Rapid Assessment Gap Analysis · PARA ALCANZAR LOS OBJETIVOS SE4ALL 102 ... EXECUTIVE SUMMARY . E...
132
Rapid Assessment Gap Analysis Ecuador
Transcript of Rapid Assessment Gap Analysis · PARA ALCANZAR LOS OBJETIVOS SE4ALL 102 ... EXECUTIVE SUMMARY . E...

Rapid AssessmentGap Analysis Ecuador

Published: 2013


This document was prepared under the direction of: The Ministry of Electricity and Renewable Energy (MEER)
With the financial support of: Inter-American Development Bank (IDB)
With the technical support of: United Nations Development Programme (UNDP)
The author of this document is: Roberto Gomelsky
The ideas expressed in this document are the responsibility of the author and involve the above mentioned organizations. The use of the information contained in this document is authorized on the condition that the source is cited. Copyright © MEER, BID y PNUD 2013. All rights reserved. Design and Layout: Diego Enríquez, Christian Lasso / [email protected]

RAPID ASSESSMENT AND GAP ANALYSIS OF THE ENERGY SECTOR (RG-T1881) ECUADOR

CONTENTS
RESUMEN EJECUTIVO 8
1. ECONOMY, SOCIETY, AND ENERGY 9
2. CURRENT SITUATION IN THE COUNTRY IN REGARD TO SEE4ALL OBJECTIVES
10 a.
Access to energy 11
i. Access to modern thermal energy for cooking 11
ii. Access to electricity 12
b. Energy efficiency 13
c. Renewable energy 15
i. General situation 15
ii. Renewable energy on-grid and off-grid
16 iii. Use of renewable energy sources for thermal applications (cooking/heating)
18 iv. Use of renewable energy for productive activities
19
3. LINES OF ACTION, INDICATORS, AND GOALS 20
a. Access to energy 20
i. Access to electricity for domestic and productive uses 20
ii. Access to modern thermal energy for cooking 21
b. Energy efficiency and renewable energy for productive uses 23
c. Renewable energy: electricity generation on-grid and off-grid 24
4. NATIONAL FRAMEWORK FOR MONITORING THE SE4ALL PROGRAM
25
5. SYNTHESIS: IMPORTANT GAPS, BARRIERS, AND ADDITIONAL REQUIREMENTS
25

SECCIÓN I: INTRODUCCIÓN 27
1.1 VISION OF THE COUNTRY 28 6. BASIC MACROECONOMIC DATA AND SOCIAL INDICATORS 28
a. Macroeconomic indicators 28
b. Social indicators 31
i. Employment, unemployment, underemployment, and poverty 31
ii. Human Development Index (HDI) 33
iii. Income Distribution 34
1.2 ENERGY SITUATION 35 7. ENERGY RESOURCES AND ENERGY OFFERING 37
a. Renewable resources 37
i. Hydroelectric potential 37
ii. Wind energy 39
iii. Solar energy 40
iv. Geothermal
40 v. Biomass
41 vi. Biofuels
41
b. Non-renewable resources
42 i. Oil
42 ii. Natural gas
45
c. Energy Supply 46
i. Electricity sector 46
a. Installed and generation capacity 46
b. International interconnections, import, and export 49
i. Oil and natural gas 51
a. Oil production
51 b. Natural gas production
52 c. Oil refining
53 d. Exports and imports
54
8. ENERGY DEMAND 55
a. Final energy demand 55
b. Sectoral demand 57
i. Transport sector 57
ii. Residential sector 58
iii. Industrial sector 59
iv. Sectoral demand for main energy sources 60
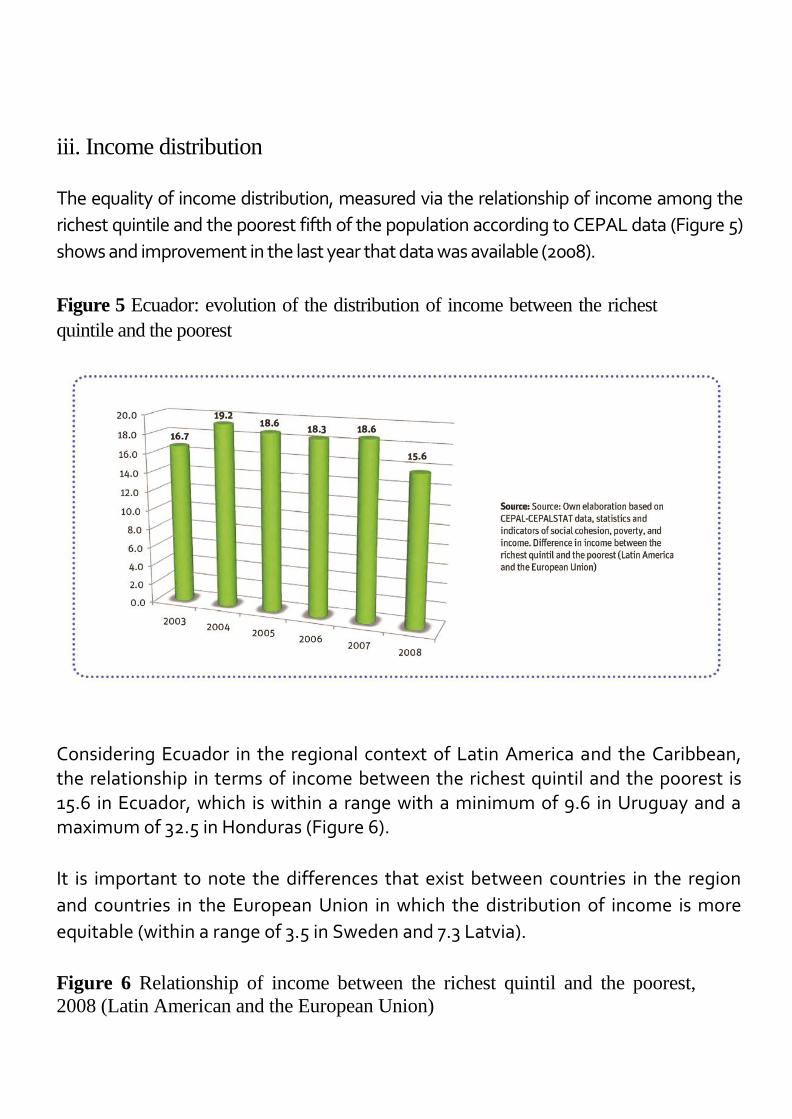
9. ENERGY AND ECONOMIC DEVELOPMENT 60 a.
Participation of the GDP in the energy sector
60 b. Impact of oil on the balance of payments
62 c. Impact of oil on public finances
64
10. ENERGY STRATEGY 64

SECCIÓN 2: SITUACIÓN ACTUAL EN RELACIÓN A LOS OBJETIVOS SE4ALL 70
2.1 ACCESS TO ENERGY IN RELATION TO THE SE4ALL OBJECTIVES 71 11. OVERVIEW 71
12. MODERN ENERGY FOR THERMAL APPLICATIONS
(COOKING, HEATING WATER) 72
13. ACCESS TO ELECTRICITY 74
a. Physical access: electricity service coverage
74
b. Renewable energy participation in the electricity generation mix
76
c. Quality of service
77
d. Prices and subsidies
78
14. MODERN ENERGY FOR PRODUCTIVE USES 81
2.2 ENERGY EFFICIENCY IN RELATION TO THE SE4ALL OBJECTIVES 82 15. OVERVIEW 82
16. ENERGY INTENSITY: SOME INDICATORS 83 a. Global
indicators
83
b. Sectoral indicators
85
2.3 RENEWABLE ENERGY IN RELATION TO THE SE4ALL OBJECTIVES 88 17. OVERVIEW 88
18. RENEWABLE ENERGY ON-GRID AND OFF-GRID 90
a. Regulation 002/2011 “Exceptionality for private participation in electricity generation”
91
b. Regulation 003/2011 “Determining the methodology for calculating the term and reference
prices for generation and self-generation projects
92
c. Regulation CONELEC 004-11 “Treatment for energy produced with Non-conventional
Renewable Energy Resources”
94 d. Mechanisms to pay for ERNC projects
97 e. Response of private initiative
97 19. USE OF RENEWABLE ENERGY SOURCES
FOR THERMAL APPLICATIONS (COOKING HEATING) 98
20. USE OF RENEWABLE ENERGY FOR PRODUCTIVE ACTIVITIES
99
21. SYNTHESIS 100
2.4 SE4ALL GOALS 100
22. GOALS 100

SECCIÓN 3: DESAFÍOS Y OPORTUNIDADES PARA ALCANZAR LOS OBJETIVOS SE4ALL 102
3.1 POLICIES AND INSTITUTIONAL FRAMEWORK 103 23. ENERGY AND DEVELOPMENT 103
24. THERMAL ENERGY FOR THE RESIDENTIAL SECTOR 103
25. ELECTRICITY SECTOR 104
26. MODERN ENERGY FOR PRODUCTIVE SECTORS
104
27. NATIONAL FRAMEWORK FOR MONITORING THE SE4ALL PROGRAM 104
3.2 PROGRAMS AND FINANCING 105 28. THERMAL ENERGY: PROGRAMS AND FINANCING TO IMPROVE ACCESS TO ENERGY, ENERGY EFIICIENCY AND ENERGY USE
RENEWABLES FOR COOKING AND OTHER RESIDENTIAL USES 105
29. ELECTRICITY SECTOR: PROGRAMS AND FINANCING TO IMPROVE ACCESS, ENERGY EFFICIENCY, AND THE USE OF RENEWABLES FOR ELECTRICITY SUPPLY 108
30. MODERN ENERGY FOR PRODUCTIVE USE: PROGRAMS AND FINANCING TO IMPROVE ACCESS,
ENERGY EFFICIENCY, AND THE USE OF RENEWABLE ENERGY SOURCES IN PRODUCTIVE SECTORS
110 a. Energy efficiency programs
110
b. National Plan for Efficient Cooking
112
3.3 PRIVATE PARTICIPATION AND REGULATORY FRAMEWORK TO PROMOTE INVESTMENT
114 31. THERMAL ENERGY FOR THE RESIDENTIAL SECTOR 115
32. ELECTRICITY SECTOR 115
33. MODERN ENERGY FOR PRODUCTIVE SECTORS 116
3.4 BARRIERS AND OBSTACLES 116
34. THERMAL ENERGY FOR THE RESIDENTIAL SECTOR 116
35. ELECTRICITY SECTOR 116
36. MODERN ENERGY FOR PRODUCTIVE SECTORS 117
37. SUMMARY: IMPORTANT GAPS AND BARRIERS AND ADDITIONAL REQUIREMENTS
117

EXECUTIVE SUMMARY

E
1. ECONOMY, SOCIETY, AND ENERGY
cuador is an oil exporting country, which has an influence on the national
economy and also dominates the energy mix. Oil is the main export of the
country, and the highly positive commercial oil balance compensates for the
deficit created by the non-oil commercial balance. The oil sector represents
around 12-15% of the generation of added value. Oil exports represented an
average of between 50% and 60% of total goods, and oil revenues play a
primary role in public finance. During the recent years of high international
prices they accounted for between 30% and 40% of non-financial public
sector revenues and between 15% and 20% of the GDP. Furthermore, oil
derivatives currently supply around 77% of total energy consumption in the
country.
Regarding the situation of high oil dependence in the economy and the
energy mix, oil resources are already in a phase of decline. Even if
production based on the addition of new reserves expands, the horizon for
crossing the line between net exporter of energy and net importer could be
between 25-30 years away. This is a reasonable amount of time, though not
excessive, to carry out economic and structural transformations.
Furthermore, although advances in recent years produced substantial
improvements in employment and decreased poverty, underemployment is
still at 44% and the incidence of poverty is around 30%, with the greatest
impact in rural areas.
The Human Development Index (HDI) also shows significant improvements
like the equity of income distribution, which will improve in the future as
part of a process of economic transformation involving equality and
environmental sustainability. The country is at a turning point and is headed

for change in its productive energy mix with social equity based on a
sustainable energy mix.
The three main objectives of SE4ALL (access to energy, energy efficiency,
renewable energy) tend to shift to an environmentally, socially, and
economically sustainable mix, i.e. to improve the energy mix while providing
support to improve the living conditions of the poor, which coincides with
the main objectives in Ecuador. Achieving these goals will have a great
impact on the social and economic situation.
2. THE SITUATION OF THE COUNTRY IN RELATION TO THE SE4ALL OBJECTIVES
Overall, the country is in an advanced position with respect to the three
SE4ALL objectives. In terms of energy access, both in relation to energy for
thermal uses and electricity, the country has high penetration rates for
modern energy for thermal uses and high electricity service coverage. Also,
there is wide development of renewable energy for electricity generation
based on existing hydroelectric projects and others under construction, as
well as loopholes in existing regulations for private generation with non-
conventional renewable energy and hydroelectric plants. There are also
programs and projects to advance energy efficiency and use renewable
resources on the demand side in productive sectors with the goal of driving
advancement in these areas in which there is currently less development.
What remains to be done to achieve the goals of universal access to
electricity in quantity and quality and thermal energy for efficient cooking,
given the high current rates, is a greater effort to expand coverage in the
most difficult to implement areas, as well as more intensively promoting
energy efficiency in the productive sectors.
With respect to the source of energy used for cooking, the data from the
2010 population and household census indicates that there are still a
significant number of households that use firewood or coal as their primary
cooking fuel, mainly in rural areas. This is an important number, even if in
terms of the total, it is low. The existence of a significant number of
households that still use firewood inefficiently is relevant in light of the
SE4ALL objectives that aim at universal access to modern energy regardless
of whether the amounts consumed have little impact with respect to
national totals.
In relation to access to electricity, current coverage is high, although there is
still a way to go to reach the goal of universal supply. While it is true that
coverage levels increased significantly in both urban and rural areas, it is
necessary to reach the entire population, which is an additional effort given
that the country is close to the goal and the remaining portion of the
population is the most difficult to reach.
a. Access to energy i. Access to modern thermal energy for cooking
Firewood or coal are regularly used by 0.7% of urban households, 17.7% and
6.8% in relation to the total. This represents around 260,000 households,
18,000 urban and 242,000 rural. The distribution by province shows a
greater concentration of households that use firewood in some provinces on
the coast and less in the Amazonian provinces.
The predominant source of energy for cooking is LPG, which is used in
96.7% of urban households and 80.7% of rural households, resulting in
91% for the total population. The residential sector consumes 92% of
LPG marketed in the country, and it is strongly subsidized. The gas
subsidy presents a risk to sustainability both for the potential
substitution of firewood and for the current supply to the majority of the
population of the country. For this reason, MEER is in the process of
approving a massive plan to substitute LPG cookstoves for electric
cookstoves.
ii. Access to electricity
There is electricity coverage in 96.2% of urban homes (96.1% network and
0.1% solar panel), 88.2% of rural homes (88.0% network and 0.2% solar
panel), resulting in 93.4% (93.2% distribution network and 0.2% solar panel)
for the total households in the country. Households without any type of
electricity service represent 2.2% of the total in urban areas, 10.5% of rural
households, and the 5.2% remaining for the total country. In absolute terms,
this means that around 196,000 households don’t have electricity in the
country – 54,000 in urban areas and 142,000 in rural areas.
In relation to environmental sustainability, the generation of electricity is
quite sustainable; current hydroelectric generation is nearly half of the total
and will increase to 90% when the big projects currently under construction
begin operation.
With respect to the quality of service, it is important to reach universal
access both physically and in terms of quality. The majority of electricity
distribution companies don’t meet the minimum requirements for the
quality of service and products established in the current guidelines. Only
three companies of a total of 20 meet the requirements. According to
CONELEC, in reality there are problems with the quality of electricity supply
due to limitations in the allocation of financial resources for the
implementation of projects to expand and improve distribution networks.
This is an issue that affects not only new users that are going to connect to
the network but also all consumers and their activities. It is a problem that is
already being faced, and although some difficulties exist, tangible results
are expected in the short term. With this objective, the provision of
resources will increase in order to reach the levels of quality or service and
products established in the regulations. At the same time, necessary
supervision will be carried out to verify that said regulations are being
applied and met. If necessary, corresponding penalties will be applied.
On the other hand, it is necessary to consider that, in certain cases of
isolated systems with “off-grid” solutions like, for example, solar
photovoltaic panels, the parameters of quality of service can’t be the same
as those applied to interconnected networks.
In relation to the objectives of economic sustainability linked to SE4ALL, the
subsidies constitute a significant barrier to promoting energy efficiency and
the use of renewable energy in the productive and services sectors and in
residential consumption. Although they could eventually indirectly affect
the objectives of energy access and electricity generation with non-
conventional renewable energy, this is not a real risk given the existence of
sufficient guarantees for the sustainability of the investment programs
related to energy access and the contracts for private generation with
renewable energy.
The tariff deficit in the electricity sector will be offset by the introduction of
low cost hydroelectric. The average prices of electricity are not currently
sufficient to cover the actual cost of supply, and there is a revenue shortfall
that is covered by the National Government as established in Constitutional
Mandate No. 15. When the hydroelectric projects that are under
construction begin operation, the average cost of generation will fall
substantially, and there will be a there will be a temporary tariff surplus,
balancing revenues and costs up to 2020-2021. There is a special tariff
(Dignity Tariff) for consumption below 110 KWh/month in the Sierra and 130
in the rest of the country.
b. Energy efficiency
Insufficient information about energy consumption
Scarce knowledge about the consumption of final users in the residential,
productive, and service sectors divided by branch of economic activity
makes it difficult to understand the real energy efficiency situation in the
country and to establish precise goals for each type of economic activity and
productive process. The MEER, among its projects, carries out the field
studies necessary to cover this lack of information, although it doesn’t
include the transport sector. Based on this new information generated on
the demand side, it would be possible to establish programs and specific
projects.
Global indicators. Although general indicators don’t allow us to make a
definitive conclusion about energy efficiency, they show certain indicators
of behavior. For example, analyzing energy consumption per capita in terms
of the GDP per-capita can be seen in Ecuador as a case of growth, while a
tendency for decreasing energy intensity in the GDP would appear to
indicate an important improvement in the global efficiency of the socio-
economic system. However, energy consumption grows more
proportionally than the Gross Fixed Capital Formation (GFCF). GFCF is a
measurement of base of capital and the incorporation of technology. The
increase in the GFCF should be made based on more efficient assets
(equipment). Behavior in the case of Ecuador suggests exactly the opposite
– as the GFCF grows, energy consumption grows proportionally. This means
that there are important indicators of inefficiency in the productive system.
Transport. Energy consumption grows more than proportionally to the GDP,
although in this case its energy intensity is clearly upward, confirmed in good
measure by its inefficiency. However, on the other hand, it is well known that

studies show that transport is highly inefficient and polluting.
Industry. Energy intensity first shows an increase in the total consumption
of industry that is clearly growing in relation to the growth of the Gross
Added Value (GAV) of the sector without any sign of disconnection between
energy consumption and added value generation.
Residential sector. Analyzing the behavior of residential consumption by
inhabitant in terms of the economics of family spending can provide evidence
of inefficiency. Residential consumption clearly grows with family spending.
Only in the past five years has this stabilized, possibly because of
technological improvements in the use of domestic appliances that were
introduced in the market a bit late. Average behavior in Latin America in the
last two decades, for example, shows a disengagement between the levels of
spending and energy consumption – as the income of the population grows,
energy consumption barely grows (as has been shown in recent decades).
c. Renewable energy i. General situation The current renewable energy situation in Ecuador can be summarized as
follows:
TYPE OF RENEWABLE ENERGY
APPLICATION
STAGE OF DEVELOPMENT
Conventional
Hydroelectric Electricity generation
On-grid
Generation 90% hydro starting in 2016
Biofuels
Final
consumption
Transport
Incipient, ethanol in Guayaquil, biodiesel in process
Firewood
Final
consumption
Home use of open fire cooking
Still used by 260.000 households (replacement)
Geothermal
Electricity generation
On-grid
Resource exploration detained for 20 years, recently reinitiated
Hydro less than 50 MW
Electricity generation
On-grid
There are some hydro plants connected to the grid selling excess (Ex. Sibimbe) and others in construction. There is a regulation of prices. There is the need to drive the development of projects.
Wind
Electricity generation
On-grid
2.4 MW installed and three plants included in the plan
Off-grid Nothing
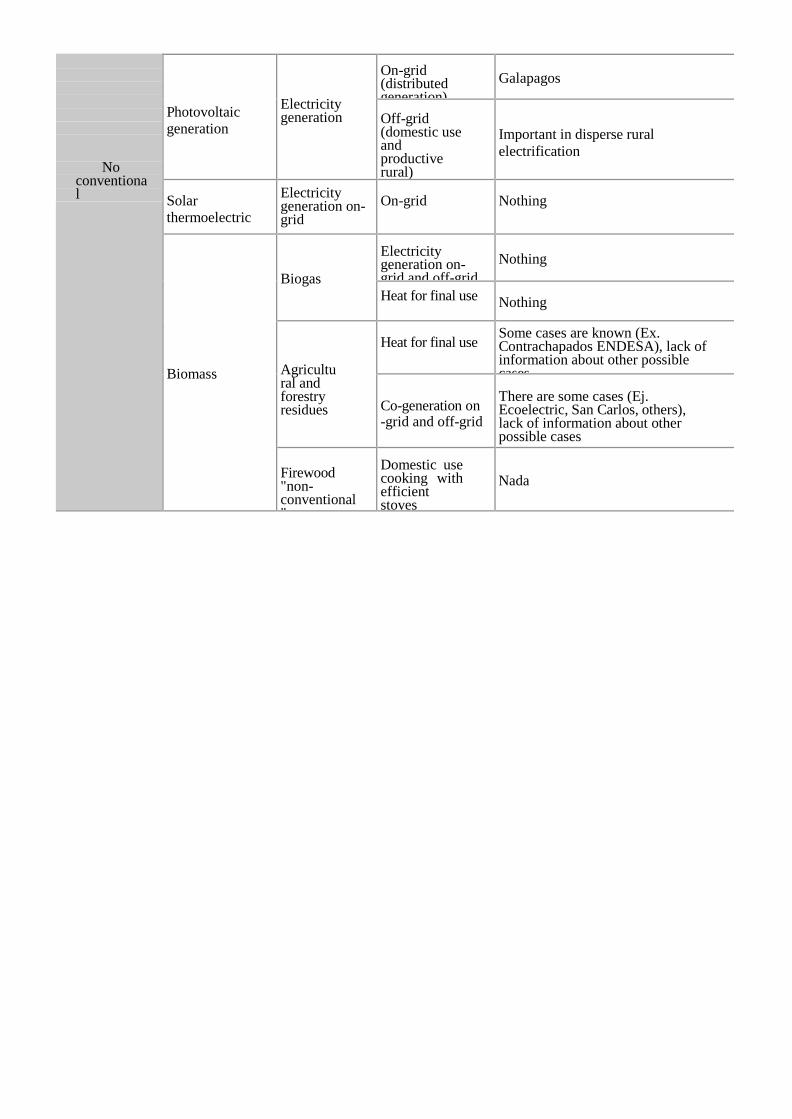
No conventional
Photovoltaic
generation
Electricity generation
On-grid (distributed generation)
Galapagos
Off-grid (domestic use and productive rural)
Important in disperse rural
electrification
Solar
thermoelectric
Electricity generation on-grid
On-grid
Nothing
Biomass
Biogas
Electricity generation on-grid and off-grid
Nothing
Heat for final use
Nothing
Agricultural and forestry residues
Heat for final use
Some cases are known (Ex. Contrachapados ENDESA), lack of information about other possible cases
Co-generation on -grid and off-grid
There are some cases (Ej. Ecoelectric, San Carlos, others), lack of information about other possible cases
Firewood "non-conventional"
Domestic use cooking with efficient stoves
Nada

Replacing “conventional” firewood with modern energies like LPG and eventually electricity and the introduction of more efficient stoves should be a priority.
Similarly, photovoltaic panels for clients connected to the network should be disseminated more because unit costs fall substantially over time. There are electricity companies in the USA and Europe that buy excess from users that is equivalent to distributed generation.
The development of wind resources should also be intensified based on the wind map created in the Action Plan for Sustainable Energy (PAES) carried out by MEER within the framework of aTechnical Cooperation with the IDB.
ii. Renewable energy on-grid and off-grid
Private generation is regulated by the 2011 Regulations of CONELEC
002, 003, and 004.
Regulation 002/2011 refers to the exceptional nature of private participation in the electricity sector, which is in agreement with the reform of the Law governing the Electricity Sector introduced in the Organic Production Code. It determines the principles and parameters that apply to cases of exception for private participation in electricity generation. It should be noted that the Code also provides tax incentives for renewable energy equipment and energy efficiency.
Regulation 003/2011 permits direct negotiation of contracts with one or various distributors based on pre-set terms and rates established by referential calculated prices in which the methodology is created by the Regulation and then the companies that buy energy are billed. Generators can opt for to qualify for special treatment whether or not they meet the requirements of Regulation 004/2011.
Regulation 004/2011 is specifically for private generation via ERNC and hydroelectric plants of up to 50 MW. It establishes that energy prices will be paid to generators, and proportionately distributes the bill to all distributors in the system according to the monthly payment made to CENACE in contracts of energy purchase of 15 years with the possibility of extension after paying current market prices.
All electricity produced by plants that use renewable resources will be dispatched into the system up to the limit of 6% of installed capacity and

operation of the National Interconnected System generators. Hydroelectric plants that produce less than 50 MW, biomass, and geothermal are not included.
According to current regulations, the CENACE is in charge of establishing the amounts of energy to be billed monthly by private generators subject to handling (greater than 1 MW) in the framework of Regulation 004/11 based on the preferential established prices. The costs of private generation with ERNC are assumed by the whole electricity system and in consequence are distributed proportionately by CENACE among all the distributors. Each private generator is shown the amount of the monthly bill. In the case of the generators less than 1MW not subject to handling and those found in the framework of Regulation 003/11, they should directly bill the involved distributors.
The mechanism for paying companies is via trusts managed by financial institutions. All existing distribution companies have trusts that are generally managed by specialized bank entities, for example, the Bank of Guayaquil, Bank of Pichincha, private banks, and the Bank of the Pacific, which is currently controlled by the state.
All the proceeds from each of the electricity distribution companies are automatically deposited into each of the respective trusts. Private generation via ERNC is a high priority in the preference of the payments of trusts. It is second only to international connections. This way private generation has an independent payment mechanism with a priority for payment that ensures the collection of revenues even in a possible financial crisis which could come about due to the risk of sustainability of the State contribution. It could occur under any circumstances.
The response to opening electricity generation to the private sector was positive. By November 29, 2012 (Regulation 004/11 was issued in April 2011) CONELEC published that 116 applications had been turned in. The space available of 6% of installed capacity (284.5 MW) was awarded entirely, 200 MW to the ERNC with the title already signed. The remaining 84.5 MW are not yet signed but have already been authorized by the Board of CONELEC.
iii. Use of renewable energy sources for thermal applications (cooking/heating)

Given the economic impact of the LPG subsidy and the availability of low cost electricity, it is projected that gas cookstoves will be replaced by electric ones. This subject was analyzed by the Quito Electricity Company for its concession area,1 and the MEER is proposing replacement at a national level.
The MEER formulated a plan, which is in the process of being approved, to replace gas cookstoves with efficient electric induction cookstoves. This plan will allow, within the national energy policy framework, a high replacement (not complete because that would be impractical) of LPG with electricity. It would have a significant impact on public finances given the reduction in the LPG subsidy and the drastic change in the consumption mix in the residential sector and in GHG emissions in the sector.
The plan is designed to substitute LPG for electricity in cooking food in the residential sector by replacing LPG cookstoves with electric induction cookstoves with LPG.2
1 Determination of final use of energy in the residential sector. ENERINTER International Energy Assessment,
conducted by the Quito Electricity Company. March 2012. 2 MEER. National Plan for Efficient Cooking, Executive Summary. 2013

The fundamental components of the Plan are:
• To adapt the electricity system to cover the demand generated by cookstoves, • To define new prices both for electricity and for LPG, • To create the supply of induction cookstoves on the national market at
accessible and competitive prices • To generate the conditions for Ecuadorian families to adopt the
technology
The subject of introducing firewood efficient cookstoves and of substituting
LPG for electricity is not the objective of any specific program at the level of
the responsible entities.
iv. The use of renewable energy for productive activities
In the productive sectors increased electricity consumption in thermal uses
substitutes fossil fuels in applications wherever possible, and it indirectly leads
to the greater use of conventional renewable energies given that the majority
of electricity generation is hydroelectric.
In this case, photovoltaic panels for industrial clients connected to the
network could also be promoted. There are also small hydroelectric or winds
plants for auto-consumption that could be taken advantage of by the
productive sectors.
The subject is directly linked to energy efficiency. There are projects
underway that research the profiles of human consumption for different
productive activities and then establish economic sectors and activities that
are priorities for designing specific projects.
In the case of productive sectors, energy efficiency and renewable energy
should be managed jointly. In the case of productive uses of energy
associated with the domestic rural or marginal urban sector, these form part
of the programs to increase electricity service coverage. 3. LINES OF ACTION, INDICATORS, AND TARGETS At this preliminary stage of the analysis, the lines of action can be

summarized as follows: a. Access to energy i. Access to energy for domestic and productive uses The expansion of electricity coverage is already underway through the Fund
for Rural and Urban Marginal Energy (FERUM) that coordinates the
CONELEC. The projects are implemented by distribution companies based on
existing inter-institutional agreements and in coordination with other
government agencies and regional and local entities. The FERUM serves rural
and urban marginal sectors with the characteristics of a social program with a
technical foundation. It is a high priority and supports the incorporation of
new basic services with the objective of improving the quality of life of those
sectors of the population.
In general, the rural population works in the agricultural, livestock, wood,
fishing, tourism, and other sectors. The urban marginal population works in
the service, sales, handiwork, and informal activities sectors, which means
that access to energy covers not only household use but also communal and
productive uses.
Between 1998 (the year FERUM began) and 2007, $316 million in projects
were implemented, while during between 2008-2012 it was $356 million. In
2012, the program was assigned $120 million USD annually.
It is important to highlight that FERUM was originally created with funds that
came from a contribution to consumers that was 10% of commercial and
industrial tariffs. It was eliminated by Constitutional Mandate 15, which
converted FERUM into a specific mechanism to finance rural and marginal
urban projects with the support of the national treasury so that they would
enter into the prioritization of projects on a national level in the process of
selection. This is why the pre-selection carried out by CONELEC should be
approved by MEER and then by SENPLADES.
FERUM currently has an IDB loan to co-finance electrification projects.
According to CONELEC data, in 2013 FERUM will reach 96% of electricity
coverage of households in marginal urban areas. In 2014, it is estimated that

32,549 households in the rural sector and 59,948 households in marginal
urban areas will need electrification. Between 2014-2021 it is estimated that
US$ 191 millions will be needed to serve all households in the rural and
marginal urban sectors.3
The goal of 100% coverage is anticipated by 2021 even though the SE4ALL
goal provides until 2030. The indicator for monitoring this objective is the
coverage index that is published regularly by CONELEC on a national level, a
provincial level, and by distribution companies.
While CONELEC set the goal to reach 100% electricity coverage by 2021, the
current plan being implemented refers to household electricity access via the
extension of networks. There is still not a specific plan to reach potential
consumers or isolated locations or an estimate of the precise number of
households that are in such conditions. However, it is estimated that it is a
small portion and also the most difficult portion in which to implement rural
energy programs. This is a gap that could be covered with the support of the
SE4ALL initiative given that the IDB is already considering the issue.
ii. Access to modern thermal energy for cooking
There are currently not any programs of this type. It is proposed that the
objective be taken care of, at least partially, within the framework of the
Fund for Rural and Marginal Urban Electrification, which will be described in
the next section about distribution companies.
3 CONELEC. Master Plan for Electrification 2012-2021.

The distribution of households without electricity and of homes that use firewood/coal as the main source of energy for cooking is uneven. Crossing the data by province from the 2010 Census, it can be observed that in some provinces, following the hypothesis that there is one household per home, the cases of cooking with firewood and a lack of electricity service are higher while in others the opposite is true. The cases of firewood use are higher than those of cases without access to electricity. This means that there are homes with electricity that use firewood and others that don’t have it (137,564 in the whole country).
The proposal posits the following:
Extending electricity service coverage with financing by FERUM with the goal of total access to electricity by 2021.
In provinces where the number of homes without electricity is greater than the number of homes that cook with firewood, electrification would arrive in the form of extended networks, mini-networks with renewables, or other solutions. The homes would be identified and contacted.
In provinces where the number of homes without electricity is less than the number of homes that cook with firewood, part of these would be served when electricity service arrived.
Electricity distribution companies are the only entities that have direct access to users.
• While it is not strictly the responsibility of distributors to deal with energy
consumption for cooking, it would be convenient to explore the feasibility of
designing an efficient wood cookstove program and distributing them via the
electricity companies as electricity service is provided to households. This
would allow improved use of firewood by 53% of homes that cook with wood,
which is the portion that still doesn’t have electricity service. Another
possibility is to structure an operational scheme separately via MEER.
• The remaining 47% of homes that cook with firewood that already have
electricity service would work with FERUM to see about the potential of
providing efficient wood cookstoves, and eventually they could use LPG. This
could be done in consultation with Petrocomercial and in conjunction with
other electricity companies since they already have those households
registered in their databases
If this proposal is followed, goals would have to be established to define the
specific operation and estimate the equipment requirements, where it would

be located, the cost, and other details. It would be convenient to conduct a
pilot project to confirm that people will accept these technologies and to
measure the performance of the teams.
b. Energy efficiency and renewable energy for productive uses
It is premature to propose specific goals and actions. In the case of energy
efficiency and the use of renewable energy in productive sectors, the first step
is to know the consumption profile of the different branches of economic
activity that work in the field on a national level and in contact with the
productive sectors. This will help identify the priority areas and establish goals
to quantify investment. It is a study that the MEER has already planned.
It is important to highlight that part of any energy efficiency program is also
the use of renewable energy by consumers. This can be via self-generation of
electricity with small hydro or wind plants for self-consumption and the sale of
the excess to the network or the use of waste produced in the production
process. In addition to making the process more efficient and reducing
operative costs, it improves environmental performance and reduces the
added costs of fines. There are currently several companies in the country that
do this. The total number isn’t known, but in general it is estimated that there
is significant potential in several production sectors.
The MEER is designing and/or carrying out some specific relevant projects like
the substitution of inefficient refrigerators, providing solar thermal energy
systems for hot water, an immediate action project for efficient energy use in
the public sector, public lighting on a national level, replacing public lighting
with more efficient lighting in the Galapagos, energy efficiency for industry
in Ecuador, and a massive communication campaign to promote energy
savings.
The most important action that MEER will conduct is a study about the final
use of energy, which in itself is part of the first goal to be reached before
December 2014. It falls within the objective of energy efficiency in the
SE4ALL initiative. The more specific goals would be established to reach the
efficiency objectives in the different productive and services sectors such as
residential consumption (in this case, LPG would be replaced by electricity).
In order to carry out this important study, MEER had the support of the
Sustainable Energy Action Plan for Ecuador (PAES), via a non-refundable
technical cooperation agreement from the IDB. It described the
methodology and the information platform for the indicated study, a wind
map, and other relevant results.
c. Renewable energy: electricity generation on-grid and off-grid
This is already underway and has shown that investors are interested, which
is very important for structuring financing for these projects with
developers.
A relevant point is that the limit of 6% of installed power is a dynamic goal that
allows the expansion of installed generation capacity with the ERNC as the
electricity system grows. The indicator of verification in this case is complying
with the timeline agreed upon in the purchase-sale energy contracts.

4. NATIONAL FRAMEWORK FOR MONITORING THE SE4ALL PROGRAM
The focal point for establishing and monitoring the SE4ALL program on a
national level should be the Ministry of Electricity and Renewable Energy
(MEER) given that it is the entity responsible for the development of renewable
energy and energy efficiency in the country via the Undersecretary of
Renewable Energy and Energy Efficiency (SEREE).
Besides approving rural and marginal urban energy projects presented by
distribution companies and prioritized by the CONELEC, it also passes through
MEER before final approval is granted in SENPLADES. The MEER could
coordinate actions with CONELEC and other entities in the energy sector and
organizations linked to production (both in the State and in the private sector).
The latter should be incorporated into the process given that consumers should
specify actions and investments to improve energy efficiency and use renewable
energy for final uses.
5. SUMMARY: IMORTANT GAPS, BARRIERS, AND ADDITIONAL REQUIREMENTS
Based on the advances of the country in relation to the SE4ALL objectives, the
areas that require more attention and the additional support of technical
cooperation and financing are thermal energy for cooking, efficiency, and the
use of renewable energy in the productive sectors, and electricity access for
isolated homes and locations.
Additionally, we imagine an area for action for financing private generation
projects with non-conventional renewable energy and hydroelectric plants of
less than 50 MW based on open niches in current regulations.
Electricity and fuel subsidies are an important barrier to promoting and
implementing energy efficiency programs and using renewable energy in the
productive, service, and residential consumption sectors.
On the other hand, while subsidies and the complete absorption of investments
on the part of the State could constitute a risk for the financial stability of
programs in the long term given the huge weight of the subsidies on the

national economy, this risk is controlled depending on the allocation of
resources for rural and marginal urban energy programs. They also have the
support of international entities and existing guarantees of the payment of
purchase-sale energy contracts to private projects with renewable energy.
There might be other institutional obstacles given the difficulty of coordinating
efforts among diverse state and private institutions to reach final energy users.

SECTION 1:
INTRODUCTION

E
1.1 VISION OF THE
COUNTRY
6. BASIC MACROECONOMIC DATA AND SOCIAL INDICATORS a. Macroeconomic indicators
cuador has a population of 14 million according to the last housing and
population census. Average income measured by the Gross Domestic Product
(GDP) per-capita is from 1,760 dollars to 2,000, which is a little more than
4,000 dollars per-capita in current currency. This shows sustained growth
with important fluctuations over the last decade (Table 1).
Table 1 Indicators per-capita
1999 2000 2001 2002 2003 2004 2005
(sd)
2006
(p)
2007
(p)
2008
(p)
2009
(p)
2010
(p)
Population (thousands of
inhabitants)
12,121 1
12,299 9
12,480 0
12,661 1
12,843 3
13,027 7
13,215 13,408 13,605 13,805 14,005 14,205
DOLLA
RS Gross domestic product 1,394 1,324 1,704 1,952 2,212 2,506 2,795 3,110 3,345 3,927 3,715 4,082
Final consumption of homes 914 842 1,192 1,363 1,544 1,683 1,854 1,999 2,129 2,397 2,481 2,765
Gross fixed capital formation 233 265 364 458 476 541 619 694 745 943 900 1,027
Exports 444 480 453 482 568 687 864 1,053 1,173 1,487 1,097 1,345
Imports 348 407 540 629 622 733 895 1,025 1,152 1,484 1,188 1,576
DOLLARS OF
2000 Gross domestic product 1,290 1,324 1,367 1,393 1,419 1,522 1,587 1,638 1,647 1,741 1,722 1,759
Final consumption of homes 819 842 886 930 964 994 1,050 1,091 1,115 1,175 1,150 1,221
Gross fixed capital formation 240 265 323 379 373 386 421 431 435 498 470 511

Exports 490 480 469 459 498 565 605 649 654 666 618 623
Imports 359 407 509 593 557 611 687 739 786 851 742 851
RATE OF VARIATION OF
PRICES 2000 Gross domestic product -6.69 2.65 3.23 1.95 1.81 7.28 4.24 3.24 0.56 5.69 -1.07 2.12
Final consumption for homes -8.38 2.77 5.21 5.00 3.59 3.09 5.72 3.89 2.16 5.37 -2.12 6.16
Gross fixed capital formation -28.70 10.44 21.69 17.22 -1.58 3.44 9.29 2.30 0.99 14.42 -5.63 8.69
Exports 5.44 -2.07 -2.24 -2.21 8.53 13.45 7.07 7.28 0.86 1.79 -7.24 0.84
Imports -30.72 13.49 24.96 16.57 -6.16 9.82 12.44 7.55 6.36 8.29 -12.83 14.65
Source: Central Bank of
Ecuador (sd) Semi-definitive data (p)
Provisional data
The sustained growth of the GDP and especially imports (10.8% annually during
the 1999-2010 period on the side of global offerings of goods and services)
sustains the growth of family consumption. During 1999-2010 there was 5.7%
annual accumulated growth, which is above the product growth rate (4.8%).
There was nearly 10% growth in the gross formation of capital while exports
grew at an average rate of 4.1%, less than the GDP (Table 2).
Table 2 Supply and use of goods and services (millions of dollars,
2000)
1999
2000
2001
2002
2003
2004
2005
(sd)
2006
(sd)
2007
(p)
2008
(p*)
2009
(p*)
2010
(p*)
Gross domestic product (PIB) 15,633 16,283 17,057 17,642 18,219 19,827 20,966 21,962 22,410 24,032 24,119 24,983
Import of goods and services 4,349 5,008 6,350 7,509 7,148 7,963 9,082 9,910 10,695 11,752 10,392 12,085
Total final offer 19,982 21,291 23,407 25,151 25,367 27,790 30,048 31,872 33,105 35,785 34,512 37,068
Total final consumption 11,425 11,921 12,612 13,400 14,022 14,647 15,643 16,458 17,105 18,378 18,351 19,618
General government 1,493 1,564 1,554 1,621 1,644 1,703 1,762 1,827 1,938 2,162 2,249 2,280
Resident homes 9,932 10,357 11,058 11,779 12,378 12,944 13,881 14,631 15,167 16,216 16,102 17,337
Gross fixed capital formation 2,913 3,265 4,031 4,794 4,786 5,022 5,568 5,780 5,922 6,876 6,583 7,257
Changes in inventories -297 203 909 1,148 164 761 844 935 1,174 1,335 924 1,343
Exports of goods and services 5,940 5,902 5,855 5,809 6,395 7,359 7,993 8,700 8,904 9,197 8,655 8,851
Total final use 19,982 21,291 23,407 25,151 25,367 27,790 30,048 31,872 33,105 35,785 34,512 37,068
Source: Central Bank of
Ecuador (sd) Semi-definitive data (p)
Provisional data
Note: The Central bank is revising the historic series of national accounts and publishing revised data as it is available
With regard to the sectoral structure of the GDP, the most relevant sectors in

terms of value added generation are the exploitation of mines and quarries, the manufacturing industry, trade, and services, and, to a lesser degree, construction and agriculture (Figure 1 and Table 3).
Figure 1 Structure of the GDP by sector in
2010
Table 3 Gross added value by sector (millions of dollars, 2000)
1999
2000
2001
2002
2003
2004
2005
(sd)
2006
(sd)
2007
(p)
2008
(p*)
2009
(p*)
2010
(p*)
Agriculture, livestock, hunting,
forestry
1,405 1,466 1,524 1,620 1,690 1,726 1,814 1,877 1,959 2,062 2,076 2,062
Fishing 289 215 231 229 262 263 331 377 386 412 434 442
Exploitation of mines and quarries 2,202 2,141 2,212 2,110 2,305 3,169 3,224 3,339 3,062 3,062 2,961 2,968
Manufacturing industries (excluding
petroleum refining)
2,329
2,170
2,276
2,333
2,440
2,519
2,752
2,946
3,091
3,341
3,290
3,511
Manufacture of petroleum refining
products
383
748
564
497
409
475
448
446
431
465
479
385
Supply of electricity and water 165 169 170 184 186 170 172 173 200 240 211 214

Construction 952 1,127 1,349 1,619 1,608 1,673 1,796 1,864 1,866 2,124 2,238 2,387

Wholesale and retail sales
2,422
2,515
2,679
2,731
2,816
2,934
3,104
3,261
3,365
3,587
3,503
3,725
Transport and storage 1,321 1,413 1,420 1,421 1,447 1,477 1,511 1,590 1,639 1,729 1,792 1,837
Brokerage financier 295 301 281 289 291 310 366 442 477 531 540 633
Other services (2) 2,336 2,421 2,521 2,627 2,737 2,900 3,172 3,355 3,555 3,809 3,874 4,083
Financial intermediation services
measured indirectly
medidos indirectamente (3)
-380
-385
-322
-440
-422
-411
-447
-555
-620
-697
-719
-833
Public administration and
defense; plans for compulsory
social
764
835
844
864
889
916
933
960
1,016
1,165
1,228
1,234
Private homes with domestic service 28 28 29 30 31 32 31 32 32 30 30 32
Gross value added 14,511 15,164 15,777 16,114 16,690 18,155 19,208 20,107 20,460 21,858 21,938 22,680
Other elements of the GDP 1,122 1,119 1,280 1,527 1,530 1,672 1,758 1,855 1,949 2,174 2,182 2,303
GDP 15,633 16,283 17,057 17,642 18,219 19,827 20,966 21,962 22,410 24,032 24,119 24,983
Source: Central Bank of Ecuador; (sd) semi-definitive data, (p)
provisional data.
The historic evolution of the 1999-2010 period clearly highlights the dynamism of
the two sectors: construction with an annual growth of 9.6% for the 1999-2010
period and financial intermediation with 7.9% annual growth. The first of these
sectors contributes 10% of National Gross Value Added, while the second has
modest participation but a very high dynamic of growth. Productive sectors like
industry, agriculture, fishing, mines, and quarries, as well as trade, had moderate
growth rates ranging between 3.9% and 4.4% annually.
b. Social indicators
i. Employment, unemployment,
underemployment, and poverty
In March 2012, the economically active population was 4.6 million with a rate of
open unemployment at approximately 5% and underemployment at 46%. These
indices showed a significant downward trend in the last four years. However, there
is still considerable work to do, especially with respect to the subject of
underemployment. (Figure 1)
Figure 1 PEA and trends in employment, unemployment, and underemployment

The rate of poverty shows a noticeable trend of decreasing in the decade of the
2000s. In December 2011 it decreased by 28% nationally. (Figure 2).
Figure 2 Poverty rate on a national level.
At the level of the urban and rural population, CEPAL data shows similar trends for both the rate of poverty (extreme poverty) and extreme poverty although there are some differences in data (Figure 3).

Figure 3 Decrease in the rate of poverty and extreme poverty in
Ecuador

ii. Human Development Index (HDI)
Ecuador’s HDI shows a growing trend that has intensified in recent years. It was above the world average and near the average for Latin America and the Caribbean.
The 2011 statistics indicated a level of 0.702 for Ecuador in relation to a maximum of
0.805, which is the case in Chile, and a minimum of 0.454, which is the case in Haiti (Figure 4).
Figure 4 Growth of the Human Development Index in Ecuador and regional comparison
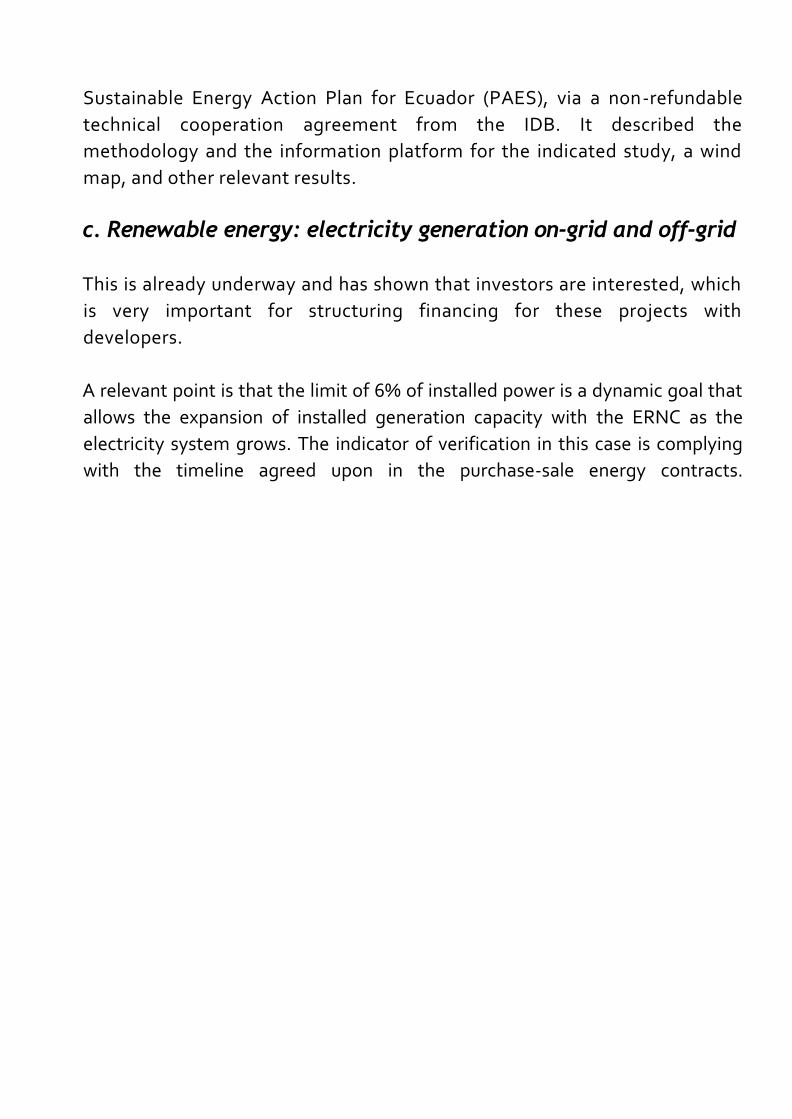
iii. Income distribution
The equality of income distribution, measured via the relationship of income among the
richest quintile and the poorest fifth of the population according to CEPAL data (Figure 5)
shows and improvement in the last year that data was available (2008).
Figure 5 Ecuador: evolution of the distribution of income between the richest
quintile and the poorest
Considering Ecuador in the regional context of Latin America and the Caribbean, the relationship in terms of income between the richest quintil and the poorest is 15.6 in Ecuador, which is within a range with a minimum of 9.6 in Uruguay and a maximum of 32.5 in Honduras (Figure 6).
It is important to note the differences that exist between countries in the region
and countries in the European Union in which the distribution of income is more
equitable (within a range of 3.5 in Sweden and 7.3 Latvia).
Figure 6 Relationship of income between the richest quintil and the poorest,
2008 (Latin American and the European Union)


Source: Own elaboration based on CEPAL-CEPALSTAT data, statistics, and indicators of social cohesion, poverty, and income. Relationship between the richest quintile and the poorest (Latin America and the European Union)
1.2 ENERGY SITUATION
Ecuador is an oil exporting country, which has a big impact on the national
economy and dominates the energy mix. Its quantitative representation in the 2010
cut is represented in the National Energy Balance (Table 4).
Although dependence on oil exports has decreased by a certain measure, the country is
at a turning point because the national economy remains highly dependent on these
exports and consequently also the power supply from oil. Therefore, there needs to be
a substantial change in the energy mix, a change which has already started on the
supply side of energy.
The country also has significant renewable energy potential, especially in the area of
hydroelectricity, which has an important role in electricity generation even though its
development has been delayed in the past two decades. However, recently a plan to
construct large-scale hydroelectric projects was implemented which will begin
operation between 2016 and 2018.
Table 4 National Energy Balance 2010. Thousands BEP
(Part 1)
Oil
Natural Gas
Hydropower
Fire
wood
Sugarcane
products
Primary Total
Electricity
Liquefied
Gas
PRODUCTION 182,8
42
8,394 5,351 3,368 2,151 202,105 12,088 1,435
IMPORTS - - - - - - 541 6,295
EXPORTS 128,4
35
- - - - 128,435 6 -
CHANGE IN
INVENTORY
(88
8)
- - - - (888) - (36)
UNUSED - 3,679 - - - 3,679 - -
TOTAL SUPPLY 53,5
20
4,715 5,351 3,368 2,151 69,104 12,623 7,694
REFINERY (51,35
9)
- - - - (51,359) - 891
ELECTRIC PLANTS - (1,979) (5,068) - - (7,047) 10,072 -
AUTOPRODUCERS (1,42
4)
(1,414) (283) - (912) (4,034) 2,016 (124)
GAS PLAN - (1,321) - - - (1,321) - 543
COAL BUNKER - - - - - - - -
COKE/OVEN - - - - - - - -
DISTILLERY - - - - - - - -
OTHER PLANTS - - - - - - - -
TOTAL
TRANSFORMATION
(52,78
4)
(4,715) (5,351) - (912) (63,762) - (124)
OWN CONSUMPTION 736 - - - - 434 186 100
LOSSES - - - - - 273 2,038 -
ADJUSTMENT - - - - - 29 - 0

TRANSPORT - - - - - - 7 85
INDUSTRY - - - 278 1,238 1,516 4,413 425
RESIDENTIAL - - - 3,090 - 3,090 3,169 6,877
COMMERCIAL PUB.
SERVICE
- - - - - - 2,810 -
AGRO, FISHING,
MINING
- - - - - - - 83
CONSTRUCTION,
OTHERS
- - - - - - - -
ENERGY
CONSUMPTION
- - - 3,368 1,238 4,606 10,398 7,470
NON-ENERGY - - - - - - -
FINAL CONSUMPTION - - - 3,368 1,238 4,606 10,398 7,470

(Parte 2)
Gasoline/ Naphtha
Kerosene
and Turb
o
Diesel
Fuel Oil Reduced
Crude
Gases No
n Energy
Total Secondary
TOTAL
PRODUCTION 8,771 2,584 11,178 19,202 3,460 28 4,672 63,418 202,105
IMPORTS 10,849 85 19,960 3,231 - - - 40,961 40,961
EXPORTS 492 - - 10,193 - - - 10,691 139,126
CHANGE IN
INVENTORY
185 (165) 560 1,488 - - - 2,032 1,144
UNUSED - - - - - - - - 3,679
TOTAL SUPPLY 19,313 2,504 31,698 13,727 3,460 28 4,672 95,720 101,406
REFINERY 8,411 2,584 11,178 19,202 3,460 - 4,672 50,399 (960)
ELECTRIC PLANTS (360) - (5,736) (6,480) - - - 10,072 (9,552)
AUTOPRODUCERS - - (1,779) (434) - - - 2,016 (4,232)
GAS PLANT 359 - - - - 28 - 543 (777)
COAL BUNKER - - - - - - -
COKE/OVEN - - - - - - -
DISTILLERY - - - - - - -
OTHER PLANTS - - - - - - -
TOTAL
TRANSFORMATION
(360) - (7,516) (6,914) - - - (14,914) (15,521)
OWN CONSUMPTION - - 96 1,463 3,460 28 - 5,334 5,769
LOSSES - - - - - - - 2,038 2,312
ADJUSTMENTS - - - (1,141) - - - (1,141) (1,112)
TRANSPORT 18,188 2,504 17,455 3,876 - - - 42,115 42,115
INDUSTRY 110 - 5,653 2,614 - - - 13,215 14,731
RESIDENTIAL - - - - - - - 10,046 13,136
COMMERCIAL PUB.
SERVICE
25 - 125 - - - - 2,960 2,960
AGRO, FISHING,
MINING
607 - - - - - - 691 691
CONSTRUCTION,
OTHER
22 - 852 - - - - 874 874
ENERGY
CONSUMPTION
18,953 2,504 24,086 6,491 - - - 69,901 74,507
NON-ENERGY - - - - - - 4,672 4,672 4,672
FINAL
CONSUMPTION
18,953 2,504 24,086 6,491 - - 4,672 74,574 79,180
Source: National Energy Balances MICSE.
7. ENERGY RESOURCES AND ENERGY SUPPLY
a. Renewable resources
i. Hydroelectric potential
Ecuador has significant potential for hydroelectric resources. There are 11 water
systems (of the 31 existing) with a theoretical potential of about 74,000 MW. The
installed technical and economic capacity is estimated at 21,500 MW, 90% in the

Amazon basin and 10% in the Pacific watershed (Table 5).

Table 5 Hydroelectric Potential in Ecuador
Watershed Potential Technically
Available (MW)
PACIFIC
WATERSHED
Potential Economically Available (MW)
Mira 488,50 -
Esmeraldas 1.878,50 1.194,00
Guayas 310,70 -
Cañar 112,20 -
Jubones 687,70 590,00
Puyango 298,70 229,00
Catamayo 459,60
SUBTOTAL 1 4.235,90 2.013,00
VERTIENTE DEL
AMAZONAS Napo-Coca 6.355,00 4.640,00
Napo-Napo 5.929,50 3.839,00
Pastaza 1.434,00 1.121,00
Santiago-Namangoza 5.810,60 4.006,00
Santiago-Zamora 5.857,60 5.401,00
Mayo 859,00 500,00
SUBTOTAL 2 26.245,70 19.507,00
TOTAL 30.481,60 21.520,00
Source: CONELEC, Master Electrification Plan 2012-
2021.
Note that the currently installed hydroelectric capacity in public service in 2012 was 2,160 MW,
which translates into approximately 10% of the potential identified as technically and
economically exploitable. When the large-scale projects that are under construction come into
operation around 2016, said capacity will increase around 5,000 MW, which is 23% of the
potential. The expectation is that by 2030 it will increase to levels around 10,000 MW, a bit less
than half the potential of the 21,520 MW shown in the previous table.
This calculation was designed for a scenario of increased efficiency in consumption
combined with greater use of electricity to replace other sources and continued
hydroelectric development to cover between 85% and 90% of generation.

ii. Wind energy
Within the framework of the PAES project (Sustainable Energy Action Plan),
Component II includes a wind map based on satellite data. Two measurement
towers were installed in two provinces in the country (Imbabura and Loja), and
were developed in parallel to a wind atlas and the measurement campaign that
began in 2011.
The Wind Atlas of Ecuador is in the process of being published. It presents the
annual wind conditions for the entire Ecuadorian territory with a resolution of 200m
x 200m.
Based on information from the wind map, the MEER estimated the potential for
electricity generation from wind parks installed in areas with significant wind
resources. The following scenarios were developed: Gross Total Potential and
Short-Term Achievable Potential. The first takes into account sites under 3500
m.s.n.m with velocities above 7m/s. The second, in addition to these
restrictions, takes into account sites that are at a distance of less than or equal
to 10km from electricity lines and highways.
The Total Available Gross Potential is estimated at 1,670 MW and the Short-Term
Achievable Potential is around 900 MW, with plant factors in the range of 25-35%.
Moreover, the prospect of viable wind potential for electricity generation
propelled by the National Government is currently 165 MW (Table 6).
Table 6 Wind projects in
development
Effective potential [MW]
Villonaco (Execution) 15
Salinas Etapa I (Studies) 15
Salinas Etapa II (Studies) 25
Membrillo – Chinchas (Studies) 110
Source: CONELEC, Master Electrification Plan 2012-2021.

iii. Solar energy
In relation to solar energy, in 2008 CONELEC published the Solar Atlas of Ecuador
that included a quantification of the solar potential available and its potential for
electricity generation.
Via programs such as Euro-Solar and the FERUM fund, taking advantage of solar for electricity generation in rural areas far from distribution lines was promoted. Through a regional agreement signed in 2006 between the European Union and eight countries in Latin America, Ecuador among them, the program “Euro-Solar” was born. This program has goals to improve life conditions related to health, education, and telecommunications for 91 rural communities in the country via access to a source of renewable electricity. The 91 communities are located in the provinces of Guayas, Morona Santiago, Pastaza, Orellana, Napo, Sucumbíos, and Esmeraldas.4
Regulation 004/11 establishes special prices for electricity generated with non-conventional renewable energy (ERNC). On this basis, some developers became interested in projects. Three solar photovoltaic projects, each with a potential near 1 MW, are being constructed in the areas of Malchinguí, Paragachi, and Escobar. In addition, five solar photovoltaic and thermoelectric generation projects have applied to begin construction (Milenio Solar I and II, Solarconnection, Shyri I and Condorsolar), for a total potential of 150 MW.5
iv. Geothermal
Ecuador is located on the Pacific ring of fire, and there is geothermal potential that
can be taken advantage of. This development was abandoned a long time ago, but
it has been recently taken up again. Although we need to move forward with
related studies, the potential is estimated at between 400 MW and 500 MW.
4 CONELEC. Master Electrification Plan 2012-2021. 5 CONELEC. Master Electrification Plan 2012-2021.
v. Biomass
There are some plants that produce energy and steam in a co-generation scheme and
sell the excess to the interconnected network. These plants are linked to the sugar
industry, although in one plant they use both bagasse and other agricultural residues.
The most important ones are Ecoelectric (36,5 MW, use bagasse and other

agricultural residues), San Carlos (35 MW) and Ecudos (29,8 MW).
vi. Biofuels
The country has the potential to develop a biofuels market to use in jet engines for
transport mixed with fossil fuels. The use of biofuels has important environmental
advantages given that their impact on the environment during their life cycle is
reduced compared to oil products. In addition, many jobs could be generated in
the agro-industrial, sugarcane, and palm oil chain: they could reach an estimated
12,000 (between direct and indirect employment), especially in the agricultural
phase.
Ethanol is already available in the city of Guayaquil as a mix – E5, 5% bioethanol and
95% gas between base and high octane. Also, between 2016 and 2017 this mix
could reach the average goal of 5% (E5, the current Ecocountry), and by 2020 could
reach 10% (E10) in the whole country. This would require planting an additional
40,000 to 50,000 hectares of sugarcane.
In 2011, an executive decree was passed that changed the formula for bioethanol
prices. It also created a strong incentive to promote investment in newly planted
areas and in distillation. All of this came about because the formula was established
based on the equivalent FOB price in New York for raw sugar (Contract 11).
The case of biodiesel is different than that of bioethanol given that the
Ecuadoran palm oil agroindustry has a surplus of raw palm oil that is being
exported (240,000 tons). The industry itself expects that these numbers will
grow in the future, especially based on an increase in productivity (and , to a
lesser degree, on the increase in planting, which is currently very low in
comparison to other producing areas in the world).
Surplus palm oil to produce biodiesel, a mix of B15 with a total penetration in
the diesel market for transport, could be commercialized by the end of the 2012 -
2030 period. In addition, production could increase based on other biomass and
technology.
Recently, an executive decree was passed that established goals for obligatory
mixes for the oil industry, starting with a plan for B3 and B5 mixes. In addition, the
implementation of a plan for the partial substitution of diesel for biodiesel in mixes

for all types of fixed consumption (electricity generation, industry) and mobiles
(terrestrial and marine engines) in the Galapagos Islands is being considered. All of
this is part of the “Zero Fossil Fuels in the Galapagos” initiative.
b. Non-renewable resources
i. Oil
Ecuador is an oil producing and exporting country, although given the size of its
reserves and production, its participation in the global market is small. Nonetheless,
oil is the main source of resources for export, and it plays an important role in the
national economy and in public finances.
Oil exploitation began in the country in 1972. Currently, taking into account the
accumulated production of some 4,700 million barrels, the proven remaining
reserves reach 3,500 million barrels. This means that 57% of the existing reserves
have been exploited, while 43% remain to be exploited (Figure 7 and Table 7).
Taking into account the remaining reserves plus additional resources,6 the total
13,000 million barrels could be exploited now. Of those, 59% are in fields that are
already in production, 22% are in fields that aren’t currently in production, and 19%
are in the ITT fields (Ishipingo, Tiputini and Tambococha).
Figure 7 Remaining reserves and additional oil resources

Source: Own elaboration based on MRNNR/MICSE data.
Table 7 Remaining reserves and additional oil resources (Millions of barrels)
Remaining
proven reserves (1)
Additional resources
(2)
Total
Fields in production 2,123.3 5,605.8 7,729.1
Fields not in production 455.1 2,416.9 2,872.0
Subtotal of fields in production and not in production
2,578.4
8,022.7
10,601.1
ITT 960.7 1,530.6 2,491.3
Total 3,539.1 9,553.3 13,092.4
(1) A t the beginning of 2011. (2) Probable, possible, and prospective reserves, data revised in mid 2012. Source: Own elaboration based on MRNNR/MICSE data.
6 Probable, possible, and prospective reserves, including improved or assisted recuperation, EOR (Enhanced Oil
Recovery).

The national government decided not to exploit the ITT fields given that most of the reserves are found in a protected area. Therefore, a fund was established to promote contributions from the international community to provide compensation for the loss of income from exports.
Thus, considering only the remaining reserves and additional resources in the
production fields and those that are not currently in production (excluding the ITT),
petroleum resources yet to be developed and exploited would be 10,600 million
barrels, 72% of which are found in fields currently in production. This is also where
80% of the remaining reserves and 70% of additional resources are found.
Resources in fields in production represent nearly 30% of remaining reserves and the
rest belongs to additional resources. Remaining reserves represent only 15% of the
resources of fields not in production.
Figure 8 Distribution of oil resources to be exploited by mid 2012 (without
ITT).

Source: own elaboration based on MRNNR/MICSE
data.
Petroleum reserves in the country are in decline, which means that additional
reserves, either by enhanced recovery or the addition of new reserves, are
extending the life of production. Without additional resources from fields not in
production and the production fields Petroecuador, Petroamazonas and Río Napo,
the country would have to import crude to fulfill the needs of refineries, especially
between 2016 and 2017, which is when the Pacific Refinery will begin operation.
Although the surplus of refined products reverses the current situation, around
2020 the country will become a net importer of energy, even in a scenario that
demands energy efficiency and continues the hydropower development that has
already begun.
With additional oil resources, the oil has a brighter future and refineries could be
supplied with national crude until the end of 2030. In approximately 2035, the
country could become a net importer. The exploitation of ITT can change the
situation and substantially prolong the horizon for depleting those resources. The
decision not to exploit those resources will have a strong impact on the future of
the national economy, something that the international community should
consider when setting resource contributions to compensate for the effect.
ii. Natural gas
Although Ecuador is not a gas producing country, it has reserves of free gas in the
Gulf of Guayaquil (Campo Amistad), and there are prospects of confirming recent
discoveries. In any case, if you wanted to increase the penetration of natural gas in
the energy mix, even with the addition of new reserves, the country might have to
increase the supply via imports of Liquefied Natural Gas (LNG) or via gas pipelines
from Venezuela and Colombia.
On the other hand, combined with oil production in eastern Ecuador, gas that is
currently vented is mostly produced.
The production of free natural gas in Campo Amistad began in August 2002. At the
end of 2010, the remaining reserves were 145,000 million feet squared (MMCF).
Accumulated production at this date was approximately 80,000 MMCF, which

means that 35% of 225,000 MMCF of original proven reserves had already been
exploited.
At the beginning of 2012, the identification of 1.7 TCF (trillions of cubic feet) in the
Campo Amistad was announced. These were in the resource category, which means
that if exploratory activity was allowed and they could become proven reserves, the
horizon for expanding the production and use of natural gas would open up.
c. Energy supply
i. Electricity sector
a. Installed capacity and
generation
Installed power in public electricity service plants grew from 3,070 MW in 1999 to
4,150 in 2010. However, during that period there was a lag in hydropower
development and an increase in the installation of thermal plants, which came to
represent 50% of the generation towards the end of the period (Figure 9).

Figure 9 Effective installed capacity by type of
plant
Own elaboration based on CONELEC data.
Above all, this increase is notable in installed capacity in gas turbines and diesel cycle internal combustion motors (ICM), especially those of average speed. Thus, more rapidly installed equipment was used given the vulnerability of the system, which suffers the risks of shortages and blackouts frequently.
This situation will be reversed in a few years when the hydroelectric projects under
construction begin operation.
Changes in the composition of the generation park and operative characteristics
and availability of different types of plants created a structure of electricity
generation that experienced the marked decrease of hydraulic participation, which
lowered from 70% to 50% between 1999 and 2010.
In turn, there was a growth of thermal generation, especially generation with ICM
and high imports from Colombia, which came to represent more than 12% of the
generation total in 2004 (Figure 10).

Figure 10 Electricity generation for type of plant
With respect to the distribution of electricity, there are 20 distributors in the country. Ten were grouped together a few years ago in the National Electricity Corporation (CNEL) with the objective of improving the performance of these companies in terms of losses, billing, collection, and quality of service. The total number of final clients of distribution companies has grown steadily with annual rates between 4% and 6%. This percentage was also consistent with population growth and the expansion of coverage. Currently, the number of subscribers to electricity service is 4.3 million according to the figures from July.
An important aspect to consider is distribution losses (Figure 11), given that to a great extent it indicates the management capacity of the companies that are in charge of expanding service coverage. Similarly, this is how CONELEC channels funds from the Rural and Marginal Urban Electrification Fund (FERUM). Total losses from the entire national distribution network have been reduced steadily from a maximum of 23% in 2004 to 14.7% in 2011. However, it could still be said that in several distribution companies losses continue to be high, especially, according to 2010 statistics,7 those that aren’t “technical.”

Figure 11 Distribution losses by company 2010
7 The losses show similar levels in the majority of companies according to available statistics on total losses
(technical and non-technical) 2011.

b. International interconnection, import, and export
At present, the defective capacity of international interconnection links reaches a
total of 635 MW, which represents nearly 12% of the total effective capacity of the
Ecuadorian electricity system (Figure 12).
Figure 12 Effective installed capacity by type of business and interconnection
The historic evolution of International Energy Transactions (IET) shows that the exchanges have basically been between Colombia and Ecuador. In the case of Peru, there was virtually now flow after the 230 KV Machala-Zorritos began operation in 2005. Ecuador only had minimal imports from Peru in that year, while in 2009 and 2010 it registered a flow of 0.21 GWh and 6.3 GWh respectively from Ecuador to Peru. Ecuador’s imports from Colombia began on a greater scale in 2003 with the opening of the first 230 KV interconnection line with 240 MW of effective power. With this it acquired a major stake between 2003 and 2006 in the supply of electricity demand on the Ecuadorian market that came to represent between 8% and 12% of gross system generation. These figures are mainly due to hydrological

decreases, requirements in periods of drought, and a lack of operational thermal backup with frequent limitations to supply in Ecuador.
In 2007 said imports reduced drastically because the hydroelectric San Francisco
began operation. Similarly, other installations reduced the need for imports for the
Ecuadorian system. However, during the 2009-2011 period imports grew again to
significant levels: between 4% and 6% of gross generation (Figure 13).
Figure 13 Gross generation by type of company and
interconnection
The value of transactions, mainly imports from Ecuador to Colombia, reached a
maximum value of 1,716 million dollars in 2005, while in 2011 it was almost 1,300
million (Table 8).

Table 8 Value and average prices of electricity exchanges with Colombia
2003 2004 2005 2006 2007 2008 2009 2010 2011
GWh 1,119.61 1,641.61 1,716.01 1,570.47 860.87 500.16 1,058.20 794.51 1,294.59
Millions US$ 68.38 134.11 148.55 122.53 17.82 33.99 102.38 74.13 87.83
Cents US$/KWh 6.11 8.17 8.66 7.80 2.07 6.80 9.67 9.33 6.78
GWh 67.20 34.97 16.03 1.07 38.39 37.53 20.76 9.74 8.22
Millions US$ 0.87 0.18 0.14 0.03 0.29 0.63 1.08 0.68 0.19
Cents US$/KWh 1.29 0.51 0.87 2.80 0.76 1.68 5.20 6.98 2.31
Source: Own elaboration based on CONELEC
data.
It should be noted that the Andean electricity market is the only case in Latin America in
which there are supranational regulations, which are issued by the Andean Community
of Nations (CAN). However, the market is still in the beginning stages given that there
are unresolved issues that are being discussed. With respect to this situation, the CAN,
in CAN Decision 757 from August 2011, extended the period that had been established
in Decision 720 by two years. Ecuador is working on the issue via MEER, CONELEC, and
other entities given that starting in 2016/2017 the country could become a net exporter
of electricity. This fact will reverse the current situation, and the surplus, whose
magnitude will depend on the nature of the structural changes produced in final
demand by substituting fossil fuels (mainly domestic LPG and industrial diesel) for
electricity.
i. Oil and natural gas
a. Oil production
As has been mentioned previously, Ecuador is a oil exporter and producer and it
participates minimally in the world market with respect to the volume of its
reserves and production. This is why hydrocarbons (oil and its derivatives, and, in
lesser measure, gas) have high participation in the energy structure of the national
economy.
The country became an exporter of oil when commercial oil exploitation began in
1972. For two decades, there was sustained growth that stabilized between 1994
and 2004. In 2004, there was a strong recovery and then growth fell starting in
2006. It was not until 20128 (average daily production, Figure 14) that growth

recovered again.
b. Natural gas production
The production of free natural gas in Campo Amistad began in August 2002 and
grew to reach levels between 10,000 and 12,000 millions of feet squared (Table 9)
Figure 14 Production of crude oil by field
This production is used mainly for electricity generation in the Machala
Thermogas plant. In 2011, the plant’s power increased from 130 MW to 210 MW
with the installation of four additional turbines. With the increase in natural gas
production, the use of gas from the Gulf allowed an increase in electricity
generation and the savings of imported diesel in the production of these four
turbines.
8 Estimated values 2012.
Table 9 Natural gas production
Millions of feet squared
2002(*) 3,063
2003 8,810

2004 8,523
2005 9,301
2006 10,005
2007 10,513
2008 8,872
2009 10,550
2010 11,776
2011 8,630
Source:
MRNNR (*) Production began on August 6, 2002.
The surplus of natural gas, 200 metric tons daily, which is equivalent to 10
million cubic feet a day, goes to a liquefaction plant. Liquefied natural gas
(LPG) is transported in special trucks to storage and regasification plants in
Cuenca where natural gas is transformed from its original gaseous state in order
to feed the city’s industry. This process is intended to partially replace diesel
with natural gas and LPG.
With respect to associated natural gas, by 2015 natural gas flaring in eastern
Ecuador is expected to be significantly reduced. The project “Optimization of
Electricity Generation” (OGE) seeks to reduce pollution from greenhouse gases
that are produced with the burning of associated gas in the oil fields. At the
same time, it seeks to substitute diesel consumption for untapped gas to
generate electricity to use in the operation of oil fields.
c. Oil refining
Currently the capacity and structure of existing refineries is not adequate for the
levels and structure of the market. Therefore there are imbalances between national
production and the demand for oil derivatives. On the one hand, the imbalance leads
to elevated import of costly derivatives like Liquefied Petroleum Gas (LPG, a mix of
propane and butane), gasoline, and diesel. On the other hand, it leads to exports of
surplus fuel oil which has a lower value on the market.
Currently a deep conversion refinery with a capacity of 300,000 barrels per day is in
construction. It would drastically change the structure of refining. The Refinery of the
Pacific (RDP), whose investment reaches 12,000 million dollars, will not produce fuel
oil (only residual coke), but it will have high yield production of diesel and gasoline.
Thus the structure of combined refining in current refineries would change

substantially by 2017 when the RDP begins operation (Figure 15).
Figure 15 The structure of oil derivative production in refineries
d. Exports and imports
Since its inception, the volume of crude exports grew continuously in function to
the growth of oil production. However, in recent years it showed a considerable
decline (Figure 16).
Figure 16 Crude exports

Both production and exports will potentially continue to be stable or decline in the short
term, but later will recover due to the increase in production in the fields and due to the
addition of fields that aren’t in production currently. This way, the timeframe for
exhausting the resource will be prolonged, as the chapter about oil resources will
explain.
Furthermore, imbalances caused by the refining structure led to the current situation of
high value imported market products like LPG (more than 80% is imported), gas (more
than 50% is imported), and diesel (more than 60% is imported). On the other hand,
more than half the production in fuel refineries is exported as a low value product on the
international market (Figure 17).
8. ENERYG DEMAND
a. Final energy demand
Final energy consumption was 75.5 million barrels of oil equivalent (BOE).
Transport represented more than half of final energy9 consumption in the country.
It is the consumption sector with the greatest influence and also possibly the one
that is most inefficient.
Figure 17 Import and export of oil derivatives
Industry and the residential sector, in this order, are the sectors with the greatest

consumption aside from transport (although in much lower proportions than the
first two), while the commercial and service sectors don’t reach 4% of energy
consumption (Figure 18).
Figure 18 Consumption by sector and energy source,
2010
9 Not including non-energy consumption.

Oil derivatives cover more than 80% of electricity consumption, while electricity covers 13%. With respect to firewood, it should be noted that the data are estimates from long ago which should be corroborated by specific measurements in the field. Based on the strong penetration of LPG for domestic cooking, one might think that firewood consumption is overestimated. However, data from the “2010 Population and Housing Census” indicates that there are still a significant number of homes, mostly rural, that use firewood and coal as the main source of energy for cooking.
b. Sectoral demand
i. Transport sector
Figure 19 Auto Fleet

The transport sector is the largest energy consumer and currently uses only oil derivatives. Consumption of electricity by the trolleybus in Quito is very reduced. 84% of total consumption corresponds to the auto fleet, and the remaining 16% to sea, air, and rail transport. Nearly half of the auto fleet in circulation, according to 2010 data, is made up of cars and jeeps, in general passenger vehicles, while light load vehicles (semi-trailer trucks and cargo vans) make up 20% of the fleet and trucks 11%. Energy consumption, given longer trips and larger motor sizes, is concentrated 46% in semi-trailer trucks and almost 40% in light load vehicles (Figure 19).

Energy consumption for highway transport is fundamentally made up of diesel and gas, almost in equal parts. Cars and jeeps use gas 98% and diesel trucks 88%. A number of the vehicles still have gas motors, and vans and light duty trucks consume approximately 85% gas and 15% diesel.
ii. Residential sector
According to 2010 data, residential sector consumption is covered 52% by LPG and
the rest by electricity and firewood (Figure 20).
Figure 20 Residential energy consumption structure by source
2010
LPG is mainly used for cooking food and, to a lesser extent, for heating water,
mainly in mountain areas where the climate is cold. As will be explained, the
product is strongly subsidized which causes the majority of the population to use it
given that it is for all consumers. As was seen previously, more than 80% is
imported. The annual estimated cost of the subsidy is around 600 million dollars. In
the specific case of Ecuador, this causes an additional universal access to modern
energy problem because the modern energy source is not sustainable in financial
terms. This is one of the elements included in the concept of sustainability defined
within the SE4ALL focus.
iii. Industrial sector

The industrial sector mainly consumes, in order of importance, diesel, electricity,
and fuel oil that together represent 86% of energy consumption in the sector
(Figure 21).
The industrial sector accounted for in the energy balance corresponds to formal
industry. In general, productive consumption linked to consumption for productive
uses in small businesses and industries aren’t represented, especially if they are
associated with sectors with less income, specifically in rural areas.
On the other hand, industrial consumption figures are included for the entire sector,
based on electricity billing rate for that segment and sales of fuel distribution
companies thereof.
Figure 21 Structure of industrial consumption by energy source
iv. Sectoral demand for the main energy sources
The main consumer of electricity is industry, with more than 40%. It is followed by
the residential sector and the commerce and services sectors (Figure 22). Given
that transport is the largest consumer of energy and that it uses only oil derivatives,
the consumption of these last sectors goes two thirds to transport and, in much

smaller measure, to the industrial and residential sectors.
Figura 22 Consumption by sector in
2010
9. ENERGY AND ECONOMIC DEVELOPMENT
a. Participation of the energy sector in the GDP
In the energy sector, the oil economy has been the motor for the national economy
for more than four decades (Figure 23).
Figure 23 Participation of the energy sector in the GDP and oil production
as the leading variable
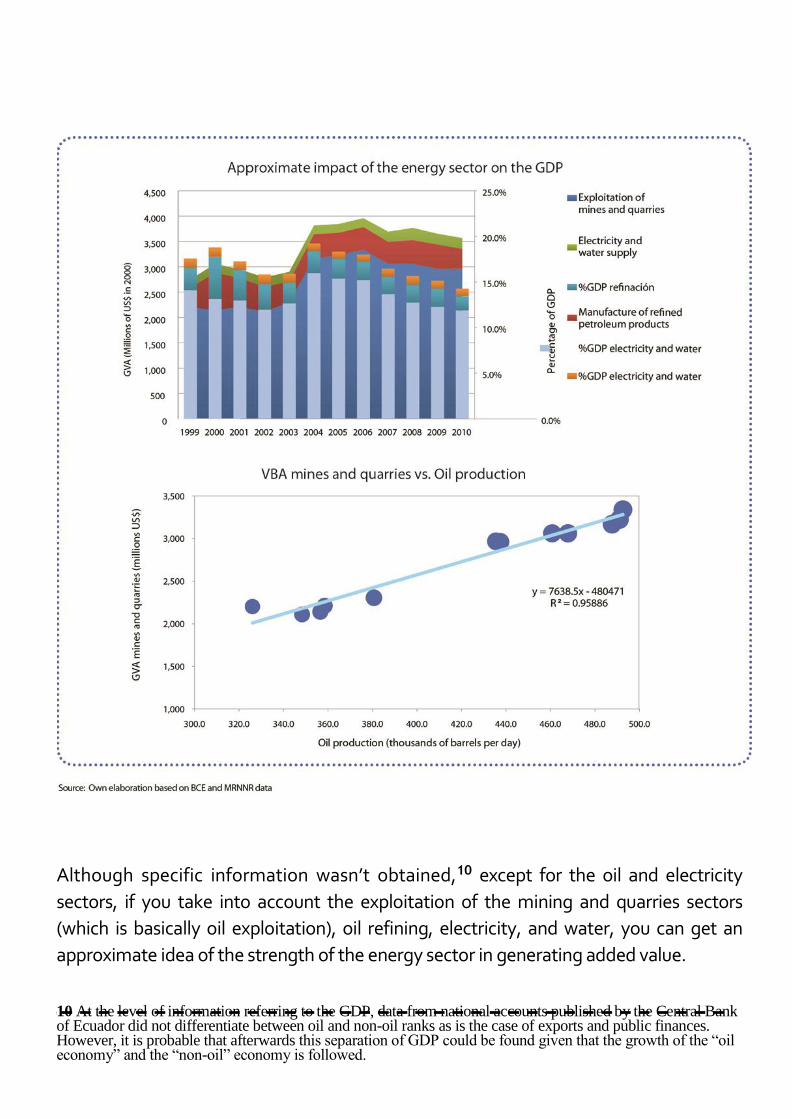
Although specific information wasn’t obtained,10 except for the oil and electricity
sectors, if you take into account the exploitation of the mining and quarries sectors
(which is basically oil exploitation), oil refining, electricity, and water, you can get an
approximate idea of the strength of the energy sector in generating added value. 10 At the level of information referring to the GDP, data from national accounts published by the Central Bank of Ecuador did not differentiate between oil and non-oil ranks as is the case of exports and public finances. However, it is probable that afterwards this separation of GDP could be found given that the growth of the “oil economy” and the “non-oil” economy is followed.

The mining and quarries exploitation sector has the greatest influence over the GDP. As you can clearly see in Figure 20, its driving force is oil production.
The abrupt increase in Gross Value Added (GVA) in the mining and quarries sector
in 2004 coincided exactly with a strong increase in oil production (see Figure 14).
b. Impact of oil on the balance of payments
Oil is the leading export in Ecuador. However, as we previously mentioned, the
commercial oil balance and the import of oil are so positive in some years that in
other years they have compensated for the deficit in the non-oil commercial
balance.
The behavior of exports and the national trade balance is represented in Figure 24.
Naturally, the oil export price variable is crucial, plus the volume of exports.
Figure 24 Commercial oil and non-oil balance
For their part, in the past few years, oil exports represented an average of between 50%
and 60% of total goods exported. These were determined according to the changes in
production and oil prices (Figure 25).
Figure 25 Effect of oil and derivatives on the export of goods

Regarding imports, the influence of oil derivatives is less important, especially
starting in 2005. During that year, their weight represented around 20% of the
export of goods, a figure that was a function of the distortion between the refining
structure and the domestic market (Figure 26).
Figure 26 Effect of oil derivatives on the import of goods

The Effect of Oil on Public Finances
The net income for the oil and derivatives trade balance also had an important
influence on public finances, which in recent years of high international prices made
up between 30% and 40% of public sector non-financial income, and between 15%
and 20% in relation to the GDP (Figure 27).
Figure 27 Total income for the public non-financial sector (base
yield)

10. ENERGY STRATEGY
In Ecuador there is no organization in charge of comprehensive energy planning.
The Ministry of Coordination for Energy Sectors, which coordinates the electricity
and hydrocarbons sectors, in addition to other strategic sectors like
communications and water, recently made a prospective and long-term planning
analysis. This project started by reviewing and updating information and creating a
comprehensive strategic plan. The plan was based on energy demand, supply, and
energy resources. It included some economic, environmental, and institutional
issues. The strategies discussed still haven’t been formalized, because no decision
has been made regarding the institutional framework for implementing the
comprehensive energy planning system.
On the other hand, in the electricity sector there is systematic planning. Every
year CONELEC publishes a projection for the next ten years. In the case of
hydrocarbons, although there are mid-term goals and objectives, development
plans are not systematically published.
However, analyzing the current energy matrix and the availability of energy
resources in the country, they can visualize relevant strategic plans, several of
which are reflected in the decisions made or considered by the national
government via diverse organizations.
On the side of supply, which has been studied the most and where large
investments have been made, the main strategies are the following:
• Electricity generation: reduction of cost, clean energy, drastic reduction of GHG,
total elimination of blackouts:
– To substantially increase the participation of hydroelectric energy in
generation: there is a plan for new hydroelectric construction projects to
take advantage of the existing potential. Similarly, large-scale works are
moving in this direction and will begin operation between 2015 and 2016,
with the majority of other mid-term projects.
– The most significant projects are Coca Codo Sinclair (1.500 MW), Paute-
Sopladora (487 MW), Toachi-Pilatón (253 MW), and Minas-San Fran- cisco
(276 MW): the incorporation of new projects signals a substantial increase in
hydroelectric capacity in the coming years and will lead to an energy mix
that will be approximately 90% hydroelectric and 10% thermal.
– To drive non-conventional renewable energy generation in addition to
advancing studies about wind and geothermal potential (there is already a
solar atlas). The “Master Electrification Plan” already includes a 50 MW
geothermal plant and two 15 MW wind projects scheduled for 2017.
– The hydroelectric generation strategy will continue over the long term.
Also, soon studies about new projects that begin providing service in 2020-
21 should be undertaken. The same will happen with non-conventional
renewable energy, although it is limited depending on the magnitude of
demand and the installation of hydroelectric plants.
– To promote completing the regulatory framework and systematic
operation of the regional Andean market on a larger scale. Starting in 2016
the situation in Ecuador will change drastically because it will move from
importing all its electricity from Colombia to become a net exporter. The
size of the surpluses will depend on the implementation of efficiency and
replacement strategies on the demand side even though, in any case, there
will be surpluses and the installed capacity for exportation could increase.
• Oil: is a resource in decline whose timeframe should be extended to maintain a
level of income that allows for the profound transformation of an economy
based on a sustainable energy mix:
– The identification of new prospects to ensure a sustained supply for oil
refining and export is a priority. In this sense, plans are directed at
improving recovery in mature production fields and the development and
exploitation of fields that are not in production (excluding ITT). These
actions would increase production so that the timeframe for depletion is
extended.
– The project of the Refinery of the Pacific is aimed at changing the
refining structure to substitute high market value light and
intermediate derivative imports and not export heavy derivatives at a
low price.
• Biocombustibles: to develop a market for ethanol and biodiesel on a
national level to use fuel mixes: – The ethanol project has already begun in Guayaquil with ethanol from
sugarcane produce in existing sugar industry distilleries – It is expected that soon biodiesel production from palm oil will begin on
a national scale.
• Natural gas: increase the penetration of gas in the energy mix to the extent that

the reserves permit and then consider importing via pipeline or LNG:
– Free natural gas in the Gulf of Guayaquil, which feeds the Central de Machala
and the industry in Cuenca is a non-renewable resource. Thus it can be used
up if new prospects aren’t discovered. As a result, the construction of an
unloading port and a natural gas regasification plant should be considered
according to the penetration of natural gas in different sectors.
– A high percentage of natural gas associated with oil production in the east
is being vented which is why the OGE project expects to use it for electricity
generation.
On the demand side, which is the part of the energy matrix where there is still more
to do, the main strategies should be oriented at adjusting the consumption structure
to the availability of resources (substitution among energy sources) and to achieve
more efficient energy use via new technologies and good operational practices. The
main strategies can be summarized as following:
• Transport: is the largest and growing consumer of energy. There are big
opportunities to improve efficiency and to partially use renewable
energy, both directly and indirectly, by using electricity generated
mainly by renewable energy:
– To promote greater use of public passenger transport to encourage
decongestion. This policy should be accompanied by regulations related to cargo
and passengers on the road, as well as to monitoring emissions.

– Development of an urban road network according to the growth of the vehicle fleet in circulation to avoid collapses during rush hour to induce increased fuel consumption and higher emissions.
– To study and, in some cases, develop rail alternatives to partially replace truck transport.
– To substitute liquid fuels by increasing the penetration of hybrid vehicles and introducing electric vehicles on the market, as well as increasing biofuels.
– To support a national production industry, marketing, and the import of vehicles with more efficient motors and new technologies like hybrid and electric cars. It is important to consider the specific characteristics of the country and the increase in development in the national metalworking industry.
– To substitute LPG in taxis for compressed natural gas (CNG) on the coast and in other types of vehicles. All this depends on the availability of gas in the future.
• Industry: is an important consumption sector with the potential to
improve its efficiency, something that not only reduces the system energy
requirements but also makes them more competitive and provides
greater earnings on the markets. Improved energy-environmental actions
are:
– Improve technologies to produce heat. – Use renewable energy, either external or generated by productive
processes (for example, agricultural residues) to produce direct heat or
electricity – To promote energy and heat cogeneration (vapor) or cold to make
more efficient use of renewable energy o fossil fuels. – Design and implementation of energy efficiency and renewable energy
via direct interaction with the productive sectors. – Substitution of diesel and fuel oil for electricity and natural gas (in the
measure that national or imported gas is available).
• Residential sector: – Education and information about energy savings mechanisms.
– Promotion to market labeled energy efficient appliances.
– Substitution of conventional water heating for solar heating.
– Gradual substitution of LPG cookstoves for high performance electric
cookstoves as the availability of electricity is extended.
– To extend electricity service coverage to reach the goal of universal

supply weather it is via the extension of distribution networks, the
installation of mini-networks supplied by renewable energy (mini
hydro, wind, and solar), or by individual supply (photovoltaic panels).
– To substitute firewood with LPG and electricity or, if this is not
possible, to make it more efficient.

SECTION 2: CURRENT SITUATION IN RELATION TO THE OBJECTIVES OF SE4ALL

2.1 ACCESS TO ENERGY IN RELATION TO THE OBJECTIVES OF SE4ALL
11. GENERAL OVERVIEW
In general, the country is in an advanced position in relation to the three SE4ALL
objectives.
With respect to energy access, there are high penetration rates of modern energy
for thermal use and high electricity service coverage. There is also extensive
development of renewable energy for generating electricity based on existing
hydroelectric projects and others under construction. Current regulations also
allow the support of private generation with non-conventional renewable energy
and hydroelectric plants. In addition, there are programs and projects to advance
energy efficiency and the use of renewable resources on the side of demand in the
productive sectors with the goal of advancing these issues, especially those that
are currently less developed.
Given the current high rates, what remains to be achieved in terms of universal
access to electricity in quantity and quality and for thermal energy in terms of
efficiency for cooking, is a greater effort to increase coverage in areas where it is
most difficult to implement. Similarly, energy efficiency should be promoted more
in the productive sectors.
The last housing and population census undertaken in 2010 provides updated
information about the energy sources used in cooking and rural and urban access
to electricity.
With respect to the energy source used for cooking, census data indicates that
there is still a significant quantity of homes that use firewood or coal as the main
source of cooking fuel, especially in rural areas, where this fact represents an

important number even though its overall weight in terms of the total is low. The
existence of a significant number of homes that still use firewood inefficiently is
relevant in relation to the SE4ALL objectives which involve universal access to
modern energy regardless of whether the quantities consumed may have little
impact with respect to national totals. Regarding access to electricity, the current
coverage is high, but there is still a way to go to reach the goal of universal supply.
Although coverage levels increased significantly in both urban and rural areas, it is
necessary to reach the whole population, which implies a big additional effort
given that the closer you get to the goal, the more difficult it is to reach the
remaining population.
12. MODERN ENERGY FOR THERMAL APPLICATIONS (COOKING, HEATING WATER)
Thermal energy in homes is mainly for cooking food. However, in some cities in the mountains with colder climates, segments of the population use hot water to shower. The magnitude of their consumption is much less than that for cooking according to some studies carried out by the Quito Electricity Company.11
Firewood or coal are regularly used by 0.7% of urban homes, 17.7% and 6.8% respectively in relation to the total. This represents nearly 260,000 homes, of which 18,000 are urban and 242,000 rural. The distribution by province shows a greater concentration of homes that use firewood in some provinces on the coast while use is lower in the Amazonian provinces (Figure 28).
11 The 2010 census didn’t gather information about the use of hot water for showers, but it did record whether bathing facilities were shared or individual.
Figura 28 Number of homes that use firewood/coal as the main cooking fuel

While LPG is consumed 32% in rural areas and 68% in urban areas, the use of
firewood/coal is 91% in rural areas and 9% in urban ones (Table 10 and 11).
Also, the main source of energy for cooking is LPG, which is used in 96.7% of urban
homes and in 80.7% of rural homes, which means that 91% of the total population
uses it (Table 12).
Table 10 Number of homes according to the main energy source for cooking

Gas (tank or
cylinder)
Central
gas
Electricity
Firewood,
coal (*)
Veg. and/or
animal residues
Other (Ex.
gas, kerosene or diesel etc)
Not
cooking
TOTAL
Rural 1.107.214 1.867 241.292 469 185 20.159 1.371.186
Urban 2.347.562 11.961 14.356 17.924 46 260 47.253 2.439.362
TOTAL 3.454.776 11.961 16.223 259.216 515 445 67.412 3.810.548
Source: INEC, National Housing and Population
Census 2010 (*) The census doesn´t separate
firewood and coal.
Table 11 Rural and urban distribution of the use of energy sources for cooking
Gas (tank or
cylinder)
Central
Gas
Electricity
Firewood,
coal
Veg. and/or
animal
residues
Other (Ex.
gas,
kerosene or
diesel etc)
Not
cooking
TOTAL
Rural 32,0% 0,0% 11,5% 93,1% 91,1% 41,6% 29,9% 36,0%
Urban 68,0% 100,0% 88,5% 6,9% 8,9% 58,4% 70,1% 64,0%
TOTAL 100,0% 100,0% 100,0% 100,0% 100,0% 100,0% 100,0% 100,0%
Source: INEC, National Housing and Population
Census 2010 (*) The census doesn´t separate
firewood and coal.
Table 12 Number of homes according to the main energy source for cooking (Percentages)
Gas (tank or
cylinder)
Central
Gas
Electricity
Firewood,
coal
Veg. and/or
animal
residues
Other (Ex.
gas, kerosene
or diesel etc)
Not
cooking
TOTAL
Rural 80,7% 0,0% 0,1% 17,6% 0,0% 0,0% 1,5% 100,0%
Urban 96,2% 0,5% 0,6% 0,7% 0,0% 0,0% 1,9% 100,0%
TOTAL 90,7% 0,3% 0,4% 6,8% 0,0% 0,0% 1,8% 100,0%
Source: INEC, National Housing and Population
Census 2010 (*) The census doesn´t separate
firewood and coal.
13. ACCESS TO ELECTRICITY
a. Physical access: electricity service coverage
Electricity service coverage is 96.2% (96.1% network and 0.1% solar panels) in
urban homes and 88.2% in rural homes (88.0% network and 0.2% panels), which
results in 93.4% (93.2% distribution network and 0.2% solar panel) for homes in the
whole country. Apart from the minimum contributions of autogeneration and
others, households without any type of electricity service represent 2.2% of the

total in urban areas and 10.5% of rural homes, which is 5.2% for the whole country.
This means, in absolute terms, that near 196,000 homes in the country don’t have
electricity, and 54,000 are in urban areas and 142,000 in rural areas (Figure 29)
Figure 29 Number of homes without access to
electricity
The geographic distribution of houses without electricity shows how, in general,
they are mainly distributed not only in provinces on the coast and in the mountains,
but also in some Amazonian provinces. Electricity service grew continually in the
past decade to arrive at 93.4% (average percentage in the 2010 population and

housing census, Figure 30)
Figure 30 Historic evolution of electricity service
coverage
b. Participation of renewable energy in the electricity generation mix
The increase in electricity coverage to reach universal access, which is the objective of
SE4ALL and of the national government, is environmentally sustainable given that
90% or more of electricity is generated by plants that use renewable energy, mainly
hydroelectricity (Figure 31).

Figure 31 Strongly hydroelectric electricity generation
c. Quality of service
The quality of technical service is measured by the Momentary Average Interruption Frequency for KW installed (MAIFI) and the Customer Total Average Interruption Duration Index (CTAIDI). The majority of electricity distribution companies don’t meet the minimum requirements for quality of service-product established in current regulations. This can be seen clearly in Figure 32, which exemplifies the case of Customer Total Average Interruption Index (CTAIDI). The same situation can be seen in the case of MAIFI12 although with a variation in terms of the regulation that the company does not meet.
Figure 32 Total interruption time 2010
This is an issue that affects not only new users that are going to connect to the
network but all consumers and their activities.
12 According to CONELEC in PME 2012-2021, “The average interruption in 2010 is around 33 hours a year, while what is permitted by the regulator is 8 hours. These indexes presented reflect reports from the distributors, which don’t always adjust to the reality given the difficulty of keeping track of indicators of technical quality. Thus, in some cases the real situation is worse than what is described in the graphics.”

This problem is already being faced and is expected to have tangible results in the
short-term although there are some difficulties.13 With this objective, the
contribution of resources to reach the levels of quality of service and product
established in the regulations will increase. At the same time, the necessary
supervision needed to verify compliance with the rules will be carried out. If
necessary, corresponding penalties will be applied.
On the other hand, it is necessary to consider that in certain cases of isolated
systems with off-grid solutions, like, for example, photovoltaic panels, the
parameters for quality of service can’t be the same as those that are applied to
interconnected networks.
d. Prices and subsidies
This is a sensitive issue that could be a barrier both for the long-term economic
sustainability of the energy supply and for the economy in general given the size of
subsidies in terms of public finance and the economy.
Specifically in relation to the SE4ALL objectives, subsidies constitute an important
barrier for energy efficiency and the use of renewable energy in productive sectors.
Although at some point this could indirectly affect the energy access objectives of
SE4ALL and electricity generation with non-renewable sources, this is not a real
risk. There are sufficient guarantees for the sustainability of investment programs
related to energy access as well as for private generation contracts with renewable
energy.
92% of LPG consumption on a national level occurs in the residential sector. Gas for
domestic use is subsidized only for cooking, and it excludes the use of heating water.
However, the real impossibility of exercising control over consumption inside homes means
that in large measure it is used to heat water.
13 El PME 2012-2021 points out: “Due to the limitations in allocating financial resources for the implementation of distribution network expansion and improvement projects, currently there are problems with the quality of the electricity supply which affect the entire society. This is because distributors don’t have information systems associated with their main clients. Therefore, when it is not possible to know the number or type of customers affected by an interruption. It is estimated that these problems have a major impact on the productive sector, which in turn directly influence the development of the country.”

The LPG subsidy is not specific, and is applied to all commercial gas in the 11 distributors that operate in the country. Petroecuador runs wholesale distribution. Thus, areas of medium, high, and very high income (not only low income segments) can buy LPG at 1.60 US$ per 15 Kg cylinder. Even including some overhead for delivery to homes, the price will not rise above US$ 2 to 2.2 per cylinder. Note that the State contribution is made on a wholesale level.
It is estimated that the total magnitude of the LPG subsidy fluctuates around 600 million annual dollars. Thus, in the case of Ecuador, reaching the SE4ALL objectives, which coincides with the government’s objectives (universal access to modern energy sources for cooking) that are environmentally, socially, and economically sustainable implies not only substituting or improving efficiency in the use of inefficient energy sources and pollutants but also replacing LPG with electricity. To do this, the MEER designed a LPG to electricity replacement plan, which will be explained later.
With respect to electricity rates, Constitutional Mandate No. 15 emitted in July 2008 establishes in Article 1 that: “The National Electricity Board – CONELEC – […] will approve the new rate structures to establish one rate for electricity distribution companies that can be applied to each type of electricity consumption […]. These parameters will eliminate the concept of marginal costs for calculating the generation component. Investment components for the expansion in cost of distribution and transmission will not be considered. The resources required to cover the investment in generation, transmission, and distribution will be covered by the State and will be a compulsory part of the General Budget. They will be transferred monthly to the Fund for Solidarity and will consider the capital contribution of said institution.”
Article 2 states that: "The Ministry of Finance will cover monthly differences
between the costs of generation, distribution, transmission, and fixed flat rates for
the consumer determined by CONELEC. To this end, the Ministry of Finance shall
make all relevant budget adjustments needed to comply with this mandate.
Average electricity prices have stayed relatively stable since 2003 (Figure 33). Note that there is a special rate for consumers under 100 KWh/month in the mountains, and 130 KWh/month in the rest of the country where the “Dignity rate” of 4 cents on the dollar per KWh is applied. Current rates are applied to the rest of consumption by category and consumption rank in different sectors: residential, commercial, and industrial.
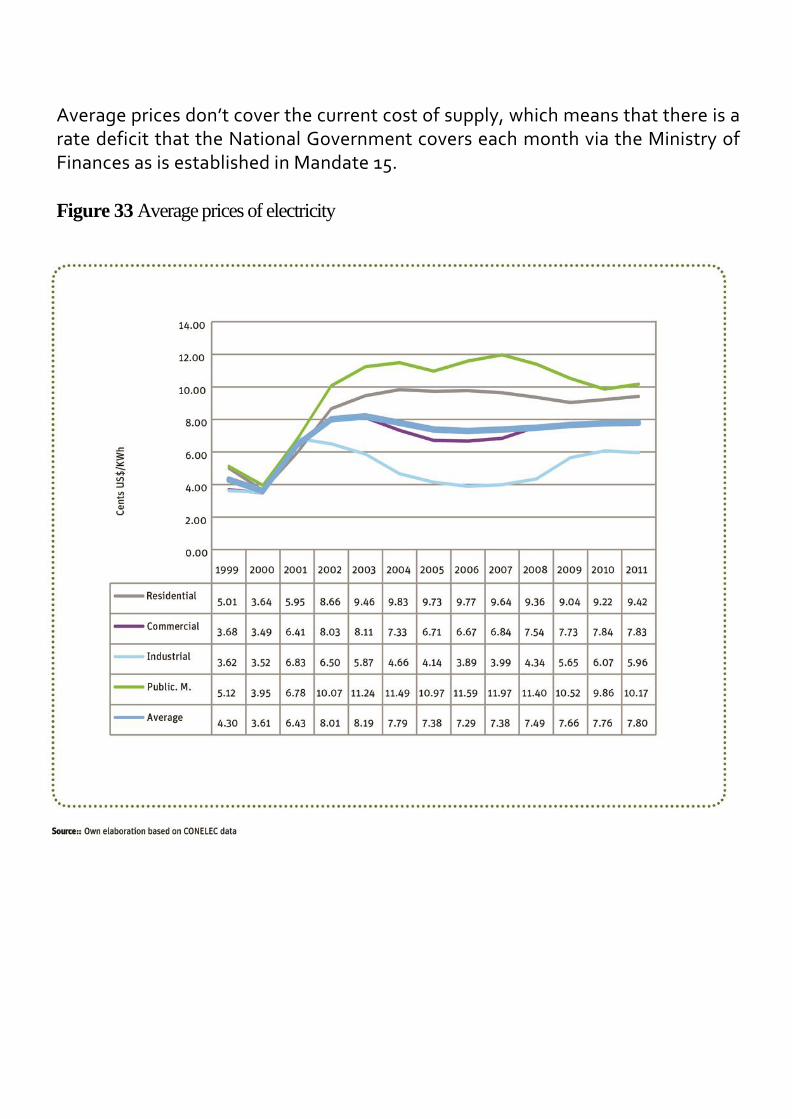
Average prices don’t cover the current cost of supply, which means that there is a rate deficit that the National Government covers each month via the Ministry of Finances as is established in Mandate 15.
Figure 33 Average prices of electricity

When the hydroelectric projects in construction begin operation, the average cost
of generation will fall substantially given that thermal generation will be limited (as
was shown previously). Thus, according to calculations made by CONELEC and
presented in the PME 2012-2021, the average cost of generation, transmission, and
distribution will remain below the average price of energy.
This would generate a rate surplus that would come into balance by 2020-2021. In
the coming years, while continuing disbursements for investments in process, the
rate deficit will increase and by 2014 will reach a maximum level of 670 million US$.
14. MODERN ENERGY FOR PRODUCTIVE USES
With respect to productive uses in rural and marginal urban sectors (small workshops,
crafts, food, etc.) there is no detailed information. As is true with companies, it is necessary
to verify with CONELEC if there are consumption estimations. In general, rural
populations work in the agricultural, livestock, forestry, fishing, tourism, and other sectors.
The marginal urban population works in services, sales, crafts, and informal activities.
Thus, the issue of modern energy for productive uses is part of electricity access. As
coverage increases, the population benefits not only in terms of having energy for use in
the home, but also in terms of productive activities.
As has been indicated in the analysis of the energy situation, there is not complete
information about consumption data by branch of industrial activity and there is even less
data about final users. There are only a few analyses of it, although there is a MEER
program to fill these information gaps related to the development of energy efficiency
activities. These information gaps make it difficult to measure inefficiencies although
some indicators show certain general measurements, as you will see below.
For reference, it may be noted that, based on a Mining and Manufacturing Survey
conducted by the INEC (National Institute of Statistics and Census), and taking into
account spending on electricity and fuel use in 2008, the estimate of energy consumption
by ISIC division (classification Industrial Classification) indicates that the main
consumption subsectors are: Food and Beverages (45%), Other Non Metallic Mineral
Products (28%), Paper and Paper Products (7%) and Textiles (6%) 14.14
On the other hand, the productive and service sectors (including transport in general) have
access to modern energy sources, and don’t register significant difficulties in the supply
chain.
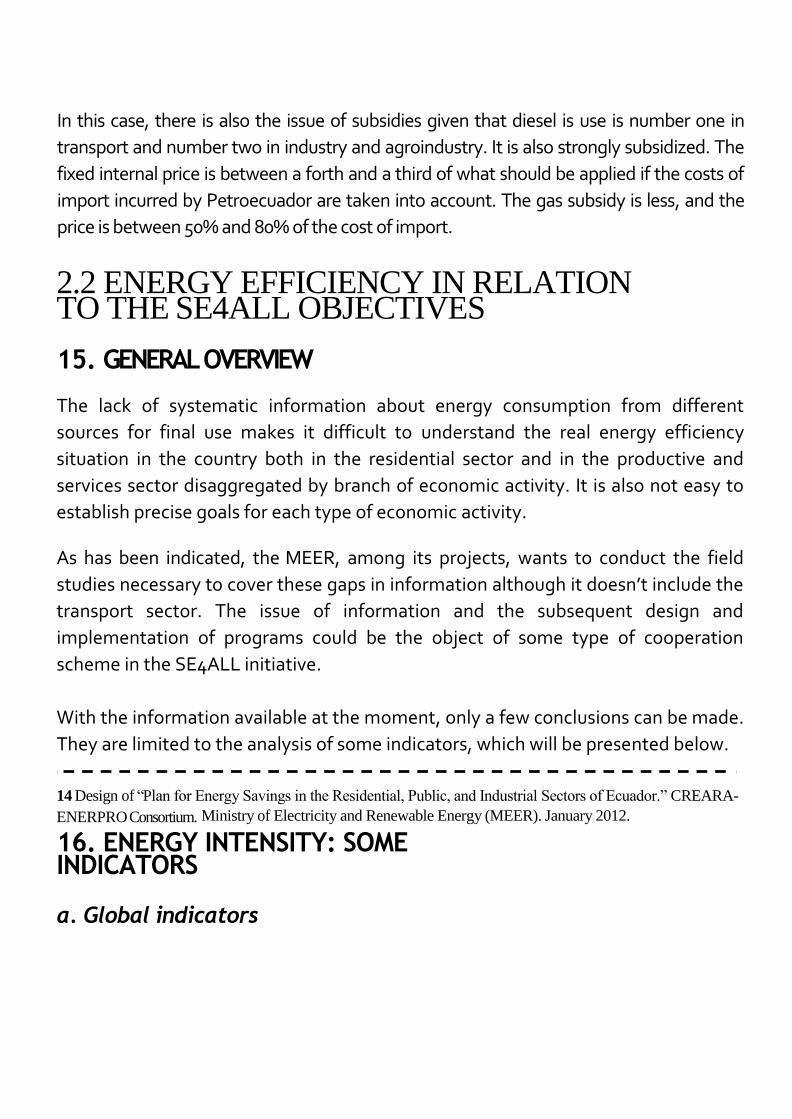
In this case, there is also the issue of subsidies given that diesel is use is number one in
transport and number two in industry and agroindustry. It is also strongly subsidized. The
fixed internal price is between a forth and a third of what should be applied if the costs of
import incurred by Petroecuador are taken into account. The gas subsidy is less, and the
price is between 50% and 80% of the cost of import.
2.2 ENERGY EFFICIENCY IN RELATION TO THE SE4ALL OBJECTIVES
15. GENERAL OVERVIEW
The lack of systematic information about energy consumption from different
sources for final use makes it difficult to understand the real energy efficiency
situation in the country both in the residential sector and in the productive and
services sector disaggregated by branch of economic activity. It is also not easy to
establish precise goals for each type of economic activity.
As has been indicated, the MEER, among its projects, wants to conduct the field
studies necessary to cover these gaps in information although it doesn’t include the
transport sector. The issue of information and the subsequent design and
implementation of programs could be the object of some type of cooperation
scheme in the SE4ALL initiative.
With the information available at the moment, only a few conclusions can be made.
They are limited to the analysis of some indicators, which will be presented below.
14 Design of “Plan for Energy Savings in the Residential, Public, and Industrial Sectors of Ecuador.” CREARA-
ENERPRO Consortium. Ministry of Electricity and Renewable Energy (MEER). January 2012.
16. ENERGY INTENSITY: SOME INDICATORS
a. Global indicators

Figures 34 to 36 present some indicators related to the global link between energy
consumption and the growth of added economic variables. The indicators, like the
sectors presented in the following chapter, compare with those of Latin American
and the Caribbean (LAC) for illustrative purposes only.
Figure 34 Energy consumption per capita vs GDP
per-capita
Figure 35 Energy intensity of the economy

Figure 36 Energy consumption vs. Gross fixed capital formation
General indicators don’t allow us to establish definitive conclusions about energy
efficiency. We can only extract signs of behavior. If energy consumption per capita
is observed in relation to the GDP per capita, Ecuador shows growth although with
greater variability than the trend in LAC.
By observing the behavior of the energy intensity of the economy in terms of
consumption levels and GDP totals, one can see a notable parallel between
behavior in Ecuador and LAC. On the other hand, the downward trend seems to
indicate an important improvement in the global efficiency of the economic
system.
However, energy consumption grows more than proportionally with the growth of
Gross Fixed Capital Formation (GFCF), and the adjustment meets a potential
function, with an inverse logarithmic curve fit to LAC. The GFCF is a measure of the
capital stock and the incorporation of technology; its increase should be done on
the basis of more efficient assets (equipment). The behavior, in the case of
Ecuador, suggests exactly the opposite, as the GFCF grows, energy consumption

increases more than proportionally.

b. Sectoral indicators
The behavior is similar to that described in the case of transport energy
consumption, which grew more than proportionally in relation to the GDP (Figure
37). However, in this case, energy intensity is clearly growing (Figure 38), which
largely confirms the indication of inefficiency. Studies show that transport is highly
inefficient and contaminant.
Figure 37 Energy consumption of transport vs total
GDP
Figure 38 Energy intensity of transport
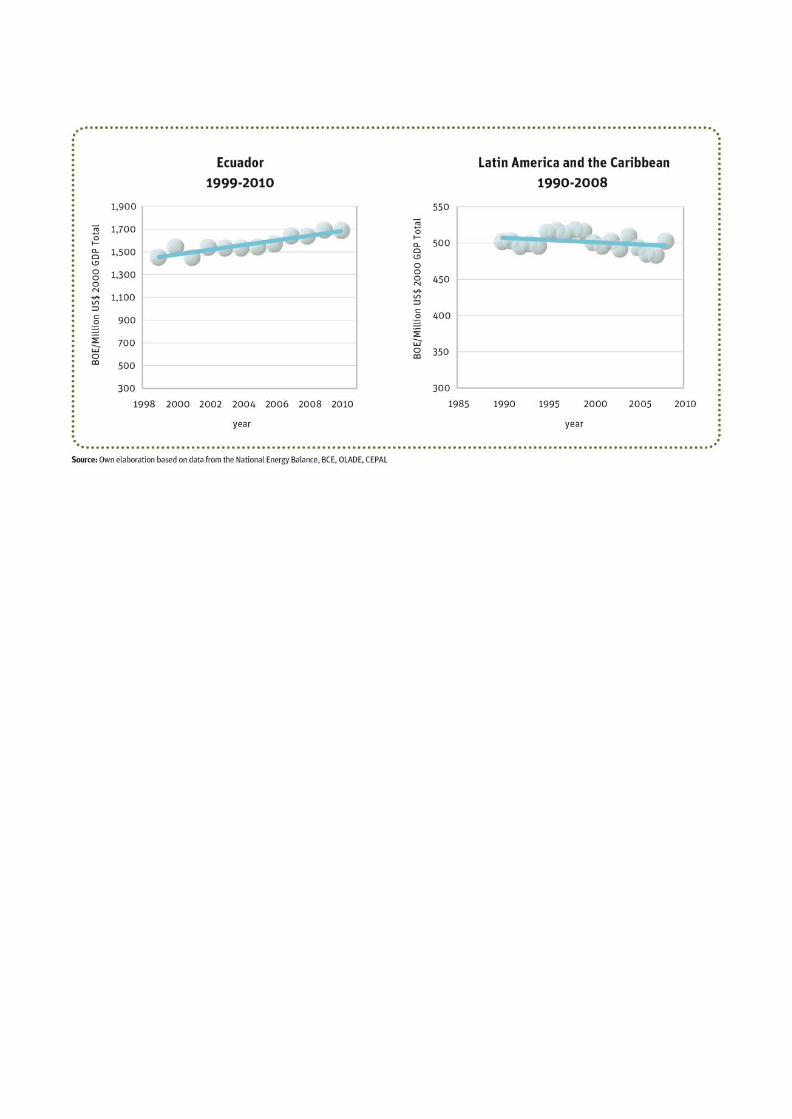

In the case of industry, energy intensity shows behavior that decreases and then increases. The total consumption of the sector is clearly growing in relation to the growth of the Gross Value Added (GVA) of the sector. There is no sign of disconnection between energy consumption and Gross Value Added (Figure 39 and 40). Energy intensity in industry in LAC is clearly growing. It doesn’t necessarily reflect great efficiencies but rather reflects changes in the economic structure. In total intensive energy activities were developed in 26 countries.
Figure 39 Energy intensity of industry
Figure 40 Industrial energy consumption vs. industrial GVA

In the residential sector, a relatively clear indication of inefficiency can be seen when analyzing the behavior of residential consumption per capita according to an economic aggregate (household spending, also per capita, Figure 41). The average behavior of LAC indicates a disconnect between these levels and energy consumption; i.e., as incomes grow, so does household expenditure per person. However, energy virtually hasn’t grown, and this indicates an improved "built in" for incorporating consumer devices that are becoming more efficient and are available on the market.
In the case of Ecuador, historical behavior is completely opposite. Residential consumption grows as household spending increases. It has only stabilized during the last five years, and this is possibly due to technological improvements in household appliances that were introduced on the market late.
Figure 41 Per capita residential consumption vs. per capita spending
by households


Based on various factors such as these general indicators, studies, and some international experiences, right now it is not possible to establish potential energy savings in the residential, industrial, and transportation sectors. Only prudent and reasonable objectives should be proposed to improve efficiency in the long term (e.g., within a range between 15% and 30%, depending on the sectors and subsectors of residential, transport and industry). These objectives should be confirmed or amended when the necessary information is generated using data from consumers. It should not be based on the global sales of electricity, oil, and gas companies. Note that the study of end uses of energy that the MEER carried out has considered implementing this measure.
2.3 RENEWABLE ENERGY IN RELATION TO THE SE4ALL OBJECTIVES
17. GENERAL OVERVIEW
With regard to renewable energy, it is convenient to consider both conventional
and unconventional energy. Similarly, with regard to the mode of use, it is
necessary to consider on-grid and off-grid electricity generation and off-Grid as
well as heat production and cogeneration for the consumption sectors.
In order to sort and clarify some concepts, Table 13 summarizes the types of
renewable energy applications, their uses, and the current state of development.
Table 13 Type of renewable energy, applications, and state of
development in the country
Type of renewable energy
Applicatio
n
Degree of development
Conventional
Hydroelectric
Electricity generation
On-grid
90% hydroelectric generation in
2016
Biofuels
Final consumption
Transport
Emerging, ethanol in
Guayaquil, biodiesel in
process
Firewood
Final consumption
Domestic cooking use of
open fires
Still used by 260.000 homes (substitution)

Unconventional
Geothermal
Electricity generation
On-grid
Resource exploration detained for 20
years, recently returned
Hydro less than 50 MW
Electricity generation
On-grid
There are some hydraulic plants
connected to the network selling
surpluses (Ex. Sibimbe) and others
in construction. There is Price
regulation and the need to develop
and promote project develoment
Wind
Electricity generation
On-grid
2.4 MW installed and 3
plants included in the plan
Off-grid Nothing
Photovoltaic panels
Electricity generation
On-grid
(distributed
generation)
Galapagos
Off-grid (domestic use
and rural productive)
Important in dispersed rural
electrification
Solar termoelectric Electricity generation “on-
grid”
On-grid Nothing
Biomass
Biogas
Electricity generation
on-grid y off-grid
Nothing
Heat for final use Nothing
Agricultural and
forest residues
Heat for final use
Some cases are known (Ex.
Contrachapados ENDESA), lack
of information for other potential
cases Cogeneration
on-grid and off-grid
There are some cases (Ex.
Ecoelectric, San Carlos, others),
lack of information for other
potential cases Firewood "unconventional"
Domestic use, cooking in
efficient kitchens
Nothing
Source: Own
elaboration.
It is necessary to focus more on renewable energy and its applications. In particular,
it should be a priority to substitute “conventional” firewood for modern energy like
LPG and later with the introduction of efficient electric stoves.
Similarly, photovoltaic panels for customers connected to the network should be
disseminated to a greater extent as unit cost falls substantially over time. Likewise,
electricity companies in the U.S. and Europe buy surplus from users, which is
equivalent to distributed generation.
The development of wind resources should also be intensified, beginning with the
development of a wind map to determine the extent of the resource and the
location of sites of interest and, thus, have a catalog of potential projects.

18. RENEWABLE ENERGY ON-GRID AND OFF-GRID
With regard to non-conventional renewable energy for electricity generation,
recently a space for private investment to generate non-conventional
renewable energy (NCRE) was opened. The purpose is to act on 6% of the
installed capacity of the national system and also in small and medium
hydropower plants up to 50 MW.
CONELEC Regulations 002, 003, and 004 of 2011 govern private generation.
Regulation 002/2011 refers to the uniqueness of private participation in the
electricity sector according to the amendment to the Electricity Sector Law,
introduced in the Organic Production Code, which sets the principles and
parameters that allow companies to apply for an exception to allow private
participation in power generation.
Regulation 003/2011 allows for the direct negotiation of contracts with one or
more distributors based on pre-established terms and rates based on a
reference price, which is calculated based on the methodology set out in this
regulation. It would be invoiced to companies that buy energy. Generators can
opt for this alternative whether or not they meet the requirements to qualify for
special treatment under the Regulation 004/2011.
Regulation 004/2011 specifically applies to private generation through the
ERNC and hydro plants of up to 50 MW. It sets energy prices to be paid to
generators and indicates billing be distributed to all distributors in the system
according to the monthly settlement that CENACE made in 15-year energy
purchase contracts with possibility of extension after paying current prices.

a. Regulation 002/2011 “Exceptionality of private participation in electricity generation”
Regulation 002/2011 establishes the principles and parameters that allow companies to apply for exceptions for private participation in power generation. This is defined in the second paragraph of Article 2 of the Law on the Electricity Sector, as established in the Organic Code of Production Reform.15 It should be noted that the Code also provides tax incentives for renewable energy equipment and energy efficiency. In its scope, Regulation 002/11 identifies two exceptional cases: 1) That it is necessary and appropriate to meet public, collective, or general interest through private investment in power generation; and 2) that public companies cannot meet the demand for electricity. It is necessary and appropriate to promote power generation through the use of ERNC to meet the public, collective interest, among others. It also provides three options for private participation: 1) Projects for coverage of demand and generation reserves included in the "Electrification Master Plan" (PME); 2) Projects proposed by the private sector not included in the PME; and 3) self-generation Projects. Regarding the first option, Regulation 002/2011 states that the PME shall include the projects to be carried out by the State, such as those that will be delegated to the private sector for construction and operation.
15 Reform Provision Four of the Code of Production, Trade, and Investment had to add an additional article 2 to the the Electric Sector Law paragraph: "The state may delegate the provision of electricity during the stages of generation, transmission, distribution, and a marketing joint venture in which it has majority shareholding. Exceptionally, it may grant delegations to private initiatives and in solidarity to provide public electricity service in any of the following circumstances: 1) when necessary and appropriate to meet public, collective, or general interest ; or 2) when the service demand can not be met by public companies."

In the second case, it establishes the possibility that a private initiative can propose the development of generation projects that are not in the PME to CONELEC, where the minimum conditions indicate what the project must cover, as well as the steps for qualification, negotiation, and execution of the "Enabling Title.”16
b. Regulation 003/2011 "Determining the methodology for calculating the time and the reference prices of generation and autogeneration projects"
Regulation 003/2011 defines the methodology for determining the terms and prices that
apply to generation and self-generation projects developed by the private sector, including
those using renewable energy.
The scope of this regulation refers to the establishment of: 1) The methodology for
determining deadlines for the apply for "Authorization certificates"; 2) The methodology for
determining the reserve price to be applied in the public selection process for awarding
generation projects, which are recorded by the PME and that the State has delegated to the
private sector; 3) The methodology for determining the benchmark applied in the
negotiation process for awarding money-generating projects, which do not appear in the
PME and that were proposed by the private sector; 4) The deadlines for application for
"Authorization certificates" that the CONELEC gives autogenerators and generation
projects that use renewable energy developed by the private sector;
16 Regulation 002/11, Article 5: Projects proposed by the private sector. Private initiative can propose the development of generation projects to CONELEC that are not in the PME. The CONELEC will analyze the projects submitted, and then go through an acceptance and rejection process. To be considered for acceptance, the following is necessary: 1) that the studies presented are pre-feasibility level; 2) that the proposed project does not appear in the "Electrification Master Plan" - PME; 3) to optimize the use of natural resources for power generation (PME projects should not be affected); 4) the cost of power generation does not exceed the average cost stipulated in contracts covered for each type of technology; 5) that the calculation for guaranteed energy is technically supported. If the project is to be accepted by the CONELEC, after verification that the detailed requirements are met, prices and terms will be determined based on the application of specific rules, and the feasibility study will determine which should then be presented by the interested party. The determined values are reserved and will be referenced and maximum values accepted for negotiation. Once the CONELEC and the proponent have come to an agreement on prices and terms to be considered in regulated contracts between the parties, the proponent will continue with the process to obtain authorizations for the use of natural resources, environmental permits, and all that is required for project implementation. The CONELEC, having reviewed and accepted the additional documentation required according to current regulations, will proceed to the "Enabling Title" correspondent, and will help the generating agent sign regulated contrac

4) The prices of surplus energy from autogenerators and power from generation
projects using renewable sources in the electricity sector.
To determine the timing of generation projects using renewable energy that do not
meet the technical specifications to enable them to qualify for the incentive
regulation of this type of project (refer to Regulation 004/2011), or they are not
eligible for adjustment even meeting the technical characteristics; it shall apply to
the provisions of Regulation 002/2011, Annex II.
Regulation 003/11 allows CONELEC to determine prices for: 1) Each public process for selecting generation projects for the private sector, as
contained in the PME; 2) Each negotiation of proposed generation projects and those for the private sector; 3) generation projects using renewable energy and making use of the incentive regulation for this type of project (004/2011); 4) The marketing of surplus energy autogeneration projects.
In general terms, the methodology for establishing prices and deadlines is based on the financial criteria of return on investment. To calculate the referential prices for generation projects for private initiatives, information from the feasibility studies will be taken into consideration by the PME. Based on this, the financial flows that will determine the price that allows the investment to be recouped will be estimated. It will recognize the profitability and apply the term determined by CONELEC for the type of technology and the range of power that corresponds to the project. The prices that result from the calculation made by CONELEC will be used as the referential price in the public selection process. To calculate the reference prices of proposed private initiative generation projects that don’t appear in the PME, information from feasibility studies carried out by the proposer will be used. A specific methodology determined in Regulation 003/2011, Annex III will be applied to the information. The value that results from the calculation made by CONELEC will be used as the reference price in the process of negotiation.

The price for generation projects that use renewable energy and qualify for the Regulation for incentives for this type of projects will be determined by the Regulation (Regulation 004/2011).
For generation projects that use renewable energy and don’t meet the technical
specifications, they can use the Regulation as an incentive for this type of project.
The methodology applied in ANNEX III of Regulation 002/11 will be applied to those
that have decided not to use the Regulation even though they meet the technical
specifications.
c. CONELEC Regulation 004-11 “Treatment for energy produced with Unconventional Renewable Energy”
CONELEC Regulation 004-11 establishes the requirements and price preferences of
energy for unconventional renewable energy projects (Table 14). It also fixes the
conditions for hydroelectric plants of less than 50 MW that are connected to the
network or in isolated systems.
Table 14 Prices of energy regulation CONELEC 004-
11
CENTRALES
Continental Territory
Insular Galapagos Territory
ERNC
WIND 9.13 10.04
PHOTOVOLTAIC 40.03 44.03
THERMOELECTRIC SOLAR 31.02 34.12
MARINE CURRENTS 44.77 49.25
BIOMASS AND BIOGAS< 5 MW 11.05 12.16
BIOMASS AND BIOGAS > 5 MW 9.60 10.56
GEOTHERMAL 13.21 14.53
HYDROELECTRIC LESS THAN 50 MW
HYDROELECTRIC PLANTS UP TO 10 MW 7.17
HYDROELECTRIC PLANT GREATER THAN10 MW UP TO 30 MW 6.88
HYDROELECTRIC PLANT GREATER THAN 30 MW UP TO 50 MW 6.21

Source: Regulation CONELEC 004/2011.
The prices for ERNC indicated in the previous table are fixed during the contractual
period and are not adjusted for inflation. These were established by the CONELEC
based on international parameters. In the future, methodologies will be applied
based on rates of return on investment calculated by future cash flow. This is similar
to what is already used by other private generation sources (as is established in
Regulation 003/11).
The prices for hydroelectric less than 50 MW are determined with a mathematical
model based on the flow of funds and the return on investment for plants with
different levels of investment and operative characteristics (plant factor, for
example).
Article 6.3 of Regulation 004/11 establishes: “El CENACE will dispatch, in an
obligatory and preferential manner, all electricity that plants using unconventional
renewable resources deliver to the system, up to the limit of 6% of the installed
and operational capacity of the National Interconnected System generators
according to what is established in the regulation that supplements regulation 15.
To calculate the limit, all unconventional renewable plants benefitting from this
regulation will be considered with the exception of hydroelectric plants of less
than 50 MW, biomass, and geothermal, which will not have this limit.
The limit of 6% of the installed generation capacity with ERNC is naturally dynamic.
The maximum MW contracted will vary as the installed capacity grows. The
percentage was established based on the impact on public finances, and it sought
to maintain an increase in the contribution of the State within the acceptable limits,
as was established in Constituent Mandate 15. Such a contribution would occur
under the higher costs of ERNC generation.
The applicability of preferential prices indicated in the previous table is for a period
of 15 years starting with the signing of the “Enabling Title,” if it is signed before
December 31, 2012. After the period of applicability ends, prices for the ERNC will
be established by regulations existing at that time. For hydroelectric plants of less
than 50 MW, an average of the price of regulated contracts for generation units in
operation will be paid, which should correspond to the current technology at that
date.

Article 9 of 2013 states that, “Those projects whose contracts are signed or who
have increased capacity should be modified starting in 2013. CONELEC will carry
out a revision of energy prices and of their period of validity; prices will be
applicable only for previously marked cases during this year and for a period that
will be defined by CONELEC during this time.” The methodology to establish said
prices will be created by CONELEC.
This regulation is important not only for promoting the ENRC but also for
establishing the possibility for independent private generators to develop
hydroelectric projects of up to 50 MW. This has been possible for a few years, and
independent projects have been constructed that are now in operation. However,
later that possibility was eliminated and projects were only authorized for
autogeneration with the sale of surplus to the network.
In addition, article 13 of Regulation 004/11 established: “the obligation of public
companies subject to the Organic Law of Public Companies to accept CONELEC
Regulation No – 004/11, and they should implement programs for the “State of
Good Territorial Living” in areas where generation projects are developed. Such
programs should be in line with the policies and regulations set out by the central
government. Such companies “will create an ‘Account for the State of Good
Territorial Living’ that will allow them to cover the costs of social responsibility in
favor of autonomous decentralized governments that are found within their areas
of influence.” The companies should make contributions according to the type of
project: “they should set aside resources for the ‘State of Good Territorial Living”
via the creation of an account clearly identified within the system of accounts of the
company. To this end, the account will receive funds from a fraction of the income
of energy sales…”

d. Mechanisms for paying for ERNC projects
According to current regulations, CENACE is in charge of establishing the amounts
of energy to be charged annually for private generators subject to clearance
(greater than 1 MW) in the framework of Regulation 004/11 and based on
established preferential prices.
The entire electricity system assumes the costs of private generation with ERNC.
Accordingly, these costs are apportioned by CENACE among all distributors. Thus,
each private generator indicates the amount to be billed monthly to each.
In the case of generators of less than 1 MW not subject to dispatch and generators
that aren’t found within the framework of Regulation 003/11, the involved
distributors should be billed directly.
The payment mechanism for companies is through trusts administered by banks.
All existing distributors’ trusts have generally been managed by specialized entities
of the Bank, for example, the Guayaquil Bank, and Pichincha Bank, which are
private banks, and the Bank of the Pacific, currently controlled by the state.
All proceeds from each of the electricity distribution companies automatically enter
into the respective trusts. Private generation via the ERNC is a high priority in the
payment of trusts, being second only to international interconnections. Thus,
private generation has a separate payment mechanism and, at the same time, a
payment priority that ensures the collection of turnover, even in an eventual
financial crisis that may occur for any reason and in function of the risk-based
sustainability of the State's contribution.
e. Response to private initiative
Regulation CONELEC 004/11 was issued in April 2011. By November 29, 2012 the quota for the ERNC has been entirely assigned as can be seen in Table 15, which presents information from CONELEC and indicates a very positive response from the private sector.
Table 15 Private participation in electricity generation projects with the ERNC
Description
Indicator

Total installed operative capacity in the National Interconnected System (S.N.I) 4,742.0 MW
Total capacity for the ERNC*: 6% of the total installed capacity in the (S.N.I) 284.5 MW
Total capacity available for the ERNC* except biomass projects (sugar mills) 284.52 MW
Power with ERNC* that accepts a preferential rate, with signed authorization certificate 200 MW
“Authorization Certificates” for authorized registration by the CONELEC Board 84.52 MW
Ratings certificates given to 11 companies 215 MW
Capacity available with ERNC* 0 MW
Number of applications submitted 116
*ERNC: Unconventional renewable energy (not including
hydroelectric). Source: CONELEC.
19. USE OF RENEWABLE ENERGY SOURCES FOR THERMAL APPLICATIONS (COOKING/HEAT)
Given the economic weight of the LPG subsidy and the availability of low cost surplus electricity, the substitution of gas stoves for electric ones is under analysis. Quito Electricity Company has already studied the issue in its concession area;17 while MEER is proposing a replacement on a national level as will be described. However, the responsible entities are not considering the issue of substitution of firewood and the introduction of firewood efficient kitchens.
In any case, it could be argued that, for this segment of the population detected in
the 2010 census, a program should be designed to introduce efficient firewood
stoves and to introduce the partial substitution of firewood with LPG stoves,
depending on the access to households. 17 Determination of final energy use in the residential sector. ENERINTER International Energy Consulting, conducted for the
Quito Electricity Company. March 2012.

Within the FERUM program for rural and marginal urban electrification, it could be argued that not only is it an approach to increasing electricity coverage, but also for increasing cooking, as it would be working on reaching the segment that lacks electrification. On the other hand, there could also be firewood consumption for cooking in households that already have electricity, and that would not be detected by the previous approach. In any case, it is necessary to cross-reference the information from different databases to define a program for efficient wood or charcoal stoves or the potential replacement of firewood with LPG.
20. USE OF RENEWABLE ENERGY FOR PRODUCTIVE ACTIVITIES
In the productive sectors, the increase of electricity consumption for thermal uses
that substitute fossil fuels in potential applications indirectly leads to a greater use of
conventional renewable energy given that the majority of electricity generated in
hydroelectric.
In this case, photovoltaic panels used by industrial clients connected to the network
could be promoted. Similarly, there are small hydroelectric or wind plants for
autoconsumption that could be taken advantage of by the productive sectors.
This issue is directly tied to energy efficiency because there are projects that
research consumption profiles for different productive activities. Later, priority
sectors and economic activities will be established for the design of specific
projects.
The proposal in the case of the productive sectors is that the objectives of energy
efficiency and renewable energy are managed together.
In the case of productive uses of energy related to the domestic rural and marginal
urban sector, these form part of programs to increase electricity service coverage.

21.
SUMMARY
With respect to energy access, the size of the problem is known and CONELEC has
established goals so that by the end of 2013, it will achieve 96% coverage, and by
2021, 100% will be achieved, as will be seen in Section 3.
However, at the moment, only an increase in energy access via the extension of
networks is being undertaken. There is still no plan to reach potential isolated
consumers.
In the case of energy efficiency and the use of renewable energy in the productive
sectors, the first step is to know the consumption profile of different branches of
economic activity. To do this fieldwork on a national level, requires working in
contact with the productive sectors to identify priority areas, establish goals, and
quantify investments. The MEER scheduled the beginning of this work in 2013 and
hopes to finish in 2014.
In relation to renewable energy for electricity generation, a space has already been
opened for the ERNC. It is worth noting that it would be desirable to extend to
more than 6% of installed capacity if the costs of the supply system permit.
2.4 SE4ALL
GOALS
22. GOALS
Prior to the discussion with national entities, more precise goals should be
established related to access to service and energy (including thermal for cooking
food). However, this recommendation doesn’t apply to the energy efficiency
objective. Given the reasons stated throughout the study, more detailed
information will be needed. MEER is about to study final use in the residential,
industrial, commercial, and service sectors. These studies would provide the
necessary information.
Related to the universal energy access objective, CONELEC has established goals
to meet 100% electricity service coverage by 2021. Currently it is carrying out a

program for the electrification of homes via the extension of networks. It should be
noted that there is still no plan for reaching potential isolated consumers nor is
there a precise estimation of the number of homes that are in said condition. This
continues to be a gap that could be covered with the support of the SE4ALL
initiative. Also, it should be taken into account that the IDB is already considering
the issue.

SECTION 3:
CHALLENGES AND
OPPORTUNITIES TO REACH
THE SER4ALL OBJECTIVES

3.1 POLITICS AND INSTITUTIONAL
FRAMEWORK
The energy sector in Ecuador is not unified in one entity. There are two
executant ministries (MEER and MRNNR), as well as the Coordinating Ministry
(MICSE). The institutional issue of integrated management of policy and
strategy for energy development is still not resolved.
23. ENERGY DEVELOPMENT
The National Secretary of Development Planning (which has a ministerial rank) is
the entity that deals with national development plans. The last current one is the
“National Plan for Good Living 2007-2012” and the 2013-2019 plan is, as yet,
unknown.
SENPLADES establishes lines of economic and social development and defines, in
coordination with relevant ministries, the general guidelines for sectoral
strategies, including those of energy and social inclusion.
The Ministry of Social Inclusion works on issues related to reducing poverty and
incorporating the population into productive activities.
24. THERMAL ENERGY FOR THE RESIDENTIAL SECTOR
As has already been indicated, there are no programs, objectives, or goals. The
responsible entities in terms of formulating and executing specific plans are
MEER and CONELEC, given that the latter is legally assigned to do
electricity planning. As will be described, CONELEC works together with MEER
and is in charge of selecting projects in the FERUM program.
25. ELECTRICITY SECTOR
MEER is the governing body that is in charge of developing the electricity
sector. The regulatory entity is CONELEC, and together the two carry out
planning in a sector whose basic strategies are to maximize generation with
renewable energy, expansion, reinforce the National Transmission System,
organize the distribution system, and universalize electricity service
coverage.
The electricity sector is almost entirely in the hands of the state in terms of
generation, transmission, and distribution. There is a state company for
generation and transmission (CELEC) and 20 distributors, 10 of them grouped in
CENEL.
26. MODERN ENERGY FOR THE PRODUCTIVE SECTORS
This should be managed in an integral way that respects energy efficiency, so the
MEER should also manage the issue. In addition, the Ministry of Coordination of
Production, Employment, and Competitiveness (MCPEC), which works with the
productive sectors, also works with issues related to biofuels and energy
efficiency. The ministry wants to improve the competitiveness of production and
develop new productive activities with an inclusive social focus.
27. NATIONAL FRAMEWORK FOR MONITORING THE SE4ALL PROGRAM
The focal point for establishing and monitoring the SE4ALL program on a national
level should be the Ministry for Electricity and Renewable Energy (MEER) given that
it is the entity responsible for the development of renewable energy and energy
efficiency in the country. It does this via the Undersecretary of Renewable Energy
and Energy Efficiency (SEREE). In addition, the approval of rural and marginal
urban energy projects presented by distribution companies are prioritized by
CONELEC and pass through MEER before getting final approval from SENPLADES.
MEER could coordinate actions with CONELEC as well as with other energy sector
entities and organizations related to production in the state and private sectors. At the
same time, it is necessary to incorporate the latter into the process given that consumers

need to act and make investments to improve energy efficiency and use renewable
energy for final use.
3.2 PROGRAMS AND FINANCING
28. THERMAL ENERGY: PROGRAMS AND FINANCING TO IMPROVE ENERGY ACCESS, ENERGY EFFICIENCY, AND THE USE OF RENEWABLE ENERGY FOR COOKING AND OTHER RESIDENTIAL USES
There are no programs of this type. In consequence, it is convenient to propose that
this objective be met also, at least partially, within the framework of the Fund for
Rural and Marginal Urban Electrification (FERUM) and via distribution companies.
The following chapter will describe the fund in more detail.
The distribution of homes without electricity and homes that use firewood/coal as
the main energy source for cooking is uneven. If data is compared for provinces
from the 2010 Census, it is possible to observe that in some provinces, under the
hypothesis that there is one household per home, the cases of homes cooking with
firewood that lack electricity service are greater. In other homes the opposite
occurs - the total cases of firewood use in homes are greater that those without
access to electricity. Thus there are households that have electricity and also use
firewood. However, there are also others that use it and don’t have electricity
(Table 16 and Figure 42).
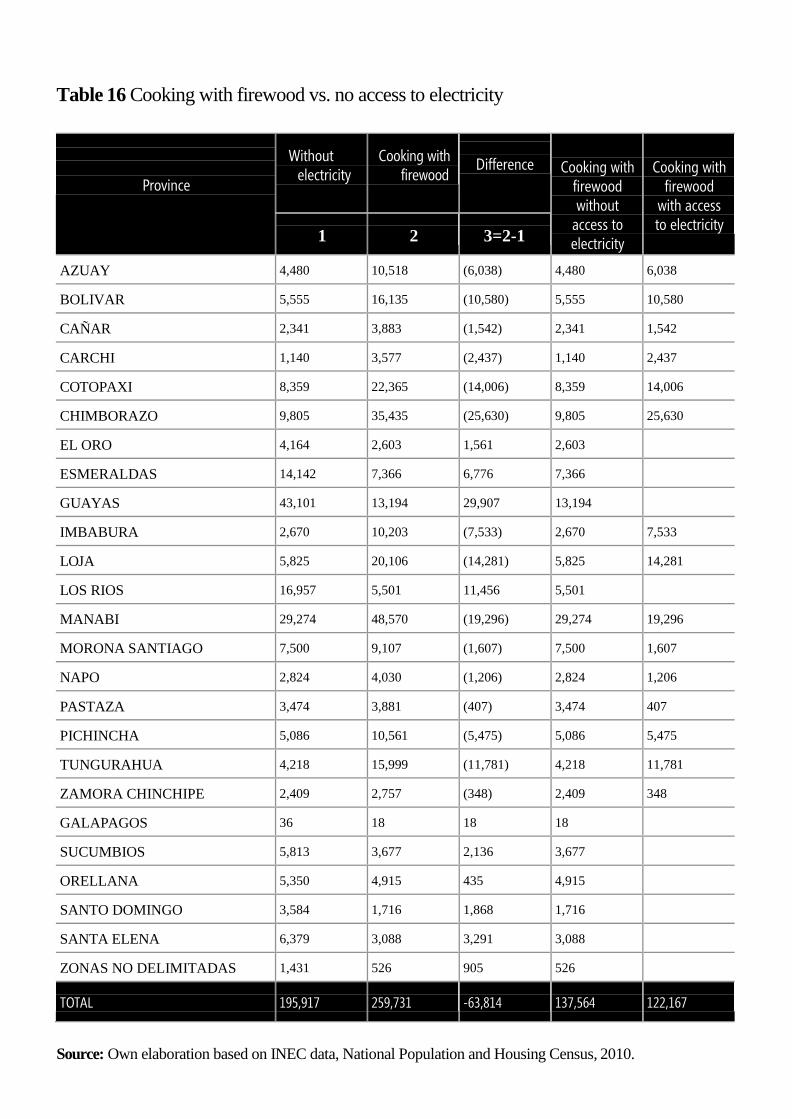
Table 16 Cooking with firewood vs. no access to electricity
Province
Without electricity
Cooking with firewood
Difference
Cooking with firewood without
access to electricity
Cooking with firewood
with access to electricity
1
2
3=2-1
AZUAY
4,480
10,518
(6,038)
4,480
6,038
BOLIVAR
5,555
16,135
(10,580)
5,555
10,580
CAÑAR
2,341
3,883
(1,542)
2,341
1,542
CARCHI
1,140
3,577
(2,437)
1,140
2,437
COTOPAXI
8,359
22,365
(14,006)
8,359
14,006
CHIMBORAZO
9,805
35,435
(25,630)
9,805
25,630
EL ORO
4,164
2,603
1,561
2,603
ESMERALDAS
14,142
7,366
6,776
7,366
GUAYAS
43,101
13,194
29,907
13,194
IMBABURA
2,670
10,203
(7,533)
2,670
7,533
LOJA
5,825
20,106
(14,281)
5,825
14,281
LOS RIOS
16,957
5,501
11,456
5,501
MANABI
29,274
48,570
(19,296)
29,274
19,296
MORONA SANTIAGO
7,500
9,107
(1,607)
7,500
1,607
NAPO
2,824
4,030
(1,206)
2,824
1,206
PASTAZA
3,474
3,881
(407)
3,474
407
PICHINCHA
5,086
10,561
(5,475)
5,086
5,475
TUNGURAHUA
4,218
15,999
(11,781)
4,218
11,781
ZAMORA CHINCHIPE
2,409
2,757
(348)
2,409
348
GALAPAGOS
36
18
18
18
SUCUMBIOS
5,813
3,677
2,136
3,677
ORELLANA
5,350
4,915
435
4,915
SANTO DOMINGO
3,584
1,716
1,868
1,716
SANTA ELENA
6,379
3,088
3,291
3,088
ZONAS NO DELIMITADAS
1,431
526
905
526
TOTAL
195,917
259,731
-63,814
137,564
122,167
Source: Own elaboration based on INEC data, National Population and Housing Census, 2010.
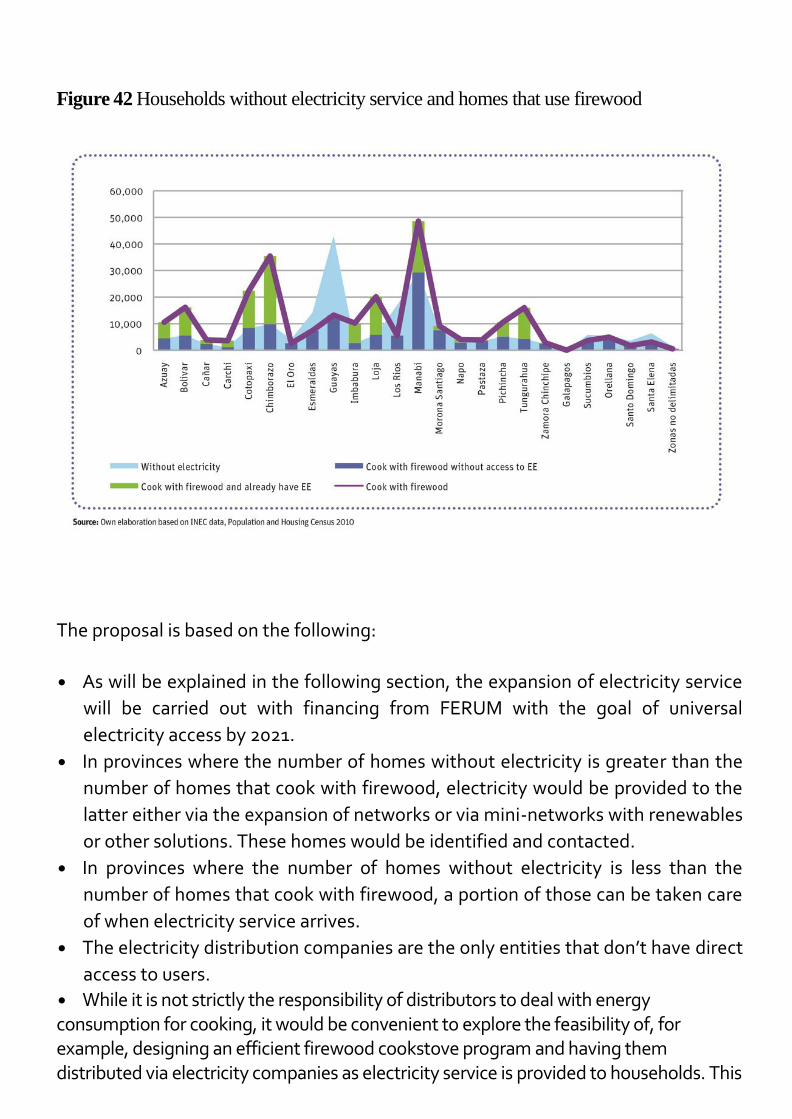
Figure 42 Households without electricity service and homes that use firewood
The proposal is based on the following:
• As will be explained in the following section, the expansion of electricity service
will be carried out with financing from FERUM with the goal of universal
electricity access by 2021.
• In provinces where the number of homes without electricity is greater than the
number of homes that cook with firewood, electricity would be provided to the
latter either via the expansion of networks or via mini-networks with renewables
or other solutions. These homes would be identified and contacted.
• In provinces where the number of homes without electricity is less than the
number of homes that cook with firewood, a portion of those can be taken care
of when electricity service arrives.
• The electricity distribution companies are the only entities that don’t have direct
access to users.
• While it is not strictly the responsibility of distributors to deal with energy consumption for cooking, it would be convenient to explore the feasibility of, for example, designing an efficient firewood cookstove program and having them distributed via electricity companies as electricity service is provided to households. This

would promote the improved use of firewood in the 53% of homes that use it and it is also the percentage that still lacks electricity service. Another possibility is to structure an operational scheme via the MEER. • For the remaining 47% of homes that cook with firewood that already have
electricity service and who would thus be served by FERUM, the possibility should be analyzed of arriving with efficient firewood cookstoves. Later it would be possible to introduce LPG cookstoves. It is necessary to consult the strategy with Petrocomercial and with the electricity companies given that they have already registered these homes in their databases.
29. ELECTRICITY SECTOR: PROGRAMS AND FINANCING TO IMPROVE ACCESS, ENERGY EFFICIENCY, AND THE USE OF RENEWABLE ENERGY FOR ELECTRICITY SUPPLY
In Ecuador there is a Fund for Rural and Marginal Urban Electrification (FERUM). This serves rural and marginal urban sectors via a social program with a technical foundation that gives high priority to the incorporation of new basic services. Its objective is to improve the quality of life in those sectors of the population.18
A strategy has been established for the incorporation of beneficiaries and other related actors who participate in activities. Among those are: representatives of autonomous decentralized governments, local organizations, communities, peasant, and women’s and indigenous movements. They also include entities such as the MEER, the National Parochial Council (CONAJUPARE), the Association for Municipalities of Ecuador (AME), the Consortium for Amazonian and Galapagos Municipalities (COMAGA), the Consortium for Provincial Councils of Ecuador (CONCOPE), the Council for the Development of Nationalities and Peoples of Ecuador (CONENPE), the Institute for Regional Amazonian Eco-development (ECORAE), and the College of Electrical Engineers and Electricians of Ecuador (CIEE), among others.
18 CONELEC. Master Electrification Plan 2012-2021.

Furthermore, the results of the program, like the norms that govern their presentation, rating, approval, and the execution of projects and good use of energy will be broadcast.
CONELEC promotes the development of comprehensive projects for improved
communications, education, health, and others, mainly on the border, and in the
Amazon, and costal regions. These sites almost always use alternative energy
sources. Between 1998 and 2007 US$ 316 million in projects have been executed,
while between 2008-2012 the figure was 356 million. In 2012 the allocation was US$
120 million annually (Figure 43).
Figure 43 Allocation of FERUM
funds
By 2013 the country is expected to reach 96% electricity coverage for homes
located in rural areas and 98% for homes in marginal urban areas. During 2014
approximately 32,549 homes will still need electrification in rural areas and 59,948
in the marginal urban sector.
From 2014-2021, it is estimated that US$ 191 million is needed to serve all the homes in the rural and marginal urban sectors.19
It is important to emphasize what was already mentioned, that the current planned
increased in physical access to energy is through grid extensions. However, there is
still no plan to reach isolated communities or consumers. Nor is there even an
estimate of the number of homes that are in those conditions.
Originally FERUM was created with funding from consumer support, which was
10% of commercial and industrial tariffs. Subsequently, Constituent Mandate 15
removed it and converted it into FERUM, a specific mechanism to fund rural and
marginal urban electrification projects with contributions from the National
Treasury. Thus, the fund enters into the prioritization of projects in the selection
process at the national level. That is why the pre-selection made by CONELEC must
be approved by the MEER and finally by SENPLADES.
FERUM currently has an IDB loan to co-finance electrification projects.
30. MODERN ENERGY FOR PRODUCTIVE USE: PROGRAMS AND FINANCING TO IMPROVE ACCESS, ENERGY EFFICIENCY, AND THE USE OF RENEWABLE ENERGY SOURCES IN PRODUCTIVE SECTORS
a. Energy Efficiency Programs
In the Ministry of Electricity and Renewable Energy (MEER) there are some
programs aimed at improving efficiency in the areas of short-term consumption.
Figure 44 summarizes the programs planned for the next five years.
19 CONELEC, Master Plan, Op.Cit.

Figure 44 Programs and energy efficiency projects for 2012-2017
Moreover, the MEER executed a project in a non-refundable cooperation from the
IDB, the "Plan of Action for Sustainable Energy for Ecuador" (SEAP ATN/MC-11398-
EC Convention). The PAES, which recently completed financing (although there are
a few activities to be completed), had four components, one operational and three
substantive:
Component I. Energy Efficiency Program: this component included two
activities 1) a baseline study to formulate a plan for saving energy; and 2) A
methodology and software platform to develop an array of end uses of energy
in the residential, industrial, commercial, and services sectors. This last item is
particularly important, as it will be applied in the study of end uses of energy
the MEER undertook nationwide.

Component II. Wind measurement campaign: a wind map based on satellite data was developed and measurement towers were installed in two provinces (Imbabura and Loja). Also in parallel a wind atlas and a measurement campaign were developed starting in December 2011. Based on information from the wind map, the MEER estimated a potential Available Gross Total of around 1,670 MW and a Feasible Short-Term potential of about 900 MW, with capacity factors in the range of 20% to 35%, installable from wind farms in areas with the best wind resources. All that remains to be completed is a study on the integration of wind energy projects to the electricity networks.
Component III. Institutional strengthening: a study is being finalized to identify
regulatory, legal, taxation, institutional, technological, economic, and financial
barriers and to design tools for the development of renewable energy, energy
efficiency, and bioenergy in Ecuador. In addition, specific training events in CDM,
carbon markets, project management, and renewable energy were carried out.
As noted, applying the methodology designed in Component I of the SEAP, MEER
has budgeted its own resources for a study of end uses of energy in the residential,
industrial, commercial, service, and public sectors, whose implementation started
in 2013 and will conclude in 2014. This study is crucial to understanding energy use,
equipment, and efficiencies in the various sectors and subsectors, and to
developing indicators and establishing specific programs with verifiable energy
efficiency goals. In fact, the study itself is part of the first national goal within the
SE4ALL objectives related to energy efficiency.
b. National Plan for Efficient Cooking
The MEER formulated a "Replacement Plan for Gas Cookstoves with Efficient
Electric Induction Cookstoves," which is in the process of being approved. This plan
will, within the framework of a strong national energy replacement policy (not all,
since it would be impractical) of LPG for electricity, have a major impact on public
finances due to the reduced LPG subsidy and a drastic change in the consumption
mix in the residential sector and GHG in the sector.
The plan seeks to substitute LPG for electricity use in cooking in the residential
sector through the replacement of LPG stoves with electric induction cookstoves
and mixed LPG.20

The cornerstones of the plan are:
• Adapt the electrical system to meet the demand generated by the cookstoves.
• Define new prices for electricity and LPG.
• Create an offer on induction cookstoves for the domestic market at accessible and
competitive prices.
• Create the conditions for Ecuadorian families adopt this technology.
With the commissioning of new hydropower plants under construction, as well as a
back up thermal park, the demand generated by induction cookstoves can be met
(taking into consideration an additional peak demand of 480 MW in 2016 with a
penetration of 1,000,000 cookstoves, and a demand of 1,400 MW for a penetration
of up to 3,000,000 kitchens). This would translate into an increase of between 12
and 15% that the electricity system must meet.
However, it is necessary to provide reinforcement for the low voltage distribution
network and the connections to consumers. This requires that necessary
investments be made in distribution company plans.
From an economic and financial viewpoint, to make the plan viable it is important
to make the required adjustments in price structure related to LPG/electricity and
in the availability and relative prices for cooking appliances.
20 MEER. National Plan for Efficient Cooking, Executive Summary, 2013.

The plan estimates that for the user to continue to pay the same monthly price for concept cooking, the electricity tariff should be 3 cents USD/kWh for the first 100 KWh. Also, the price of residential LPG would have to change as an additional tool for getting households to use electricity and also to reduce what the country spends on the LPG subsidy, which a is 80% imported. The changes should be identified, evaluated, and established in conjunction with the introduction of electric cookstoves.
The implementation strategy for the domestic manufacture of cookstoves nationwide and their installation in homes should be a gradual transition. Also, incentives should be considered to move users from LPG to electricity.
Contacts with appliance manufacturers allow us to estimate that the cost of an electric induction stove could be between US$150 and US$300, depending on the induction zones and market size. These values are very competitive with the prices of LPG stoves with similar features.
Based on the pilot by the MEER in the Carchi province, the key areas for the success of a cookstove plan in relation to consumers are: training, dissemination, advertising, technology, logistics, suppliers available, strategic partnerships with utilities and other stakeholders in the sector, and monitoring, control, and project maintenance.
3.3 PRIVATE PARTICIPATION AND REGULATORY FRAMEWORK TO PROMOTE INVESTMENT
In Ecuador strategic sectors are in state hands, although there is room for private
investment in power generation and NCRE hydroelectric plants under 50 MW (as
seen above). There are also gaps in relation to oil exploitation through contracts
with Petroecuador. Similarly, note that most of the LPG distributors are private.

31. THERMAL ENERGY FOR THE RESIDENTIAL SECTOR:
In this case, if firewood for cooking LPG is replaced, the distributors should
intervene. However, because gas distribution is widespread and the
market to replace wood is scattered and small, it is very likely that
Petroecuador (which also has one of the 11 existing distributors) will take
this supply.
The introduction of efficient firewood cookstoves would be carried out by
the State and coordinated by the MEER. However, the design,
manufacture, and supply of cookstoves may be a private activity.
32. ELECTRICITY SECTOR
The state makes investments in the electricity sector. The last paragraph
of Article 1 of Constitutional Mandate 15 states: "[...] The resources
required to cover investments in generation, transmission, and
distribution will be covered by the State as part of its General Fund and
shall be transferred monthly to the Solidarity Fund, and will be
considered capital contributions of that institution."
However, it has already been mentioned that there are niches for
generating on-grid, off-grid, and below 50 MW hydroelectric plants,
which are set out in Regulations 002, 003 and 004/11. There are no
barriers, but there is a limit of 6% of the installed capacity of the system
to NCRE; for hydroelectric plants the limit reaches 50 MW. The State can
make concessions to other generation projects that are within the
"Master Electrification Plan.”
Private investment in transmission and distribution is not permitted.

Obviously, providers of goods and services are private, either for
generation or rural electrification.
Major funding comes from the National Treasury leveraged by
international development banks (IDB, CAF), international banks (China
and others) and national development banks. As already mentioned, the
FERUM currently has an IDB loan to co-finance electrification projects.
In the case of management of demand and energy efficiency, we can say
that there are no obstacles to the provision of services or equipment to
consumers. Naturally, the actors in this area are private.
33. MODERN ENERGY FOR PRODUCTIVESECTORS
Companies on the demand side are private, like most of the banks, with
some exceptions. The areas in which they operate are: agriculture,
agribusiness, manufacturing, construction, and all other areas of production,
as well as services (trade, import, export, tourism, etc.).
The idea is that the production of equipment for energy efficiency and
renewable energy, as well as its provision, will be private. It is worth
mentioning that this is one of the sectors included in the agenda prepared by
the productive MCPEC.
3.4 GAPS AND
OBSTACLES
34. THERMAL ENERGY FOR THERESIDENTIAL SECTOR

In this case, there are other obstacles, because the institutional issue is
complex. Although it seems that the issue of using wood for thermal energy
in the residential sector itself is handled within the scope of FERUM, this
item could operate properly with all regional and local institutions. At the
same time, it could overcome some cultural barriers such as those already
experienced in several countries with efficient wood stoves.
35. ELECTRICITY SECTOR
In this case, in principle there seems to be an additional obstacle to those
indicated above. An important aspect to consider is the slowness with
which changes are being made in the field of electricity distribution.
As noted in previous chapters, most distribution company indicators are
still far from the required levels of efficiency.
36. MODERN ENERGY FOR PRODUCTIVE SECTORS
In this case, a specific additional obstacle is the lack of information and consumer awareness, which could be in the process of being resolved.
There is an important aspect to consider: there should be more communication and exchange between the public sector and the leading companies or trade associations representing the production sectors regarding issues of energy efficiency and use of renewable energy. It is essential to involve more productive sectors from the design stage of programs and projects. After all, it is the consumers who have to implement these programs in their production units.
37. SUMMARY: IMPORTANT GAPS, BARRIERS, AND ADDITIONAL REQUIREMENTS
In this case, a specific additional obstacle is the lack of information. Based on
knowledge of the progress that the country has made in relation to the SE4All
objectives, areas requiring further attention that may demand additional
support or technical cooperation funding are: thermal energy for cooking,
efficiency and use of renewable energy in the productive sectors, and access to
electricity for isolated locations or dwellings.
Additionally, we envision potential for financing private generation projects
with unconventional and renewable energy and hydroelectric plants below 50
MW hydroelectric via open niches in the regulations.
Subsidies for electricity and fuel are a major barrier to the promotion and
implementation of energy efficiency programs and renewable energy use
in the productive, service, and residential consumption sectors.
Furthermore, although the subsidies and the total absorption of
investments by the state may constitute a risk to the financial
sustainability of long-term programs (due to the pressure it exerts on the
national economy), this risk is controlled depending on the allocation of
resources to rural and marginal urban electrification programs.
Furthermore, it features contributions from international institutions and
guarantees with respect to the payment of contracts for sale of power to
private renewable energy projects.
Lastly, it is noted that there may be other institutional barriers. This is due
to difficulties in coordinating efforts between various government and
private institutions to reach all end users of energy.

www.se4all.org
���������� ��������������������