Ramirent Nordea seminarinvestors.ramirent.com/sites/default/files/misc/ramirent_20100909... ·...
48
Ramirent – Nordea seminar Jonas Söderkvist, CFO 9 September 2010 18.12.2012 / event / name of presentor© 2010 Ramirent
Transcript of Ramirent Nordea seminarinvestors.ramirent.com/sites/default/files/misc/ramirent_20100909... ·...

Ramirent
– Nordea seminar
Jonas Söderkvist, CFO 9 September 2010
18.12.2012 / event / name of presentor© 2010 Ramirent

RAMIRENT IN BRIEF
Leading equipment rental
company in Northern, Central
and Eastern Europe
Net Sales EUR 503 million (2009)
3,071 employees
353 rental outlets
13 countries
100,000 customers
200,000 rental units
NASDAQ OMX Helsinki 1998
Founded 1955
Headquartered in Finland
2
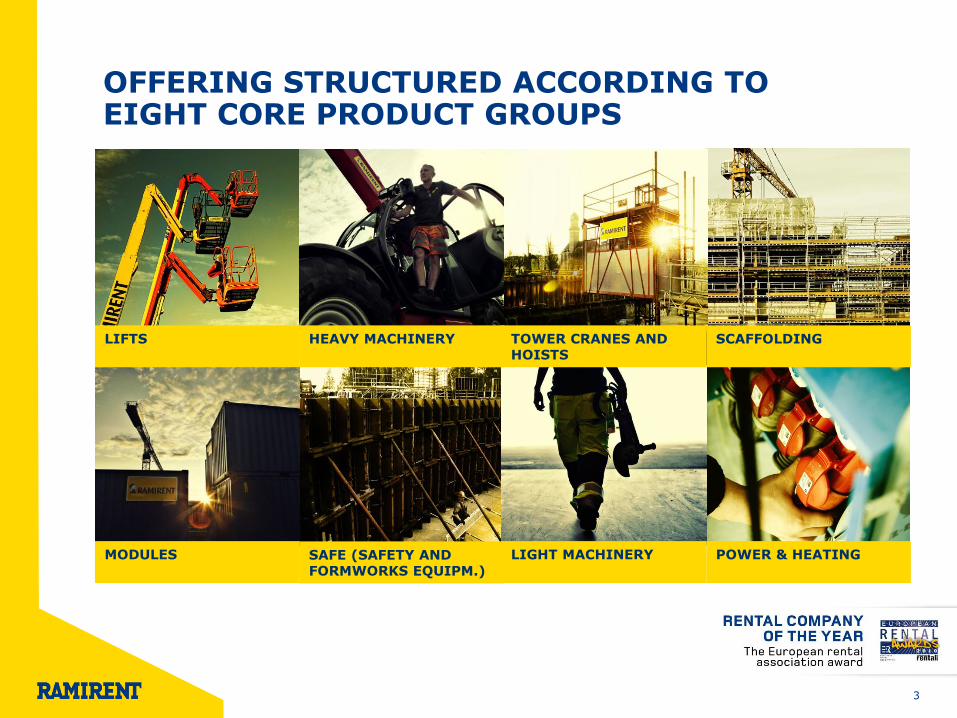
OFFERING STRUCTURED ACCORDING TO EIGHT CORE PRODUCT GROUPS
3
MODULES
HEAVY MACHINERY
LIGHT MACHINERY
LIFTS
TOWER CRANES AND HOISTS
SCAFFOLDING
POWER & HEATING
SAFE (SAFETY AND FORMWORKS EQUIPM.)

NORDIC COUNTRIES ARE OUR LARGEST MARKETS AND CONSTRUCTION IS OUR LARGEST CUSTOMER SECTOR
4
Finland
26%
Sweden
26% Norway
23%
Denmark
7%
Europe
Central
11%
Europe
East
7%
Sales per segment 1-6/2010
Construction
75%
Industry
16%
Public sector
4%
Households
5%
Sales per customer sector (2009)

LEADING MARKET POSITIONS
Poland2
39 depots Market #1
Ukraine 3 depots
Market #~5
Hungary2
17 depots Market #1
Czech 6 depots
Market #~4
Russia1
5 depots 14 dealers Market #1
Finland 83 depots Market #1
Sweden 69 depots Market #2
Norway 38 depots Market #1
Denmark 20 depots Market #1
Slovakia 36 depots Market #1
Baltic 37 depots Market #2
(1) Russia including Moscow and St. Petersburg
Segments Employees
Outlets
Market Position
Finland 641 83 #1
Sweden 540 69 #2
Norway 519 38 #1
Denmark 148 20 #1
Europe East 394 45 #1
Europe Central 812 98 #1
Group 3,071 353
(2) excl. Formworks rentals
5

JANUARY-JUNE 2010
INTERIM REPORT

APRIL – JUNE 2010: SIGNS OF RECOVERING DEMAND IN MOST PRODUCT GROUPS
Demand in most product groups improved due to
positive market development within residential
construction and in various industrial sectors.
However, activity in non-residential construction
continued at a fairly sluggish pace
Geographically, demand in the Nordic countries,
Russia and Ukraine picked up during the second
quarter. On the back of a recovering demand, we are
also taking actions to return to healthier price levels
Business climate improved in Poland, although
market activity was impacted negatively by floods.
In Slovakia, Czech Republic and Hungary, the activity
continued on a low level. Small signs of recovery in
the Baltic countries, although at a very low level
7

APRIL – JUNE 2010 FINANCIAL HIGHLIGHTS
Net sales EUR 128.7 (124.6) million, up 3.3% (down 3.2% at
comparable exchange rates)
EBITDA EUR 30.7 (36.1) million or 23.9% (29.0%) of net sales
EBIT EUR 7.4 (13.5) million or 5.8% (10.8%) of net sales
Cash flow after investments EUR 13.4 (27.8) million
Acquisition of access platform operation and rental agreement signed in
Finland and acquisition of rental business in Czech Republic
JANUARY - JUNE 2010 HIGHLIGHTS
Net sales EUR 240.3 (246.8) million, down 2.6% (down 8.7% at
comparable exchange rates)
EBITDA EUR 48.3 (66.4) million or 20.1% (26.9%) of net sales
EBIT EUR 1.9 (20.7) million or 0.8% (8.4%) of net sales
Net profit EUR -1.0 (9.0) million and EPS EUR -0.01 (0.08)
Gross capital expenditure EUR 34.2 (7.3) million
Cash flow after investments EUR 9.4 (45.7) million
Net debt EUR 209.3 (254.8) million and gearing 70.6% (86.1%)
8

WE REITERATE OUR OUTLOOK 2010
9
Due to the restructuring actions and
adjustment of fixed costs, the profit before taxes is expected to improve in 2010, and cash flow to be positive.

COMPANY STILL IN CASH GENERATIVE MODE
16 MEUR dividend paid in Q2/2010
10
MEUR Cash flow versus change in net debt
-55
-30
25
67
18 28 22 20
-4
13
56 82
-11
-59
-22 -26 -25 -23
5
-2
-70
-50
-30
-10
10
30
50
70
90
Q1/08 Q2/08 Q3/08 Q4/08 Q1/09 Q2/09 Q3/09 Q4/09 Q1/10 Q2/10
Cash flow after investments Change in net debt

Focus on top line and widening the customer base
HAVATOR AND RAMIRENT FORM ONE-STOP-SHOP TOWARDS INDUSTRIAL CUSTOMERS
On 18 May 2010, Havator outsourced access platform operation
(excl. truck-mounted equipment) to Ramirent and signed a
five-year rental and cooperation agreement
Strengthens competitiveness
through marketing alliance in
heavy industrial projects
Complementary network in
Finland, Sweden, Norway,
Russia and the Baltic States

Focus on top line and widening the customer base
ACQUISITION SIGNED IN CZECH REPUBLIC
On 29 June 2010, Ramirent acquired the
equipment rental business of the Czech
construction machinery company
NTC Stavební Tecnika spol. s r.o.
Expands network in Czech republic by three
new outlets in Hradec Králove, Pardubice and
Ceska Skalice in the East Bohemia region
The acquired operations are certified by the
ISO 9001:2009 quality control system
12

OUR NORWEGIAN OPERATION KNOWN AS ”BAUTAS” REBRANDED TO RAMIRENT
13

NEW MANAGEMENT INCENTIVE PROGRAMME AND REPURCHASE OF OWN SHARES TO START
14
New Performance Share Programme for the
earning period 2010—2012
Targeting apprx. 50 managers
The reward will be based on:
-Total Shareholder Return,
-Average Return on Capital Employed
-Cumulative Earnings per Share
The maximum reward corresponds to the
value of up to 390,000 Ramirent Plc shares
Repurchase of up to 390,000 own shares
To commence not until one week after the
publication of the decision on 11 August 2010

Growth Stability Positioning Growth
Priorities in 2009
• Safeguarding cash flow and profitability
• Reduction of fixed costs and capital expenditure
• Optimising fleet sharing
Priorities from 2010 onwards
• Top line growth • Outsourcing • Acquisitions • Pricing discipline
• Operational excellence –
“Rami platform” • Risk management
Business cycle
Strategy
implementation
priorities
Counter cyclical
free cash flow
Strong market
conditions and
substantial growth
2004-2007
WELL POSITIONED FOR A MARKET UPTURN
15
Ramirent today

DEPOT NETWORK AND FLEET INTACT TO CAPTURE OPPORTUNITIES
96 83
57 69
37 38
18 20
52 45
99 98
0
50
100
150
200
250
300
350
400
Finland Sweden
Norway Denmark
Europe East Europe Central
96
165
212
165
15 26 0
50
100
150
200
250
Investment in fleet Number of outlets per segment
359 353
MEUR
16

JANUARY – JUNE 2010
REVIEW BY SEGMENT
17

33
39 43
39
29
34
41
31 28
36
-5 %
0 %
5 %
10 %
15 %
20 %
25 %
30 %
0
5
10
15
20
25
30
35
40
45
50
Q1 2008 Q2 Q3 Q4 Q1 2009 Q2 Q3 Q4 Q1 2010 Q2
Net sales EBIT-%
FINLAND
Demand improved for most product groups due to higher construction activity
Activity was high due to maintenance breaks in industrial plants while it decreased in shipyards
Price pressure increased in certain product groups, while there was an upward trend in prices in other product groups due to lack of equipment
EBIT burdened by harmonisation of depreciation rules
18
Q2 Jan-Jun Jan-Dec
Finland 2010 2009 Change 2010 2009 Change 2009
Net sales, MEUR
36.1 33.8 6.6% 64.2 62.6 2.6% 134.3
EBIT, MEUR 4.0 4.9 -17.8% 3.8 5.8 -34.3% 12.1
EBIT-margin 11.1% 14.4% 5.9% 9.2% 9.0%
Employees 641 626 2.4% 602
Outlets 83 84 -1.2% 81
MEUR

Q2 Jan-Jun Jan-Dec
Sweden 2010 2009 Change 2010 2009 Change 2009
Net sales, MEUR
34.9 32.6 6.9% 64.2 64.7 -0.6% 127.9
EBIT, MEUR 5.0 6.9 -27.0% 7.6 12.2 -37.7% 20.9
EBIT-margin 14.4% 21.1% 11.8% 18.8% 16.4%
Employees 540 552 -2.2% 500
Outlets 69 58 19.0% 59
SWEDEN
42 45
42 42
32 33 31
32 29
35
0 %
5 %
10 %
15 %
20 %
25 %
0
5
10
15
20
25
30
35
40
45
50
Q12008
Q2 Q3 Q4 Q12009
Q2 Q3 Q4 Q12010
Q2
Sales EBIT-%MEUR
19
-10.4% at comparable exchange rates
Sales decreased due to lower activity especially in the beginning of the year
Activity in the capital city was high
Upwards trend in pricing was noticeable due to lack of equipment in certain product groups
EBIT burdened by costs for the opening of new outlets
-4.2% at comparable exchange rates

Q2 Jan-Jun Jan-Dec
Norway 2010 2009 Change 2010 2009 Change 2009
Net sales, MEUR
27.4 25.2 8.8% 55.7 54.1 3.0% 109.2
EBIT, MEUR 1.0 3.4 -69.5% 0.6 5.9 -90.2% 9.1
EBIT-margin 3.7% 13.4% 1.0% 10.9% 8.4%
Employees 519 582 -10.8% 547
Outlets 38 40 -5.0% 39
NORWAY
37 39
37
34
29
25 27
29 28 27
-20 %
-15 %
-10 %
-5 %
0 %
5 %
10 %
15 %
20 %
25 %
0
5
10
15
20
25
30
35
40
45
Q12008
Q2 Q3 Q4 Q12009
Q2 Q3 Q4 Q12010
Q2
Net sales EBIT-%MEUR
20
-7.2% at comparable exchange rates
Net sales was supported in the second quarter by overall improving market conditions
EBIT was still burdened by price competition in certain product groups as well as costs for reorganising product centres
Bautas brand name changed to the Group master brand name Ramirent
-2.6% at comparable exchange rates

DENMARK
14
15 14
16
11 12
11 10
8 9
-50 %
-40 %
-30 %
-20 %
-10 %
0 %
10 %
20 %
0
2
4
6
8
10
12
14
16
18
Q12008
Q2 Q3 Q4 Q12009
Q2 Q3 Q4 Q12010
Q2
Net sales EBIT-%MEUR
21
Net sales decreased due to continued weak market conditions
Persistent and intense price competition affected both sales and EBIT negatively
Q2 Jan-Jun Jan-Dec
Denmark 2010 2009 Change 2010 2009 Change 2009
Net sales, MEUR
9.0 11.6 -22.6% 17.1 22.9 -25.2% 42.9
EBIT, MEUR -0.7 0.4 N/A -1.3 0.4 N/A -4.3
EBIT-margin -7.4% 3.6% -7.6% 1.5% -10.1%
Employees 148 190 -22.1% 151
Outlets 20 20 0% 21

Q2 Jan-Jun Jan-Dec
Europe East 2010 2009 Change 2010 2009 Change 2009
Net sales, MEUR
9.5 12.0 -20.3% 17.0 21.3 -20.0% 51.3
EBIT, MEUR -1.6 -3.3 N/A -4.0 -6.6 N/A -10.6
EBIT-margin -16.5% -27.4% -23.4% -31.1% -20.7%
Employees 394 424 -7.1% 357
Outlets 45 47 -4.3% 44
EUROPE EAST
20
23
26
21
9
12
19
11
8 10
-70 %
-60 %
-50 %
-40 %
-30 %
-20 %
-10 %
0 %
10 %
20 %
30 %
0
5
10
15
20
25
30
Q1 2008 Q2 Q3 Q4 Q1 2009 Q2 Q3 Q4 Q1 2010 Q2
Net sales EBIT-%
MEUR
22
Net sales decreased in Europe East due to low market activity and less internal transfers of equipment
Activity is increasing in Russia and Ukraine where construction activity has picked up. Small signs of recovery is also seen in the Baltic countries, although at a very low level
EBIT was burdened by continuously lower sales and price levels
-24.1% at comparable exchange rates -22.4% at comparable exchange rates

17
21
27
24
14 16
18 16
12
16
-25 %
-20 %
-15 %
-10 %
-5 %
0 %
5 %
10 %
15 %
20 %
0
5
10
15
20
25
30
Q1 2008 Q2 Q3 Q4 Q1 2009 Q2 Q3 Q4 Q1 2010 Q2
Net sales EBIT-%
EUROPE CENTRAL
MEUR
23
Net sales decreased in Europe Central, due to lower construction activity in all countries
The business climate improved in Poland at the end of the period, although market activity was impacted by floods
EBIT was burdened by the decline in sales and intense price competition in most product groups
Q2 Jan-Jun Jan-Dec
Europe Central
2010 2009 Change 2010 2009 Change 2009
Net sales, MEUR
15.9 16.3 -2.9% 28.0 30.4 -8.1% 65.0
EBIT, MEUR 0.3 1.6 -81.0% -2.3 2.3 N/A 2.8
EBIT-margin 1.9% 9.5% -8.4% 7.5% 4.3%
Employees 812 875 -7.2% 849
Outlets 98 102 -3.9% 100
-7.1% at comparable exchange rates -13.6% at comparable exchange rates

FINANCIAL HIGHLIGHTS
24

NET SALES GREW BY 3.3% IN APRIL-JUNE 2010
For the period January-June 2010, Net sales declined by 2.6%
(-8.7% at comparable exchange rates)
25
Change in net sales YoY, %
3 %
7 % 7 % 9 %
-23 % -20 %
-3 % -3 %
7 %
-4 % -3 %
-23 % -24 %
-7 %
-30 %
-25 %
-20 %
-15 %
-10 %
-5 %
0 %
5 %
10 %
15 %
Group Finland Sweden Norway Denmark East Central
EUR Comparable exchange rates

Q2/2010 FIRST QUARTER WITH GROWTH SINCE Q3/2008
Change in net sales YoY, %
26
19 % 19 %
13 %
-4 %
-25 %
-31 % -31 %
-27 %
-9 %
3 %
-40 %
-30 %
-20 %
-10 %
0 %
10 %
20 %
30 %
Q1/08 Q2/08 Q3/08 Q4/08 Q1/09 Q2/09 Q3/09 Q4/09 Q1/10 Q2/10

GROSS MARGIN STRENGTHENED COMPARED TO PREVIOUS QUARTER
Gross margin impacted by
• Price pressure
• More transportation of equipment
• More outsourced services
• More project establishments
27
71 % 71 % 71 %
68 %
70 %
71 %
70 %
68 %
65 %
69 %
65 %
67 %
62 %
63 %
64 %
65 %
66 %
67 %
68 %
69 %
70 %
71 %
72 %
Q1 Q2 Q3 Q4 FY
Gross margin 2008 Gross margin 2009 Gross margin 2010

STABLE FIXED COSTS DEVELOPMENT CONTINUED
44 35
30 33 33 33 33
29
22 22 19
23 22 23
0
10
20
30
40
50
60
70
80
Q3/08 Q1/09 Q2/09 Q3/09 Q4/09 Q1/10 Q2/10
Employee benefit expenses Other operating expenses
MEUR
28
57 52 52 57 56
73
56

EBIT MARGIN BACK TO POSITIVE IN Q2/2010
For the period January-June 2010, EBIT-margin was 0.8% (8.4%
previous year)
29
18 % 20 %
18 %
-11 %
6 %
11 % 9 %
-3 % -5 %
6 %
-15 %
-10 %
-5 %
0 %
5 %
10 %
15 %
20 %
25 %
Q1/08 Q2/08 Q3/08 Q4/08 Q1/09 Q2/09 Q3/09 Q4/09 Q1/10 Q2/10
EBIT-margin by quarter

EBIT MARGIN APRIL-JUNE 2010 REMAINED STRONGEST IN SWEDEN
EBIT-margin by segments
10,8 %
14,4 %
21,1 %
13,4 %
3,6 %
-27,4 %
9,5 % 5,8 %
11,1 % 14,4 %
3,7 %
-7,4 %
-16,5 %
1,9 %
-30 %
-20 %
-10 %
0 %
10 %
20 %
30 %
Group Finland Sweden Norway Denmark East Central
April-June 2009 April-June 2010
30

PERSONNEL DEVELOPMENT
At the end of June 2010, the Group’s workforce amounted
to 3,071 persons (3,265 at end of June 2009)
626
552 582
190
424
875
602
500 547
151
357
849
641
540 519
148
394
812
0
100
200
300
400
500
600
700
800
900
1 000
Finland Sweden Norway Denmark Europe East Europe
Central
Personnel 30/06/09 Personnel 31/12/09 Personnel 30/06/10
31

29,7
12,9
2,0 4,4
2,1
6,5 7,5
18,9
6,1
1,6 3,7
5,0 6,7
4,7 5,0 3,7
0
5
10
15
20
25
30
35
Q3/08 Q4/08 Q1/09 Q2/09 Q3/09 Q4/09 Q1/10 Q2/10
Purchased equipment Sold equipment
In the period January-June 2010, gross capital expenditure was EUR 34.2 million (EUR 7.3 million previous year) of which EUR 26.4 million (EUR 6.4 million previous year) in machinery and equipment
Value of sold equipment was EUR 8.7 million (EUR 8.7 million previous year). Focus is on selling off old equipment and non-standard fleet
MEUR
32
PURCHASED EQUIPMENT YTD 26.4 MEUR, SOLD 8.7 MEUR

MOST INVESTMENTS TO SWEDEN AND FINLAND
Capital Expenditure by segments
7 5
1 1 0 0
5
34
12
15
7
1 2 3
0
5
10
15
20
25
30
35
40
Group Finland Sweden Norway Denmark East Central
January-June 2009 January-June 2010
33
External investments will be limited – capacity need primarily covered by internal transfers
In the period January-June 2010, value of internally transferred equipment was EUR 5.5 million (EUR 5.4 million previous year)
MEUR

WORKING CAPITAL AT 3.5% OF NET SALES
16 15 15 15 15 14
86 88 90 80 83 90
-66 -68 -70 -67 -69 -86
-10 %
-8 %
-6 %
-4 %
-2 %
0 %
2 %
4 %
6 %
8 %
10 %
-120
-80
-40
0
40
80
120
Q1/09 Q2/09 Q3/09 Q4/09 Q1/10 Q2/10
Trade payables and other liabilitiesTrade and other receivablesInventoriesWorking capital/Net sales Rolling 12 month basis
MEUR
34

96 %
84 %
70 %
69 %
81 %
113 % 106 % 108 %
99 %
86 %
74 %
68 % 68 % 71 %
0 %
20 %
40 %
60 %
80 %
100 %
120 %
0
50
100
150
200
250
300
350
400
2004 2005 2006 2007 Q1/08 Q2/08 Q3/08 Q4/08 Q1/09 Q2/09 Q3/09 Q4/09 Q1/10 Q2/10
Net debt Gearing (%)
GEARING INCREASED SLIGHTLY TO 71%
35
Equity ratio rose to 44.3% (42.5%)
16 MEUR in dividend paid in April 2010
Net debt decreased to EUR 209.3 (254.8) million
On 30 June 2010, Ramirent had unused committed back-up loan
facilities available of EUR 181.6 million
MEUR

LONG-TERM FINANCIAL TARGETS
ROI >18 % p.a. over a business cycle
EPS growth > 15 % p.a. over a business cycle
Gearing < 120 % at end of each year
Dividend pay-out > 40 %
0 %
5 %
10 %
15 %
20 %
25 %
30 %
35 %
1998 1999 2000 2001 2002 2003 2004 2005 2006 2007 2008 2009
EBIT margin ROI EBIT margin (average) ROI (average)
23% 18%
36

FORWARD-LOOKING STATEMENTS
A number of forward-looking statements will be made during
this presentation. Forward-looking statements are any
statements that are not historical facts. These statements are
based on current decisions and plans and currently known
factors. They involve risks and uncertainties which may cause
the actual results to materially differ from the results currently
expected by Ramirent.
This presentation is being made on August 11, 2010. The
content of this presentation contains time-sensitive information
that is accurate only as of the time hereof.
If any portion of this presentation is rebroadcast, retransmitted
or redistributed at a later date, Ramirent will not be reviewing
or updating the material that is contained herein.

MORE INFORMATION www.ramirent.com
Magnus Rosén, CEO
+358 20 750 2845
Jonas Söderkvist, CFO
+358 20 750 3248
Franciska Janzon, IR
+358 20 750 2859

CONSOLIDATED INCOME STATEMENT
(EUR 1,000) 4-6/10 4-6/09 1-6/10 1-6/09 1-12/09
Net sales 128 749 124 600 240 275 246 814 502 500
Other operating income 613 537 912 1 162 2 060
Materials and services -42 628 -37 160 -81 318 -72 533 -157 153
Employee benefit expenses -32 595 -30 110 -66 089 -64 795 -130 934
Depreciation & amortisation -23 294 -22 621 -46 409 -45 751 -101 113
Other operating expenses -23 398 -21 740 -45 515 -44 201 -86 594
EBIT 7 447 13 507 1 856 20 696 28 766
Financial income 3 617 1 862 9 718 10 386 17 936
Financial expenses -4 968 -4 030 -11 496 -18 794 -34 027
EBT 6 097 11 339 78 12 288 12 675
Income taxes -1 804 -2 866 -1 097 -3 281 -7 992
NET RESULT FOR THE PERIOD 4 293 8 472 -1 019 9 007 4 683
Net result for the period attributable to:
Owners of the parent company 4 293 8 472 -1 019 9 007 4 683
Non-controlling interests - - - - -
Total 4 293 8 472 -1 019 9 007 4 683
Earnings per share (EPS), basic and diluted, EUR
0.04 0.08 -0.01 0.08 0.04
39

BALANCE SHEET – ASSETS
(EUR 1,000) 30.6.2010 30.6.2009 31.12.2009
NON-CURRENT ASSETS
Property, plant and equipment 446 885 491 906 456 076
Goodwill 94 559 83 309 87 194
Other intangible assets 6 780 6 383 5 851
Available-for-sale investments 53 135 53
Deferred tax assets 11 019 8 495 7 660
NON-CURRENT ASSETS, TOTAL 559 296 590 228 556 833
CURRENT ASSETS
Inventories 13 988 15 092 14 574
Trade and other receivables 89 709 87 909 80 146
Income tax receivables on the taxable income for the financial period
2 222 542 2 260
Cash and cash equivalents 2 425 1 649 1 800
CURRENT ASSETS, TOTAL 108 345 105 191 98 780
Non-current assets held for sale
370 559 370
TOTAL ASSETS 668 011 695 978 655 982
40

BALANCE SHEET – EQUITY AND LIABILITIES (EUR 1,000) 30.6.2010 30.6.2009 31.12.2009
EQUITY
Share capital 25 000 25 000 25 000
Revaluation fund -3 287 -3 326 - 2 319
Free equity fund 113 329 113 329 113 329
Translation differences -5 016 -27 372 - 14 403
Retained earnings 166 169 188 152 183 963
Items recognised directly to equity on non-current assets held for sale 62 136 62
PARENT COMPANY SHAREHOLDERS’ EQUITY 296 258 295 919 305 632
Non-controlling interests - - -
EQUITY, TOTAL 296 258 295 919 305 632
NON-CURRENT LIABILITIES
Deferred tax liabilities 54 414 45 420 50 798
Pension obligations 9 501 7 610 9 750
Provisions 3 432 6 201 3 856
Interest-bearing liabilities 181 025 184 820 198 061
NON-CURRENT LIABILITIES, TOTAL 248 372 244 051 262 466
CURRENT LIABILITIES
Trade payables and other liabilities 86 495 68 470 67 013
Provisions 5 184 12 296 8 477
Income tax liabilities on the taxable income for the financial period 1 003 3 619 1 501
Interest-bearing liabilities 30 698 71 625 10 894
CURRENT LIABILITIES, TOTAL 123 380 156 008 87 885
LIABILITIES, TOTAL 371 753 400 059 350 351
TOTAL EQUITY AND LIABILITIES 668 011 695 978 655 982

KEY FIGURES
MEUR 4-6/10 4-6/09 change 1-6/10 1-6/09 change 2009
Net sales 128.7 124.6 3.3% 240.3 246.8 -2.6% 502.5
EBITDA 30.7 36.1 -14.9% 48.3 66.4 -27.4% 129.9
EBITDA,% 23.9% 29.0% 20.1% 26.9% 25.8%
EBIT 7.4 13.5 -44.9% 1.9 20.7 -91.0% 28.8
EBIT, % 5.8% 10.8% 0.8% 8.4% 5.7%
ROI,% 5.1% 10.1% 8.5%
Invested capital, end of period 508.0 552.4 -8.0% 514.6
Net debt 209.3 254.8 -17.9% 207.2
Gearing, % 70.6% 86.1% 67.8%
Equity ratio,% 44.3% 42.5% 46.6%
Personnel, end of period 3,071 3,265 -5.9% 3, 021
Gross investments 21.7 4.8 351.8% 34.2 7.3 368.3% 17.5
Cash flow after investments 13.4 27.8 -51.8% 9.4 45.7 -79.5% 87.6
Earnings per share, basic and diluted, EUR
0.04 0.08 -52.3% -0.01 0.08 -111.3% 0.04
Dividend per share, EUR 0.15
42

CONDENSED CASH FLOW STATEMENT MEUR 1-6/10 1-6/09 Change 1-12/09
Cash flow from operating activities 39.6 51.2 -22.6% 107.7
Cash flow from investing activities -30.3 -5.6 -440.3% -20.0
Cash flow from financing activities
Borrowings/repayment of short-term debt 12.8 -9.0 242.3% -19.1
Borrowings/repayment of long-term debt -5.2 -37.1 85.9% -68.8
Dividends paid -16.3 - - -
Cash flow from financing activities -8.7 -46.1 81.1% -87.9
Net change in cash and cash equivalents 0.6 -0.4 256.2% -0.3
Cash and cash equivalents at the beginning of the period
1.8 2.1 -14.3% 2.1
Translation difference on cash and cash equivalents
- -0.1 -100% -
Net change in cash and cash equivalents 0.6 -0.3 308.2% -0.3
Cash and cash equivalents at the end of the period
2.4 1.6 51.6% 1.8
43

SEGMENT INFORMATION
Net sales, MEUR 1-6/10 1-6/09 Change 1-12/09
Finland, net sales (external) 63.1 60.4 4.6% 125.9
-Inter-segment sales 1.0 2.2 -52.7% 8.4
Sweden, net sales (external) 63.8 64.2 -0.7% 127.2
-Inter-segment sales 0.5 0.4 9.8% 0.6
Norway, net sales (external) 55.4 54.1 2.5% 109.1
-Inter-segment sales 0.3 - - -
Denmark, net sales (external) 15.5 21.2 -27.1% 40.0
-Inter-segment sales 1.7 1.7 -0.1% 2.8
Europe East, net sales (external) 15.2 16.8 -9.4% 36.1
-Inter-segment sales 1.8 4.4 -60.1% 15.2
Europe Central, net sales (external) 27.2 30.1 -9.5% 64.1
-Inter-segment sales 0.7 0.3 107.9% 1.0
Elimination of sales between segments -5.9 -9.0 34.3% -28.1
Net sales, total 240.3 246.8 -2.6% 502.5
44

EBIT BY SEGMENT EBIT (EUR million) 1-6/10 1-6/09 Change
1-12/09
Finland 3.8 5.8 -34.3% 12.1
% of net sales 5.9 % 9.2 % 9.0 %
Sweden 7.6 12.2 -37.7% 20.9
% of net sales 11.8 % 18.8 % 16.4 %
Norway 0.6 5.9 -90.2% 9.1
% of net sales 1.0 % 10.9 % 8.4 %
Denmark -1.3 0.4 N/A -4.3
% of net sales -7.6 % 1.5 % -10.1 %
Europe East -4.0 -6.6 N/A -10.6
% of net sales -23.4 % -31.1 % -20.7 %
Europe Central -2.3 2.3 N/A 2.8
% of net sales -8.4 % 7.5 % 4.3 %
Net items not allocated to operating segments -2.5 0.9 -389.5% -1.3
Group EBIT 1.9 20.7 -91.0% 28.8
% of net sales 0.8 % 8.4 % 5.7 %
45

LARGEST SHAREHOLDERS
Number of shares % of share
capital
1. Nordstjernan Ab 31 186 331 28.69
2. Julius Tallberg Oy Ab 11 962 229 11.01
3. Varma Mutual Pension Insurance Company 7 831 299 7.20
4. Ilmarinen Mutual Pension Insurance Company 6 142 214 5.65
5. Odin Norden 1 862 728 1.71
6. Tapiola Mutual Pension Insurance Company 1 700 000 1.56
7. Nordea Nordenfonden 1 560 057 1.44
8. Odin Finland 1 500 316 1.38
9. Odin Europa Smb 1 394 780 1.28
10. Veritas Pension Insurance Company Ltd 1 079 075 0.99
*As per 30 June 2010
46

50 000 000
100 000 000
150 000 000
200 000 000
250 000 000
300 000 000
0
20
40
60
80
100
120
140
160
180
SHARE PRICE DEVELOPMENT
22.36
EU
R
47
12.42
14.90
17.39
19.87
9.94
7.45
4.97
2.48
Ramirent share Sector OMX Helsinki
Share turnover