Ramirent results q3_2014_en_final
70
© 2014 Ramirent Q3 Interim Report January–September 2014 RESTRUCTURING MEASURES BEARING FRUIT, MIXED MARKET PICTURE REMAINS 6 November 2014 Magnus Rosén, President and CEO Jonas Söderkvist, CFO and EVP Corporate Functions
-
Upload
annika-berg -
Category
Investor Relations
-
view
29 -
download
0
Transcript of Ramirent results q3_2014_en_final

© 2014 Ramirent
Q3 Interim Report January–September 2014
RESTRUCTURING MEASURES BEARING FRUIT, MIXED MARKET PICTURE REMAINS 6 November 2014 Magnus Rosén, President and CEO Jonas Söderkvist, CFO and EVP Corporate Functions

© 2014 Ramirent © 2014 Ramirent
Agenda
2
Group performance
Segment review
Market outlook
Key figures
Financial position
Company overview
Appendix

© 2014 Ramirent 3
Restructuring measures bearing fruit, mixed market picture remains
Key figures Q3/2014
Business performance
Market situation
The market picture remained mixed and we saw no major changes in the market environment during the third quarter
Net sales down by 1.6%; adjusted for divested operations, net sales were
up by 1.9% at comparable exchange rates
EBITA MEUR 28.0 (25.9) or 17.1% (15.6%) of net sales
EBITA excl. non-recurring items and divested operations1) MEUR 29.9
(28.7) or 18.3% (17.5%) of net sales
Gross capex MEUR 23.8 (29.5)
Third-quarter net sales were supported by improving demand in the Swedish market as several projects started
A number of actions were carried out to adjust the cost base in low-performing segments
Interim Report January–September 2014 l 6 November 2014
1) Restructuring provision of EUR 1.9 million in Norway was booked in the third quarter of 2014. In the comparison period, non-recurring items included a EUR 1.5 million restructuring provision in Denmark, a EUR 1.9 million loss from disposal of Hungary and EUR 0.6 million EBITA result from Hungary.
© 2014 Ramirent 4
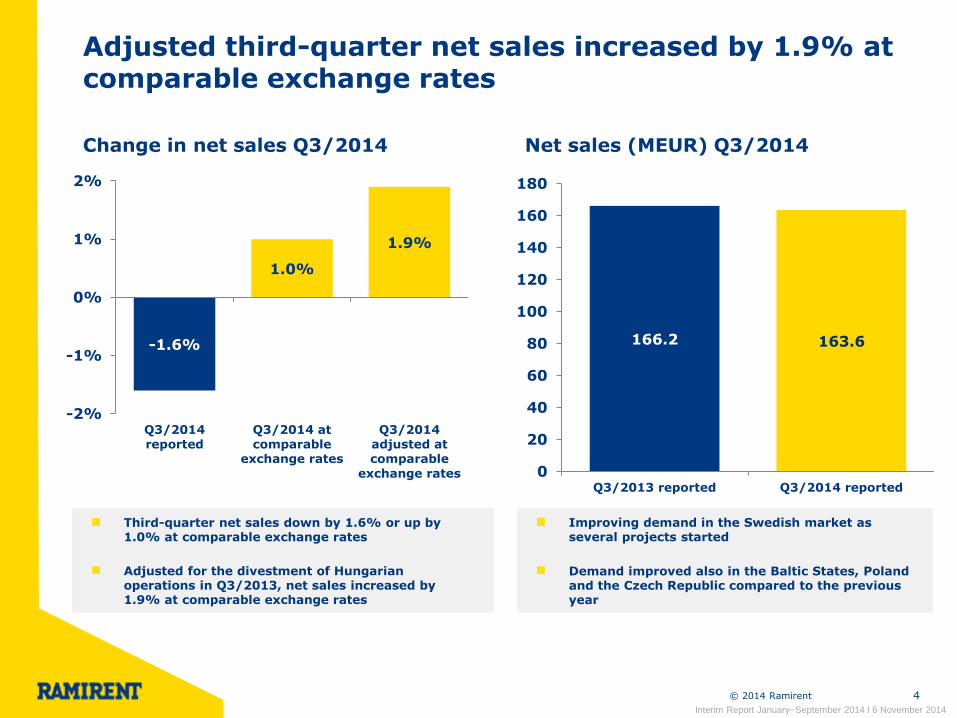
Adjusted third-quarter net sales increased by 1.9% at comparable exchange rates
Change in net sales Q3/2014
-1.6%
1.0%
1.9%
-2%
-1%
0%
1%
2%
Q3/2014reported
Q3/2014 atcomparable
exchange rates
Q3/2014adjusted atcomparable
exchange rates
Net sales (MEUR) Q3/2014
Third-quarter net sales down by 1.6% or up by 1.0% at comparable exchange rates
Adjusted for the divestment of Hungarian operations in Q3/2013, net sales increased by 1.9% at comparable exchange rates
166.2 163.6
0
20
40
60
80
100
120
140
160
180
Q3/2013 reported Q3/2014 reported
Improving demand in the Swedish market as several projects started
Demand improved also in the Baltic States, Poland and the Czech Republic compared to the previous year
Interim Report January–September 2014 l 6 November 2014

© 2014 Ramirent 5
Reported and adjusted EBITA margin improved compared to the previous year
15.6% 17.5% 17.1%
18.3%
0%
2%
4%
6%
8%
10%
12%
14%
16%
18%
20%
Q3/2013reported
Q3/2013 excl.non-recurring
items
Q3/2014reported
Q3/2014 excl.non-recurring
items
Restructuring provision of EUR 1.9 million in
Norway was booked
Q3/2014 EBITA margin excl. non-recurring
items and divested operations 18.3% (17.5%1))
EBITA margin Q3/2014 EBITA (MEUR) Q3/2014
25.9 28.7 28.0
29.9
0
5
10
15
20
25
30
35
Q3/2013reported
Q3/2013 excl.non-recurring
items
Q3/2014reported
Q3/2014 excl.non-recurring
items
Q3/2014 reported EBITA MEUR 28.0 (25.9)
Q3/2014 EBITA excl. non-recurring items and
divested operations MEUR 29.9 (28.71))
Interim Report January–September 2014 l 6 November 2014
1) Non-recurring items in the third quarter of 2013 included the EUR 1.5 million restructuring provision in Denmark, the EUR 1.9 million loss from disposal of Hungary and the EUR 0.6 million EBITA result from Hungary.

© 2014 Ramirent 6
Third-quarter EPS increased slightly from the comparison period
Earnings Per Share (EPS)
-0.05
0.04
0.08
0.07
0.00
0.08
0.17
0.16
0.07
0.14
0.19
0.18
0.10
0.11
0.16
0.13
0.02
0.07
0.17
-0.06
-0.04
-0.02
0.00
0.02
0.04
0.06
0.08
0.10
0.12
0.14
0.16
0.18
0.20
0.22
Q12010
Q2 Q3 Q4 Q12011
Q2 Q3 Q4 Q12012
Q2 Q3 Q4 Q12013
Q2 Q3 Q4 Q12014
Q2 Q3
Interim Report January–September 2014 l 6 November 2014
0.50 0.59 0.41 0.10 0.26
(0.37)

© 2014 Ramirent 7
Ramirent has signed three cooperation agreements with large construction companies
Interim Report January–September 2014 l 6 November 2014
Skanska's internal machinery department, Skanska Maskin AB, signed a three-year equipment rental agreement with Ramirent in Sweden
The agreement covers the whole assortment of both companies, from light and heavy machinery to modules and cranes
Veidekke renewed its cooperating agreement and signed a nationwide three-year equipment rental agreement with Ramirent in Norway
The agreement covers the whole assortment of machines and services from Ramirent
Hartela Oy outsourced its fleet of tower cranes to Ramirent in Finland and signed a five-year co-operation agreement covering the whole assortment of machines and services from Ramirent
According to the agreement, three employees will
move to Ramirent
After the end of the review period

© 2014 Ramirent 8
Our efficiency programme is progressing according to plan
Sales and pricing
Other
Sourcing
Fleet management
• Developing logistics and maintenance & repair processes
• Optimisation of fleet life-cycle
• Developing support processes and systems
• Optimisation of sourcing terms and supplier portfolio
• Common system platform and performance management model
• Developing efficient back-office functions
Target at the end of 2016: The identified efficiency actions are planned to deliver a Group EBITA margin of 17%
Interim Report January–September 2014 l 6 November 2014
Main areas of improvement
• Developing the network and customer care model
• Revenue management • Promoting services and
integrated solutions
• New organisational model for Customer Centre Sales and Solutions Sales introduced in Sweden, Denmark, and Norway
Actions implemented in 1-9/2014
• Concentration of repair & maintenance operations to few locations in the Nordic countries
• Outsourced yard & storage operations in Finland
• Compliance increased in usage of approved suppliers in all countries
• Increase in number of Groupwide supplier agreements
• New rental system live in Sweden, Denmark and, Norway
• Integration of back-office functions in Sweden and Denmark
• Personnel reductions due to restructuring

© 2014 Ramirent © 2014 Ramirent 9
Group performance
Segment review
Market outlook
Key figures
Financial position
Company overview
Appendix

© 2014 Ramirent 10
Finland Q3/2014: Net sales increased due to acquisitions and active sales management
• Net debt to EBITDA 1.1x in Q4
• Long-term financial target: below 1.6x
(at the end of FY)
24.9% 24.5%
19.0%
0%
5%
10%
15%
20%
25%
30%
Q12012
Q2 Q3 Q4 Q12013
Q2 Q3 Q4 Q12014
Q2 Q3
Net sales (MEUR) Highlights Q3/2014
45.0 41.8 43.5
05
101520253035404550
Q12012
Q2 Q3 Q4 Q12013
Q2 Q3 Q4 Q12014
Q2 Q3
EBITA margin Key figures
Demand remained at a good level in region South and Central
EBITA was burdened by the challenging pricing environment
Finland Q3
2014 Q3
2013 Change 2013
Net sales, MEUR 43.5 41.8 4.0% 151.9
EBITA, MEUR 8.3 10.2 −19.3% 25.7
% of net sales 19.0% 24.5% 16.9%
Capital expenditure, MEUR
4.9 7.4 −33.5% 28.8
Personnel (FTE) 538 531 1.4% 547
Customer centres 67 74 −9.5% 74
Net sales up by 4.0%
Interim Report January–September 2014 l 6 November 2014

© 2014 Ramirent 11
Sweden Q3/2014: Improving demand in the Swedish market as several projects started
• Net debt to EBITDA 1.1x in Q4
• Long-term financial target: below 1.6x
(at the end of FY)
18.0%
16.8% 17.2%
0%
5%
10%
15%
20%
25%
Q12012
Q2 Q3 Q4 Q12013
Q2 Q3 Q4 Q12014
Q2 Q3
Net sales (MEUR) Highlights Q3/2014
53.0 51.1 52.0
0
10
20
30
40
50
60
70
Q12012
Q2 Q3 Q4 Q12013
Q2 Q3 Q4 Q12014
Q2 Q3
EBITA margin Key figures
The demand for equipment rental in large construction projects started to improve and increased ancillary income
Ramirent carried out actions to reduce its fixed cost base during the quarter
Net sales up by 1.7% or by 7.7% at
comparable exchange rates
Sweden Q3
2014 Q3
2013 Change 2013
Net sales, MEUR 52.0 51.1 1.7% 207.3
EBITA, MEUR 8.9 8.6 4.1% 36.6
% of net sales 17.2% 16.8% 17.6%
Capital expenditure, MEUR
10.3 7.6 34.1% 35.8
Personnel (FTE) 771 644 19.8% 656
Customer centres 75 75 − 74
Interim Report January–September 2014 l 6 November 2014

© 2014 Ramirent 12
Norway Q3/2014: Focus on cost reductions to adjust to prevailing market conditions
• Net debt to EBITDA 1.1x in Q4
• Long-term financial target: below 1.6x
(at the end of FY)
17.0% 17.6%
11.8%
0%
5%
10%
15%
20%
25%
Q12012
Q2 Q3 Q4 Q12013
Q2 Q3 Q4 Q12014
Q2 Q3
Net sales (MEUR) Highlights Q3/2014
41.1 35.9 34.0
0
10
20
30
40
50
60
Q12012
Q2 Q3 Q4 Q12013
Q2 Q3 Q4 Q12014
Q2 Q3
EBITA margin Key figures
Net sales were affected by lower demand from residential construction especially in the capial city area
Actions to adjust the cost base continued and a restructuring provision of EUR 1.9 million was booked in the quarter
Net sales down by 5.3% or by 1.6% at
comparable exchange rates
Norway Q3
2014 Q3
2013 Change 2013
Net sales, MEUR 34.0 35.9 −5.3% 153.6
EBITA, MEUR 4.01) 6.3 −36.2% 22.0
% of net sales 11.8%1) 17.6% 14.3%
Capital expenditure, MEUR
3.8 8.4 −55.3% 34.5
Personnel (FTE) 410 470 −12.8% 460
Customer centres 43 43 - 43
Interim Report January–September 2014 l 6 November 2014
1) EBITA excluding non–recurring items was EUR 5.9 million, representing 17.3% of net sales. Non–recurring items included the EUR 1.9 million restructuring provision booked in the third quarter of 2014.

© 2014 Ramirent
Denmark Q3
2014 Q3
2013 Change 2013
Net sales, MEUR 10.1 11.9 −15.0% 44.0
EBITA, MEUR −0.1 −2.01) 94.0% −4.31)
% of net sales −1.2% −17.3%1) −9.7%1)
Capital expenditure, MEUR
1.5 1.3 17.6% 6.6
Personnel (FTE) 151 192 −21.3% 175
Customer centres 16 16 − 16
13
Denmark Q3/2014: Performance is improving
• Net debt to EBITDA 1.1x in Q4
• Long-term financial target: below 1.6x
(at the end of FY)
7.3%
-17.3%
-1.2%
-25%
-20%
-15%
-10%
-5%
0%
5%
10%
Q12012
Q2 Q3 Q4 Q12013
Q2 Q3 Q4 Q12014
Q2 Q3
Net sales (MEUR) Highlights Q3/2014
11.4 11.9
10.1
0
2
4
6
8
10
12
14
Q12012
Q2 Q3 Q4 Q12013
Q2 Q3 Q4 Q12014
Q2 Q3
EBITA margin Key figures
Net sales were disrupted due to restructuring measures being implemented to restore profitability
Performance is improving but was still burdened by low rental income
Integration of back-office functions to realise synergies with Sweden continued
Net sales down by 15.0% or by 15.1% at comparable exchange
rates
1) EBITA excluding non–recurring items was EUR –0.6 million or –4.7% of net sales in July–September 2013 and EUR –2.8 million or –6.3% of net sales in January–December 2013. Non–recurring items included the EUR 1.5 million restructuring provision in the third quarter of 2013. Interim Report January–September 2014 l 6 November 2014

© 2014 Ramirent 14
Europe East Q3/2014: Growth driven by demand from construction and energy sectors
• Net debt to EBITDA 1.1x in Q4
• Long-term financial target: below 1.6x
(at the end of FY)
Net sales (MEUR) Highlights Q3/2014
18.8
9.8 10.3
02468
101214161820
Q12012
Q2 Q3 Q4 Q12013
Q2 Q3 Q4 Q12014
Q2 Q3
EBITA margin Key figures
Net sales up by 4.9%
1) EBITA excluding non–recurring items and EBITA from Russia and Ukraine was EUR 6.0 million, representing 19.3% of net sales. Non–recurring items included the non–taxable capital gain of EUR 10.1 million from the formation of Fortrent Group, recorded in the first quarter of 2013 and EBITA from Russia and Ukraine. 2) EBITA margin excluding Fortrent transaction was 9.1% in the first quarter of 2013.
113.5%2)
Europe East Q3
2014 Q3
2013 Change 2013
Net sales, MEUR 10.3 9.8 4.9% 35.5
EBITA, MEUR 3.7 3.5 5.4% 17.31)
% of net sales 35.8% 35.6% 48.8%1)
Capital expenditure, MEUR
1.3 2.5 −47.9% 9.6
Personnel (FTE) 241 240 0.4% 235
Customer centres 42 41 2.4% 41
The Baltic States
23.5%
35.6% 35.8%
30.4% 31.3%
-5%
0%
5%
10%
15%
20%
25%
30%
35%
40%
Q12012
Q2 Q3 Q4 Q12013
Q2 Q3 Q4 Q12014
Q2 Q3
Interim Report January–September 2014 l 6 November 2014
Net sales increased in all Baltic countries compared to the last year
Profitability strengthened as a result of increased rental income and higher fleet utilisation
High uncertainty continued in Fortrent's markets

© 2014 Ramirent 15
Europe Central Q3/2014: Stable demand in Poland, the Czech Republic recovering
• Net debt to EBITDA 1.1x in Q4
• Long-term financial target: below 1.6x
(at the end of FY)
3.2%
7.0% 11.3%
-25%
-20%
-15%
-10%
-5%
0%
5%
10%
15%
20%
Q12012
Q2 Q3 Q4 Q12013
Q2 Q3 Q4 Q12014
Q2 Q3
Net sales (MEUR) Highlights Q3/2014
17.9 16.9
14.2
02468
101214161820
Q12012
Q2 Q3 Q4 Q12013
Q2 Q3 Q4 Q12014
Q2 Q3
EBITA margin Key figures
Net sales decreased by 15.6% at comparable
exchange rates; adjusted for divested operations net sales decreased by 7.0%
1) Adjusted for the divestment of the Hungarian operations in the third quarter 2013 the decrease in net sales was 7.0%. 2) EBITA excluding non–recurring items was EUR 2.5 million or 16.2% of net sales July–September 2013 and EUR 0.7 million or 1.2% of net sales in January–December 2013. The non-recurring items included the EUR 1.9 million loss from disposal of operations in Hungary, recorded in the third quarter 2013 and EBITA from Hungary.
Europe Central Q3
2014 Q3
2013 Change 2013
Net sales, MEUR 14.2 16.9 −15.6%1) 57.3
EBITA, MEUR 1.6 1.22) 36.4% −0.72)
% of net sales 11.3% 7.0%2) −1.2%2)
Capital expenditure, MEUR
1.1 2.5 −55.9% 7.1
Personnel (FTE) 473 489 −3.3% 479
Customer centres 59 57 3.5% 56
Interim Report January–September 2014 l 6 November 2014
In Poland, net sales were affected by some large projects ending but overall there was stable demand both in the construction and industrial sectors
Demand for rental equipment started to recover in the Czech Republic

© 2014 Ramirent © 2014 Ramirent
Group performance
Segment review
Market outlook
Key figures
Financial position
Company overview
Appendix
16
© 2014 Ramirent 17
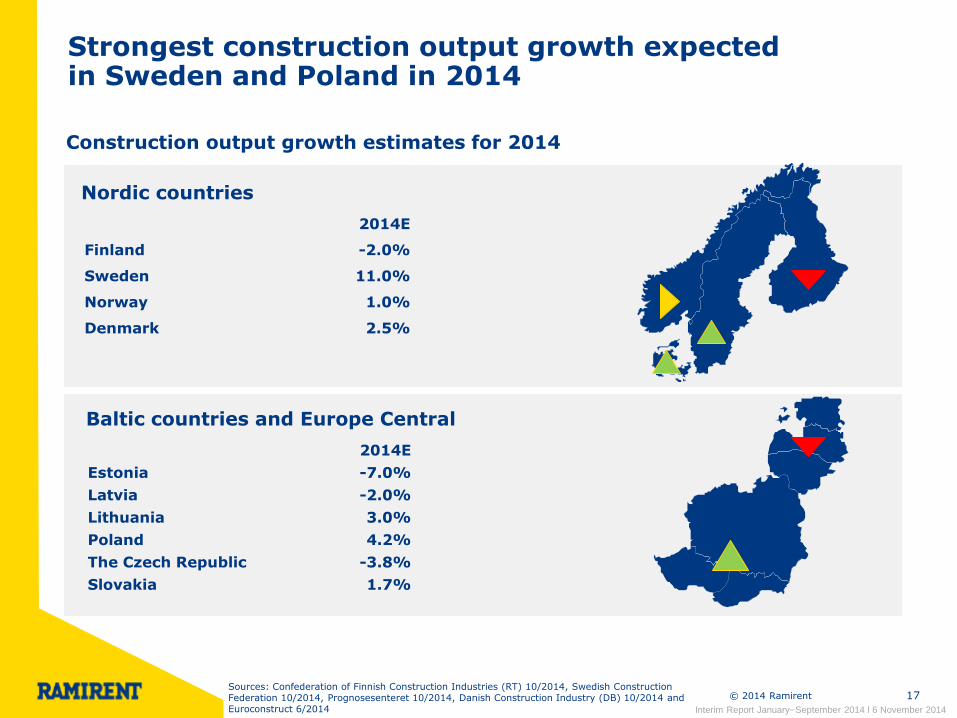
Strongest construction output growth expected in Sweden and Poland in 2014
Construction output growth estimates for 2014
Nordic countries
Baltic countries and Europe Central
2014E
Finland -2.0%
Sweden 11.0%
Norway 1.0%
Denmark 2.5%
2014E
Estonia -7.0%
Latvia -2.0%
Lithuania 3.0%
Poland 4.2%
The Czech Republic -3.8%
Slovakia 1.7%
Interim Report January–September 2014 l 6 November 2014
Sources: Confederation of Finnish Construction Industries (RT) 10/2014, Swedish Construction Federation 10/2014, Prognosesenteret 10/2014, Danish Construction Industry (DB) 10/2014 and Euroconstruct 6/2014

© 2014 Ramirent 18
Stable development in Ramirent's main equipment rental markets
Equipment rental market 2008-2015E (index)
Interim Report January–September 2014 l 6 November 2014
101
113
125
69
85
40
50
60
70
80
90
100
110
120
130
140
2008 2009 2010 2011 2012 2013 2014E 2015F
Finland Sweden Norway Denmark Poland
Source: ERA (European Rental Association) report 10/2014

© 2014 Ramirent 19
Equipment rental markets estimated to recover in 2015
Equipment rental market growth 2014-2015E (%)
Interim Report January–September 2014 l 6 November 2014
-1.6%
1.0%
2.0%
0.7%
1.5%
2.8%
2.1%
1.8%
1.1%
3.5%
5.3%
2.6%
-2.0%
-1.0%
0.0%
1.0%
2.0%
3.0%
4.0%
5.0%
6.0%
Finland Sweden Norway Denmark Poland Total Europe
2014E 2015E
Source: ERA (European Rental Association) report 10/2014

© 2014 Ramirent 20
Nordic construction order books increased by 5.2% compared to the previous year
Nordic construction companies order books (at comparable exchange rates)
billion
Nordic construction order books including NCC, YIT*, Lemminkäinen and SRV increased by 5.2% at comparable exchange rates compared to the previous year
Ramirent's rolling 12 months net sales declined by 8.0% (y-o-y)
*YIT's order book not fully comparable as it includes also order book from the Baltic States, Slovakia and the Czech Republic (change in reporting structure as of Q1/2014).
-40%
-20%
0%
20%
40%
60%
0
1
2
3
4
5
6
7
8
9
Q1
2007
Q2 Q3 Q4 Q1
2008
Q2 Q3 Q4 Q1
2009
Q2 Q3 Q4 Q1
2010
Q2 Q3 Q4 Q1
2011
Q2 Q3 Q4 Q1
2012
Q2 Q3 Q4 Q1
2013
Q2 Q3 Q4 Q1
2014
Q2 Q3
NCC YIT*
Lemminkäinen SRV
Change in Net sales (y-o-y), R12 Ramirent Change in order backlog (y-o-y), Nordic construction
Interim Report January–September 2014 l 6 November 2014

The economic growth in 2014 is
expected to be modest and construction
market demand remains mixed in our
core markets.
Ramirent will maintain strict cost
control and, for 2014, capital
expenditure is expected to be around
the same level as in 2013.
The strong financial position will enable
the Group to continue to address
profitable growth opportunities.
Ramirent outlook for 2014 unchanged

© 2014 Ramirent © 2014 Ramirent
Group performance
Segment review
Market outlook
Key figures
Financial position
Company overview
Appendix

23
Finland Sweden Norway Denmark Baltics Central
Net
Sale
s
(M
EU
R)
EB
IT
A m
arg
in
(%
)
R12 Q3/2013 R12 Q3/2014
Rolling 12 months EBITA margin improved in the Baltic States and Europe Central
17.6% 16.7% 16.0%
-6.1%2)
17.2%
-0.7%3)
15.2% 15.6%
9.5%
-9.1%
19.3%
2.3%
-20%
-10%
0%
10%
20%
Finland Sweden Norway Denmark The BalticStates
Europe Central
155.0
212.3
163.8
44.4 30.5
58.2
152.8
198.9
142.6
40.6 33.1 54.7
0.0
50.0
100.0
150.0
200.0
Finland Sweden Norway Denmark The BalticStates
Europe Central
1) Rolling 12 months EBITA excluding non–recurring items was EUR 15.5 million or 10.9% of net sales. Non-recurring items included restructuring provision of EUR 1.9 million in Norway, booked in the third quarter of 2014. 2) Rolling 12 months EBITA excluding non–recurring items was EUR −1.2 million or −2.7% of net sales. The non-recurring items included the EUR 1.5 restructuring provision for the third quarter of 2013. 3) Rolling 12 months EBITA excluding non–recurring items was EUR 1.5 million or 2.5% of net sales. The non-recurring items included the EUR 1.9 million loss from disposal of operation in Hungary, recorded in the third quarter 2013.
© 2014 Ramirent
1)
Interim Report January–September 2014 l 6 November 2014
© 2014 Ramirent 24
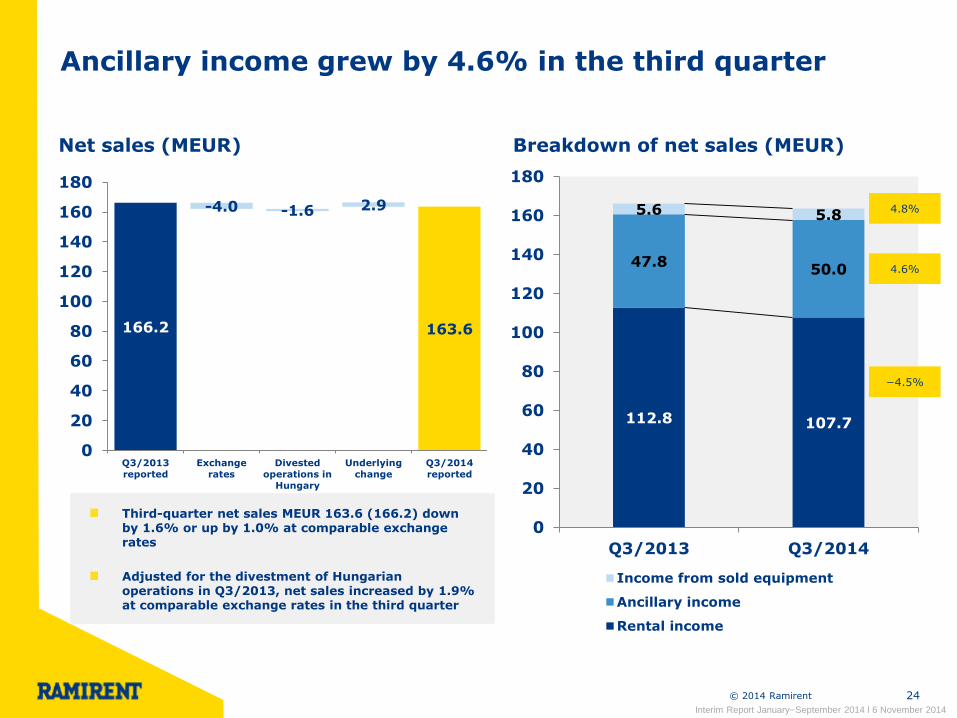
Ancillary income grew by 4.6% in the third quarter
Net sales (MEUR) Breakdown of net sales (MEUR)
112.8 107.7
47.8 50.0
5.6 5.8
0
20
40
60
80
100
120
140
160
180
Q3/2013 Q3/2014
Income from sold equipment
Ancillary income
Rental income
−4.5%
4.6%
4.8%
166.2
-4.0 -1.6 2.9
163.6
0
20
40
60
80
100
120
140
160
180
Q3/2013
reported
Exchange
rates
Divested
operations in
Hungary
Underlying
change
Q3/2014
reported
Third-quarter net sales MEUR 163.6 (166.2) down by 1.6% or up by 1.0% at comparable exchange rates
Adjusted for the divestment of Hungarian operations in Q3/2013, net sales increased by 1.9% at comparable exchange rates in the third quarter
Interim Report January–September 2014 l 6 November 2014

© 2014 Ramirent 25
Ramirent carried out actions to reduce its fixed cost base during the third quarter
Customer centres Personnel (FTE)
334 325 306 304 302 301 302
Q12013
Q2 Q3 Q4 Q12014
Q2 Q3
Finland Sweden Norway Denmark Europe East -Baltics Europe Central
Number of customer centres has been adjusted
to prevailing market conditions during 2014
Improving efficiency of repair & maintenance
operations on-going
Third-quarter employee benefit expenses
decreased to MEUR 37.7 (39.6)
Ramirent carried out actions to reduce its
fixed cost base in the third quarter
Group: 2,621 (2,597)
Interim Report January–September 2014 l 6 November 2014
Finland
538
Sweden
771 Norway
410
Denmark
151
Europe East -
Baltics 241
Europe
Central 473

© 2014 Ramirent 26
Ramirent’s third-quarter fixed costs 5.6 MEUR lower compared to last year
Fixed costs (MEUR) and % of Group net sales
68.0 63.7
58.1 36.6%
38.3%
35.5%
0%
5%
10%
15%
20%
25%
30%
35%
40%
45%
50%
0
10
20
30
40
50
60
70
80
Q12012
Q2 Q3 Q4 Q12013
Q2 Q3 Q4 Q12014
Q2 Q3
Group fixed costs MEUR 58.1 (63.7) in the third quarter
Third-quarter fixed costs of net sales 35.5% (38.3%)
Q3/14 fixed costs:
• Employee benefit expenses MEUR 37.7 (39.6)
• Other operating expenses MEUR 20.4 (24.1)
Fixed costs rolling 12 months MEUR 239.0 or 38.5% of net sales
Interim Report January–September 2014 l 6 November 2014

© 2014 Ramirent 27
Third-quarter reported and adjusted EBITDA margin improved from the previous year
EBITDA margin
31.3% 33.3% 33.0% 34.1%
0%
5%
10%
15%
20%
25%
30%
35%
40%
Q3/2013reported
Q3/2013 excl.non-recurring
items
Q3/2014reported
Q3/2014 excl.non-recurring
items
EBITDA margin quarterly
30.0%
32.7% 32.5% 31.3%
33.0%
0%
5%
10%
15%
20%
25%
30%
35%
Q1
2010
Q2 Q3 Q4 Q1
2011
Q2 Q3 Q4 Q1
2012
Q2 Q3 Q4 Q1
2013
Q2 Q3 Q4 Q1
2014
Q2 Q3
Restructuring provision of EUR 1.9 million in
Norway was booked
Q3/2014 EBITDA margin excl. non-recurring
items and divested operations 34.1% (33.3%1))
Year-to-date EBITDA MEUR 127.8 (148.8) or
28.2% (31.0%) of net sales
Year-to-date EBITDA excluding non-recurring
items and adjusted for transferred or divested
operations was MEUR 129.7 (139.6) or 28.6%
(29.7%)
Interim Report January–September 2014 l 6 November 2014
1) Non-recurring items in the third quarter of 2013 included the EUR 1.5 million restructuring provision in Denmark, the EUR 1.9 million loss from disposal of Hungary and the EUR 0.6 million EBITDA result from Hungary.

© 2014 Ramirent 28
Third-quarter reported EBITA was 28.0 MEUR, 17.1% of net sales
12.4%
17.9% 17.1%
15.6%
17.1%
-6%
-4%
-2%
0%
2%
4%
6%
8%
10%
12%
14%
16%
18%
20%
Q1
2010
Q2 Q3 Q4 Q1
2011
Q2 Q3 Q4 Q1
2012
Q2 Q3 Q4 Q1
2013
Q2 Q3 Q4 Q1
2014
Q2 Q3
15.6% 17.5% 17.1%
18.3%
0%
2%
4%
6%
8%
10%
12%
14%
16%
18%
20%
Q3/2013reported
Q3/2013 excl.non-recurring
items
Q3/2014reported
Q3/2014 excl.non-recurring
items
Restructuring provision of EUR 1.9 million in
Norway was booked
Q3/2014 EBITA margin excl. non-recurring
items and divested operations 18.3% (17.5%1))
Year-to-date EBITA MEUR 51.3 (71.2) or 11.3%
(14.8%) of net sales
Year-to-date EBITA excl. non-recurring items and
adjusted for transferred or divested operations
was MEUR 53.2 (62.7) or 11.7% (13.3%)
EBITA margin EBITA margin quarterly
Interim Report January–September 2014 l 6 November 2014
1) Non-recurring items in the third quarter of 2013 included the EUR 1.5 million restructuring provision in Denmark, the EUR 1.9 million loss from disposal of Hungary and the EUR 0.6 million EBITA result from Hungary.

© 2014 Ramirent 29
EBITA excl. non-recurring items was 11.7% in January-September 2014
71.2
62.7
51.3
1.93)
6.81)
64.4
1.72)
53.2
0.0
10.0
20.0
30.0
40.0
50.0
60.0
70.0
80.0
1-9/2013 reported 1-9/2013 excl. non-
recurring items
1-9/2013 adjusted 1-9/2014 reported 1-9/2014 excl. non-
recurring items
EBITA (MEUR) 1-9/13 vs 1-9/14
1) Non-recurring items in 2013: -the loss from disposal Hungary MEUR 1.9 -the non-taxable capital gain from Fortrent transation MEUR 10.1 -the restructuring provision in Denmark MEUR 1.5
2) EBITA result from Russia, Ukraine and Hungary
3) Restructuring provision of EUR 1.9 million in Norway
14.8% 13.3% 11.3% EBITA margin 13.4%
Interim Report January–September 2014 l 6 November 2014
11.7%

© 2014 Ramirent 30
Group R12 EBITA margin was 11.6%
Q3/2014 R12 EBITA margin by segment (%)
15.2 15.6
9.5
-9.1
19.3
2.3
11.6
-5
0
5
10
15
20
Finland Sweden Norway Denmark Baltics Europe Central Group
Group EBITA targeted to reach 17% by
the end of 2016…
…by delivering at least 18% EBITA
margin on segment level
18%
10%
Interim Report January–September 2014 l 6 November 2014

© 2014 Ramirent 31
Investments in machinery and equipment adjusted to prevailing market conditions
Gross capital expenditure (MEUR) and % of net sales
9.7
119.9
28.0 29.5 23.8
0%
10%
20%
30%
40%
50%
60%
70%
80%
0
20
40
60
80
100
120
140
Q12010
Q2 Q3 Q4 Q12011
Q2 Q3 Q4 Q12012
Q2 Q3 Q4 Q12013
Q2 Q3 Q4 Q12014
Q2 Q3
Gross Capex Share of net sales-%
Third-quarter gross capex MEUR 23.8 (29.5) of which 0.1 (0.0) related to acquisitions
Investments in machinery and equipment MEUR 20.4 (28.0) in the third quarter
Gross capex in 1-9/2014 was MEUR 125.6 (91.9)
Interim Report January–September 2014 l 6 November 2014

© 2014 Ramirent 32
Capital expenditure focused on Finland and Sweden
• Net debt to EBITDA 1.1x in Q4
• Long-term financial target: below 1.6x
(at the end of FY)
Capital expenditure by segment (MEUR)
Investments
21.9
26.8
25.4
4.7
6.9
4.9
31.4
56.0
13.5
3.3
8.7
6.7
0.0 20.0 40.0 60.0
Finland
Sweden
Norway
Denmark
East
Central1-9/14
1-9/13 In January-September 2014, investments in
machinery and equipment MEUR 92.5 (85.3)
Interim Report January–September 2014 l 6 November 2014

© 2014 Ramirent 33
Cash flow after investments and cash conversion positive
-60%
-40%
-20%
0%
20%
40%
60%
80%
-60
-40
-20
20
40
60
80
EBITDA (MEUR)
Cashflow after investments (MEUR)
Cash Conversion
Cash flow after investments (MEUR) Cash conversion (MEUR and %)
19
-5
34
25
-5
-22
14
-30
-20
-10
0
10
20
30
40
Q1
2013
Q2 Q3 Q4 Q1
2014
Q2 Q3
Cash flow after investments MEUR 13.7 (34.4) in
the third quarter
Cash flow after investments MEUR -10.7 (48.2) in
January-September 2014
Interim Report January–September 2014 l 6 November 2014

© 2014 Ramirent 34
Return on investment at 12.3% at the end of the third quarter
Return on investment % ROI % and Invested capital MEUR
17.5%
12.3%
0%
2%
4%
6%
8%
10%
12%
14%
16%
18%
20%
Q3/2013 Q3/2014
509.2
588.3 605.0 604.1 605.2
5.4%
13.2%
18.6%
17.5%
12.3%
0%
5%
10%
15%
20%
25%
0
100
200
300
400
500
600
700
Q1
2010
Q2 Q3 Q4 Q1
2011
Q2 Q3 Q4 Q1
2012
Q2 Q3 Q4 Q1
2013
Q2 Q3 Q4 Q1
2014
Q2 Q3
Rolling 12 months ROI at the end of Q3 was
12.3% (17.5%)
Return on investment decreased compared year-
on-year mainly due to lower profit generation
The Group's invested capital was close to last
year's level and amounted to 605.2 (604.1) at the
end of Q3/14
Interim Report January–September 2014 l 6 November 2014

© 2014 Ramirent 35
Return on equity at 12.0% at the end of the third quarter
Return on equity % ROE % and Total equity (MEUR)
16.9%
12.0%
0%
2%
4%
6%
8%
10%
12%
14%
16%
18%
20%
Q3/2013 Q3/2014
307.5 305.3
346.8 360.7
342.1
-0.6%
11.4%
18.7%
16.9%
12.0%
-5%
0%
5%
10%
15%
20%
25%
0
50
100
150
200
250
300
350
400
Q1
2010
Q2 Q3 Q4 Q1
2011
Q2 Q3 Q4 Q1
2012
Q2 Q3 Q4 Q1
2013
Q2 Q3 Q4 Q1
2014
Q2 Q3
Rolling 12 months ROE at the end of Q3 was
12.0% (16.9%)
Long-term financial target: ROE of 18% over a
business cycle
The Group's total equity amounted to MEUR 342.1
(360.7) at the end of Q3/14
Equity per share was 3.17 (3.35) at the of the
quarter
Interim Report January–September 2014 l 6 November 2014
Target 18%

© 2014 Ramirent © 2014 Ramirent 36
Group performance
Segment review
Market outlook
Key figures
Financial position
Company overview
Appendix

© 2014 Ramirent 37
Net debt to EBITDA ratio below long-term financial target
Net debt (MEUR) Net debt to EBITDA ratio
230
260
0
50
100
150
200
250
300
Q1
2013
Q2 Q3 Q4 Q1
2014
Q2 Q3
1.7x 1.7x
1.2x
1.1x
1.5x
0.0
0.5
1.0
1.5
2.0
2.5
Q12010
Q2 Q3 Q4 Q12011
Q2 Q3 Q4 Q12012
Q2 Q3 Q4 Q12013
Q2 Q3 Q4 Q12014
Q2 Q3
Net debt MEUR 259.7 (230.3) at the end of
Q3/14
Net debt increased by 12.7% (y-o-y)
Net debt to EBITDA 1.5x (1.1x) at the end of
September, which was below Ramirent's long-
term financial target of maximum 1.6x at the end
of each fiscal year
Interim Report January–September 2014 l 6 November 2014

© 2014 Ramirent 38
Equity ratio and gearing weakened slightly year-on-year
Equity ratio (%) Gearing (%)
45.2% 42.8%
0%
10%
20%
30%
40%
50%
60%
Q1
2013
Q2 Q3 Q4 Q1
2014
Q2 Q3
63.9%
75.9%
0%
10%
20%
30%
40%
50%
60%
70%
80%
90%
Q1
2013
Q2 Q3 Q4 Q1
2014
Q2 Q3
Third-quarter equity ratio decreased to 42.8%
(45.2%)
Total equity amounted to MEUR 342.1 (360.7) at the
end of the quarter
Third-quarter gearing increased to 75.9% (63.9%)
Net debt MEUR 259.7 (230.3) at the end of the
quarter
Interim Report January–September 2014 l 6 November 2014

© 2014 Ramirent 39
An ordinary dividend of EUR 0.37 per share was paid and the
AGM authorised the Board to decide on a potential additional
dividend of up to EUR 0.63 per share
Earnings Per Share and Dividend Per Share
0.04
0.13
0.41
0.59
0.50
0.15
0.25 0.28
0.34
0.00
0.10
0.20
0.30
0.40
0.50
0.60
0.70
0.80
0.90
1.00
2009 2010 2011 2012 2013
EPS DPS
Ordinary dividend of EUR 0.37 per share paid in April 2014 representing a payout ratio of 73.7% (57.6%) for fiscal year 2013
Potential for an additional dividend of up to EUR 0.63 per share for fiscal year 2013, which would represent a total payout ratio of up to 199% for fiscal year 2013
Long-term financial target: Dividend payout ratio at least 40% of net profit
1.00
0.37
0.63
Interim Report January–September 2014 l 6 November 2014

© 2014 Ramirent 40
Working capital at 6.4% of net sales
Working capital (MEUR) Working capital / Rolling 12 months net sales
5.3% 5.6% 5.5% 5.6%
6.4%
-6.0%
-4.0%
-2.0%
0.0%
2.0%
4.0%
6.0%
8.0%
10.0%
12.0%
Q1
2010
Q2 Q3 Q4 Q1
2011
Q2 Q3 Q4 Q1
2012
Q2 Q3 Q4 Q1
2013
Q2 Q3 Q4 Q1
2014
Q2 Q3
14.4 12.0
125.3 121.1
-102.0 -93.3
-200
-150
-100
-50
0
50
100
150
200
Q12013
Q2 Q3 Q4 Q12014
Q2 Q3
Trade payables and other liabilities
Trade and other receivables
Inventories
Credit losses and change in the allowance for bad
debt:
7-9/2014: MEUR -1.0 (-0.3)
1-9/2014: MEUR -2.5 (-3.2)
Working capital of rolling 12 months net sales
6.4% (5.6%) at the end of September
Dividend of MEUR 39.8 (36.6) paid in April 2014
Interim Report January–September 2014 l 6 November 2014

© 2014 Ramirent 41
At the end of September 2014, Ramirent had unused committed back–up loan facilities of MEUR 156.4
Repayment schedule of interest-bearing liabilities (MEUR) Ramirent had unused committed back-up loan facilities of MEUR 156.4 available at the end of the third quarter
The average interest rate of the loan portfolio including interest rate hedges was 2.8% (3.9%) at the end of the third quarter
In addition to bank facilities, Ramirent is utilising a domestic commercial paper program of up to EUR 150 million
Net debt EUR 259.7 million
EUR 415.0 million in committed credit facilities
Interim Report January–September 2014 l 6 November 2014
Senior unsecured bond
75
95
100
145
2014 2015 2016 2017 2018 2019 2020

© 2014 Ramirent 42
Two of our long-term financial targets were met in Q3/2014
Leverage and risk
Profit generation
Dividend
Element Target level
ROE
Net Debt / EBITDA
ratio
Dividend pay-out
ratio
18% p.a. over a business cycle
Below 1.6x at the end of each fiscal year
At least 40% of Net profit
Measure Q3/2014
12.0%
1.5x
73.7% of 2013 net profit
STATED OBJECTIVES
Interim Report January–September 2014 l 6 November 2014

For further information:
Magnus Rosén, President and CEO, tel. +358 20 750 2845 Jonas Söderkvist, CFO, tel. +358 20 750 3248 Franciska Janzon, IR, tel. +358 20 750 2859
www.ramirent.com

© 2014 Ramirent © 2014 Ramirent 44
Group performance
Segment review
Market outlook
Key figures
Financial position
Company overview
Appendix

© 2014 Ramirent
Ramirent is a generalist equipment rental and service company
45
Where
Geographic presence
Home market Europe with focus on the Baltic Rim
How
Concept Ramirent is a generalist rental company, with an extensive customer centre network enabling customer proximity while managing through decentralised operations
What
Offering Ramirent’s business offering stretches from single products to managing the entire fleet capacity at a customer site
Who
Customers Ramirent’s diverse customer base includes construction, industry, services, the public sector and private households
302 customer centres in 10
countries
2,621 employees serving 200,000 customers with
200,000 rental items
MEUR 647 of sales (2013)
Definition of Ramirent's business and strategic choices
Interim Report January–September 2014 l 6 November 2014

© 2014 Ramirent 46
Vision
To be the leading and most progressive equipment rental solutions company in Europe, setting the benchmark for industry performance and customer service
Values Open
Engaged
Progressive
Mission
We simplify business by delivering Dynamic Rental SolutionsTM
Brand promise
More than Machines
Our strategic choices
Interim Report January–September 2014 l 6 November 2014

© 2014 Ramirent 47
We increased geographical focus on core Baltic Rim markets and widened the customer base
Europe Central
(PL+CZ+SL)
# 1 59 customer
centres
Finland # 1
67 customer centres
Sweden # 2
75 customer centres
Norway # 1
43 customer centres
Denmark # 1
16 customer centres
Europe East –Baltics
# 1 42 customer
centres
Finland 25%
Sweden 32%
Norway 22%
Denmark 6%
Europe East -Baltics
5%
Europe Central 9%
Sales per customers 1-9/2014
Construction 63% Industrial
18%
Services & Retail 13%
Public 4%
Private 2%
Current state close to target of 40% non-construction dependent sales
Russia and Ukraine presence through JV Fortrent
Sales per segment 1-9/2014
Interim Report January–September 2014 l 6 November 2014

© 2014 Ramirent Event / Name of presentor 48
0 200 400 600 800 1000
Loxam
Cramo
Ramirent
Algeco
Scotsman
Kiloutou
Sarens
Speedy Hire
Liebherr-
Mietpartner
Mediaco Levage
Zeppelin Rental
Net sales 2013 (MEUR) Net sales 2013 (MEUR)
Largest rental companies in Europe Largest rental companies globally
One of the leading equipment rental companies both in Europe (#3) and globally (#10)
0 1000 2000 3000 4000
United Rentals
Aggreko
Ashtead Group
Algeco
Scotsman
Herz Equipment
Rental
Aktio Corp
Loxam
Coates Hire
Cramo
Ramirent
Source: IRN June 2014
Interim Report January–September 2014 l 6 November 2014

49
Our offering
MODULE AND SITE EQUIPMENT
HEAVY MACHINERY ACCESS EQUIPMENT
PLANNING
LIGHT EQUIPMENT
LOGISTICS
ON-SITE SERVICES
RENTAL INSURANCE
TRAINING ACCESSORIES
Ramirent SpaceSolveTM
Ramirent SafeSolveTM
Ramirent EcoSolveTM
Ramirent PowerSolveTM
Ramirent ClimateSolveTM
Ramirent AccessSolveTM
Ramirent TotalSolveTM
MACHINERY AND EQUIPMENT SERVICES
SOLUTION AREAS

© 2014 Ramirent 50
Equipment Services
Rental Business and Sector Knowledge
Benefits Lighter balance sheets, less investments
Benefits More uptime in core operations due to less downtime in equipment, less maintenance costs, right choice of equipment improves efficiency, less product liability risk
Benefits Understanding customer requirements helps to customise product selection and further improve productivity
Heavy Equipment
Access Equipment Lifts, Hoists,
Scaffolding, Tower cranes
Modules and site equipment
Light Equipment Tools, power and heating
equipment
• Planning
• On-site services
• Logistics
• Merchandise sale
• Rental insurance
• Training
• Construction
• Mining
• Paper
• Power generation
• Oil & Gas
• Shipyards
• Retail & Service
• Public sector
• Households
Integrated Solutions
Benefits Easy to buy, reduced number of subcontractors, increased focus on the core business
Ramirent combines the best equipment, services and knowhow into integrated rental solutions
Interim Report January–September 2014 l 6 November 2014
6%
34%
23%
38%
Share of Group equipment rental income (1-9/2014)

© 2014 Ramirent
Customer First
Common Ramirent Platform
Sustainable profitable
growth
Balanced business portfolio
51
Ramirent's strategic priorities
Strong local customer orientation and tailored offerings
Increased synergies & operational excellence
Further widening the customer base
Interim Report January–June 2014 l 29 July 2014

© 2014 Ramirent 52
Increased market share
Growth within current business
Extended customer value
proposition
Increasing services and integrated solutions
Increased penetration
Outsourcing opportunities
Increased footprint
New customer segments
New geographies
M&A
Acquisitions, joint ventures
and other transactions
1 2 3 4 5
Interim Report January–September 2014 l 6 November 2014
The five components of Ramirent's growth strategy

© 2014 Ramirent 53
Room for rental penetration to further increase in the Nordic countries
Equipment rental penetration 2014E (%)
3.5%
2.0%
1.5% 1.7%
Rental penetration (%)*
Sweden Norway Finland Denmark
Source: European Rental Association 10/2014; Rental Turnover / Total construction output
HIG
H
ME
DIU
M
LO
W
Average penetration in Europe: 1.5%
Interim Report January–September 2014 l 6 November 2014

© 2014 Ramirent 54
Ramirent has seen significant growth through outsourcing and acquisitions
Outsourcing deal in Finland
Acquisition of Finnish weather protection
rental company
Aquisition of Czech rental
business Acquisition of Czech
rental business
Acquisition of Swedish rental
company Acquisition of Danish rental
business
Acquisition of module rental company in Norway
Outsourcing of Mt Hojgaard's Danish scaffolding division
Acquisition of Swedish rental company
Acquisition of Swedish rental
company
Outsourcing deal in Norway
Joint venture in Russia and Ukraine
with Cramo
2011 - 2012 2013
Outsourcing deal in Finland
Divestment of operations in
Hungary
Formworks partnership with Doka in Finland
Extending geography to “white spots”
Complimentary product ranges or related services
Strengthening links to new customer segments
Targets mid-size companies mainly
Outsourcing of customer’s in-house fleets
Criteria
Proven track record of accretive acquisitions made at attractive multiples tied to earn-outs
Outsourcing deal in Denmark
2014
Acquisition of safety solutions
specialist company in Sweden
Acquisition of telehandler
business in Finland
DCC (Dry Construction
Concept) business in Sweden,
Denmark and Finland
Outsourcing deal in Finland
Joint Venture* with Zeppelin Rental in Fehmarnbelt tunnel construction project
in Germany and Denmark
*Subject to relevant authorities approval Interim Report January–September 2014 l 6 November 2014

© 2014 Ramirent 55
Ramirent's Financial Business Model: Three complimentary drivers of value creation
• Volumes • Upselling
• Pricing • Fleet management • Sourcing • Cost structure • Quality of earnings
• Cash conversion • Capex • Working capital • Dividend • Capital Structure
Organic Growth Operating Leverage Financial Leverage
Cash Flow
Target EBITA margin of 17% by the end of 2016
Net debt/ EBITDA target of below 1.6x (at y/e)
Capital
Expenditure
ROE target of 18% over the cycle
Dividend pay-out ratio of at least 40% of
net profit
Interim Report January–September 2014 l 6 November 2014

© 2014 Ramirent 56
Customer
service level
Total costs
Non- available
fleet
Capital efficiency
Optimising fleet maintenance strategy
Resourcing and repair & maintenance locations
Optimising workshop processes
Balanced fleet age structure
Fleet management activities
Efficiency utilisation* (%) R3 months
Total Fleet Yield** (%) R3 months
∗) 𝐸𝑓𝑓𝑖𝑐𝑖𝑒𝑛𝑐𝑦 𝑢𝑡𝑖𝑙𝑖𝑠𝑎𝑡𝑖𝑜𝑛 =𝐴𝑐𝑞𝑢𝑖𝑠𝑖𝑡𝑖𝑜𝑛 𝑣𝑎𝑙𝑢𝑒 𝑜𝑓 𝑟𝑒𝑛𝑡𝑒𝑑 𝑓𝑙𝑒𝑒𝑡
𝐴𝑐𝑞𝑢𝑖𝑠𝑖𝑡𝑖𝑜𝑛 𝑣𝑎𝑙𝑢𝑒 𝑜𝑓 𝑡𝑜𝑡𝑎𝑙 𝑓𝑙𝑒𝑒𝑡∗ 100 %
∗∗) 𝑇𝑜𝑡𝑎𝑙 𝐹𝑙𝑒𝑒𝑡 𝑌𝑖𝑒𝑙𝑑 =𝑅𝑒𝑛𝑡𝑎𝑙 𝑖𝑛𝑐𝑜𝑚𝑒 ∗ 100 %
𝐴𝑐𝑞𝑢𝑖𝑠𝑖𝑡𝑖𝑜𝑛 𝑣𝑎𝑙𝑢𝑒 𝑜𝑓 𝑡𝑜𝑡𝑎𝑙 𝑓𝑙𝑒𝑒𝑡
Goals KPIs
Efficient logistics
Fleet management potential realised at different levels
Interim Report January–September 2014 l 6 November 2014
30%
35%
40%
45%
50%
55%
60%
65%
Dec 0
9
Mar
10
Jun 1
0
Sep 1
0
Dec 1
0
Mar
11
Jun 1
1
Sep 1
1
Dec 1
1
Mar
12
Jun 1
2
Sep 1
2
Dec 1
2
Mar
13
Jun 1
3
Sep 1
3
Dec 1
3
Mar
14
Jun 1
4
Sep 1
4
20%
25%
30%
35%
40%
45%
50%
Dec 0
9
Mar
10
Jun 1
0
Sep 1
0
Dec 1
0
Mar
11
Jun 1
1
Sep 1
1
Dec 1
1
Mar
12
Jun 1
2
Sep 1
2
Dec 1
2
Mar
13
Jun 1
3
Sep 1
3
Dec 1
3
Mar
14
Jun 1
4
Sep 1
4

© 2014 Ramirent 57
Market Cap EUR 677.2 million
Trading information Listing: NASDAX OMX Helsinki Date of listing: April 30, 1998
Segment: Mid Cap Sector: Industrials
Trading code: RMR1V
16%
28%
9% 11%
2%
34%
Private companies
Financial and insurance institutions
Public sector organizations
Households
Non-profit organizations
Foreigners
Shareholders September 30, 2014
Largest shareholders September 30, 2014
Number of shares
% of share
capital
1. Nordstjernan AB 31,303,716 28.80%
2. Oy Julius Tallberg Ab 12,207,229 11.23%
3. Nordea funds 5,043,904 4.64%
4. Varma Mutual Pension Insurance Company 4,113,799 3.78%
5. Ilmarinen Mutual Pension Insurance Company 3,945,154 3.63%
6. Odin funds 2,758,691 2.54%
8. Aktia funds 2,275,562 2.09%
9. Fondita funds 1,055,000 0.97%
10. Oslo Pensjonsforsikring As 800,000 0.74%
Ramirent Plc 973,957 0.90%
Other shareholders 44,220,316 40.68%
Total 108,697,328 100.00%
Largest shareholders at the end of September 2014
Interim Report January–September 2014 l 6 November 2014

© 2014 Ramirent 58
Share price development year-to-date
Ramirent Plc (RMR1V)
Index
Interim Report January–September 2014 l 6 November 2014
0
20
40
60
80
100
120
Jan-14 Feb-14 Mar-14 Apr-14 May-14 Jun-14 Jul-14 Aug-14 Sep-14 Oct-14 Nov-14
RMR1V
Nasdaq Helsinki
Nasdaq Helsinki Mid-Cap
(6.35 Nov. 4, 2014)

© 2014 Ramirent
Attractive market - structural growth drivers and cyclical recovery potential
Number 1 position - market leader in 7/10 countries
Strong platform - above industry average profitability, balanced risk level and increasing operational excellence
Growth potential - 5 point growth strategy to capitalise on strong position
Financial strength – industry leading cash generation and leverage potential to finance growth, drive ROE and increase dividends
Proven management track record – experienced management has reshaped the company since 2008
59
Return on equity of 18% over a business cycle
YE net debt to EBITDA of below 1.6x
Dividend pay-out ratio of at least 40% of net profit
EBITA margin of 17% by the end of 2016
How will we deliver on our financial targets and create shareholder value?
Company highlights Stated objectives
Interim Report January–September 2014 l 6 November 2014

© 2014 Ramirent © 2014 Ramirent 60
Group performance
Segment review
Market outlook
Key figures
Financial position
Company overview
Appendix

© 2014 Ramirent 61
Consolidated statement of income
Interim Report January–September 2014 l 6 November 2014
CONSOLIDATED STATEMENT OF INCOME 7–9/14
7–9/13
1–9/14
1–9/13
1–12/13
(EUR 1,000)
Rental income 107,672 112,764 292,541 316,133 420,895
Ancillary income 50,041 47,830 143,219 146,186 198,040
Sales of equipment 5,839 5,574 17,115 17,471 28,317
NET SALES 163,551 166,168 452,875 479,791 647,252
Other operating income 958 827 2,111 12,524 12,732
Materials and services −52,955 −51,876 −149,375 −152,064 −213,169
Employee benefit expenses −37,690 −39,625 −112,287 −120,813 −156,791
Other operating expenses −20,407 −24,099 −65,378 −70,277 −95,660
Share of result in associates and joint ventures 476 572 −106 −353 688
Depreciation, amortisation and impairment charges −27,905 −27,638 −82,217 −85,501 −112,768
EBIT 26,028 24,330 45,623 63,307 82,284
Financial income 3,195 3,207 7,365 13,031 15,639
Financial expenses −5,546 −6,946 −16,945 −25,302 −34,055
Total financial income and expenses −2,351 −3,739 −9,580 −12,270 −18,415
EBT 23,677 20,590 36,044 51,037 63,869
Income taxes −5,402 −3,776 −8,207 −10,907 −9,839
PROFIT FOR THE PERIOD 18,276 16,814 27,837 40,130 54,030
Profit for the period attributable to:
Owners of the parent company 18,435 16,814 28,142 40,130 54,030
Non-controlling interest −160 − −304 − −
18,276 16,814 27,837 40,130 54,030
Earnings per share (EPS) on parent company shareholders’ share of profit
Basic, EUR 0.17 0.16 0.26 0.37 0.50
Diluted, EUR 0.17 0.16 0.26 0.37 0.50

© 2014 Ramirent 62
Interim Report January–September 2014 l 6 November 2014
CURRENT ASSETS
Inventories 12,015 14,434 11,494
Trade and other receivables 121,148 125,300 109,207
Current tax assets 4,042 3,351 1,495
Cash and cash equivalents 3,436 13,118 1,849
TOTAL CURRENT ASSETS 140,642 156,202 124,045
TOTAL ASSETS 799,143 797,687 759,477
CONSOLIDATED STATEMENT OF FINANCIAL POSITION 30/9/2014
30/9/2013
31/12/2013
(EUR 1,000)
ASSETS
NON–CURRENT ASSETS
Goodwill 142,460 126,590 124,825
Other intangible assets 46,613 37,894 38,427
Property, plant and equipment 434,694 436,012 432,232
Investments in associates and joint ventures 14,747 19,026 18,524
Non–current loan receivables 18,254 20,261 20,261
Available–for–sale investments 150 412 517
Deferred tax assets 1,582 1,291 647
TOTAL NON–CURRENT ASSETS 658,500 641,486 635,432
Consolidated statement of financial position

© 2014 Ramirent 63
CONSOLIDATED STATEMENT OF FINANCIAL POSITION 30/9/2014
30/9/2013
31/12/2013
Consolidated statement of financial position (continued)
Interim Report January–September 2014 l 6 November 2014
(EUR 1,000)
EQUITY AND LIABILITIES
EQUITY
Share capital 25,000 25,000 25,000
Revaluation fund −724 −3,376 −1,502
Invested unrestricted equity fund 113,767 113,568 113,568
Retained earnings from previous years 174,980 185,368 179,882
Profit for the period 28,142 40,130 54,030
Equity attributable to the parent company shareholders 341,165 360,690 370,978
Non-controlling interest 950 − −
TOTAL EQUITY 342,114 360,690 370,978
NON–CURRENT LIABILITIES
Deferred tax liabilities 54,731 57,417 54,286
Pension obligations 17,600 14,806 13,923
Non–current provisions 2,399 1,379 1,198
Non–current interest–bearing liabilities 207,256 243,405 174,981
Other non–current liabilities 19,963 5,546 −
TOTAL NON–CURRENT LIABILITIES 301,949 322,553 244,388
CURRENT LIABILITIES
Trade payables and other liabilities 93,271 101,973 104,369
Current provisions 1,219 1,128 664
Current tax liabilities 4,727 11,303 5,278
Current interest–bearing liabilities 55,863 40 33,800
TOTAL CURRENT LIABILITIES 155,079 114,444 144,111
TOTAL LIABILITIES 457,028 436,997 388,499
TOTAL EQUITY AND LIABILITIES 799,143 797,687 759,477
© 2014 Ramirent 64
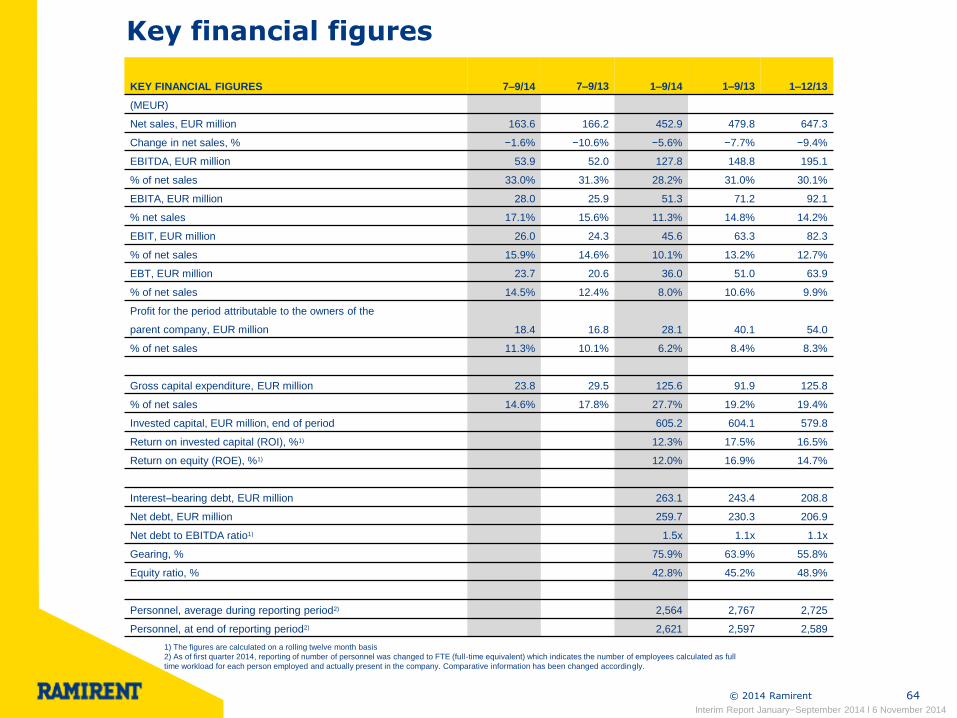
Key financial figures
1) The figures are calculated on a rolling twelve month basis
2) As of first quarter 2014, reporting of number of personnel was changed to FTE (full-time equivalent) which indicates the number of employees calculated as full
time workload for each person employed and actually present in the company. Comparative information has been changed accordingly.
Interim Report January–September 2014 l 6 November 2014
KEY FINANCIAL FIGURES 7–9/14
7–9/13
1–9/14
1–9/13
1–12/13
(MEUR)
Net sales, EUR million 163.6 166.2 452.9 479.8 647.3
Change in net sales, % −1.6% −10.6% −5.6% −7.7% −9.4%
EBITDA, EUR million 53.9 52.0 127.8 148.8 195.1
% of net sales 33.0% 31.3% 28.2% 31.0% 30.1%
EBITA, EUR million 28.0 25.9 51.3 71.2 92.1
% net sales 17.1% 15.6% 11.3% 14.8% 14.2%
EBIT, EUR million 26.0 24.3 45.6 63.3 82.3
% of net sales 15.9% 14.6% 10.1% 13.2% 12.7%
EBT, EUR million 23.7 20.6 36.0 51.0 63.9
% of net sales 14.5% 12.4% 8.0% 10.6% 9.9%
Profit for the period attributable to the owners of the
parent company, EUR million 18.4 16.8 28.1 40.1 54.0
% of net sales 11.3% 10.1% 6.2% 8.4% 8.3%
Gross capital expenditure, EUR million 23.8 29.5 125.6 91.9 125.8
% of net sales 14.6% 17.8% 27.7% 19.2% 19.4%
Invested capital, EUR million, end of period 605.2 604.1 579.8
Return on invested capital (ROI), %1) 12.3% 17.5% 16.5%
Return on equity (ROE), %1) 12.0% 16.9% 14.7%
Interest–bearing debt, EUR million 263.1 243.4 208.8
Net debt, EUR million 259.7 230.3 206.9
Net debt to EBITDA ratio1) 1.5x 1.1x 1.1x
Gearing, % 75.9% 63.9% 55.8%
Equity ratio, % 42.8% 45.2% 48.9%
Personnel, average during reporting period2) 2,564 2,767 2,725
Personnel, at end of reporting period2) 2,621 2,597 2,589

© 2014 Ramirent 65
Consolidated cash flow statement
Interim Report January–September 2014 l 6 November 2014
CONSOLIDATED CASH FLOW STATEMENT 7–9/14
7–9/13
1–9/14
1–9/13
1–12/13
(EUR 1,000)
CASH FLOW FROM OPERATING ACTIVITIES
EBT 23,677 20,590 36,044 51,037 63,869
Adjustments
Depreciation, amortisation and impairment charges 27,905 27,638 82,217 85,501 112,768
Adjustment for proceeds from sale of used rental equipment 3,231 1,304 14,101 7,703 8,975
Financial income and expenses 2,351 3,739 9,580 12,270 18,415
Adjustment for proceeds from disposals of subsidiaries − −5,481 − −15,609 −15,609
Other adjustments −4,538 20,035 −3,520 18,195 4,735
Cash flow from operating activities before change in working capital 52,626 67,826 138,422 159,098 193,153
Change in working capital
Change in trade and other receivables −9,242 7,022 −11,257 8,046 18,994
Change in inventories 1,057 1,196 −481 816 3,114
Change in non–interest–bearing liabilities −3,778 −13,829 −21,077 −17,868 −5,724
Cash flow from operating activities before interest and taxes 40,663 62,214 105,606 150,091 209,537
Interest paid −1,975 −2,972 −9,820 −8,022 −5,270
Interest received 256 549 959 1,857 1,047
Income tax paid −3,293 −2,566 −9,953 −17,153 −23,068
NET CASH FLOW FROM OPERATING ACTIVITIES 35,650 57,226 86,791 126,773 182,245

© 2014 Ramirent 66
Consolidated cash flow statement (continued)
CONSOLIDATED CASH FLOW STATEMENT 7–9/14
7–9/13
1–9/14
1–9/13
1–12/13
Interim Report January–September 2014 l 6 November 2014
CASH FLOW FROM INVESTING ACTIVITIES
Acquisition of businesses and subsidiaries, net of cash − − −27,272 − −2,832
Investment in tangible non–current asset (rental machinery) −19,809 −26,928 −72,576 −85,339 −110,115
Investment in other tangible non–current assets −239 −890 −817 −2,465 −2,825
Investment in intangible non–current assets −2,897 −588 −6,356 −4,121 −6,503
Proceeds from sale of tangible and intangible non–current assets
(excluding used rental equipment) − 138 7,482 262 360
Proceeds from sales of other investments − 5,481 − 14,681 14,681
Loan receivables, increase, decrease and other changes 1,006 − 2,006 −1,577 −1,577
NET CASH FLOW FROM INVESTING ACTIVITIES −21,939 −22,786 −97,534 −78,560 −108,812
CASH FLOW FROM FINANCING ACTIVITIES
Paid dividends − − −39,858 −36,618 −36,618
Borrowings and repayments of current debt (net) −22,621 −21,545 57,442 −49,719 −49,771
Borrowings of non–current debt − 37 − 99,113 99,031
Repayments of non–current debt −9 −2,906 −5,255 −49,210 −85,565
NET CASH FLOW FROM FINANCING ACTIVITIES −22,630 −24,414 12,330 −36,433 −72,923
NET CHANGE IN CASH AND CASH EQUIVALENTS
DURING THE FINANCIAL YEAR −8,919 10,026 1,588 11,780 511
Cash at the beginning of the period 12,356 3,093 1,849 1,338 1,338
Translation differences − − − − −
Change in cash −8,919 10,026 1,588 11,780 511
Cash at the end of the period 3,436 13,118 3,436 13,118 1,849
Presentation of the figures in the consolidated cash flow statement for January–June 2014 has been adjusted and consolidated cash flow statement for January–September
2014 has been adjusted accordingly. After adjustment the cash flows reflect better the impact of acquired businesses.
© 2014 Ramirent 67
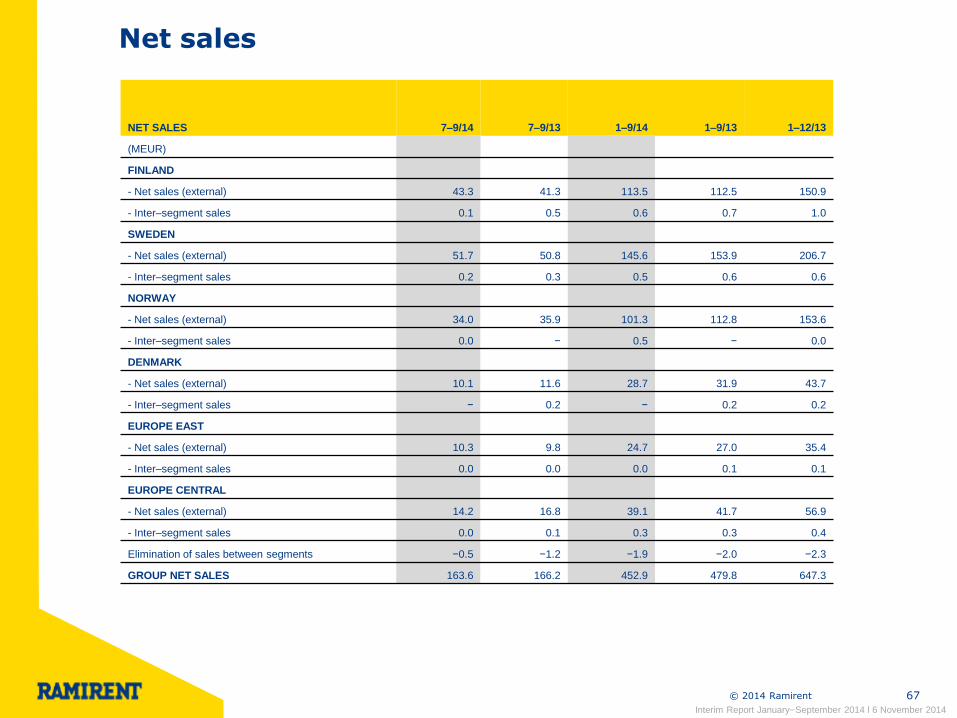
Net sales
Interim Report January–September 2014 l 6 November 2014
NET SALES 7–9/14
7–9/13
1–9/14
1–9/13
1–12/13
(MEUR)
FINLAND
- Net sales (external) 43.3 41.3 113.5 112.5 150.9
- Inter–segment sales 0.1 0.5 0.6 0.7 1.0
SWEDEN
- Net sales (external) 51.7 50.8 145.6 153.9 206.7
- Inter–segment sales 0.2 0.3 0.5 0.6 0.6
NORWAY
- Net sales (external) 34.0 35.9 101.3 112.8 153.6
- Inter–segment sales 0.0 − 0.5 − 0.0
DENMARK
- Net sales (external) 10.1 11.6 28.7 31.9 43.7
- Inter–segment sales − 0.2 − 0.2 0.2
EUROPE EAST
- Net sales (external) 10.3 9.8 24.7 27.0 35.4
- Inter–segment sales 0.0 0.0 0.0 0.1 0.1
EUROPE CENTRAL
- Net sales (external) 14.2 16.8 39.1 41.7 56.9
- Inter–segment sales 0.0 0.1 0.3 0.3 0.4
Elimination of sales between segments −0.5 −1.2 −1.9 −2.0 −2.3
GROUP NET SALES 163.6 166.2 452.9 479.8 647.3

© 2014 Ramirent 68
EBITA
Interim Report January–September 2014 l 6 November 2014
EBITA 7–9/14
7–9/13
1–9/14
1–9/13
1–12/13
(MEUR)
FINLAND 8.3 10.2 17.2 19.7 25.7
% of net sales 19.0% 24.5% 15.1% 17.4% 16.9%
SWEDEN 8.9 8.6 19.9 25.5 36.6
% of net sales 17.2% 16.8% 13.6% 16.5% 17.6%
NORWAY 4.0 6.3 10.8 19.2 22.0
% of net sales 11.8% 17.6% 10.6% 17.0% 14.3%
DENMARK −0.1 −2.0 −3.0 −3.5 −4.3
% of net sales −1.2% −17.3% −10.4% −11.0% −9.7%
EUROPE EAST 3.7 3.5 4.6 14.6 17.3
% of net sales 35.8% 35.6% 18.5% 53.8% 48.8%
EUROPE CENTRAL 1.6 1.2 1.2 −0.8 −0.7
% of net sales 11.3% 7.0% 3.0% −1.9% −1.2%
Net items not allocated to segments 1.61) −1.8 0.7 −3.4 −4.6
GROUP EBITA 28.0 25.9 51.3 71.2 92.1
% of net sales 17.1% 15.6% 11.3% 14.8% 14.2%
1) Third-quarter net items not allocated to segments amounted to EUR 1.6 (-1.8) million due to reallocation of certain costs incurred in previous periods from
Ramirent Plc to the segments. The reallocated costs have been accrued as expenses in the respective segment for Q3 2014.

© 2014 Ramirent 69
Net sales in 1-9/2013 included business in Russia, Ukraine and Hungary
Net sales: Group, Russia & Ukraine, Hungary
EBITA: Group, Russia & Ukraine, Hungary
Net sales, MEUR Q1/2013 Q2/2013 Q3/2013 Q4/2013 Q1/2014 Q2/2014 Q3/2014
Group as reported 152.8 160.8 166.2 167.5 137.5 151.8 163.6
Russia & Ukraine 4.6
Hungary 1.5 1.7 1.6
Group (excl. Russia, Ukraine & Hungary) 146.7 159.1 164.6 167.5 137.5 151.8 163.6
EBITA, MEUR Q1/2013 Q2/2013 Q3/2013 Q4/2013 Q1/2014 Q2/2014 Q3/2014
Group as reported 22.6 22.7 25.9 20.9 7.1 16.2 28.0
Russia & Ukraine (incl. capital gain) 11.4
Hungary (incl. capital loss) -0.2 0.1 -1.3
Group (excl. Russia, Ukraine & Hungary) 11.4 22.6 27.3 20.9 7.1 16.2 28.0
Interim Report January–September 2014 l 6 November 2014

For further information:
Magnus Rosén, President and CEO, tel. +358 20 750 2845 Jonas Söderkvist, CFO, tel. +358 20 750 3248 Franciska Janzon, IR, tel. +358 20 750 2859
www.ramirent.com