Ramachandran Plot in Python - azevedolab.net · Python to generate Ramachandran plots. Information...
18
© 2016 Dr. Walter F. de Azevedo Jr. 1 www.python.org
Transcript of Ramachandran Plot in Python - azevedolab.net · Python to generate Ramachandran plots. Information...

©2
01
6 D
r. W
alter
F.
de
Aze
ve
do
Jr.
1
www.python.org

In the 1960s, G. N. Ramachandran, C.
Ramakrishnan, and V. Sasisekharan
(1963) proposed a methodology to
evaluate stereochemical quality of protein
models. The basic idea is to investigate
the allowed regions for a two-dimensional
plot of main-chain torsion angles. These
torsion angles, referred to as phi and psi
are illustrated in the figure on the right.
CA
C
O
N
CB
i
i+1
i + 2
i + 3
CAC
N
CB
O
NCA
2
Ramachandra Plot
www.python.org
i is for residue number.

Here we describe a program written in
Python to generate Ramachandran plots.
Information to generate plots is based on
the atomic coordinates of a protein
structure in the PDB format. In the
Ramachandran plot, the x-axis is for phi
() angle and y-axis is for psi (). Both
axis range from -180o to +180o, as shown
in the plot on the right.
(o)
(o
)
3
Ramachandra Plot
www.python.org

4
Below we have a typical line for atomic coordinates in a Protein Data Bank (PDB) file.
Each field brings a specific information related to the atoms in the structure. These
lines starts either with “ATOM ” or “HETATM” strings. Additional information for each
field is given red.
ATOM 1 N MET A 1 101.710 112.330 93.759 1.00 48.54 N
Columns ranging from 1 to 6 for “ATOM “ or “HETATM” strings, they are assigned to line[0:6] variable
Columns ranging from 7 to 11 for atom order, they are assigned to line[6:11] variable
Columns ranging from 14 to 15 for atom name, they are assigned to line[13:15]
variable
Columns ranging from 18 to 20 for residue or ligand name, they are assigned to line[17:20] variable
Colum 22 for chain identification, it is assigned to line[21:22] variable
Columns ranging from 23 to 26 for residue/ligand number, they are assigned to
line[22:26] variable
Columns ranging from 32 to 53 for atomic coordinates, they are assigned to
line[30:38], line[38:46], line[46:54] variables
Columns ranging from 57 to 60 for occupancy, they are assigned to
line[56:60] variable
Protein Data Bank
www.python.org

5
Last fields are indicated below.
Columns ranging from 62 to 65 for B-values, they are assigned to line[61:65] variable
Colunan 77-77 for chemical element, it is assigned to line[76:77] vairable
Besides the fields indicated beforehand, we have a field
for segment identification, columns ranging from 73 to
76, which are assigned to line[72:76] variable. In
addition, we have a field for atomic charge, columns
ranging from 79 to 80), which are assigned to line[78:80]
variable.
ATOM 1 N MET A 1 101.710 112.330 93.759 1.00 48.54 N
Protein Data Bank
www.python.org
Abstract
Program to generate two-dimensional plot of protein srtuctures. This program reads a file
in the Protein Data Bank (PDB) (Berman, Westbrook, Feng et al. 2000; Berman, Battistuz,
Bhat et al. 2002; Westbrook et al., 2003) format and generates the Ramachandran plot for
the structure.
Ramachandran Plot
Program: rama_plot.py
6
Program: rama_plot.py
www.python.org

# Main function
def main():
# Call function to read PDB
my_list_of_atoms = read_PDB()
# Call function to calculate torsion angles
phi,psi = calc_torsion(my_list_of_atoms)
# Call function to plot torsion angles
plot_2_arrays(phi,psi,"Phi(deg)","Psi(deg)")
# Main program
main()7
In the main program we call read_PDB() function, which reads a PDB file and returns a
list with all lines that starts with “ATOM “. To calculate torsion angles, we call
calc_torsion() function, which returns two arrays with torsion angles for each residue in
the structure, and finally call plot_2_arrays() function. Below we have the main
program.
Program: bfactor_plot.py (main program)
www.python.org

def read_PDB():
"""Function to read a PDB file"""
# Import library
import sys
# Set up empty list
my_atoms = []
# Call read_file_name() function
input_file_name = read_file_name()
# Try to open PDB file
try:
# Open PDB file
my_fo = open(input_file_name,"r")
except IOError:
print("Error! I can't find file ",input_file_name)
sys.exit("Finishing program execution!")
# Looping through PDB file content
for line in my_fo:
if line[0:6] == "ATOM " or line[0:6] == "HETATM":
my_atoms.append(line)
# Close file
my_fo.close()
# Return list
return my_atoms
8
Initially, we set up an empty list,
named my_atoms. Then we call
read_file_name() function, which
reads the input file name. At this
point, we open this file, and assigns
its content to a file object, named
my_fo.
After we have for loop, which loops
through my_fo and assigns all
coordinate lines to my_atoms list.
Then, we close the file and return
my_atoms list..
Function: read_PDB()
www.python.org
def read_file_name():
"""Function to read file name"""
# Read input file name
my_file = input("Type input file name => ")
# Return input file name
return my_file
9
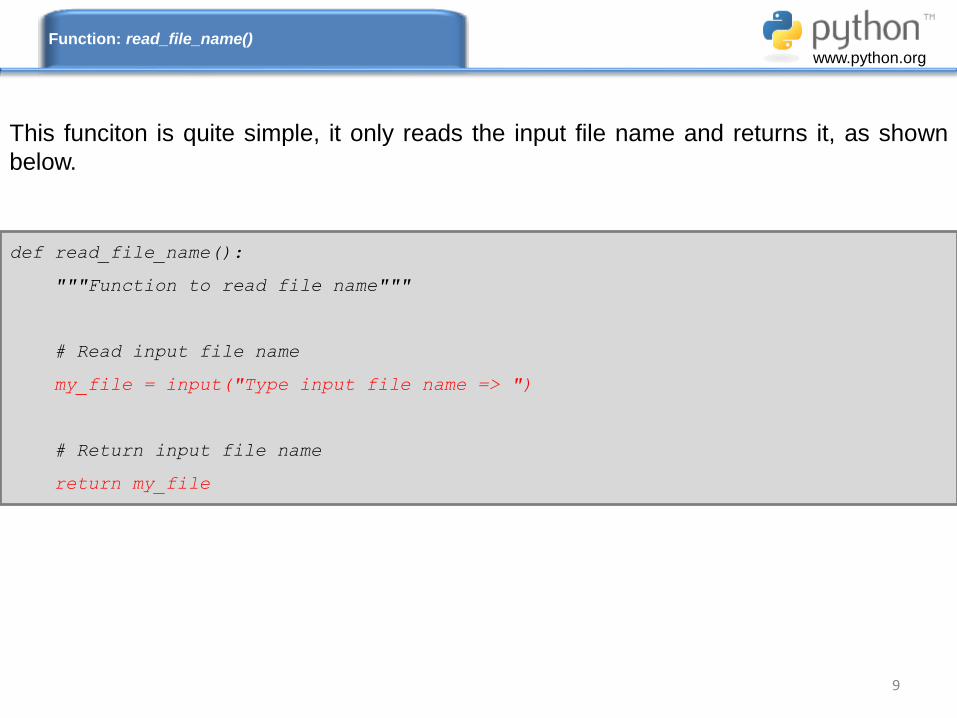
This funciton is quite simple, it only reads the input file name and returns it, as shown
below.
Function: read_file_name()
www.python.org

10
This function has more
than 50 lines, so we
divide the presentation in
several slides.
These lines set up arrays
and counts.
Function: calc_torsion()
www.python.org
def calc_torsion(list_of_atoms_in):
"""Function to calculate torsion angles"""
# Import library
import numpy as np
# We have the number of rows and number of columns equal to 3
# matrix = [[0]*column for i in range(row)]
columns = 3
rows = 9999
co = np.array([[0]*columns]*rows,float)
n = np.array([[0]*columns]*rows,float)
ca = np.array([[0]*columns]*rows,float)
# Set up counts
count_res = 0
former_res = -9999
new_res = -9998
found_co = 0
found_n = 0
found_ca = 0

11
In this for loop, we select
main-chain and side-
chain atoms.
Function: calc_torsion()
www.python.org
# Looping through list_of_atoms_in
for line in list_of_atoms_in:
if line[0:6] == "ATOM " and line[13:15] == "C ":
co[count_res,0] = float(line[30:38])
co[count_res,1] = float(line[38:46])
co[count_res,2] = float(line[46:54])
new_res = int(line[22:26])
found_co = 1
elif line[0:6] == "ATOM " and line[13:15] == "N ":
n[count_res,0] = float(line[30:38])
n[count_res,1] = float(line[38:46])
n[count_res,2] = float(line[46:54])
new_res = int(line[22:26])
found_n = 1
elif line[0:6] == "ATOM " and line[13:15] == "CA":
ca[count_res,0] = float(line[30:38])
ca[count_res,1] = float(line[38:46])
ca[count_res,2] = float(line[46:54])
found_ca =1
new_res = int(line[22:26])
complete_mc = found_co*found_n*found_ca
if former_res != new_res and complete_mc:
former_res = new_res
count_res += 1
found_co = 0
found_n = 0
found_ca = 0
12
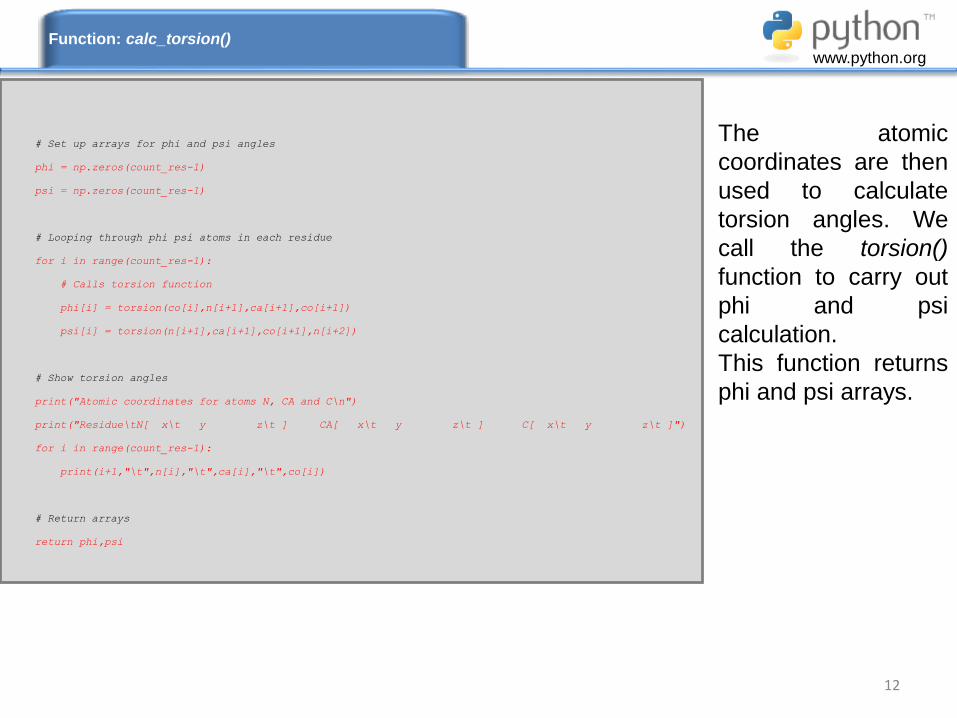
The atomic
coordinates are then
used to calculate
torsion angles. We
call the torsion()
function to carry out
phi and psi
calculation.
This function returns
phi and psi arrays.
Function: calc_torsion()
www.python.org
# Set up arrays for phi and psi angles
phi = np.zeros(count_res-1)
psi = np.zeros(count_res-1)
# Looping through phi psi atoms in each residue
for i in range(count_res-1):
# Calls torsion function
phi[i] = torsion(co[i],n[i+1],ca[i+1],co[i+1])
psi[i] = torsion(n[i+1],ca[i+1],co[i+1],n[i+2])
# Show torsion angles
print("Atomic coordinates for atoms N, CA and C\n")
print("Residue\tN[ x\t y z\t ] CA[ x\t y z\t ] C[ x\t y z\t ]")
for i in range(count_res-1):
print(i+1,"\t",n[i],"\t",ca[i],"\t",co[i])
# Return arrays
return phi,psi

13
This function calculates
torsion angles, based on
the coordinates of four
points. It returns angle as
a float. Details about
torsion angle equation are
given here.
www.python.org
def torsion(p1,p2,p3,p4):
"""Function to calculate torsion angle for atoms a,b,c, and d"""
# Equation from http://www.stem2.org/je/proteina.pdf
# Import libraries
import numpy as np
import math
# Get coordinates for vectors q1, q2 and q3
q1 = np.subtract(p2,p1) # b - a
q2 = np.subtract(p3,p2) # c - b
q3 = np.subtract(p4,p3) # d - c
# Calculate cross vectors
q1_x_q2 = np.cross(q1,q2)
q2_x_q3 = np.cross(q2,q3)
n1 = q1_x_q2/np.sqrt(np.dot(q1_x_q2,q1_x_q2))
n2 = q2_x_q3/np.sqrt(np.dot(q2_x_q3,q2_x_q3))
# Calculate unit vectors
u1 = n2
u3 = q2/(np.sqrt(np.dot(q2,q2)))
u2 = np.cross(u3,u1)
# Calculate cosine and sine
cos_theta = np.dot(n1,u1)
sin_theta = np.dot(n1,u2)
# Calculate torsion angle
theta = -math.atan2(sin_theta,cos_theta) # it is different from atan2 from fortran
theta_deg = np.degrees(theta)
# Show results
print("theta (rad) = ",theta)
print("theta (deg) = ",theta_deg)
# Return torsion angle in degrees
return theta_deg
14
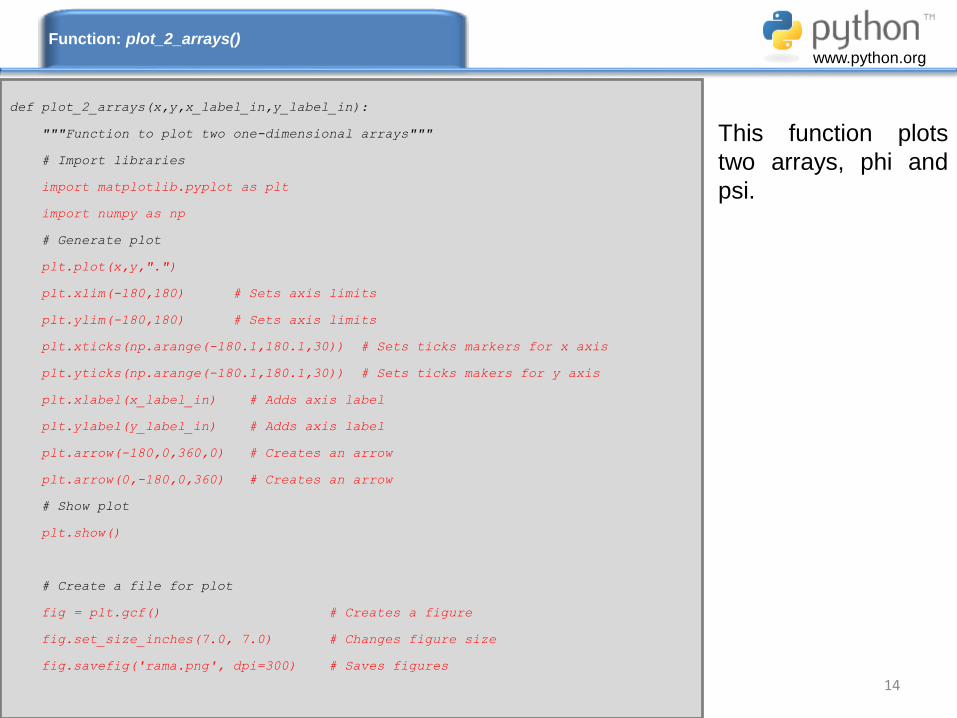
This function plots
two arrays, phi and
psi.
Function: plot_2_arrays()
www.python.org
def plot_2_arrays(x,y,x_label_in,y_label_in):
"""Function to plot two one-dimensional arrays"""
# Import libraries
import matplotlib.pyplot as plt
import numpy as np
# Generate plot
plt.plot(x,y,".")
plt.xlim(-180,180) # Sets axis limits
plt.ylim(-180,180) # Sets axis limits
plt.xticks(np.arange(-180.1,180.1,30)) # Sets ticks markers for x axis
plt.yticks(np.arange(-180.1,180.1,30)) # Sets ticks makers for y axis
plt.xlabel(x_label_in) # Adds axis label
plt.ylabel(y_label_in) # Adds axis label
plt.arrow(-180,0,360,0) # Creates an arrow
plt.arrow(0,-180,0,360) # Creates an arrow
# Show plot
plt.show()
# Create a file for plot
fig = plt.gcf() # Creates a figure
fig.set_size_inches(7.0, 7.0) # Changes figure size
fig.savefig('rama.png', dpi=300) # Saves figures
15
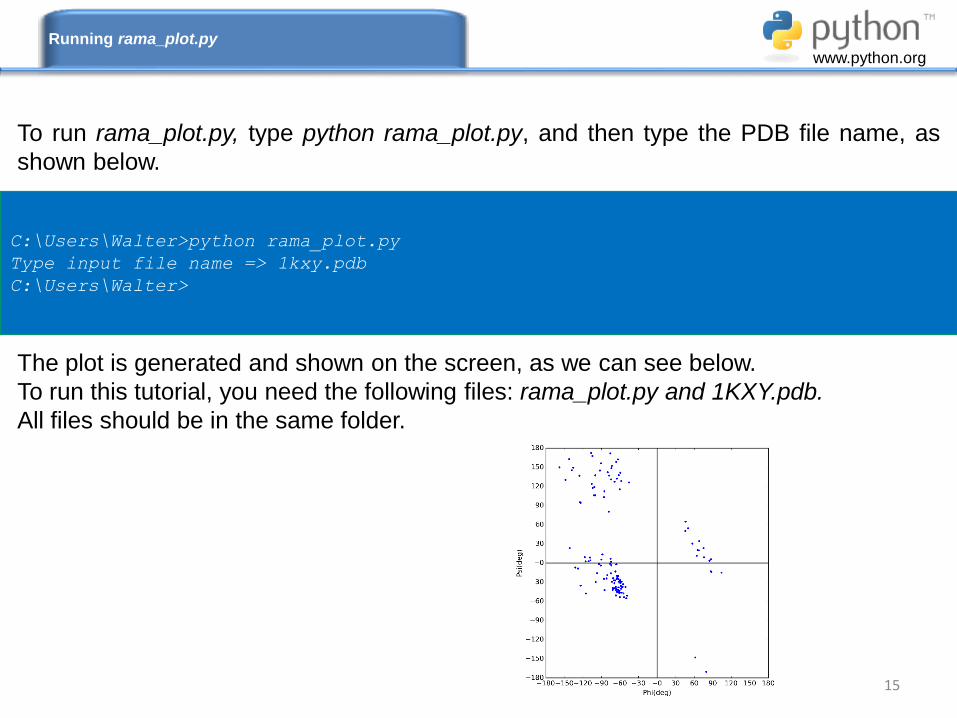
To run rama_plot.py, type python rama_plot.py, and then type the PDB file name, as
shown below.
The plot is generated and shown on the screen, as we can see below.
To run this tutorial, you need the following files: rama_plot.py and 1KXY.pdb.
All files should be in the same folder.
C:\Users\Walter>python rama_plot.py
Type input file name => 1kxy.pdb
C:\Users\Walter>
Running rama_plot.py
www.python.org

Berman HM, Westbrook J, Feng Z, et al. The Protein Data Bank. Nucleic Acids Res 2000; 28: 235-42.
Berman HM, Battistuz T, Bhat TN, et al. The Protein Data Bank. Acta Crystallogr D Biol Crystallogr 2002; 58(Pt 6 No 1): 899-907.
Ramachandran GN, Ramakrishnan C, Sasisekharan V. Stereochemistry of polypeptide chain configurations.
J Mol Biol. 1963; 7:95-9.
Westbrook J, Feng Z, Chen L, Yang H, Berman HM. The Protein Data Bank and structural genomics. Nucleic Acids Res 2003;
31(1): 489-491.
Last updated on July 6th 2016.
References
www.python.org
16

Colophon
This text was produced in a DELL Inspiron notebook with 6GB of memory, a 750 GB
hard disk, and an Intel® Core® i5-3337U CPU @ 1.80 GHz running Windows 8.1. Text
and layout were generated using PowerPoint 2013 and graphical figures were
generated by Visual Molecular Dynamics
(VMD)(http://www.ks.uiuc.edu/Research/vmd/). This tutorial uses Arial font.
www.python.org
13

Author
I graduated in Physics (BSc in Physics) at University of Sao Paulo (USP) in 1990. I
completed a Master Degree in Applied Physics also at USP (1992), working under
supervision of Prof. Yvonne P. Mascarenhas, the founder of crystallography in Brazil.
My dissertation was about X-ray crystallography applied to organometallics compounds
(De Azevedo Jr. et al.,1995).
During my PhD I worked under supervision of Prof. Sung-Hou Kim (University of
California, Berkeley. Department of Chemistry), on a split PhD program with a
fellowship from Brazilian Research Council (CNPq)(1993-1996). My PhD was about the
crystallographic structure of CDK2 (Cyclin-Dependent Kinase 2) (De Azevedo Jr. et
al.,1996). In 1996, I returned to Brazil. In April 1997, I finished my PhD and moved to Sao Jose do Rio Preto (SP,
Brazil) (UNESP) and worked there from 1997 to 2005. In 1997, I started the Laboratory of Biomolecular Systems-
Department of Physics-UNESP - São Paulo State University. In 2005, I moved to Porto Alegre/RS (Brazil), where I
am now. My current position is coordinator of the Laboratory of Computational Systems Biology at Pontifical
Catholic University of Rio Grande do Sul (PUCRS). My research interests are focused on application of computer
simulations to analyze protein-ligand interactions. I'm also interested in the development of biological inspired
computing and machine learning algorithms. We apply these algorithms to molecular docking simulations, protein-
ligand interactions and other scientific and technological problems. I published over 160 scientific papers about
protein structures and computer simulation methods applied to the study of biological systems (H-index: 36).
These publications have over 4000 citations. I am editor for the following journals:
18