Rahul Ghosale Project
92
A PROJECT REPORT ON “COMPARATIVE ANALYSIS OF EXPENDITURE BUDGET “COMPARATIVE ANALYSIS OF EXPENDITURE BUDGET” FOR HINDUSTAN PETROLEUM CORPORATION LIMITED SUBMITTED TO UNIVERSITY OF PUNE IN PARTIAL FULFILLMENT OF 2 YEARS FULL TIME COURSE MASTER OF BUSINESS ADMINISTRATION (MBA) SUBMITTED BY MR. RAHUL ASHOK GHOSALE MR. RAHUL ASHOK GHOSALE (BATCH-2009-2011) UNDER THE GUIDANCE OF PROF.VIKAS BARBATE JSPM’S JAYAWANT INSTITUTE OF COMPUTER APPLICATION
Transcript of Rahul Ghosale Project

A
PROJECT REPORTON
“COMPARATIVE ANALYSIS OF EXPENDITURE BUDGET“COMPARATIVE ANALYSIS OF EXPENDITURE BUDGET””
FORHINDUSTAN PETROLEUM CORPORATION LIMITED
SUBMITTED TO
UNIVERSITY OF PUNEIN PARTIAL FULFILLMENT OF 2 YEARS FULL TIME COURSE
MASTER OF BUSINESS ADMINISTRATION (MBA)
SUBMITTED BYMR. RAHUL ASHOK GHOSALEMR. RAHUL ASHOK GHOSALE
(BATCH-2009-2011)
UNDER THE GUIDANCE OF
PROF.VIKAS BARBATE
JSPM’SJAYAWANT INSTITUTE OF COMPUTER APPLICATION
S.N.80/3, Pune Mumbai Bypass Highway, TathwadePune-411033
DECLARATION
I Mr. RAHUL ASHOK GHOSALE Student of MBA II (Finance) 2009-2011 studying at JAYWANT INSTITUTE OF COMPUTER APPLICATION; TATHWADE PUNE- 33 declared that the project work entitled “COMPARITIVE ANALYSIS OF EXPENDITURE BUDGET”FOR HINDUSTAN PETROLEUM CORPORATION LIMITED. It was carried by me in the partial fulfillment Of MBA program under the University of Pune.
This project was undertaken as a part of academic curriculum according to the university rules and norms and it has not commercial interest and motive. It is my original work. It is not submitted to any other organization for any other purpose.
PLACE: PUNE
Date: (Rahul Ashok Ghosale) Roll No
ACKNOWLEDGEMENT
I take immense pleasure in completing this project and submitting the final Project report in 60 days with HINDUSTAN PETROLEUM CORPORATION LIMITED. It has been full of learning and sense of contribution towards the organisation. I would like to thank HINDUSTAN PETROLEUM CORPORATION LIMITED for giving me an opportunity of learning and contributing through this project. I also take this opportunity to thank all those people that made this experience a memorable one.
A successful project can never be prepared by this single effort of the person to whom the project is assigned, but it also demands the help and guardianship of some concern persons who helped the undersigned activity or passively in the completion of successful project.
The project couldn’t have been completed without timely and vital help of other office staff. Special thank to Mr.MDS Sastry (Sr. Manager –Finance O&D), and thanks to their invaluable guidance, keen interest cooperation inspiration, and course moral support through my project session.
I would like to give special thanks to my project guide Prof. Vikas Barbate for their guidance, cooperation, and inspiration for fulfilling my project.
Rahul Ashok Ghosale
CHAPTER NO PARTICULARS PAGE
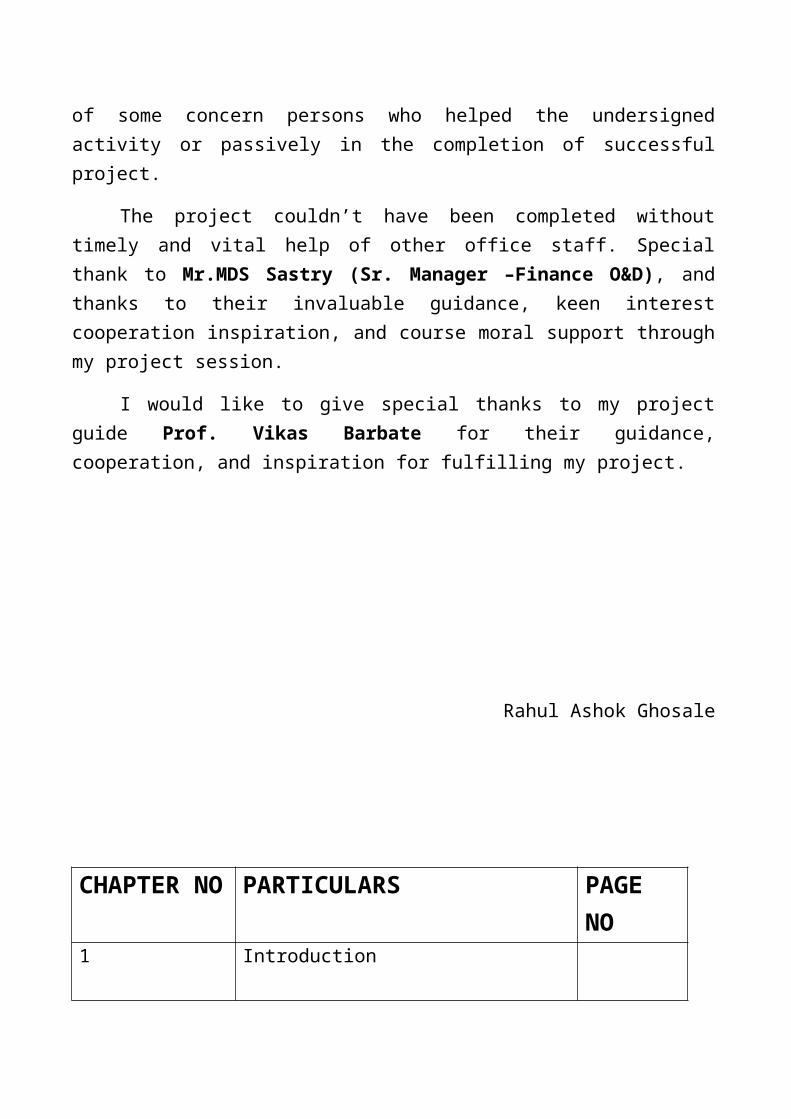
NO1 Introduction
2 Profile of Organization
3 Research Methodology
4 Conceptual Background
5 Data Presentation, Analysis and Interpretation
6 Findings ,Suggestion and Conclusion
Bibliography
Table of Contents:
LIST OF TABLES
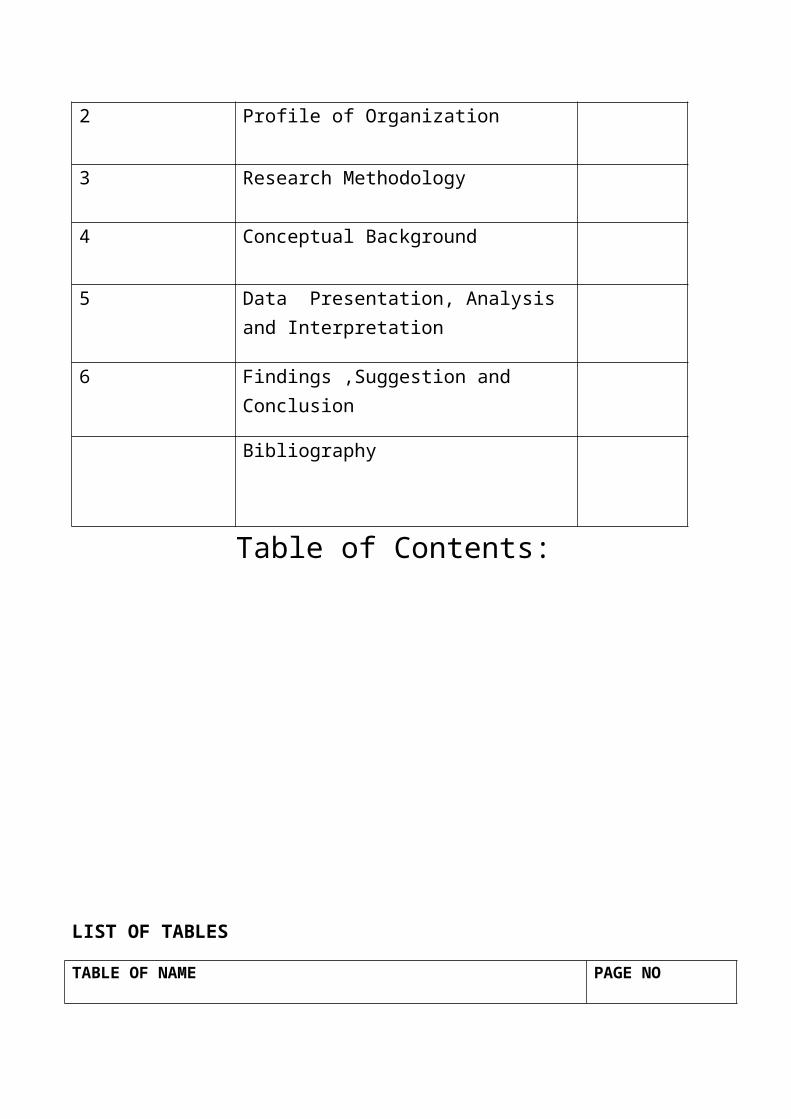
TABLE OF NAME PAGE NO
History about HPCL
Marketing network
Number of employee
Capital structure & Financial ratio
Expenditure budget statement
Statement showing volume handled
Advertising & publishing
Consultancy & Technical services
Bank charges
Casual/Contract labour
Communication
Depreciation
Electricity & Water
Employee training
Employee welfare expenses
Insurance
Maintenance & Repairs
Manpower cost
Others
Overtime
Printing & Stationery
Public Awareness Program
Rates & Taxes
Rent expenses
Security
Stores & Spares
Travel & Conveyance
Utilities (Power & fuel)
LIST OF CHARTS
CHART NAME PAGE NO
Market share of the company
Organisation chart
Manager wise budget
Types of budget
Zone operation & distribution
Digramic representation of expenditure
Advertising & publishing
Consultancy & Technical services
Bank charges
Casual/Contract labour
Communication
Depreciation
Electricity & Water
Employee training
Employee welfare expenses
Insurance
Maintenance & Repairs
Manpower cost
Others
Overtime
Printing & Stationery
Public Awareness Program
Rates & Taxes
Rent expenses
Security
Stores & Spares
Travel & Conveyance
Utilities (Power & fuel)
CHAPTER 1
INTRODUCTION
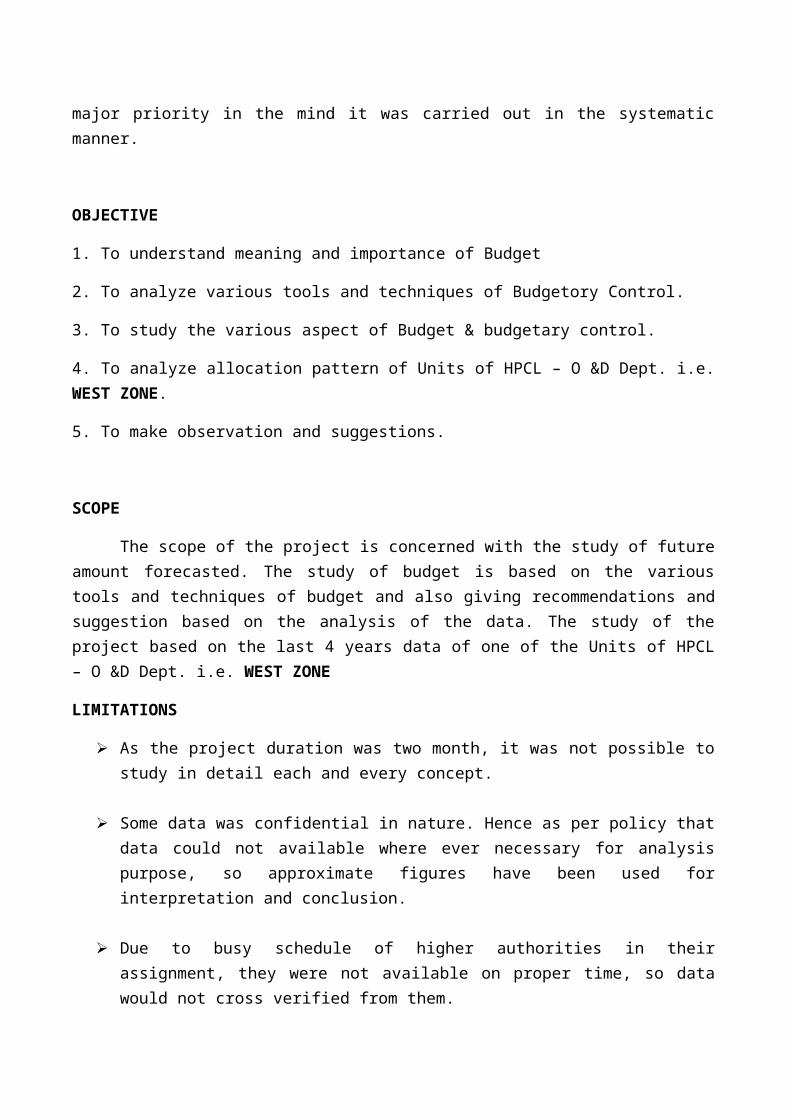
EXECUTIVE SUMMARY

Managerial control becomes essential in case of public limited Companies and government undertaking which are run by hired managerial personnel with little interest in the result of such enterprises. The proprietors have, therefore, to think of a device which may encourage the management to work with greater case and caution to serve the interests of all by optimizing the use of investment in the form of man, money and material.
Budgeting is one of such device which helps the management to understand the business programmes in their right perspective and take steps to achieve business objective .Business means planning for future .It involves the preparation of departmental budgets ,budgetary control and related issues. The budgetary control is concerned with the management of business activities with help of budgets .In this way, budget serve as a control device.
A Budget is a plan which relates to a definite period of time and which is expressed in quantitative terms. It is thus a predetermined statement which incorporates the policy of the management during a given period and serve as a standard for Comparing the actual results .Thus , a Budget is a tool in the hands of the management during a given period and serve as a guide to all planning and co-ordination with all the employee in achieving their goals objectives and targets .A Budget helps in planning and co-ordination with all the employees and departments, but the most important factor is that it is used for control purpose at all levels of management.
There is a difference between budget and budgetary control. A budget is a quantitative statement prepared in advance and keeping it as the base, the actual are compared. Budgetory control involves use of the budgeting techniques to help the management for carrying out the various functions viz. Planning, Organising, Co-ordinating and controlling the activities of a business.
In this report, I dealt with the planning for the more immediate future, i.e. the next financial year. Budgeting is used by businesses as a method of financial planning for the future. Budgets are prepared for main areas of the business – purchases, sales, Production, labour, debtors, creditors, cash – and provide detailed plans of the business for the next three, six or twelve months.
The focus of this Report is on the expenditure budget. In this report shall be examining on the following topics:
• The benefits of budgets and budgetary control• The limitations of budgets and budgetary control• The preparation and use of expenditure budgets
The objective behind this project is to understand the meaning and importance of budget and to study the various aspects of budget and to find out future spending power of the Unit of the Organisation under study.
In this project theoretical background includes the budget, budgetary control, objective of budget, budgetary control and types of budget. The data analysis includes projection for future spending controllable expenditure, forecasted expenditure and volume handled, cost per KL and their interpretation
AIM, OBJECTIVE AND SCOPE
AIM
As brought out in the title of the project the basic aim of the project is to analyze the budget & budgetary control of the west zone (HINDUSTAN PETROLEUM CORPORATION LIMITED) and this as the major priority in the mind it was carried out in the systematic manner.
OBJECTIVE
1. To understand meaning and importance of Budget
2. To analyze various tools and techniques of Budgetory Control.
3. To study the various aspect of Budget & budgetary control.
4. To analyze allocation pattern of Units of HPCL – O &D Dept. i.e. WEST ZONE.
5. To make observation and suggestions.
SCOPE
The scope of the project is concerned with the study of future amount forecasted. The study of budget is based on the various tools and techniques of budget and also giving recommendations and suggestion based on the analysis of the data. The study of the project based on the last 4 years data of one of the Units of HPCL – O &D Dept. i.e. WEST ZONE
LIMITATIONS
As the project duration was two month, it was not possible to study in detail each and every concept.
Some data was confidential in nature. Hence as per policy that data could not available where ever necessary for analysis purpose, so approximate figures have been used for interpretation and conclusion.
Due to busy schedule of higher authorities in their assignment, they were not available on proper time, so data would not cross verified from them.

CHAPTER 2
PROFILE OF
THE ORGANISATION
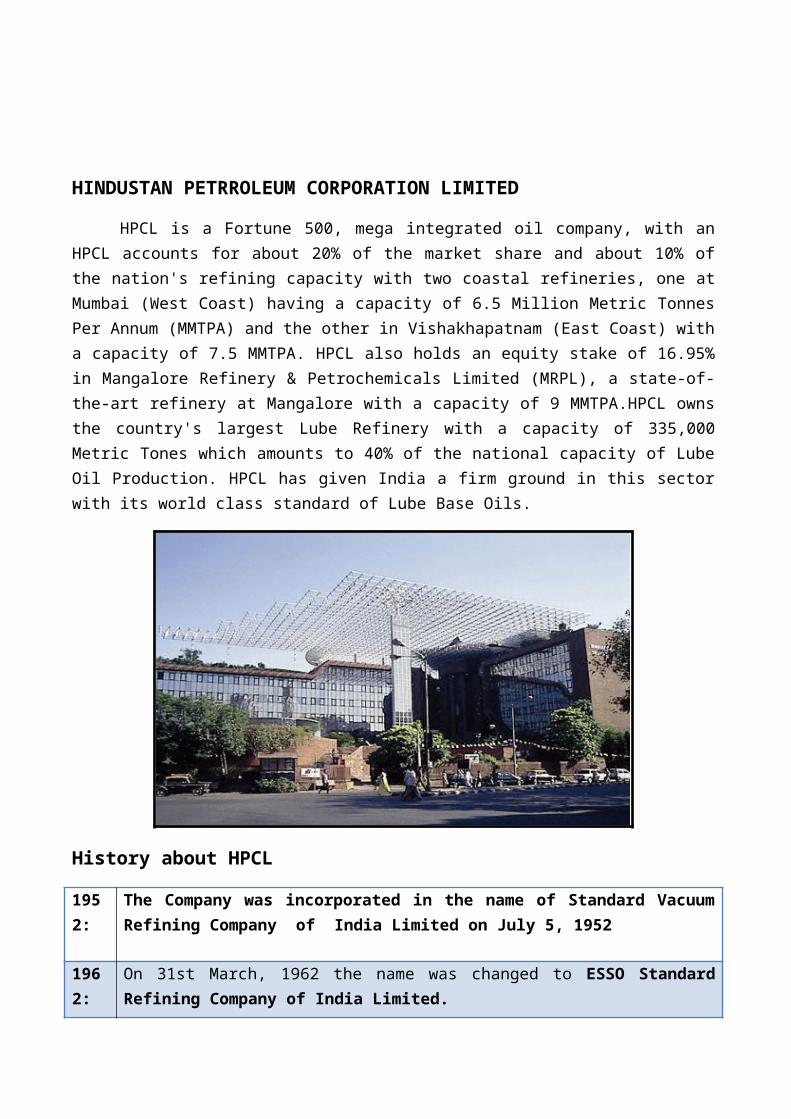
HINDUSTAN PETRROLEUM CORPORATION LIMITED
HPCL is a Fortune 500, mega integrated oil company, with an HPCL accounts for about 20% of the market share and about 10% of the nation's refining capacity with two coastal refineries,
one at Mumbai (West Coast) having a capacity of 6.5 Million Metric Tonnes Per Annum (MMTPA) and the other in Vishakhapatnam (East Coast) with a capacity of 7.5 MMTPA. HPCL also holds an equity stake of 16.95% in Mangalore Refinery & Petrochemicals Limited (MRPL), a state-of-the-art refinery at Mangalore with a capacity of 9 MMTPA.HPCL owns the country's largest Lube Refinery with a capacity of 335,000 Metric Tones which amounts to 40% of the national capacity of Lube Oil Production. HPCL has given India a firm ground in this sector with its world class standard of Lube Base Oils.
History about HPCL
1952: The Company was incorporated in the name of Standard Vacuum Refining Company of India Limited on July 5, 1952
1962: On 31st March, 1962 the name was changed to ESSO Standard Refining Company of India Limited.
1974: Hindustan Petroleum Corporation Limited comes into being after the takeover and merger of erstwhile Esso and Lube India Undertaking
1976: Caltex Oil Refining Ltd. is taken over by the Government of India and subsequently merged with HPCL in 1978.
1979: Kosan Gas Company, the concessionaries of HPCL in the domestic LPG market, are taken over and merged with HPCL.
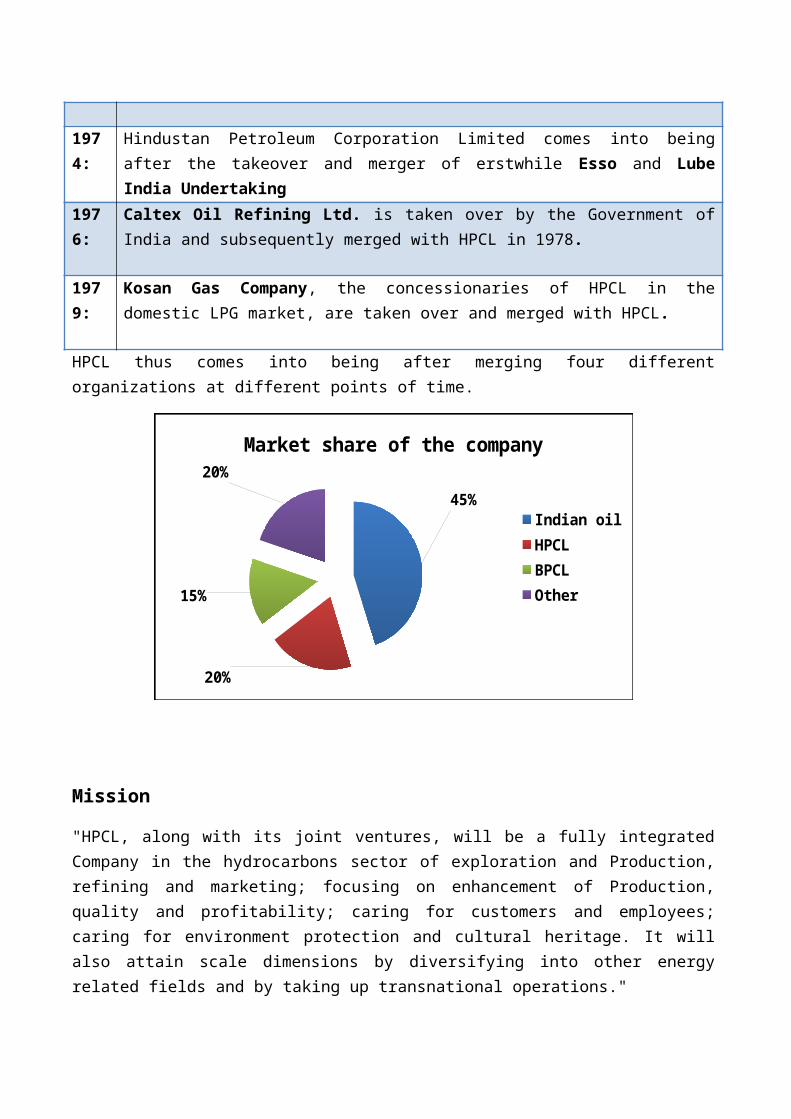
HPCL thus comes into being after merging four different organizations at different points of time.
45%
20%
15%
20%Market share of the company
Indian oilHPCLBPCLOther
Mission
"HPCL, along with its joint ventures, will be a fully integrated Company in the hydrocarbons sector of exploration and Production, refining and marketing; focusing on enhancement of Production, quality and profitability; caring for customers and employees; caring for environment protection and cultural heritage. It will also attain scale dimensions by diversifying into other energy related fields and by taking up transnational operations."
Vision
To be a World Class Energy Company known for caring and delighting the customers with high quality Production and innovative services across domestic and international markets with aggressive growth and delivering superior financial performance. The Company will be a model of excellence in meeting social commitment, environment, health and safety norms and in employee welfare
Logo of company
Infrastructure
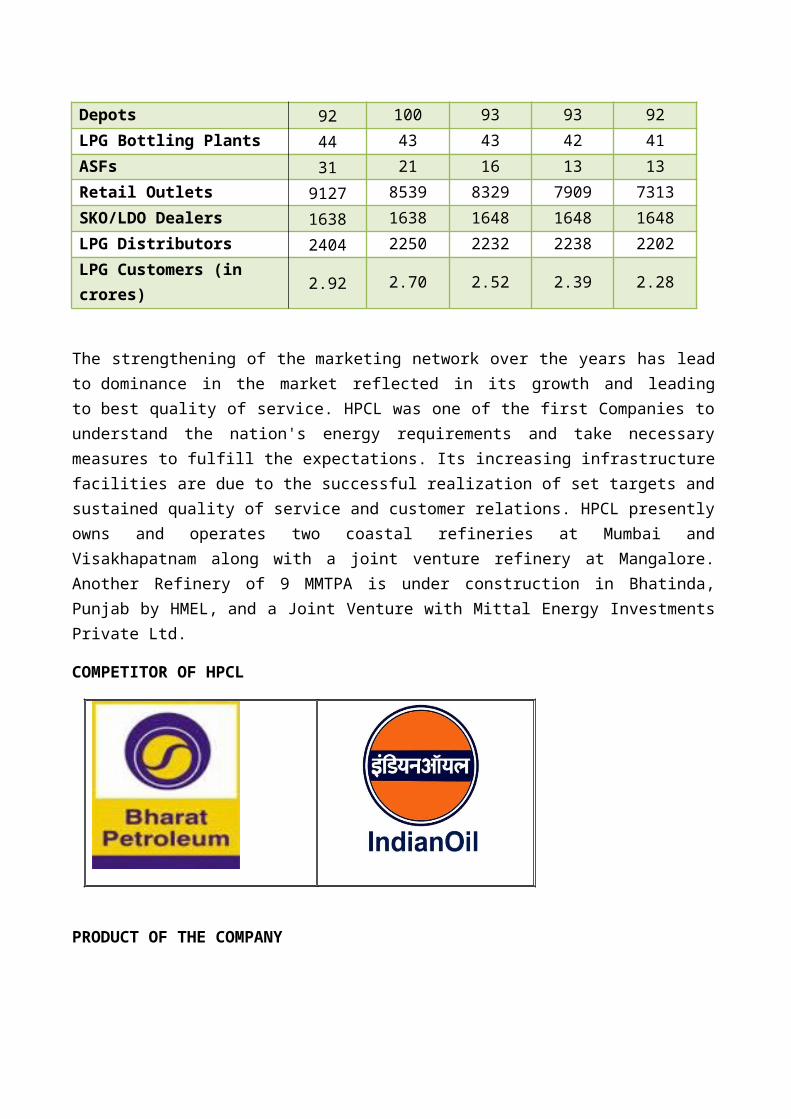
HPCL's infrastructure is at par with that of the best global corporations in the hydrocarbons sector. For over a quarter century now, HPCL has been consistently breaking new grounds in Production and marketing. A glimpse of the vast marketing network already developed is given below in a table.
Marketing Network 2009-10 2008-09 2007-08 2006-07 2005-06
Regional Offices 101 90 91 86 85
Terminals/Installations/TOPs
31 31 42 37 37
Depots 92 100 93 93 92
LPG Bottling Plants 44 43 43 42 41
ASFs 31 21 16 13 13
Retail Outlets 9127 8539 8329 7909 7313
SKO/LDO Dealers 1638 1638 1648 1648 1648
LPG Distributors 2404 2250 2232 2238 2202
LPG Customers (in crores) 2.92 2.70 2.52 2.39 2.28
The strengthening of the marketing network over the years has lead to dominance in the market reflected in its growth and leading to best quality of service. HPCL was one of the first Companies to understand the nation's energy requirements and take necessary measures to fulfill the expectations. Its increasing infrastructure facilities are due to the successful realization of set targets and sustained quality of service and customer relations. HPCL presently owns and operates two coastal refineries at Mumbai and Visakhapatnam along with a joint venture refinery at Mangalore. Another Refinery of 9 MMTPA is under construction in Bhatinda, Punjab by HMEL, and a Joint Venture with Mittal Energy Investments Private Ltd.
COMPETITOR OF HPCL
PRODUCT OF THE COMPANY
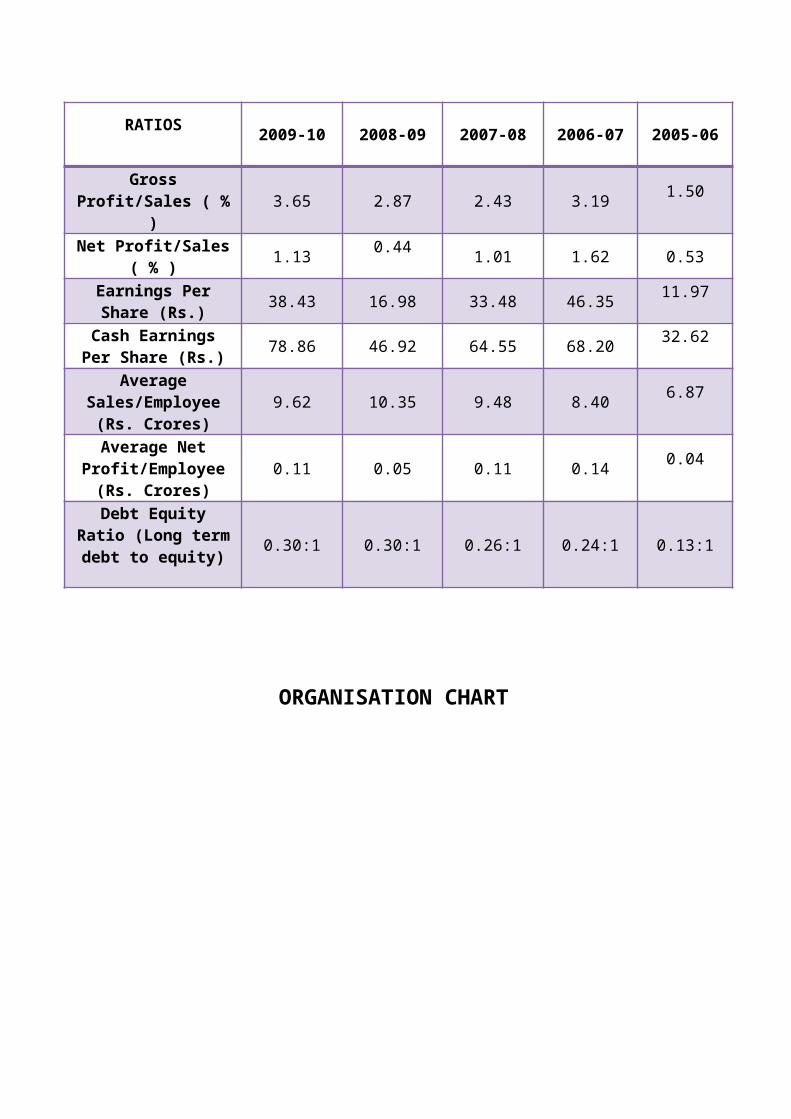
STATEMENT SHOWING NUMBER OF EMPLOYEE
Group Total No .of Employees
No. of women employee
% of Women employee
A 4479 393 8.22B - - -C 6396 404 6.32D 116 7 6.03
TOTAL 11291 804 7.12
AviationSupply the fuel of airport and Defense service
LubesThe lube provide Various companies and customer .
Retail
With the help of retail outlet company sell Petrol ,Diesel and kerosene
LPGThe LPG gas supply for the house use
FUTURE PLANS In order to strengthen core processes and modernize, HPCL has developed ambitious plans
for expansion and diversification in the areas of increasing energy demand, technological up gradation and environment management. HPCL has proposed capital expenditure (including equity investments in Joint Ventures) of Rs. 11487 Crores during the eleventh plan. Currently, several projects are in progress in different parts of India. Here is a brief introduction to these projects. Major Ongoing Projects
New FCCU at Mumbai Refinery: Lube Oil Base Stock (LOBS) Up gradation project at Mumbai Refinery: Diesel Hydro Treating (DHT) at Mumbai & Visakhapatnam refineries: SPM Project at Visakh Refinery: Resitement of Visakh Terminal: Guru Gobind Singh Refinery Production Evacuation Project: Ennore Terminal Project:
FINANCIAL AWARDS Listed in Fortune Global 500 and Forbes Global 2000 companies
Listed in “World’s Most Reputable Companies” compiled by Reputation Institute (RI) during Janurary-February 2009.
Awarded the prestigious ‘NDTV Profit’ Business Leadership Award 2008 in the category of Oil & Gas. The Award honours business excellence & recognizes companies that have fuelled the Indian economy to currently being among the fastest growing economies in the world.
The ‘World Council for Corporate Governance’ (WCFCG), UK and Institute of Directors, India has conferred on HPCL the prestigious ‘Golden Peacock Corporate Governance Award 2008’ under the petroleum category. This annual award is conferred to companies which demonstrate benchmark standards and excellence in Corporate Governance
National Award For Excellence in Cost Management from the Institute of Cost Accountants of India (ICWAI) under the category of Public Sector – Manufacturing Organization of Turnover more than Rs. 1000 Crores.
Mayaram Surjan Foundation Award for in-house journal ‘HP News’ in recognition of the ‘effective use of the media of house Journal as an essential tool for image building for furtherance of Internal Communication & for creating better Public Relations’
Directorates of Commercial Taxes have conferred on HPCL with the Second Best Tax Payer Award for the State of Madhya Pradesh.
CAPITAL STRUCTURE
FUNDS2009-10 2008-09 2007-08 2006-07 2005-06
Net Worth 11,557.97 10,730.63 10,563.30 9,598.64 8,735.74
Share Capital 339.71 339.71 339.71 338.95 338.94
Share Forfeiture
0.70) ( (0.70) (0.70) - -
Reserves 11,218.96 10,391.62 10,224.28 9,259.69 8,396.80
Borrowings 21,302.37 22,755.51 16,786.70 10,517.54 6,663.83
Net Profit 1,301.37 574.98 1,134.88 1,571.17 405.63
FINANCIAL RATIO
RATIOS2009-10 2008-09 2007-08 2006-07 2005-06
Gross Profit/Sales ( % ) 3.65 2.87 2.43 3.191.50
Net Profit/Sales ( % ) 1.130.44
1.01 1.62 0.53
Earnings Per Share (Rs.)
38.43 16.98 33.48 46.3511.97
Cash Earnings Per Share (Rs.)
78.86 46.92 64.55 68.2032.62
Average Sales/Employee (Rs.
Crores)9.62 10.35 9.48 8.40
6.87
Average Net Profit/Employee (Rs.
Crores)0.11 0.05 0.11 0.14
0.04
Debt Equity Ratio (Long term debt to
equity)0.30:1 0.30:1 0.26:1 0.24:1 0.13:1
ORGANISATION CHART
Mr.Arun BalakrishnanChairman & Managing Director
Functional Directors
Mr.S.Roy ChoudhuryDirector-
Marketing
Mr.V. Vizia Saradhi
Director- Human Resources
Mr.B.Mukherjee Director- Finance
Mr.K. MuraliDirector-
Refineries
Part-time ex-official Directors
Mr.P.K.SinhaDirector
Mr.L.N.Gupta
Director
Part-time non-official Directors
Prof. Prakash G Apte Director
Mr.P.V.Rajaraman
Director
Dr. Gitesh K Shah
Director

CHAPTER 3
RESEARCH
METHODOLOGY

RESEARCH METHODOLOGY
RESEARCH
“A careful investigation or inquiry especially through search for new facts in any branch of knowledge”
According to Radman and Mory research means “Systematic effort to gain new knowledge.”
Research is thus an original contribution to the existing stock of knowledge made for its advancement .As such the term ‘research’ refers to the systematic method consisting of enunciating the problem, formulating a hypothesis, collecting the fact o data, analyzing the facts and reaching certain generation for some theoretical formulation .Research has its special significance in solving various operational and planning problems of business and industry.
TYPES OF RESEARCH
Descriptive Vs Analytical
Applied Vs Fundamental
Quantitative Vs Qualitative
Conceptual Vs Empirical
TYPES OF RESEARCH USED FOR PROJECT
Analytical Research
Analytical Research is that research where the researchers already have all the facts or information available to them, and they make a critical evaluation of that information for finding the solution to certain problem. In these types of research the researcher uses that facts or information which is already collected by some other person. The research uses this facts or information and makes critical of data for providing results or solution to specific problem.
In analytical research two type of analysis can mode:-
i. Analysis of historical? Recording of notes ,content analysis, tape and film listening and analysis
ii. Analysis of document? Statistical compilations a manipulation reference and abstract content analysis.
METHDOLOGY USED FOR PROJECT
Research Methodology is way to systematically solve the research problem .Research is a systematically search for pertinent information on a specific topic. It has its special significance in solving various operational and planning problems of business and industry in it we study the various steps that are generally adopted by researcher in studying his research problem along with the logic behind them.
The methodology used for calculating Budget of the company had based on budget estimation and the values from various document of the company
The methodology to analyzing the financial data of the company had based on figure and values from available data of the company.
For theories related to topic, ratios and interpretation web sites and interviews of people who have good knowledge about these topics.
For this project analytical research is carried.
DATA
Data is a raw form of information .Data is used for generating some useful information related to this project, data is that information or raw information which is used to find the solution of the problem.
There were two types of data used in the project.
PRIMARY DATA:-
Primary data are those data which are collected afresh and for the first time ,and thus happen to be original in character .primary data is directly collect for individuals by:-
Survey method Personal interview
Primary data related to the project was collected from formal and informal discussion and interaction with senior employees of the company. This data helps in calculating budget, volume handled and some other topic.

SECONDARY DATA
Secondary data are those data which have collected by someone else and which have already been passed though the statistically process. The researcher uses this data for further research. Secondary data can be collected by:-
Catalogues Reports Broachers Magazines, etc.
The project mainly depends upon the secondary data.

CHAPTER 4
CONCEPTUAL
BACKGROUND

IntroductionBusinesses need to plan for the future. In large businesses such planning is very formal
while, for smaller businesses, it will be less formal. Planning for the future falls into three time
scales:
• Long-term: from about three years up to, sometimes, as far as twenty years ahead
• Medium-term: one to three years ahead
• Short-term: for the next year
Clearly, planning for these different time scales needs different approaches: the further on in time,
the less detailed are the plans. In the medium and longer term, a business will establish broad
business objectives. Such objectives do not have to be formally written down, although in a large
business they are likely to be. In smaller businesses, objectives will certainly be considered and
discussed by the owners or managers. Planning takes note of these broader business objectives and
sets out how these are to be achieved in the form of detailed plans known as budgets .In this chapter
we are concerned with planning for the more immediate future, i.e. the next financial year.
Budgeting is used by businesses as a method of financial planning for the future. Budgets are
prepared for main areas of the business – purchases ,sales, Production, labour, debtors, creditors,
cash – and provide detailed plans of the business for the next three, six or twelve months
• The benefits of budgets and budgetary control
• The limitations of budgets and budgetary control
Objectives of budget
This chapter is intended to provide:
An indication and explanation of the importance of budgetary control in marketing as a key
marketing control technique
An overview of the advantages and disadvantages of budgeting
An introduction to the methods for preparing budgets
An appreciation of the uses of budgets.
DEFINITIONS: “Budget”
1. The Chartered Institute of Management Accountants (CIMA), London:“A financial and / or quantitative statement, prepared and approved prior to a defined period of time, of the policy to be pursued during the period for the purpose of attaining a given objective .It may include income, expenditure and employment of capital".
2. Kolhar:“A financial plan serving as a pattern for and a control over future operations".
3. Brown and Howard:"It is a pre-determined statement of management policy during a given period which provides a standard for Comparison with the result actually achieved".
Budgetary control methods
a) Budget:
A formal statement of the financial resources set aside for carrying out specific activities in a given period of time.
It helps to co-ordinate the activities of the organisation.
An example would be an advertising budget or sales force budget.
b) Budgetary control:
A control technique whereby actual results are Compared with budgets. Any differences (variances) are made the responsibility of key individuals who can either
exercise control action or revise the original budgets.
Budgetary control and responsibility centres;
These enable managers to monitor organisational functions.
A responsibility centre can be defined as any functional unit headed by a manager who is responsible for the activities of that unit.
There are four types of responsibility centres:

a) Revenue centres
Organisational units in which outputs are measured in monetary terms but are not directly compared to input costs.
b) Expense centres
Units where inputs are measured in monetary terms but outputs are not.
c) Profit centres
Where performance is measured by the difference between revenues (outputs) and expenditure (inputs). Inter-departmental sales are often made using "transfer prices".
d) Investment centres
Where outputs are compared with the assets employed in Production them, i.e.ROI
Advantages of budgeting and budgetary control
There are a number of advantages to budgeting and budgetary control:
Company’s management to think about the future, which is probably the most important feature of a budgetary planning and control system. Forces management to look ahead, to set out detailed plans for achieving the targets for each department, operation and (ideally) each manager, to anticipate and give the organisation purpose and direction.
Promotes coordination and communication.
Clearly defines areas of responsibility. Requires managers of budget centres to be made responsible for the achievement of budget targets for the operations under their personal control.
Provides a basis for performance appraisal (variance analysis). A budget is basically a yardstick against which actual performance is measured and assessed. Control is provided by Comparisons of actual results against budget plan. Departures from budget can then be investigated and the reasons for the differences can be divided into controllable and non-controllable factors.
Enables remedial action to be taken as variances emerge.
Motivates employees by participating in the setting of budgets.
Improves the allocation of scarce resources.
Characteristics of a budget
A good budget is characterized by the following: Participation: involve as many people as possible in drawing up a budget.
Comprehensiveness: Embrace the whole organization.
Standards: base it on established standards of performance.
Flexibility: allow for changing circumstances.
Feedback: constantly monitor performance.
Analysis of costs and revenues: this can be done on the basis of Production lines,
departments or cost centers.
Budget organization and administration:
In organizing and administering a budget system the following characteristics may apply:
a) Budget centers: Units responsible for the preparation of budgets. A budget centre may Compensation several cost centers.
b) Budget committee: This may consist of senior members of the organization, e.g. departmental heads and executives (with the managing director as chairman). Every part of the organization should be represented on the committee, so there should be a representative from sales, Production, marketing and so on.
Functions of the budget committee include:
Coordination of the preparation of budgets, including the issue of a manual Issuing of timetables for preparation of budgets Provision of information to assist budget preparations Comparison of actual results with budget and investigation of variances.
c) Budget Officer: Controls the budget administration the job involves:
Liaising between the budget committee and managers responsible for budget preparation Dealing with budgetary control problems Ensuring that deadlines are met Educating people about budgetary control.
d) Budget manual:
This document deals with the:
Charts the organization. Details the budget procedures. Contains account codes for items of expenditure and revenue. Timetables the process. Clearly defines the responsibility of persons involved in the budgeting system.
Budget preparation
Firstly, determine the principal budget factor. This is also known as the key budget factor or limiting budget factor and is the factor which will limit the activities of an undertaking. This limits output, e.g. sales, material or labour.
Preparation of an organisation chart:
An organisation chart when property drafted will shows the functional responsibilities of each member of management and ensures that he knows his position in the organisation and his relationship to other members .The organisation chart may have to ensure that each centre is controlled by an appropriate member of the staff .The figure shows the specimen of organisation chart for implementation of Budgetory Control System.
TYPES OF BUDGET
The budgets is different types which are classified according to the various bases as shown in Figure as under
Chief executive officer(CEO)
Budget officer
Personnel Manager
*Labour Budget(Human Resourc
e budget)
Purchase Manager
*Purchase
Budget
Poroduction
Manager
*Material
Budget*Produ
ction Budget*Plant
Utilisation
Budget
Finance Manager*Financ
ial Budget*Expenditure Budget*Produ
ction Cost
Budget*Administrtive Budget*Maste
r Budget
Sales Manager
*Sales Budget*Advertisement Budget*Selling and
distribution Cost
Budget
Budgeting is an undertaking may be done for a particular segment or it may cover all the activities depending upon the need and resources of the enterprises The large scales business enterprises prepare different types of budgets covering almost all activities where control is desired .In order to understand the nature of budgets, it is desirable to know their classification which is usually done on time, flexibility, functions and management control instrument basis:
(A)According to TimeAccording to time, budgets can be of three types:
1) Long –Term budget
TYPES OF BUDGET
According to Time
i)Long-Term Budget
ii)Short -Term Budget
iii)Current Budget
According to Flexibility
i)Fixed Budgetii)Flexible
Budget
According to Function
i)Sales Budgetii)Production
Budgetiii)Purchase
Budgetiv)Cash Budgetv)Expenditure
Budgetvi)Master
Budget
The period covered by budget is more than 1 year budget may be prepared 1,5,10 year etc. But it budget in no use in practical because it is very difficult to predict about the future.
2) Short-Time BudgetThe period covers by budget of one year .This type of budget are prepared continuously and
regularly E.g. Union budget of central government
3) Current BudgetThe period Covered by this budget is one week, one month or maximum 3 month. These
budgets are regularly prepared. Generally current budget regarding the sales, purchase etc, are prepared by the concern manager.
(B)According to FlexibilityOn the basis of flexibility budgets are classified in two categories
1) Fixed Budget According to ICMA, London Defines Fixed Budget as, “a budget which is designed to
remain unchanged irrespective of the volume of output or turnover achieved”It is rigid budget and it is drawn on the assumption that there will no changes in the budget
level of activity .A does not take in to account any changes in expenditure arising out of changes in the level of activity.
However in practice the fixed budget is rarely used .The main reason is that the actual output and budgeted output is not equal & actual output may changes in various reasons. This budget cannot be used the purpose of cost control.
2) Flexible BudgetAccording to ICMA, London Defines Flexible Budget as, “a budget which is to designed
to change in accordance with the level of activity actually attend”This budget gives different budgeted cost for different level of activity while preparing
budget are classified in to fixed overhead and semi variable overhead. This budget is useful especially in the business of which the sales cannot be predicted.E.g. New business trading luxuries and fashionable goods
Certain adjustment are possible in to the flexible budget .Flexible budget is more useful to practical and realistic than the fixed budget .it is more useful for cost control and decision making.
(C) According to the Function
1) Sales budget
Sales budget is most important budget all budget are depend upon the sales budget .if sales budget is incurred then all other budgets will get affected .Sales budget shows future sales in quantity or in amount .It is an estimate of sales to be made during the budget period. The sales budget is the statement of sales in terms of quantity and value in sales.
Sales budget is prepared by Sales Manager. He is assisted by salesman and market research .The preparation of sales budget is most difficult job it is very difficult to estimate future demand for the Production It involves a realistic sales forecast. This is prepared in units of each Production and also in sales value. Methods of sales forecasting include:
Sales force opinions Market research Statistical methods (correlation analysis and examination of trends) Mathematical models.
In using these techniques consider: Company's pricing policy general economic and political conditions changes in the population consumers' income and tastes advertising and other sales promotion techniques after sales service credit terms offered
2) Production BudgetAfter preparing the sales budget, the Production budget prepared .This budget prepared by
Production Manager .It concern with Purchase Manager ,Sales Manager and General Manager while Preparing by Production Budget is the estimate of goods of the during the budget period. It is an estimated of quantity of goods to be manufacture. This budget is also known as Manufacturing Budget .This budget is based on sales Budget This Budget is consist of three Subsidiary budgets.
I. Material Cost BudgetII. Labour Cost budget
III. Overhead budget
Production budget: expressed in quantitative terms only and is geared to the sales budget. The Production manager's duties include:
Analysis of plant utilization Work-in-progress budgets.
If requirements exceed capacity he may: Subcontract Plan for overtime Introduce shift work Hire or buy additional machinery
The materials purchases budget's both quantitative and financial.
3) Purchase BudgetShows the future purchases in terms of quantity in terms of quantity and value. It is an
estimate and purchase to make during the year. It includes cost of direct material, indirect material and cost of services. It is prepared by Purchase Manager. Purchase Manager helps of Stores Manager, Sales Manager, Finance Manager, while preparing budget.
The materials usage budget is in quantities. The materials purchases budget is both quantitative and financial.
Factors influencing a) and b) include: Production requirements Planning stock levels Storage space Trends of material prices.
4) Cash BudgetCash budget is a most important budget in the financial budget .cash budget shows the
Estimated Cash Receipt & Estimated Cash Payment during the budgeted period .this budget is divided 2 parts .One part show the Estimated Cash receipt and other part show an estimated cash payment. This budget shows the cash position of the budget or business concern.
The Cash Budget is prepared by the cashier or by the Chief Accountant. Cash budget is closely related to the Sales Budget and Purchase Budget. This budget shows cash receipt and cash payment as well as cash balance of each month of the budgeted period.
Cash budget hence to know whether business has sufficient cash available to meet its need it also helps to know whether their will be shortage or surplus of cash during the budget period The business concern can take loan or overdraft of bank if there is shortage of cash .The business can take decision regarding the investment of excess cash
A cash plan for a defined period of time. It summarizes monthly receipts and payments. Hence, it highlights monthly surpluses and deficits of actual cash. Its main uses are:
To maintain control over a firm's cash requirements, e.g. stock and debtors To enable a firm to take precautionary measures and arrange in advance for
investment and loan facilities whenever cash surpluses or deficits arises To show the feasibility of management's plans in cash terms To illustrate the financial impact of changes in management policy, e.g. change
of credit terms offered to customers.
Receipts of cash Cash sales Payments by debtors
The sale of fixed assets The issue of new shares The receipt of interest and dividends from investments.
Payments of cash Purchase of stocks Payments of wages or other expenses Purchase of capital items Payment of interest, dividends or taxation.
5) Expenditure Budget
Definition
1. Budget based on the cost of goods and services already received and paid for.
2. Financial plan based on the cost of goods and services already received and paid for.
Expenditure Budget is to define an economic policy, with respect to the financial spending made for operational & distribution purpose, which include their making and maintenances.
In an Expenditure Budget, operation & distribution expenses are described in terms of the construction, maintenance of assets like plant, machineries and other facilities. In fact, all the possible expenses are listed and recorded in an Expenditure Budget.
As an integral part of the Expenditure Budget, the calculation of spending is based on the submission of facts for acceptance, from various portfolio departments to the Administration and Finance Divisions. It is the Administration and Finance Division, which suggests an operational budget scheme to the President and the Board of Trustees of the concerned Company for final approval. In case of Expenditure Budgets, there may arise a necessity for buying or renting equipments, even after the sales and the Production budgets are compiled simultaneously. This is because there is deficit in the availability of resources which are unable to satisfy the demand at a particular point of time. This ultimately leads to an escalation of the total expenses.
Primary objectives of Expenditure Budget:
At the time of allocation and spending of money, an Expenditure Budget takes into account the following few factors:
Budgetary financial acquisitions are allocated in a manner to the create symmetry and bring about a parity among the collective requirements of all customers.

Expenditure Budgets aim to maintain parity between the persisting commitments and fresh initiatives.
Expenditure Budgets balance different subject disciplines.
Symmetry is preserved by all Expenditure Budgets between all the available financial resources of a Company as well as resources like research work. This ultimately earns funds for the organization
6) Master Budget
When all subsidiary or functions budget are prepared the Master Budget is prepared. Master Budget is the summary of functional budget .This budget consists of budgeted Profit & Loss A/C and budgeted Balance Sheet. The Master Budget is prepared by the Budget Officer or Budget Directors. Master budget presenting to the budget committee for the final approval.
The budget committee will discuss in a meeting and submit it to the board if directors for approval the board of director make certain changes before it is finally approval after the final approval the budget becomes the official cleark.
Management action and cost control
Production information in management accounting form is expensive in terms of the time and effort involved. It will be very wasteful if the information once Production is not put into effective use.
There are five parts to an effective cost control system. These are:
a) Preparation of budgets
b) Communicating and agreeing budgets with all concerned
c) Having an accounting system that will record all actual costs
d) Preparing statements that will Compare actual costs with budgets, showing any variances and disclosing the reasons for them, and
e) Taking any appropriate action based on the analysis of the variances in d) above.
Action(s) that can be taken when a significant variance has been revealed will depend on the nature of the variance itself. Some variances can be identified to a specific department and it is

within that department's control to take corrective action. Other variances might prove to be much more difficult, and sometimes impossible, to control.
Variances revealed are historic. They show what happened last month or last quarter and no amount of analysis and discussion can alter that. However, they can be used to influence managerial action
CHAPTER 5
DATA ANALYSIS AND
INTERPRETATION
The following are of the zones under the operation & distribution of HINDUSTAN PETROLEUM CORPORATION LIMITED
The operation & distribution department is operated thru 7 zones. Out of 7 zones the West zone is choose for the Comparative study & analysis, due to paucity of time it is possible to analyses the data pertaining to each and every Zone.
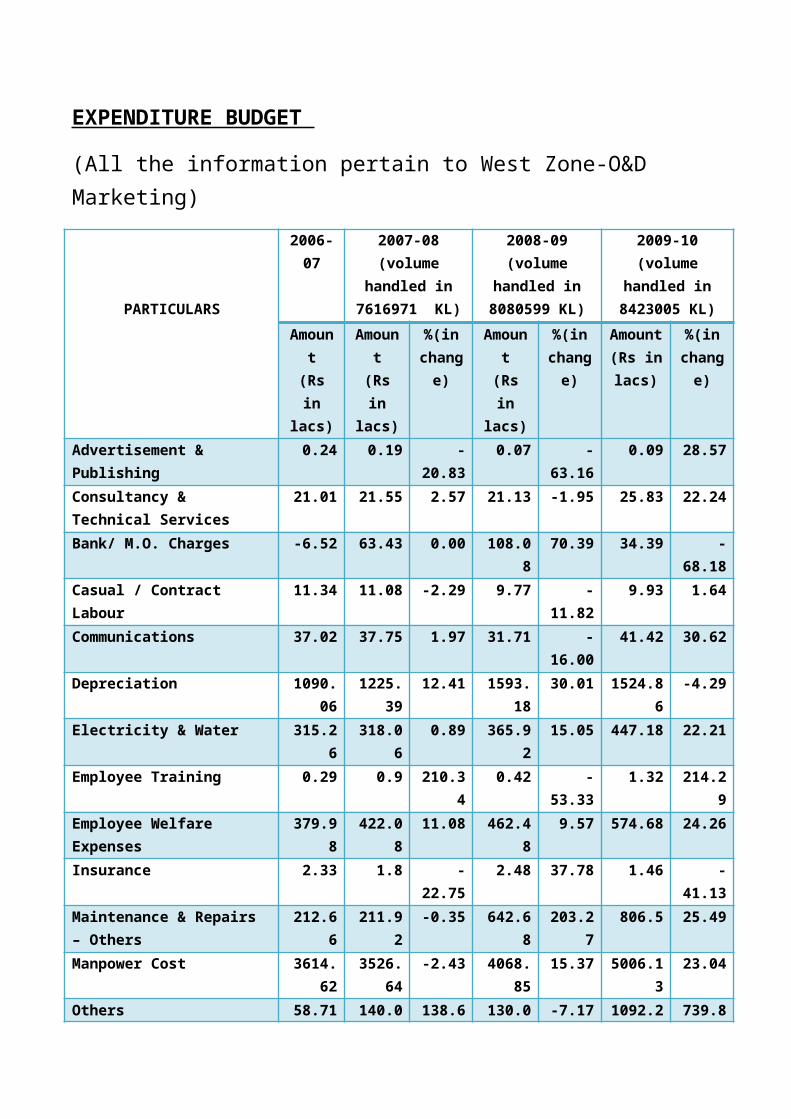
EXPENDITURE BUDGET
ZONE OPERATION
&DISTRIBUTION

(All the information pertain to West Zone-O&D Marketing)
PARTICULARS
2006-07 2007-08 (volume handled in
7616971 KL)
2008-09 (volume handled in
8080599 KL)
2009-10 (volume handled in
8423005 KL)
Amount (Rs in
lacs)
Amount (Rs in
lacs)
%(in change
)
Amount (Rs in
lacs)
%(in change
)
Amount (Rs in lacs)
%(in change
)
Advertisement & Publishing 0.24 0.19 -20.83 0.07 -63.16 0.09 28.57
Consultancy & Technical Services
21.01 21.55 2.57 21.13 -1.95 25.83 22.24
Bank/ M.O. Charges -6.52 63.43 0.00 108.08 70.39 34.39 -68.18
Casual / Contract Labour 11.34 11.08 -2.29 9.77 -11.82 9.93 1.64
Communications 37.02 37.75 1.97 31.71 -16.00 41.42 30.62
Depreciation 1090.06 1225.39 12.41 1593.18 30.01 1524.86 -4.29
Electricity & Water 315.26 318.06 0.89 365.92 15.05 447.18 22.21
Employee Training 0.29 0.9 210.34 0.42 -53.33 1.32 214.29
Employee Welfare Expenses 379.98 422.08 11.08 462.48 9.57 574.68 24.26
Insurance 2.33 1.8 -22.75 2.48 37.78 1.46 -41.13
Maintenance & Repairs – Others
212.66 211.92 -0.35 642.68 203.27 806.5 25.49
Manpower Cost 3614.62 3526.64 -2.43 4068.85 15.37 5006.13 23.04
Others 58.71 140.09 138.61 130.05 -7.17 1092.25 739.87
Overtime 120.74 109.94 -8.94 104.38 -5.06 98.83 -5.32
Printing & Stationery 31.64 21.33 -32.59 22.92 7.45 50.03 118.28
Public Awareness programs 18.07 27.96 54.73 43.22 54.58 16.55 -61.71
Rates & Taxes 2607.69 1287.28 -50.64 693.18 -46.15 752.4 8.54
Rent Expenses 533.52 503.25 -5.67 587.25 16.69 619.68 5.52
Security 118.94 140.56 18.18 163.98 16.66 226.7 38.25
Stores & Spares 792.96 74.83 -90.56 173.67 132.09 187.34 7.87
Travel & Conveyance 153.58 163.44 6.42 162.06 -0.84 159.69 -1.46
Utilities (Power & Fuel) 236.66 239.87 1.36 38.77 -83.84 61.12 57.65
TOTAL 10350.8 8549.34 -17.40 9426.25 10.26 11738.38 24.53
DIGRAMIC REPRESENTATION OF EXPENDITURE
2007-08 2008-09 2009-10
0.00
2000.00
4000.00
6000.00
8000.00
10000.00
12000.00
14000.00
8549.34 9426.25
11738.38
EXPENDITURE (Rs in lacs)
EXPENDITURE (Rs in lacs)
(Rs
in la
cs)
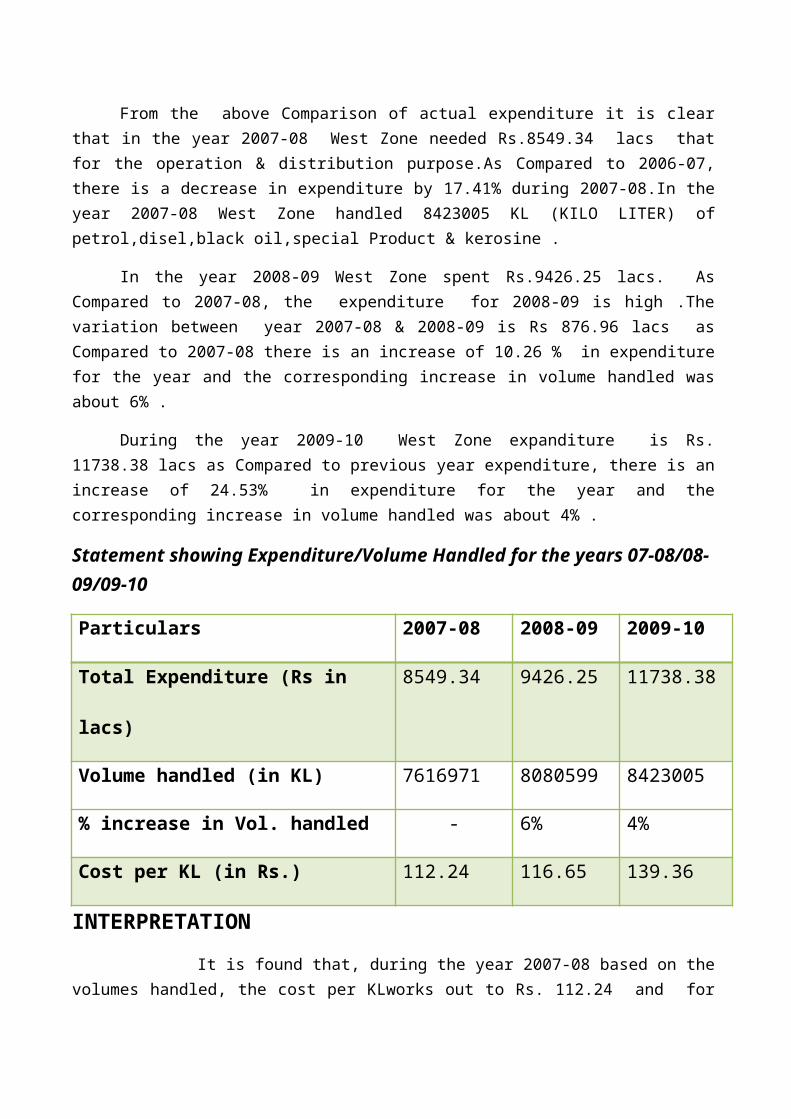
From the above Comparison of actual expenditure it is clear that in the year 2007-08 West Zone needed Rs.8549.34 lacs that for the operation & distribution purpose.As Compared to 2006-07, there is a decrease in expenditure by 17.41% during 2007-08.In the year 2007-08 West Zone handled 8423005 KL (KILO LITER) of petrol,disel,black oil,special Product & kerosine .
In the year 2008-09 West Zone spent Rs.9426.25 lacs. As Compared to 2007-08, the expenditure for 2008-09 is high .The variation between year 2007-08 & 2008-09 is Rs 876.96 lacs as Compared to 2007-08 there is an increase of 10.26 % in expenditure for the year and the corresponding increase in volume handled was about 6% .
During the year 2009-10 West Zone expanditure is Rs. 11738.38 lacs as Compared to previous year expenditure, there is an increase of 24.53% in expenditure for the year and the corresponding increase in volume handled was about 4% .
Statement showing Expenditure/Volume Handled for the years 07-08/08-09/09-10
Particulars 2007-08 2008-09 2009-10
Total Expenditure (Rs in lacs) 8549.34 9426.25 11738.38
Volume handled (in KL) 7616971 8080599 8423005
% increase in Vol. handled - 6% 4%
Cost per KL (in Rs.) 112.24 116.65 139.36
INTERPRETATION
It is found that, during the year 2007-08 based on the volumes handled, the cost per KLworks out to Rs. 112.24 and for the years 2008-09 & 2009-10, the cost per KL is at Rs 116.65
& Rs.139.36 respectively, it means that the expenditure does not change in the ratio of the volume handled. It seems that there is no control on expenditure which incurred on volumed handled. Therefore it is prooved that Company should keep constant watch on its.
Analysis of Expenditure
1.Advertisement & publishing
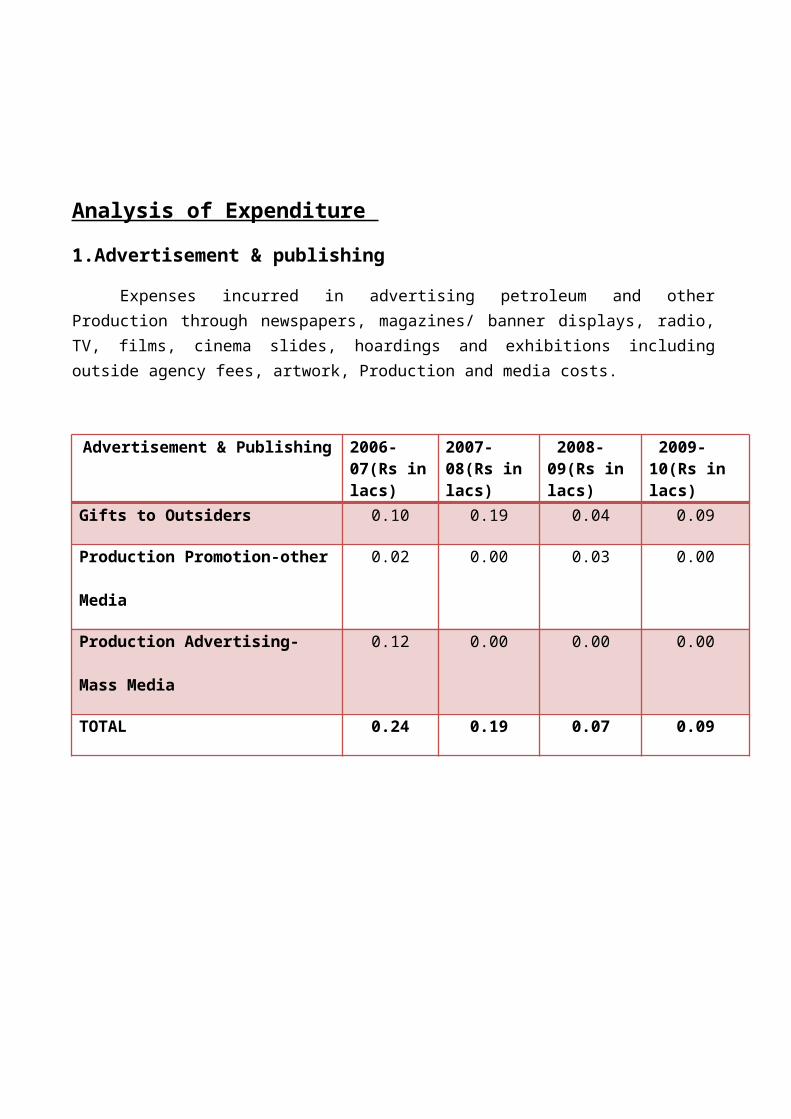
Expenses incurred in advertising petroleum and other Production through newspapers, magazines/ banner displays, radio, TV, films, cinema slides, hoardings and exhibitions including outside agency fees, artwork, Production and media costs.
Advertisement & Publishing 2006-07(Rs in lacs)
2007-08(Rs in lacs)
2008-09(Rs in lacs)
2009-10(Rs in lacs)
Gifts to Outsiders 0.10 0.19 0.04 0.09
Production Promotion-other Media 0.02 0.00 0.03 0.00
Production Advertising- Mass Media 0.12 0.00 0.00 0.00
TOTAL 0.24 0.19 0.07 0.09
2006-07 2007-08 2008-09 2009-10
0.00
0.05
0.10
0.15
0.20
0.250.24
0.19
0.07
0.09
Advertisement & Publishing
Advertisement & Publishing
(Rs
in l
acs
)
INTERPRETATION
Advertisement & publishing expenditure in the year 2006-07 Rs.0.24 lacs & 2007-08,2008-09 and 2009-10 is respectively Rs.0.19 lacs,0.07 lacs and 0.09 lacs ,so the advertising & publishing expenses is decrease because of the some of the volume handled depo were closed that’s reason the advertising & publishing expenses decrease.
2. Consultancy & Technical Services
Expenditure incurred mainly on account of hiring consultants for technical services are covered under this charter of expense:
Particulars 2006-07(Rs in lacs)
2007-08(Rs in lacs)
2008-09(Rs in lacs)
2009-10(Rs in lacs)
Consultancy/Technical Services 21.01 21.55 21.13 25.83
TOTAL 21.01 21.55 21.13 25.83
2006-07 2007-08 2008-09 2009-100
5
10
15
20
25
30
21.01 21.55 21.13
25.83
Consultancy/Technical Services
Consultancy/Tech Services
(Rs
in la
cs)
INTERPRETATION
It may be noted from the above data/information, charges incurred on Consultancy & Technical services for the year 2006-07 is at Rs.21.01 lacs. Whereas these expenses for the years 2007-08 ,2008-09 & 2009-10 is at Rs.21.55 lacs,Rs.21.13 lacs,and Rs.25.83 lacs respectively. As can be seen from the data that there is a slight increase in this head of expenditure during the year 2009-10 as Compared to the past three years, This increase was occurred due to payment of consultancy charges for conducting study of manpower to identify excess/shortages at the locations which is required to control overtime as well as for the best utilisation of available manpower.
3. Bank/ M.O. ChargesExpenses pertaining to Remittance charges for transmitting Funds from upcountry locations
to Mumbai, Cost of negotiating upcountry cheques Deposited at various locations, Stamp duty and
service charges for Consortium arrangements, Encashing Payroll cheques- Bank charges-Excise duty payments
Bank/ M.O. Charges 2006-07(Rs
in lacs)
2007-08(Rs
in lacs)
2008-09(Rs
in lacs)
2009-10(Rs
in lacs)
Bank Charges -6.52 63.43 108.08 34.25
Brokerage /Commission 0 0 0 0.15
TOTAL -6.52 63.43 108.08 34.39
2006-07 2007-08 2008-09 2009-10-20.00
0.00
20.00
40.00
60.00
80.00
100.00
120.00
63.43
108.08
34.39
Bank/ M.O. Charges
Bank/ M.O. Charges
(Rs
in la
cs)
INTERPRETATION
From the above information the Bank/M.O Charges is the important expenditure is the Company the Bank/M.O charges is 2006-07 is Rs.-6.52 lacs & 2007-08 ,2008-09 and 2009-10 is Rs.63.43 lacs,Rs.108.08 lacs and Rs.34.83 lacs. Bank /M.O.charges increase up to 2008-09 and after that decrease by73.69 lacs. Bank M.O charges have decreased by 68.18% because presently instead of traditional method new E-commerce system has been applied.
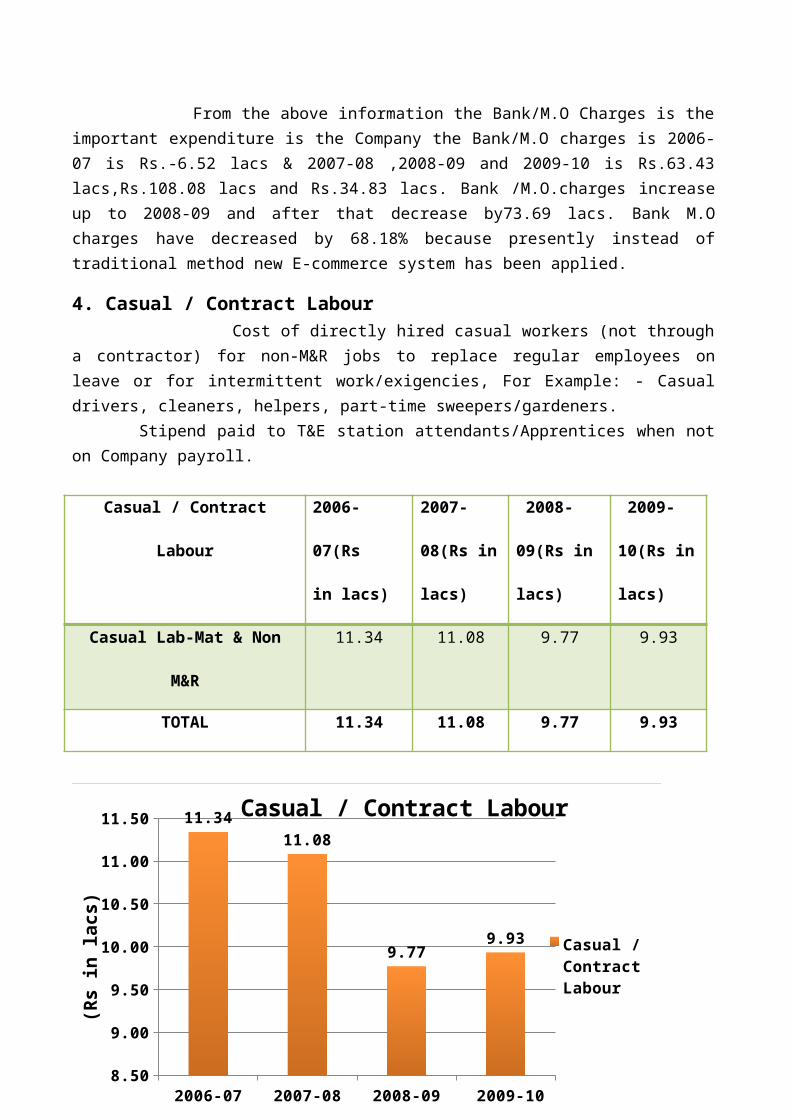
4. Casual / Contract Labour Cost of directly hired casual workers (not through a contractor) for non-M&R jobs to replace regular employees on leave or for intermittent work/exigencies, For Example: - Casual drivers, cleaners, helpers, part-time sweepers/gardeners.
Stipend paid to T&E station attendants/Apprentices when not on Company payroll.
Casual / Contract Labour 2006-07(Rs
in lacs)
2007-08(Rs
in lacs)
2008-09(Rs
in lacs)
2009-10(Rs
in lacs)
Casual Lab-Mat & Non M&R 11.34 11.08 9.77 9.93
TOTAL 11.34 11.08 9.77 9.93
INTERPRETATION
From the above information casual /contract labour in the year 2006-07 is Rs .11.34 lacs and the year 2007-08,2008-09 & 2009-10 is Rs.11.08 lacs,Rs.9.77lacs,Rs.9.93 lacs respectively,so overall expenditure is position good because the casual /contract labour expenditure is decrease the Company less concentrate on the casual /contract labour expenditure .Because of the removal of the casual labours from the Company.
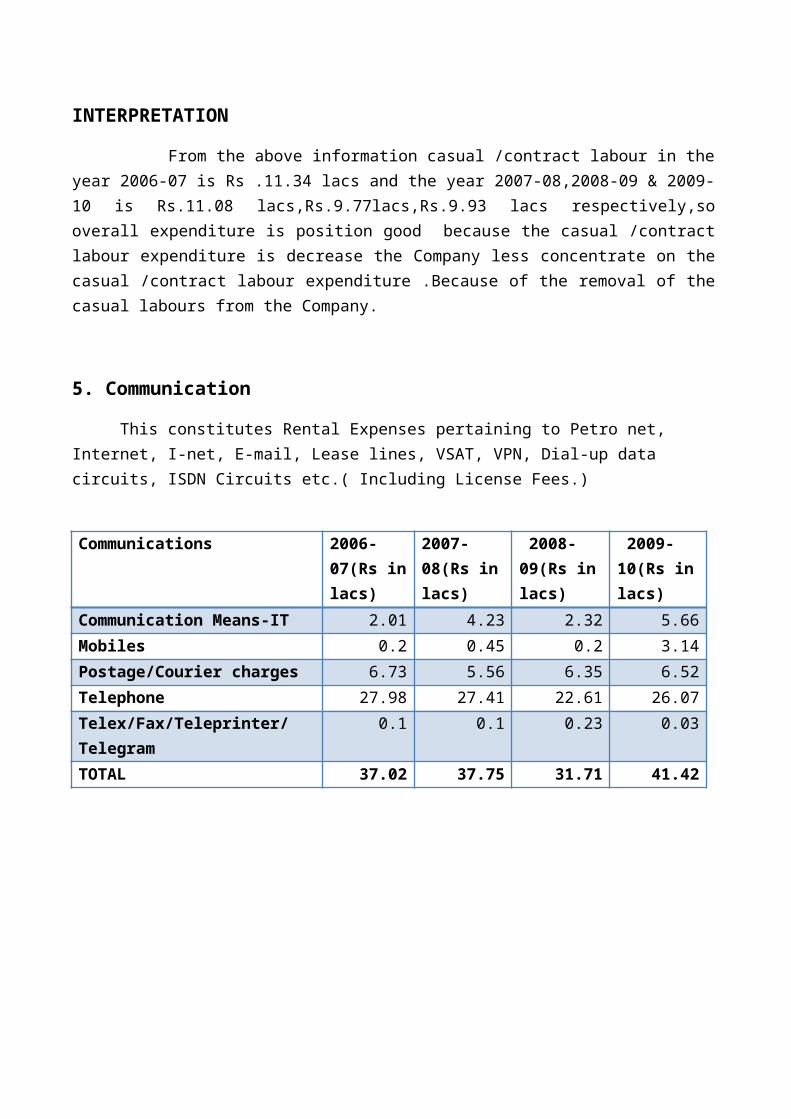
5. Communication
This constitutes Rental Expenses pertaining to Petro net, Internet, I-net, E-mail, Lease lines, VSAT, VPN, Dial-up data circuits, ISDN Circuits etc.( Including License Fees.)
2006-07 2007-08 2008-09 2009-108.50
9.00
9.50
10.00
10.50
11.00
11.50 11.34
11.08
9.779.93
Casual / Contract Labour
Casual / Con-tract Labour
(Rs
in la
cs)
Communications 2006-07(Rs in lacs)
2007-08(Rs in lacs)
2008-09(Rs in lacs)
2009-10(Rs in lacs)
Communication Means-IT 2.01 4.23 2.32 5.66
Mobiles 0.2 0.45 0.2 3.14
Postage/Courier charges 6.73 5.56 6.35 6.52
Telephone 27.98 27.41 22.61 26.07
Telex/Fax/Teleprinter/Telegram 0.1 0.1 0.23 0.03
TOTAL 37.02 37.75 31.71 41.42
2006-07 2007-08 2008-09 2009-100.00
5.00
10.00
15.00
20.00
25.00
30.00
35.00
40.00
45.00
37.02 37.75
31.71
41.42Communications
Communications
(Rs
in l
acs
)
INTERPRETATION
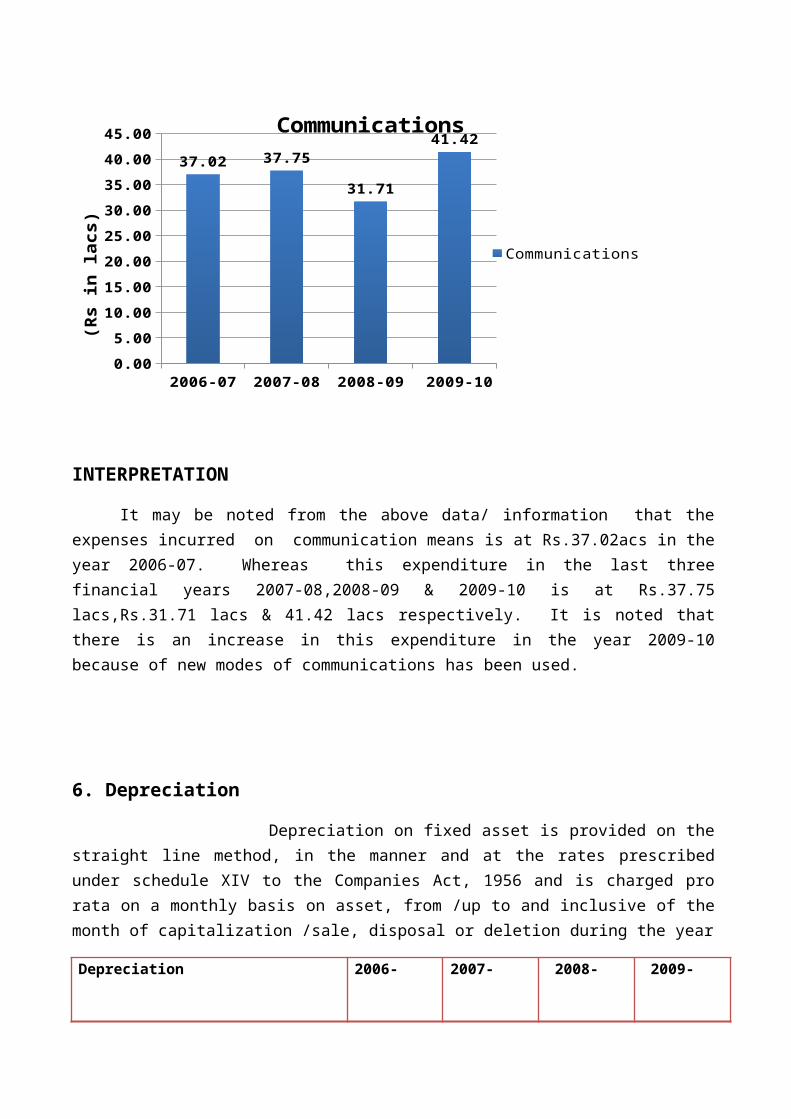
It may be noted from the above data/ information that the expenses incurred on communication means is at Rs.37.02acs in the year 2006-07. Whereas this expenditure in the last three financial years 2007-08,2008-09 & 2009-10 is at Rs.37.75 lacs,Rs.31.71 lacs & 41.42 lacs respectively. It is noted that there is an increase in this expenditure in the year 2009-10 because of new modes of communications has been used.
6. Depreciation

Depreciation on fixed asset is provided on the straight line method, in the manner and at the rates prescribed under schedule XIV to the Companies Act, 1956 and is charged pro rata on a monthly basis on asset, from /up to and inclusive of the month of capitalization /sale, disposal or deletion during the year
Depreciation 2006-07(Rs
in lacs)
2007-08(Rs
in lacs)
2008-09(Rs
in lacs)
2009-10(Rs
in lacs)
Depreciation 1090.1 1225.39 1593.18 1524.86
TOTAL 1090.1 1225.39 1593.18 1524.86
2006-07 2007-08 2008-09 2009-100.00
200.00
400.00
600.00
800.00
1000.00
1200.00
1400.00
1600.00
1800.00
1090.011225.39
1593.181524.86
Depreciation
Depreciation
(Rs
in la
cs)
INTERPRETATION
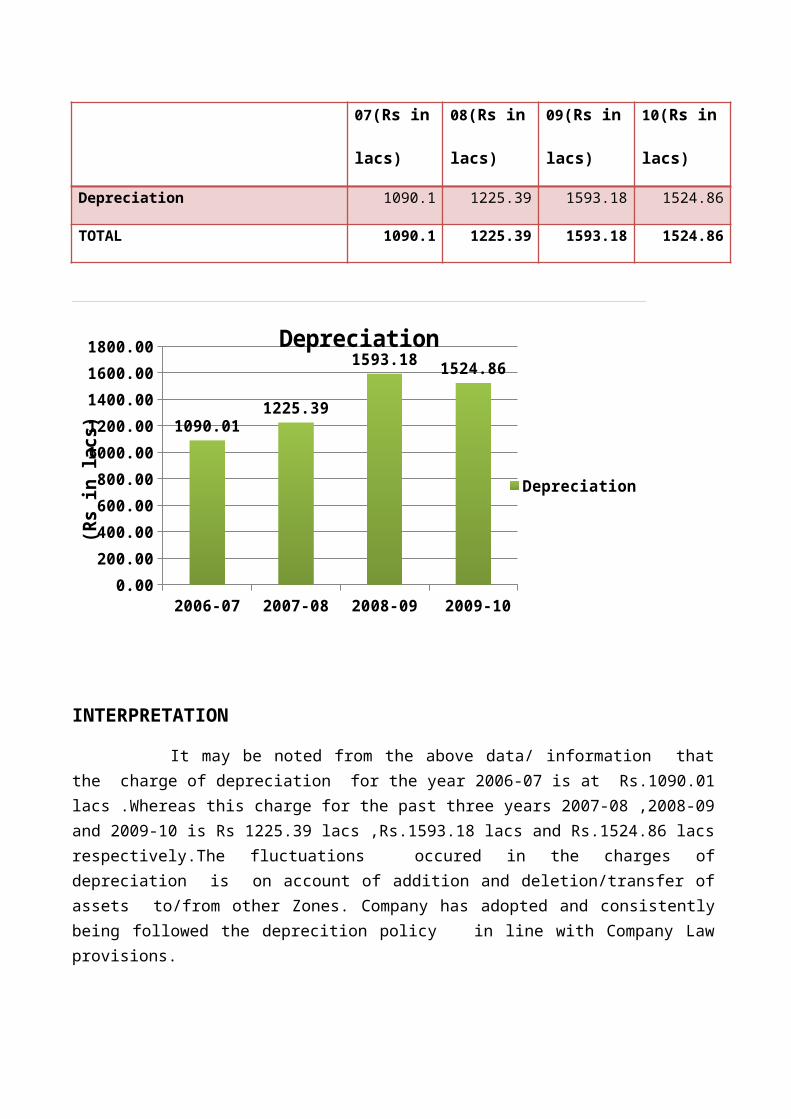
It may be noted from the above data/ information that the charge of depreciation for the year 2006-07 is at Rs.1090.01 lacs .Whereas this charge for the past three years 2007-08 ,2008-09 and 2009-10 is Rs 1225.39 lacs ,Rs.1593.18 lacs and Rs.1524.86 lacs respectively.The fluctuations occured in the charges of depreciation is on account of addition and deletion/transfer of assets to/from other Zones. Company has adopted and consistently being followed the deprecition policy in line with Company Law provisions.
7. Electricity & Water:
Payment of Electricity consumption charges on equipments and other operations at various locations at the Zone and cost of water purchased are being accounted under this character of expense.
Electricity & Water 2006-07(Rs
in lacs)
2007-08(Rs
in lacs)
2008-09(Rs
in lacs)
2009-10(Rs
in lacs)
Electricity - Energy Charges 6.36 30.16 8.65 1.79
Electricity 279.16 249.44 320.07 407.84
Electricity - other 4.12 0.41 0 0
Water 25.62 38.05 37.2 37.55
TOTAL 315.26 318.06 365.92 447.18
2006-07 2007-08 2008-09 2009-100.00
50.00
100.00
150.00
200.00
250.00
300.00
350.00
400.00
450.00
500.00
315.26 318.06
365.92
447.18
Electricity & Water
Electricity & Wa-ter
(Rs
in l
acs
)
INTERPRETATION
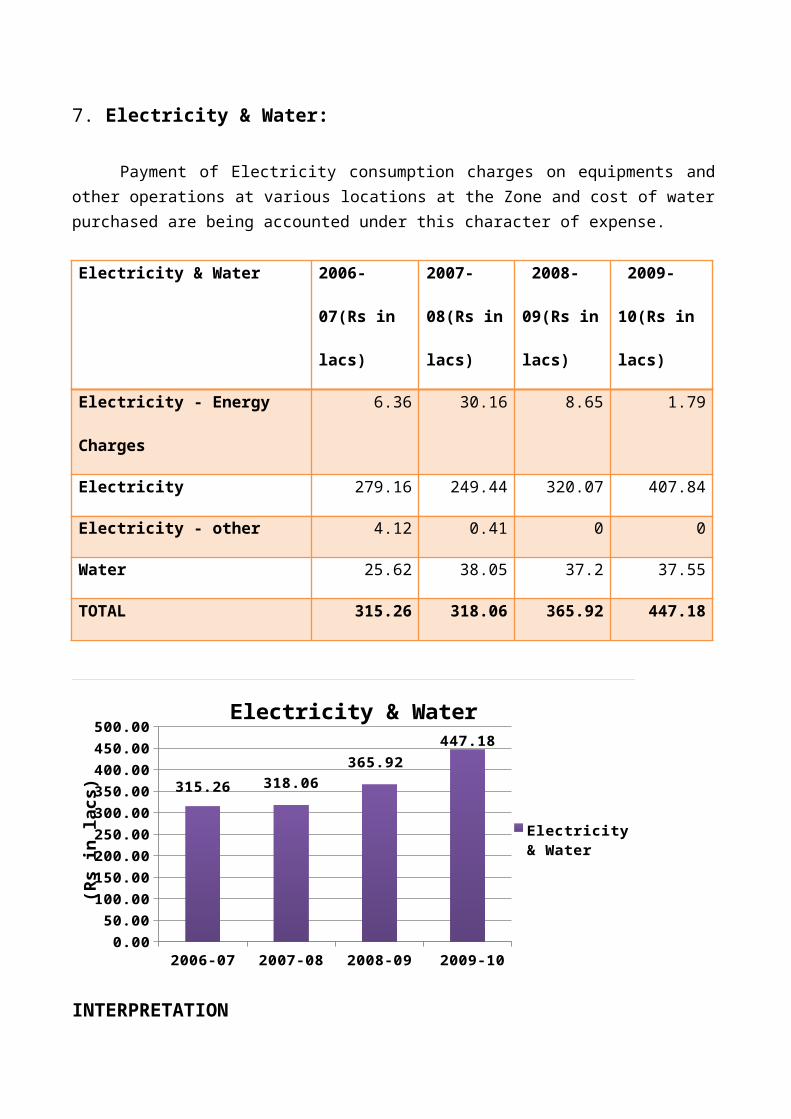
It may be noted from the above data that the cost of electricity & water in the year 2006-07 is at Rs.315.26 lacs. Whereas in the immediate past three years 2007-08,2008-09 & 2009-10, this expenditure is at Rs.318.06 lacs ,Rs.365,92lacs &Rs. 447.18 lacs respectively. As can be seen from the above that there is an increase in this expenditure which is mainly due to increase in tariff and also due to increase in volumes handled at the loctions.On over all basis this expenditure is under control.
8. Employee Training
The expenses paid for the training to the employee for effective work for new/old employee.
Employee Training 2006-07(Rs
in lacs)
2007-08(Rs
in lacs)
2008-09(Rs
in lacs)
2009-10(Rs
in lacs)
Training Expenses 0.29 0.9 0.42 1.32
TOTAL 0.29 0.9 0.42 1.32
2006-07 2007-08 2008-09 2009-100.00
0.20
0.40
0.60
0.80
1.00
1.20
1.40
0.29
0.90
0.42
1.32Employee Training
Employee Train-ing
(Rs
in l
acs)
INTERPRETATION
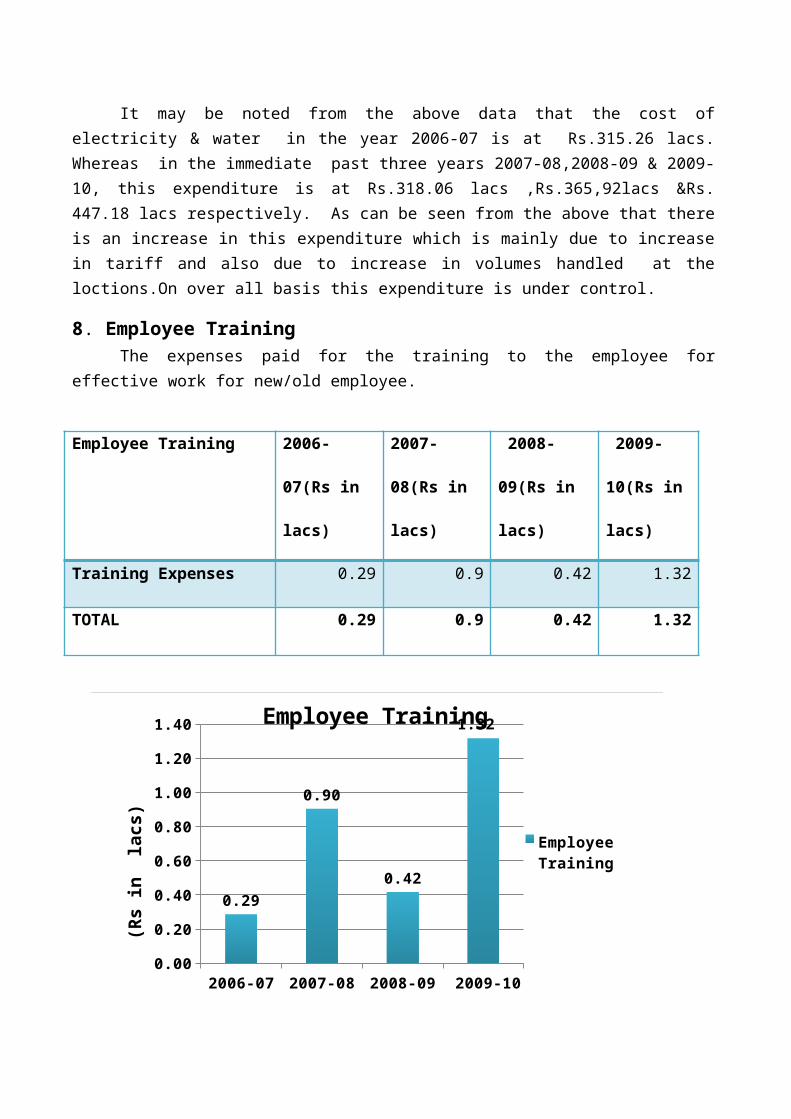
From the above data the expenditure in the employee training is expenditure in the year 2006-07 for the Rs.0.29 lacs ,2007-08 is Rs.0.90 lacs ,2008-09 is Rs.0.42 lacs and in the year 2009-10 is Rs.1.32 lacs,expenditure on the emploee training has increased as Compare to last some years.Because new employee has been recruited and imparted a training .
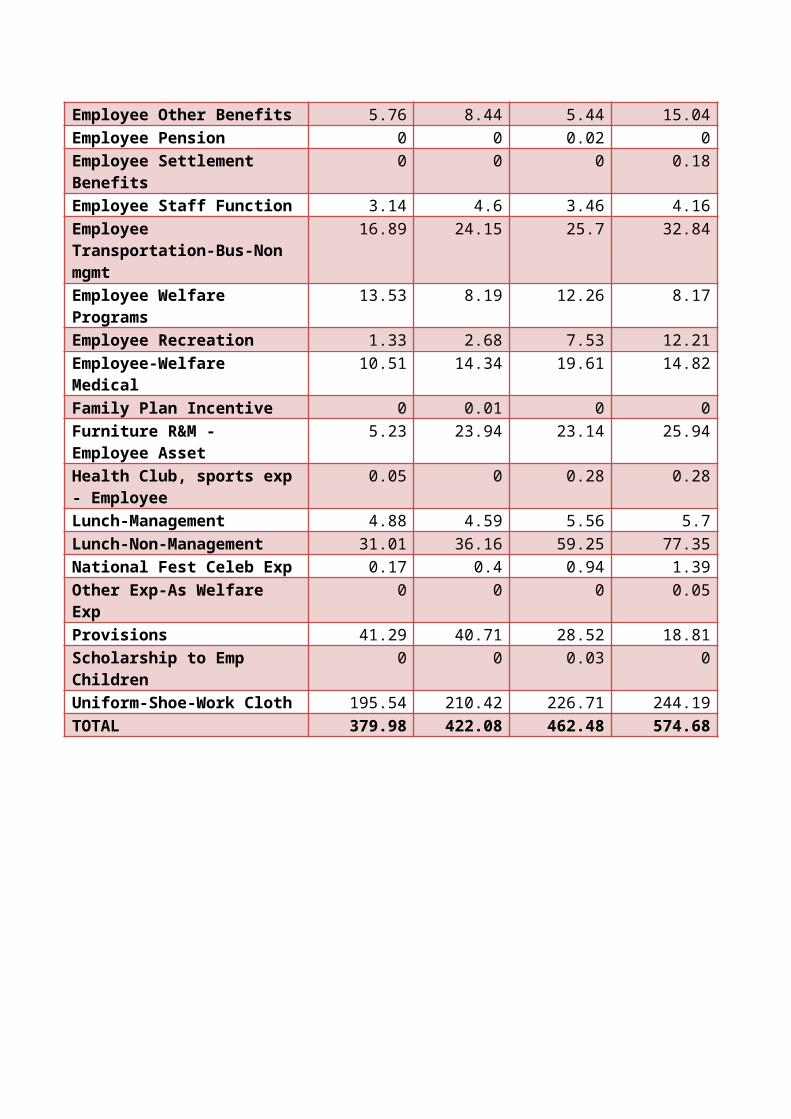
9. Employee Welfare Expenses
These expenses are incurred in connection with the welfare of regular employees and other benefit being provided to the employee as per the terms of employment and the policy of the Corporation, like work cloths, lunch facility ,employee health club, sports etc.
Employee Welfare Expenses 2006-07(Rs in lacs)
2007-08(Rs in lacs)
2008-09(Rs in lacs)
2009-10(Rs in lacs)
Admin Charges - EPF 2.52 0.41 0 0Cafeteria Provisions 37.05 42.16 43.58 103.2
Club Membership fee - Employee 0 0 0 0
Contract Labour-Cafeteria 10.59 0.3 0.02 8.29
Contract -Labor Welfare 0.46 0.45 0.45 1.06
Compensation- Extra Hours 0 0 0 0.37
Compensation-Holiday Working 0 0 0 0.09
Contribution - EDLI 0 0.05 0 0
Double /Triple Shift-Normal Day 0.03 0 0 0.53
Employee Death Benefits 0 0.08 0.04 0.12
Employee Other Benefits 5.76 8.44 5.44 15.04
Employee Pension 0 0 0.02 0
Employee Settlement Benefits 0 0 0 0.18
Employee Staff Function 3.14 4.6 3.46 4.16
Employee Transportation-Bus-Non mgmt
16.89 24.15 25.7 32.84
Employee Welfare Programs 13.53 8.19 12.26 8.17
Employee Recreation 1.33 2.68 7.53 12.21
Employee-Welfare Medical 10.51 14.34 19.61 14.82
Family Plan Incentive 0 0.01 0 0
Furniture R&M - Employee Asset
5.23 23.94 23.14 25.94
Health Club, sports exp - Employee
0.05 0 0.28 0.28
Lunch-Management 4.88 4.59 5.56 5.7
Lunch-Non-Management 31.01 36.16 59.25 77.35
National Fest Celeb Exp 0.17 0.4 0.94 1.39
Other Exp-As Welfare Exp 0 0 0 0.05
Provisions 41.29 40.71 28.52 18.81
Scholarship to Emp Children 0 0 0.03 0
Uniform-Shoe-Work Cloth 195.54 210.42 226.71 244.19
TOTAL 379.98 422.08 462.48 574.68

2006-07 2007-08 2008-09 2009-100
100
200
300
400
500
600
700
379.979999999999
422.08
462.479999999999
574.68
Employee Welfare Expenses
Employee Welfare Expenses
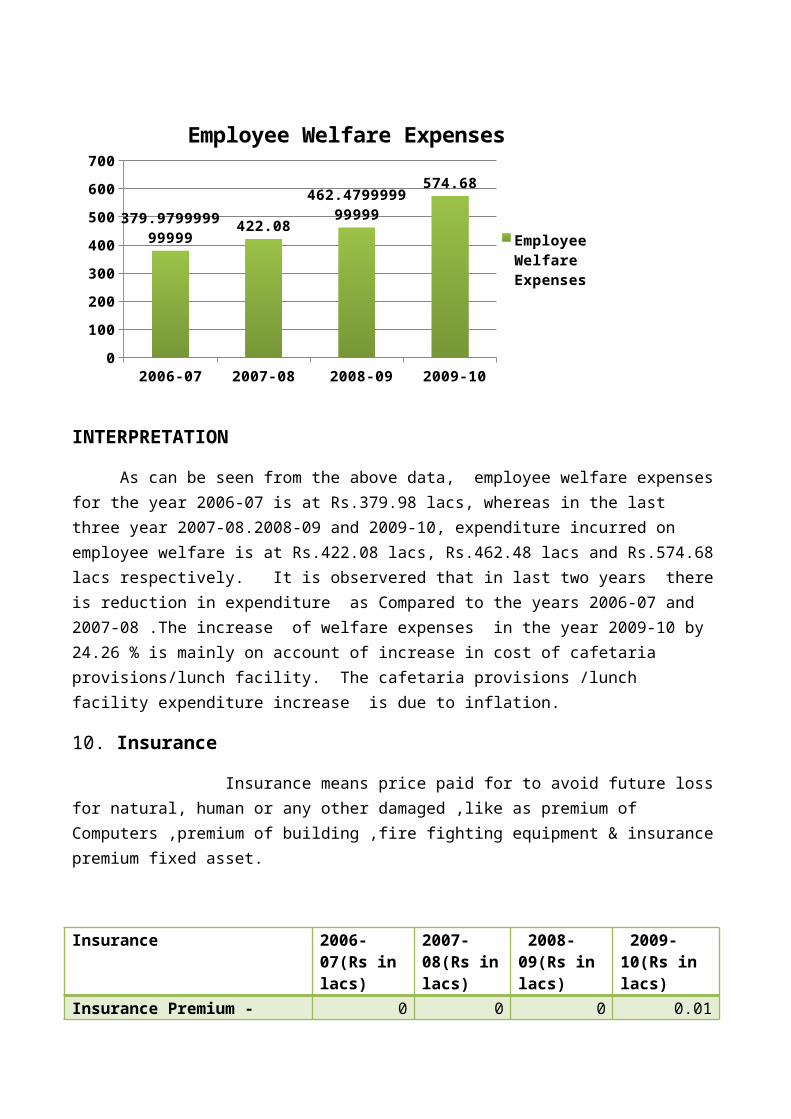
INTERPRETATION
As can be seen from the above data, employee welfare expenses for the year 2006-07 is at Rs.379.98 lacs, whereas in the last three year 2007-08.2008-09 and 2009-10, expenditure incurred on employee welfare is at Rs.422.08 lacs, Rs.462.48 lacs and Rs.574.68 lacs respectively. It is observered that in last two years there is reduction in expenditure as Compared to the years 2006-07 and 2007-08 .The increase of welfare expenses in the year 2009-10 by 24.26 % is mainly on account of increase in cost of cafetaria provisions/lunch facility. The cafetaria provisions /lunch facility expenditure increase is due to inflation.
10. Insurance
Insurance means price paid for to avoid future loss for natural, human or any other damaged ,like as premium of Computers ,premium of building ,fire fighting equipment & insurance premium fixed asset.
Insurance 2006-07(Rs in lacs)
2007-08(Rs in lacs)
2008-09(Rs in lacs)
2009-10(Rs in lacs)
Insurance Premium - Marine 0 0 0 0.01
Insurance Premium - Other 0.6 0.07 0 0
Insurance Premium - Vehicles 0 0 0.26 0.18
Ins Premium-Fixed Asset / Stocks 2.33 1.73 2.22 1.27
TOTAL 2.93 1.8 2.48 1.46
2006-07 2007-08 2008-09 2009-100.00
0.50
1.00
1.50
2.00
2.50
3.00
3.50
2.93
1.8
2.48
1.46
Insurance
Insurance
(Rs
in la
cs)
INTERPRETATION
From the above data insurance premium expenditure in the year 2006-07 is Rs.2.93 lacs ,2007-08 is Rs.1.8 lacs ,2008-09 is Rs.2.48 lacs and the year 2009-10 is Rs.1.46 lacs , insurance charges decrease as Compare to previous year 2008-09 .the insurance expenditure decrease by 41.13 % ,as Compared to last few years the asset value has decrease therefore the insurance premium charges has decreased.
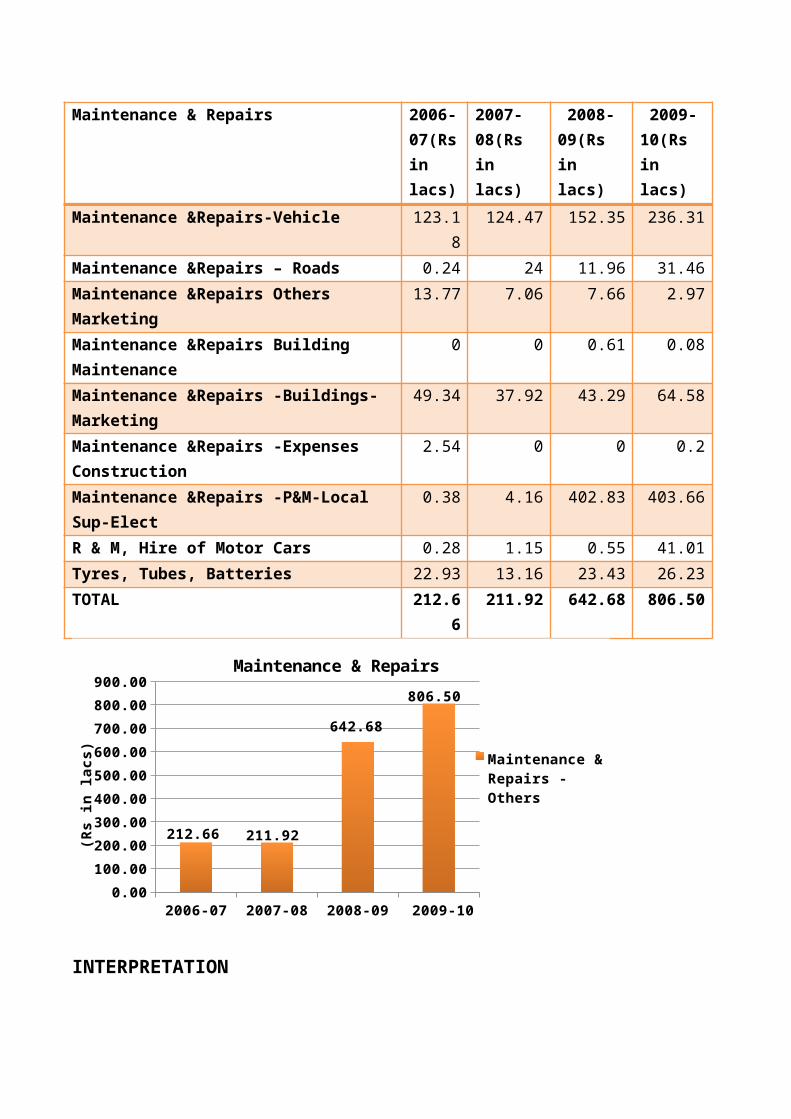
11. Maintenance & Repairs It represent the expenses incurred on regular and preventive maintenance and upkeeping of
various assets at the locations like roads, building ,plant & equipment and other misc. assets:
Maintenance & Repairs 2006-07(Rs in lacs)
2007-08(Rs in lacs)
2008-09(Rs in lacs)
2009-10(Rs in lacs)
Maintenance &Repairs-Vehicle 123.18 124.47 152.35 236.31
Maintenance &Repairs – Roads 0.24 24 11.96 31.46
Maintenance &Repairs Others Marketing 13.77 7.06 7.66 2.97
Maintenance &Repairs Building Maintenance 0 0 0.61 0.08
Maintenance &Repairs -Buildings-Marketing 49.34 37.92 43.29 64.58
Maintenance &Repairs -Expenses Construction
2.54 0 0 0.2
Maintenance &Repairs -P&M-Local Sup-Elect 0.38 4.16 402.83 403.66
R & M, Hire of Motor Cars 0.28 1.15 0.55 41.01
Tyres, Tubes, Batteries 22.93 13.16 23.43 26.23
TOTAL 212.66 211.92 642.68 806.50

2006-07 2007-08 2008-09 2009-100.00
100.00
200.00
300.00
400.00
500.00
600.00
700.00
800.00
900.00
212.66 211.92
642.68
806.50
Maintenance & Repairs
Maintenance & Repairs - Others
(Rs
in la
cs)
INTERPRETATION
As can be seen from the above data/information, that the expenses incurred towards Maintenance & repairs of location assets for the year 2006-07 is at Rs.212.66 lacs, whereas in the last three years 2007-08,2008-09 and 2009-10 this expenditure is at Rs.211.92 lacs, Rs. 642.68 lacs and Rs.806.50 lacs. On Comperison of the figures of last three years, it is observed that there is a substantial increase in this expenditure in the last two years. On further analyses of this increase, it is noted that the Company has taken up new initiative called “ Visual Indentity of Locations” for improving safety and image of stake holders. This a one time exercise. The increase is justified for betterment of the locations.
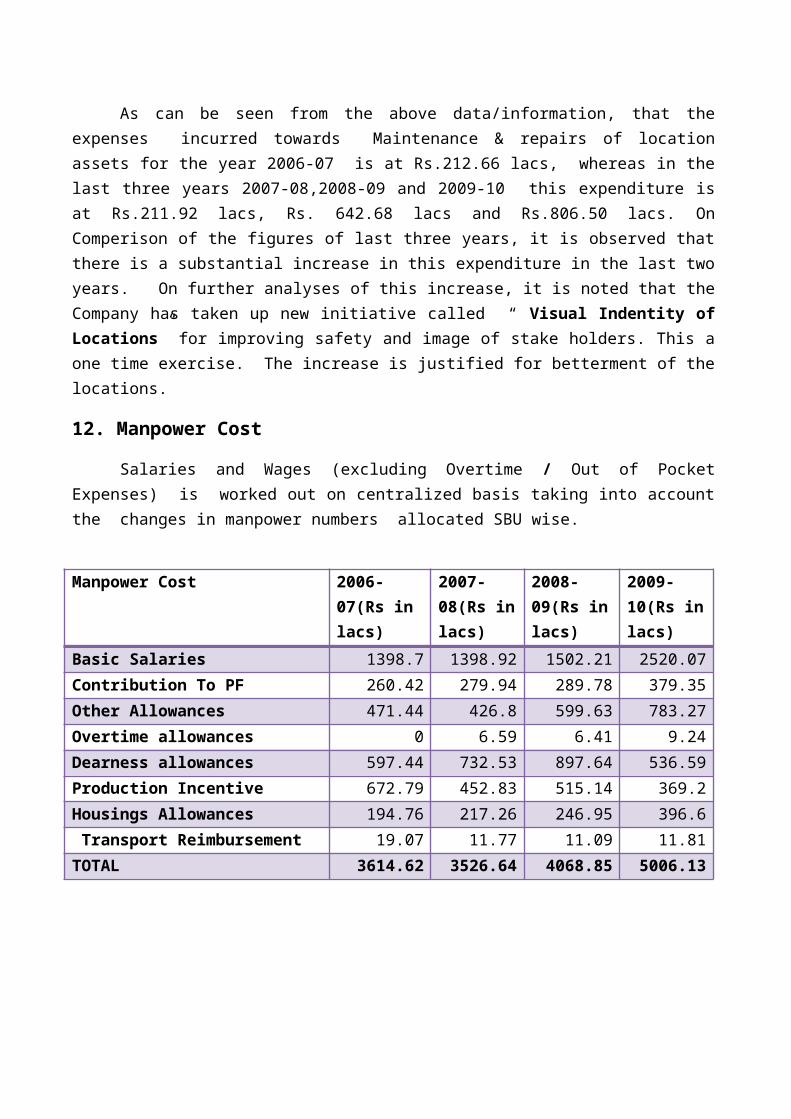
12. Manpower Cost
Salaries and Wages (excluding Overtime / Out of Pocket Expenses) is worked out on centralized basis taking into account the changes in manpower numbers allocated SBU wise.
Manpower Cost 2006-07(Rs in lacs)
2007-08(Rs in lacs)
2008-09(Rs in lacs)
2009-10(Rs in lacs)
Basic Salaries 1398.7 1398.92 1502.21 2520.07
Contribution To PF 260.42 279.94 289.78 379.35
Other Allowances 471.44 426.8 599.63 783.27
Overtime allowances 0 6.59 6.41 9.24
Dearness allowances 597.44 732.53 897.64 536.59
Production Incentive 672.79 452.83 515.14 369.2
Housings Allowances 194.76 217.26 246.95 396.6
Transport Reimbursement 19.07 11.77 11.09 11.81
TOTAL 3614.62 3526.64 4068.85 5006.13
2006-07 2007-08 2008-09 2009-100
1000
2000
3000
4000
5000
6000
3614.62 3526.644068.85
5006.13
Manpower Cost
Manpower Cost
Rs
in la
cs
INTERPRETATIONAs can be seen from the above data that the cost of manpower in the year 2006-07 is at
Rs.3614.62 lacs, whereas in the last three years 2007-08,2008-09 and 2009-10, this expenditure is at Rs.3526.64 lacs, Rs.4068.85 lacs, and Rs.5006.13lacs respectively. It is noted that there is an increase of about 23.04 % recorded in last year in manpower cost as Compared to 2006-07. This increase is attributable to the revision in salaries of the management staff which has taken place during the year 2009-10 w.e.f Jan.07.
13. Others
In this category the books, magazines, newspaper, entertainment outsiders expenses and other expenses coming.
Others 2006-07(Rs in lacs)
2007-08(Rs in lacs)
2008-09(Rs in lacs)
2009-10(Rs in lacs)
Books 16.38 58.97 5.81 30.73
Entertainment 2.93 20.92 33.67 977.46
Magazines 25.79 25.91 27.88 1.67
Newspaper 13.61 34.29 62.69 82.39
TOTAL 58.71 140.09 130.05 1092.25

2006-07 2007-08 2008-09 2009-100
200
400
600
800
1000
1200
58.71140.09 130.05
1092.25
Others
Others
(Rs
in la
cs)
INTERPRETATION
From the above data the other expenses in the year 2006-07 Rs.58.71 lacs ,in the year 2007-08 Rs.140.09 lacs,in the year 2008-09 Rs.130.05lacs and in the year 2009-10 Rs.1092.25 lacs.As Compensetionare to last year figure tis year increase big variance .The variance between 2009-10 and 2008-09 is Rs.962.2 lacs.739.77 % increase with respect to expenditure in 2008-09 in order to motivate the employee to raise the job morale and job enrollment.
14. Overtime
Overtime of Non-Management staff in ERP through payroll includes: Over time payment for working in excess of normal working hours,
Working on Saturday for 5 day week locations beyond normal working hours
Working on Sunday or a weekly off day with CDO
Working on declared National/ Festival holiday
Call on allowances, occasional shifts absentee relief.

Overtime 2006-07(Rs in lacs)
2007-08(Rs in lacs)
2008-09(Rs in lacs)
2009-10(Rs in lacs)
Overtime 120.74 109.94 104.38 98.83
TOTAL 120.74 109.94 104.38 98.83
2006-07 2007-08 2008-09 2009-10
0
20
40
60
80
100
120
140120.74
109.94104.38
98.83
Overtime
Overtime
(RS
in la
cs)
INTERPRETATION
It is noted from data presented above that the expenditure incurred on payment of wages to Non-management staff towards overtime is at Rs.120.74 lacs in the year 2006-07, whereas in the last three years 2007-08.2008-09 and 2009-10, this is at Rs.109.94 lacs, Rs.104.38 and Rs.98.83 lacs respectively. It is observed that there is constant reduction in this cost element in the past three years, it shows that Management is taking necessary steps in controlling this cost thru manpower realignment and proper planning in working hours etc,Hence it is undoubtly a very good trend in expenditure management.
15. Printing & Stationery
In this category the expenses relating to the printing & stationery, Documents, Xerox, Drawing expenses etc. are covered.
Printing & Stationery 2006-07(Rs 2007-08(Rs 2008-09(Rs 2009-10(Rs

in lacs) in lacs) in lacs) in lacs)
Computer Stationery 0.56 0.58 0.73 2.08
Documentation, Xerox, Drawing. 0 0 0.1 0.08
Printing 3.44 0 0 12.31
Other Office Supplies 9.34 2.51 3.83 4.82
Stationery & 18.3 18.24 18.26 30.74
TOTAL 31.64 21.33 22.92 50.03
2006-07 2007-08 2008-09 2009-100
10
20
30
40
50
60
31.64
21.33 22.92
50.03
Printing & Stationery
Printing & Sta-tionery
(Rs
in l
acs
)
INTERPRETATION
It may be noted from the data given above that the expenditure incurred on Printing & stationery at the Zone for the year 2006-07 is at Rs.31.64 lacs. Whereas in the last three years this expendute is at Rs.21.33 lacs ( 2007-08), Rs.22.92 lacs (2008-09) and Rs.50.03 lacs(2009-10). It is observed that there is an increase of 118.28 % in this head of expenses during last year as Compared to 2008-09. The primary reasons for such an increase in Printing and Stationery are
(a) Increase in Prices of stationery Items (b) Usage of more computer Stationery. Hence, it is suggested to have a thorough review of this element of cost .
16. Public Awareness programs: This expenditure paid for the public awareness program.
Public Awareness programs 2006-07(Rs
in lacs)
2007-08(Rs
in lacs)
2008-09(Rs
in lacs)
200910(Rs
in lacs)
Oil/Energy Conservation Program 0.08 0.06 0 0
Public/Dealer/Customer Education
Program
17.99 27.9 43.22 16.55
TOTAL 18.07 27.96 43.22 16.55
2006-07 2007-08 2008-09 2009-100
5
10
15
20
25
30
35
40
45
50
18.07
27.96
43.22
16.55
Public Awareness programs
Public Awareness programs
(Rs
in l
acs
)
INTERPRETATION
As can be seen from the above data, expenditure incurred on Public Awareness Programs in the year 2006-07 is at Rs18.07 lacs, whereas in the last three years 2007-08, 2008-09 and 2009-10, this expenditure is at Rs.27.96 lacs, Rs.43.22 lacs and Rs.16.55 lacs respectively. It is noted that there is an increase in expenditure on this head of expenditure as Compared to 2006-07. As these programs are aim at improving customer services and utimately results customer delight, this is possitive sign which shows that the Company has committed for the growth path of the business.
17. Rates & Taxes
These expenses include the payment of statutory levies like property tax, vehicle tax and various licence fees like Factory license, Explosive license, Sales tax Registration expenses, interstate sales Tax, lease and rentals Land tax, municipal tax and other taxes ,Levied on property.
Rates & Taxes 2006-07(Rs in lacs)
2007-08(Rs in lacs)
2008-09(Rs in lacs)
2009-10(Rs in lacs)
Ser Tax-SSLF MS/HSD/LPG Dealer 0 0 0 78.88
Taxes - Automobiles 0.12 0.89 0.39 0.04
Taxes - Business 176.64 15.47 89.3 10.74
Taxes - Other 240.03 211.98 290.94 321.28
Taxes - Property 82.03 64.71 69.53 80.61
Taxes - Transport Equipment 510.32 457.59 3.07 3.75
Taxes - Irrecoverable 1598.55 536.64 239.93 257.1
Taxes - Vac Land-NALA 0 0 0.02 0
TOTAL 2607.69 1287.28 693.18 752.4
2006-07 2007-08 2008-09 2009-100
500
1000
1500
2000
2500
30002607.69
1287.28
693.180000000001 752.4
Rates & Taxes
Rates & Taxes
(Rs
in la
cs)
INTERPRETATION
It is noted from the above graphical representation, that the expenditure incurred on Rates and Taxes at the Zone in the year 2006-07 is at Rs. 2109.09 lacs, whereas in the last three years, 2007-08, 2008-09 and 2009-10, this expenditure is at Rs.831.53 lacs, Rs.693.23 lacs and Rs.752.5 lacs respectively. It may be observed that this Zone has recorded a substantial reduction in this expenditure in the last three years mainly due to controlling irrecoverable Taxes & Transport Equipment.
18. Rent Expenses
Rental paid on land, building, right of way, rail way siding tracks, wharfs and other real property other than those associated with Automotive Retail Outlets.
Rent Expenses 2006-07(Rs
in lacs)
2007-08(Rs
in lacs)
2008-09(Rs
in lacs)
2009-10(Rs
in lacs)
Rent Paid - Retail 2.04 0 0 0.12
Rent Paid - Self Lease 215.03 199.85 151.28 62.51
Rentals-Other 316.45 303.4 435.97 557.05
TOTAL 533.52 503.25 587.25 619.68
2006-07 2007-08 2008-09 2009-100
100
200
300
400
500
600
700
533.52503.25
587.25619.68
Rent Expenses
Rent Ex-penses
(Rs
in la
cs)
INTERPRETATIONIt can be observed from the above data that the rental expenses for the year 2006-07 is at
Rs.533.52 lacs, whereas in the last three years 2007-08,2008-09 and 2009-10, the expenditure incurred on this head is gradually increased at Rs.503.25 lacs, Rs.587.25 lacs and Rs.619.68 lacs respectively, The sharp increase is due to the enhancement in Rent in one of the Location of WZ-O&D paid w.e.f. March’08 during 2009-10.
19. Security
Expenses pertaining to the Engagement of Contract services for providing security staff at Locations and Office Building etc., Engagement of security services for imports supervision, regular supervision & bunkering supervision (Shipping) etc., are also covered in this element of cost.
2006-07 2007-08 2008-09 2009-100
50
100
150
200
250
118.94140.56
163.98
226.7
Security
Security
(Rs
in la
cs)
INTERPRETATION
From the above diagram, it may be noted that the expenditure incurred on the security in the year 2006-07 is at Rs.118.94 lacs, and in past three years i.e 2007-08, 2008-09 and 2009-10, this expenditure is at Rs.140.56 lacs, Rs.163.98 lacs and Rs.226.7 lacsrespectively. It is observed from Comparision of figures that the expenditure incurred on the security has been continously increasing in the last four years on an average of 38.25 % . HPCL has been very much concerned about scurity at the lcoations in view of increasing threats due to Terrotist activitites etc. Further a new initiative of Tell-Tell clock has also been installed for the purposes and resulting in increased expenditure. Hence, the Company is justified in incurring additional cost as there is no Compromise security aspect.
Security 2006-07(Rs in lacs)
2007-08(Rs in lacs)
2008-09(Rs in lacs)
2009-10(Rs in lacs)
Security 118.94 140.56 163.98 226.7
TOTAL 118.94 140.56 163.98 226.7
20. Stores & Spares
Stores and spare expenses is relatig to the stock of material ,spares and other pats.
Stores & Spares 2006-07(Rs in lacs)
2007-08(Rs in lacs)
2008-09(Rs in lacs)
2009-10(Rs in lacs)
Stores & Spares 792.95 74.83 173.67 187.34
TOTAL 792.95 74.83 173.67 187.34
2006-07 2007-08 2008-09 2009-100.00
100.00
200.00
300.00
400.00
500.00
600.00
700.00
800.00
900.00792.95
74.83
173.67 187.34
Stores & Spares
Stores & Spares
(Rs.
in la
cs)
INTERPRETATION
From the above information the stoes & spares expenses in the year 2006-07 Rs.792.95 lacs ,in the year 2007-08 Rs.74.83 lacs,in the year 2008-09 Rs.173.67 lacs and in the year 2009-10 Rs.187.34 lacs,so good control for the stores & spares expenditure because as Compare to 2006-07 expenditure the storage & spares expenses.Because of the efficient and alert inventory management and control.
21. Travel & Conveyance
Traveling and conveyance expenses incurred on domestic/foreign Tour in connection with business are shown hereunder:
Travel & Conveyance 2006-07(Rs in lacs)
2007-08(Rs in lacs)
2008-09(Rs in lacs)
2009-10(Rs in lacs)
Car Hire Charges 5.44 5.14 3.94 5.71
Local Convince/Meals T & I 0.00 0.00 0.00 0.11
Local Conveyance/Meals 5.13 4.90 4.59 4.80
Travailing- Domestic Tours 24.60 34.62 29.30 32.98
Traveling- Foreign Tours 0.25 0.05 0.00 0.00
Travailing- Recruitment Employee 0.06 0.00 0.00 0.04
Traveling– Training 13.78 10.02 9.30 10.58
Traveling Car/Scooter 104.19 108.68 114.76 105.47
Travel-Sales Officer 0.13 0.03 0.17 0.00
TOTAL 153.58 163.45 162.06 159.69
2006-07 2007-08 2008-09 2009-10148.00
150.00
152.00
154.00
156.00
158.00
160.00
162.00
164.00
166.00
153.58
163.45162.06
159.69
Travel & Conveyance
Travel & Conveyance
(Rs
in la
cs)
INTERPRETATION
As can be seen from the above chart, the travel & conveyance expenses in the year 2006-07 is at Rs.153.58 lacs, whereas in the years 2007-08, 2008-09 and 2009-10, this expenditure is at Rs.163.45 lacs,Rs.162.06 lacs and Rs.159.69 lacs respectively. It may be noted that there is decreasing trend in the expenses of travel & conveyance in the last three years at this Zone by approximately by 1.46 % despite increase in cost of travel which is a good sign. It is because efficient control over traveling and conveyance expenses.
22. Utilities (Power & Fuel)

Facilities for the supply of drinking water, electric power or disposal of waste.
Utilities (Power & Fuel) 2006-07(Rs in lacs)
2007-08(Rs in lacs)
2008-09(Rs in lacs)
2009-10(Rs in lacs)
Power & Fuel 236.65 239.86 38.78 61.12
TOTAL 236.65 239.86 38.78 61.12
2006-07 2007-08 2008-09 2009-100.00
50.00
100.00
150.00
200.00
250.00
300.00
236.65 239.86
38.7861.12
Utilities (Power & Fuel)
Utilities (Power & Fuel)
(Rs.
in l
acs
)
INTERPRETATION
From the above data the utilities (Power & Fuel) in the year 2006-07 Rs.236.65 lacs, in the year 2007-08 Rs.236.65 lacs, in the year 239.86 lacs, in the year Rs.38.78 lacs and in the year 2009-10 Rs.61.12 lacs, so the expenditure in the power and fuel increase as compare to last year data .The utilities (Power & fuel) increase by 57.61 % as compare to the 2008-09 expenditure. The utilities (power & fuel) expenses decrease as compare to previous year because of the some volume handled depos were closed due to loss, Hence the utilities expenses is decrease.
CHAPTER 6
FINDINGS, CONCLUSIONS
FINDINGS:
It is noted that the total amount incurred on all West Zone locations during the year 2006-07 was at Rs.10350.8lacs, there is decrease in over all spending (total spending being Rs.8549.34 lacs in the year 2007-08) as Compared to 2006-07. Then again during the year 2008-09, the total expenditure has gone up to Rs.9426.25 lacs and in the year 2009-10 it is further increased to Rs.11738.38 lacs, due to fluctuation in the volume handled.
It is further noted that in the year 2009-10, increase in total expenditure is substantial as Compared to other years in view of various new initiatives taken up by SBU during the period like visual identity, manpower study.
It is found that 43 % (approx.) expenditure incurred on account of manpower cost.
It is found that the ratio of expenditure is not commensurate with the changes in volume handled.
It is also noted that the cost per KL of volume handled is increasing year by year.
CONCLUSION

A. The Manpower cost is the major cost i.e. 43% approximately, which has covered
large portion of total cost.
B. The total capacity of plant is 90,00,000 Kilo Liter but actual utilization is 84,23,005
Kilo Liter.
C. The total cost of the unit may be reduced; .if full capacity is utilized properly.
D. Cost reduction will lead to the profit maximization and then profit maximization lead
to rise in the value of share.
CHAPTER 7RECOMMENDATIONS
RECOMMENDATIONS
Is it recommended that the west zone should aggressive in carrying out its business operations at top gears, i.e. in terms of volume handled.
It is recommended that the Company should increase in the percentage of volume handled and reduce the percentage of the expenses.
YEARTOTAL
EXPENDITURE (Rs. In lacs)
Volume handled
(KL)
%
In expenditure
In volume handled
2007-08 8549.34 7616971 - -2008-09 9426.25 8080599 10 62009-10 11738.38 8423005 25 4
It is recommended that Company should think on controlling/decreasing manpower cost because share of manpower cost is large as Compared to other expenses.
YEARTOTAL EXPENDITURE(Rs in
Lacs)
Manpower cost
(Rs in lacs)% of manpower
cost
2007-08 8549.34 3626.64 41.25
2008-09 9426.25 4068.85 43.16
2009-10 11738.38 5006.13 42.64
It is recommended that the capacity of depot (volume handled) should be enhanced.
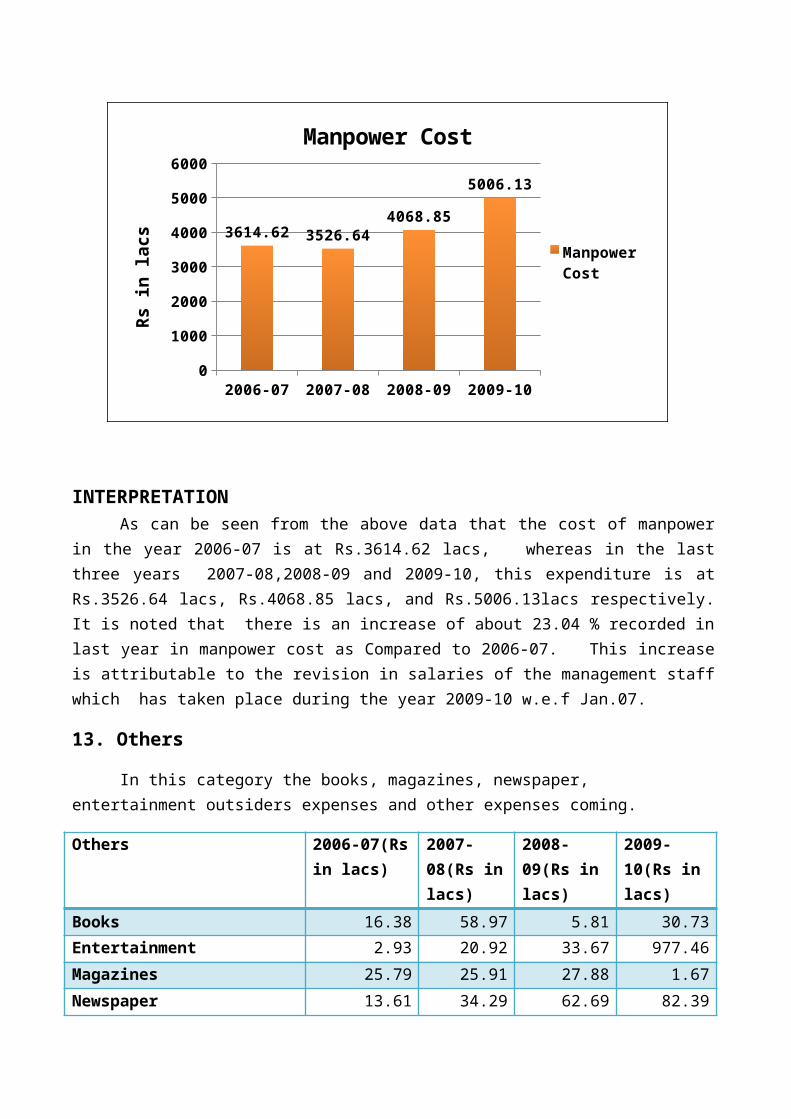
ANNEXURE
AND
BIBLIOGRAPHY
QUESTIONNAIRE:-
1. How many zones are under Operation & Distribution of HPCL? Also mention which they
are.
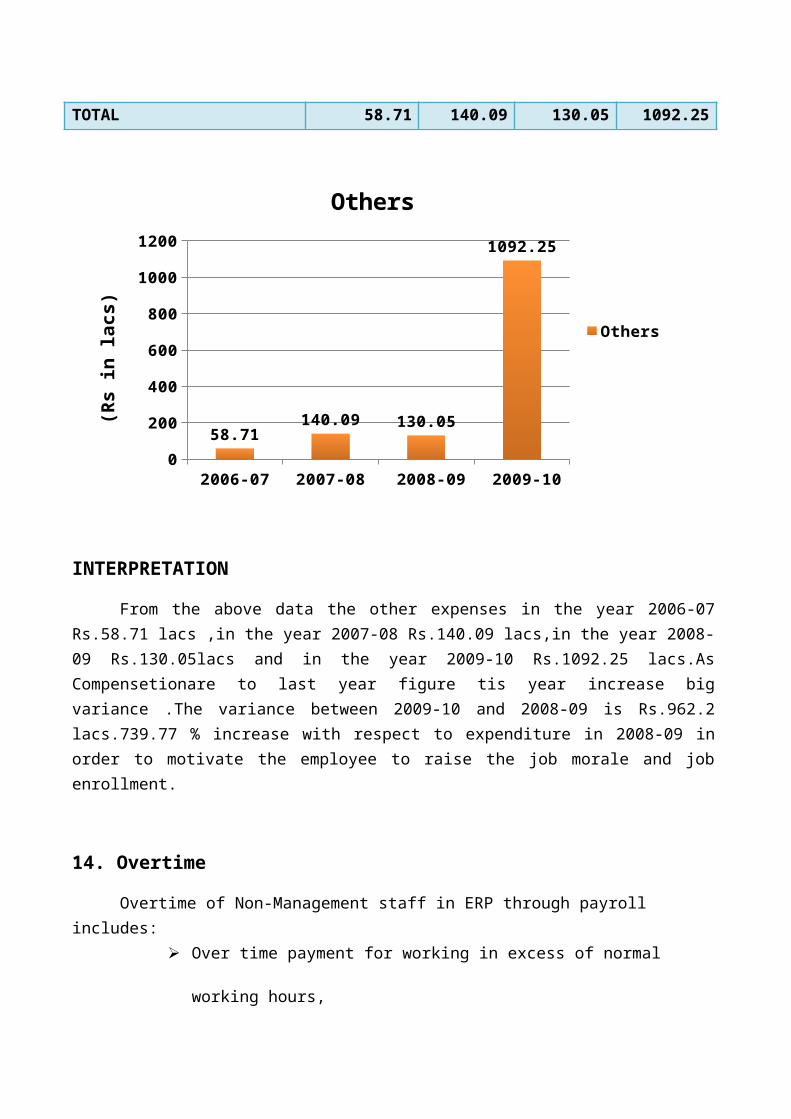
2. How much is the total expenditure per year Operation and Distribution of HPCL? And also
mention the different ingredients of total expenditure?
3. What is the cost incurred to stock per 1000 Liter (Per Kiloliters) of petrochemical product
per year?
4. According to the nature of expenditure how the expenditure can be classified?
5. Among the expenditure mentioned above which is the largest one?
6. Can this cost be reduced?
7. How many liter capacities of each depos?
8. Can the capacity of depos be increased?
9. Is the expenditure directly or inversely proportional to the stock volume?
10. Have you established the standard for setting the budget?
11. Does the deviation occur between actual performance and standard performance?
12. If yes, what corrective actions do you take to recover the deviation?
BIBLOGRAPHY
1. Financial information of Hindustan Petroleum Corporation Limited (West Zone) from the year 2006-07 till 2009-10.
2. Financial Management by

1) Mr. Mahesh Kulkarni.2) Mr. R.P. Rustagi.
Financial Management, Theory, Concepts & problemGalgotia Publishing Company 3rd Edition
3. Cost & Works Accounting by
Mr. B. K. Bhar.
4. Research methodology by
Mr. C.R.Kothari.
Research Methodology, Methods & Techniques, New Age International Publisher, edition II, 2004.
5. www.hpcl.com