RAFT VERSION UNE 26, 2012 A - hea-kim/pap/2012_Transients.pdfIESL, Foundation for Research and...
19
arXiv:1206.5304v1 [astro-ph.CO] 22 Jun 2012 DRAFT VERSION J UNE 26, 2012 Preprint typeset using L A T E X style emulateapj v. 5/2/11 THE SPECTRAL AND TEMPORAL PROPERTIES OF TRANSIENT SOURCES IN EARLY-TYPE GALAXIES N. J. BRASSINGTON School of Physics, Astronomy and Mathematics, University of Hertfordshire, College Lane, Hatfield AL10 9AB and Harvard-Smithsonian Center for Astrophysics, 60 Garden Street, Cambridge, MA 02138 G. FABBIANO Harvard-Smithsonian Center for Astrophysics, 60 Garden Street, Cambridge, MA 02138 A. ZEZAS Harvard-Smithsonian Center for Astrophysics, 60 Garden Street, Cambridge, MA 02138 Physics Department, University of Crete, GR-710 03 Heraklion, Crete, Greece and IESL, Foundation for Research and Technology, 711 10 Heraklion, Crete, Greece A. KUNDU Eureka Scientific, Inc. 2452 Delmer Street, Suite 100, Oakland, CA 94602 D.-W. KIM Harvard-Smithsonian Center for Astrophysics, 60 Garden Street, Cambridge, MA 02138 T. FRAGOS Harvard-Smithsonian Center for Astrophysics, 60 Garden Street, Cambridge, MA 02138 A. R. KING Theoretical Astrophysics Group, University of Leicester, Leicester LE1 7RH, UK S. PELLEGRINI Dipartimento di Astronomia, Universita di Bologna, Via Ranzani 1, 40127 Bologna, Italy G. TRINCHIERI INAF-Osservatorio Astronomico di Brera, Via Brera 28, 20121 Milan, Italy S. ZEPF Department of Physics and Astronomy, Michigan State University, East Lansing, MI 48824-2320 N. J. WRIGHT Harvard-Smithsonian Center for Astrophysics, 60 Garden Street, Cambridge, MA 02138 Draft version June 26, 2012 ABSTRACT We report the spectral and temporal variability properties of 18 candidate transient and potential transient (TC and PTC) sources detected in deep multi-epoch Chandra observation of the nearby elliptical galaxies, NGC 3379, NGC 4278 and NGC 4697. Only one source can be identified with a background counterpart, leaving 17 TCs + PTCs in the galaxies. Of these, 14 are in the galaxy field, supporting the theoretical picture that the majority of field X-ray binaries (XRBs) will exhibit transient accretion for >75% of their lifetime. Three sources are coincident with globular clusters (GCs), including two high-luminosity candidate black hole (BH) XRBs, with L X =5.4×10 38 erg s -1 , and L X =2.8×10 39 erg s -1 , respectively. The spectra, luminosities and temporal behavior of these 17 sources suggest that the transient population is heterogeneous, including neutron star (NS) and BH XRBs in both normal and high-rate accretion modes, and super soft sources containing white dwarf binaries. Our TC and PTC detections are noticeably fewer that the number expected from the populations synthesis (PS) models of Fragos et al. (2009), tailored to our new Chandra pointings of NGC 4278. We attribute this discrepancy to the PS assumption that the transient population is composed of NS XRBs, as well as differences between the statistical analysis and error estimates used in the model and our observations. Subject headings: galaxies: individual (NGC 3379) — galaxies: individual (NGC 4278) — galaxies: individual
Transcript of RAFT VERSION UNE 26, 2012 A - hea-kim/pap/2012_Transients.pdfIESL, Foundation for Research and...

arX
iv:1
206.
5304
v1 [
astr
o-ph
.CO
] 22
Jun
201
2DRAFT VERSIONJUNE 26, 2012Preprint typeset using LATEX style emulateapj v. 5/2/11
THE SPECTRAL AND TEMPORAL PROPERTIES OF TRANSIENT SOURCES IN EARLY-TYPE GALAXIES
N. J. BRASSINGTONSchool of Physics, Astronomy and Mathematics, University of Hertfordshire, College Lane, Hatfield AL10 9AB and
Harvard-Smithsonian Center for Astrophysics, 60 Garden Street, Cambridge, MA 02138
G. FABBIANOHarvard-Smithsonian Center for Astrophysics, 60 Garden Street, Cambridge, MA 02138
A. ZEZASHarvard-Smithsonian Center for Astrophysics, 60 Garden Street, Cambridge, MA 02138
Physics Department, University of Crete, GR-710 03 Heraklion, Crete, Greece andIESL, Foundation for Research and Technology, 711 10 Heraklion, Crete, Greece
A. K UNDUEureka Scientific, Inc. 2452 Delmer Street, Suite 100, Oakland, CA 94602
D.-W. KIMHarvard-Smithsonian Center for Astrophysics, 60 Garden Street, Cambridge, MA 02138
T. FRAGOSHarvard-Smithsonian Center for Astrophysics, 60 Garden Street, Cambridge, MA 02138
A. R. KINGTheoretical Astrophysics Group, University of Leicester,Leicester LE1 7RH, UK
S. PELLEGRINIDipartimento di Astronomia, Universita di Bologna, Via Ranzani 1, 40127 Bologna, Italy
G. TRINCHIERIINAF-Osservatorio Astronomico di Brera, Via Brera 28, 20121 Milan, Italy
S. ZEPFDepartment of Physics and Astronomy, Michigan State University, East Lansing, MI 48824-2320
N. J. WRIGHTHarvard-Smithsonian Center for Astrophysics, 60 Garden Street, Cambridge, MA 02138
Draft version June 26, 2012
ABSTRACTWe report the spectral and temporal variability propertiesof 18 candidate transient and potential transient
(TC and PTC) sources detected in deep multi-epochChandraobservation of the nearby elliptical galaxies,NGC 3379, NGC 4278 and NGC 4697. Only one source can be identified with a background counterpart,leaving 17 TCs + PTCs in the galaxies. Of these, 14 are in the galaxy field, supporting the theoretical picturethat the majority of field X-ray binaries (XRBs) will exhibittransient accretion for>75% of their lifetime.Three sources are coincident with globular clusters (GCs),including two high-luminosity candidate black hole(BH) XRBs, withLX=5.4×1038erg s−1, andLX=2.8×1039 erg s−1, respectively.
The spectra, luminosities and temporal behavior of these 17sources suggest that the transient populationis heterogeneous, including neutron star (NS) and BH XRBs inboth normal and high-rate accretion modes,and super soft sources containing white dwarf binaries. OurTC and PTC detections are noticeably fewerthat the number expected from the populations synthesis (PS) models of Fragos et al. (2009), tailored to ournew Chandrapointings of NGC 4278. We attribute this discrepancy to the PS assumption that the transientpopulation is composed of NS XRBs, as well as differences between the statistical analysis and error estimatesused in the model and our observations.Subject headings:galaxies: individual (NGC 3379) — galaxies: individual (NGC 4278) — galaxies: individual

2 Brassington et al.
(NGC 4697) — X-rays: galaxies — X-rays: binaries
1. INTRODUCTION
Chandra observations of elliptical and S0 galaxies haveled to the widespread detection of low-mass X-ray bi-nary (LMXB) populations (see review Fabbiano 2006).The existence of these populations had been inferred fromthe first X-ray observations of early-type galaxies withthe Einstein Observatoryin the 1980s (Trinchieri & Fab-biano 1985; see Fabbiano 1989 and references therein),but their first detection required the sub-arcsecond reso-lution of Chandra (Sarazin et al. 2000). These popula-tions of extra-galactic LMXBs provide a wider observa-tional base for the understanding of LMXB formation andevolution, which has been debated since their discovery inthe Milky Way (see e.g. Giacconi 1974; Grindlay 1984;review by Verbunt & van den Heuvel 1995; Piro & Bildsten2002; King 2002; Bildsten & Deloye 2004). A key observa-tional result that can constrain the nature of these LMXBsis their time variability, as luminous LMXBs (LX≥ 1037
erg s−1) in relatively wide orbits are expected to exhibit tran-sient behavior, according to the ‘standard’ formation sce-nario of LMXBs in galactic fields (Verbunt & van den Heuvel1995; Shahbaz et al. 1997; Piro & Bildsten 2002; King 2002;Wu et al. 2010). For sources originating as ultra-compactbinaries formed in Globular Clusters (GC) instead, tran-sient behavior is only expected at lower luminosities(Bildsten & Deloye 2004). Until recently, only the most lu-minous extra-galactic LMXBs (LX≥ a few 1038 erg s−1 inthe 03−8.0 keV band) have been observed withChandra,with limited time coverage, making the detection of tran-sients problematic. Recent deep monitoring observations ofthe nearby elliptical galaxies NGC 3379 (Brassington et al.2008; from hereafter B08), NGC 4278 (Brassington et al.2009; hereafter B09) and NGC 4697 (Sivakoff et al. 2008a;Sivakoff et al. 2008b; hereafter S08) provide the means nec-essary to pursue this line of investigation.
Each of these galaxies have been observed withChandraas part of monitoring campaigns; NGC 3379 and NGC 4278were observed as part of a legacy study of LMXB popula-tions, with two new observations of NGC 4278 performedin 2010 also included (PI: Fabbiano). Multi-epoch observa-tions of NGC 4697 were obtained from the archive. All threegalaxies have been determined to be old∼10 Gyr1, ensuringthat the X-ray point source population is not contaminatedby younger sources (e.g. high-mass X-ray binaries or super-nova remnants). In this paper distances of 10.6 Mpc (NGC3379), 16.1 Mpc (NGC 4278), and 11.8 Mpc (NGC 4697)are adopted. These are based on the surface brightness fluc-tuation analysis by (Tonry et al. 2001). At these distances,1′
corresponds to 3.1 kpc, 4.7 kpc, and 3.4 kpc, respectively. A
[email protected] Terlevich & Forbes (2002) estimated ages for the central galactic re-
gion for all of three galaxies, based on spectral line indices calibrated tothe Lick system, via interpolation with the results of the Worthey (1994)and Worthey & Ottaviani (1997) single stellar population evolutionary tracks.Further, for NGC 3379 and NGC 4278 SAURON data within the centralregion, again calibrated with the Lick indices and single stellar populationsynthesis models of Schiavon (2007), were used to determineage estimates(Kuntschner et al. 2010). For NGC 4697 Rogers et al. (2010) used spectralenergy distributions of the stellar light, as well as absorption lines, whichwere then both compared to four different population models. This resultsin age ranges of: 9.3−14.7 Gyr, 10.7−14.1 Gyr and 8.1−11.0 Gyr for NGC3379, NGC 4278 and NGC 4697 respectively.
summary of the properties of the galaxies and theirChandraobservations is presented in Table 1, where column (1) givesthe galaxy name, (2) distance, (3) the B-band luminosity, (4)the average stellar age, derived from single stellar popula-tion models, (5) globular cluster specific frequencies, (6)theChandraobservation ID, (7) the date of each pointing, (8) thecleaned exposure time and column (9) the number of pointsources detected in each observation within the overlappingarea covered by all pointings. In this table, in addition to thesingle pointings, information from the coadded (All) observa-tions are also provided.
The catalogs of point sources detected in NGC 3379 andNGC 4278 are presented in B08 and B09 respectively. Thepoint sources of NGC 4697 presented in this paper were de-tected and analyzed using the techniques detailed in B08, allof these sources are included in the catalog presented in S08.A study of the X-ray luminosity functions (XLFs) of thesegalaxies in both the field and in GCs is presented in Kim et al.(2009). Brassington et al. (2010) and Fabbiano et al. (2010)provide a detailed analysis of the bright persistent point sourcepopulation of NGC 3379 and NGC 4278 respectively. PSmodeling of the XLFs and transient population were pursuedby Fragos et al. (2008) and Fragos et al. (2009). The newpoint sources detected in the 2010 observations of NGC 4278have been analyzed using the techniques presented in B09,and will be presented in a forthcoming paper.
This paper is structured as follows: In Section 2 we de-scribe the definition of transient candidate (TC) and potentialtransient candidate (PTC) sources, provide an overview of theproperties of these sources from the B08 & B09 catalogs, andour new analysis of NGC 4697, and present our results. InSection 3 we present our discussion of these sources alongwith comparisons to population synthesis modeling. Our con-clusions are summarized in Section 4.
2. ANALYSIS AND RESULTS
2.1. Transient Candidate Selection
A transient candidate is usually defined to be a source thateither appears or disappears, or is visible for only a lim-ited amount of ‘contiguous’ time during observations, wherethe flux ratio between the peak ‘on-state’ emission and thenon-detection upper limit, or ‘off-state’ is greater than acer-tain value (usually between 5−10, e.g. Williams et al. 2008).However, using only this ratio as a discriminator can lead tooverestimating the number of transients by including lowerluminosity sources, which have poorly constrainedLX values.Following B08 and B09, we use instead the Bayesian modeldeveloped by Park et al. (2006)(see Section 2.4 of B08 for de-tails), which estimates the uncertainties in the ratio, as well aslower-bounds2. We classify sources with a lower bound ra-tio >10 as TCs and sources with ratios between 5 and 10 asPTCs. We note here that a small number of Galactic sourceshave been observed to vary by ratios>10 but do not go intoperiods of quiescence, e.g. 4U 1705-440 (Homan et al. 2009)and 4U 0513-40 (Maccarone et al. 2010b), where we particu-larly note that this latter source has been confirmed to be anultra-compact binary (Zurek et al. 2009).
2 This lower-bound value accounts for the uncertainties in the sourcecounts and upper limit values from the individual observations and therebyprovides the lowest measure of ‘on’ to ‘off’ values for each source

Transient Sources in Early-Type Galaxies 3
12
3
45
67
8
AA
A
AA
AA
A
1
23
45
6
78
B
BB
BB
B
BB
1
2
Jan 00 Jan 02 Jan 04 Jan 06 Jan 08 Jan 10
C
C
Figure 1. Long-term light curves for all the transient sources detected in the three galaxies, compared over the same time period.The x-axis indicates theobservation date, with each pointing date indicated by a vertical dashed line in each panel, and the y-axis corresponds to the source numbers in Table 2. Greentriangles indicate confirmed GC sources, blue diamonds confirmed field sources and the black square indicates a background object. Source B7 is observed in 2pointings, both of these observations were performed in March 2010 and hence only appear as one point in this figure.
From the multi-epoch observations of the galaxies pre-sented, the Bayesian analysis leads to the detection of 18 TCsand PTCs, listed in Table 2. In this table column (1) indicatesthe source numbering used in this paper, and (2) indicatesthe original source number as presented in each catalog pa-per (B08, B09, S08 or ‘new’ for sources detected in the NGC4278 cycle 11 observations). Columns (3) and (4) provide RAand Dec of each source, (5) indicates the observation ID(s) thesource was detected in. (6) provides net counts for that point-ing (0.3−8.0 keV), (7) the mode ratio and (8) the lower-boundratio from the Bayesian analysis, (9) marks the source as aTC or PTC, (10) the long-term light curve behavior (see Sec-tion 2.2 for an explanation). In column (11) additional notesfor each source are provided and (12) providesg band mag-nitude (Vegamag) optical upperlimits for sources that havenodetected optical counterpart. These upperlimit values arethe3σ flux values centered on the RA and Dec values in columns(3) and (4). In B08 there was no optical coverage for sourceA8 but from recentHSTobservations it can now be confirmedthat this source is coincident with a GC (with a separation<0.1′′), with g andzband (Vegamag) magnitudes of 23.4 magand 21.9 mag respectively. This corresponds to a color of 0.8(ABMAGs), which indicates that the cluster is blue3. Thelong-term light curves are shown in Figure 1 where the top,middle and bottom panels present the TCs and PTCs in NGC3379, NGC 4278 and NGC 4697, respectively (In Figure 2individual long-term light curves are presented for the fouradditional sources that are not presented in B08 or B09).
3 These values and the upper limit values presented in column 12 of Table2 have been derived using the methods presented in Kundu et al. (2007).
In summary, we observe 5 TCs and 3 PTCs in NGC 3379, 3TCs and 5 PTCs in NGC 4278, and 1 TC and 1 PTC in NGC4697. Using theHSTWFPC2 and ACS observations of thesegalaxies we find that three transients reside in GCs, and 14 inthe galaxy stellar field. The source A3 in the NGC 3379 field,is found to be coincident with a background object; we onlylist this source and report its properties for completeness.
2.2. Flux Variability
The long-term light curves (Figure 1) show three TCs with‘on states’ of at least three months in NGC 3379. Of thesesources, one has a maximum outburst time of 9 months (A1),while the other two (A6 & A8) could have maximum out-burst times up to 4 years and 5 months, respectively. In NGC4278, only source B7 was observed in two epochs (both inMarch 2010), with a minimum outburst time of∼5 days andunconstrained maximum outburst time; the other TCs andPTCs were detected in single epochs, giving minimum out-burst times of hours. Upper limits to the duration of the out-bursts ranging from months to a few years can be placed onseven TC/PTCs, while the remaining seven were detected atthe beginning or end of the monitoring observations and there-fore the duration of the outburst is unconstrained. In Table2,column 10 lists our estimated outburst durations.
Source A5 is denoted as only being in outburst in one obser-vation in Table 2, although in B08 it was reported as being de-tected in three out of five observations. However, A5 was alsoflagged as a possible double source in B08, a conclusion sup-ported by our further investigation (see Figure 3). The countsfrom observation 1 arise almost exclusively from within thetop white circular region shown in this figure, whereas in the

4 Brassington et al.
Figure 2. Long-term light curves of the four additional sources that are not presented in B08 or B09. In cases where the source was not detected in an observationan upper limit of the X-ray luminosity has been calculated (details of this calculation are presented in Section 2.1 of B08). The horizontal line indicatesLX derivedfrom the coadded observations.
Figure 3. Full band (0.3−8.0 keV)Chandraimages of Source A5 from thecoadded and individual observations. The white region in the top left panelindicates the 95% encircled energy radius (at 1.5 keV) for A5(labeled as S94in B08), which was flagged as a possible double source in B08. In the sub-sequent panels the white region indicates thewavdetectposition from obser-vation 1 (obs ID 1587) and the green region indicates thewavdetectpositionfrom observation 2 (obs ID 7073). Both regions have a radius of 1′′. Theseparation between these two positions is 1.86′′ (Astrometry offsets≤0.12′′
for NGC 3379; see Section 2.2 in B08). More details are provide in Section2.2.
two subsequent observations the counts are centered in thelower green circle. The luminosity from observations 2 and3 is more than a factor of 15 lower, suggesting that this sec-ondary source is a variable lower flux object.
Short-term variability was investigated for all sources withnet counts> 20 in a single observation, using both theKolmogorov-Smirnov test (K-S test), and the Bayesian blocksmethod (BB) (Scargle 1998; see Section 2.4 of B08 for moredetails). Of the 18 transient sources presented in this paper,only A5 and A8 exhibited detectable short-term variabilityduring their outburst.
The intraobservation variability of these two sources was
investigated in more detail by extracting the lightcurves fromthe ‘on’ observations (and the results are discussed in sec-tions 3.5.1 and 3.3 respectively). This analysis was performedwith the CXC CIAO software suite (v4.2)4 and HEASOFT(v5.3.1), where barycenter corrected binned lightcurves wereextracted with the CIAO tooldmextract. The binning for thesetwo sources was selected to provide well constrained val-ues, allowing variability to be identified, while remainingfineenough to ensure that any changes in flux were not maskedby the selected binning scheme. Counts were extracted fromcircular source region files with radii as in B08. Backgroundcounts were extracted from a large elliptical source-free re-gion, located within the overlapping area covered in all obser-vations.
2.3. Photometry
Hardness ratios (HR) and colors were derived for eachsource, as described in Section 2.3 of B08. They are listedin Table 3 along with logLX . These luminosity values werederived from the net count rate, assuming a power law shapeof Γ=1.7 and GalacticNH (see Section 2.1 in B08 for furtherdetails).
2.4. Spectral Analysis
Spectral extraction was performed for the ‘on’ observationsfor the TC/PTC sources. using the CIAO toolpsextract. Weused the same circular extraction regions as in B08 or B09; forthe TC/PTC discovered in our new analysis, the radii are: 2.5′′
(B7), 3.0′′(B8), 2.2′′ (C1) and 3.0′′(C2); background countswere extracted from surrounding annuli, with outer radii 2-3times larger, depending on the presence of nearby sources. Incases where the source region was found to overlap with a
4 http://asc.harvard.edu/ciao

Transient Sources in Early-Type Galaxies 5
Figure 4. Hardness ratio and color-color diagram of the Transient candidates in the three galaxies. Squares indicate TCs and triangles PTCs. Black points aresources from NGC 3379, red from NGC 4278 and green NGC 4697. The shaded regions indicate the range in values of 90% of the persistent sources in the threegalaxies (i.e. net counts>50 counts). Also shown in the right hand panel is a grid to indicates the predicted locations of the sources at redshiftz=0 with variousphoton indices (0≤ Γph ≤ 4, top to bottom) and absorption column densities (1020 ≤ NH ≤ 1022 cm−2, right to left). The five TC/PTCs that have been identifiedto have unusual spectral properties (see section 3 for more details) are indicated by purple stars and are labeled in bothpanels.
nearby source, the extractions region radius was reduced (to aminimum of 1.5′′) and the area of the overlapping source wasexcluded.
The source spectra were fitted in XSPEC (v12.5.1). Weused only data between 0.3−8.0 keV, to avoid the calibra-tion uncertainties at the low energies, and the high cosmic raybackground above 8.0 keV. All the spectra were fitted to twomodels that describe the properties of X-ray binary spectrawell (see e.g. review by Remillard & McClintock 2006): themulticolor disc blackbody (DISKBB in XSPEC; hereon in re-ferred to as DBB), and the power law (PO) models. For eachmodel all parameters were allowed to vary freely, with theexception of the absorption columnNH, described by the X-ray absorption modeltbabs, which in cases where the best-fitvalue was below that of the Galactic absorption, was frozen tothe Galactic value5. In instances where there were sufficientcounts to bin the data to at least 20 counts per bin (allow-ing Gaussian error approximation to be used), the minimumχ2 method was used to fit the data. The Cash statistic (Cash1979) was otherwise used, however this statistical method hasthe disadvantage that it does not provide a goodness of fitmeasure likeχ2.
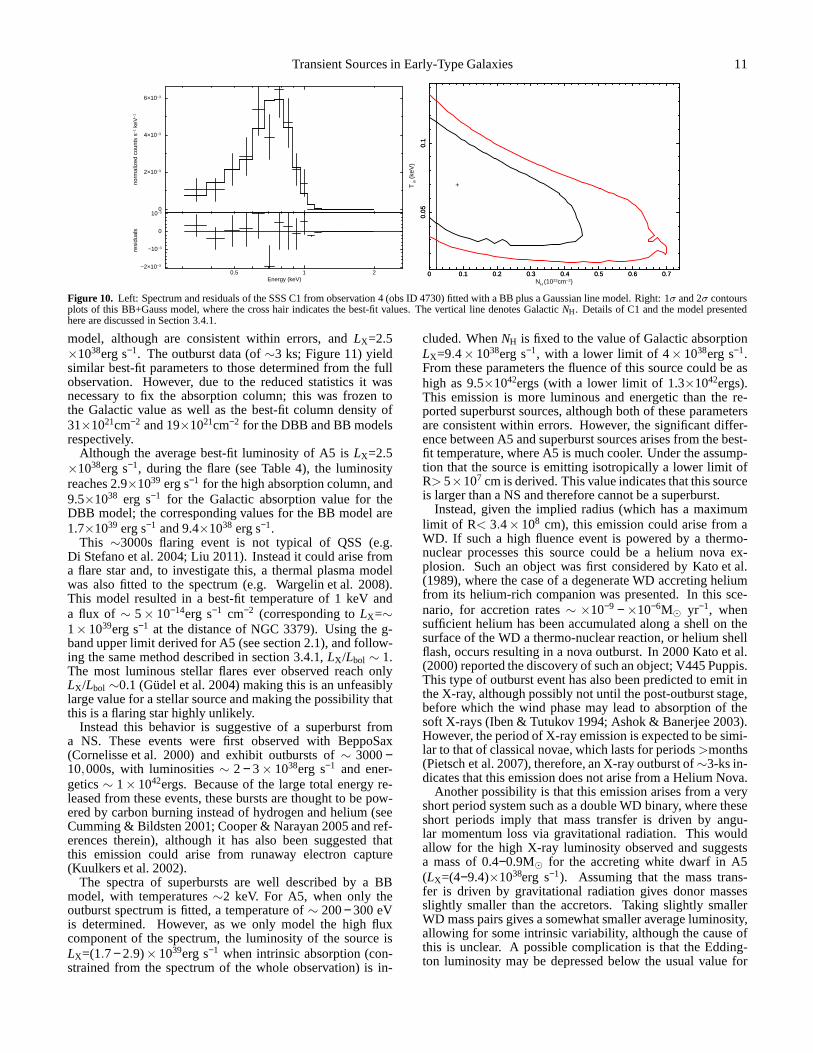
Table 4 summarizes the best-fit models, with the threegalaxies listed separately. Column (1) contains the sourcenumber, (2) the observations used in each fit, (3) the netsource counts from the spectral extraction, (4) indicates whichspectral model was used, (5) the fit statistic (χ2 and numberof degrees of freedomν, or the C statistics - indicated byC),(6) the null hypothesis probability (or goodness when usingCash). Columns (7), (8) & (9) present the best-fit values of thefit parameters with 1σ errors for each interesting parameter (Fdenotes that the value was frozen):NH, Γ for the power law
5 GalacticNH was calculated with the tool COLDEN:http://cxc.harvard.edu/toolkit/colden.jsp. This tool provides values of (2.79,1.79 & 2.14)×1020cm−2 for NGC 3379, NGC 4278 and NGC 4697 respec-tively.
model andkTin, the temperature of the innermost stable orbitof an accretion disc, for the multicolor disc model. Column(10) indicates the intrinsic value ofLX and (11) the luminos-ity range from the lowest (1σ) lower bound to the highest (1σ)upper bound of each observation included in the joint fit6.
Figure 4 shows that the majority of TC/PTCs have both HRand colors consistent with those of the persistent LMXBs inthe galaxies. Five of these sources have insufficient countsto allow even simple spectral modeling (A2, A7, B5, C2 &the background source A3, which will not be discussed fur-ther; see Table 4) and therefore single-component modelswith canonical values have been applied (Γ = 1.7 or kTin=1.0keV Remillard & McClintock 2006). Six more sources (A1,A4, B1, B4, B6 & B7) have spectra well described by single-component models. Four of these (A4, B1, B4 & B7), are wellfitted with a PO model withΓ∼1.7 and GalacticNH. A1, in-stead requires a large value ofNH in the PO fit. Based on thesimulations of Brassington et al. (2010), this result may favordisk emission. The single-component PO model of sourceB6 also shows an elevated value ofNH, however, the two-dimensional errors on this value indicate that the best-fitNHis consistent with Galactic absorption (Figure 5).
Sources B2 & B3, have colors and HR values softer thanthe persistent LMXB population (Figure 4). Their spectra arewell fitted by both a single PO and single DBB model. How-ever, the PO model in both cases requires an elevated value ofNH, indicative of the source containing a significant disc com-ponent (Brassington et al. 2010). In the case of B2, the best-fitvalue ofNH from the DBB model tends to zero when left freeto vary, indicating that there is likely a non-thermal compo-nent as well as disc emission in this source (Brassington et al.
6 Throughout this paper luminosities quoted are the 0.3−8.0 keV Chan-dra bandpass.Lbol corrections for the HS sources will be between 5−15(Portegies Zwart et al. 2004) and corrections for SSS/QSS will be between1.5−3 (e.g. McGowan et al. 2005). Bolometric corrections for sources in aTD state are small, with∼90% of the emission occurring between 0.3−8.0keV (Portegies Zwart et al. 2004).
6 Brassington et al.
0 0.1 0.2 0.3 0.4
22.
53
0 0.1 0.2 0.3 0.4
22.
53
Γ
NH (1022cm−2)
+
0 0.05 0.1 0.15 0.2 0.25
1.5
22.
5
Γ
NH (1022cm−2)
+
0 0.05 0.1 0.15 0.2 0.25
1.5
22.
5
Figure 5. 1σ and 2σ contour plots for single-component PO models from sources A1 (left) and B6 (right), presented in Section 2.4. In both figures the the crosshair within the contours indicates the best-fit values and Galactic NH is denoted by the vertical line.
2010). When freezing the absorption column to the Galacticvalue, the best-fit disc temperature is 0.41 keV, with an X-ray luminosity of 1.0×1038erg s−1. The spectrum of sourceB3 is well described by a DBB model with an absorptionvalue more than twice that of the Galactic absorption value(albeit poorly constrained), indicating that more than 75%ofthe emission is arising from the disc component, with a tem-perature of 0.55 keV.
Four further sources (A5, A6, B8 & C1; see Figure 4 tocompare with the persistent sources), all have little emis-sion above 2 keV, and are therefore super soft, or quasi-soft,sources (SSS and QSS respectively). In all cases, the PO fitsyielded extremely steep power-law indices (>6), reflectingthevery soft nature of the emission. Their spectra were also fittedwith black-body models (BB), as reported in Table 4.
When simple single-component models did not provide anadequate description of the source spectrum, we used morecomplex models, as discussed below for sources C1 (Section3.4.1) and A8 (Section 3.3).
3. DISCUSSION
3.1. The Field Transient Population
One of the clear results from this work is that TC/PTCsources are predominantly found in the field with only threesources out of the 17 TC/PTCs (excluding the backgroundsource) coincident with a GC7. These numbers support thetheory which suggests that the LMXB field population largelyarises from relatively detached systems evolved from nativefield binaries and as such will exhibit transient accretion for>75% of their lifetime (Piro & Bildsten 2002). This is as op-posed to transient GC-LMXBs, which have a more difficultformation channel (as discussed in Section 3.2).
From the detailed spectral analysis presented in this paperwe have been able to determine that out of the 14 confirmedfield sources, 10 exhibit colors and spectra consistent withtypical emission from LMXBs, with power-law (Γ 1.3−2.0) ordisk (kTin 0.4−1.0 keV) emission and on-state intrinsic lumi-nositiesLX ranging from 4×1037 erg s−1 to 2.32×1039 erg s−1
(see Table 4). The spectra of these sources are consistent withthose of NS or BH binaries in either a hard state (HS) or ther-mally dominant (TD) state (Remillard & McClintock 2006).
7 In comparison observations of the total X-ray binary population sug-gest that between 30%−70% of LMXBs are coincident with a GC (e.g.Angelini et al. 2001, B08, B09). We also note that the opticalcoverage of allthree galaxies provided a representative view of the GC population of each ofthe systems (see B08, B09 and Kim et al. 2009 for further details).
Only one of these sources has a luminosity significantlyabove the Eddington limit for a 1.4M⊙ neutron star (B6) andis a strong BH candidate. A further three sources that havebeen determined to be in a TD state (A1, B2, B3) exhibitinner-disc temperatures that are softer than the spectra typ-ically observed in Galactic NS-LMXBs (kTin 1−2 keV), in-dicating that they could be BH candidates. A further threefield sources (A4, B4 & B7) have been determined to be ina HS, but have X-ray luminosities≥10% of the Eddingtonlimit. This high accretion is not observed in NS-LMXBs ina HS and suggests that the primary of these binaries may beBHs. However, due to the quality of our data, while a HS isthe preferred interpretation, we cannot rule out any of thesesources emitting in a TD state, and therefore cannot excludeany of these sources from being NS-LMXBs. The remain-ing three sources have low-count data and haveLX values de-rived from canonical models, therefore these sources couldbe NS or BH-LMXBs. A further soft source (B8) has beenclassified as a QSS but is also consistent with a NS-LMXB(or WD-LMXB; see section 3.5). This results in a ratio ofBH to NS-LMXBs in transient field sources ranging from atleast 10% up to 90% of sources. Such an unconstrained ratiois consistent with a study of the transient population of M31Williams et al. (2006) which suggest that the majority of thesources that they identify to be LMXBs contain BHs.
3.1.1. Comparison with PS models of field LMXBs
Population synthesis modeling of the LMXB populationsof NGC 3379 and NGC 4278 were presented in Fragos et al.(2008) and a study comparing the theoretical and observedfield transient populations of these galaxies was provided inFragos et al. (2009). From this work it was determined thata constant duty cycle (DC) for all transient systems did notmatch the data and instead a variable DC for each systemprovided results that were consistent with the observations.Furthermore Fragos et al. (2009) suggested that the observednumber of TCs and PTCs is proportional to the total numberof field LMXBs (or the stellar mass of the galaxy) and not thetotal observed LMXB population (which will be enhanced byGC-LMXB formation; Kim et al. 2006).
These models were compared to the transient populationof NGC 4278 prior to the 2010 observations and as such en-abled us to estimate the number of new TC and PTC sourcesthat would be observed with repeat pointings. Based on themodels’ prediction the additional 2010 observations of NGC4278 would reveal an additional∼6 TCs and∼6 PTCs. How-ever no TCs and only two new PTCs have been determined

Transient Sources in Early-Type Galaxies 7
from these recent observations. The discrepancy between themodel predictions and the observed number of new sourcescan be attributed to three main factors. Fragos et al. (2009)assumed in their modeling calibration that all TCs and PTCsdetermined from B08 & B09 were NS-LMXBs. This assump-tion was based on the fact that NS-LMXBs were the dominantpopulation in their population synthesis models, and the lackof detailed characterization of the observed transient popula-tion. From the spectral modeling that has been presented inthis paper, it can now be determined that only≤2 TCs and≤1 PTC, and≤1 TC and≤3 PTCs in NGC 3379 and NGC4278 respectively are classified as NS-LMXBs (compared to5 TC and 3 PTC, and 3 TC and 3 PTC previously). Combin-ing this fact with the low number statistics used in the model-observation comparison by Fragos et al. (2009) can possiblyexplain the over-prediction of their models.
Furthermore, Fragos et al. (2009) used the ‘on-to-off’ fluxratio of a source in order to characterize it as a TC or PTC,instead of the more conservative Bayesian analysis employedhere. Finally, we should also consider the uncertainties ofthe bolometric corrections used by Fragos et al. (2008, 2009)in order to convert mass-transfer rates to X-ray luminosities,which would significantly increase the error bars in the pre-dicted number of transients. These last two factor can explainthe discrepancy between the model predictions and observa-tions based solely on statistical arguments.
3.2. GC-LMXBs
Three of the TC/PTCs presented in this work are in GCs.It has been suggested that there is a trend for GCs tohave a higher fraction of ultra-compact binaries, comparedto the field LMXB population (Deutsch et al. 2000; Heinke2010). However for sources brighter than∼ ×1037erg s−1
such objects are expected to be persistent (Lasota et al. 2008;Bildsten & Deloye 2004) and are therefore not the transientsources presented here. Instead these sources could be NSwith main sequence or red giant donors, where populationsynthesis models of the formation of LMXBs in GCs pre-dict that these systems, in addition to ultra-compact binaries,also contribute to the GC-LMXB population (Ivanova et al.2008). Such sources were shown to exhibit transient emis-sion from 60% to all of their mass-transfer lifetimes. Wetherefore suggest that A2, a source with low counts whichhas therefore been described with a canonical PO spectrum, islikely to be a NS-main sequence or NS-red giant system withLX∼ 8×1037erg s−1 (although NS-red giants are less favoredas Ivanova et al. (2008) predicted that their numbers are lowwhen considering their formation rates and short lifetimes).
The second GC-LMXB, B1, has a spectrum that is well de-scribed by both a PO and DBB model, however the best-fitLX from the PO model indicates that the source is emittinggreatly above the 2−4 percent Eddington luminosity that istypically seen from a LMXBs in a HS (Maccarone 2003) andthe DBB model is therefore preferred8. The best-fit valuesfrom the DBB model determines an inner disc temperature ofkTin∼=1.3 keV andLX=5.4×1038erg s−1. Therefore, becauseof this high luminosity, which is above the Eddington limit fora NS binary (although could be close to the limit of a heavy(2−3 M⊙; Kalogera & Baym 1996) NS, or a 1.4M⊙ NS with a
8 It is also noted that while the absorption column of the PO model in-dicates a value consistent with the Galactic value, and therefore indicativeof a HS (c.f. Brassington et al. 2010), this value is poorly constrained andconsequently does not rule out the presence of a thermal component.
He or C/O donor), it is possible that B1 is a BH binary insteadof a NS-main sequence system.
The third GC-LMXB in this sample is A8 (presented in sec-tion 3.3), which could be a BH-ULX undergoing a period ofsuper-Eddington accretion.
The detection of a BH binary in a GC is thought to berare, since in tidally captured persistent sources BHs are likelyto be expelled from the GC (Spitzer 1969); they could betransients with very low duty cycles from an exchange in-teraction (Kalogera et al. 2004). More recent work has indi-cated that a significant number of BH can be retained in GCs(Mackey et al. 2007; Moody & Sigurdsson 2009). In particu-lar, Maccarone et al. (2011) point out that once a number ofBHs are ejected from their host GC the ratio of the masses be-tween the heavy (BHs) and light (non-BH) components fallsbelow the critical value and the Spitzer instability criterion isno longer met, therefore not all BHs will be expunged.
Observationally, the existence of accreting BHs in GCshas been supported by the detection of five luminous (abovethe NS Eddington limit), variable sources (Maccarone et al.2007; Brassington et al. 2010; Shih et al. 2010; Irwin et al.2010; Maccarone et al. 2011). Using the TC/PTC criteria de-fined in this paper, four of these binary systems are persis-tent and could be ultra-compact binaries with either a BH(Gnedin et al. 2009) or NS with super-Eddington accretionand rather mild beaming (King 2011)9. The BH-GC can-didates A8 and B1 exhibit large flux variability, withLX>
1× 1038erg s−1, therefore ruling out genuine disc instabilitytransients. They are also unlikely to be the mildly beamedsuper-Eddington NS-LMXBs suggested by King (2011).
Instead, A8 and B1 could represent BHs in a GC that havebeen formed through an exchange interaction, resulting intransient behavior (Kalogera et al. 2004). In Barnard et al.(2011) this formation channel has been advocated to explaina recurring transient in M31, which has been observed withan outburst luminosity∼ LEdd and therefore could be a BH-GC candidate (although a NS binary cannot be ruled out). Intheir work they also suggest that the source could have formedthrough a complex interaction of a triple system resulting ina BH-WD binary, as first theorised by Ivanova et al. (2010).Further, additional observations of the first strong BH-GCcandidate (first presented in Maccarone et al. 2007), have leadto the suggestion that this source is also a triple system, withthe inner binary comprising a BH and WD (Maccarone et al.2010a).
The properties of the host clusters for the five BH-GC can-didates are presented in Maccarone et al. (2011), where theydemonstrate that this small population suggests that BH bina-ries are favored in massive ‘red’ GCs. The properties of theGCs hosting A8 and B1 are also massive withg=23.4 andV=21.6 respectively. However, both of these sources havecolor values indicating that these GCs are blue, (although B6has a (V − I ) of 1.00±0.02 which is only marginally classi-fied as a ‘blue’ low metallicity cluster: Fabbiano et al. 2010;blue clusters haveV − I ≤ 1.05). This further indicates that themass of the GC is important in the formation of GC-LMXBsin these environments. However, we do not comment on theinfluence of GC colors in the formation of BH-GCs, as the
9 Although Peacock et al. (2012) noted that the model presented in King(2011) is inconsistent with the observed emission of brightX-ray sources inGCs, where the observed X-ray emission is harder. They also suggested thatmany of the sources considered in King (2011) will be dominated by carbonand oxygen edges instead of Thomson scattering, and therefore, as Thomsonscattering is assumed in King (2011), this model cannot be applied.

8 Brassington et al.
10−3
2×10⁻³
3×10⁻³
4×10⁻³
norm
aliz
ed c
ount
s s−
1 ke
V−
1
10.5 2 5
−4
−2
0
2
sign
(dat
a−m
odel
) ×
∆ χ
2
Energy (keV)
Figure 6. The whole spectrum of source A8 from observation 2 (obs ID7073) indicating the PO model fit and theχ2 residuals, which indicate thesignificant deficiencies between 1−2 keV. The details of this model are dis-cussed in Section 3.3.
metallicity correlation presented in Maccarone et al. (2011)was only suggestive.
3.3. A8: ULX in Outflow in a GC
The GC source A8 in NGC 3379 is very luminous (Table4) and variable (Section 2.2). The photometric parametersare consistent with those of the persistent LMXB population(Figure 4), and a single-component PO model provides a sta-tistically acceptable description of the spectrum, withΓ =1.1(Table 4). However, there is a statistically significant defi-ciency in the spectrum at∼1.0 keV as well as excess emission<0.7 keV (Figure 6). These features cannot be modeled witheither a composite DBB plus PO model, or additional neutralabsorption components, or a thermal plasma model. A single-component power law model, modified by an ionized intrinsicabsorber (absori), was fitted to the spectrum. The results ofthis fit are presented in Table 5, where the best-fit values froman XSPEC model withtbabs×tbabs×absori×po (column 2)are shown with one of the neutral absorption components be-ing frozen to GalacticNH.
A8 is one of the two TC/PTC sources exhibiting short-termvariability, where the count-rate falls from>0.01 cnt s−1 to<0.005 cnt s−1 ∼42 ks into the observation (see Figure 7).The spectrum of the high flux state requires an ionized ab-sorption component. The best-fit values of the absori powerlaw model are presented in column 3 of Table 5, and the spec-trum is presented in the left hand panel of Figure 8. Thesevalues are similar to those determined for the spectrum fromthe full observation, except that the best-fitΓ is 1.89 andNH islarger (although both parameters are consistent with the val-ues derived from the whole observation when considering theuncertainties). The derived X-ray luminosity for the source inthis higher flux state is 2.8×1039 erg s−1, in theUltraluminousX-ray Source(ULX) range.
The spectrum of the lower state is instead adequately de-scribed by a single-component PO model (right hand panelFigure 8), withNH consistent with Galactic (column 4 of Ta-ble 5). However the best-fit photon index is very flat, sim-ilar to the value derived when fitting the whole spectrum toa single-component model. This could indicate that ionizedabsorption may still be present, although there are too fewcounts to be able to investigate it. The hardness ratios, binnedto 5000s over this period, are constant. From this model aluminosity of 8.9×1038 erg s−1 is derived.
Figure 7. Short-term light curve of Source A8 from observation 2 (obs ID7073), with binning of 5000s. The dashed vertical line indicates the end ofthe high flux period, which has a count-rate of>0.01 cnt s−1. The loweremission state has a count-rate<0.005 cnt s−1. We used a finer 500s binningto determine the onset of this decrease in flux, which occurs∼42 ks into theobservation. Separate spectra were extracted from before and after this time.This behavior is discussed in Section 3.3.
This source was also detected in the 3rd observation ofNGC 3379 (OBS ID 7074), although it only has∼9 netcounts, too few to perform any meaningful spectral analysis.B08 estimated an X-ray luminosity ofLX=2.5×1037 erg s−1.This luminosity then fell to an upper limit of 2×1037 erg s−1
in the subsequent pointing, taken three months later.The parameters determined from the model during the pe-
riod of high flux emission are similar to those reported forthe NGC 1365 flaring ULX by Soria et al. (2007). In A8,the properties of the spectrum (see Table 5) suggest that thesource is in some sort of outflowing phase, similar to the de-cline period of the ULX in NGC 1365. During this phasethe spectrum is fitted with an ionized absorption column of∼ 5+3
−2 ×1022cm−2 and an ionization parameter ofξ ≈150+79−52
erg cm s−1, largely consistent with the parameters determinedin Soria et al. (2007), of∼ 1+2
−1×1022cm−2 and 111+184−83 respec-
tively, where they also determineΓ ∼1.9 and neutral absorp-tion column∼ 2×1021cm−2. The lower flux spectrum, fol-lowing the outflow phase reported here, indicates that therehas been a three-fold reduction inLX over the period of 12hours (assuming a PO model), similar to the factor of∼2 seenafter three days in NGC 1365.
Soria et al. (2007) suggest that such properties could beanalogous to flares observed in Galactic X-ray binaries in asteep-power law state, where the outflow commences afterthe source exceeds the Eddington limit. Alternatively, someGalactic binaries have been observed to remain in a power-law spectrum HS during short outbursts (Yu & Yan 2009). Ithas been suggested that some sources with such HS eventscould reach flux levels which classify them as ULX duringtheir short outburst events (Yu & Yan 2009), as we find inthe case of A8. This further strengthens the suggestion ofYu & Yan (2009), that some ULXs which stay in the HS dur-ing a flaring event harbor stellar-mass compact stars. We notethat Galactic BH binaries have been observed to typicallyproceed through hysteresis cycles (Remillard & McClintock2006) meaning that the HS event should be followed by a TDstate, which is not observed in the subsequent pointing threemonths later. However, these canonical state transitions ob-served for Galactic binaries are often not observed in ULXs(e.g. Feng & Soria 2011 and references therein).

Transient Sources in Early-Type Galaxies 9
2×10⁻³
4×10⁻³
6×10⁻³
norm
aliz
ed c
ount
s s−
1 ke
V−
1
1 2 5
−2
0
2
sign
(dat
a−m
odel
) ×
∆ χ
2
Energy (keV)
0
5×10⁻⁴
10−3
1.5×10⁻³
norm
aliz
ed c
ount
s s−
1 ke
V−
1
10.5 2 5
0
5
sign
(dat
a−m
odel
) ×
∆ C
−S
tatis
tic
Energy (keV)
Figure 8. Left: Best-fit spectrum andχ2 residuals from the ‘high’ flux emission of source A8 where an ionized absorption component has been included in themodel. Right: Spectrum and Cstat residuals of the ‘low’ emission period from A8 fitted to a single-component PO model. This is discussed in detail in Section3.3.
3.4. Super Soft Sources
SSS are sources with little or no emission above 1 keV,with typical X-ray luminosities between 1×1036 to 1×1038
erg s−1. Following the discovery of SSS in the Large Magel-lanic Cloud (Long et al. 1981), van den Heuvel et al. (1992)proposed a model of quasi-steady nuclear burning on the sur-face of a white dwarf (WD) accreting matter from a Rochelobe-filling companion with high accretion rates, with emis-sion described by a simple absorbed blackbody (BB). Furtherobservations have revealed a heterogeneous class of objectswith sources detected in both early- and late-type galaxies,in the field and in GCs, and with a range of temporal be-havior, and luminosities as high asLX>1×1039 erg s−1, inthe ULX range (e.g. Carpano et al. 2007; Di Stefano & Kong2003; Fabbiano et al. 2003). It has been suggested thatthese sources could be WDs in super-Eddington outbursts,stellar-mass BHs, or even intermediate-mass black holes (e.g.Di Stefano et al. 2004).
A6 was observed in the second and third observations ofNGC 3379 (Obs. ID 7073 & 7074). The HR and colors donot change between pointings; consequently the spectra fromthese two observations were jointly fitted with all parametersapart from the normalization tied between observations. Ofthe three models, the PO does not provide a physically realis-tic description of the spectrum, determining a best-fit photonindex of ∼ 8, and can be discounted. The best-fit parame-ters between the DBB and BB model are very similar, withan inner disc temperature of 91±15 eV, and an absorptioncolumn consistent with the Galactic value for the BB model,and anNH of more than twice the Galactic value for the DBBmodel, although within errors this is consistent with GalacticNH. These best-fit models yieldLX=1.1×1038 erg s−1 (BB)andLX=1.5×1038 erg s−1 (DBB), consistent within the uncer-tainties.
The spectrum is that of a ‘classical’ SSS. Due to its tran-sient nature it is possible that the observed X-ray emissionarises from a classical nova (CNe) where episodic thermonu-clear explosions on the surface of the WD lasting from monthsto years can appear as a transient SSS (Pietsch et al. 2007).From X-ray/optical studies of M31 and M33 Pietsch et al.(2005) suggested that these sources are a major class of SSS.
3.4.1. The extremely luminous SSS C1
The second SSS, C1, is even softer than A6, with an innerdisc temperature of 60±10 eV and a large absorption column
(∼ 1×1022cm−2), yielding an intrinsic extremely high X-rayluminosity of 5.8×1041 erg s−1. The spectrum is shown inFigure 9, along with 1σ and 2σ contour parameters for theBB model. Even using the 1σ lower limits of the inner disctemperature and absorption column of this fit, the luminos-ity would still be extreme, 5.6×1040 erg s−1. A neutron staratmosphere model applied to this spectrum also resulted in alarge best-fit luminosity> 1 ×1041 erg s−1.
We further investigated if this source could be a foregroundobject (e.g. a flaring M dwarf) by fitting a thermal plasmamodel (APEC) to the spectrum. This resulted in a best-fit tem-perature∼0.3 keV and a flux of∼ 1.1×10⁻¹⁴ erg s−1 cm−2
(corresponding toLX∼ 2× 1038 erg s−1 at the distance ofNGC 4697). By assuming that C1 is a star it is possible tocalculate theLX /Lbol ratio by combining the photometric g-band upper limit for this source with the semi-empirical stel-lar SEDs of Kraus & Hillenbrand (2007) to provideLbol, withLX values scaled from the best-fit X-ray luminosity derivedfrom the APEC model. The resulting value,LX /Lbol > 0.35,is much higher than values that are typically seen in stars,where in a recent large survey (Wright et al. 2011)LX /Lbol
values were 1×10⁻³ with a dispersion of an order of mag-nitude. Therefore, C1 is unlikely to be a foreground objectunless it was observed during an incredibly rare flaring eventfor which the X-ray luminosity increased by more than anorder of magnitude. To determine the likelihood of observ-ing such a flare we compare to the studies of Feigelson et al.(2004) and Wright et al. (2010), who both studied the prop-erties of stellar X-ray sources in deep, high Galactic latitudefields. From a total of 71 sources and a cumulative exposureof 26.68 Ms they observed only 2 stars with flaring eventswith peak amplitudes greater than a factor of 10. From theirdetection thresholds and the relative exposure times we es-timate that we should detect∼5 stars in the observation ofNGC 4697. This equates to a cumulative exposure of 660 kson these stars, and therefore a probability of observing a sig-nificantly large flare in one of these stars of 0.05. This seemshighly unlikely and therefore we conclude that the emissionfrom C1 does not arise from a flare star.
C1 was previously discussed in S08 (Section 4.4), who,after determining that a background AGN is unlikely, sug-gest an intermediate mass black hole with a mass range of∼ (7× 10³ − 106)M⊙, although they note that the formationof such a large black hole outside of the nucleus or a GC is achallenge for current black hole formation theory.

10 Brassington et al.
0
2×10⁻³
4×10⁻³
6×10⁻³
norm
aliz
ed c
ount
s s−
1 ke
V−
1
10.5 2
−2×10⁻³
−10−3
0
10−3
resi
dual
s
Energy (keV) 0.4 0.6 0.8 1 1.2 1.4
0.04
0.05
0.06
0.07
0.08
0.09
T in
(keV
)
NH (1022cm−2)
+
Figure 9. Left: Spectrum and residuals of the SSS C1 from observation 4(obs ID 4730) with a single-component BB model. Right: 1σ and 2σ contours plotsof the BB model, the cross hair indicates the best-fit values.Details of this source are presented in Section 3.4.1.
X-ray luminosities in excess of 1041erg s−1 have onlybeen reported for two previous SSS; ULX-1 in M101(Kong & Di Stefano 2005) and a luminous SSS transient inNGC 4631 (Carpano et al. 2007). Both of these galaxies arelate-type star forming systems, unlike NGC 4697. Thesesources, when described by a single-component BB model,exhibited similar properties to C1, with soft X-ray spectra(kTin∼ 40−150 eV), high intrinsic absorption, and result-ing extremely largeLX . However, in both cases, alternatemodels have been suggested resulting in less extreme lumi-nosities (Mukai et al. (2005) ; (Liu 2009); Soria & Ghosh(2009); Carpano et al. (2007). For C1, even though a single-component model is statistically acceptable, there is a pos-sible excess in the residuals around 0.8 keV (see Figure 9).Following Carpano et al. (2007) an additional Gaussian linewas included with the BB model in the fit (we also attemptedto use an absorption edge to model the spectrum, as pre-sented in Soria & Ghosh (2009) for the NGC 4631 source,but were able to constrain the model parameters). The val-ues obtained from the BB+Gaussian model are presented inTable 6 and the spectrum and the 1σ and 2σ contours areshown in Figure 10. The best-fit parameters indicate a lowerintrinsic absorption, consistent with the Galactic value withinerrors, and a temperature of 70 eV (compared to 60 eV inthe single-component BB model). The peak energy of theGaussian component,∼0.7 keV, is likely to arise from a blendof unresolved emission lines (e.g. OVIII ; Ness et al. 2005),or there could alternatively be absorption edges, as seen inSoria & Ghosh (2009). The resulting 0.3−8.0 keV luminos-ity, 3.4×1038 erg s−1, although poorly constrained, is threeorders of magnitude lower than that from the simple BBmodel. Although in excess of the emission from a hydro-gen burning 1.35 M⊙ WD system, this luminosity could arisefrom an extreme super Eddington event (a fireball scenarioSoria & Ghosh 2009).
The 2XMM survey reports a source within<2′′of C1.Given its soft hardness ratios (e.g. HR2=-0.95±0.0810), andthe lower spatial resolution ofXMM-Newton, it is possiblethat this is emission arising from C1. TheXMM-Newtonob-servation was taken in July 2003 (compared to August 2004for the ‘on’ Chandraobservation) yielding an X-ray luminos-ity of 1.30×1038 erg s−1, from the 2XMM catalogue (com-pared to 4.72×1038 erg s−1 for the model derived from the
10 Derivation of Hardness Ratios are provided in section 3.1.2in theXMM-NewtonSerendipitous Source Catalogue Users Guide
Chandraobservation over the 0.2−12 keV energy range). Ifthis observed emission is from C1, it suggests that the sourceunderwent two outbursts, with a recurrence time of∼1 year.From simulations Starrfield et al. (2004) estimated that thehydrogen layer involved in the surface nuclear burning wouldhave a mass of< 1× 10⁻⁶ M⊙ and that steady surface hy-drogen burning (for a 1.35M⊙ WD) only occurs for accretionrates below 1×10⁻⁶ M⊙ yr−1. If the outbursts of C1 are a con-sequence of this fireball scenario this implies accretion rates> 1× 10⁻⁶ M⊙ yr−1 and therefore the hydrogen shell couldbe replenished within 1 year. In fact, Soria & Ghosh (2009)estimates that the SSS in NGC 4631 has an accretion rate ofaround 1×10⁻⁵ M⊙ yr−1, which could therefore replenish theshell within a month.
However, this interpretation should be treated with cautiondue to the large uncertainties in the best-fit parameters. Fur-thermore, the inclusion of the Gaussian component, possiblyrelated to the photospheric expansion period, is speculative,although it serves the purpose of lowering the intrinsic lumi-nosity from the extreme value of> 5×1041 erg s−1 to a moretypical SSS value of 3.4×1038 erg s−1.
3.5. Quasi-Soft Sources
QSS are systems with little or no emission above ener-gies of 2 keV, with temperatures between 100 eV to 350 eV(Di Stefano & Kong 2004). QSS are too hot to be WDs, un-less there is significant upscattering of photons emitted bytheWD, or the emission emanates from a limited portion of thesurface. Alternative scenarios include QSS as NS or BH bi-nary systems (Di Stefano et al. 2010) (and SNRs; Orio 2006).The results of the spectral analysis put B8 and A5 in this cat-egory (see Table 4).
Source B8, was observed in one of the cycle 11Chan-dra observations and has a maximum outburst time of∼3years. Spectral modeling determines a temperature of be-tween 280−360 eV and X-ray luminosity∼ (1.1 − 1.5)×1038erg s−1 (depending on if a DBB or BB model is preferred).Such values are consistent with the properties of previouslyobserved QSS.
3.5.1. The flaring QSS A5
In the case of the flaring source A5, the best-fit DBB modelyields inner disc temperature of 220 eV, with intrinsic absorp-tion of ∼3×1021cm−2, Both the temperature and absorptioncolumn values from the BB model are lower than the DBB
Transient Sources in Early-Type Galaxies 11
0
2×10⁻³
4×10⁻³
6×10⁻³
norm
aliz
ed c
ount
s s−
1 ke
V−
1
10.5 2−2×10⁻³
−10−3
0
10−3
resi
dual
s
Energy (keV)0 0.1 0.2 0.3 0.4 0.5 0.6 0.7
0.05
0.1
0 0.1 0.2 0.3 0.4 0.5 0.6 0.7
0.05
0.1
T in
(keV
)
NH (1022cm−2)
+
Figure 10. Left: Spectrum and residuals of the SSS C1 from observation 4(obs ID 4730) fitted with a BB plus a Gaussian line model. Right: 1σ and 2σ contoursplots of this BB+Gauss model, where the cross hair indicatesthe best-fit values. The vertical line denotes GalacticNH. Details of C1 and the model presentedhere are discussed in Section 3.4.1.
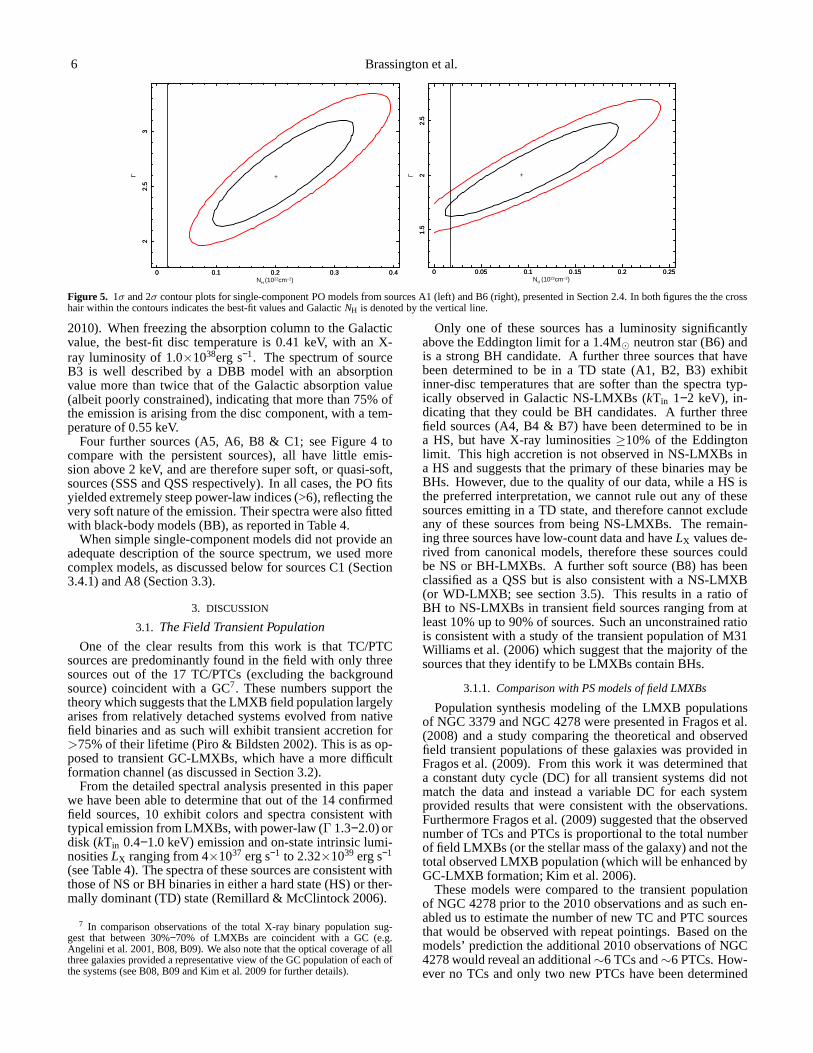
model, although are consistent within errors, andLX=2.5×1038erg s−1. The outburst data (of∼3 ks; Figure 11) yieldsimilar best-fit parameters to those determined from the fullobservation. However, due to the reduced statistics it wasnecessary to fix the absorption column; this was frozen tothe Galactic value as well as the best-fit column density of31×1021cm−2 and 19×1021cm−2 for the DBB and BB modelsrespectively.
Although the average best-fit luminosity of A5 isLX=2.5×1038erg s−1, during the flare (see Table 4), the luminosityreaches 2.9×1039 erg s−1 for the high absorption column, and9.5×1038 erg s−1 for the Galactic absorption value for theDBB model; the corresponding values for the BB model are1.7×1039 erg s−1 and 9.4×1038 erg s−1.
This ∼3000s flaring event is not typical of QSS (e.g.Di Stefano et al. 2004; Liu 2011). Instead it could arise froma flare star and, to investigate this, a thermal plasma modelwas also fitted to the spectrum (e.g. Wargelin et al. 2008).This model resulted in a best-fit temperature of 1 keV anda flux of ∼ 5× 10⁻¹⁴erg s−1 cm−2 (corresponding toLX=∼1× 1039erg s−1 at the distance of NGC 3379). Using the g-band upper limit derived for A5 (see section 2.1), and follow-ing the same method described in section 3.4.1,LX /Lbol ∼ 1.The most luminous stellar flares ever observed reach onlyLX /Lbol ∼0.1 (Güdel et al. 2004) making this is an unfeasiblylarge value for a stellar source and making the possibility thatthis is a flaring star highly unlikely.
Instead this behavior is suggestive of a superburst froma NS. These events were first observed with BeppoSax(Cornelisse et al. 2000) and exhibit outbursts of∼ 3000−10,000s, with luminosities∼ 2 − 3× 1038erg s−1 and ener-getics∼ 1× 1042ergs. Because of the large total energy re-leased from these events, these bursts are thought to be pow-ered by carbon burning instead of hydrogen and helium (seeCumming & Bildsten 2001; Cooper & Narayan 2005 and ref-erences therein), although it has also been suggested thatthis emission could arise from runaway electron capture(Kuulkers et al. 2002).
The spectra of superbursts are well described by a BBmodel, with temperatures∼2 keV. For A5, when only theoutburst spectrum is fitted, a temperature of∼ 200− 300 eVis determined. However, as we only model the high fluxcomponent of the spectrum, the luminosity of the source isLX=(1.7− 2.9)× 1039erg s−1 when intrinsic absorption (con-strained from the spectrum of the whole observation) is in-
cluded. WhenNH is fixed to the value of Galactic absorptionLX=9.4× 1038erg s−1, with a lower limit of 4× 1038erg s−1.From these parameters the fluence of this source could be ashigh as 9.5×1042ergs (with a lower limit of 1.3×1042ergs).This emission is more luminous and energetic than the re-ported superburst sources, although both of these parametersare consistent within errors. However, the significant differ-ence between A5 and superburst sources arises from the best-fit temperature, where A5 is much cooler. Under the assump-tion that the source is emitting isotropically a lower limitofR> 5×107 cm is derived. This value indicates that this sourceis larger than a NS and therefore cannot be a superburst.
Instead, given the implied radius (which has a maximumlimit of R< 3.4×108 cm), this emission could arise from aWD. If such a high fluence event is powered by a thermo-nuclear processes this source could be a helium nova ex-plosion. Such an object was first considered by Kato et al.(1989), where the case of a degenerate WD accreting heliumfrom its helium-rich companion was presented. In this sce-nario, for accretion rates∼ ×10−9 − ×10−6M⊙ yr−1, whensufficient helium has been accumulated along a shell on thesurface of the WD a thermo-nuclear reaction, or helium shellflash, occurs resulting in a nova outburst. In 2000 Kato et al.(2000) reported the discovery of such an object; V445 Puppis.This type of outburst event has also been predicted to emit inthe X-ray, although possibly not until the post-outburst stage,before which the wind phase may lead to absorption of thesoft X-rays (Iben & Tutukov 1994; Ashok & Banerjee 2003).However, the period of X-ray emission is expected to be simi-lar to that of classical novae, which lasts for periods>months(Pietsch et al. 2007), therefore, an X-ray outburst of∼3-ks in-dicates that this emission does not arise from a Helium Nova.
Another possibility is that this emission arises from a veryshort period system such as a double WD binary, where theseshort periods imply that mass transfer is driven by angu-lar momentum loss via gravitational radiation. This wouldallow for the high X-ray luminosity observed and suggestsa mass of 0.4−0.9M⊙ for the accreting white dwarf in A5(LX=(4−9.4)×1038erg s−1). Assuming that the mass trans-fer is driven by gravitational radiation gives donor massesslightly smaller than the accretors. Taking slightly smallerWD mass pairs gives a somewhat smaller average luminosity,allowing for some intrinsic variability, although the cause ofthis is unclear. A possible complication is that the Edding-ton luminosity may be depressed below the usual value for

12 Brassington et al.
Figure 11. Short-term light curve of Source A5 from observation 1 (obs ID 1587). In the top panel binning of 2000s has been used and in the bottom panel afiner binning scheme of 250s is presented. The outburst lastsfor less than 3500s. The unbinned light curve and event arrival times show that of the 61 events inthis observation, 43 arise from a time interval<3260s. (Section 3.5.1).
this type of accretion, since for CO-dominated compositionsthe Kramers opacity can exceed Thomson at high tempera-tures (Peacock et al. 2012). Although ‘opacity’ here referstothe Rosseland mean, and is therefore not strictly applicablefor considering radiation pressure, a fuller exploration of thistype of model would be needed.
4. CONCLUSIONS
In this paper we have identified the transient and potentialtransient candidates within three elliptical galaxies using deepmulti-epochChandradata. From spectral analysis of the sev-enteen sources that have been confirmed as a TC or PTCs (ex-cluding the background source) a large variety of propertieshave been determined, revealing the heterogeneous nature oftransient populations in elliptical galaxies. These sources aresummarized in Table 7.
From Table 7 it can be seen that the majority of thesesources have been revealed to be normally accreting LMXBs,where 12 of the objects have spectra consistent with binariesin either a hard or thermally dominant state. Of the remainingfive sources, one (A8, which has also been determined to be aGC-LMXB) has been observed as a ULX, with a peak lumi-nosity of 2.8×1039erg s−1 over a∼12 hour period, after whichthe source drops toLX=8×1038erg s−1. During this bright pe-riod of emission the source has been determined to be in ahard state with evidence of enhanced ionized absorption witha column density of∼ 5×1022cm−2 and an ionization param-eter of∼ 150 erg cm s−1. Following this 12 hour period thelower flux emission is consistent with an LMXB in a typicallyHS. We suggest that this source has undergone a large flaringevent prior to our observation and we have observed the sub-sequent period of decline, where an outflow phase has com-menced after the super-Eddington accretion. This behaviorissimilar to the properties of the ULX observed in NGC 1365(Soria et al. 2007) and could indicate that A8 is a stellar-massBH binary undergoing a HS flaring event.
The two SSS transients presented in this paper have prop-erties indicating that they are both likely to arise from WDbinaries. The first, A6, has spectra consistent with ‘typical’
SSS, with a temperature of 90 eV and, given the transient na-ture of this source, is likely to be a classical nova. The sec-ond SSS, when fitted with a single-component DBB modelhasLX> 5× 1041erg s−1. This value is much greater thanany of the previously confirmed X-ray luminosities of ultra-luminous SSS and is difficult to explain. Instead, we includea Gaussian component to the model, which we suggest couldbe related to an outflow or expansion, as seen in NGC 4361(Soria & Ghosh 2009). Our tentative interpretation of thissource is a WD binary with photospheric expansion takingplace, resulting in an extreme super Eddington event with anX-ray luminosity∼ 3.4×1038erg s−1.
In addition to the SSS, two of the transients presented herehave been classified as QSS. One of these sources (B8) hasspectral properties that are consistent with previously ob-served QSS, with a temperature∼300 eV and a luminosity∼ 1038 erg s−1. Source A5 on the other hand has rather un-usual temporal behavior, where>70% of the emission fromthis source arises within 3 ks, with a peak luminosity of9.4×1038erg s−1 (with a lower limit of 4×1038erg s−1) anda temperature of∼ 200−300 eV. This cool emission indicatesthat the source is a WD and, as a consequence of this short-lived highly luminous event, we tentatively suggest that thisemission arises from super-Eddington accretion from a shortperiod double WD binary.
From cross-correlations ofHST data (presented in B08,B09, S08 and section 2.1 of this paper) we have been able toquantify the number of field and GC transients and determinethe nature of binaries in these objects. Only three sources (A2,A8 & B1) have been determined to be GC-LMXBs. Fromthe modeling of B1 this source could be emitting in eithera hard or thermally dominant state but, due to the high lu-minosity of> 5×1038erg s−1, we favor the interpretation ofthermal emission, providing a best-fit inner disc temperatureof 1.3 keV. Due to the high luminosity of not only this object,which is above the Eddington limit for a NS, but also A8, bothsources are BH-GC candidates. Such objects are expected tobe rare and these provide only the sixth and seventh unam-biguous example of such a system. Further, these are only the

Transient Sources in Early-Type Galaxies 13
second and third BH-GC that has been shown to exhibit tran-sient behavior (although a BH-GC candidate emitting∼ LEddhas recently been presented in Barnard et al. 2011). Due tothe transient nature of these systems we suggest a formationchannel of an exchange interaction (Kalogera et al. 2004), in-stead of a tidally captured source (or an ultra-compact binary;Gnedin et al. 2009; King 2011) which would lead to the for-mation of a persistent BH-GC.
From the optical matching we have determined that 14sources arise from the field compared to only three from GCs(the remaining source is a background object). The largenumber of field sources in the transient population is expectedas theoretical work predicts that the majority of the field pop-ulation will arise from relatively detached systems, whichwillbe transient>75% of their lifetime.
From population synthesis modeling (Fragos et al. 2009)predictions were made about the number of TCs and PTCsthat would be detected in our new observations of NGC 4278.However, from comparing the newly determined numbersof TC/PTC sources to those predicted we have much fewersources, in fact no new TCs were observed and only 2 PTCs,compared to the prediction of 6 TCs and 6 PTCs. We attributethis discrepancy to the original comparison of the modelingresults to the observed transient population, where all tran-sient sources included in B08 and B09 were assumed to beNS-LMXBs, and significant difference in our and their statis-tical analysis and error estimates.
We thank the CXC DS and SDS teams for their ef-forts in reducing the data and developing the software usedfor the reduction (SDP) and analysis (CIAO). We wouldalso like to thank the anonymous referee whose detailedand careful report has helped to improve this paper. Thiswork was supported byChandra G0 grant G06-7079A &GO0-11102X (PI:Fabbiano). We acknowledge partial sup-port from NASA contract NAS8-39073(CXC). A. Kundu ac-knowledges support for this work by NASA through Chandraawards GO-11111 and AR-12009. A. Zezas acknowledgessupport from NASA LTSA grant NAG5-13056. S. Pelle-grini and G. Trinchieri acknowledge partial financial supportfrom the Italian Space Agency ASI (Agenzia Spaziale Ital-iana) through grant ASI-INAF I/009/10/0. S. Zepf acknowl-edges support from NASA ADAP grants NNX08AJ60G andNNX11AG12G. G. Fabbiano is grateful to the Aspen Centerfor Physics for their hospitality
REFERENCES
Angelini, L., Loewenstein, M., & Mushotzky, R. F. 2001, ApJ,557, L35Ashok, N. M. & Banerjee, D. P. K. 2003, A&A, 409, 1007Barnard, R., Garcia, M., Li, Z., Primini, F., & Murray, S. S. 2011, ApJ, 734,
79Bildsten, L. & Deloye, C. J. 2004, ApJL, 607, L119Brassington, N. J., Fabbiano, G., Blake, S., Zezas, A., Angelini, L., Davies,
R. L., Gallagher, J., Kalogera, V., Kim, D.-W., King, A. R., Kundu, A.,Trinchieri, G., & Zepf, S. 2010, ApJ, 725, 1805
Brassington, N. J., Fabbiano, G., Kim, D.-W., Zezas, A., Zepf, S., Kundu,A., Angelini, L., Davies, R. L., Gallagher, J., Kalogera, V., Fragos, T.,King, A. R., Pellegrini, S., & Trinchieri, G. 2008, ApJS, 179, 142
—. 2009, ApJS, 181, 605Carpano, S., Pollock, A. M. T., King, A. R., Wilms, J., & Ehle,M. 2007,
A&A, 471, L55Cash, W. 1979, ApJ, 228, 939Cooper, R. L. & Narayan, R. 2005, ApJ, 629, 422Cornelisse, R., Heise, J., Kuulkers, E., Verbunt, F., & in’tZand, J. J. M.
2000, A&A, 357, L21
Cumming, A. & Bildsten, L. 2001, ApJ, 559, L127Deutsch, E. W., Margon, B., & Anderson, S. F. 2000, ApJ, 530, L21Di Stefano, R., Kong, A., & Primini, F. A. 2010, NewAR, 54, 72Di Stefano, R. & Kong, A. K. H. 2003, ApJ, 592, 884—. 2004, ApJ, 609, 710Di Stefano, R., Kong, A. K. H., Greiner, J., Primini, F. A., Garcia, M. R.,
Barmby, P., Massey, P., Hodge, P. W., Williams, B. F., Murray, S. S.,Curry, S., & Russo, T. A. 2004, ApJ, 610, 247
Fabbiano, G. 1989, ARA&A, 27, 87Fabbiano, G. 2006, ARA&A, 44, 323Fabbiano, G., Brassington, N. J., Lentati, L., Angelini, L., Davies, R. L.,
Gallagher, J., Kalogera, V., Kim, D.-W., King, A. R., Kundu,A.,Pellegrini, S., Richings, A. J., Trinchieri, G., Zezas, A.,& Zepf, S. 2010,ApJ, 725, 1824
Fabbiano, G., King, A. R., Zezas, A., Ponman, T. J., Rots, A.,& Schweizer,F. 2003, ApJ, 591, 843
Feigelson, E. D., Hornschemeier, A. E., Micela, G., Bauer, F. E., Alexander,D. M., Brandt, W. N., Favata, F., Sciortino, S., & Garmire, G.P. 2004,ApJ, 611, 1107
Feng, H. & Soria, R. 2011, NewAR, 55, 166Fragos, T., Kalogera, V., Belczynski, K., Fabbiano, G., Kim, D.-W.,
Brassington, N. J., Angelini, L., Davies, R. L., Gallagher,J. S., King,A. R., Pellegrini, S., Trinchieri, G., Zepf, S. E., Kundu, A., & Zezas, A.2008, ApJ, 683, 346
Fragos, T., Kalogera, V., Willems, B., Belczynski, K., Fabbiano, G.,Brassington, N. J., Kim, D.-W., Angelini, L., Davies, R. L.,Gallagher,J. S., King, A. R., Pellegrini, S., Trinchieri, G., Zepf, S. E., & Zezas, A.2009, ApJ, 702, L143
Giacconi, R. 1974, InX-ray Astronomy, Giacconi, R. & Gursky, H. eds., p.155, Dordrecht: Reidel
Gnedin, O. Y., Maccarone, T. J., Psaltis, D., & Zepf, S. E. 2009, ApJ, 705,L168
Grindlay, J. E. 1984, InCataclysmic Variables and Low-Mass X-rayBinaries, Bignami, G. and Sunyaev, R. A. eds, p19, Oxford: Pergamon
Güdel, M., Audard, M., Reale, F., Skinner, S. L., & Linsky, J.L. 2004,A&A, 416, 713
Heinke, C. O. 2010, in American Institute of Physics Conference Series,Vol. 1314, American Institute of Physics Conference Series, ed.V. Kologera & M. van der Sluys, 135–142
Homan, J., Kaplan, D. L., van den Berg, M., & Young, A. J. 2009,ApJ, 692,73
Iben, Jr., I. & Tutukov, A. V. 1994, ApJ, 431, 264Irwin, J. A., Brink, T. G., Bregman, J. N., & Roberts, T. P. 2010, ApJ, 712,
L1Ivanova, N., Chaichenets, S., Fregeau, J., Heinke, C. O., Lombardi, Jr., J. C.,
& Woods, T. E. 2010, ApJ, 717, 948Ivanova, N., Heinke, C. O., Rasio, F. A., Belczynski, K., & Fregeau, J. M.
2008, MNRAS, 386, 553Kalogera, V. & Baym, G. 1996, ApJ, 470, L61+Kalogera, V., King, A. R., & Rasio, F. A. 2004, ApJ, 601, L171Kato, M., Saio, H., & Hachisu, I. 1989, ApJ, 340, 509Kato, T., Kanatsu, K., Takamizawa, K., Takao, A., & Stubbings, R. 2000,
IAU Circ, 7552, 1Kim, D.-W., Fabbiano, G., Brassington, N. J., Fragos, T., Kalogera, V.,
Zezas, A., Jordán, A., Sivakoff, G. R., Kundu, A., Zepf, S. E., Angelini,L., Davies, R. L., Gallagher, J. S., Juett, A. M., King, A. R.,Pellegrini, S.,Sarazin, C. L., & Trinchieri, G. 2009, ApJ, 703, 829
Kim, E., Kim, D.-W., Fabbiano, G., Lee, M. G., Park, H. S., Geisler, D., &Dirsch, B. 2006, ApJ, 647, 276
King, A. R. 2002, MNRAS, 335, L13—. 2011, ApJ, 732, L28+Kong, A. K. H. & Di Stefano, R. 2005, ApJ, 632, L107Kraus, A. L. & Hillenbrand, L. A. 2007, AJ, 134, 2340Kundu, A., Maccarone, T. J., & Zepf, S. E. 2007, ApJ, 662, 525Kuntschner, H., Emsellem, E., Bacon, R., Cappellari, M., Davies, R. L., de
Zeeuw, P. T., Falcón-Barroso, J., Krajnovic, D., McDermid, R. M.,Peletier, R. F., Sarzi, M., Shapiro, K. L., van den Bosch, R. C. E., & vande Ven, G. 2010, MNRAS, 408, 97
Kuulkers, E., in’t Zand, J. J. M., van Kerkwijk, M. H., Cornelisse, R., Smith,D. A., Heise, J., Bazzano, A., Cocchi, M., Natalucci, L., & Ubertini, P.2002, A&A, 382, 503
Lasota, J.-P., Dubus, G., & Kruk, K. 2008, A&A, 486, 523Liu, J. 2009, ApJ, 704, 1628—. 2011, ApJS, 192, 10Long, K. S., Helfand, D. J., & Grabelsky, D. A. 1981, ApJ, 248,925Maccarone, T. J. 2003, A&A, 409, 697

14 Brassington et al.
Maccarone, T. J., Kundu, A., Zepf, S. E., & Rhode, K. L. 2007, Nature, 445,183
—. 2010a, MNRAS, 409, L84—. 2011, MNRAS, 410, 1655Maccarone, T. J., Long, K. S., Knigge, C., Dieball, A., & Zurek, D. R.
2010b, MNRAS, 406, 2087Mackey, A. D., Wilkinson, M. I., Davies, M. B., & Gilmore, G. F. 2007,
MNRAS, 379, L40McGowan, K. E., Charles, P. A., Blustin, A. J., Livio, M., O’Donoghue, D.,
& Heathcote, B. 2005, MNRAS, 364, 462Moody, K. & Sigurdsson, S. 2009, ApJ, 690, 1370Mukai, K., Still, M., Corbet, R. H. D., Kuntz, K. D., & Barnard, R. 2005,
ApJ, 634, 1085Ness, J.-U., Starrfield, S., Jordan, C., Krautter, J., & Schmitt, J. H. M. M.
2005, MNRAS, 364, 1015Orio, M. 2006, ApJ, 643, 844Park, T., Kashyap, V. L., Siemiginowska, A., van Dyk, D. A., Zezas, A.,
Heinke, C., & Wargelin, B. J. 2006, ApJ, 652, 610Peacock, M. B., Zepf, S. E., & Maccarone, T. J. 2012, astro-ph/1204.5800Pietsch, W., Fliri, J., Freyberg, M. J., Greiner, J., Haberl, F., Riffeser, A., &
Sala, G. 2005, A&A, 442, 879Pietsch, W., Haberl, F., Sala, G., Stiele, H., Hornoch, K., Riffeser, A., Fliri,
J., Bender, R., Bühler, S., Burwitz, V., Greiner, J., & Seitz, S. 2007, A&A,465, 375
Piro, A. L. & Bildsten, L. 2002, ApJL, 571, L103Portegies Zwart, S. F., Dewi, J., & Maccarone, T. 2004, MNRAS, 355, 413Remillard, R. A. & McClintock, J. E. 2006, ARA&A, 44, 49Rogers, B., Ferreras, I., Peletier, R., & Silk, J. 2010, MNRAS, 402, 447Sarazin, C. L., Irwin, J. A., & Bregman, J. N. 2000, ApJ, 544, L101Scargle, J. D. 1998, ApJ, 504, 405Schiavon, R. P. 2007, ApJS, 171, 146Shahbaz, T., Naylor, T., & Charles, P. A. 1997, MNRAS, 285, 607Shih, I. C., Kundu, A., Maccarone, T. J., Zepf, S. E., & Joseph, T. D. 2010,
ApJ, 721, 323
Sivakoff, G. R., Jordán, A., Juett, A. M., Sarazin, C. L., & Irwin, J. A.2008a, astro-ph/0806.0626
—. 2008b, astro-ph/0806.0627Soria, R., Baldi, A., Risaliti, G., Fabbiano, G., King, A., La Parola, V., &
Zezas, A. 2007, MNRAS, 379, 1313Soria, R. & Ghosh, K. K. 2009, ApJ, 696, 287Spitzer, Jr., L. 1969, ApJ, 158, L139Starrfield, S., Timmes, F. X., Hix, W. R., Sion, E. M., Sparks,W. M., &
Dwyer, S. J. 2004, ApJ, 612, L53Terlevich, A. I. & Forbes, D. A. 2002, MNRAS, 330, 547Tonry, J. L., Dressler, A., Blakeslee, J. P., Ajhar, E. A., Fletcher, A. B.,
Luppino, G. A., Metzger, M. R., & Moore, C. B. 2001, ApJ, 546, 681van den Heuvel, E. P. J., Bhattacharya, D., Nomoto, K., & Rappaport, S. A.
1992, A&A, 262, 97Verbunt, F. & van den Heuvel, E. P. J. 1995, inX-ray Binaries, Lewin, W. H.
G., van Paradijs, J., van den Heuvel, E. P. J., eds., p. 457, Cambridge, UK:Cambridge Univeristy Press
Wargelin, B. J., Kashyap, V. L., Drake, J. J., García-Alvarez, D., & Ratzlaff,P. W. 2008, ApJ, 676, 610
Williams, B. F., Gaetz, T. J., Haberl, F., Pietsch, W., Shporer, A.,Ghavamian, P., Plucinsky, P. P., Mazeh, T., Sasaki, M., & Pannuti, T. G.2008, ApJ, 680, 1120
Williams, B. F., Naik, S., Garcia, M. R., & Callanan, P. J. 2006, ApJ, 643,356
Worthey, G. 1994, ApJS, 95, 107Worthey, G. & Ottaviani, D. L. 1997, ApJS, 111, 377Wright, N. J., Drake, J. J., & Civano, F. 2010, ApJ, 725, 480Wright, N. J., Drake, J. J., Mamajek, E. E., & Henry, G. W. 2011, ApJ, 743,
48Wu, Y. X., Yu, W., Li, T. P., Maccarone, T. J., & Li, X. D. 2010, ApJ, 718,
620Yu, W. & Yan, Z. 2009, ApJ, 701, 1940Zurek, D. R., Knigge, C., Maccarone, T. J., Dieball, A., & Long, K. S. 2009,
ApJ, 699, 1113

Transient Sources in Early-Type Galaxies 15
Table 1Summary of the properties of the three galaxies
Galaxy D LB Age SGC Obs ID Obs Date Expo No. Src(1) (2) (3) (4) (5) (6) (7) (8) (9)
NGC 3379 10.6 1.46 9.3−14.7a,b 1.21587 Feb 2001 29.0 587073 Jan 2006 80.3 727074 Apr 2006 66.7 697075 Jul 2006 79.6 777076 Jan 2007 68.7 63All - 324.2 125 (+7)
NGC 4278 16.1 1.63 10.7−14.1a,b 6.94741 Feb 2005 37.3 857077 Mar 2006 107.7 1527078 Jul 2006 48.1 847079 Oct 2006 102.5 1227081 Feb 2007 54.8 1417080 Apr 2007 107.6 10511269 Mar 2010 80.7 11612124 Mar 2010 25.5 64
All - 564.2 231 (+20)NGC 4697 11.8 2.00 8.1−11.0a,c 2.5
0784 Jan 2000 36.7 954727 Dec 2003 36.6 724728 Jan 2004 33.3 744729 Feb 2004 22.3 594730 Aug 2004 38.1 82All - 132.0 120 (+4)
Note. — No. src denotes the number of sources detected within eachobservation in the overlapping region of the S3 chip in all observations. Also note there that in NGC 4278obs IDs 7081 was taken prior to obs ID 7080, we therefore retain the chronological sequence with obs ID 7081 labeled as pointing 5 in subsequent figures. Age estimates from (a)Terlevich & Forbes (2002), (b) Kuntschner et al. (2010), (c) Rogers et al. (2010).
Table 2Properties of TCs and PTCs detected in the three galaxies
Src No. Catalog No. RA Dec OBS ID Net Counts Mode Ratio Lower-bound value TC/PTC Light Curve Notes Optical Limits(1) (2) (3) (4) (5) (6) (7) (8) (9) (10) (11) (12)
A1 25 (B08) 10:47:54.5 +12:35:30.9 7074 174.9 161.4 43.5 TC Mid (2) Field >27.4- - - - 7075 24.2 - - - - - -
A2 50 (B08) 10:47:51.6 +12:35:35.9 7073 44.1 6.8 5.9 PTC LMid(1) GC -A3 85 (B08) 10:47:49.2 +12:34:31.1 7074 38.4 30.2 9.0 PTC Mid(1) Background -A4 89 (B08) 10:47:48.9 +12:34:59.1 7076 97.6 18.4 16.4 TC Beg(1) Field >25.0A5 94 (B08) 10:47:48.0 +12:34:45.7 1587 58.3 19.2 13.2 TC End(1) Field/Double >26.2A6 100 (B08) 10:47:47.2 +12:34:59.8 7073 54.8 20.2 14.1 TC LMid (2) Field >26.4- - - - 7074 19.5 - - - - - -
A7 115 (B08) 10:47:43.6 +12:34:10.8 1587 18.3 12.9 6.8 PTC End (1) Field >27.0A8 128 (B08) 10:47:38.2 +12:33:07.6 7073 548.3 85.1 50.7 TC LMid (2) GC -- - - - 7074 9.1 - - - - - -
B1 83 (B09) 12:20:08.138+29:17:17.1 7079 249.7 57.8 35.5 TC Mid (1) GC -B2 91 (B09) 12:20:07.930+29:16:57.2 7079 93.5 9.0 8.3 PTC Mid (1) Field >26.2B3 139 (B09) 12:20:06.218+29:16:57.5 7079 170.8 26.1 18.9 TC Mid (1) Field >25.8B4 156 (B09) 12:20:05.669+29:17:15.9 7077 50.5 6.2 5.5 PTC LMid (1) Field >26.5B5 159 (B09) 12:20:05.388+29:17:17.0 7080 23.2 13.6 5.8 PTC LMid (1) Field >26.6B6 204 (B09) 12:20:01.582+29:16:26.2 4741 339.4 871.7 202.9 TC End (1) Field >27.0B7 - (new) 12:20:09.001+29:17:23.7 11269 70.6 11.2 8.4 PTC Mid (2) Field >27.0- - - - 12124 16.1 - - - - - -
B8 - (new) 12:20:06.361+29:16:54.6 11269 66.1 11.6 8.7 PTC Beg (1) Field >24.9
C1 110 (S08) 12:48:40.507 -05:50:20.7 4730 87.4 30.9 22.9 TC Beg (1) Field >27.0C2 104 (S08) 12:48:27.484 -05:49:00.8 4730 16.5 8.0 5.4 PTC Beg (1) Field >27.8
Note. — All net count values are derived from the standard processing techniques detailed in both B08 and B09. Optical limits are provided for sources without an identified opticalcounterpart, where 3σ g-band (Vega) magnitudes are quoted. In column 10 sources that could be in outburst for over a year are labeled as ‘LMid’ and those with a shorter outburstupperlimit are ‘Mid’. Sources that were observed in the firstobservation are labeled as ‘End’ and sources labeled as ‘Beg’ are seen at the beginning of their ‘on state’ in the last epochof each galaxy’s monitoring campaign. The number in brackets in this column indicates the number of observations the source was detected in.

16 Brassington et al.
Table 3Hardness ratios and colors of TCs and PTCs detected in the three galaxies
Src No. HR C21 C32 LogLXergs−1
(1) (2) (3) (4) (5)
A1 -0.73+0.04−0.06 -0.16+0.05
−0.10 0.76+0.13−0.10 38.4
A2 -0.20+0.14−0.16 -0.48+0.19
−0.22 0.43+0.18−0.16 37.8
A3 -0.46+0.15−0.16 -0.04+0.16
−0.18 0.22+0.19−0.18 37.8
A4 -0.42+0.09−0.11 -0.11+0.10
−0.12 0.32+0.14−0.09 38.1
A5 -0.92+0.04−0.06 -0.14+0.13
−0.11 1.16+0.58−0.35 38.3
A6 -1.00+0.02−0.00 1.99+0.91
−0.54 -0.08+1.15−1.14 37.8
A7 -0.65+0.17−0.21 0.00+0.21
−0.21 0.64+0.57−0.40 37.8
A8 -0.28+0.04−0.04 -0.27+0.08
−0.02 0.22+0.05−0.04 38.9
B1 -0.52+0.05−0.06 -0.29+0.10
−0.03 0.58+0.07−0.09 38.7
B2 -0.83+0.05−0.07 0.04+0.08
−0.11 1.08+0.43−0.25 38.2
B3 -0.79+0.06−0.05 -0.23+0.08
−0.09 1.00+0.20−0.16 38.5
B4 -0.58+0.12−0.14 -0.37+0.16
−0.17 0.80+0.41−0.24 38.0
B5 -0.08+0.24−0.25 -0.24+0.24
−0.32 0.16+0.24−0.24 37.9
B6 -0.61+0.04−0.05 -0.19+0.03
−0.07 0.68+0.06−0.08 39.2
B7 -0.31+0.10−0.13 -0.15+0.12
−0.17 0.18+0.09−0.15 38.2
B8 -1.00+0.02−0.00 -0.06+0.16
−0.12 1.66+0.67−0.68 38.2
C1 -0.98+0.02−0.02 1.09+0.19
−0.13 0.59+0.54−0.40 38.4
C2 -0.20+0.25−0.27 0.03+0.24
−0.24 0.35+0.40−0.32 37.7
Note. — The definition of these values are explained in Sections 2.1 & 2.3 of B08.
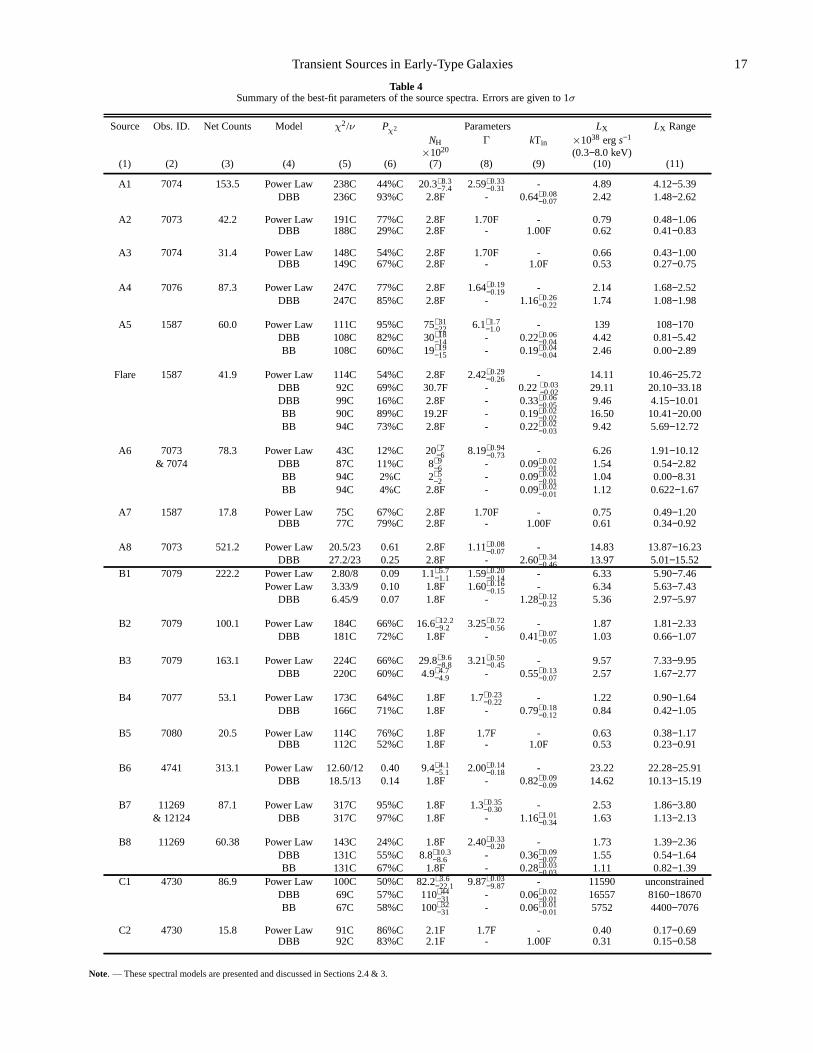
Transient Sources in Early-Type Galaxies 17
Table 4Summary of the best-fit parameters of the source spectra. Errors are given to 1σ
Source Obs. ID. Net Counts Model χ2/ν Pχ2 Parameters LX LX Range
NH Γ kTin ×1038 ergs−1
×1020 (0.3−8.0 keV)(1) (2) (3) (4) (5) (6) (7) (8) (9) (10) (11)
A1 7074 153.5 Power Law 238C 44%C 20.3+8.3−7.4 2.59+0.33
−0.31 - 4.89 4.12−5.39DBB 236C 93%C 2.8F - 0.64+0.08
−0.07 2.42 1.48−2.62
A2 7073 42.2 Power Law 191C 77%C 2.8F 1.70F - 0.79 0.48−1.06DBB 188C 29%C 2.8F - 1.00F 0.62 0.41−0.83
A3 7074 31.4 Power Law 148C 54%C 2.8F 1.70F - 0.66 0.43−1.00DBB 149C 67%C 2.8F - 1.0F 0.53 0.27−0.75
A4 7076 87.3 Power Law 247C 77%C 2.8F 1.64+0.19−0.19 - 2.14 1.68−2.52
DBB 247C 85%C 2.8F - 1.16+0.26−0.22 1.74 1.08−1.98
A5 1587 60.0 Power Law 111C 95%C 75+31−22 6.1+1.7
−1.0 - 139 108−170DBB 108C 82%C 30+18
−14 - 0.22+0.06−0.04 4.42 0.81−5.42
BB 108C 60%C 19+19−15 - 0.19+0.04
−0.04 2.46 0.00−2.89
Flare 1587 41.9 Power Law 114C 54%C 2.8F 2.42+0.29−0.26 - 14.11 10.46−25.72
DBB 92C 69%C 30.7F - 0.22+0.03−0.02 29.11 20.10−33.18
DBB 99C 16%C 2.8F - 0.33+0.06−0.05 9.46 4.15−10.01
BB 90C 89%C 19.2F - 0.19+0.02−0.02 16.50 10.41−20.00
BB 94C 73%C 2.8F - 0.22+0.02−0.03 9.42 5.69−12.72
A6 7073 78.3 Power Law 43C 12%C 20+7−6 8.19+0.94
−0.73 - 6.26 1.91−10.12& 7074 DBB 87C 11%C 8+9
−6 - 0.09+0.02−0.01 1.54 0.54−2.82
BB 94C 2%C 2+5−2 - 0.09+0.02
−0.01 1.04 0.00−8.31BB 94C 4%C 2.8F - 0.09+0.02
−0.01 1.12 0.622−1.67
A7 1587 17.8 Power Law 75C 67%C 2.8F 1.70F - 0.75 0.49−1.20DBB 77C 79%C 2.8F - 1.00F 0.61 0.34−0.92
A8 7073 521.2 Power Law 20.5/23 0.61 2.8F 1.11+0.08−0.07 - 14.83 13.87−16.23
DBB 27.2/23 0.25 2.8F - 2.60+0.34−0.46 13.97 5.01−15.52
B1 7079 222.2 Power Law 2.80/8 0.09 1.1+5.7−1.1 1.59+0.20
−0.14 - 6.33 5.90−7.46Power Law 3.33/9 0.10 1.8F 1.60+0.16
−0.15 - 6.34 5.63−7.43DBB 6.45/9 0.07 1.8F - 1.28+0.12
−0.23 5.36 2.97−5.97
B2 7079 100.1 Power Law 184C 66%C 16.6+12.2−9.2 3.25+0.72
−0.56 - 1.87 1.81−2.33DBB 181C 72%C 1.8F - 0.41+0.07
−0.05 1.03 0.66−1.07
B3 7079 163.1 Power Law 224C 66%C 29.8+9.6−8.8 3.21+0.50
−0.45 - 9.57 7.33−9.95DBB 220C 60%C 4.9+4.7
−4.9 - 0.55+0.13−0.07 2.57 1.67−2.77
B4 7077 53.1 Power Law 173C 64%C 1.8F 1.7+0.23−0.22 - 1.22 0.90−1.64
DBB 166C 71%C 1.8F - 0.79+0.18−0.12 0.84 0.42−1.05
B5 7080 20.5 Power Law 114C 76%C 1.8F 1.7F - 0.63 0.38−1.17DBB 112C 52%C 1.8F - 1.0F 0.53 0.23−0.91
B6 4741 313.1 Power Law 12.60/12 0.40 9.4+4.1−5.1 2.00+0.14
−0.18 - 23.22 22.28−25.91DBB 18.5/13 0.14 1.8F - 0.82+0.09
−0.09 14.62 10.13−15.19
B7 11269 87.1 Power Law 317C 95%C 1.8F 1.3+0.35−0.30 - 2.53 1.86−3.80
& 12124 DBB 317C 97%C 1.8F - 1.16+1.01−0.34 1.63 1.13−2.13
B8 11269 60.38 Power Law 143C 24%C 1.8F 2.40+0.33−0.20 - 1.73 1.39−2.36
DBB 131C 55%C 8.8+10.3−8.6 - 0.36+0.09
−0.07 1.55 0.54−1.64BB 131C 67%C 1.8F - 0.28+0.03
−0.03 1.11 0.82−1.39C1 4730 86.9 Power Law 100C 50%C 82.2+3.6
−22.1 9.87+0.03−9.87 - 11590 unconstrained
DBB 69C 57%C 110+44−31 - 0.06+0.02
−0.01 16557 8160−18670BB 67C 58%C 100+32
−31 - 0.06+0.01−0.01 5752 4400−7076
C2 4730 15.8 Power Law 91C 86%C 2.1F 1.7F - 0.40 0.17−0.69DBB 92C 83%C 2.1F - 1.00F 0.31 0.15−0.58
Note. — These spectral models are presented and discussed in Sections 2.4 & 3.

18 Brassington et al.
Table 5Best-fit parameters of A8 for the whole spectrum and the spectra from the high and lowflux states. Presented are values from the tbabs * tbabs * absori * power law model with
the quoted errors given to 1σ.
Parameters Whole Spectrum High Flux Spectrum Low Flux Spectrum(1) (2) (3) (4)
Net Counts 521.2 366 130χ2/ν 13.8/20 13.2/13 303CPχ2 0.84 0.04 44%C
NH (1021 cm−2) 0.43+0.54−0.43 1.79+0.99
−1.26 0.34+0.68−0.39
Γ 1.45+0.17−0.23 1.89+0.35
−0.41 1.04+0.24−0.22
kpo(10−5 ) 1.2+0.8−0.4 3.7+3.1
−1.7 -Tabs (K) 105F 105F -
Zabs (Z⊙) 1F 1F -ξabs(erg cm s−1) 133+113
−39 149+79−52 -
NHabs (1022 cm−2) 2.33+2.23
−1.46 4.95+2.84−2.25 -
LX (1039 erg s−1) 1.59 2.75 0.89LX Range (1039 erg s−1) 1.39−1.93 1.97−3.14 0.80−1.03
Note. — The difference in counts between the ‘whole’ observationand the high and low flux spectra arises from the short time gapbetween the two extracted spectra. This modelis discussed in detail in Section 3.3.
Table 6Best fitting parameters of SSS C1. Presented are values from the tbabs * BB +Gauss
model with the quoted errors given to 1σ.
Parameters Best-fit Values(1) (2)
Cstat 52CGoodness 10%
NH (1021 cm−2) 0.85+0.31−0.85
kTin (eV) 70+33−49
EL (keV) 0.71+0.04−0.09
σL (keV) 0.12+0.04−0.01
LX (1038 erg s−1) 3.40LX Range (1038 erg s−1) 0.00−3.90
Note. — This spectral model and subsequent interpretation of thesource is presented in Section 3.4.1.
Table 7Summary of the properties of the seventeen TC/PTC sources
Src No. Optical Correlation Spectral State LX Suggested Nature×1038 ergs−1
colhead (0.3−8.0 keV)(1) (2) (3) (4) (5)
A1 Field TD 2.42 BH-LMXBA2 GC Canonical 0.79 NS/BH-GCA4 Field HS 2.14 NS/BH-LMXBA5 Field QSS 9.42 WD-WD binaryA6 Field SSS 1.12 Classical Nova (CNe)A7 Field Canonical 0.75 NS/BH-LMXBA8 GC Ionized HS 27.50 GC-ULX in outflowB1 GC TD 5.36 BH-GCB2 Field TD 1.03 BH-LMXBB3 Field TD 2.57 BH-LMXBB4 Field HS 1.22 NS/BH-LMXBB5 Field Canonical 0.63 NS/BH-LMXBB6 Field HS (+ disc contribution) 23.22 BH-LMXBB7 Field HS 2.53 NS/BH-LMXBB8 Field QSS 1.11 WD/NS-LMXBC1 Field SSS+Gauss 3.40 WD binary with
photospheric expansionC2 Field Canonical 0.40 NS/BH-LMXB

Transient Sources in Early-Type Galaxies 19
Table 7 — Continued
Src No. Optical Correlation Spectral State LX Suggested Nature×1038 ergs−1
colhead (0.3−8.0 keV)(1) (2) (3) (4) (5)
Note. — Column (3): TD indicates a source in a thermally dominant state, HS a source in a hard state and Canonical a source with insufficient counts to allow spectral modeling tobe carried out. Details of the spectral modeling and interpretation of these sources are presented in Sections 2.4 & 3 of this paper.


![Guia Cruceromania de Heraklion [Creta] (Grecia)](https://static.fdocuments.in/doc/165x107/5571fc194979599169967dc8/guia-cruceromania-de-heraklion-creta-grecia.jpg)