radical and non-radical carbazole derivatives for molecular ...

SANDIA REPORT SAND2007-0148 Unlimited Release Printed January 2007
Radical Advancement in Multi-Spectral Imaging for Autonomous Vehicles (UAVs, UGVs, and UUVs) Using Active Compensation Brett E. Bagwell, David V. Wick, and Brian F. Clark Prepared by Sandia National Laboratories Albuquerque, New Mexico 87185 and Livermore, California 94550 Sandia is a multiprogram laboratory operated by Sandia Corporation, a Lockheed Martin Company, for the United States Department of Energy’s National Nuclear Security Administration under Contract DE-AC04-94AL85000. Approved for public release; further dissemination unlimited.

2
Issued by Sandia National Laboratories, operated for the United States Department of Energy by Sandia Corporation. NOTICE: This report was prepared as an account of work sponsored by an agency of the United States Government. Neither the United States Government, nor any agency thereof, nor any of their employees, nor any of their contractors, subcontractors, or their employees, make any warranty, express or implied, or assume any legal liability or responsibility for the accuracy, completeness, or usefulness of any information, apparatus, product, or process disclosed, or represent that its use would not infringe privately owned rights. Reference herein to any specific commercial product, process, or service by trade name, trademark, manufacturer, or otherwise, does not necessarily constitute or imply its endorsement, recommendation, or favoring by the United States Government, any agency thereof, or any of their contractors or subcontractors. The views and opinions expressed herein do not necessarily state or reflect those of the United States Government, any agency thereof, or any of their contractors. Printed in the United States of America. This report has been reproduced directly from the best available copy. Available to DOE and DOE contractors from U.S. Department of Energy Office of Scientific and Technical Information P.O. Box 62 Oak Ridge, TN 37831 Telephone: (865) 576-8401 Facsimile: (865) 576-5728 E-Mail: [email protected] Online ordering: http://www.osti.gov/bridge Available to the public from U.S. Department of Commerce National Technical Information Service 5285 Port Royal Rd. Springfield, VA 22161 Telephone: (800) 553-6847 Facsimile: (703) 605-6900 E-Mail: [email protected] Online order: http://www.ntis.gov/help/ordermethods.asp?loc=7-4-0#online

3
SAND2007-0148 Unlimited Release
Printed January 2007
Radical Advancement in Multi-Spectral Imaging for Autonomous Vehicles (UAVs, UGVs, and
UUVs) Using Active Compensation
Brett E. Bagwell and David V. Wick System Architecture & Engineering
Department 6345
Brian F. Clark Cognitive & Exploratory Systems
Department 6341
Sandia National Laboratories P.O. Box 5800
Albuquerque, New Mexico 87185-MS1188
Abstract The purpose of this LDRD was to demonstrate a compact, multi-spectral, refractive imaging systems using active optical compensation. Compared to a comparable, conventional lens system, our system has an increased operational bandwidth, provides for spectral selectivity and, non-mechanically corrects aberrations induced by the wavelength dependent properties of a passive refractive optical element (i.e. lens). The compact nature and low power requirements of the system lends itself to small platforms such as autonomous vehicles. In addition, the broad spectral bandwidth of our system would allow optimized performance for both day/night use, and the multi-spectral capability allows for spectral discrimination and signature identification.

4

5
CONTENTS
1. Introduction................................................................................................................................ 7 1.2. Background..................................................................................................................... 7
2. Active optics .............................................................................................................................. 8 2.1 Liquid Crystal Lenses ................................................................................................... 10
2.1.1 Characterization................................................................................................... 11 2.2 Spectral filters ............................................................................................................... 15
2.2.1 Lyot Filters...................................................................................................... 16 2.2.2 Solc Filters ...................................................................................................... 16 2.2.3 Digital Tunable Filters (DTFs) ....................................................................... 18
3. Increasing the Spectral Bandwidth of a Simple Night Vision Monocular............................... 20
4. Conclusions.............................................................................................................................. 34
5. References................................................................................................................................ 35
Distribution ................................................................................................................................... 37
FIGURES Figure 1: Axial Chromatic Aberration in an F/2, BK7 Singlet....................................................... 8 Figure 2: Dipole in an External Electric Field ................................................................................ 9 Figure 3: Uniaxial Birefringent LC without (a) and with (b) an External Electric Field. .............. 9 Figure 4: Twisted Nematic Liquid Crystal ................................................................................... 10 Figure 5: Liquid Crystal Lens ....................................................................................................... 10 Figure 6: LC Lens Focal Length and Irradiance........................................................................... 12 Figure 7: Focal Length vs. V2 ....................................................................................................... 12 Figure 8: LC Lens Wavefront Measurement ............................................................................... 13 Figure 9: OPD with Variable Focus.............................................................................................. 14 Figure 10: OPD LC 47, f= 10 cm. WPV = .75 λ........................................................................... 14 Figure 11: OPD LC 48, f = 7 cm. WPV = .61 λ............................................................................ 14 Figure 12: Uniaxial Retarder Between Polarizer and Analyzer.................................................... 16 Figure 13: Five Stage Lyot Filter.................................................................................................. 16 Figure 14: Visible Solc Tunable Filter.......................................................................................... 17 Figure 15: NIR Solc Tunable Filter .............................................................................................. 17 Figure 16: Visible Digital Tunable Filter (DTF) .......................................................................... 18 Figure 17: DTF Block Diagram.................................................................................................... 18 Figure 18: Digital Tunable Filter (DTF) Pass-Band ..................................................................... 19 Figure 19: Passive Polarization Interference Filter Pass-Bands ................................................... 20 Figure 20: Combined Transmission from DTF and PIF............................................................... 20 Figure 21: Spectral Response of InGaAs and VisGaAs [2].......................................................... 21 Figure 22:Comparison of (a). Traditional InGaAs, and (b). VisInGaAs ...................................... 22 Figure 23: Night Sky Radiance and Throughput [32] ................................................................. 22 Figure 24: Spectral Discrimination of a Camouflaged HMMWV................................................ 23

6
Figure 25: F/6 Refractive Imaging System w/LC Lens and Filter................................................ 24 Figure 26: Silicon Responsivity.................................................................................................... 24 Figure 27: visible Geometric PSF (Uncorrected) ......................................................................... 24 Figure 28: NIR Geometric PSF (Uncorrected) ............................................................................. 25 Figure 29: Increased Spectral Bandwidth Imaging System.......................................................... 25 Figure 30: Standard Lamp Spectral Output .................................................................................. 26 Figure 31: Best Focus λ= 0.45 μm ............................................................................................... 26 Figure 32: visible-NIR Uncorrected PSF...................................................................................... 27 Figure 33: Corrected PSF.............................................................................................................. 28 Figure 34: Strehl Ratio vs. Wavelength........................................................................................ 29 Figure 35: visible Resolution Target Images ................................................................................ 30 Figure 36: NIR Resolution Target Images.................................................................................... 31 Figure 37: LC Lens Drive Voltage and Encircled Energy............................................................ 32 Figure 38: Quadratic Fit Coefficients for Drive Voltage V2........................................................ 33 Figure 39: Continuous Drive Voltage Curves .............................................................................. 33
TABLES Table 1. Liquid Crystal Lenses .................................................................................................... 11 Table 2. Shortest focal lengths and OPD of liquid crystal lenses................................................ 13 Table 3. Zernike coefficients of liquid crystal lenses .................................................................. 15
NOMENCLATURE DOE Department of Energy FOV field-of-view LC liquid crystal LP linear polarized NIR near-infrared NVG night vision goggles NLC nematic liquid crystal SLM spatial light modulator SNL Sandia National Laboratories SWIR short-wave infrared TNLC twisted nematic liquid crystal UAV unmanned aerial vehicle UGV unmanned ground vehicle UUV unmanned underwater vehicle

7
1. INTRODUCTION Autonomous vehicles have become multi-million dollar industries supplying both commercial and military customers. As evidenced by recent events in Iraq and Afghanistan, there is a growing sense of urgency to improve our ability to discriminate spectral content for a number of military applications, including chem/bio detection and the detection of IEDs. Using unmanned systems allows our troops to stay out of harms way. As size, weight, and power are a premium on many platforms, especially on mini and micro UAVs, UGVs, and UUVs, our approach can reduce the size of the optical system and allow for spectral resolution from a compact, nonmechanical system. It is also possible to use this technology in conjunction with nonmechanical zoom, which is also being developed by our group at Sandia National Laboratories. The combination of increased spectral and spatial resolution could be useful for threat discrimination from an extremely compact, nonmechanical system. In addition, night vision systems are currently limited to a spectral bandwidth of approximately 600 nm to 850 nm. Recent DARPA-funded research (a $40M+ program) has led to the development of an InGaAs based detector with a very wide spectral range, spanning the visible (0.4-0.75 μm), near-infrared (NIR: 0.75-1.0 μm), and short-wave infrared (SWIR: 1.0-1.8 μm) [35,2]. There are at least two companies that have developed complex imaging sensors that will image across all of these bands. Our technique would not only make the imaging system more compact, but it would allow spectral discrimination from a nonmechanical system. 1.2. Background Axial (or longitudinal) chromatic aberration is simply a variation in focal length f(λ) with wavelength. In addition to the spectral response of the focal plane array/film, it is often the limiting factor determining the useable spectral bandwidth of a transmissive system, especially near the optical axis, [3] Ch 3. The refractive index (n) of a material is wavelength dependent, and it is these differences in refractive index, n(λ), that lead to variations in effective focal length, f(λ). In the case of a simple positive lens, Figure 1, shorter wavelengths will have a shorter focal length than longer wavelengths. Wherever we place the image plane, all but one of the wavelengths will be out of focus (at least in the geometric approximation). Further image degradation associated with dispersion results from transverse chromatic aberrations and the wavelength dependence of the so-called monochromatic aberrations (especially at large field angle). Traditionally, lens designers introduce more degrees of freedom to the design to address this issue. More lenses with different glass types are added in order to increase the spectral bandwidth over which the system meets some required metric (e.g. diffraction limited, detector limited, minimum spatial resolution, etc.). Thus, a typical camera lens is designed to meet specific requirements, such as f/#, focal length, and field-of-view, and will require a sufficient number of lens elements to meet those requirements over the entire visible spectrum.

8
Figure 1: Axial Chromatic Aberration in an F/2, BK7 Singlet However, difficulties arise when one needs to image over a wide spectral range (e.g. Δλ > 600 nm), and the system must be extremely simple and compact. Additional complications arise if there is a need to spectrally resolve the image (i.e. image only one spectral region at a time). For spectral discrimination, one can use fewer optical elements, a mechanical color wheel, and an adjustable focus, but this adds mechanical complication and power requirements. We have developed and submitted a patent on a novel solution to this problem that uses liquid crystal-based polarization interference filters to isolate a narrow spectral region of interest and an active optic, such as a liquid crystal (LC) lens, to correct the focus over that spectral region. This approach completely removes the need for mechanical components. The end state is a transmissive system that is compact, requires no macroscopic moving parts, and has the ability to resolve an image over a wide spectral range.
2. ACTIVE OPTICS The active optical components utilized in this research relied on birefringent liquid crystal (LC) materials to alter either the phase or the polarization of the incoming wavefront. Birefringence, or optical anisotropy, refers to a variation in refractive index with molecular orientation relative to the polarization state of incoming light. Many crystalline materials exhibit such properties. The most general case is biaxial birefringence, where there exist three non-degenerate refractive indices (nX, nY, nZ). When two of these three are degenerate, the material is uniaxial, and these two indices are the ordinary index of refraction, no. The non-degenerate index is the extraordinary index of refraction, ne. The LC’s optical axis is defined as the direction of propagation such that the molecule behaves isotropically, that is the k vector of a propagating electromagnetic field is parallel to the extraordinary axis. A uniaxial material can be further classified as having positive birefringence (ne > no) or negative birefringence (ne < no) [4], Ch. 15. In this research, we utilize the LC devices such that our imaging system’s optical axis is normal to the LC optical axis. LC materials, as the name implies, occupy a phase state in between an isotropic liquid and an anisotropic crystalline solid. The sub-class of LC material of interest for our applications are nematic (NLC), which are uniaxial birefringent. The application of an external electric field
λ = 0.486 1.8 μm Δf = 2.5 mm
Δf = 0.8 mm λ = 0.486 0.656 μm

9
induces a dipole in the NLC molecule, which in turn interacts with the external electric field to produce a torque and a rotation of the optical axis. To prevent migration within the LC material, NLC’s are driven by an AC voltage. Since the dipole moment is induced, not permanent, it changes sign with a change in sign of the external electric field, and the torque retains its direction. The LC molecule stops its rotation when the torque exerted by the external electric field is balanced by the elastic torque exerted by the surrounding LC molecules [5], Ch. 7.
Dipole: d = q⋅r Torque: τ = d × F
Figure 2: Dipole in an External Electric Field
The bulk behavior of NLC molecules is such that their optical axes tend to align parallel to one another. Boundary conditions can be established by polishing alignment layers on the plates enclosing the LC material. In the LC lenses used in this research, the fore and aft alignment layers are parallel and the LC is in an untwisted configuration. This is known as the electrically controlled birefringence mode, and is utilized for pure phase modulation of a linearly polarized input. Application of an external electric field results in a change in the index of refraction experienced by an incoming polarized wavefront given by:
θθθ
2222 sincos)(
EO
EO
nn
nnn
+=
where θ is the angle between the optical axis and the k vector (see Figure 3).
Figure 3: Uniaxial Birefringent LC without (a) and with (b) an External Electric Field.
A second mode of operation is a twisted nematic liquid crystal (TNLC) configuration, wherein the alignment layers are orthogonal. In this configuration the optical axis of the LC molecules twist in a helical manner through 90º. For a linear polarized (LP) input parallel to the first alignment layer, this helical twist will rotate the state of polarization through π/2, via a waveguide effect, see Figure 4.
ne
z
no no
ne
no no
k
θLP
(a). V = 0 (b). │V│> 0
EEXT
E+ q
- q
d
τ

10
Figure 4: Twisted Nematic Liquid Crystal When a voltage is applied, the optical axes all reorient parallel to the direction of propagation, and the state of polarization remains unchanged. When the output passes through an analyzer orthogonal to the input, the result is a light valve, which allows light through in an uncharged state and blocks it in a charged state [6]. A TNLC 90º is used in conjunction with polarization interference filters to actively control the pass-band of the digital tunable filters used in our polychromatic systems. 2.1 Liquid Crystal Lenses Liquid crystal lenses are made with either patterned electrodes or gradient polymers in order to produce an inhomogeneous electric field across the LC material [7]. The goal is to produce a tunable lens with electrically controllable focal length.
Figure 5: Liquid Crystal Lens
ne

11
Figure 5 depicts one of the liquid crystal lenses used in our nonmechanical zoom system. The focal length is varied by aligning the LC molecules to spatially vary the index of refraction in a quadratic fashion across the radius of the lens, similar to the OPD of a glass lens. The spectral bandwidth of an LC lens is simply limited by dispersion in the liquid crystal itself, and that dispersion must be considered in the design process. 2.1.1 Characterization HoloChip, LLC provided us with 12 lenses, 3 different diameters and 4 thicknesses:
Table 1. Liquid Crystal Lenses
Thickness Diameter
50.8 μm
76.2 μm
101.6 μm
127 μm
2.5 mm 41 42 43 44
3.5 mm 45 46 47 48
4.5 mm 49 50 51 52
We evaluated 7 of 12 lenses, with 1 bad lens and 6 lenses characterized. In doing so, we tried a large combination of drive voltages (V1: 20-100V and V2: 50-250V). We looked at the wavefront error and relative on-axis irradiance and decided to fix V1 at 20 V. We then characterized six lenses in three areas: On-Axis Irradiance: We measured on axis irradiance relative to total incident irradiance for a given focal length. Metric: Highest relative on-axis irradiance (light in a bucket). Focal Length: We varied V2, measuring distance at which on axis irradiance was a maximum. Metric: Minimum focal length, defined as the distance at which on-axis irradiance was at least 20% of incident. Aberrations: We then selected two lenses with best F/# and relative on axis irradiance and obtained wavefront error for the shortest focal length. Metric: OPD < 1 λ. The test apparatus to measure the irradiance and focal length is depicted in Figure 6:

12
Figure 6: LC Lens Focal Length and Irradiance We first illuminated the LC lens with a collimated HeNe (λ = .632 μm) and measured the total irradiance exiting the clear aperture. Having fixed V1, we then varied V2 and measured the resulting focal length by translating a 150 μm pinhole in x, y, and z until we achieved a maximum reading on the detector/power meter. As we reduced the focal length, aberrations increasingly blurred the focused spot. We defined the minimum focal length as the distance at which this maximum was at least 20% of the total irradiance measured in an unpowered state. Figure 7 depicts the result for five of the most promising LC lenses. Based on their relatively short focal lengths and high on-axis irradiance, we selected LC lenses 47 and 48 for further characterization.
Figure 7: Focal Length vs. V2 To quantify the wavefront error of the LC lenses, we set up the LC lenses in front of a Zygo with a positive reference sphere, as shown in Figure 8.
LC Lens Polarizer
Aperture
Collimated HeNe
Detector
Power Meter
Pinhole (150 um)

13
Figure 8: LC Lens Wavefront Measurement By placing the focused spot from this reference sphere at the front focus of the LC lens and then reflecting the collimated light off a flat mirror we were able to create an external reference leg. In order to enable measurements at various focal lengths we inserted a positive lens on a translation stage between the flat mirror and the LC lens. When power is applied to the LC lens, the distance that this positive lens needs to be moved to
re-collimate the light onto the flat mirror is given by: ( )0
2
ZfZZ
LC
O
−=Δ . This relationship is
graphically illustrated in Figure 9. To independently verify our previous focal length measurements, we applied the appropriate V1 and V2 voltages, and translated the positive lens until the OPD was a minimum. Measuring Δz, we then calculated and compared the short focal lengths for LC 47 and 48, with the following results:
Table 2. Shortest focal lengths and OPD of liquid crystal lenses
LC 47 Irradiance OPD LC 48 Irradiance OPD 7.3 cm 7.0 cm 7.0 cm 7.15 cm 8.5 cm 8.5 cm 7.8 cm 8.0 cm 10.0 cm 9.96 cm 10.0 cm 9.8 cm
Zygo
Negative Lens
Polarizer
Flat Mirror
Positive Lens
Spherical Reference
LC Lens

14
Figure 9: OPD with Variable Focus The aberrations for the minimum focal length for each lens are shown below:
Figure 10: OPD LC 47, f= 10 cm. WPV = .75 λ
Figure 11: OPD LC 48, f = 7 cm. WPV = .61 λ
Unpowered
Powered
LC
LC
ZO ΔZ

15
The corresponding Zernike coefficients are:
Table 3. Zernike coefficients of liquid crystal lenses
Zernike Coeff. LC 47, f = 10 cm LC 48, f = 7 cm Power Z3 .078 .023 X Astigmatism Z4 .021 .007 Y Astigmatism Z5 -.037 .000 X Coma Z6 .047 .092 Y Coma Z7 .136 .094 Spherical Z8 .031 -.153
2.2 Spectral filters LC lenses suffer from chromatic aberrations, by virtue of the fact that they rely on dispersion to impart their desired phase profiles. To overcome this limitation, we investigated a number of devices which would allow us to image only a narrow range of wavelengths in a manner that would allow a wide FOV, nonmechanical, compact imaging system. We initially focused on visible wavelengths (0.4-0.7 μm), keeping in mind the need to extend into the NIR, and potentially SWIR. The most straightforward and inexpensive method for color imaging is the use of a color-filtered focal plane array. Unfortunately this results in a loss of spatial resolution, each pixel being capable of imaging only one narrow range of wavelengths (e.g., an RGB Bayer pattern). Alternatively, one could opt for a three (or more) chip imaging system, but this necessitates spatially separating the different color channels. We discarded both methods as being inconsistent with the desired end-state of having a simple system with high resolution. Previous efforts at nonmechanical spectral filtering in an adaptive optical imaging system utilized acousto-optic tunable filters (AOTF) [8]. Wavelength selectivity was accomplished via diffraction from a variable frequency acoustic standing wave. The advantages of such a device are tunability and narrow pass band. Typical disadvantages of AOTFs are large packaging size, small clear aperture, and small acceptance angles—none of which were consistent with our design goals. To overcome these drawbacks, we used application-specific polarization interference filters (PIFs), both continuous (tunable) and discrete (digital) PIFs. The benefit is a reduction in thickness and an increase in the useable field of view. The primary drawback to PIFs is the loss associated with an unpolarized input (50%). Since we were using polarized light for the other LC active optics, this was not an added disadvantage.

16
2.2.1 Lyot Filters Polarization interference filters rely on birefringent materials placed between a polarizer and analyzer. This birefringence performs both the wavefront shearing and OPD necessary for interference of a linearly-polarized input, while the analyzer provides the requisite recombination. The number of birefringent layers, layer thicknesses, amount of birefringence, and orientation relative to the polarizer and analyzer dictate the pass-bands. For instance, a single uniaxial retarder at α = 45º between parallel/perpendicular polarizers yields a transmission spectra given by TX = Cos2(πΔnd/λ) [6] (see Figure 12). Filters have been constructed that are simply the addition of multiple such stages, each of geometrically increasing retarder thicknesses but with the same birefringence and orientation, a concept first described by B. Lyot in 1933 [9], and illustrated below in Figure 13 for a 5-stage filter. The output is the product of the individual sinusoids.
Figure 12: Uniaxial Retarder Between Polarizer and Analyzer
Figure 13: Five Stage Lyot Filter 2.2.2 Solc Filters Solc et.al, later improved upon the basic Lyot design by introducing multiple retarders between a single polarizer and analyzer, albeit with different birefringent orientation [10]. With the
nE
nO
LP
TXTY
d
α θ
( )XY
OX
TTndkT
−=Δ−⋅−−=
1)cos(1)](2sin[2sin2sin αθαθ

17
addition of birefringent LC material in the individual stages of both types of filters, the narrow spectral pass-band of the filter can be tuned via an applied voltage [11]. Commercial devices based on both Lyot and Solc analog filters are currently available. We evaluated two models manufactured by Cambridge Research and Instrumentation (CRI), both tunable Lyot-type with a 20 mm entrance aperture and a 7.5º half FOV. The visible model had a wavelength range from 0.40 – 0.72 μm, and the NIR model had a wavelength range from 0.65-1.10 μm. The manufacturer specified transmittance for both are depicted in Figure 14 and Figure 15.
Figure 14: Visible Solc Tunable Filter
Figure 15: NIR Solc Tunable Filter

18
In general, analog filters suffer from significant drawbacks for our applications, not the least of which are throughput, filter thickness, and field-of-view. The polarizing film in each filter stage typically has approximately a 10% transmission loss. Filters with high finesse and acceptable dynamic range generally have poor peak transmission and are bulky. In the Solc filter, bandpass tunability requires that each multi-order retarder is fully tunable. So in practice, throughput is often not significantly improved, because the insertion loss of each polarizer is traded for the additional LC cell losses. A more viable alternative has been developed by ColorLink, Inc. for use in the visible, with the potential for extension to the NIR and SWIR. 2.2.3 Digital Tunable Filters (DTFs) DTFs use digitally driven LC devices as wavelength-neutral polarization switches for the random-access selection between a pre-defined set of spectral profiles.
Figure 16: Visible Digital Tunable Filter (DTF) Like the Lyot filter, DTFs represent the product of independent filter stages. However, the task of generating a high-quality bandpass is almost exclusively confined to a single element: a Solc-type passive retarder stack (RS) placed in each stage. The retarder stack is typically a multi-layer laminate of bulk transparent stretched polymer (birefringent) retarder films. The LC layer simply provides (digital) access to the passband of each retarder stack.
RS2 LC2RS1 LC1 RS2 LC2RS1 LC1
Figure 17: DTF Block Diagram
19
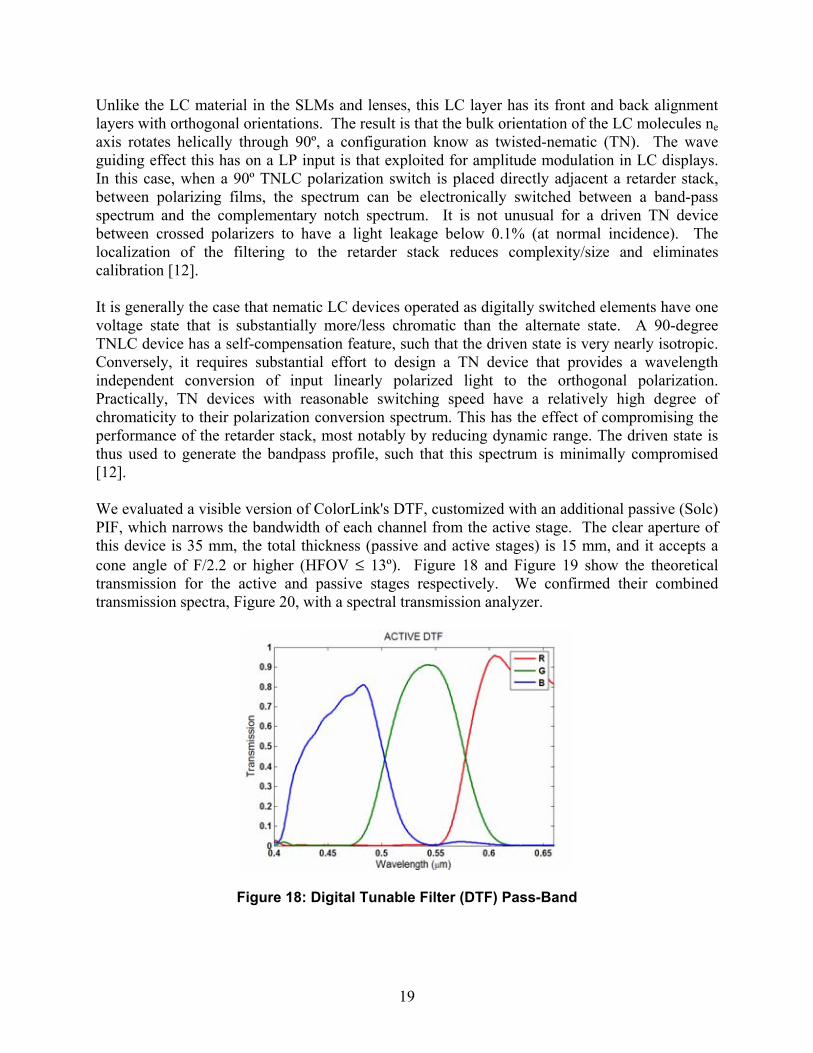
Unlike the LC material in the SLMs and lenses, this LC layer has its front and back alignment layers with orthogonal orientations. The result is that the bulk orientation of the LC molecules ne axis rotates helically through 90º, a configuration know as twisted-nematic (TN). The wave guiding effect this has on a LP input is that exploited for amplitude modulation in LC displays. In this case, when a 90º TNLC polarization switch is placed directly adjacent a retarder stack, between polarizing films, the spectrum can be electronically switched between a band-pass spectrum and the complementary notch spectrum. It is not unusual for a driven TN device between crossed polarizers to have a light leakage below 0.1% (at normal incidence). The localization of the filtering to the retarder stack reduces complexity/size and eliminates calibration [12]. It is generally the case that nematic LC devices operated as digitally switched elements have one voltage state that is substantially more/less chromatic than the alternate state. A 90-degree TNLC device has a self-compensation feature, such that the driven state is very nearly isotropic. Conversely, it requires substantial effort to design a TN device that provides a wavelength independent conversion of input linearly polarized light to the orthogonal polarization. Practically, TN devices with reasonable switching speed have a relatively high degree of chromaticity to their polarization conversion spectrum. This has the effect of compromising the performance of the retarder stack, most notably by reducing dynamic range. The driven state is thus used to generate the bandpass profile, such that this spectrum is minimally compromised [12]. We evaluated a visible version of ColorLink's DTF, customized with an additional passive (Solc) PIF, which narrows the bandwidth of each channel from the active stage. The clear aperture of this device is 35 mm, the total thickness (passive and active stages) is 15 mm, and it accepts a cone angle of F/2.2 or higher (HFOV ≤ 13º). Figure 18 and Figure 19 show the theoretical transmission for the active and passive stages respectively. We confirmed their combined transmission spectra, Figure 20, with a spectral transmission analyzer.
Figure 18: Digital Tunable Filter (DTF) Pass-Band

20
Figure 19: Passive Polarization Interference Filter Pass-Bands
Figure 20: Combined Transmission from DTF and PIF “Blue”: 475 ± 5 nm. “Green”: 538 ± 9 nm. “Red”: 631 ± 13 nm.
Note that this is only for the visible range, as the source moved towards longer wavelengths (> 800 nm), the polarizers within the DTF and PIF become isotropic, and thus no interference occurs. This necessitated the addition of an NIR cut-off filter.
3. INCREASING THE SPECTRAL BANDWIDTH OF A SIMPLE NIGHT VISION MONOCULAR
This research is intended to complement recent advances in indium gallium arsenide (InGaAs) focal plane array technology. The ability of InGaAs photodiodes to function at room temperature with high responsivity over the range 0.9-1.8 μm make them an ideal choice for imaging in the short wavelength infrared (SWIR). Recent (DARPA -funded) efforts to extend

21
the responsivity to shorter wavelengths has resulted in VisGaAs™ focal plane arrays that can simultaneously image in the SWIR, near infrared (NIR: .75-1 μm), and visible (VIS: .4-.75 μm), [1,2]. The responsivity of these new materials is shown in Figure 21. Commercial devices based on these efforts have just become available in 2006.a,b
Figure 21: Spectral Response of InGaAs and VisGaAs [2] Figure 22 is a comparison of images taken with traditional InGaAs and VisGaAs focal plane arrays [31]. The traditional InGaAs (a) clearly cannot detect the visible illumination (text) from the computer screen, although there is an NIR component from the fluorescent backlight. The VisGaAs (b) can detect both the visible imagery as well as the infrared component from a hot soldering iron that has been introduced into the field of view. The problem of imaging across such a broad spectral range is two-fold. The first has already been discussed: chromatic aberrations. The SWIR rays from the soldering iron are out of focus in (b). As the author of this article pointed out: “The lens used to collect these images is a visible lens that also has high IR transmission. It works well as either a visible-only lens or an IR-only lens but can’t function well when performing simultaneous imaging of both spectral regions” [31]. Passing the wavelength range of interest and then correcting for focus at the center of the range, virtually eliminates this aberration.
a Indigo Sytsems Inc.: www.indigosystems.com b Sensors Inc.: www.sensorsinc.com

22
(a). InGaAs (b). VisInGaAs
Figure 22:Comparison of (a). Traditional InGaAs, and (b). VisInGaAs Transmissive lens designs are available that attempt to cover the entire regime,c but they are complex and fail to address the second problem—the unequal spectral responsivity of the detector. Note in Figure 22 (b), that the soldering iron (SWIR) is also clearly saturating the detector, relative to the visible signal from the monitor. Compensating for this problem requires some a priori knowledge about the spectral composition of the scene of interest. A camera based on a VisGaAs focal plane array lends itself well to future night vision systems, as evidenced by the following night sky spectral radiance chart (left). Note that current night vision devices (GEN III-IV) cut-off at approximately 0.85 μm [32].
Figure 23: Night Sky Radiance and Throughput [32] When the detectors spectral response characteristics are taken into account, we get the throughput at right (normalized by the in-band maximum). Under a full moon, the SWIR component is only two times greater than the visible, but under other phases it is anywhere from
c Coastal Optics, Inc: www.coastalopt.com

23
5-10 times greater. Without a mechanism for compensating the unequal weighting of these spectral components, information will be lost. By imaging a spectral band at a time, the gain of the camera can be adjusted to achieve maximum contrast for that band. One of the collateral benefits of imaging spectral bands sequentially is the ability to spectrally discriminate the image.
(a). visible (b). SWIR
Figure 24: Spectral Discrimination of a Camouflaged HMMWV The figure above dramatically illustrates the difference such discrimination can make on the battlefield [33]. Figure 24 (a) depicts a camouflaged vehicle in the visible and (b) the same vehicle in the SWIR. Because the reflectivities of the various paints are different at longer wavelengths, the camouflage is much less effective. Design The general approach we explored is graphically depicted above. We used: - liquid crystal-based tunable color filters to select the imaging wavelength of interest, - liquid crystal lenses to correct the wavefront error (focus) at that wavelength, - an appropriate wide-band focal plane array (e.g., Vis-InGaAs), adjusting the integration time to compensate for the responsivity of the material.
In order to demonstrate this concept, we set up a simple 50mm focal length imaging system, as show in Figure 25, below. Since the LC lens cannot apply a negative focal length, we aligned the system for best focus at λ = 450 nm.

24
Figure 25: F/6 Refractive Imaging System w/LC Lens and Filter We used a silicon-based CCD camera, with 4.4 x 4.4 μm pixels and the following spectral response:
Figure 26: Silicon Responsivity For this system, we thus restricted our observations to the range: 0.45 μm ≤ λ ≤ 1.05 μm. The geometrically predicted on-axis RMS spots (uncorrected) in the range 0.45-1.05 μm are show below. For reference, the Airy diameter at each wavelength is also show.
Figure 27: visible Geometric PSF (Uncorrected)
3º HFOV
Polarization Interference Filter
Plano-Convex fEFF = 50 mm
LC Lens
CCD
6.5 μm
200 μm
7.8 μm 70.6 μm
8.5 μm
111 μm
10 μm
DRMS
DAIRY
.450 μm .550 μm .650 μm

25
Figure 28: NIR Geometric PSF (Uncorrected) Note that the increase in spot size is a non-linear function of wavelength, dictated by the dependence of the focal length on the non-linear dispersion of the glass in question (in this case BK7). Performance
Figure 29: Increased Spectral Bandwidth Imaging System To measure the PSF we used a point source (D ≤ .5 mm) at a distance Z = 1500 mm, with the calibrated spectral shown in Figure 30. This source was chosen for its relatively flat output over the wavelengths of interest.
11.6 μm
137 μm 157 μm
13.1 μm
172 μm
14.7 μm
DRMS
DAIRY
186 μm
16.2 μm
400 μm
.750 μm .850 μm .950 μm 1.050 μm

26
Figure 30: Standard Lamp Spectral Output Figure 31 depicts the measured PSF, uncorrected (i.e. without any voltage applied to the LC lens), at λ = 0.45 μm. This is best focus for the system. On axis it is near the diffraction limit (DAIRY = 6.5 μm) and also close to the limits of our sampling ability (4.4 μm x 4.4 μm pixels).
Figure 31: Best Focus λ= 0.45 μm When the source is coherent (as with a true point source) and the aberrations are sufficiently low, diffraction effects dominate. In this case, geometrical optics does not give an accurate prediction of the point spread function. Instead, a Fourier transform of the exit pupil yields functionally correct results. Figure 32 depicts the theoretical and measured PSF over the range .650-1.05 μm. Note that, in the interest of brevity, we have limited our images to discrete snapshots at the wavelengths shown. Actual measurements were made in 0.10 μm increments from 0.45 1.05 μm.

27
Figure 32: visible-NIR Uncorrected PSF

28
Figure 33: Corrected PSF Rayleigh scattering from the liquid crystal molecules is manifested in an increased FWHM of the PSF at shorter wavelengths, shown in Figure 33. It is also evident in an attendant reduction of the Strehl ratio, as shown in Figure 34. This reduction in performance in the visible regime for

29
thick LC lenses (> 10 μm) has been observed as early as 1979 [34]. Note that at 0.45 μm the LC lens is off and the system is aligned for best focus. Without any voltage to the lens, the scattering is reduced, resulting in a higher Strehl ratio.
Figure 34: Strehl Ratio vs. Wavelength These Strehl ratios, corresponded to an OPD of between 0.5 1.0 λ of error [1]. While dismal for astronomy, the corrected PSF served quite well for our imaging purposes across the IFOV, as shown in Figure 35 (visible) and Figure 36 (NIR). These figures depict static on-axis images of a 7.5 cm USAF 1951 resolution target, back illuminated, , and represent approximately a 2º field of view.

30
Figure 35: visible Resolution Target Images

31
Figure 36: NIR Resolution Target Images Note that the low signal-to-noise at long wavelengths (e.g., 1.05 μm) resulted because we were forced to switch to a narrow-band source (equipment failure) and not because of the camera/lens/filter throughput. The above images were taken at fixed voltages (V1 and V2), with at least 60 seconds between frames.

32
In addition to the scattering at shorter wavelengths, the other major drawback to LC lenses as an active optical component are the slow response and relaxation times of the LC molecules. For the static images depicted above, We initially used values for V1 and V2 in the range 50-150 V, as specified by the manufacturer. The response time between the off state (λ = 0.45 μm, V1 and V2 = 0) and a corrected state was on the order of 20-25 seconds. The relaxation time was typically between 17.5 – 22.5 seconds. The relaxation time is independent of the applied voltage and increases as the square of the LC layer thickness [35]. However, increasing the voltages V1 and V2 (in an appropriate ratio) can increase the response time. To explore this possibility across the entire range of allowed voltages, we wrote a MATLAB program that measured the encircled energy for a point source image as a function of V1, V2, and λ. The results for λ = 0.65 μm and 1.05 μm are shown in Figure 37. In this figure the false color (blue-min, red-max) represents the encircled energy over a 13.2 μm square centered on the chief ray, normalized by the peak value across the entire range. We were limited by our equipment (a computer, GPIB interface, function generator, and amplifier) to Δt = 0.333 seconds, ΔV = ±5 V, V1MAX = 200 V and V2MAX = 400V.
Figure 37: LC Lens Drive Voltage and Encircled Energy

33
Figure 38: Quadratic Fit Coefficients for Drive Voltage V2
As shown by the dashed line in Figure 37, V2 = f(V1) followed a quadratic fit (appropriate for a quadratic phase distribution) given by:
)()()( 3122
112 λλλ CVCVCV +⋅+⋅= In order to more quickly change between spectral bands, we shifted the range of drive voltages along this family of quadratic curves to the high voltage regime shown in Figure 39 (V1: 100-200V, V2: 150-250 V).
Figure 39: Continuous Drive Voltage Curves We then linearly interpolated along a fit between the intercepts of these curves (e.g., Curve A, Figure 39-Subset) to achieve spectrally continuous (Δλ = ± .01 μm) imaging. This enabled us to switch bands with a response time of approximately 1 second and the image quality was comparable to that achieved in the static case.
λ 1.05 0.85 0.75 0.65 0.55 C1 : 9.651E-03 7.639E-03 5.860E-03 4.905E-03 2.637E-03
C2 : 0.146 0.128 0.188 0.111 0.106
C3 : 39.108 40.187 39.874 39.150 39.965

34
4. CONCLUSIONS We conceived and built a wide spectral band refractive imaging system composed of one static element and two active elements: an LC lens and a tunable PIF. The useable range of this system, without compensation, was 0.100 μm (0.45-0.55 μm). With the active optics it was 0.600 μm). The limiting factor in the later case was the responsivity of the detector, which could be easily overcome with the addition of a VisGaAs camera. Drawbacks to the system we demonstrated include scattering at short (VIS) wavelengths, the narrow field-of-view imposed by the tunable PIF, the requirement for different tunable PIFs for different bands of interest, high LC drive voltages, and the relatively slow temporal response of the LC lenses that limited us to approximately 1 frame/second. The narrow FOV and need for multiple PIFs could (and we hope will) be addressed by the development of a DTF polarization interference filter, customized for the bands of interest [40]. The scattering and slow response times are issues that can be virtually eliminated by the use of liquid crystal polymer composites, wherein the LC material is stabilized within a polymer network producing uniform alignment (reducing scattering) and mechanically stressing the molecules to produce higher birefringence and faster response times [51]. Dramatic reductions in drive voltage have been achieved by the suspension of submicron ferroelectric particles in nematic LCs [52].

35
5. REFERENCES
1. Martin, T., et al., 640x512 InGaAs Focal Plane Array Camera for Visible and SWIR
Imaging. Proceedings of SPIE, 2005. 5783: p. 12-20M. 2. Hoelter, T.R. and J.B. Barton, Extended short-wavelength spectral response from InGaAs
focal plane arrays. Proceedings of SPIE, 2003. 5074: p. 481-490. 3. Smith, W.J., Modern Optical Engineering. 3rd ed. 2000, New York: McGraw-Hill. 4. M. Born and E. Wolf, Principles of Optics (Oxford: Pergamon, 1999). 5. J.W. Goodman, Introduction to Fourier Optics. 3rd ed. (Englewood: Roberts & Company,
2005). 6. Sharp, G.D., M.G. Robinson, and J. Chen, Polarization Engineering for LCD Projection.
Wiley-SID Series in Display Technology, ed. A.C. Lowe. 2005, West Sussex: John Wiley & Sons, Ltd.
7. A.F. Naumov, et al., Control optimization of spherical modal liquid crystal lenses, Optics Express, 4(9): p. 344-352 (1999).
8. M.T. Gruneisen, Wavelength-agile telescope system with diffractive wavefront control and acousto-optic spectral filter. Proceedings of SPIE, 5553: p. 182-188 (2004).
9. B. Lyot, Optical Apparatus With Wide-Field Using Interference of Polarized Light. C.R. Acad. Sci., 197: p. 1593 (1933).
10. I. Solc, Birefringent Chain Filters. Journal of the Optical Society of America, 55: p. 621 (1965).
11. G. Kopp, M. Derks, and A. Graham, Liquid Crystal Tunable Birefringent Filters. SPIE, 2830: p. 345-350 (1996).
12. G. Sharp (Chief Technology Officer, ColorLink Inc.), private correspondence, Boulder, CO (2006).

36

37
DISTRIBUTION 1 MS0123 D. Chavez, LDRD Office 1011 1 MS1005 Russ Skocypec 6340 1 MS1005 Alan Nanco 6345 1 MS1009 Chuck Duus 6301 13 MS1188 David Wick 6345 1 MS1188 Brett Bagwell 6345 1 MS1188 Brian Clark 6341 2 MS9018 Central Technical Files 8944 2 MS0899 Technical Library 4536