Radiation Damage in Nuclear Graphite - Institute of Physics · School of something FACULTY OF OTHER...
44
School of Process and Chemical Engineering FACULTY OF ENGINEERING Radiation Damage in Nuclear Graphite Helen Freeman Institute for Materials Research [email protected] Sponsors:
Transcript of Radiation Damage in Nuclear Graphite - Institute of Physics · School of something FACULTY OF OTHER...

School of something FACULTY OF OTHER
School of Process and Chemical Engineering FACULTY OF ENGINEERING
Radiation Damage in Nuclear Graphite
Helen Freeman
Institute for Materials Research
Sponsors:

• Introducing graphite as a neutron moderator
• What happens to graphite in a nuclear reactor?
• Radiation damage through the length scales
• Nanoscale – dislocations
• Microscale – cracks and pores
• Future of graphite moderated reactors
• Summary
Content

Graphite moderated reactors
• > 80% current UK nuclear reactors
• Graphite:
• Moderates neutron energy
• Accommodates fuel and control rods
• Cooled by CO2 coolant
• Low atomic weight
• Low thermal neutron absorption cross
section
• High scattering cross section
• High thermal conductivity
• Low thermal expansion coefficient
Graphite moderated reactors
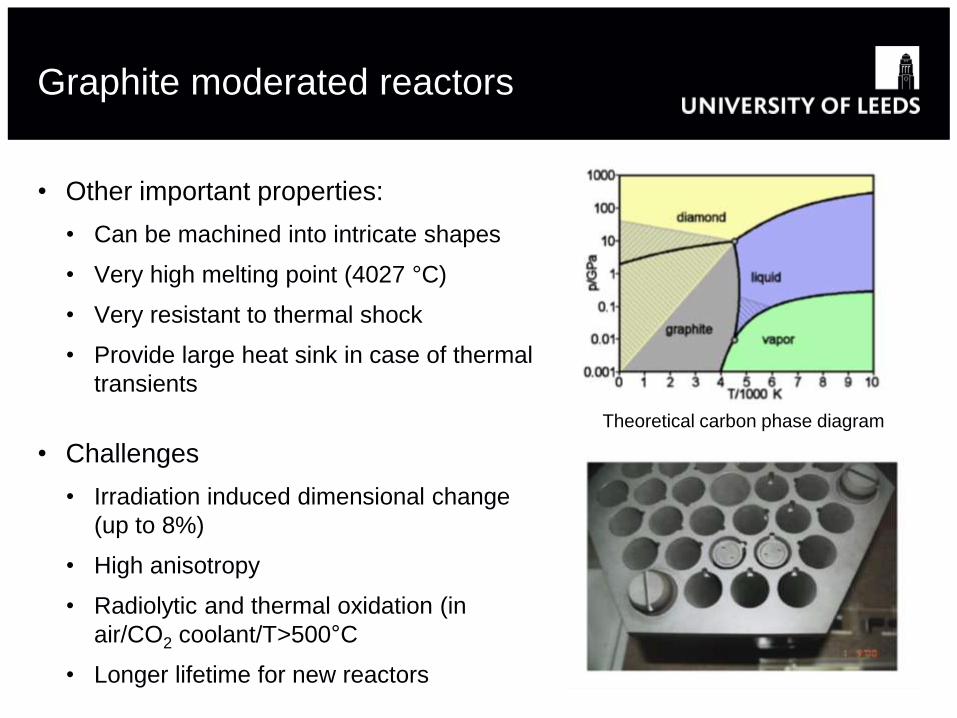
• Other important properties:
• Can be machined into intricate shapes
• Very high melting point (4027 °C)
• Very resistant to thermal shock
• Provide large heat sink in case of thermal
transients
Theoretical carbon phase diagram
• Challenges
• Irradiation induced dimensional change
(up to 8%)
• High anisotropy
• Radiolytic and thermal oxidation (in
air/CO2 coolant/T>500°C
• Longer lifetime for new reactors

Graphite moderated reactors
Fuel rods Control rods
Coolant channel
Graphite core
Nuclear reactor
Electron micrograph
Uranium
fission
High energy
neutrons
High energy
neutrons
released from
fission events
Neutrons bombard the
graphite moderator and
transfer energy
Changes in strength,
porosity, dimension etc.
(002) planes
(002) planes
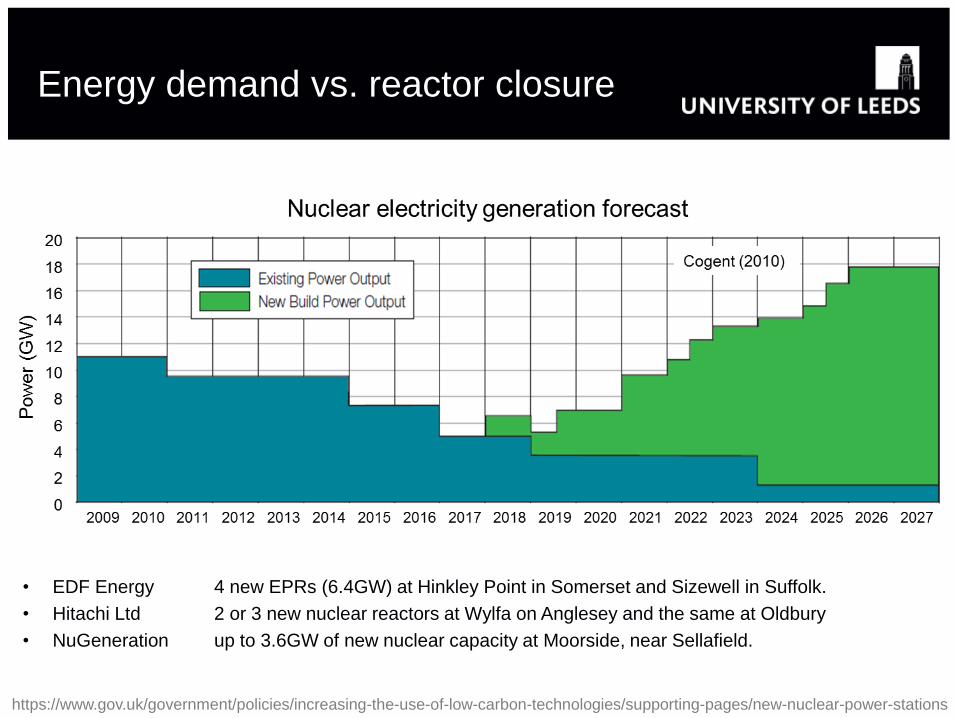
Energy demand vs. reactor closure
• EDF Energy 4 new EPRs (6.4GW) at Hinkley Point in Somerset and Sizewell in Suffolk.
• Hitachi Ltd 2 or 3 new nuclear reactors at Wylfa on Anglesey and the same at Oldbury
• NuGeneration up to 3.6GW of new nuclear capacity at Moorside, near Sellafield.
https://www.gov.uk/government/policies/increasing-the-use-of-low-carbon-technologies/supporting-pages/new-nuclear-power-stations

• It is increasingly recognised that
existing “mechanistic” models do not
fully explain the observed behaviour
of graphite in these reactors. There
are substantial gaps in understanding,
which have become apparent.
• The consortium investigated
irradiation induced dimensional
change, creep, and other property
changes using various
complementary characterisation
techniques.
Fun.Graphite
www.nuclear-graphite.org.uk
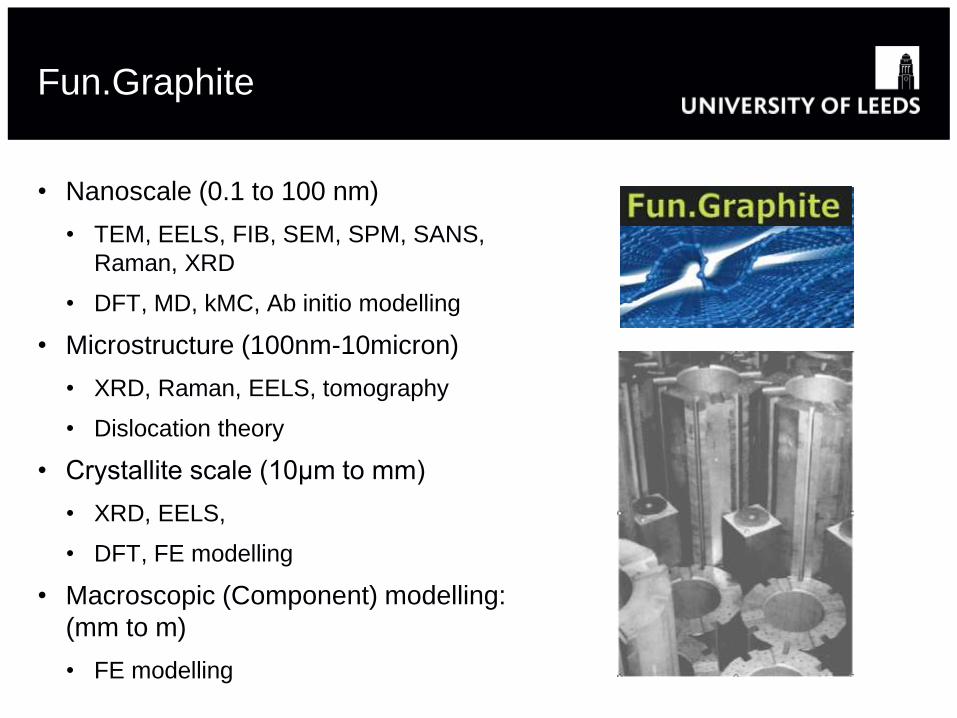
• Nanoscale (0.1 to 100 nm)
• TEM, EELS, FIB, SEM, SPM, SANS,
Raman, XRD
• DFT, MD, kMC, Ab initio modelling
• Microstructure (100nm-10micron)
• XRD, Raman, EELS, tomography
• Dislocation theory
• Crystallite scale (10μm to mm)
• XRD, EELS,
• DFT, FE modelling
• Macroscopic (Component) modelling:
(mm to m)
• FE modelling
Fun.Graphite

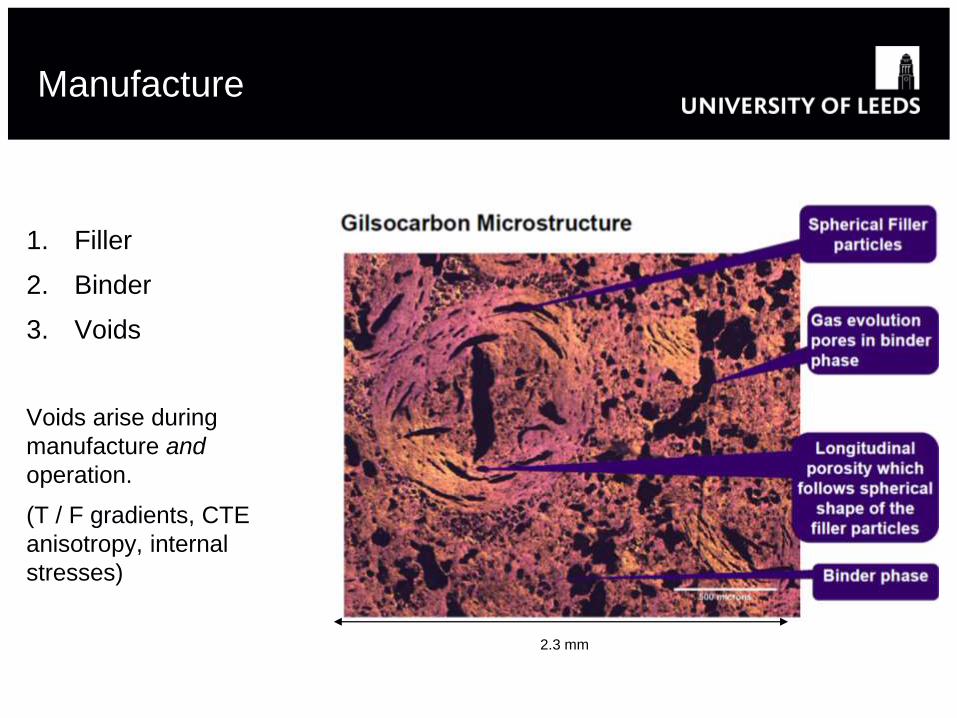
Manufacture
2.3 mm
Removes
volatiles
HCs
Extrusion:
Alignment of
filler particles
Shrinkage
Crystal
growth,
diffusion and
annealing
“Filler”
“Binder”
Manufacture
2.3 mm
1. Filler
2. Binder
3. Voids
Voids arise during
manufacture and
operation.
(T / F gradients, CTE
anisotropy, internal
stresses)

Atomistic model of neutron damage NANOSCALE: BONDING AND DENSITY ANALYSIS
The cascade model
A 1 MeV neutron
produces ca. 500 atomic
displacements
vacancy
interstitial
PKA = primary knock on atom
neutron
SDG = secondary displacement group
PKA
SDG
SDG
A= 12 (carbon)
neutron
energy
transferred
energy

Atomistic model of neutron damage NANOSCALE: BONDING AND DENSITY ANALYSIS
vacancy
interstitial
PKA = primary knock on atom
neutron
SDG = secondary displacement group
PKA
SDG
SDG
Problems:
• Assumes flat graphite layers
• No quantitative fit with experiment for dimensional change
• First principles calculations show that interstitial is much
less mobile than thought

Atomistic model of neutron damage NANOSCALE: BONDING AND DENSITY ANALYSIS
Multiple basal plane dislocations
Single vacancies and interstitials
Di-vacancies and interstitials
Prismatic dislocation loops
Basal/edge dislocation
Stone-Wales defect
Screw dislocation
Stacking faults
Ruck and tuck
Voids
Heggie et al. J. Nuc Mat 413(3) (2011)
Trevethan et al. Phys. Rev. Let. 111(9) (2013)

Quantification of radiation damage NANOSCALE: BONDING, DENSITY AND DISLOCATION ANALYSIS
Transmission Electron Microscopy
Electron energy loss spectroscopy
Selected Area Electron Diffraction
EFTEM ratio map
002 graphite planes
In-situ TEM

High voltage
Accelerated electrons
High energy
electrons
Small wavelength
High resolution
Image from the Super-STEM
facility, UK
TEM facility at Leeds
Transmission Electron Microscopy
λ(light) 400 – 750 nm
λ(e-) 1 – 4 pm

Quantification of radiation damage TRANSMISSION ELECTRON MICROSCOPY
5 nm5 nm
5 nm
5 nm5 nm
5 nm
5 nm5 nm
5 nm
200 kV 200 kV 200 kV
(002) Graphite planes (002) Graphite planes (002) Graphite planes
5 nm5 nm
5 nm 5 nm
5 nm5 nm
5 nm 80 kV 80 kV 80 kV
(002) Graphite planes (002) Graphite planes (002) Graphite planes
1.3 x 10²⁰ e- cm-2 5.1 x 10²⁰ e- cm-2 3.3 x 10²¹ e- cm-2

Quantification of radiation damage
2D image analysis and 3D image
reconstruction and modelling of
Pyrocarbons

Transmission electron microscopy NANOSCALE: 002 FRINGE ANALYSIS
Mironov & Freeman. Carbon 83 106 – 117(2015) | Image analysis software courtesy of ‘PyroMaN’ research group – University of Bordeaux
(002) Graphite planes
(002) Graphite planes

Mironov & Freeman. Carbon 83 106 – 117 (2015) | Raynal et al. Proc. Int. Carbon conf. (2010)| Campbell et al. Carbon. 60 410-420 (2013).
1
1.02
1.04
1.06
1.08
1.1
1.12
1.14
0 2 4 6 8 10
To
rtu
osi
ty, τ
Fringe length, L2 (nm)
0.09 dpa
0.45 dpa
Transmission electron microscopy NANOSCALE: 002 FRINGE ANALYSIS
20
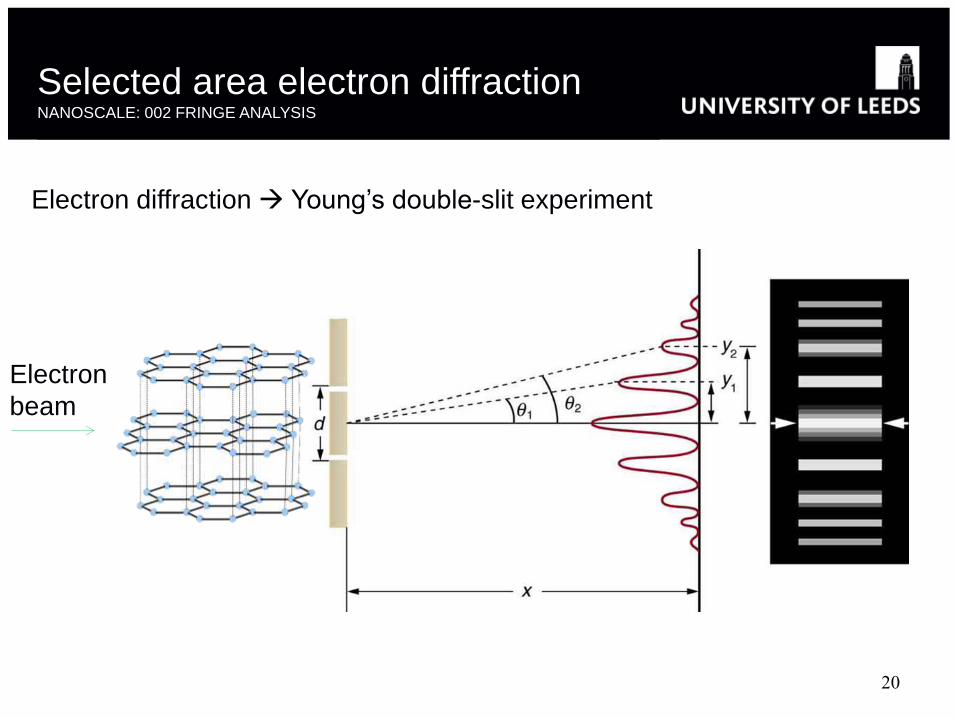
Selected area electron diffraction NANOSCALE: 002 FRINGE ANALYSIS
Electron
beam
Electron diffraction Young’s double-slit experiment
21
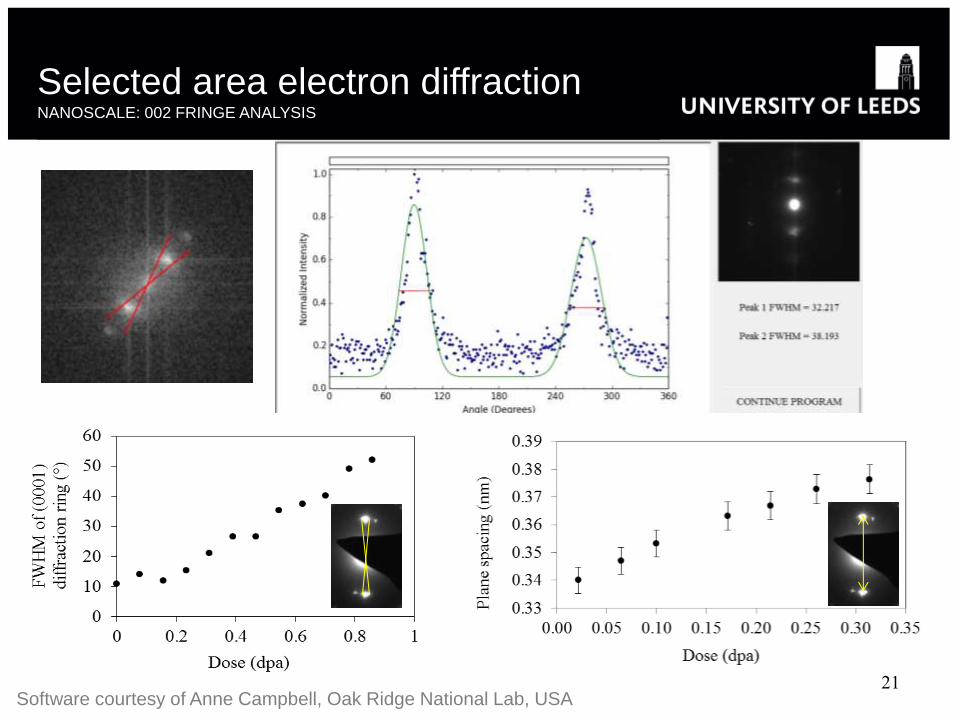
Selected area electron diffraction NANOSCALE: 002 FRINGE ANALYSIS
Software courtesy of Anne Campbell, Oak Ridge National Lab, USA

Transmission electron microscopy NANOSCALE: 002 FRINGE ANALYSIS – INSITU HEATING
0 min 10 mins 20 mins
100 °C (002) Graphite planes
0min 200C5 n m5 n m
200 °C (002) Graphite planes
10min 200C5 n m5 n m
5 n m5 n m20min 200C
400 °C (002) Graphite planes
Images courtesy
of University of
York in-situ TEM
facilities
200 kV
electron
beam
exposure
Literature* quotes the migration energy of a single vacancy
is 1.2 eV, i.e. mobile at temperatures above 100-200 °C
* C. Latham, et al., J. Phys. Condens. Matter 25, 135403 (2013).
* T. Trevethan, et al., Physical Review Letters 111 (9), 095501 (2013)

Transmission electron microscopy NANOSCALE: 002 FRINGE ANALYSIS – INSITU HEATING
t = 0 t = 14 min
0.001
dpa /s

Electron Energy Loss Spectroscopy NANOSCALE: BONDING AND DENSITY ANALYSIS
“finger print of
local bonding”
Electron Energy Loss Spectroscopy NANOSCALE: BONDING AND DENSITY ANALYSIS
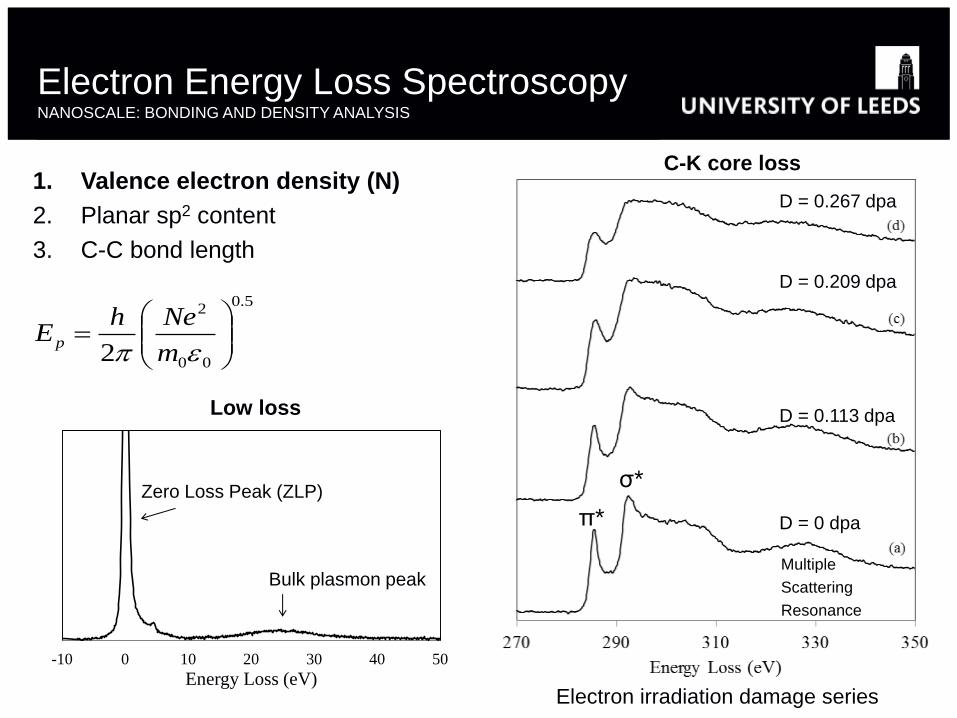
1. Valence electron density (N)
2. Planar sp2 content
3. C-C bond length
-10 0 10 20 30 40 50
Energy Loss (eV)
Bulk plasmon peak
Zero Loss Peak (ZLP)
5.0
00
2
2
m
NehEp
π*
σ*
Multiple
Scattering
Resonance
D = 0.267 dpa
D = 0.209 dpa
D = 0.113 dpa
D = 0 dpa
Electron irradiation damage series
C-K core loss
Low loss

Electron Energy Loss Spectroscopy NANOSCALE: BONDING AND DENSITY ANALYSIS
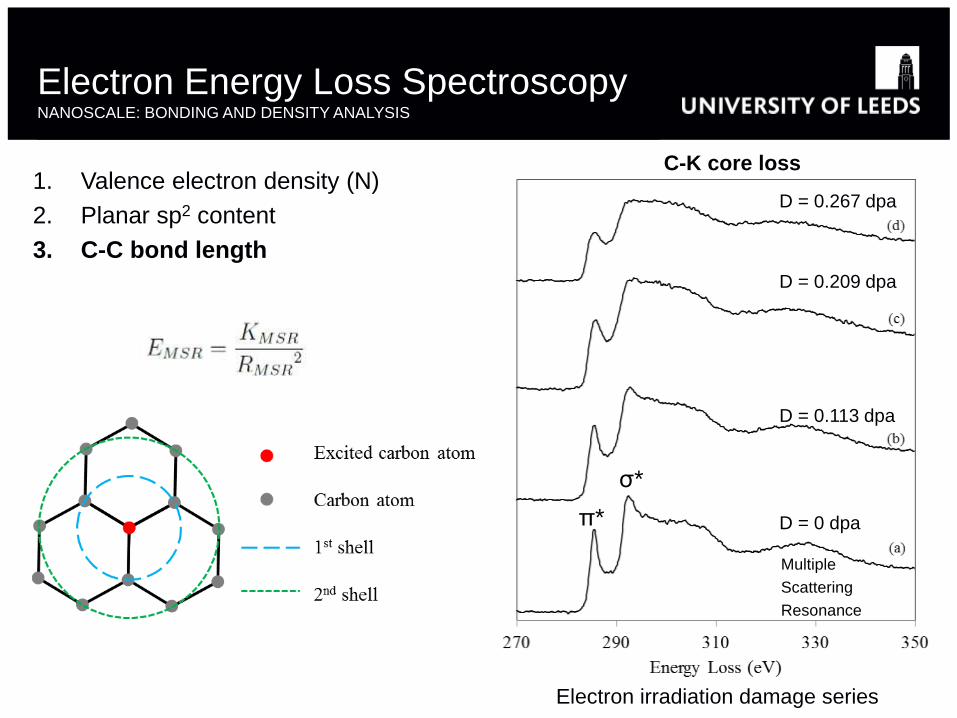
1. Valence electron density (N)
2. Planar sp2 content
3. C-C bond length
π*
σ*
Multiple
Scattering
Resonance
D = 0.267 dpa
D = 0.209 dpa
D = 0.113 dpa
D = 0 dpa
Electron irradiation damage series
C-K core loss
265 285 305 325 345
Co
un
t
Energy Loss (eV)
π*
σ*
MSR
Integration 1 Integration 2
Integration 1
Integration 2
Electron Energy Loss Spectroscopy NANOSCALE: BONDING AND DENSITY ANALYSIS
1. Valence electron density (N)
2. Planar sp2 content
3. C-C bond length
π*
σ*
Multiple
Scattering
Resonance
D = 0.267 dpa
D = 0.209 dpa
D = 0.113 dpa
D = 0 dpa
Electron irradiation damage series
C-K core loss

Electron Energy Loss Spectroscopy NANOSCALE: BONDING AND DENSITY ANALYSIS
2)(
1
CC
MSRL
E
1.418
1.422
1.426
1.430
1.434
1.438
1.442
0.00 0.05 0.10 0.15 0.20 0.25 0.30 0.35
Bond l
ength
(Å
)
Dose (dpa)
Variation in C-C bond length
Amorphous carbon
50%
60%
70%
80%
90%
100%
0.00 0.05 0.10 0.15 0.20 0.25 0.30 0.35
sp2 co
nte
nt
(%)
Dose (dpa)
Variation in sp2 content
Amorphous carbon
bulkep NNE
10
14
18
22
26
30
0 0.05 0.1 0.15 0.2 0.25 0.3 0.35
Pla
smon p
eak e
ner
gy (
eV)
Dose (dpa)
Variation in plasmon peak energy
Amorphous carbon
Highly ordered graphite
Mironov & Freeman. Carbon 83 106 – 117(2015) | Daniels et al. Philosophical Magazine 87(27) 4073-4092 (2007)

Quantification of radiation damage NANOSCALE: BONDING, DENSITY AND DISLOCATION ANALYSIS
Transmission Electron Microscopy
Electron energy loss spectroscopy
Selected Area Electron Diffraction
In-situ TEM
EFTEM ratio map zero loss EFTEM
002 graphite planes
Reduction in fringe length
and increase in tortuosity
Reduction in sp2 content,
increase in C-C bond
length, slight reduction in
density
Increase in d-spacing
Temperature dependent
damage threshold

• Voids
• Closed porosity (OLM) in filler
• Open porosity (FLM) in binder
Void and Crack Analysis MICROSCALE: LIGHT MICROSCOPY
0
5
10
15
20
25
30
35
40
Po
rosity A
rea F
ractio
n (
%)
Open porosity
Closed porosity
4 mm

Porosity related property changes
Th
erm
al co
nd
uctivity (
W/m
K)
Weight loss (%) Bulk density (Mg/m3)
Th
erm
al co
nd
uctivity (
W/m
K)
Matsuo J. Nuc. Mat 89(1) (1980) (Effect of oxidation at 1000°C)
Hall et al. J. Nuc. Mat 353(1-2) (2006) (Gilsocarbon) Berre et al. J. Nuc. Mat 352(1-3) (2006) (Gilsocarbon)
Yo
un
g's
Mo
du
lus (
GP
a)
Porosity ratio

Void and Crack Analysis MICROSCALE: TRANSMISSION ELECTRON MICROSCOPY
2 µ m2 µ m
(a)
2 µ m2 µ m
(b)
2 µ m2 µ m
(c)
(a) BEPO1 was farthest from the core and received 0.4 dpa (displacements per atom)
(b) BEPO16 was in the middle of the channel and received 1.27 dpa
(c) BEPO20 was closest to the core and received 1.44 dpa
5 - 200 nm x < 10μm

Void and Crack Analysis MICROSCALE: ENERGY DISPERSIVE X-RAY
(a)
(b)
Energy (keV)
Examples of EDX
spectra over a
microcrack in
BEPO1 negligible Ga content (0.12%)
significant Ga content (5.85%)

Void and Crack Analysis MICROSCALE: ENERGY FILTERED TEM
Energy Filtered TEM
magnetic prism path of
the electrons will vary
depending on their energy.
loss of energy and
a change in
momentum

Void and Crack Analysis MICROSCALE: ENERGY FILTERED TEM
A
B
C
D
Contrast in TEM image from:
• Thickness and graphitic nature of material
Contrast in EFTEM image from
• Graphitic nature of material only
Dark = disordered (or hole)
Light = graphitic
A
B
C
D
50 nm
TEM image
EFTEM image
Intensity calibration from Daniels et al. Ultramicroscopy 96(3) 547-58 (2003)

Void and Crack Analysis MICROSCALE: ENERGY FILTERED TEM
100 nm
23
24
25
26
27
0 20 40 60 80 100
(π
+σ
) p
lasm
on
pea
k p
osi
tion
, E
p (
eV)
Position from centre of crack (nm)
(π+σ) plasmon peak
5.0
00
2
2
m
NehEp
Energy (Ep) density (N)

Changes in Crystallite Size MICROSCALE: X-RAY DIFFRACTION
XRD spectrum for virgin graphite (PCEA grade)
Lc value (crystallite dimension)
La value
(crystallite
dimension)
Damaged material is
evident through changes in:
1. Peak position
2. Peak width (FWHM) by
the Scherrer equation
τ = mean size of the crystallite
K = shape factor
λ = X-ray wavelength
β = broadening at FWHM
θ = Bragg angle

Changes in Crystallite Size MICROSCALE: X-RAY DIFFRACTION
virgin
1.5 dpa
350 °C
4.0 dpa
535 °C
6.8 dpa
670 °C
Work of Brindusa Mironov [email protected] | Samples provided by Will Windes INL

Changes in Crystallite Size MICROSCALE: X-RAY DIFFRACTION
• <1 % ↑ c spacing
• < 1% ↓ a spacing
• Decrease in both La and Lc with irradiation dose and
temperature by up to 50%.
• i.e. crystals are breaking up and getting smaller but
are experiencing intra-crystalline dimensional change
Work of Brindusa Mironov [email protected] | Samples provided by Will Windes INL
Results Summary
• Neutron radiation induces chemical and physical property
changes
• Atomic displacements expansion of graphite planes (in
c-direction) contraction of graphite planes (in a-
direction) increased tortuosity and length of graphite
planes change in bonding
• Breaking up of crystallites
• Formation of cracks and closure of cracks with swelling
(at turnaround)
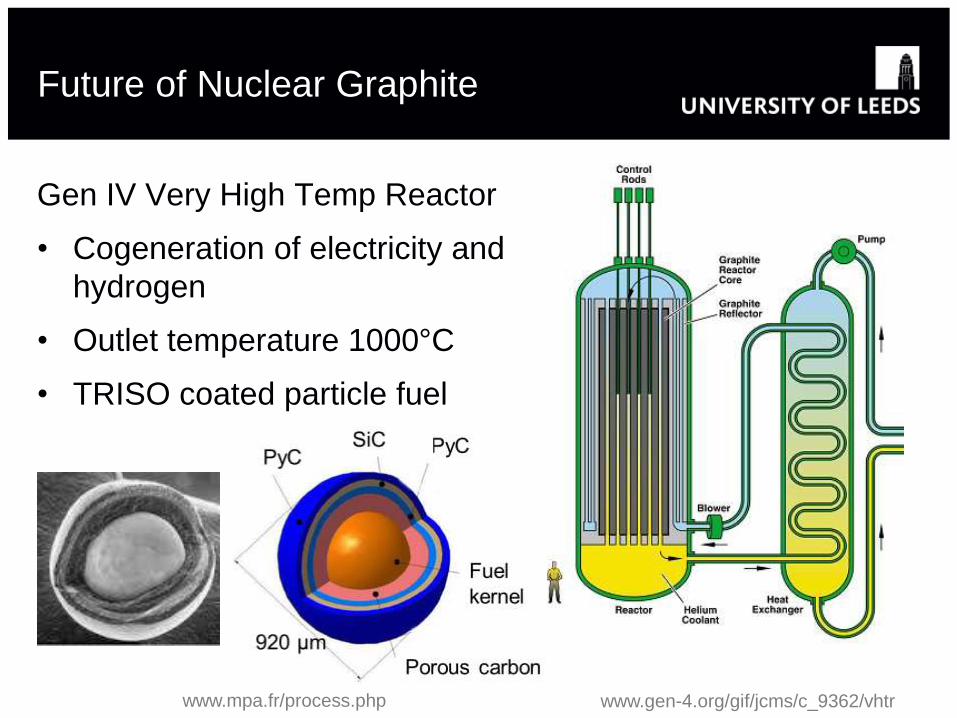
Future of Nuclear Graphite
Gen IV Very High Temp Reactor
• Cogeneration of electricity and
hydrogen
• Outlet temperature 1000°C
• TRISO coated particle fuel
www.gen-4.org/gif/jcms/c_9362/vhtr www.mpa.fr/process.php

Collaborations/Acknowledgments
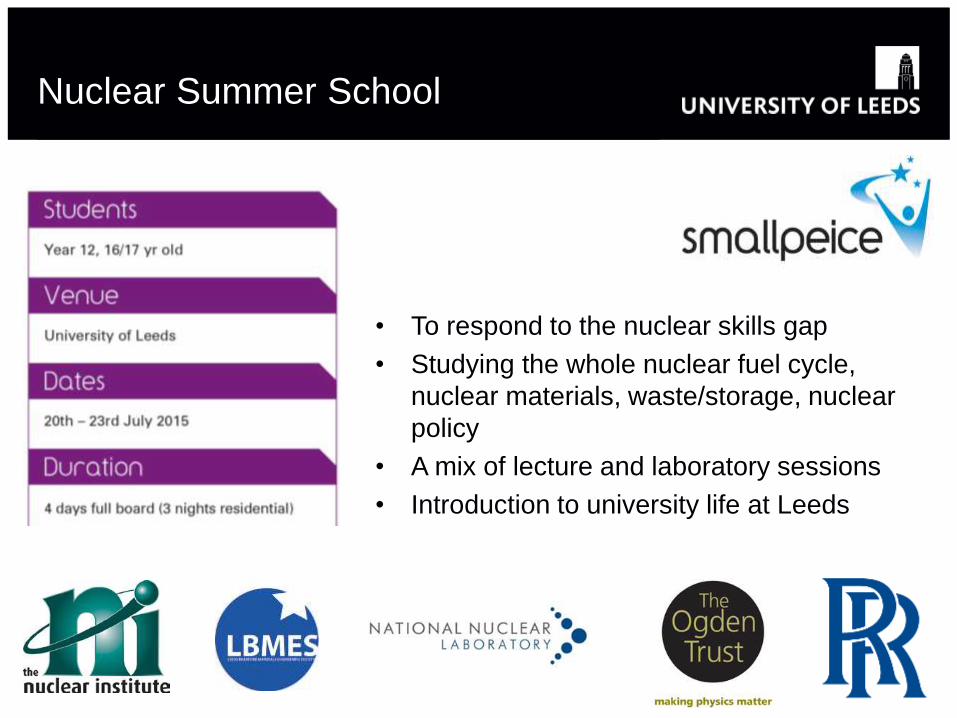
Nuclear Summer School
• To respond to the nuclear skills gap
• Studying the whole nuclear fuel cycle,
nuclear materials, waste/storage, nuclear
policy
• A mix of lecture and laboratory sessions
• Introduction to university life at Leeds

School of something FACULTY OF OTHER
School of Process and Chemical Engineering FACULTY OF ENGINEERING
Radiation Damage in Nuclear Graphite
Helen Freeman
Institute for Materials Research
PhD Supervisors: R. M. D. Brydson, and A. J. Scott
Sponsors:
Prof. Bruce Hanson
Leeds Centre of Excellence for Nuclear Engineering