RET Reflections…………. From: Dr. Loris Carter. A Wheatstone Bridge beginning…
1
MCE 403 MACHINERY LABORATORY EXPERIMENT 10
1
1.OBJECTIVE
The objective of this experiment is to become familiar with the electric resistance strain gauge
techniques and utilize such gauges for the determination of unknown quantities (such as strain,
stress and young’s modulus) at the prescribed conditions of a cantilever beam.
2.INTRODUCTION
Experimental stress analysis is an important tool in the design and testing of many products.
Several practical techniques are available including photoelastic, coatings and models, brittle
coatings, and electrical resistance strain gauges.
In this experiment, the electrical resistance strain gauge will be utilized. There are three steps
in obtaining experimental strain measurements by using a strain gauge:
1. Selecting a strain gauge
2. Mounting the gauge on the test structure
3. Measuring strains corresponding to specific loads.
The operation and selection criteria for strain gauges will be discussed. In this experiment, you
will mount a strain gauge on a beam and test its accuracy. Measurements will be made with a
strain gauge rosette in this experiment to obtain the principal stresses and strains on a
cantilevered beam.
What’s a Strain Gauge Used For? The Birdman Contest is an annual event held on Lake Biwa near Kyoto, Japan.
In this contest cleverly designed human-powered airplanes and gliders fly
several hundred meters across the lake. Aside from the great spectacle of this
event, it is a wonderful view of engineering experimentation and competition.
Despite the careful designs and well-balanced airframes occasionally the
wings of these vehicles fail and crash into the lake. There have been some
spectacular crashes but few, if any, injuries to the contestants.
Increasingly, each time a new airplane, automobile, or other vehicle is
introduced, the structure of such vehicles is designed to be lighter to attain
faster running speeds and less fuel consumption. It is possible to design a
lighter and more efficient product by selecting light-weight materials.
However, as with all technology, there are plusses and minuses to be balanced.
If a structural material is made lighter or thinner the safety of the vehicle is
compromised unless the required strength is maintained. By the same token,
if only the strength is taken into consideration, the vehicle’s weight will
increase and its economic feasibility is compromised.
In engineering design the balance between safety and economics is one
variable in the equation of creating a successful product. While attempting to
design a component or vehicle that provides the appropriate strength it is
important to understand the stress borne by the various parts under different
conditions. However, there is no technology or test tool that allows direct
measurement of stress. Thus, strain on the surface is frequently measured in
MCE 403 MACHINERY LABORATORY EXPERIMENT 10
2
order to determine internal stress. Strain gauges are the most common
instrument to measure surface strain.
STRAIN GAUGES:
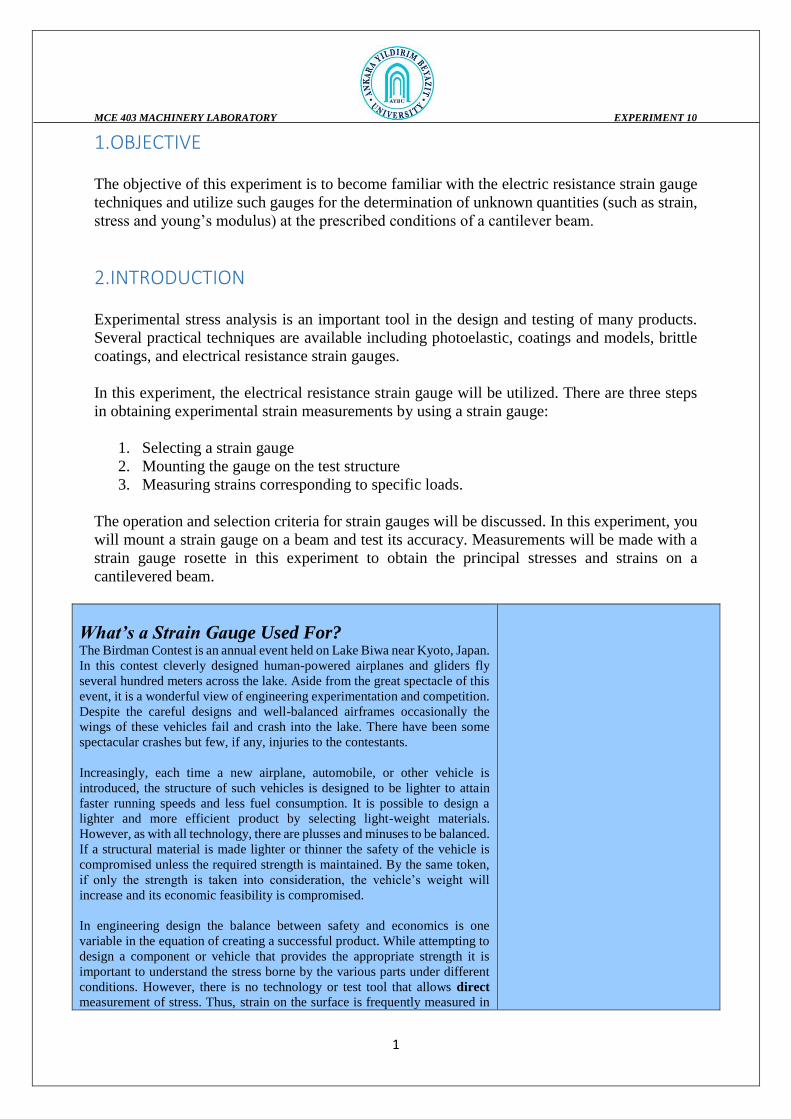
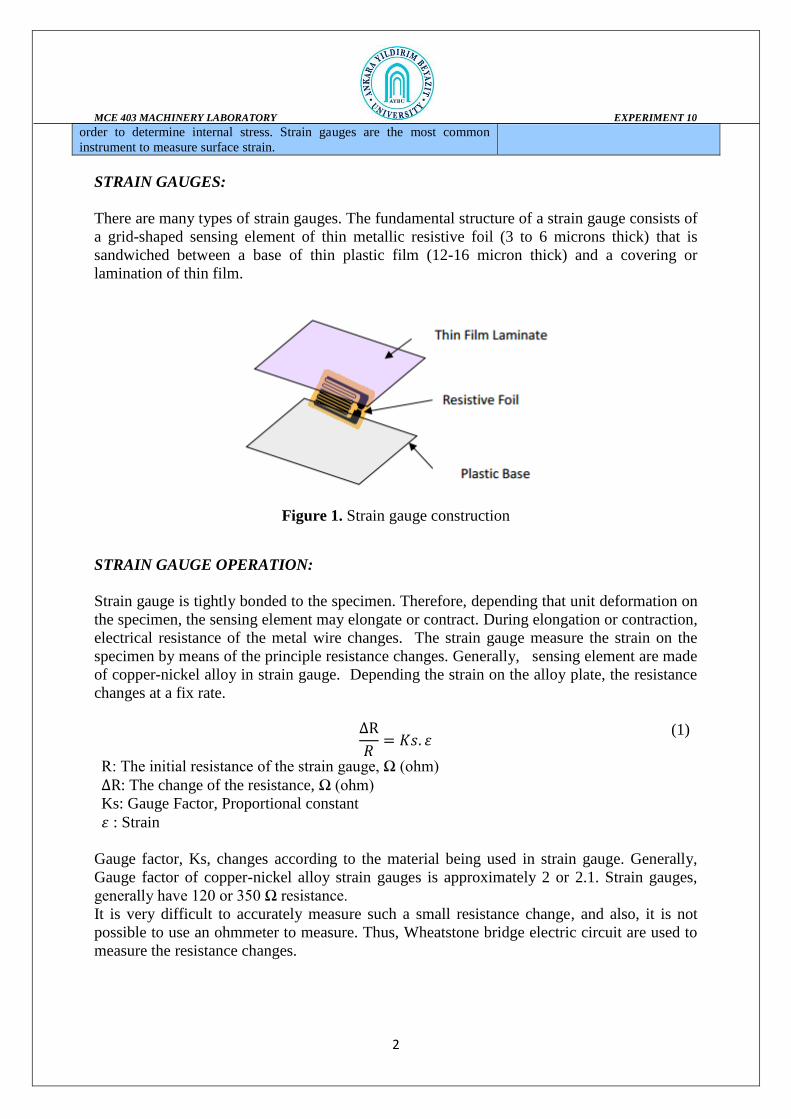
There are many types of strain gauges. The fundamental structure of a strain gauge consists of
a grid-shaped sensing element of thin metallic resistive foil (3 to 6 microns thick) that is
sandwiched between a base of thin plastic film (12-16 micron thick) and a covering or
lamination of thin film.
Figure 1. Strain gauge construction
STRAIN GAUGE OPERATION:
Strain gauge is tightly bonded to the specimen. Therefore, depending that unit deformation on
the specimen, the sensing element may elongate or contract. During elongation or contraction,
electrical resistance of the metal wire changes. The strain gauge measure the strain on the
specimen by means of the principle resistance changes. Generally, sensing element are made
of copper-nickel alloy in strain gauge. Depending the strain on the alloy plate, the resistance
changes at a fix rate.
∆R
𝑅= 𝐾𝑠. 𝜀
(1)
R: The initial resistance of the strain gauge, Ω (ohm)
∆R: The change of the resistance, Ω (ohm)
Ks: Gauge Factor, Proportional constant
𝜀 : Strain
Gauge factor, Ks, changes according to the material being used in strain gauge. Generally,
Gauge factor of copper-nickel alloy strain gauges is approximately 2 or 2.1. Strain gauges,
generally have 120 or 350 Ω resistance.
It is very difficult to accurately measure such a small resistance change, and also, it is not
possible to use an ohmmeter to measure. Thus, Wheatstone bridge electric circuit are used to
measure the resistance changes.

MCE 403 MACHINERY LABORATORY EXPERIMENT 10
3
3. THEORY
STRESS:
Stress is simply a distributed force on an external or internal surface of a body. To obtain a
physical feeling of this idea, consider being submerged in water at a particular depth. The
‘‘force’’ of the water one feels at this depth is a pressure, which is a compressive stress, and not
a finite number of ‘‘concentrated’’ forces. Other types of force distributions (stress) can occur
in a liquid or solid. Tensile (pulling rather than pushing) and shear (rubbing or sliding) force
distributions can also exist.
Consider a general solid body loaded as shown in Figure 2 (a). Pi and pi are applied
concentrated forces and applied surface force distributions, respectively; and Ri and ri are
possible support reaction force and surface force distributions, respectively. To determine the
state of stress at point Q in the body, it is necessary to expose a surface containing the point Q.
This is done by making a planar slice, or break, through the body intersecting the point Q. The
orientation of this slice is arbitrary, but it is generally made in a convenient plane where the
state of stress can be determined easily or where certain geometric relations can be utilized. The
first slice, illustrated in Figure 2 (b), is described by the surface normal oriented along the x
axis. This establishes the yz plane. The external forces on the remaining body are shown, as
well as the internal force (stress) distribution across the exposed internal surface containing Q.
In the general case, this distribution will not be uniform along the surface, and will be neither
normal nor tangential to the surface at Q. However, the force distribution at Q will have
components in the normal and tangential directions. These components will be tensile or
compressive and shear stresses, respectively.
Figure 2. (a) Structural member and (b) Isolated section
Following a right-handed rectangular coordinate system, the y and z axes are defined
perpendicular to x, and tangential to the surface. Examine an infinitesimal area ∆A x = ∆y∆z
surrounding Q, as shown in Figure. 3 (a). The equivalent concentrated force due to the force
distribution across this area is ∆Fx, which in general is neither normal nor tangential to the
surface (the subscript x is used to designate the normal to the area). The force ∆Fx has
MCE 403 MACHINERY LABORATORY EXPERIMENT 10
4
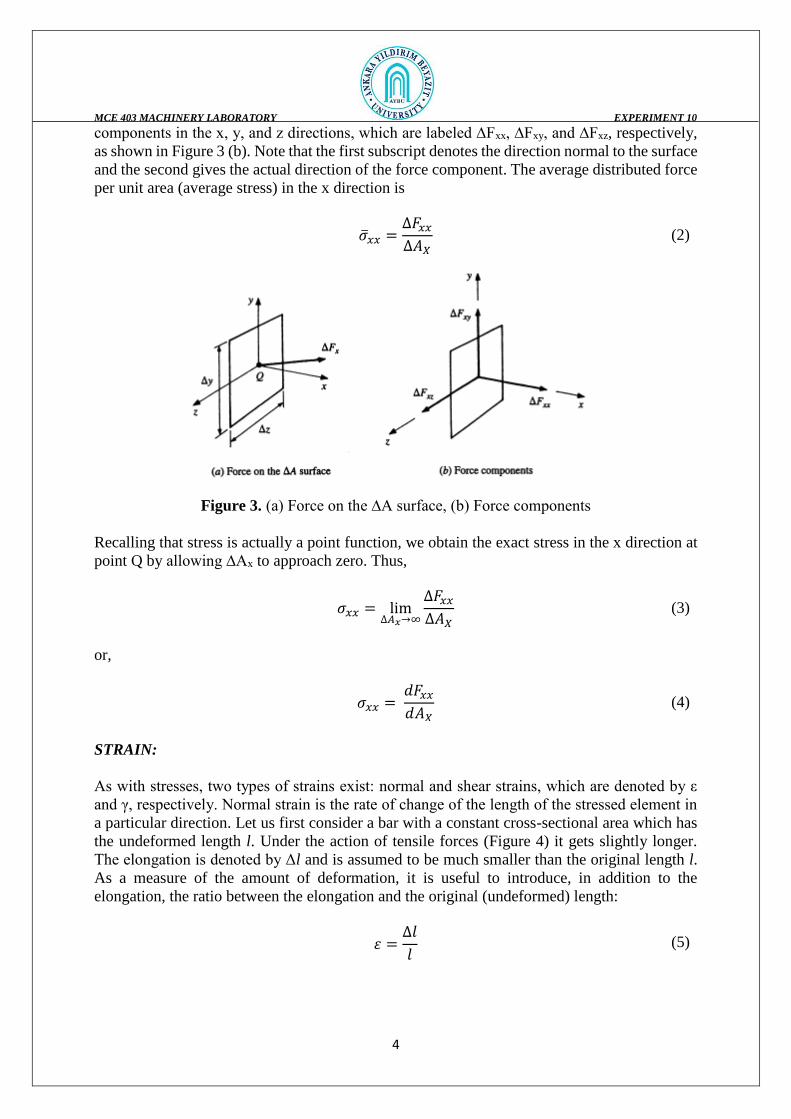
components in the x, y, and z directions, which are labeled ∆Fxx, ∆Fxy, and ∆Fxz, respectively,
as shown in Figure 3 (b). Note that the first subscript denotes the direction normal to the surface
and the second gives the actual direction of the force component. The average distributed force
per unit area (average stress) in the x direction is
𝜎𝑥𝑥 =
∆𝐹𝑥𝑥
∆𝐴𝑋 (2)
Figure 3. (a) Force on the ∆A surface, (b) Force components
Recalling that stress is actually a point function, we obtain the exact stress in the x direction at
point Q by allowing ∆Ax to approach zero. Thus,
𝜎𝑥𝑥 = lim
∆𝐴𝑥→∞
∆𝐹𝑥𝑥
∆𝐴𝑋 (3)
or,
𝜎𝑥𝑥 =
𝑑𝐹𝑥𝑥
𝑑𝐴𝑋 (4)
STRAIN:
As with stresses, two types of strains exist: normal and shear strains, which are denoted by ε
and γ, respectively. Normal strain is the rate of change of the length of the stressed element in
a particular direction. Let us first consider a bar with a constant cross-sectional area which has
the undeformed length l. Under the action of tensile forces (Figure 4) it gets slightly longer.
The elongation is denoted by Δl and is assumed to be much smaller than the original length l.
As a measure of the amount of deformation, it is useful to introduce, in addition to the
elongation, the ratio between the elongation and the original (undeformed) length:
𝜀 =
Δ𝑙
𝑙 (5)

MCE 403 MACHINERY LABORATORY EXPERIMENT 10
5
Figure 4. The undeformed length l and the deformed length l
The dimensionless quantity ε is called strain.
HOOK’S LAW
The strains in a structural member depend on the external loading and therefore on the
stresses. For linear elastic behavior, the relation between stresses and strains is given by
Hooke’s law. In the uniaxial case (bar) it takes the form σ = E ε where E is Young’s modulus.
Figure 5. Stress vs strain diagram
Strain Measurement It should be noted that there are various types of strain measuring
methods available. These may be roughly classified into mechanical,
electrical, and even optical techniques.
From a geometric perspective, strain recorded during any test may
be regarded as a distance change between two points on a test article.
Thus all techniques are simply a way of measuring this change in
distance.
If the elastic modulus of the test article’s constituent material is
known, strain measurement will allow calculation of stress. As you
have learned from your studies and prior labs strain measurement is
often performed to determine the stress created in a test article by
some external force, rather than to simply gain knowledge of the
strain value itself.
This linear variable differential
transformer (LVDT), attached to a tensile
specimen, is also a common tool for
measuring strain.
MCE 403 MACHINERY LABORATORY EXPERIMENT 10
6
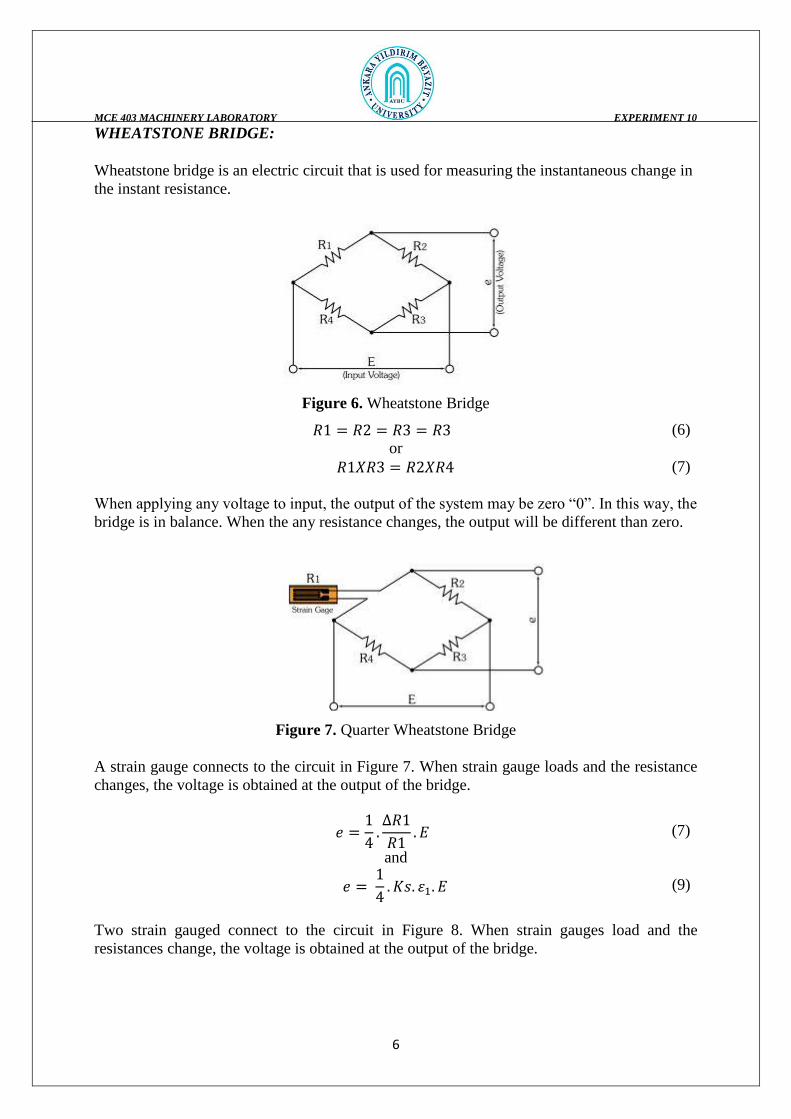
WHEATSTONE BRIDGE:
Wheatstone bridge is an electric circuit that is used for measuring the instantaneous change in
the instant resistance.
Figure 6. Wheatstone Bridge
𝑅1 = 𝑅2 = 𝑅3 = 𝑅3 (6)
or
𝑅1𝑋𝑅3 = 𝑅2𝑋𝑅4 (7)
When applying any voltage to input, the output of the system may be zero “0”. In this way, the
bridge is in balance. When the any resistance changes, the output will be different than zero.
Figure 7. Quarter Wheatstone Bridge
A strain gauge connects to the circuit in Figure 7. When strain gauge loads and the resistance
changes, the voltage is obtained at the output of the bridge.
𝑒 =
1
4.∆𝑅1
𝑅1. 𝐸 (7)
and
𝑒 =
1
4. 𝐾𝑠. 𝜀1. 𝐸 (9)
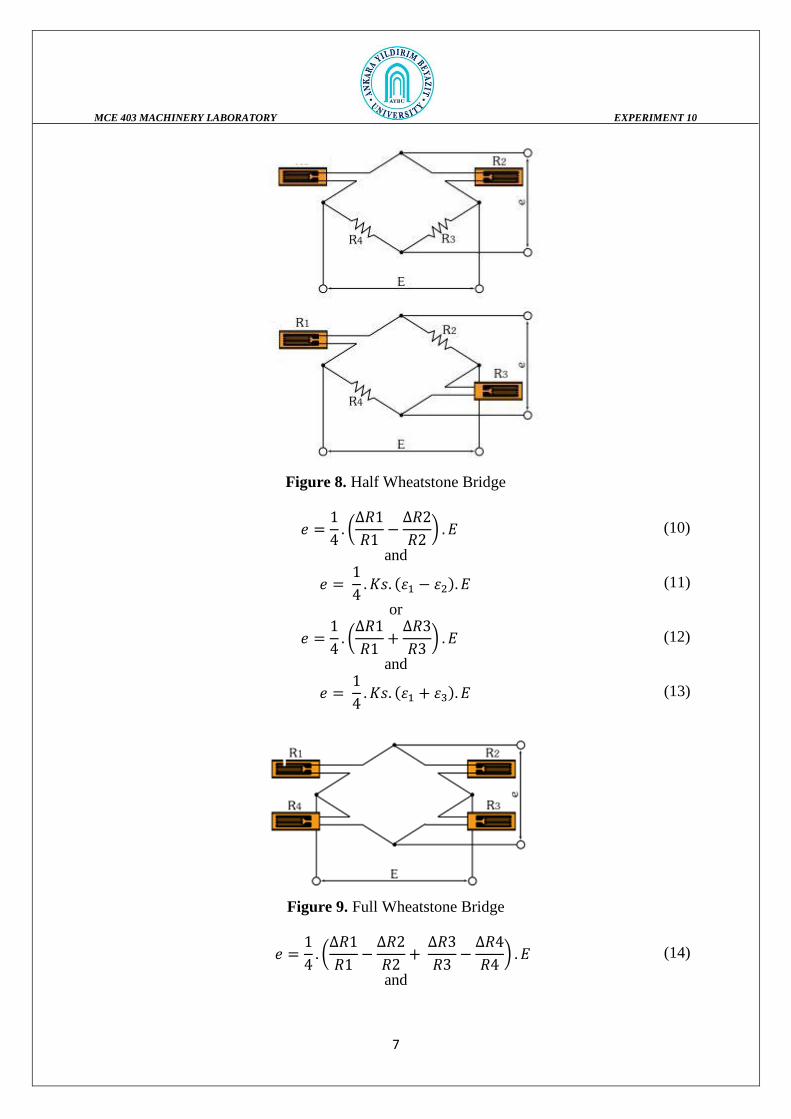
Two strain gauged connect to the circuit in Figure 8. When strain gauges load and the
resistances change, the voltage is obtained at the output of the bridge.
MCE 403 MACHINERY LABORATORY EXPERIMENT 10
7
Figure 8. Half Wheatstone Bridge
𝑒 =
1
4. (
∆𝑅1
𝑅1−
∆𝑅2
𝑅2) . 𝐸 (10)
and
𝑒 =
1
4. 𝐾𝑠. (𝜀1 − 𝜀2). 𝐸 (11)
or
𝑒 =
1
4. (
∆𝑅1
𝑅1+
∆𝑅3
𝑅3) . 𝐸 (12)
and
𝑒 =
1
4. 𝐾𝑠. (𝜀1 + 𝜀3). 𝐸 (13)
Figure 9. Full Wheatstone Bridge
𝑒 =
1
4. (
∆𝑅1
𝑅1−
∆𝑅2
𝑅2+
∆𝑅3
𝑅3−
∆𝑅4
𝑅4) . 𝐸 (14)
and

MCE 403 MACHINERY LABORATORY EXPERIMENT 10
8
𝑒 =
1
4. 𝐾𝑠. (𝜀1 − 𝜀2 + 𝜀3 − 𝜀4). 𝐸 (15)
A resistance strain gage consists of a thin strain-sensitive wire mounted on a backing that
insulates the wire from the test structure. Strain gages are calibrated with a gage factor F, which
relates strain to the resistance change in the wire by
𝐹 =
∆R𝑅⁄
∆𝐿 ⁄ 𝐿
(16)
where R is the resistance and L is the length of the wire. The change in resistance corresponding
to typical values of strain is usually only a fraction of an ohm.
Because conventional ohmmeters are not capable of measuring these small changes in
resistance accurately, a Wheatstone bridge is usually employed. It can be operated in either a
balanced or unbalanced configuration. For an unbalanced bridge, a change in resistance is
measured as a non-zero voltage Vo which, can be calibrated in standard strain units (∆L/L x 10-6)
or micro strain. A balanced bridge is rebalanced after each load increment so that the output
voltage Vo is zero. The appropriate changes in resistance are then noted and strain calculated
using the gage factor.
The Wheatstone Bridge A Wheatstone bridge is a measuring instrument that, despite
popular myth, was not invented by Sir Charles Wheatstone,
but by Samuel H. Christie in 1833. The device was later
improved upon and popularized by Wheatstone. The bridge is
used to measure an unknown electrical resistance by
balancing two legs of a circuit, one leg of which includes the
unknown component that is to be measured. The Wheatstone
bridge illustrates the concept of a difference measurement,
which can be extremely accurate. Variations on the
Wheatstone bridge can be used to measure capacitance,
inductance, and impedance.
In a typical Wheatstone configuration, Rx is the unknown
resistance to be measured; R1, R2 and R3 are resistors of
known resistance and the resistance of R2 is adjustable. If the
ratio of the two resistances in the known leg (R2/R1) is equal
to the ratio of the two in the unknown leg (Rx/R3), then the
voltage between the two midpoints will be zero and no current
will flow between the midpoints. R2 is varied until this
condition is reached. The current direction indicates if R2 is
too high or too low.
Detecting zero current can be done to extremely high
accuracy. Therefore, if R1, R2 and R3 are known to high
precision, then Rx can be measured to high precision. Very
small changes in Rx disrupt the balance and are readily
detected.
Typical Wheatstone Bridge diagram
with strain gauge at Rx

MCE 403 MACHINERY LABORATORY EXPERIMENT 10
9
Alternatively, if R1, R2, and R3 are known, but R2 is not
adjustable, the voltage or current flow through the meter can
be used to calculate the value of Rx. This setup is what you
will use in strain gauge measurements, as it is usually faster
to read a voltage level off a meter than to adjust a resistance
to zero the voltage.
CANTILEVER BEAM
The beam with the strain gage you have just attached will be placed in the Cantilever Flexure
Frame to take strain measurements. The arrangement is schematically shown in Figure 10.
Figure 10. Beam with Strain Gage in Flexure Fixture
The structure examined in this experiment is the cantilever beam. A beam under bending can
be characterized by equation (11).
1
𝜌=
𝑀
𝐸𝐼 (17)
The radius of curvature is given by equation (12)
1
𝜌=
𝑑2𝑦𝑑𝑥2⁄
(1 + (𝑑𝑦
𝑑𝑥⁄ )
2
)3/2
(18)
where y is the deflection in the y direction at any given point x along the beam. Any expression
involving the radius of curvature seems to always have it appear in the denominator. And this
is no exception, even when it is a defining equation. The fact that many mechanics applications
involve bending, but on a small scale. The beam bending discussed here is no exception. In
MCE 403 MACHINERY LABORATORY EXPERIMENT 10
10
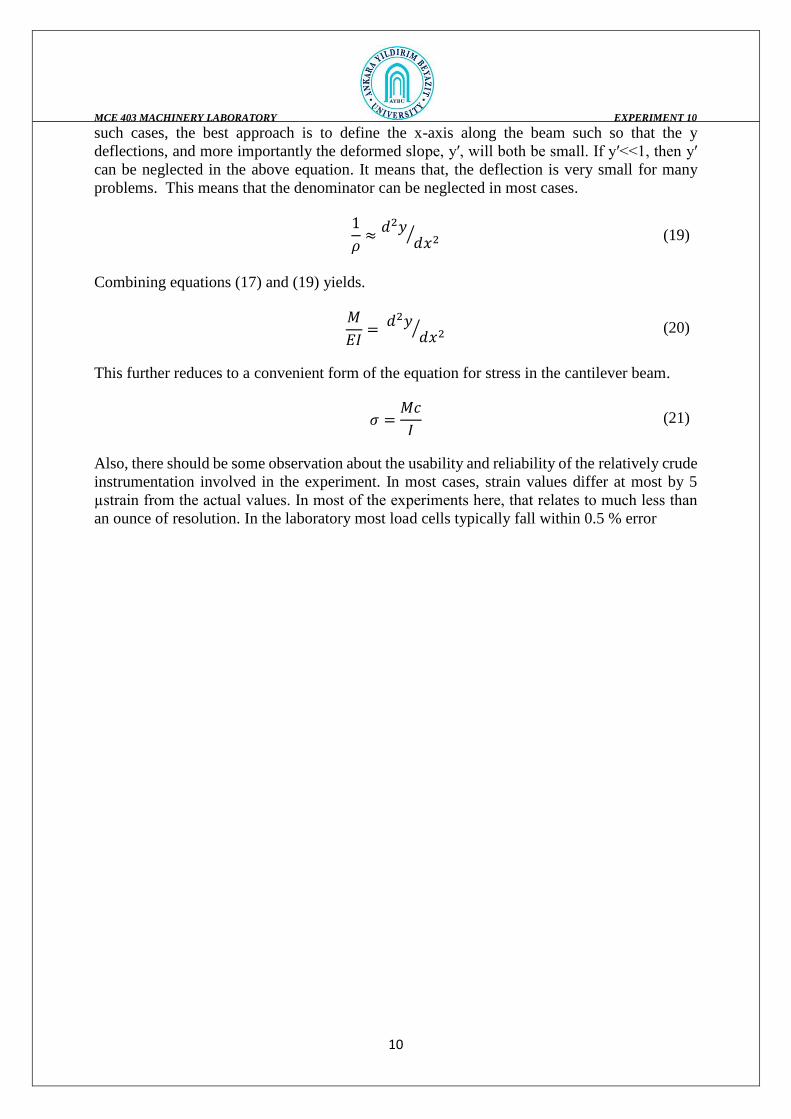
such cases, the best approach is to define the x-axis along the beam such so that the y
deflections, and more importantly the deformed slope, y′, will both be small. If y′<<1, then y′
can be neglected in the above equation. It means that, the deflection is very small for many
problems. This means that the denominator can be neglected in most cases.
1
𝜌≈
𝑑2𝑦𝑑𝑥2⁄ (19)
Combining equations (17) and (19) yields.
𝑀
𝐸𝐼=
𝑑2𝑦𝑑𝑥2⁄ (20)
This further reduces to a convenient form of the equation for stress in the cantilever beam.
𝜎 =
𝑀𝑐
𝐼 (21)
Also, there should be some observation about the usability and reliability of the relatively crude
instrumentation involved in the experiment. In most cases, strain values differ at most by 5
µstrain from the actual values. In most of the experiments here, that relates to much less than
an ounce of resolution. In the laboratory most load cells typically fall within 0.5 % error

MCE 403 MACHINERY LABORATORY EXPERIMENT 10
11
4. STRAIN GAUGE BONDING PROCEDURE
Select the strain gauge
model and gauge length
which meet the
requirements of the
measuring object and
purpose
Using a sand cloth (20
to 300), polish the strain
gauge bonding site over
a wider area than the
strain gauge size. Wipe
off paint, rust and
plating, if any, with a
grinder or sand blast
before polishing.
Using an industrial
tissue paper (SILBON
paper) dipped in
acetone, clean the strain
gauge bonding site.
Strongly wipe the
surface in a single
direction to collect dust
and then remove by
wiring in the same
direction. Reciprocal
wiping causes dust to
move back and forth
and does not ensure
cleaning.
Using a pencil or
marking off pin, mark
the measuring site in
the strain direction.
When using a marking
off pin, take care not to
deeply scratch the
strain gauge bonding
surface.
Ascertain the back and front of
the strain gauge. Apply a drop of
adhesive to the back of the strain
gauge. Do not spread the
adhesive. If spreading occurs,
curing is adversely accelerated,
thereby lowering the adhesive
strength.
After applying a drop of the
adhesive, put the strain gauge on
the measuring site while lining up
the center marks with the
marking off lines.
Cover the strain gauge with the
accessory polyethylene sheet and
press it over the sheet with a
thumb. Quickly perform steps (5)
to (7) as a series of actions. Once
the strain gauge is placed on the
bonding site, do not lift it to
adjust the position. The adhesive
strength will be extremely
lowered.
After pressing the strain gauge
with a thumb for one minute or
so, remove the polyethylene sheet
and make sure the strain gauge is
securely bonded. The above steps
complete the bonding work.
However, good measurement
results are available after 60
minutes of complete curing of
adhesive.
MCE 403 MACHINERY LABORATORY EXPERIMENT 10
12
5. QUESTIONS
1. What are potential safety concerns for this experiment?
2. Sketch a simple (metal wire) strain gage. On this drawing indicate where the leads
should be attached. Also indicate the direction of "transverse sensitivity". Should the transverse
sensitivity be high or low? What is the difference between a strain gage and a rosette?
3. Using the variables defined for the cantilevered beam in Figure 10, write down an
equation for
a) Displacement δ at the loading point for an applied end load P
b) Moment as a function of position x, M(x) for an applied end load P. (Apply static
equilibrium to a free-body diagram of a portion of the beam.)
c) Axial stress σx in terms of moment
d) Axial strain εx as a function axial stress (Reduce Hooke’s law.)
Combine these equations to obtain axial strain εx(x) on the upper surface of the beam as a
function of x, in terms of the applied displacement δ (i.e., eliminate P from the equation.). Use
this equation during the lab, to check whether your measured strains are accurate.
Use these equations to answer the following questions:
i) Where along the length of the beam will the maximum deflection occur?
ii) Where along the length of the beam will the maximum linear strain occur?
iii) Does this strain occur perpendicular or parallel to the axis of the beam?
4. Using the results of question 3, derive an expression for the axial strain gradient along
the beam’s upper surface. (Note that the strain gradient is dεx/dx.)
5. Using the results of question 3, calculate the displacement to be applied at the free end
of the cantilever beam in order to produce an axial stress of approximately 35 MPa at the fixed
end of the beam. Assume E = 71.7 GPa, L= 100 mm, and t = 3 mm. Compare to the value for
t=7 mm. Note that, if the yield strength of the aluminum bar is S=240 MPa, then this calculated
displacement is the maximum displacement before plastic deformation of the beam will occur.
Avoid plastic deformation of the beams.