R Programming
51
R Programming Confidence Intervals for Population Means
description
R Programming. Confidence Intervals for Population Means. Confidence Intervals. These notes will guide you through estimating a single population mean from a sample. Throughout these notes: The formula will be presented; The formula will be applied (manually); - PowerPoint PPT Presentation
Transcript of R Programming
R Programming
Confidence Intervals for Population Means

Confidence Intervals
These notes will guide you through estimating a single population mean from a sample.
Throughout these notes:
1. The formula will be presented;2. The formula will be applied (manually);3. The formula will be applied via R.

Confidence Intervals
Any Confidence Interval can be estimated using the following general form:
Sample estimate + conf. level * standard error
A Confidence Interval around a single population mean is developed using:
Where:
x = sample meanz = the appropriate two sided Z-score, based upon the
desired confidence levels = sample standard deviationn = number of elements in sample
𝒙± 𝒛∗ 𝒔/√𝒏

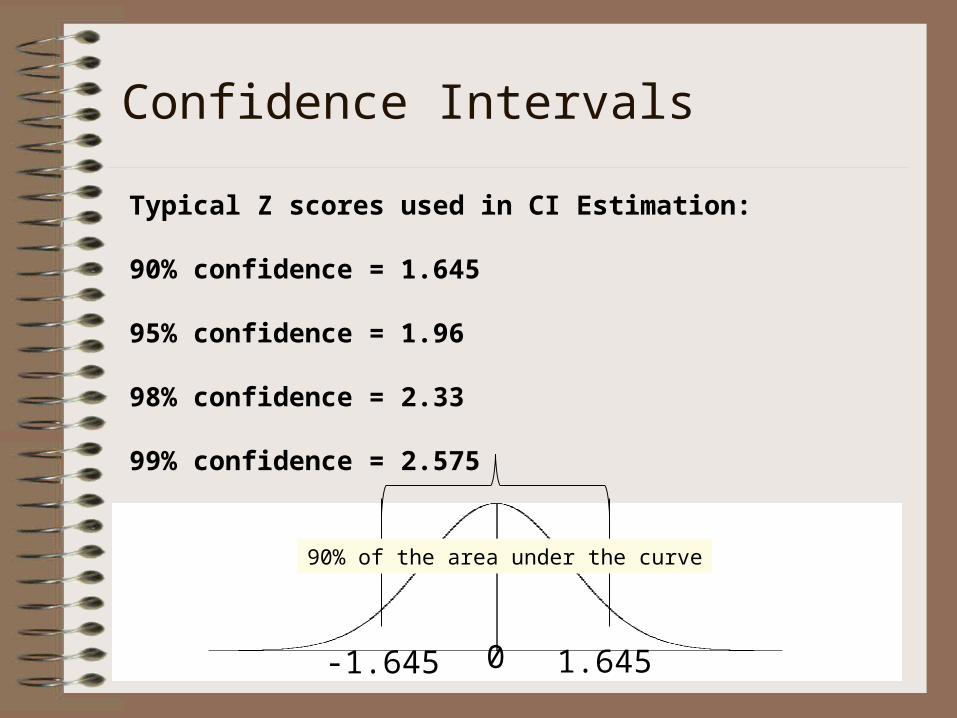
Typical Z scores used in CI Estimation:
90% confidence = 1.645
95% confidence = 1.96
98% confidence = 2.33
99% confidence = 2.575
Confidence Intervals

Confidence Intervals
For example, lets say that we took a poll of 100 college students and determined that they spent an average of $225 on books in a semester with a std dev of $50.
Report the 95% confidence interval for the expenditure on books for ALL college students.
Confidence Intervals
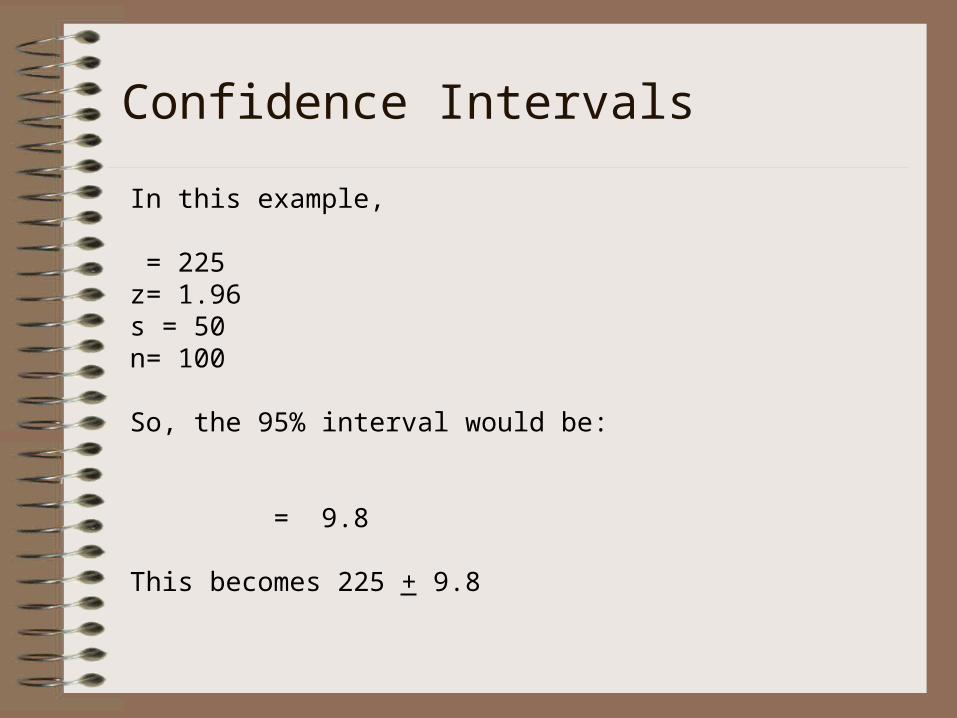
In this example,
= 225z= 1.96s = 50n= 100
So, the 95% interval would be:
= 9.8
This becomes 225 + 9.8

In English, this becomes…
“We are 95% confident that the mean expenditure on books for college students is $225 plus or minus $9.80…we are 95% confident that they are spending as little as $215.20 or as much as $234.80”.
Confidence Intervals

One general note regarding Confidence Intervals…
The results tell us NOTHING about the probability of an individual observation…a 95% interval SHOULD NOT be interpreted as “Joe has a 95% probability of spending between $215.20 and $234.80”.
The interval is an estimation of the mean of the population…not of an individual observation.
Confidence Intervals

Confidence Intervals
A second example…
175 students from Penn State where asked “In a typical day, about how much time do you spend watching TV?” The sample average was 2.09 hours with a standard deviation of 1.644.
Report the 99% confidence interval for the average time spent watching TV for all college students.

Confidence Intervals
The answer is:
“We are 99% confident that the average time college students spent watching TV is between 1.77 and 2.41 hours. “

R Programming
Confidence Intervals for The Population Mean of
Paired Differences

Confidence Intervals
These notes will guide you through estimating Confidence Intervals for the Population Mean of Paired Samples.
Throughout these notes:
1. The formula will be presented;2. The formula will be applied (manually);3. The formula will be applied via R.

A few notes about paired differences (which are different from two independent sample differences):
• The same (or VERY similar) people/objects are measured pre/post treatment.
• Typically, we are only interested in the calculated differences between the before and after - not in the actual values of the original data which was collected.
Confidence Intervals

As we saw previously, any CI can be estimated using the approach of
Sample estimate + conf. level * standard error
A Confidence Interval around the population mean of paired differences :
Where:
x d = sample mean (difference of the two means)z = the appropriate two sided Z-score, based upon desired confidences = sample standard deviation (difference)n = number of elements in sample
Confidence Intervals
Typical Z scores used in CI Estimation:
90% confidence = 1.645
95% confidence = 1.96
98% confidence = 2.33
99% confidence = 2.575
Confidence Intervals
-1.645 1.6450
90% of the area under the curve

Confidence Intervals
For example, lets say that a particular firm tracks their sales every week over the course of a year. They average 150 units a week. After hiring an advertising company, the average goes up to 165 units on average the next year. The std of the differences between the two years is 10.25. What is the 90% Confidence Interval?
Confidence Intervals
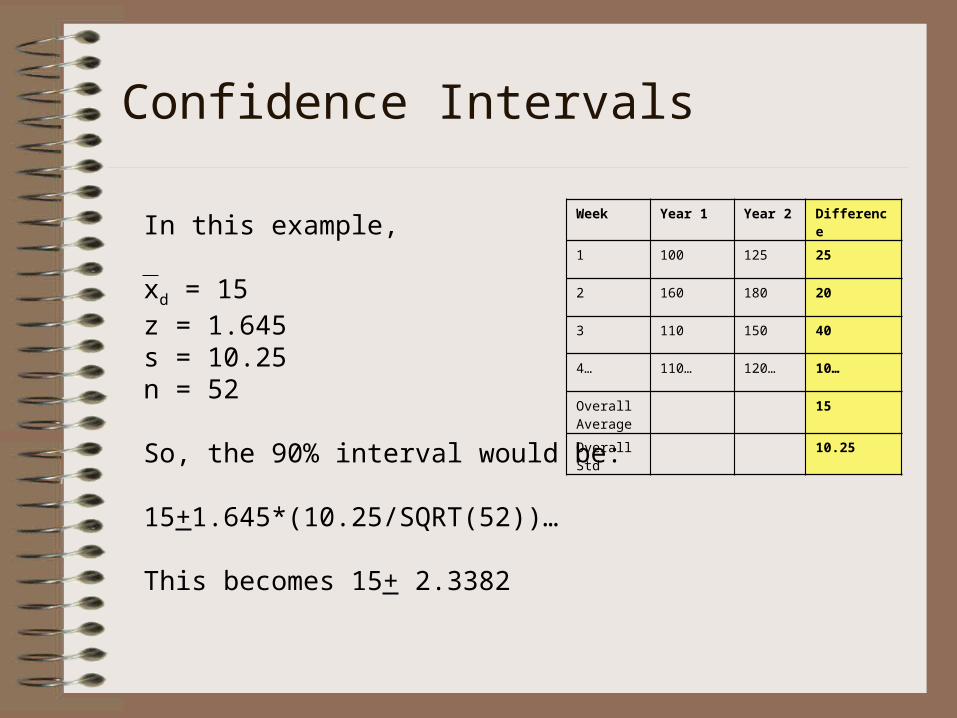
In this example,
xd = 15z = 1.645s = 10.25n = 52
So, the 90% interval would be:
15+1.645*(10.25/SQRT(52))…
This becomes 15+ 2.3382
Week Year 1 Year 2 Difference
1 100 125 25
2 160 180 20
3 110 150 40
4… 110… 120… 10…
OverallAverage
15
OverallStd
10.25
In English, this becomes…
“We are 90% confident that the mean difference in weekly sales between year 1 and year 2 is 15 plus or minus 2.3382…we are 90% confident that the change is as little as 12.6618 sales per week and as great as 17.3382 sales per week.”
Confidence Intervals

Lets now put this into a more realistic context…
Say that each sale generates $100 in profit. If you are generating as little as 12.6618 incremental sales per week (lower end of the interval), that would equate to $65,841.36 (12.6618*100*52) incremental profit over one year. This might represent the maximum that you would be willing to pay the advertising agency.
Confidence Intervals
Confidence Intervals
A second example…
A pharmaceutical company is testing a new cholesterol reducing drug – Choless. They recruit 100 representative men for the trial of Choless. The average cholesterol level before the trial was 242. The average cholesterol level after the trial was 216. The average difference was 26 with a standard deviation of the differences of 32. Determine the 99% confidence level.

Confidence Intervals
In this example,
xd = 26z = 2.575s = 32n = 100
So, the 99% interval of the paired differences would be:
26+2.575*(32/SQRT(100))…
This becomes 26+ 8.24

In English, this becomes…
“We are 99% confident that the mean difference in cholesterol levels before Choless and after Choless is 26 points, plus or minus 8.24 points…we are 99% confident that the change is as little as 17.76 points or as great as 34.24 points.”
Confidence Intervals

R Programming
Confidence Intervals for Difference The Two
Independent Sample Means

Confidence Intervals
These notes will guide you through estimating parameter (mean) confidence intervals for two independent samples.
Throughout these notes:
1. The formula will be presented;2. The formula will be applied (manually);3. The formula will be applied via R.

As we saw previously, any CI can be estimated using the approach of
Sample estimate + conf. level * standard error
A Confidence Interval around the difference between two independent samples can be calculated as:
Where:
xi = sample mean (two independent samples)z = the appropriate two sided Z-score, based upon desired confidencesi = sample standard deviation (two independent samples)ni = number of elements in each sample
x1 – x2 z* SQRT((s21/n1)+(s2
2/n2))
Confidence Intervals
Typical Z scores used in CI Estimation:
90% confidence = 1.645
95% confidence = 1.96
98% confidence = 2.33
99% confidence = 2.575
Confidence Intervals

A few notes about independent sample differences:
• The two samples must be statistically independent of each other.
• You need to know if the variances (std) are approximately equal or not. The formula from the previous slide assumes that they are not equal. A second formula and a discussion of the differences will be provided in a later slide.
Confidence Intervals

Volunteers who had developed a cold within the previous 24 hours were randomly assigned to two groups – one took zinc lozenges and one took a placebo every 2-3 hours until their symptoms had subsided.
From Zinc Group:
35 peopleDuration of symptoms – 4.5 daysStd of days – 1.6
Confidence Intervals
From Placebo Group:
33 peopleDuration of symptoms – 8.1 daysStd of days – 1.8
Calculate the 95% Confidence Interval for the difference between the two groups.
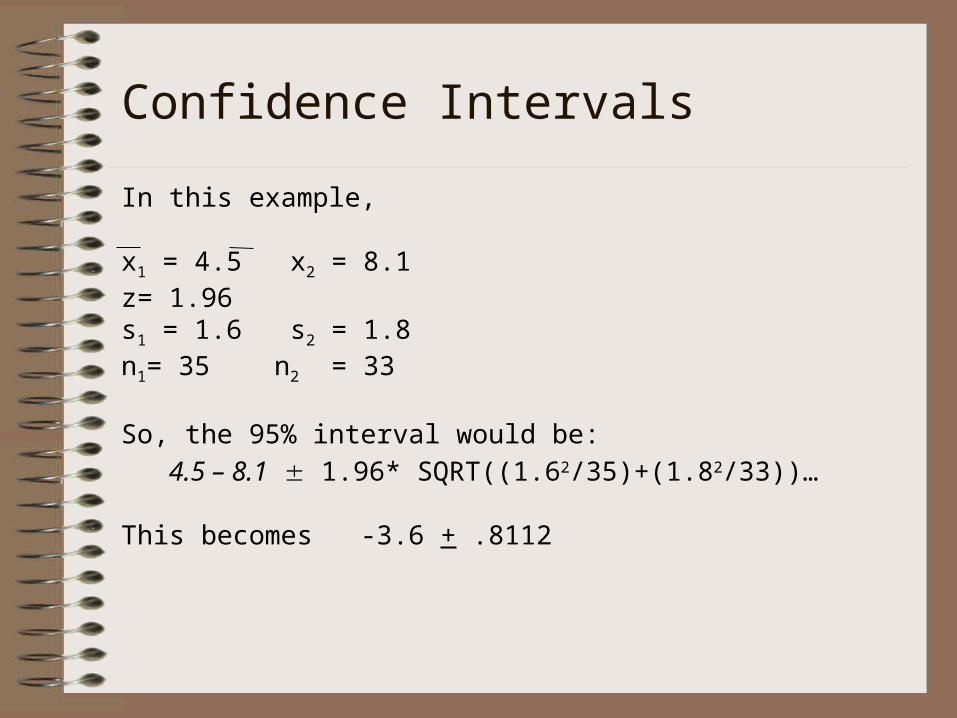
In this example,
x1 = 4.5 x2 = 8.1 z= 1.96s1 = 1.6 s2 = 1.8n1= 35 n2 = 33
So, the 95% interval would be:4.5 – 8.1 1.96* SQRT((1.62/35)+(1.82/33))…
This becomes -3.6 + .8112
Confidence Intervals

In English, this becomes…
“We are 95% confident that the zinc group experienced 3.6 fewer days of symptoms than did the placebo group, plus or minus .8112 days…the zinc group experienced as much as 4.4112 days less than the placebo group or as few as 2.7888 days less than the placebo group”.
Confidence Intervals

In this example, we generated the Confidence Interval using the unpooled approach . There is a second option – the pooled approach.
In theory, we use the pooled approach when the standard deviations are approximately the same between the two groups. In practice, this is uncommon.
The rule of thumb goes something like this…
If the larger sample standard deviation is from the group with the larger sample size, the pooled procedure will generate a larger (more conservative) interval. If the smaller sample standard deviation is from the group with the larger sample size, the pooled version may produce a misleading narrow interval.
Confidence Intervals

Confidence Intervals
Practitioners tend to use the unpooled procedure unless the sample standard deviations are VERY close.
Lets redo the previous example with the pooled procedure and discuss the difference…
Where s = SQRT[((n1-1)s21+(n2-1)S2
2)/(n1+n2 – 2)]
So, the 95% interval would be:4.5 – 8.1 1.96*1.699*[ SQRT( (1/35)+(1/33))]… -3.6+.8080
x1 – x2 z* SQRT(s2(1/n1+1/n2))

Using the pooled version, we did generate a slightly smaller margin of error (.8080 versus .8112). This occurred because the larger group (group 1) had smaller standard deviation.
As mentioned in the previous slide, when in doubt, use the unpooled approach.
Confidence Intervals

Confidence Intervals
Lets now generate two sample Confidence Intervals using R…
R Programming
Confidence Intervals for One Sample Proportion

These notes will guide you through estimating proportion confidence intervals.
In each case:1. The formula will be presented;2. The formula will be applied (manually);3. The formula will be applied via R.
Confidence Intervals

The interval for any CI estimate can be expressed as:
Sample estimate + conf. level * standard error
In the case of a single population proportion, the expression is:
Where, “p” is the proportion of units in a sample; z is the associated # of Std deviations
associated with the required confidence level;
n is the number of obs in the sample.
Confidence Intervals

Typical Z scores used in CI Estimation:
90% confidence = 1.645
95% confidence = 1.96
98% confidence = 2.33
99% confidence = 2.575
Confidence Intervals

The Gallup Organization, founded in 1935 by George Gallup, is one of the most well respected polling organizations in the world.
Their website is a great place to find confidence intervals of proportions www.gallup.com
A common survey for Gallup is the presidential approval rating…
Confidence Intervals
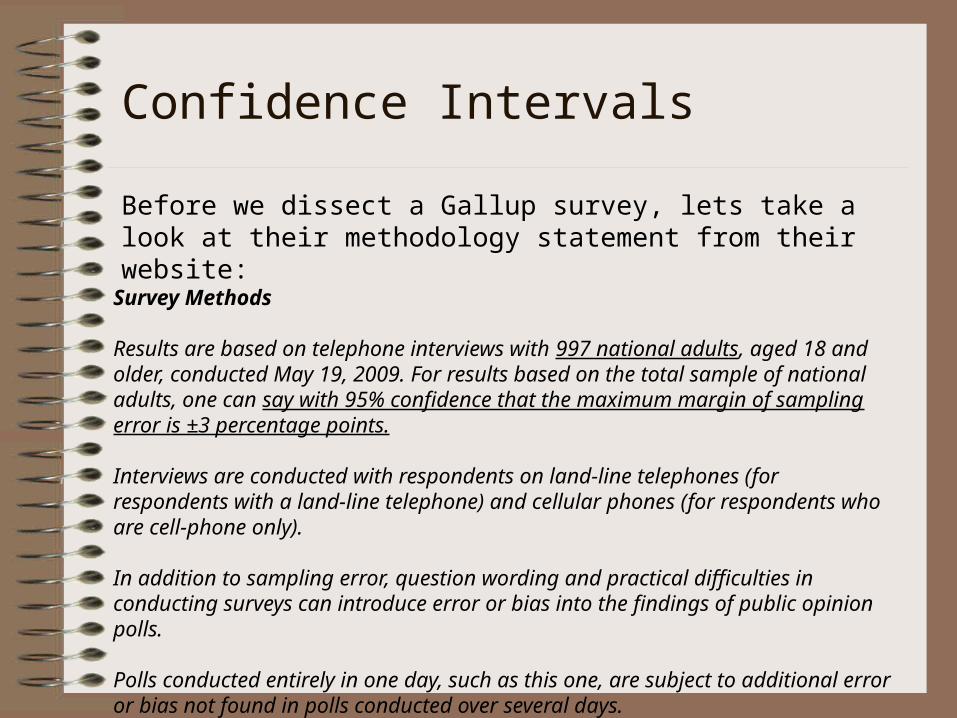
Before we dissect a Gallup survey, lets take a look at their methodology statement from their website:
Confidence Intervals
Survey Methods
Results are based on telephone interviews with 997 national adults, aged 18 and older, conducted May 19, 2009. For results based on the total sample of national adults, one can say with 95% confidence that the maximum margin of sampling error is ±3 percentage points.
Interviews are conducted with respondents on land-line telephones (for respondents with a land-line telephone) and cellular phones (for respondents who are cell-phone only).
In addition to sampling error, question wording and practical difficulties in conducting surveys can introduce error or bias into the findings of public opinion polls.
Polls conducted entirely in one day, such as this one, are subject to additional error or bias not found in polls conducted over several days.

From this statement, Gallup asked 997 if they approve of the job the president is doing. From this representative sample, 64% say “Yes”…How did they get a margin of error of 3%?
So, from this example, we have:
p=.64z = 1.96n = 997
.64 + 1.96 * SQRT((.64(.36))/997) …
.64+.0298
Confidence Intervals

So…what would happen to the interval if we increased the confidence to 99%?
Confidence Intervals
Everything would stay the same except for the Z-score:p=.64z = 2.575n = 997
.64 + 2.575 * SQRT((.64(.36))/997) …
.64+.0391

Confidence Intervals
Confidence Level
Z-score Margin of Error
Low End of Approval Rating
High End of Approval Rating
90% 1.645 .0250 61.50% 66.50%
95% 1.96 .0298 61% 67%
99% 2.575 .0391 60% 68%
From the Gallup Data (approval = 64%, n=997), here are the effects of changing the confidence levels…

R Programming
Confidence Intervals for Difference of Two Sample
Proportions

Confidence Intervals
These notes will guide you through estimating the confidence interval for the difference in proportions for two independent samples.
Throughout these notes:
1. The formula will be presented;2. The formula will be applied (manually);3. The formula will be applied via R.

As we saw previously, the interval for any CI estimate can be expressed as:
Sample estimate + conf. level * standard error
In the case of a CI for the difference between two proportions, the expression is:
Where, pi is the proportion of units in a sample (1 or 2);
Z is the associated # of Std deviations associated with the required confidence level;
ni is the number of obs in the sample (1 or 2).
Confidence Intervals

Confidence Intervals
A few notes about independent sample differences:
• Sample proportions are available based upon independent randomly selected samples from the two populations.
• The frequencies of each proportional quantity is at least 10.

For example, lets say that we took a poll of students and asked “would you date someone with a great personality who you were not attracted to?” By gender, the results were 61.07% of 131 women said “yes” while 42.62% of 61 men said “yes”.
What is the 95% Confidence Interval?
Confidence Intervals
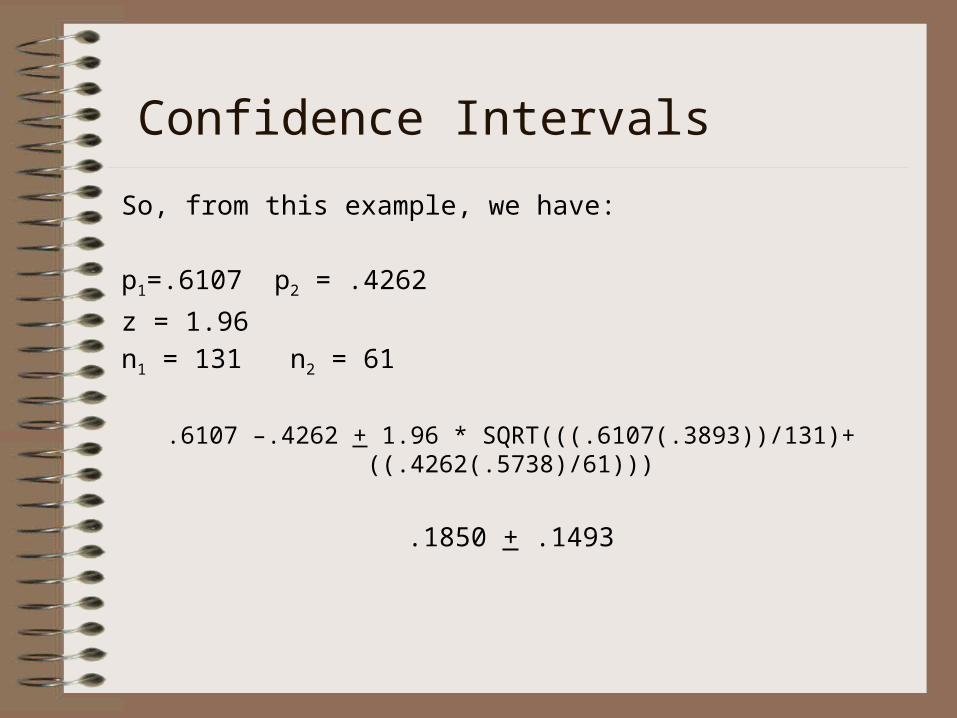
So, from this example, we have:
p1=.6107 p2 = .4262
z = 1.96n1 = 131 n2 = 61
.6107 –.4262 + 1.96 * SQRT(((.6107(.3893))/131)+((.4262(.5738)/61)))
.1850 + .1493
Confidence Intervals
In English, this becomes…
“We are 95% confident that the proportion of women who would date someone who they thought was a great person even if they did not find them attractive is 18.50% higher than the proportion of men…this difference could be as great as 33.43% or as little as 3.57%.”
Confidence Intervals

Confidence Intervals
Lets now generate a single proportion confidence interval using R…