,QWURGXFWLRQ WR 6KRFN 9LEUDWLRQnengvib.sydneyinstitute.wikispaces.net/file/view/BA767412.pdf/... ·...
36
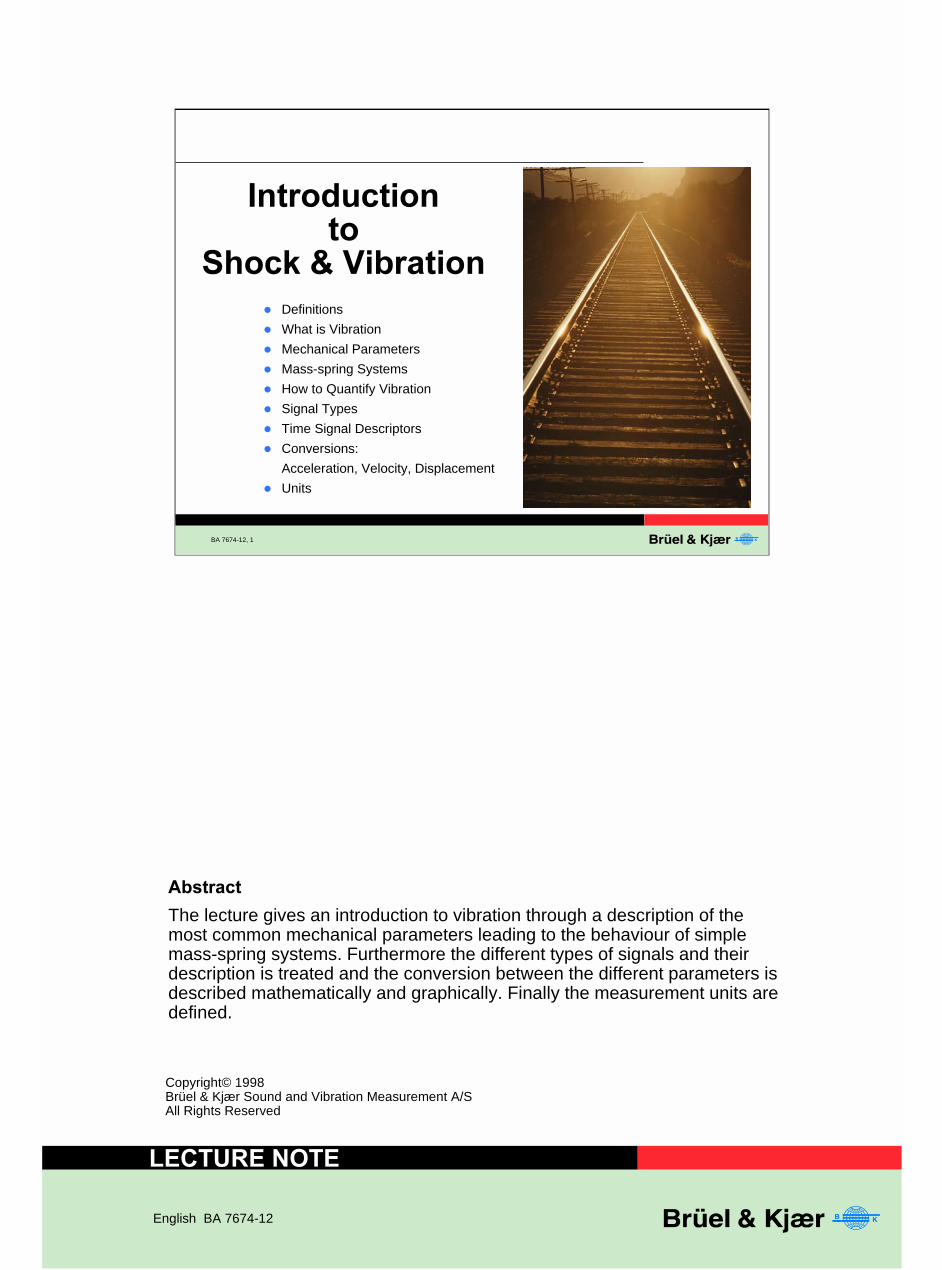
$EVWUDFW The lecture gives an introduction to vibration through a description of the most common mechanical parameters leading to the behaviour of simple mass-spring systems. Furthermore the different types of signals and their description is treated and the conversion between the different parameters is described mathematically and graphically. Finally the measurement units are defined. BA 7674-12, 1 l Definitions l What is Vibration l Mechanical Parameters l Mass-spring Systems l How to Quantify Vibration l Signal Types l Time Signal Descriptors l Conversions: Acceleration, Velocity, Displacement l Units ,QWURGXFWLRQ WR 6KRFN9LEUDWLRQ /(&785(127( Copyright© 1998 Brüel & Kjær Sound and Vibration Measurement A/S All Rights Reserved English BA 7674-12
-
Upload
phungthien -
Category
Documents
-
view
214 -
download
0
Transcript of ,QWURGXFWLRQ WR 6KRFN 9LEUDWLRQnengvib.sydneyinstitute.wikispaces.net/file/view/BA767412.pdf/... ·...
$EVWUDFW
The lecture gives an introduction to vibration through a description of themost common mechanical parameters leading to the behaviour of simplemass-spring systems. Furthermore the different types of signals and theirdescription is treated and the conversion between the different parameters isdescribed mathematically and graphically. Finally the measurement units aredefined.
BA 7674-12, 1
l Definitions
l What is Vibration
l Mechanical Parameters
l Mass-spring Systems
l How to Quantify Vibration
l Signal Types
l Time Signal Descriptors
l Conversions:
Acceleration, Velocity, Displacement
l Units
,QWURGXFWLRQWR
6KRFN��9LEUDWLRQ
/(&785(�127(
Copyright© 1998Brüel & Kjær Sound and Vibration Measurement A/SAll Rights Reserved
English BA 7674-12

Page 2
'HILQLWLRQV
It is practical to know more precisely what we are going to talk about. Thesedefinitions are adapted from the “Shock and Vibration Handbook” by Harrisand Crede (see literature list).
BA 7674-12, 2
'HILQLWLRQV
9LEUDWLRQ is an oscillation wherein thequantity is a parameter defining themotion of a mechanical system
2VFLOODWLRQ is the variation, usually withtime, of the magnitude of a quantity withrespect to a specified reference when themagnitude is alternately greater andsmaller than the reference

Page 3
:KDW�LV�9LEUDWLRQ"
Vibration is mechanical oscillation about a reference position. Vibration is aneveryday phenomenon, we meet it in our homes, during transport and atwork. Vibration is often a destructive and annoying side effect of a usefulprocess, but is sometimes generated intentionally to perform a task.
9LEUDWLRQ�RI�PDFKLQHV
Vibration is a result of dynamic forces in machines which have moving partsand in structures which are connected to the machine. Different parts of themachine will vibrate with various frequencies and amplitudes. Vibrationcauses wear and fatigue. It is often responsible for the ultimate breakdown ofthe machine.
BA 7674-12, 3
9LEUDWLRQ�,Q�(YHU\GD\�/LIH
�����UHWU�IJNM�MJI�ONGVG�����NJKD�SZZSRGM�GHR

Page 4
8VHIXO�$SSOLFDWLRQ�RI�9LEUDWLRQ
Vibration is generated intentionally in component feeders, concretecompactors, ultrasonic cleaning baths and pile drivers, for example. Vibrationtesting machines impart vibration to objects in order to test their resistanceand function in vibratory environments.
BA 7674-12, 4
8VHIXO�9LEUDWLRQ

Page 5
0HFKDQLFDO�3DUDPHWHUV
Before going into a discussion about vibration measurement and analysis,we will examine the basic mechanical parameters and components and howthey interact.
All mechanical systems contain the three basic components: spring, damper,and mass. When each of these in turn is exposed to a constant force theyreact with a constant displacement, a constant velocity and a constantacceleration respectively.
BA 7674-12, 5
F = c × v
0HFKDQLFDO�3DUDPHWHUV�DQG�&RPSRQHQWV
VelocityDisplacement Acceleration
dv a
k
c
m
m
F = k × d F = m × a

Page 6
0DVV�DQG�6SULQJ
Once a (theoretical) system of a mass and a spring is set in motion it willcontinue this motion with constant frequency and amplitude. The system issaid to oscillate with a sinusoidal waveform.
7KH�6LQH�&XUYH
The sine curve which emerges when a mass and a spring oscillate can bedescribed by its amplitude (D) and period (T). Frequency is defined as thenumber of cycles per second and is equal to the reciprocal of the period. Bymultiplying the frequency by 2π the angular frequency is obtained, which isagain proportional to the square root of spring constant k divided by mass m.The frequency of oscillation is called the natural frequency fn. The whole sinewave can be described by the formula d = Dsin ωnt, where d = instantaneousdisplacement and D = peak displacement.
BA 7674-12, 6
6LPSOHVW�)RUP�RI�9LEUDWLQJ�6\VWHP
D
d = D sinωnt
m
k
T
Time
Displacement
Frequency1T
Period, Tn in [sec]
Frequency, fn= in [Hz = 1/sec] 1Tn
Displacement
km
ωn= 2 π fn =

Page 7
)UHH�XQGDPSHG�YLEUDWLRQ
When a free undamped mass-spring system is set into oscillation the addedenergy is constant, but changes form from kinetic to potential during themotion.
At maximum displacement the velocity and therefore also the kinetic energyis zero, while the potential energy is 1/2kD2. At the equilibrium position thepotential energy is zero and the kinetic energy is maximum at 1/2mV2.
For the sinusoidal motion
d = D sinωntwe can also find the velocity by differentiating:
and thereby find V = 2πfnD.
Using energy conservation laws we then get the natural resonancefrequency
BA 7674-12, 7
)UHH�9LEUDWLRQ
D
Energy transfer between Kinetic and Potential Energy(assuming no damping)
1/2 m V2 = 1/2 k D2 , and V = (2πfn)D
1/2 m (2πfn)2 D2 = 1/2 k D2
∆ Kinetic Energy = - ∆ Potential Energy
mk
21
fn π=
tVcostDcosdt
t)d(Dsinv nnn
n ωωωω===
mk
21
fn π=

Page 8
,QFUHDVH�RI�0DVV
An increase in the mass of a vibrating system causes an increase in periodi.e. a decrease in frequency.
BA 7674-12, 8
0DVV�DQG�6SULQJ
time
m1
m
Increasing massreduces frequency
1n mm
k2
+=π=ω QI

Page 9
0DVV��6SULQJ�DQG�'DPSHU
When a damper is added to the system it results in a decrease in amplitudewith time. The frequency of oscillation known as the damped naturalfrequency is constant and almost the same as the natural frequency. Thedamped natural frequency decreases slightly for an increase in damping.
BA 7674-12, 9
0DVV��6SULQJ�DQG�'DPSHU
time
m
k c1 + c2
Increasing dampingreduces the amplitude

Page 10
)RUFHG�9LEUDWLRQ
If an external sinusoidal force is applied to the system, the system will followthe force, which means that the movement of the system will have the samefrequency as the external force. There might, however, be a difference inamplitude (and phase) as shown in the diagram.
For frequencies below its natural frequency, the amplitude of the vibratingsystem will increase as the frequency is increased, a maximum beingreached at the natural frequency. If there was no damping in the system(c = 0), the amplitude would approach infinity.
If the frequency of the external force is increased the frequency of thespring/mass/damper system will increase to the same value, but theamplitude (and the phase) will change in accordance with the curves in thediagrams.
BA 7674-12, 10
)RUFHG�9LEUDWLRQ
+90°
dm
ck
m
F
dF
Frequency
Frequency
Frequency
Displacement
Magnitude
Phase
dm = df
0°-90°
7LPH

Page 11
&RPELQHG�UHVSRQVHV
When considering real mechanical systems they will normally be morecomplex than the previous models. A simple example of twomasses/springs/dampers is shown here.
In this system we will see the responses combined, and its frequencyresponse function shows two resonance peaks corresponding to the twomasse/spring/damper systems.
BA 7674-12, 11
5HVSRQVHV�&RPELQH
0°
-90°
-180°
m
d1+ d2
d1
dF
2 1
1+2
1 2
1+2
F
Frequency
FrequencyPhase
Magnitude
Page 12
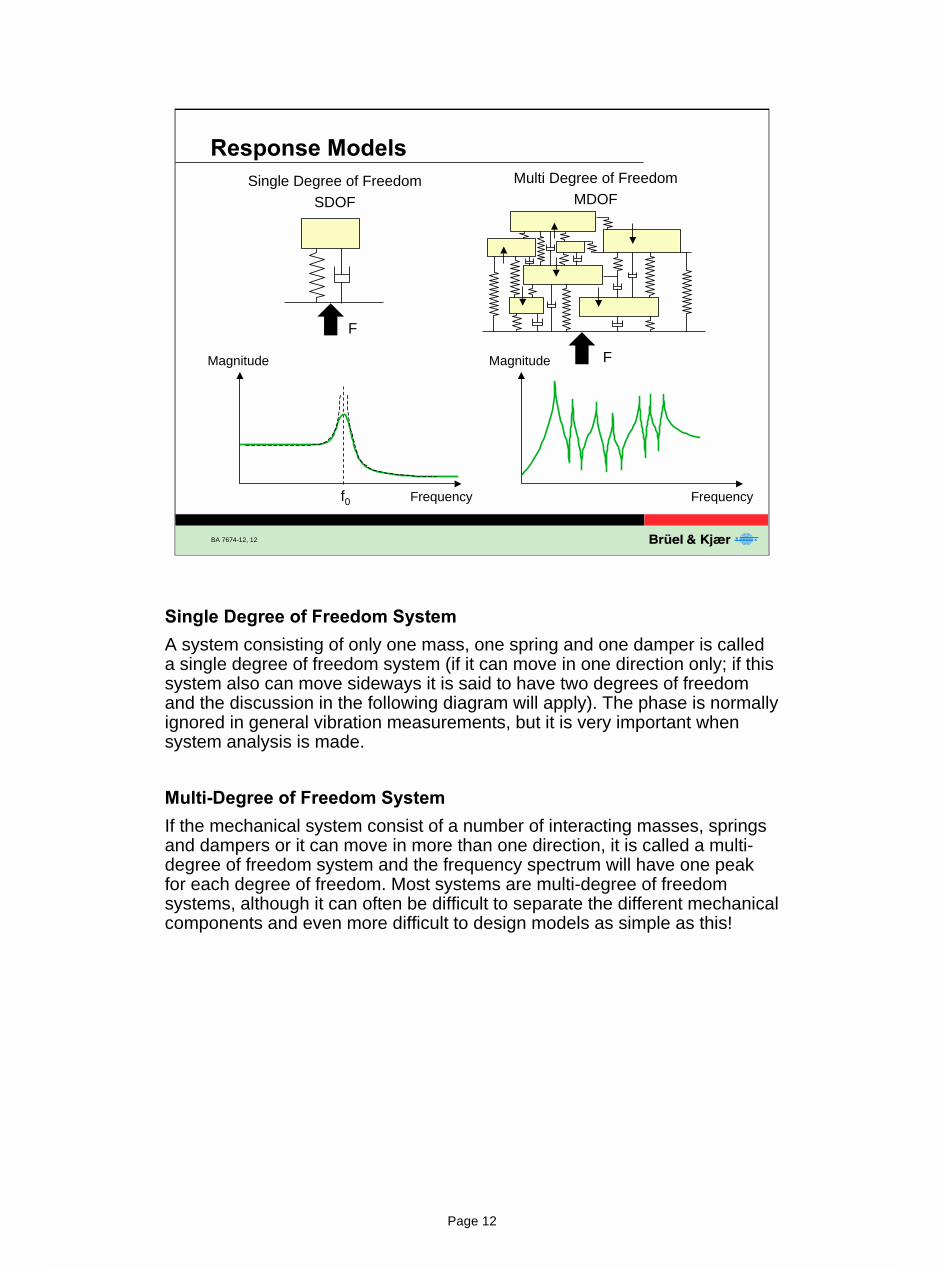
6LQJOH�'HJUHH�RI�)UHHGRP�6\VWHP
A system consisting of only one mass, one spring and one damper is calleda single degree of freedom system (if it can move in one direction only; if thissystem also can move sideways it is said to have two degrees of freedomand the discussion in the following diagram will apply). The phase is normallyignored in general vibration measurements, but it is very important whensystem analysis is made.
0XOWL�'HJUHH�RI�)UHHGRP�6\VWHP
If the mechanical system consist of a number of interacting masses, springsand dampers or it can move in more than one direction, it is called a multi-degree of freedom system and the frequency spectrum will have one peakfor each degree of freedom. Most systems are multi-degree of freedomsystems, although it can often be difficult to separate the different mechanicalcomponents and even more difficult to design models as simple as this!
BA 7674-12, 12
Magnitude
5HVSRQVH�0RGHOVSingle Degree of Freedom
SDOF
Multi Degree of FreedomMDOF
Magnitude
F
f0
F
Frequency Frequency

Page 13
5HDO�ZRUOG�5HVSRQVH
In most cases even simple systems are to be considered multi degree offreedom systems as illustrated here by a simple rotor in a couple of bearings.
BA 7674-12, 13
Bearing
³5HDO�ZRUOG´�5HVSRQVH
Magnitude
Frequency
Rotor
Bearing
Foundation

Page 14
)RUFHV�DQG�YLEUDWLRQ
A system will respond to an input force with a certain motion, depending onwhat we call the mobility of the system. Knowing the force and the mobilitypermits us to calculate the vibration.
Modal analysis or other methods are used to model systems. Once themodel is created we can calculate its mobility for a force input at a certainpoint, and thereby predict vibration at different locations. Such models canalso in some cases be used to calculate the load on the structure to predictfailure.
BA 7674-12, 14
)RUFHV�DQG�9LEUDWLRQ
891875
Vibration+ =InputForces
SystemResponse(Mobility)
)RUFHV�FDXVHG�E\
l Imbalancel Shockl Frictionl Acoustic
6WUXFWXUDO
3DUDPHWHUV:l Massl Stiffnessl Damping
+ =
9LEUDWLRQ
3DUDPHWHUV�
l Accelerationl Velocityl Displacement
Frequency Frequency Frequency

Page 15
:K\�PHDVXUH�YLEUDWLRQ"
A number of reasons are listed here.
The Wöhler curve is a curve describing the stress level up to which astructure can be loaded a certain number of times (endurance strength). Athigh stresses the load can only be carried a few times, but reducing thestress increases the number of cycles to failure. For most metals there existsan endurance limit for which the endurance becomes infinite. This stresslevel is very important, and it is often found by subjecting the object to10.000.000 cycles of stress, based on the experience that this number issufficient to reach the endurance limit.
BA 7674-12, 15
:K\�'R�:H�0HDVXUH�9LEUDWLRQ"
l To verify that frequencies andamplitudes do not exceed thematerial limits (e.g. as described bythe Wöhler curves)
l To avoid excitation of resonances incertain parts of a machine
l To be able to dampen or isolatevibration sources
l To make conditionalmaintenance on machines
l To construct or verify computermodels of structures (systemanalysis)

Page 16
BA 7674-12, 16
+RZ�GR�:H�4XDQWLI\�9LEUDWLRQ"
In order to make the analysis, we must first talkabout the types of vibration signals we mightencounter and how we measure these signals
l We make a measurement
l We analyse the results (levels and frequencies)

Page 17
6LJQDOV
Basically a distinction between Stationary Signals and Non-stationarySignals has to be made. Stationary Signals can again be divided intoDeterministic Signals and Random Signals, and Non-stationary Signals intoContinuous and Transient signals.
Stationary deterministic signals are made up entirely of sinusoidalcomponents at discrete frequencies.
Random signals are characterised by being signals where the instantaneousvalue cannot be predicted, but where the values can be characterised by acertain probability density function i.e. we can measure its average value.Random signals have a frequency spectrum which is continuously distributedwith frequency.
The continuous non-stationary signal has some similarities with bothtransient and stationary signals. During analysis continuous non-stationarysignals should normally be treated as random signals or separated into theindividual transient and treated as transients.
Transient signals are defined as signals which commence and finish at aconstant level, normally zero, within the analysis time.
BA 7674-12, 17
7\SHV�RI�6LJQDOV
Deterministic Random Continuous Transient
Non-stationary signalsStationary signals

Page 18
'HWHUPLQLVWLF�6LJQDOV
The vibration signal from a gearbox could look like the one shown here. Inthe frequency domain this signal will give rise to a number of separate peaks(discrete frequency components) which through knowledge of the number ofteeth on the gearwheels and their speed can be related back to particularparts of the system. The signal here is called deterministic, since theinstantaneous value of the signal is predictable at all points in time.
7KH�UROH�RI�IUHTXHQF\�DQDO\VLV
The frequency spectrum gives in many cases a detailed information aboutthe signal sources which cannot be obtained from the time signal. Theexample shows measurement and frequency analysis of the vibration signalmeasured on a gearbox. The frequency spectrum gives information on thevibration level caused by rotating parts and tooth meshing. It herebybecomes a valuable aid in locating sources of increased (undesirable)vibration from these and other sources.
BA 7674-12, 18
'HWHUPLQLVWLF�6LJQDOV
DE Vibration
A
B C
Amplitude
Time
Frequency
AB CD E
Amplitude

Page 19
9LEUDWLRQ�6LJQDOV
The motion of a mechanical system can consist of a single component at asingle frequency as with the system described in one of the previousexamples; (a tuning fork is another example) or it can consist of severalcomponents occurring at different frequencies simultaneously, as forexample with the piston motion of an internal combustion engine.
The motion signal is here split up into its separate components both in thetime domain and in the frequency domain.
BA 7674-12, 19
'HWHUPLQLVWLF�6LJQDOV�DQG�+DUPRQLFV
Time
Time
Time
Frequency
Frequency
Frequency
f1
f1
2f1
2f1

Page 20
+DUPRQLFV
Many non-sinusoidal signals can be separated into a number of harmonicallyrelated sinusoids. Two examples are given. The harmonic components arealways referred to the fundamental frequency to which they are related.
BA 7674-12, 20
+DUPRQLFV
Time
Frequencyf0 3f1
Time
Frequency
5f1
f0 2f0 3f0 4f0 5f0
Generator

Page 21
5DQGRP�6LJQDOV
A typical example of random vibration is that caused by fluid flow. Randomsignals have no periodic and harmonically related components. They arecharacterised by totally random movements, so that their instantaneousvalue cannot be predicted. Random vibration can, however, be described byits statistical properties. Stationary random signals have a frequencyspectrum which is no longer concentrated at discrete frequencies, butdistributed continuously with frequency.
BA 7674-12, 21
5DQGRP�6LJQDOV
Frequency
Time

Page 22
6KRFN
Mechanical shock is a short burst of vibratory energy. If the shock is infinitelyshort it will also have a frequency spectrum which is distributed continuouslywith frequency. Since a shock will always have a finite length its frequencyspectrum will be limited to a band of frequencies.
BA 7674-12, 22
,PSDFW�,PSXOVH�6KRFN�6LJQDOV
Time
Frequency

Page 23
:KLFK�SDUDPHWHU�WR�PHDVXUH"
Measuring on the time signal is the simplest form of analysis.
A number of different possibilities are mentioned here.
BA 7674-12, 23
:KLFK�7LPH�6LJQDO�3DUDPHWHU�'R�:H�8VH
l Peakl Peak-Peakl Averagel RMSl Crest Factorl Periodicity/Repetition Ratel Duration

Page 24
6LJQDO�/HYHO�'HVFULSWRUV
The level of vibration signal can be described in different ways. Peak andpeak-to-peak values are often used to describe the level of a vibration signalsince they indicate the maximum excursion from equilibrium position. TheRMS (Root Mean Square) level is a very good descriptor, since it is ameasure of the energy content of the vibration signal.
BA 7674-12, 24
7LPH�6LJQDO�'HVFULSWRUV
Time
RMS AveragePeak
Peak-Peak
Amplitude
T
Crest Factor :PeakRMS
dt)t(xT
RMST
∫=0
21 dt)t(xT
verageAT
∫=0
1

Page 25
7LPH�6LJQDO�'HVFULSWRUV
These descriptors are not only used in conjunction with a single sinusoidalsignal but also with normal machine vibration signals which are composed ofmany sinusoidal vibration components.
BA 7674-12, 25
7LPH�6LJQDO�'HVFULSWRUV
AverageRMS
Amplitude
Time
PeakPeak-Peak
dt)t(xT
RMST
∫=0
21 dt)t(xT
verageAT
∫=0
1Crest Factor :
PeakRMS

Page 26
/LQHDU�YV��RVFLOODWRU\�PRWLRQ
The motion of an object along a straight line can be described in the form ofthe instantaneous position, its velocity at the given time and its accelerationat that time.
For an oscillatory motion at a certain frequency the three parameters arestrictly linked together.
BA 7674-12, 26
/LQHDU�YV��2VFLOODWRU\�0RWLRQ
Detroit35 Miles
Speedlimit
65 MPH
TEST0-60 MPH
in 8.6second
D
Time
Displacement
Time
Time
Velocity
Acceleration
V
A

Page 27
5HODWLRQVKLS�EHWZHHQ�G��Y�DQG�D
The three mechanical parameters displacement, velocity and accelerationare closely related. If a vibration signal containing only one frequency isconsidered the form and period of the signal remains the same whether it isthe displacement, velocity or acceleration being considered, the maindifference is that there is a phase difference between the amplitude-timecurves of the three parameters. Knowing the displacement signal, the otherscan be found through a single and double differentiation of this signal. If thephase difference is ignored (as is normally the case) the numerical values ofvelocity and acceleration can be found by simple multiplication as shown.
BA 7674-12, 27
&RQYHUVLRQ�IURP�'LVSODFHPHQW�WR�$FFHOHUDWLRQ
Displacement, d
Velocity, v
Acceleration, a
Time
D
Time
Time
d = D sin ωt
d = D
v = = Dω cos ωt dddt
v = Dω = D2πf
v = = Dω2 sin ωt d2ddt2
a = Dω2 = D4π2f 2

Page 28
5HODWLRQVKLS�EHWZHHQ�D��Y�DQG�G
If the parameter measured is the acceleration, the two other parameters canjust as easily be found through a single and double integration of theacceleration signal. Since integration is easier than differentiation byelectronic methods, the best parameter to pick up is acceleration. Theelectronic equipment takes care of the rest. There are other reasons forchoosing acceleration as the best parameter to pick up. This will beexplained in following lectures.
BA 7674-12, 28
&RQYHUVLRQ�IURP�$FFHOHUDWLRQ�WR�'LVSODFHPHQW
Acceleration, a
Velocity, v
Displacement, d
Time
A
Time
Time
a = A sin ωt
a = A
∫v = a dt = - cos ωtAω
v = = A2πf
Aω
∫d = a dt dt = - sin ωtAω2∫
d = = A4π2f 2
Aω2

Page 29
8VH�RI�D�1RPRJUDP�IRU�&RQYHUVLRQ�EHWZHHQ�D��Y�DQG�G
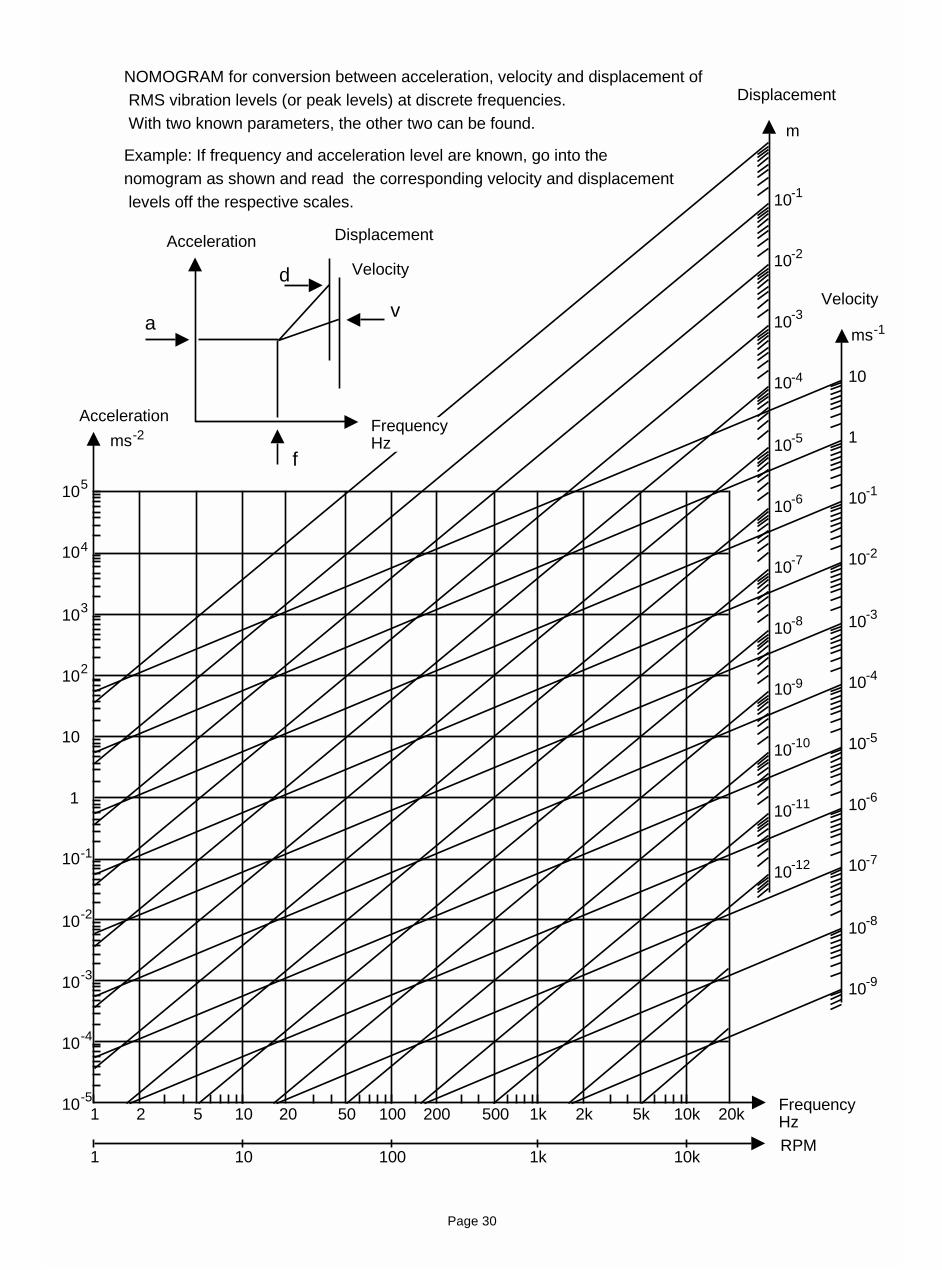
Knowing the frequency of vibration and the acceleration level, the velocityand displacement levels can easily be found by the use of a nomogram. Notethat the nomogram is only valid for vibration with a single frequencycomponent and not for a signal containing several frequency components.The details in the nomogram pictured on the transparency cannot be seenvery clearly. Therefore the next notes page contains a full size copy forpractical use.
BA 7674-12, 29
&RQYHUVLRQ�XVLQJ�D�1RPRJUDP
a
f
d
v
Acceleration Displacement
Velocity
FrequencyHz
10 5
10 4
10 3
10 2
10
1
10 -1
10 -2
10 -3
10 -4
10 -51 2 5 10 20 50 100 200 500 1k 2k 5k 10k 20k
1 10 100 1k 10k
10
1
10-1
10-2
10
10
10
-4
10-6
10-7
10-8
10-9
-5
-3
10-1
10-2
10
10
10
-4
10-6
10-7
10-8
10-9
-5
-3
10 -10
10 -11
10 -12
m
ms -1
Displacement
Velocity
Acceleration
FrequencyHzRPM
ms-2
f
NOMOGRAM for conversion between acceleration, velocity anddisplacement of RMS vibration levels (or peak levels) at discretefrequencies. With two known parameters, the other two can be found.
Displacement
Velocity
Acceleration
FrequencyHz
d
av
Example: If frequency and acceleration level are known, go into thenomogram as shown and read the corresponding velocityand displacement levels off the respective scales.
Page 30
105
104
103
102
10
1
10-1
10-2
10-3
10-4
10-51 2 5 10 20 50 100 200 500 1k 2k 5k 10k 20k
1 10 100 1k 10k
10
1
10-1
10-2
10
10
10
-4
10-6
10-7
10-8
10-9
-5
-3
10-1
10-2
10
10
10
-4
10-6
10-7
10-8
10-9
-5
-3
10-10
10-11
10-12
m
ms-1
Displacement
Velocity
Acceleration
FrequencyHzRPM
Displacement
Velocity
Acceleration
FrequencyHz
d
av
f
NOMOGRAM for conversion between acceleration, velocity and displacement of RMS vibration levels (or peak levels) at discrete frequencies. With two known parameters, the other two can be found.
Example: If frequency and acceleration level are known, go into the nomogram as shown and read the corresponding velocity and displacement levels off the respective scales.
ms-2

Page 31
8QLWV
The SI units for acceleration, velocity and displacement are ms-2, ms-1 and m.Other units have earlier been used, but in the interests of internationalstandardisation these should be avoided as much as possible.
The unit g often used in vibration work comes from the gravitationalacceleration, but is today purely a unit defined as:
1g ≡ 9.80665 ms-2
likewise
1 inch ≡ 25.4 mm
BA 7674-12, 31
8QLWV�RI�9LEUDWLRQ�6LJQDOV
Accelerationa
Velocityv
Displacementd
1ms-2 (m/s2)
1ms-1 (m/s)
1m
= 0.102g = 39.4 in/s2
= 3.6 km/h = 39.4 in/s
= 1000 mm = 39.4 in
1g ≡ 9.80665 ms-2

Page 32
7KH�PHDVXUHPHQW�FKDLQ
Now understanding the fundamentals of vibration we need to look at thesystem or measurement chain to be used for its measurement.
Normally a chain like the one illustrated is used. It contains a propertransducer, preamplifier suitable for the transducer, an analysis systemwhich can be as simple as a mean value detector and as complicated as anFFT analyser and finally an output in the form of a screen picture, a printoutor data stored in a computer or on a diskette.
The important thing to remember is that this chain, just as the normal oneshown, is no stronger than its weakest member!
BA 7674-12, 32
7KH�0HDVXUHPHQW�&KDLQ
Transducer Preamplifier Detector/Averager
Filter(s) Output

Page 33
*DUEDJH�,Q��*DUEDJH�2XW�
In development of new cars, monotoring of machines and many otherapplications of vibration measurement it is of paramount importance to havea very high reliability in the quality of measurement.
Unfortunately, choosing the accelerometer as the front end doesn’tautomatically give the enhanced reliability suggested. Firstly, the correct typemust be chosen, and then it must be used properly as we will see in laterlectures.
If the accelerometer used gives bad data for any reason, the entire machinecondition monitoring system collapses or we get an unusable new carconstruction.
A system with Garbage going In, can only give Garbage coming Out. That’sthe GIGO principle.
Don’t forget the concept of the system must also include not only thesoftware and hardware, but also the resources tied up, both human andfinancial.
BA 7674-12, 33
*,*2
Garbage In = Garbage Out
920046

Page 34
BA 7674-12, 34
&RQFOXVLRQ
You should now have a good understanding of:
l The fundamental nature of vibration
l The mechanical parameters involved
l The types of signals encountered
l The relationships between a, v and d
l The units of measurement
l The importance of the measurement chain

Page 35
BA 7674-12, 35
/LWHUDWXUH�IRU�)XUWKHU�5HDGLQJ
l Shock and Vibration Handbook (Harris and Crede, McGraw-Hill 1976)
l Frequency Analysis (Brüel & Kjær Handbook BT 0007-11)
l Brüel & Kjær Technical Review– No.1 - 1988 (BV 0033-11)

Page 36
/LVW�RI�6\PEROV�DQG�1RWDWLRQ
6LJQDO�3DUDPHWHUV
t = Time
f = Frequency
ω = Angular frequency
RMS = Root Mean Square
3K\VLFDO�3DUDPHWHUV
d = Displacement
v = Velocity
a = Acceleration
D = Peak Displacement
V = Peak Velocity
A = Peak Acceleration
k = Spring Constant
m, m1 = Masses
c, c1 = Damping Coefficients
F = Force
8QLWV
m = Meter
s = Second
Hz = Hertz
dB = Decibel
(OHFWULFDO�3DUDPHWHUV
V = Voltage (Volt)
Q = Charge (Coulomb)
Z = Impedance (Ohm)
R = Resistance (Ohm)
C = Capacitance (Farad)
i = Current (Ampere)
A = Amplification factor (Gain)