QUICKBOOKS 2016 STUDENT GUIDE Lesson 9 - Intuit · PDF fileLesson 9 — Analyzing...
30
QUICKBOOKS 2016 STUDENT GUIDE Lesson 9 Analyzing Financial Data
Transcript of QUICKBOOKS 2016 STUDENT GUIDE Lesson 9 - Intuit · PDF fileLesson 9 — Analyzing...
QU I CKB OOKS 2 0 16 ST U DENT GU I D E
Lesson 9
Analyzing Financial Data
Copyright
Copyright 2016 Intuit, Inc. Intuit, Inc.
All rights reserved. 5601 Headquarters Drive
Plano, TX 75024
Trademarks
©2016 Intuit Inc. All rights reserved. Intuit, the Intuit logo, Intuit ProLine, Lacerte, ProAdvisor,
ProSeries and QuickBooks, among others, are trademarks or registered trademarks of Intuit Inc. in
the United States and other countries. Other parties’ marks are the property of their respective
owners.
Notice to Readers
The publications distributed by Intuit, Inc. are intended to assist accounting professionals in their
practices by providing current and accurate information. However, no assurance is given that the
information is comprehensive in its coverage or that it is suitable in dealing with a client’s particular
situation. Accordingly, the information provided should not be relied upon as a substitute for
independent research. Intuit, Inc. does not render any accounting, legal, or other professional advice
nor does it have any responsibility for updating or revising any information presented herein. Intuit,
Inc. cannot warrant that the material contained herein will continue to be accurate nor that it is
completely free of errors when published. Readers should verify statements before relying on them.
Lesson 9 — Analyzing Financial Data Table of Contents
QuickBooks 2016 Student Guide 3
Table of Contents
Lesson Objectives .............................................................................................................................. 5
Creating QuickReports ........................................................................................................................ 6
Zooming in on a QuickReport .............................................................................................................. 7
Customizing QuickReports .................................................................................................................. 8
Using the Report Center ................................................................................................................... 11
Creating a Balance Sheet Previous Year Comparison Report ............................................................... 13
Filtering Reports ............................................................................................................................... 14
Saving Reports as a PDF .................................................................................................................. 15
Using QuickZoom in a Report ............................................................................................................ 16
Memorizing Reports ......................................................................................................................... 18
Creating Memorized Report Groups................................................................................................... 19
Printing Reports ............................................................................................................................... 20
Processing Reports in Groups ........................................................................................................... 21
Processing Multiple Miscellaneous Reports ........................................................................................ 22
Lesson 9 — Analyzing Financial Data Table of Contents
QuickBooks 2016 Student Guide 4
Sending a Report to Microsoft Excel® ............................................................................................... 23
Creating an Income and Expense Graph ............................................................................................ 24
Using QuickZoom with Graphs .......................................................................................................... 26
Customizing How Graphs Display ...................................................................................................... 27
Analyzing Financial Data — Review Questions .................................................................................... 28
Review Activities ............................................................................................................................... 29
Answers to Review Questions ........................................................................................................... 30
Lesson 9 — Analyzing Financial Data Lesson Objectives
QuickBooks 2016 Student Guide 5
Lesson Objectives
To discuss some of the tools QuickBooks gives you for analyzing financial data: QuickReports, preset reports,
and graphs
To create a QuickReport
To add a column to a report
To learn how to move a column in a report
To learn about the types of preset reports QuickBooks offers
To practice creating reports and viewing them onscreen
To customize a report by changing how it looks and the data it covers (filtering)
To learn how to process reports in batches
To save reports as portable document format (PDF) files
To learn how to export a report to Microsoft Excel
To practice filtering reports in Microsoft Excel
To learn about the types of graphs QuickBooks offers
To create and customize several graphs
Lesson 9 — Analyzing Financial Data Creating QuickReports
QuickBooks 2016 Student Guide 6
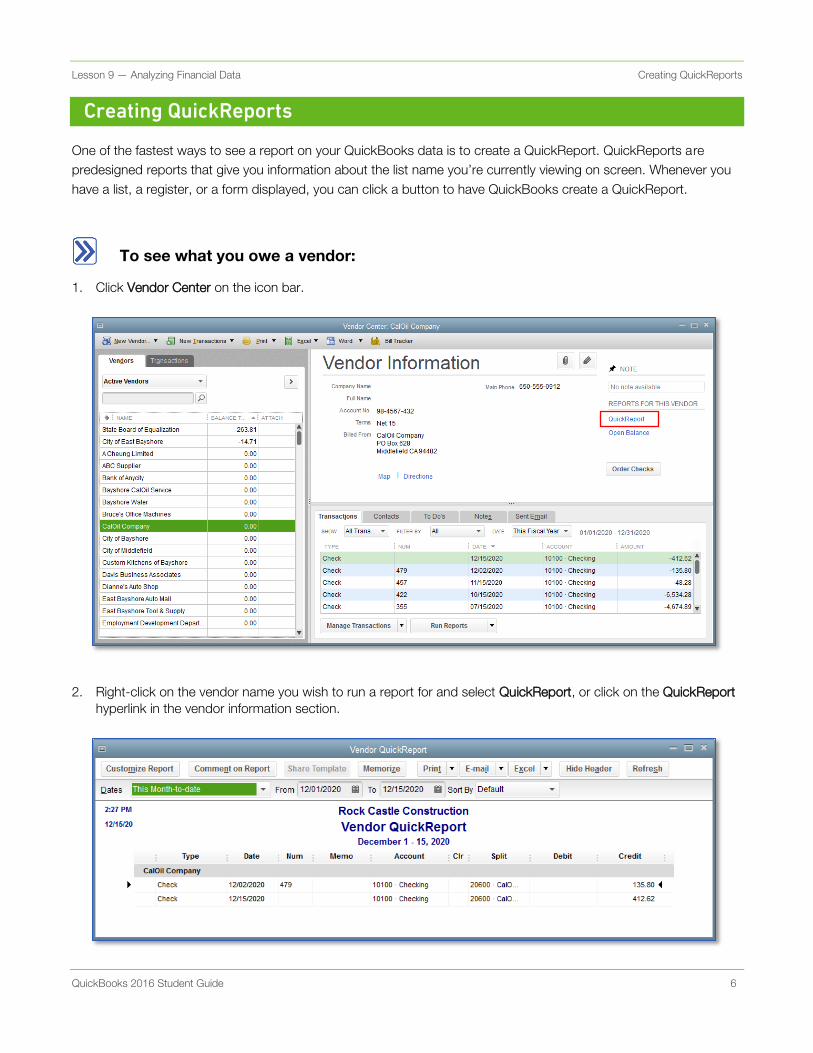
Creating QuickReports
One of the fastest ways to see a report on your QuickBooks data is to create a QuickReport. QuickReports are
predesigned reports that give you information about the list name you’re currently viewing on screen. Whenever you
have a list, a register, or a form displayed, you can click a button to have QuickBooks create a QuickReport.
To see what you owe a vendor:
Click Vendor Center on the icon bar. 1.
Right-click on the vendor name you wish to run a report for and select QuickReport, or click on the QuickReport 2.
hyperlink in the vendor information section.
Lesson 9 — Analyzing Financial Data Zooming in on a QuickReport
QuickBooks 2016 Student Guide 7
Zooming in on a QuickReport
All QuickReports contain a summary of individual transactions. To help you better understand the information
presented in reports, QuickBooks lets you trace report data to the individual transaction level using QuickZoom.
When you position the mouse pointer over a number in a report and see the QuickZoom symbol (a magnifying glass
with a Z in it), you can double-click the number to display the original transaction in QuickBooks.
To see more detail about a transaction:
From any financial report, hold your cursor over the dollar amount/transaction you wish to view in more detail. 1.
When your cursor turns into the QuickZoom icon, double-click your mouse to zoom in. This will open the 2.
transaction.
Press Esc to close the window. 3.
NOTES

Lesson 9 — Analyzing Financial Data Customizing QuickReports
QuickBooks 2016 Student Guide 8
Customizing QuickReports
Each QuickReport window has a button bar at the top of the report for customizing report content and layout.
To add a column to a report:
In the QuickReport window, click Customize Report. 1.
In the Columns list, select the additional columns you would like to add to the report (in this example we marked 2.
the Transaction # column).
Click OK to accept the change. 3.
Lesson 9 — Analyzing Financial Data Customizing QuickReports
QuickBooks 2016 Student Guide 9
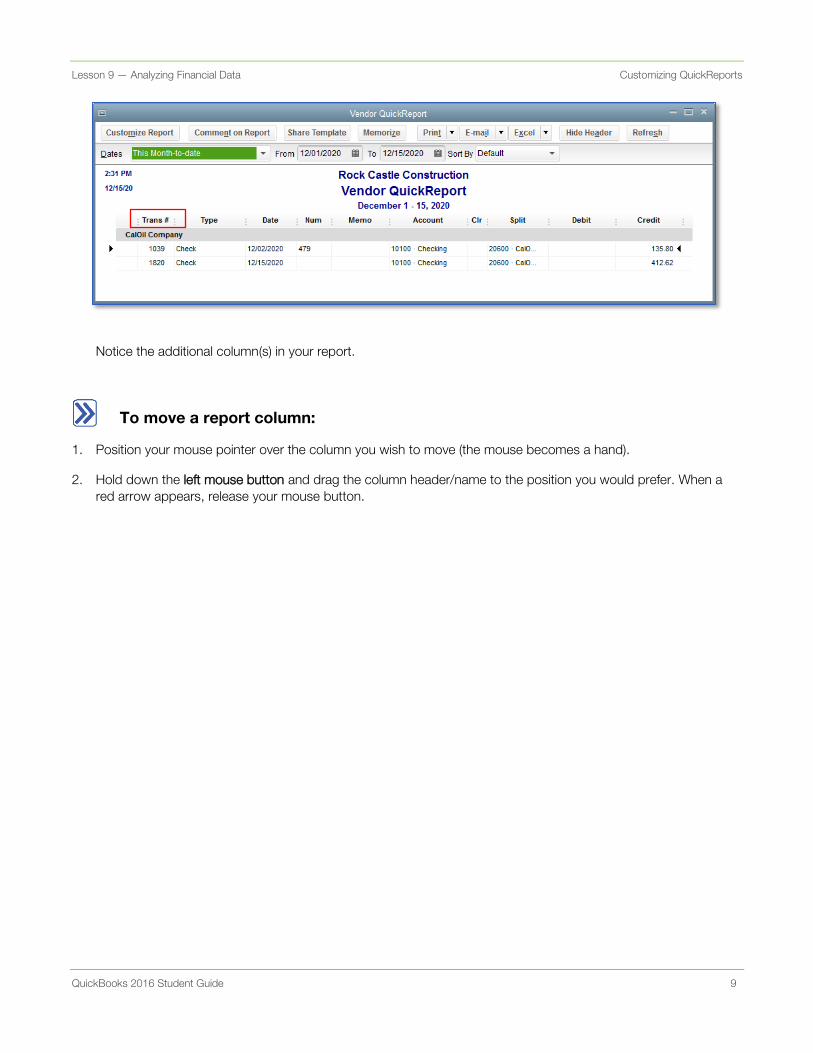
Notice the additional column(s) in your report.
To move a report column:
Position your mouse pointer over the column you wish to move (the mouse becomes a hand). 1.
Hold down the left mouse button and drag the column header/name to the position you would prefer. When a 2.
red arrow appears, release your mouse button.

Lesson 9 — Analyzing Financial Data Customizing QuickReports
QuickBooks 2016 Student Guide 10
To change information in the report heading:
In the report window, click Customize Report then click the Header/Footer tab. 1.
On the Header/Footer tab, you can change the company name, report title, subtitle, and date and time prepared.
You can also specify whether to print the header on all pages or just the first page. The Header/Footer tab is the
same for all QuickBooks reports.
Highlight the text in the Report Title field and replace it with the title you would like to give your report. 2.
Click OK to close the Modify Report window. 3.
Close the report. 4.
IMPORTANT: To save this report for future use, click the Memorize button on the report tool bar before closing the report. This allows you to save the custom settings and run the report at a later date from the Reports drop-down menu.
NOTES
Lesson 9 — Analyzing Financial Data Using the Report Center
QuickBooks 2016 Student Guide 11
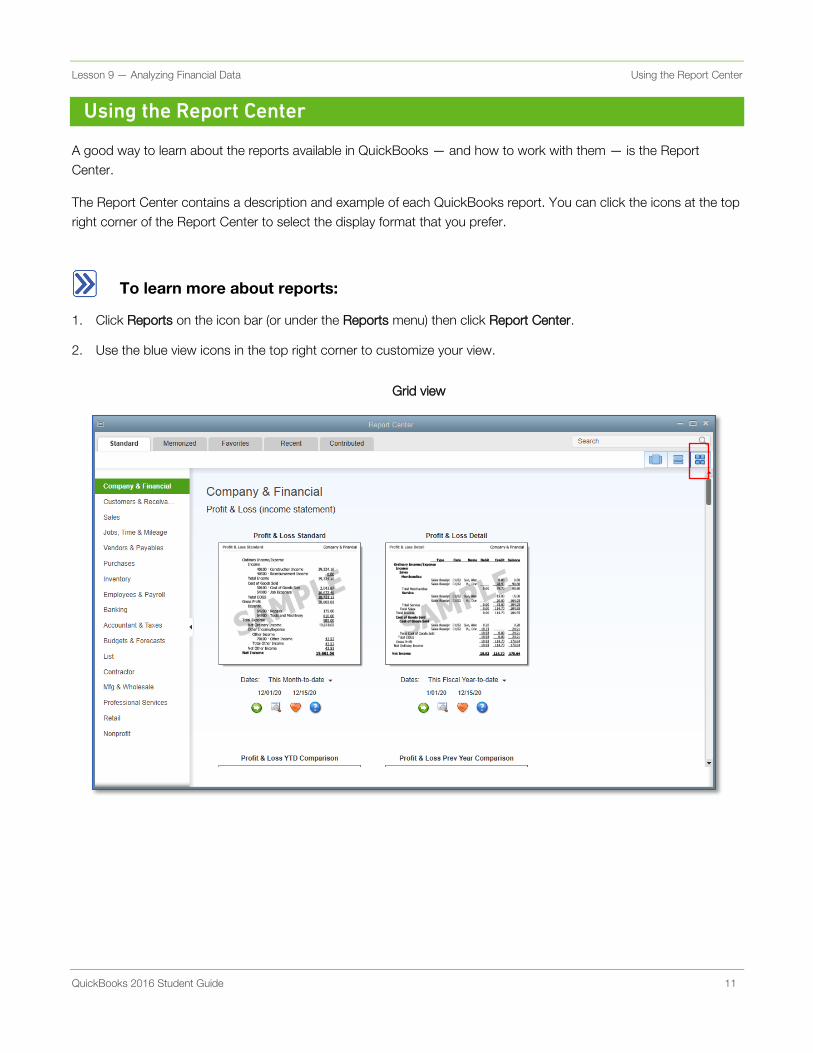
Using the Report Center
A good way to learn about the reports available in QuickBooks — and how to work with them — is the Report
Center.
The Report Center contains a description and example of each QuickBooks report. You can click the icons at the top
right corner of the Report Center to select the display format that you prefer.
To learn more about reports:
Click Reports on the icon bar (or under the Reports menu) then click Report Center. 1.
Use the blue view icons in the top right corner to customize your view. 2.
Grid view
Lesson 9 — Analyzing Financial Data Using the Report Center
QuickBooks 2016 Student Guide 12
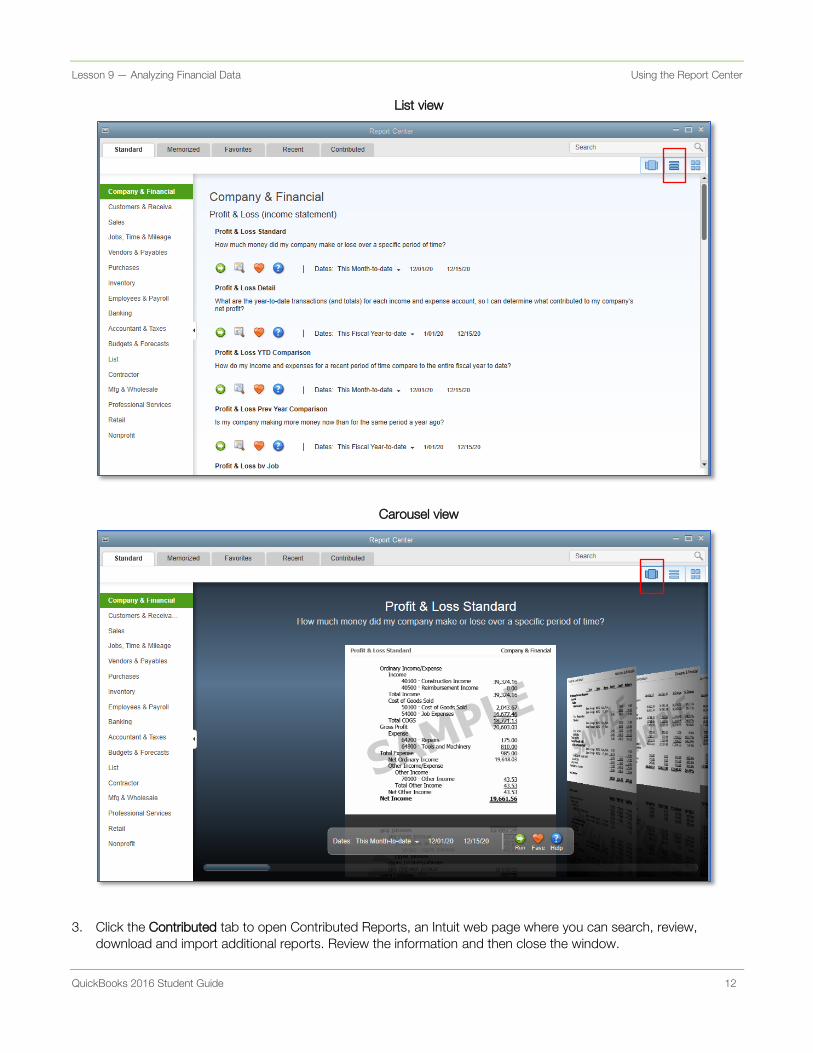
List view
Carousel view
Click the Contributed tab to open Contributed Reports, an Intuit web page where you can search, review, 3.
download and import additional reports. Review the information and then close the window.
Lesson 9 — Analyzing Financial Data Creating a Balance Sheet Previous Year Comparison Report
QuickBooks 2016 Student Guide 13
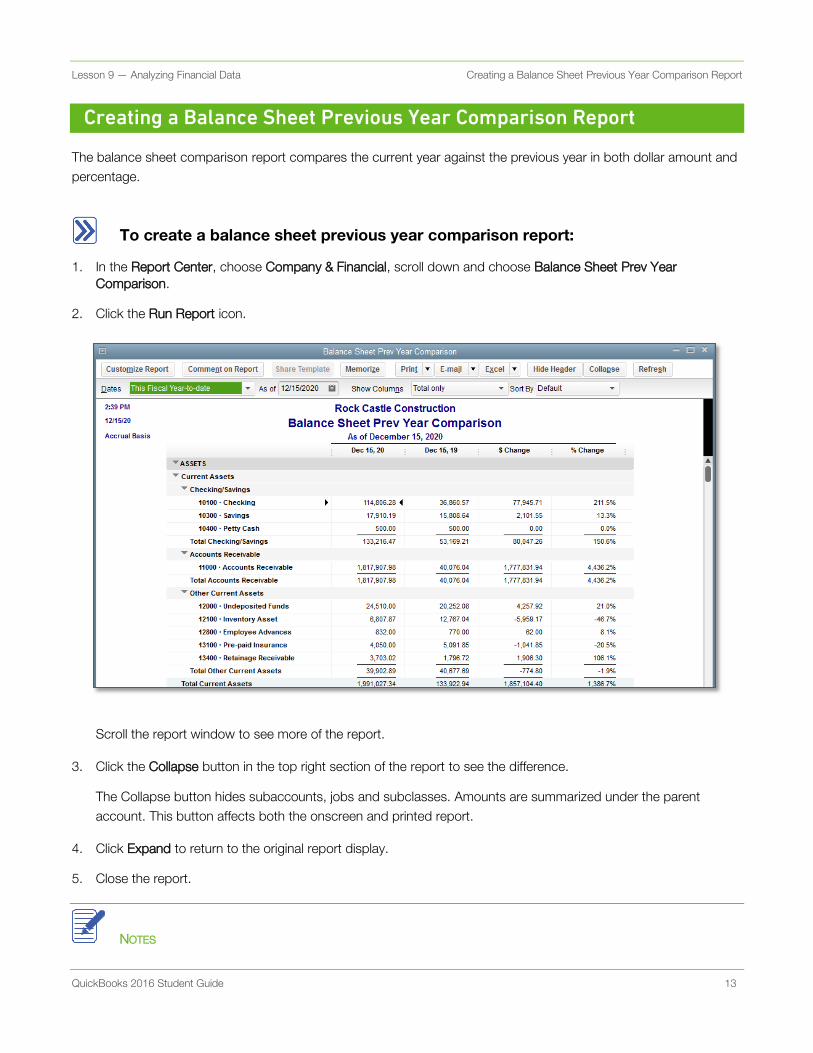
Creating a Balance Sheet Previous Year Comparison Report
The balance sheet comparison report compares the current year against the previous year in both dollar amount and
percentage.
To create a balance sheet previous year comparison report:
In the Report Center, choose Company & Financial, scroll down and choose Balance Sheet Prev Year 1.
Comparison.
Click the Run Report icon. 2.
Scroll the report window to see more of the report.
Click the Collapse button in the top right section of the report to see the difference. 3.
The Collapse button hides subaccounts, jobs and subclasses. Amounts are summarized under the parent
account. This button affects both the onscreen and printed report.
Click Expand to return to the original report display. 4.
Close the report. 5.
NOTES
Lesson 9 — Analyzing Financial Data Filtering Reports
QuickBooks 2016 Student Guide 14
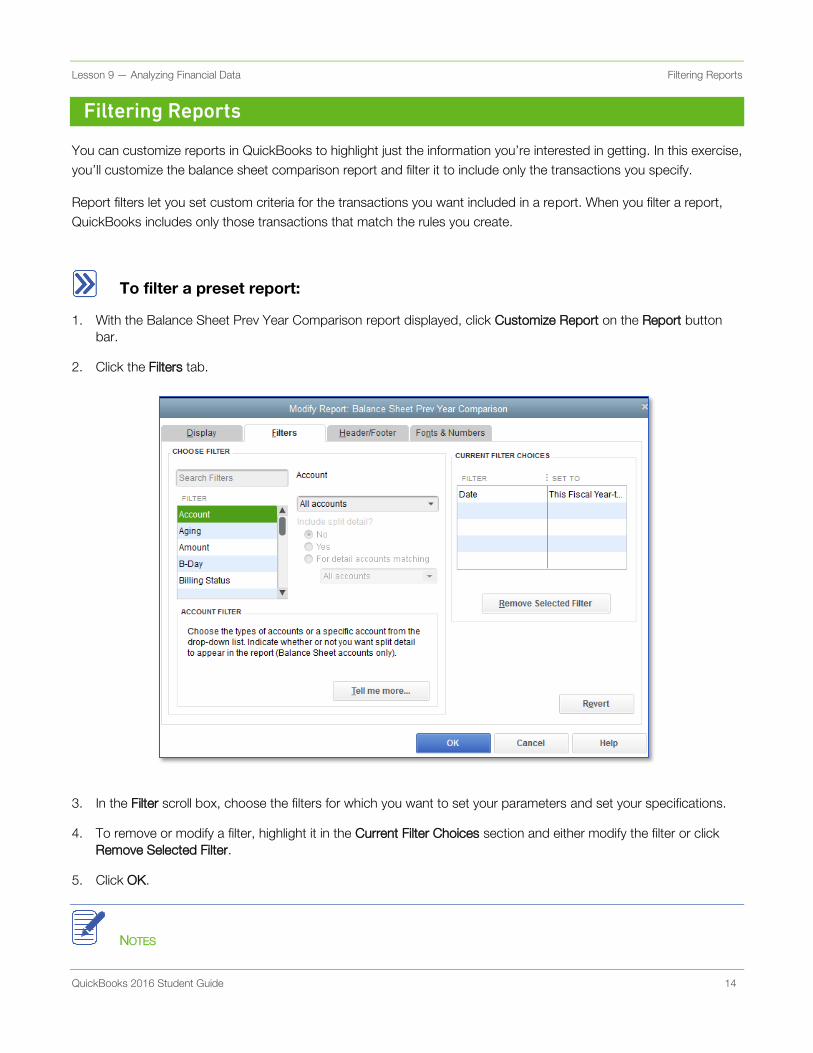
Filtering Reports
You can customize reports in QuickBooks to highlight just the information you’re interested in getting. In this exercise,
you’ll customize the balance sheet comparison report and filter it to include only the transactions you specify.
Report filters let you set custom criteria for the transactions you want included in a report. When you filter a report,
QuickBooks includes only those transactions that match the rules you create.
To filter a preset report:
With the Balance Sheet Prev Year Comparison report displayed, click Customize Report on the Report button 1.
bar.
Click the Filters tab. 2.
In the Filter scroll box, choose the filters for which you want to set your parameters and set your specifications. 3.
To remove or modify a filter, highlight it in the Current Filter Choices section and either modify the filter or click 4.
Remove Selected Filter.
Click OK. 5.
NOTES
Lesson 9 — Analyzing Financial Data Saving Reports as a PDF
QuickBooks 2016 Student Guide 15
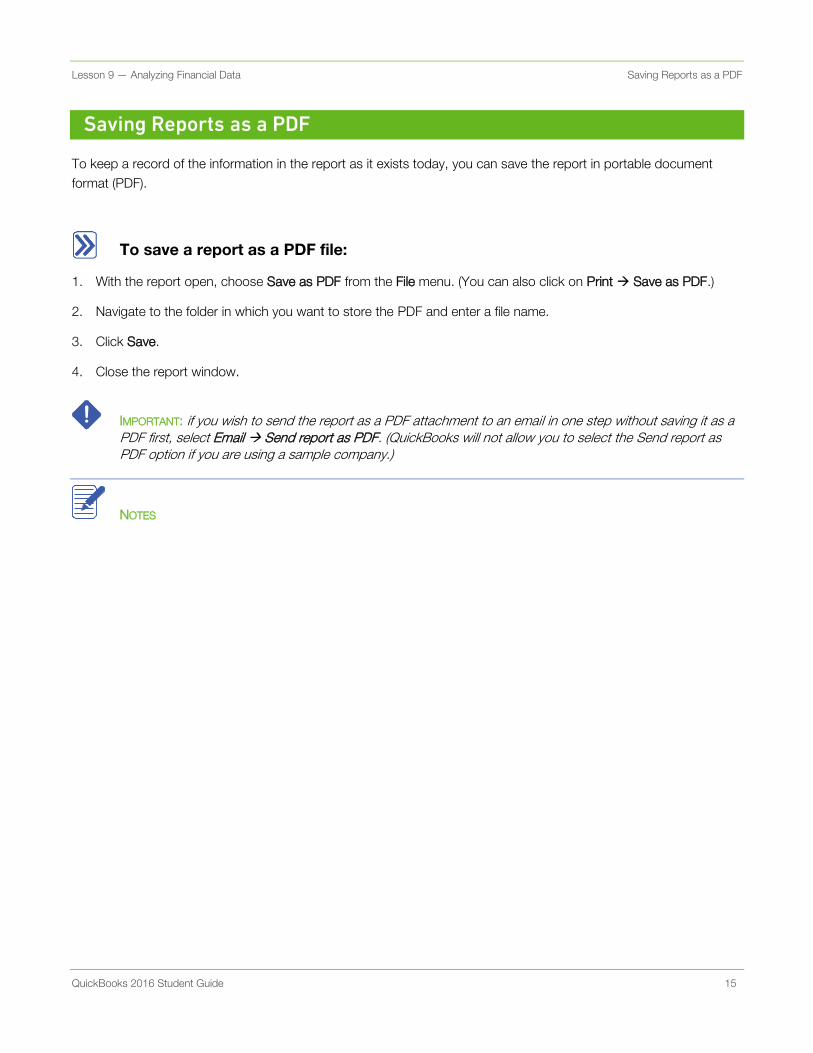
Saving Reports as a PDF
To keep a record of the information in the report as it exists today, you can save the report in portable document
format (PDF).
To save a report as a PDF file:
With the report open, choose Save as PDF from the File menu. (You can also click on Print Save as PDF.) 1.
Navigate to the folder in which you want to store the PDF and enter a file name. 2.
Click Save. 3.
Close the report window. 4.
IMPORTANT: if you wish to send the report as a PDF attachment to an email in one step without saving it as a PDF first, select Email Send report as PDF. (QuickBooks will not allow you to select the Send report as PDF option if you are using a sample company.)
NOTES
Lesson 9 — Analyzing Financial Data Using QuickZoom in a Report
QuickBooks 2016 Student Guide 16
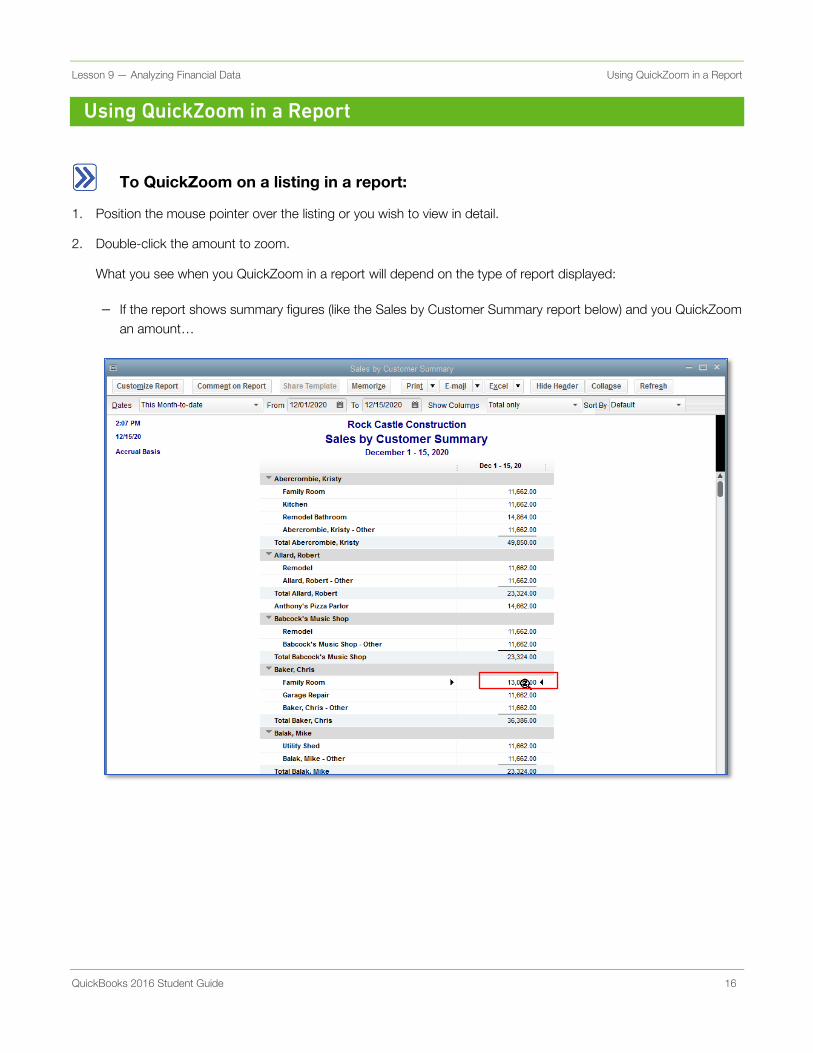
Using QuickZoom in a Report
To QuickZoom on a listing in a report:
Position the mouse pointer over the listing or you wish to view in detail. 1.
Double-click the amount to zoom. 2.
What you see when you QuickZoom in a report will depend on the type of report displayed:
If the report shows summary figures (like the Sales by Customer Summary report below) and you QuickZoom
an amount…
Lesson 9 — Analyzing Financial Data Using QuickZoom in a Report
QuickBooks 2016 Student Guide 17
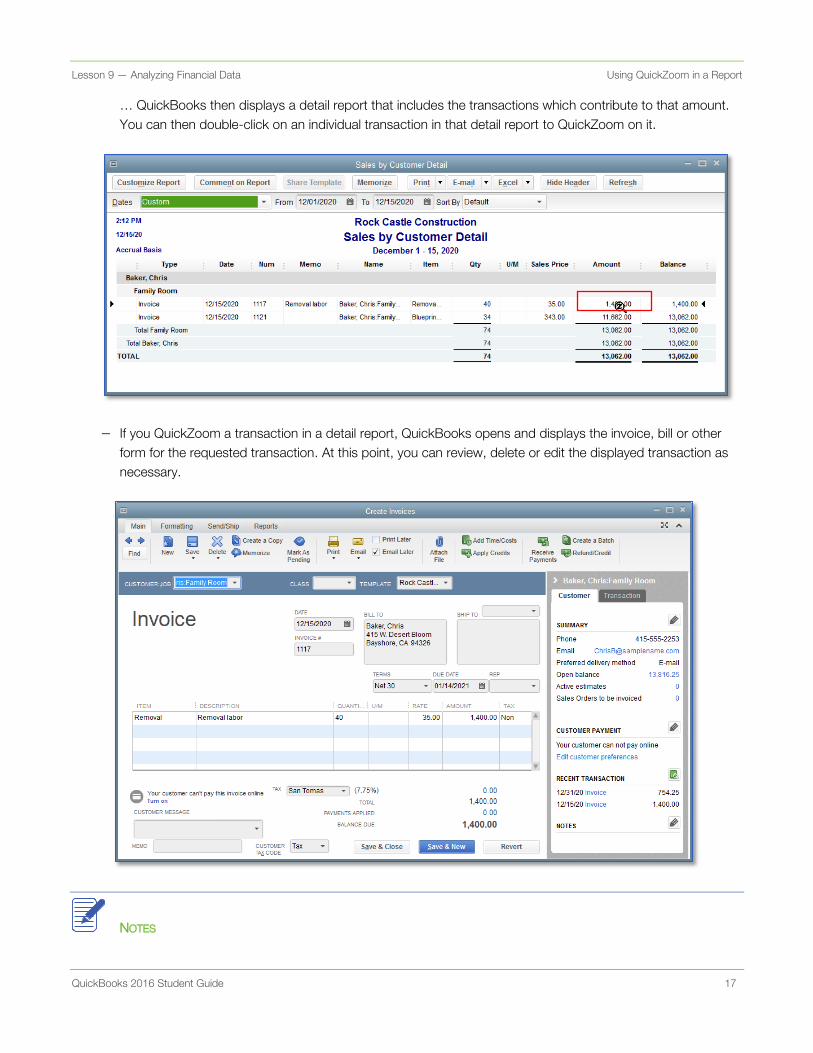
… QuickBooks then displays a detail report that includes the transactions which contribute to that amount.
You can then double-click on an individual transaction in that detail report to QuickZoom on it.
If you QuickZoom a transaction in a detail report, QuickBooks opens and displays the invoice, bill or other
form for the requested transaction. At this point, you can review, delete or edit the displayed transaction as
necessary.
NOTES
Lesson 9 — Analyzing Financial Data Memorizing Reports
QuickBooks 2016 Student Guide 18
Memorizing Reports
You may want to memorize reports which you customize, filter, and run frequently. Memorizing reports can save you
from spending time customizing the same reports over and over again. Remember: memorizing reports saves your
customizations and filters, not the data displayed. As new data is entered or existing data is changed, running a
memorized report will display the refreshed data but with the same settings (e.g., columns, title, etc.) you saved.
To memorize a report:
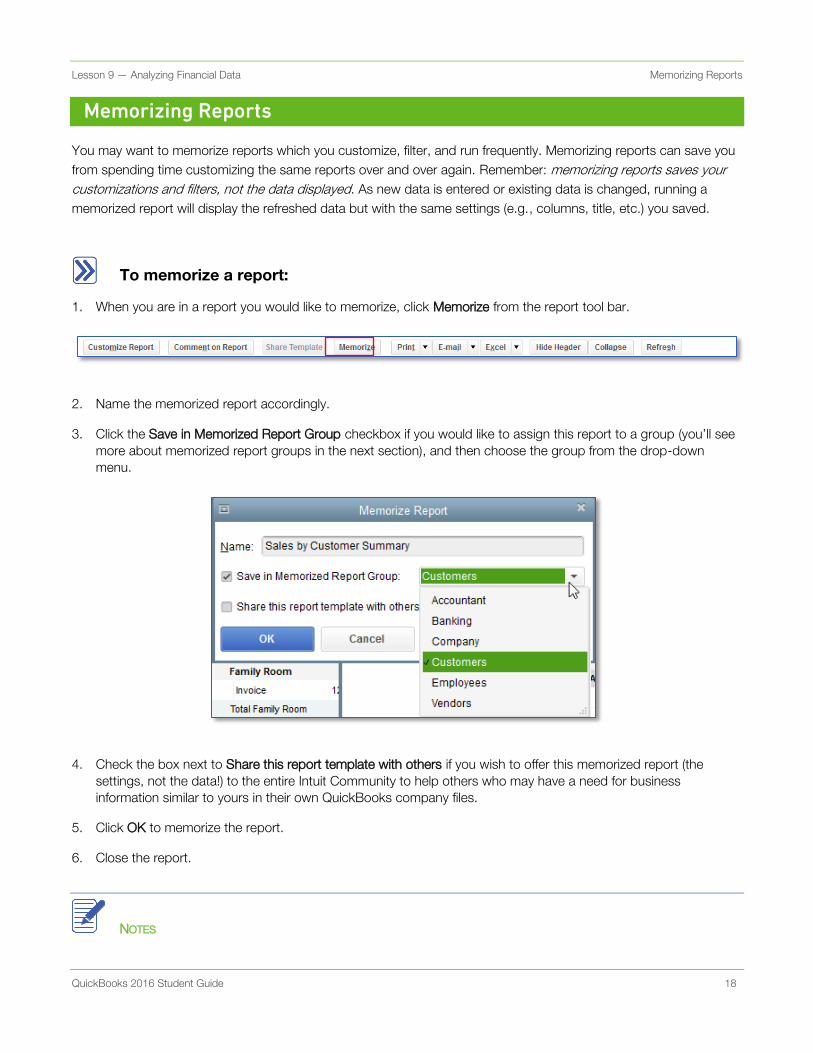
When you are in a report you would like to memorize, click Memorize from the report tool bar. 1.
Name the memorized report accordingly. 2.
Click the Save in Memorized Report Group checkbox if you would like to assign this report to a group (you’ll see 3.
more about memorized report groups in the next section), and then choose the group from the drop-down
menu.
Check the box next to Share this report template with others if you wish to offer this memorized report (the 4.
settings, not the data!) to the entire Intuit Community to help others who may have a need for business
information similar to yours in their own QuickBooks company files.
Click OK to memorize the report. 5.
Close the report. 6.
NOTES
Lesson 9 — Analyzing Financial Data Creating Memorized Report Groups
QuickBooks 2016 Student Guide 19
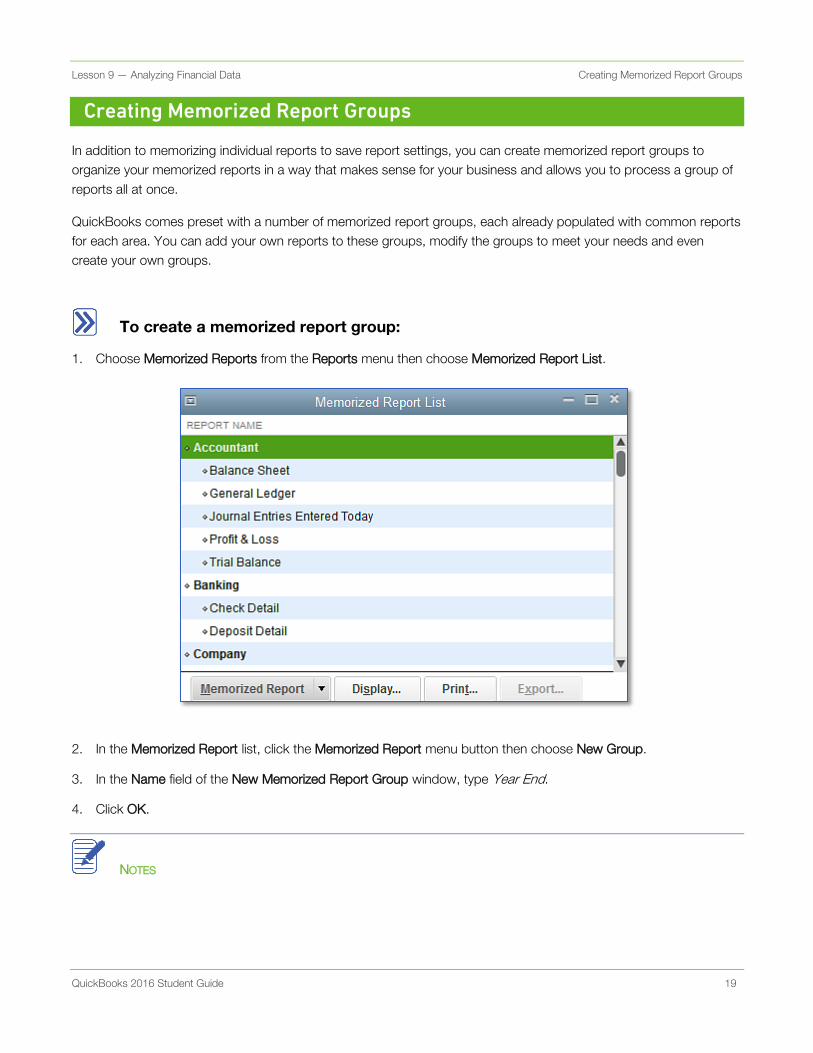
Creating Memorized Report Groups
In addition to memorizing individual reports to save report settings, you can create memorized report groups to
organize your memorized reports in a way that makes sense for your business and allows you to process a group of
reports all at once.
QuickBooks comes preset with a number of memorized report groups, each already populated with common reports
for each area. You can add your own reports to these groups, modify the groups to meet your needs and even
create your own groups.
To create a memorized report group:
Choose Memorized Reports from the Reports menu then choose Memorized Report List. 1.
In the Memorized Report list, click the Memorized Report menu button then choose New Group. 2.
In the Name field of the New Memorized Report Group window, type Year End. 3.
Click OK. 4.
NOTES
Lesson 9 — Analyzing Financial Data Printing Reports
QuickBooks 2016 Student Guide 20
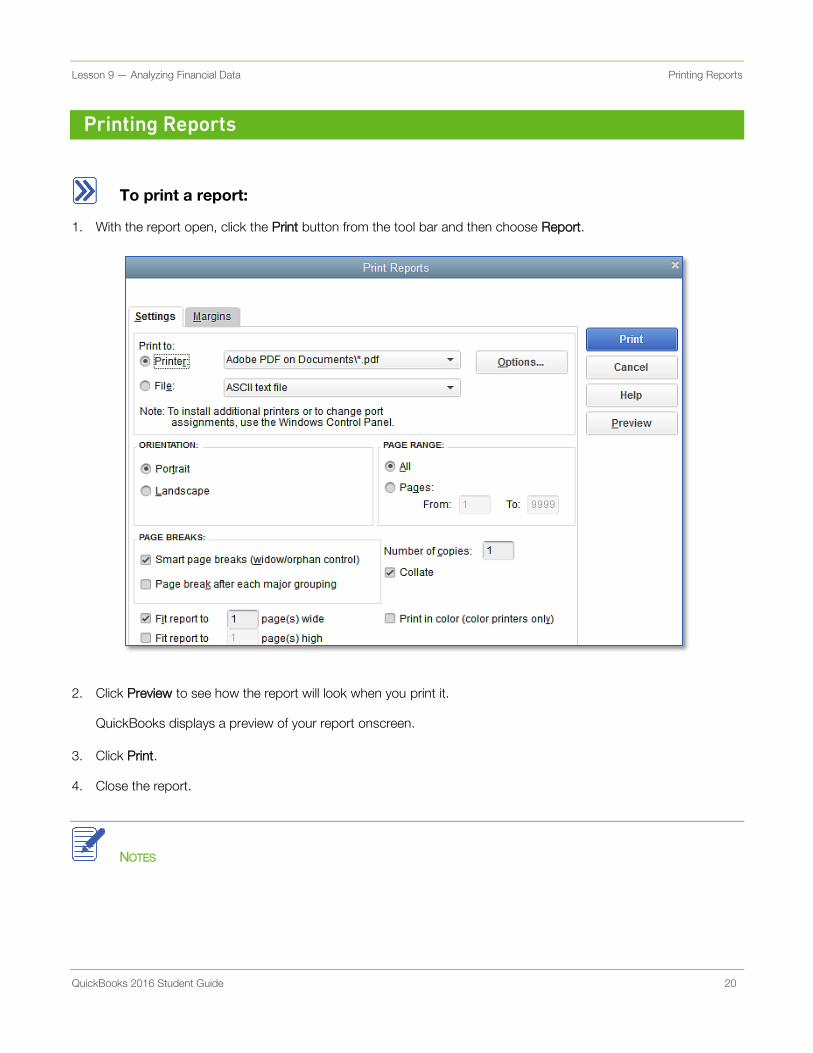
Printing Reports
To print a report:
With the report open, click the Print button from the tool bar and then choose Report. 1.
Click Preview to see how the report will look when you print it. 2.
QuickBooks displays a preview of your report onscreen.
Click Print. 3.
Close the report. 4.
NOTES
Lesson 9 — Analyzing Financial Data Processing Reports in Groups
QuickBooks 2016 Student Guide 21
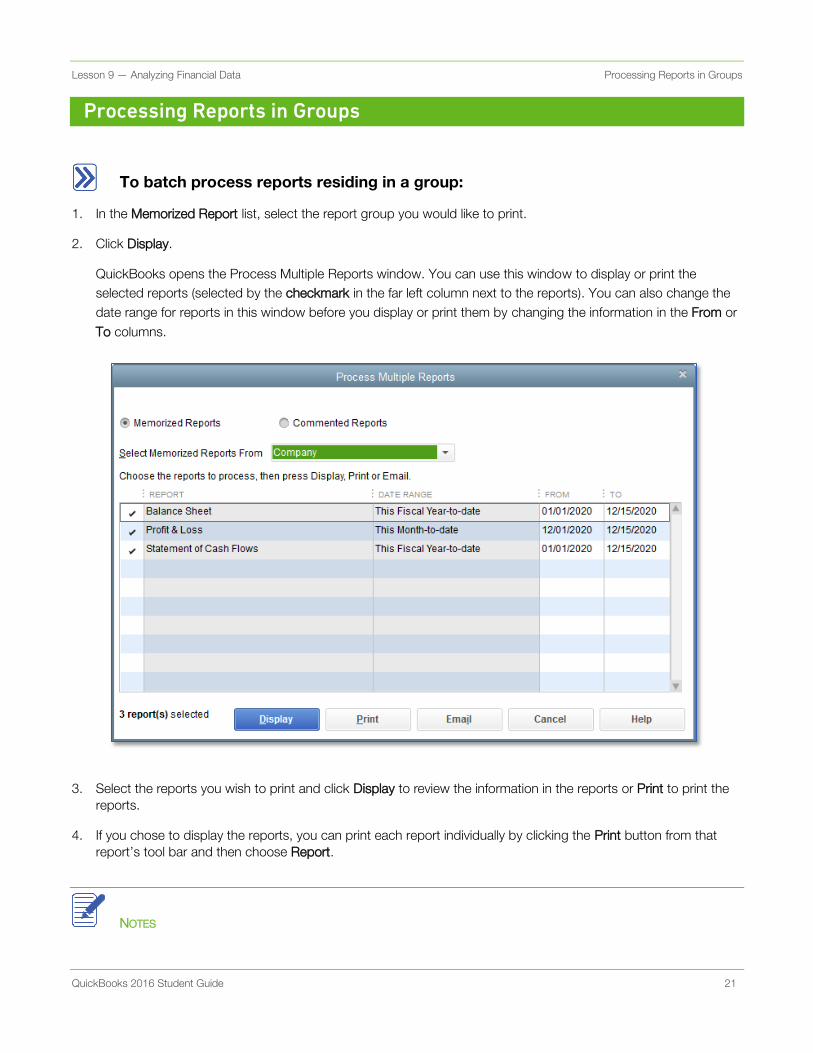
Processing Reports in Groups
To batch process reports residing in a group:
In the Memorized Report list, select the report group you would like to print. 1.
Click Display. 2.
QuickBooks opens the Process Multiple Reports window. You can use this window to display or print the
selected reports (selected by the checkmark in the far left column next to the reports). You can also change the
date range for reports in this window before you display or print them by changing the information in the From or
To columns.
Select the reports you wish to print and click Display to review the information in the reports or Print to print the 3.
reports.
If you chose to display the reports, you can print each report individually by clicking the Print button from that 4.
report’s tool bar and then choose Report.
NOTES
Lesson 9 — Analyzing Financial Data Processing Multiple Miscellaneous Reports
QuickBooks 2016 Student Guide 22
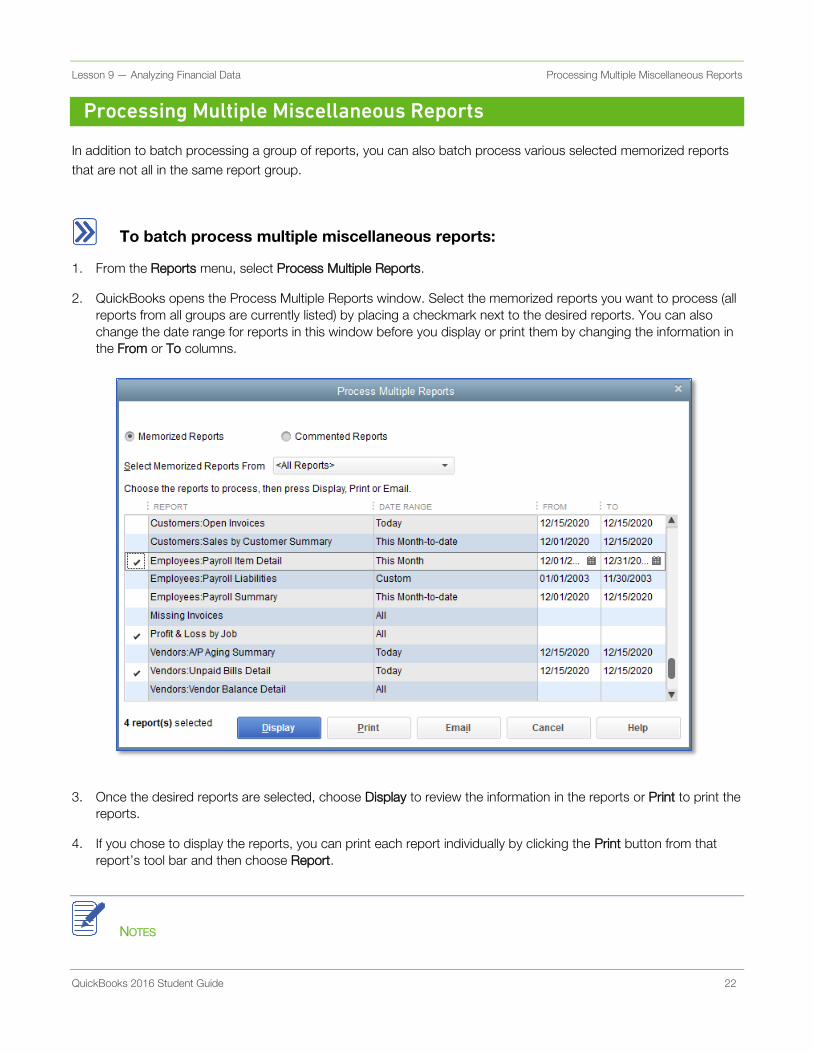
Processing Multiple Miscellaneous Reports
In addition to batch processing a group of reports, you can also batch process various selected memorized reports
that are not all in the same report group.
To batch process multiple miscellaneous reports:
From the Reports menu, select Process Multiple Reports. 1.
QuickBooks opens the Process Multiple Reports window. Select the memorized reports you want to process (all 2.
reports from all groups are currently listed) by placing a checkmark next to the desired reports. You can also
change the date range for reports in this window before you display or print them by changing the information in
the From or To columns.
Once the desired reports are selected, choose Display to review the information in the reports or Print to print the 3.
reports.
If you chose to display the reports, you can print each report individually by clicking the Print button from that 4.
report’s tool bar and then choose Report.
NOTES
Lesson 9 — Analyzing Financial Data Sending a Report to Microsoft Excel
QuickBooks 2016 Student Guide 23
Sending a Report to Microsoft Excel®
Occasionally, you may want to change a report’s appearance or contents in ways that aren’t available in
QuickBooks, filter report data in ways you can’t in QuickBooks, or run “what-if” scenarios on your QuickBooks data.
You can send reports from QuickBooks to Microsoft Excel. Since the changes you make in Excel don’t affect your
QuickBooks data, you’re free to customize reports as needed and even change data to run “what-if” scenarios.
To send a report to Microsoft Excel:
From the Reports menu, open the report you would like to convert to Excel. 1.
On the Report button bar, set the date parameters for your report. You can use the Customize button to set 2.
additional filters and add additional customization.
If you clicked on the Customize button in the previous step, after you’ve specified your additional customization 3.
parameters, click OK.
On the Report button bar, click Excel and Create New Worksheet (or you could select Update Existing 4.
Worksheet if this report with these settings was previously sent to a spreadsheet that was saved).
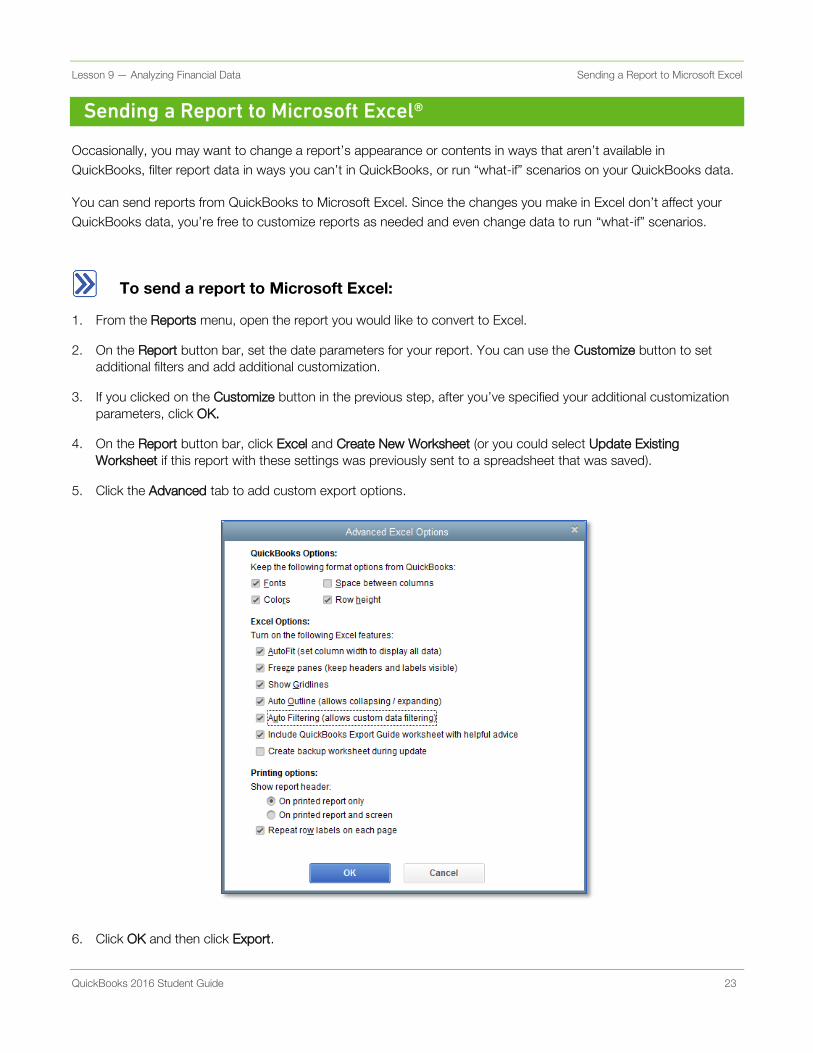
Click the Advanced tab to add custom export options. 5.
Click OK and then click Export.6.
Lesson 9 — Analyzing Financial Data Creating an Income and Expense Graph
QuickBooks 2016 Student Guide 24
Creating an Income and Expense Graph
If you want your business to be profitable, you need to keep an eye on your expenses. The income and expense
graph shows you exactly what you’re spending and where.
You should be especially concerned with the proportion you’re spending on expenses relative to the income you
receive. As a simplistic example, if you’re earning only $20,000 in income, you don’t want to spend $30,000 in
expenses.
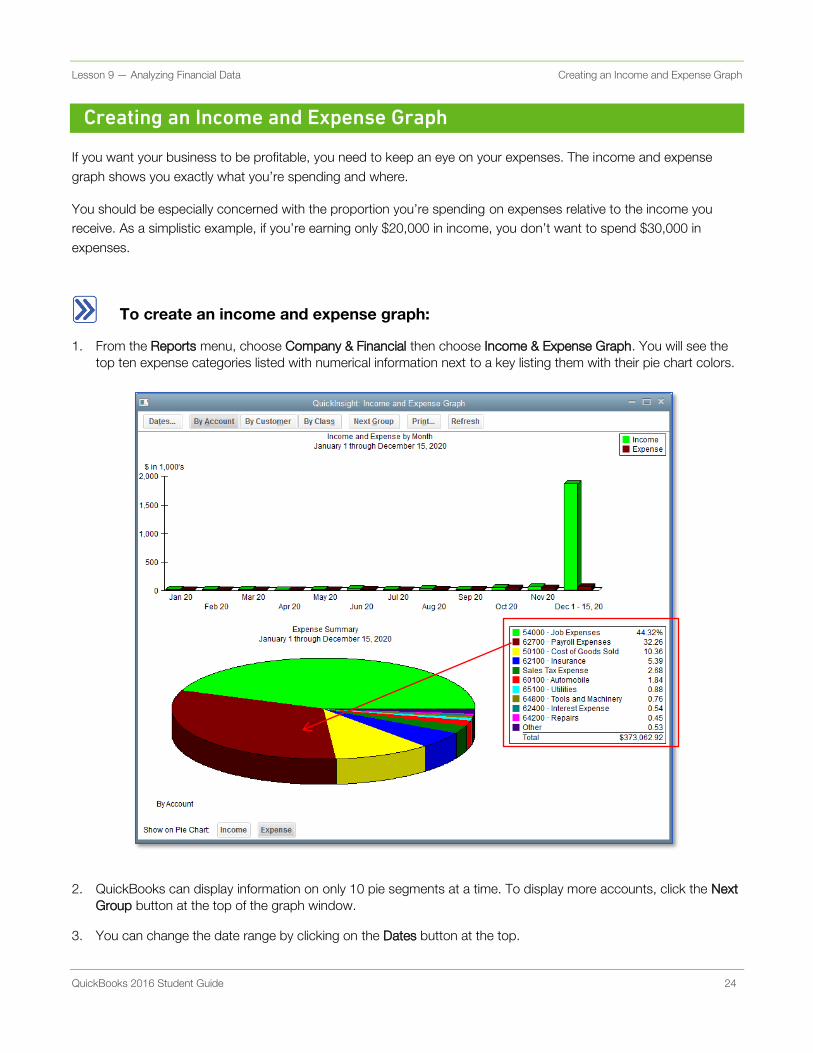
To create an income and expense graph:
From the Reports menu, choose Company & Financial then choose Income & Expense Graph. You will see the 1.
top ten expense categories listed with numerical information next to a key listing them with their pie chart colors.
QuickBooks can display information on only 10 pie segments at a time. To display more accounts, click the Next 2.
Group button at the top of the graph window.
You can change the date range by clicking on the Dates button at the top. 3.
Lesson 9 — Analyzing Financial Data Creating an Income and Expense Graph
QuickBooks 2016 Student Guide 25
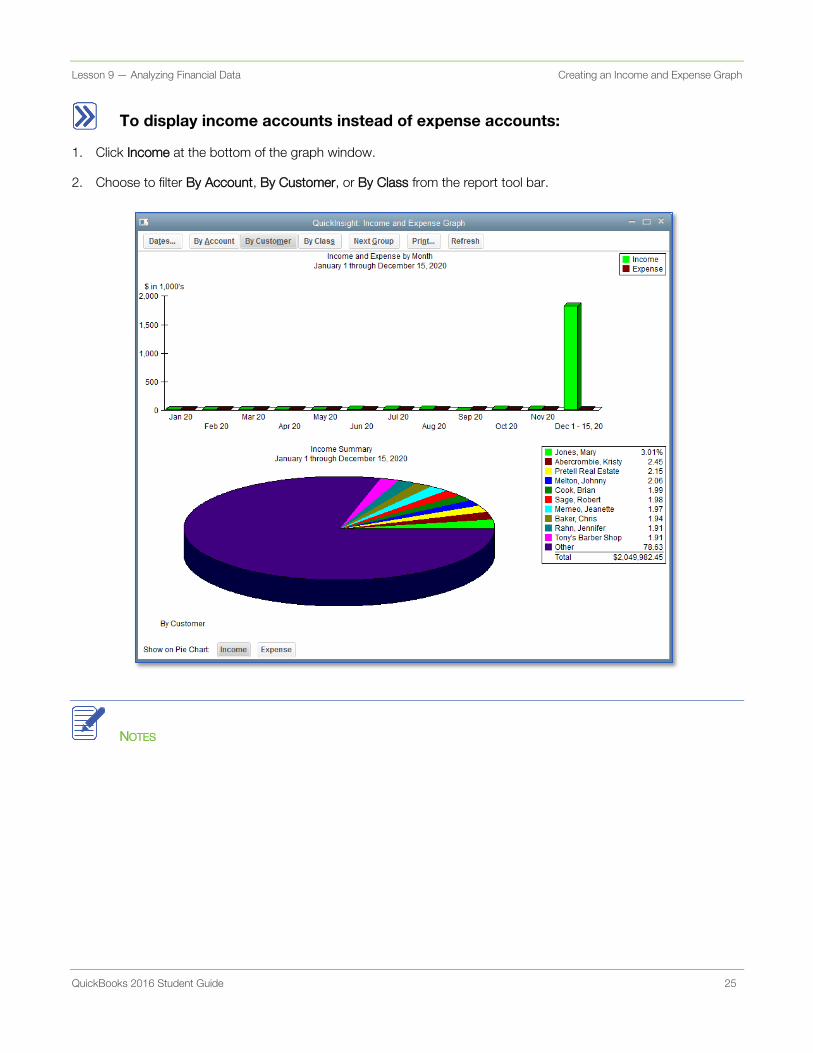
To display income accounts instead of expense accounts:
Click Income at the bottom of the graph window. 1.
Choose to filter By Account, By Customer, or By Class from the report tool bar. 2.
NOTES
Lesson 9 — Analyzing Financial Data Using QuickZoom with Graphs
QuickBooks 2016 Student Guide 26
Using QuickZoom with Graphs
To help you better understand the information shown in the graphs, QuickBooks lets you trace graphical data using
QuickZoom graphs. This works in a fashion very similar to the QuickZoom functionality on report entries described
earlier in this lesson.
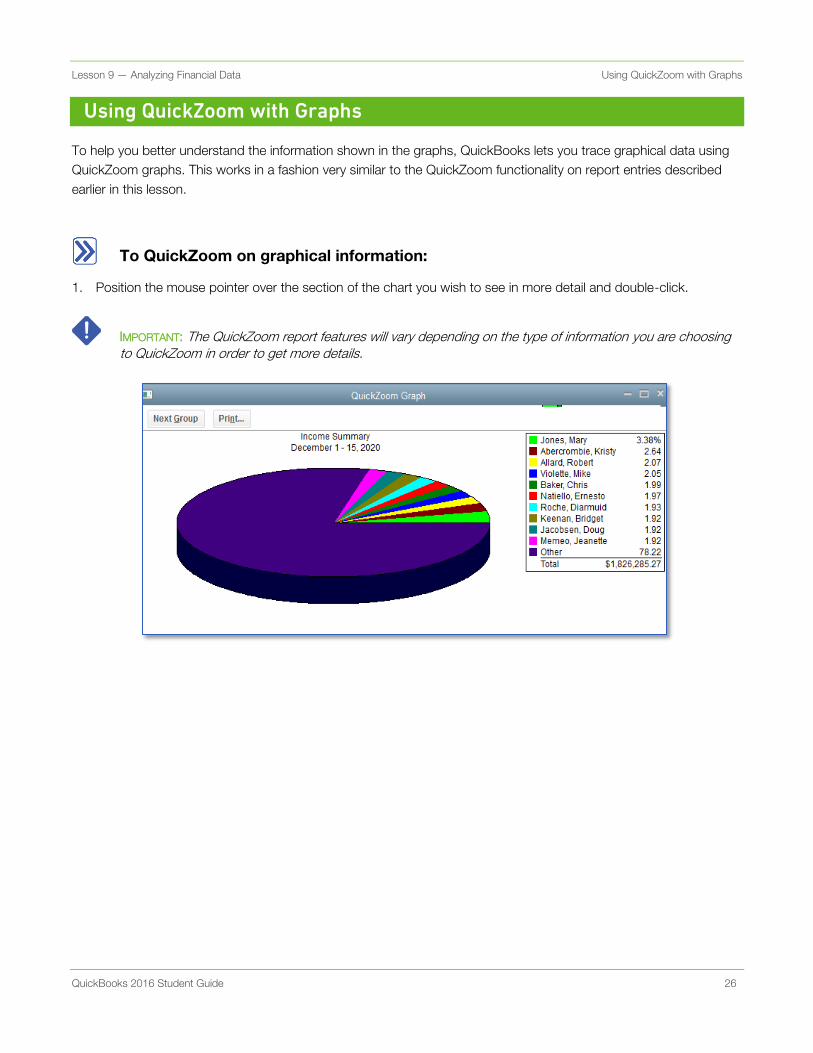
To QuickZoom on graphical information:
Position the mouse pointer over the section of the chart you wish to see in more detail and double-click. 1.
IMPORTANT: The QuickZoom report features will vary depending on the type of information you are choosing to QuickZoom in order to get more details.
Lesson 9 — Analyzing Financial Data Customizing How Graphs Display
QuickBooks 2016 Student Guide 27
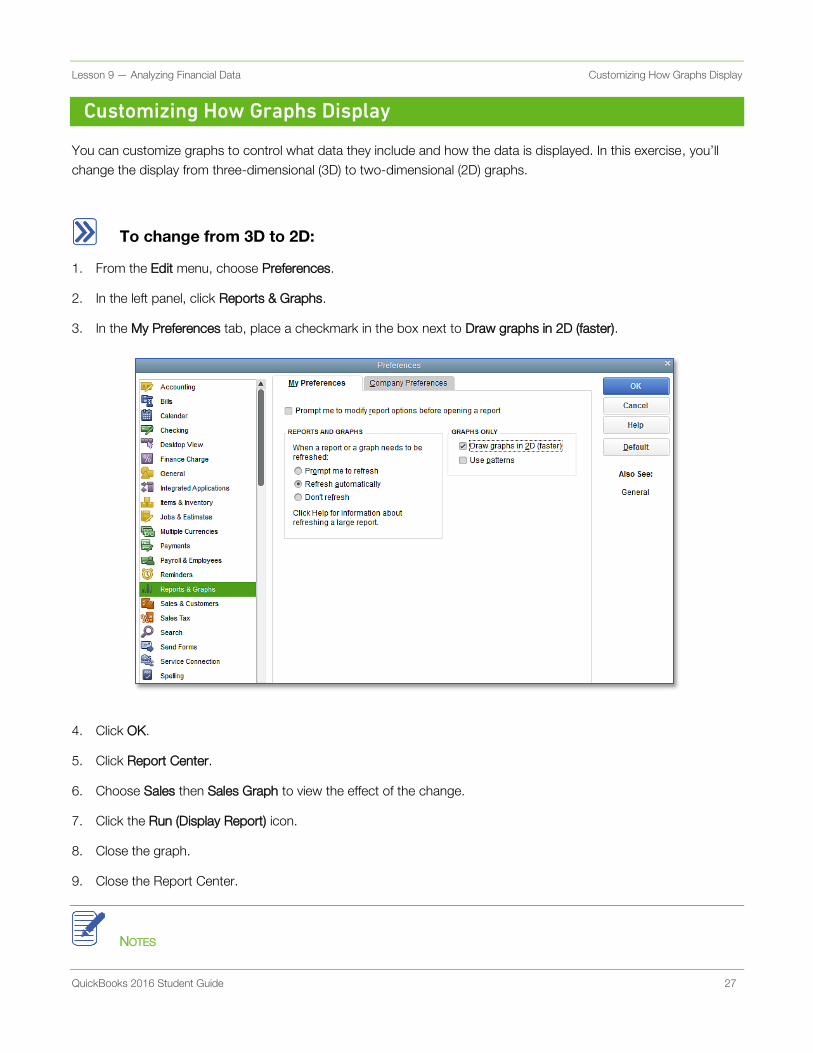
Customizing How Graphs Display
You can customize graphs to control what data they include and how the data is displayed. In this exercise, you’ll
change the display from three-dimensional (3D) to two-dimensional (2D) graphs.
To change from 3D to 2D:
From the Edit menu, choose Preferences. 1.
In the left panel, click Reports & Graphs. 2.
In the My Preferences tab, place a checkmark in the box next to Draw graphs in 2D (faster). 3.
Click OK. 4.
Click Report Center. 5.
Choose Sales then Sales Graph to view the effect of the change. 6.
Click the Run (Display Report) icon. 7.
Close the graph. 8.
Close the Report Center. 9.
NOTES
Lesson 9 — Analyzing Financial Data Analyzing Financial Data — Review Questions
QuickBooks 2016 Student Guide 28
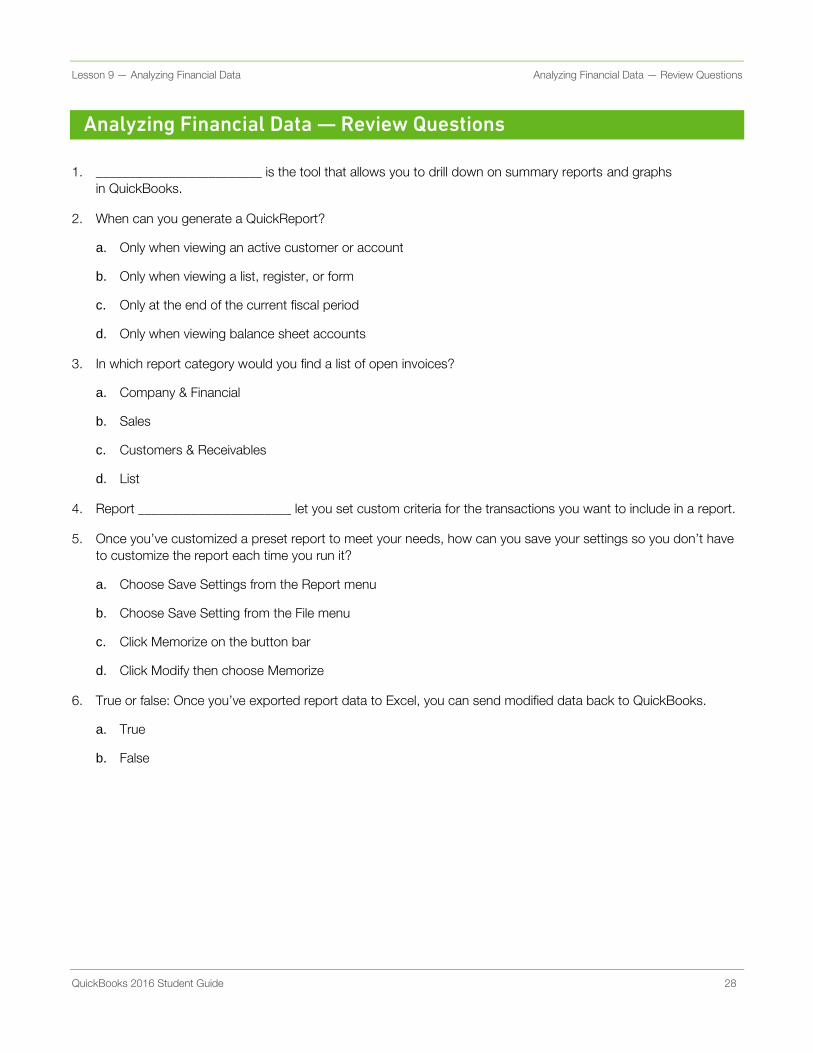
Analyzing Financial Data — Review Questions
_________________________ is the tool that allows you to drill down on summary reports and graphs 1.
in QuickBooks.
When can you generate a QuickReport? 2.
a. Only when viewing an active customer or account
b. Only when viewing a list, register, or form
c. Only at the end of the current fiscal period
d. Only when viewing balance sheet accounts
In which report category would you find a list of open invoices? 3.
a. Company & Financial
b. Sales
c. Customers & Receivables
d. List
Report _______________________ let you set custom criteria for the transactions you want to include in a report. 4.
Once you’ve customized a preset report to meet your needs, how can you save your settings so you don’t have 5.
to customize the report each time you run it?
a. Choose Save Settings from the Report menu
b. Choose Save Setting from the File menu
c. Click Memorize on the button bar
d. Click Modify then choose Memorize
True or false: Once you’ve exported report data to Excel, you can send modified data back to QuickBooks. 6.
a. True
b. False
Lesson 9 — Analyzing Financial Data Review Activities
QuickBooks 2016 Student Guide 29
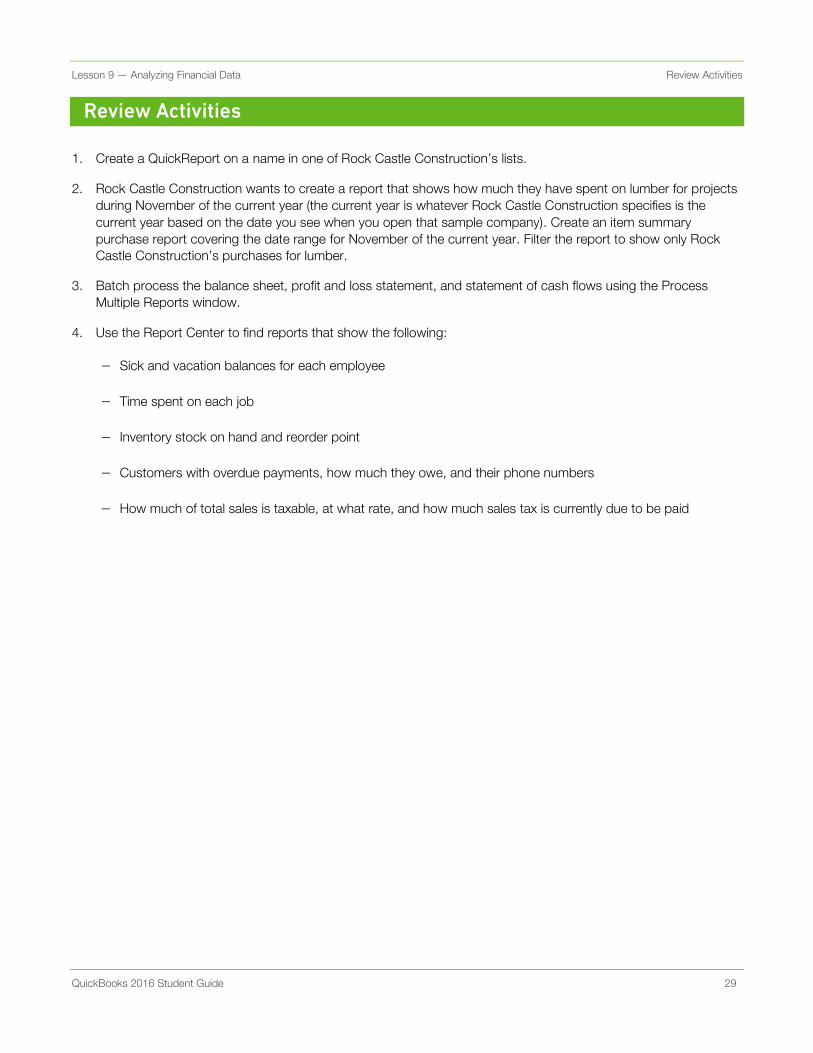
Review Activities
Create a QuickReport on a name in one of Rock Castle Construction’s lists. 1.
Rock Castle Construction wants to create a report that shows how much they have spent on lumber for projects 2.
during November of the current year (the current year is whatever Rock Castle Construction specifies is the
current year based on the date you see when you open that sample company). Create an item summary
purchase report covering the date range for November of the current year. Filter the report to show only Rock
Castle Construction’s purchases for lumber.
Batch process the balance sheet, profit and loss statement, and statement of cash flows using the Process 3.
Multiple Reports window.
Use the Report Center to find reports that show the following: 4.
Sick and vacation balances for each employee
Time spent on each job
Inventory stock on hand and reorder point
Customers with overdue payments, how much they owe, and their phone numbers
How much of total sales is taxable, at what rate, and how much sales tax is currently due to be paid

Lesson 9 — Analyzing Financial Data Answers to Review Questions
QuickBooks 2016 Student Guide 30
Answers to Review Questions
QuickZoom is the tool that allows you to drill down on summary reports and graphs in QuickBooks. 1.
When can you generate a QuickReport? 2.
a. Only when viewing an active customer or account
b. Only when viewing a list, register, or form
c. Only at the end of the current fiscal period
d. Only when viewing balance sheet accounts
In which report category would you find a list of open invoices? 3.
a. Company & Financial
b. Sales
c. Customers & Receivables
d. List
Report filters let you set custom criteria for the transactions you want to include in a report. 4.
Once you’ve customized a preset report to meet your needs, how can you save your settings so you don’t have 5.
to customize the report each time you run it?
a. Choose Save Settings from the Report menu
b. Choose Save Setting from the File menu
c. Click Memorize on the button bar
d. Click Modify, and then choose Memorize
True or false: Once you’ve exported report data to Excel, you can send modified data back to QuickBooks. 6.
a. True
b. False