Quenching H O Residuals After UV/ H O Drinking Water … · · 2013-12-05Drinking Water Treatment...
141
Quenching H 2 O 2 Residuals After UV/ H 2 O 2 Drinking Water Treatment Using Granular Activated Carbon by Jinghong Li A thesis submitted in conformity with the requirements for the degree of Masters of Applied Science Graduate Department of Civil Engineering University of Toronto © Copyright by Jinghong Li (2013)
Transcript of Quenching H O Residuals After UV/ H O Drinking Water … · · 2013-12-05Drinking Water Treatment...

Quenching H2O2 Residuals After UV/ H2O2 Drinking Water
Treatment Using Granular Activated Carbon
by
Jinghong Li
A thesis submitted in conformity with the requirements
for the degree of Masters of Applied Science
Graduate Department of Civil Engineering
University of Toronto
© Copyright by Jinghong Li (2013)

ii
Quenching H2O2 Residuals After UV/ H2O2 Drinking Water
Treatment Using Granular Activated Carbon
Jinghong Li
Department of Civil Engineering, University of Toronto
Degree of Masters of Applied Science
ABSTRACT
The ability of six types of granular activated carbon (GAC) to quench H2O2 was
evaluated by bench-scale H2O2 decomposition kinetics tests and pilot-scale H2O2 breakthrough
tests. Bench-scale studies showed that carbon ageing significantly reduced the performance of
H2O2 quenching by the GAC, but that the greatest impacts occurred within the first 25 000 bed
volumes of water treated, with performance tending to stabilize afterwards. Pilot-scale studies
suggested that both H2O2 exposure and exposure to natural organic matter were important factors
in GAC ageing, with exposure to oxygen also suspected of being important. A continuously
stirred tank reactor (CSTR)-in-series model was proposed for the prediction of H2O2
breakthrough in a GAC column.

iii
ACKNOWLEDGEMENTS
I would like to thank Professor Robert Andrews for introducing me to the Drinking Water
Research Group. I appreciate such a great chance to learn from other excellent students and
professors in the group.
My appreciation would also go to my supervisor, Professor Ron Hofmann. Thanks for his
guidance, patience and inspiration. As a new project, we had lots of unknowns at the beginning.
Thanks Professor Hofmann for sharing his insights and thoughts.
I am really thankful to the Post doc fellow in our group, Dr. Arash Zamyadi. Thanks for
the contribution on the pilot-scale installation and breakthrough tests. The project would not
move on without Arash’s biggest help.
Thanks to the Region of Peel for funding this project, and providing us the chance to
build up pilot-scale columns on site.
Thanks to all the people in the drinking water research group, especially Emma, for
sharing her thoughts and answering my tons of questions.
My deepest thank would go to my dear family. Thanks for the warmest support when I
am studying abroad.

iv
TABLE OF CONTENTS ABSTRACT ......................................................................................................................... ii
ACKNOWLEDGEMENTS .................................................................................................. iii
TABLE OF CONTENTS ..................................................................................................... iv
LIST OF TABLES ............................................................................................................... ix
LIST OF FIGURES .............................................................................................................. xi
GLOSSARY ...................................................................................................................... xiii
1 INTRODUCTION AND RESEARCH OBJECTIVES ..................................................... 1
1.1 INTRODUCTION ..................................................................................................................... 1
1.2 RESEARCH OBJECTIVES ........................................................................................................ 1
1.3 DESCRIPTION OF CHAPTERS ................................................................................................. 2
1.4 REFERENCES ......................................................................................................................... 3
2 LITERATURE REVIEW ................................................................................................ 4
2.1 FUNDAMENTALS OF ULTRAVIOLET LIGHT / HYDROGEN PEROXIDE ................................... 4
2.1.1 Background ................................................................................................................ 4
2.1.2 The Need to Quench Hydrogen Peroxide Residuals.................................................. 4
2.2 FUNDAMENTALS OF GRANULAR ACTIVATED CARBON (GAC) .......................................... 5
2.3 HETEROGENEOUS CATALYSIS OF GAC FOR QUENCHING OZONE AND CL2 ....................... 5
2.3.1 Reaction of Chlorine Decomposition Using GAC ..................................................... 5
2.3.2 GAC for Ozone Decomposition ................................................................................. 6
2.4 QUENCHING OF HYDROGEN PEROXIDE BY GAC ................................................................. 9
2.4.1 Quenching Mechanism .............................................................................................. 9
2.4.2 Kinetics of the Quenching Process .......................................................................... 17
2.5 SUMMARY ........................................................................................................................... 18
2.6 REFERENCES ....................................................................................................................... 20
3 BENCH-SCALE ANALYSIS OF THE EFFECT OF H2O2 EXPOSURE AND CARBON
TYPE ON H2O2 QUENCHING USING GAC ..................................................................... 24
v
ABSTRACT ............................................................................................................................. 24
3.1 INTRODUCTION ................................................................................................................... 25
3.2 OBJECTIVE .......................................................................................................................... 26
3.3 MATERIAL AND METHODS ................................................................................................. 27
3.3.1 Carbon Preparation .................................................................................................. 27
3.3.2 Carbon Characterization .......................................................................................... 29
3.3.3 H2O2 Decomposition Kinetics Tests in the Presence of GAC ................................. 30
3.4 RESULTS AND DISCUSSION ................................................................................................. 31
3.4.1 Effect of Carbon Age on the Quenching of H2O2 .................................................... 31
3.4.2 Effect of the Addition of H2O2 during the Ageing Process ..................................... 35
3.5 SUMMARY AND CONCLUSION ............................................................................................ 44
3.6 RECOMMENDATIONS FOR FUTURE WORK ......................................................................... 45
3.7 REFERENCES ....................................................................................................................... 46
4 PILOT-SCALE STUDY FOR THE QUENCHING OF H2O2 USING GAC .................. 48
ABSTRACT ............................................................................................................................. 48
4.1 INTRODUCTION ................................................................................................................... 50
4.2 OBJECTIVE .......................................................................................................................... 50
4.3 MATERIAL AND METHODS ................................................................................................. 51
4.3.1 Pilot-Scale Set-up..................................................................................................... 51
4.3.2 Tests to Study Quenching Performance ................................................................... 53
4.4 RESULTS AND DISCUSSION ................................................................................................. 54
4.4.1 H2O2 Breakthrough Tests ......................................................................................... 54
4.4.2 Validation of Bench-scale H2O2 Decomposition Kinetics Tests ............................. 57
4.4.3 XPS Analysis ........................................................................................................... 60
4.4.4 SEM Imaging ........................................................................................................... 63
4.4.5 Study of Full-scale GAC Samples ........................................................................... 66
4.5 SUMMARY AND CONCLUSION ............................................................................................ 71
4.6 RECOMMENDATIONS FOR FUTURE WORK ......................................................................... 73
4.7 REFERENCES ....................................................................................................................... 74

vi
5 MODELLING HYDROGEN PEROXIDE QUENCHING WITH GRANULAR
ACTIVATED CARBON..................................................................................................... 75
ABSTRACT .................................................................................................................... 75
5.1 INTRODUCTION ................................................................................................................... 76
5.2 OBJECTIVES ........................................................................................................................ 76
5.3 MODEL DESCRIPTION AND PARAMETERS .......................................................................... 76
5.4 MODELING RESULTS AND DISCUSSION ............................................................................. 80
5.4.1 Prediction of H2O2 Effluent Breakthrough .............................................................. 80
5.4.2 Evaluation of the Accuracy of the CSTR-in-Series Model ..................................... 89
5.5 SUMMARY AND CONCLUSION ............................................................................................ 90
5.6 RECOMMENDATIONS FOR FUTURE WORK ......................................................................... 90
5.7 REFERENCES ....................................................................................................................... 91
6 SUMMARY, CONCLUSION AND RECOMMENDATIONS ...................................... 92
6.1 SUMMARY AND CONCLUSION ............................................................................................ 92
6.2 RECOMMENDATIONS FOR FUTURE WORK ......................................................................... 93

vii
APPENDICES
A: EXPERIMENTAL PROTOCOLS .................................................................................. 95
A.1 CARBON PROPERTY DETERMINATION .............................................................................. 96
A.1.1 Apparent density measurement ............................................................................... 96
A.1.2 Iodine number test ................................................................................................... 96
A.1.3 Trace capacity number test ..................................................................................... 96
A.2 TOTAL ORGANIC CARBON ANALYSIS ............................................................................... 96
A.3 CARBON DRYING ............................................................................................................... 96
REFERENCE ............................................................................................................................... 96
B: PRELIMINARY TESTS ................................................................................................ 97
B.1 MODELING WITH ADDESIGNSTM
....................................................................................... 98
B.1.1 Introduction ............................................................................................................. 98
B.1.2 Parameters Required in AdDesignSTM
.................................................................... 99
B.1.3 Testing Model Assumptions.................................................................................... 99
B.1.4 Results from the PSDM......................................................................................... 101
B.1.5 Summary and Conclusions .................................................................................... 103
B.1.6 Supplementary Information................................................................................... 104
B.1.7 References ............................................................................................................. 113
B.2 INVESTIGATION OF THE GAC CAPACITY FOR QUENCHING H2O2 .................................. 114
B.2.1 Pre-loading GAC with H2O2 ................................................................................. 114
B.2.2 H2O2 Decomposition Kinetics Pre-test ................................................................. 115
C: QA/QC ......................................................................................................................... 117
QUALITY CONTROL TEST FOR FREEZE-DRYING METHOD .................................................... 118
D: SUPPLEMENTARY DATA ........................................................................................ 120
D.1 H2O2 DECOMPOSITION KINETICS TEST USING GAC FROM PILOT-SCALE COLUMNS .... 121
D.2 CSTR-IN-SERIES MODEL DEVELOPMENT FOR ALL TYPES OF GAC ............................. 123
D.2.1 Selection of Parameters for k Expression ............................................................. 123

viii
D.2.2 Model for Each GAC ............................................................................................ 124
D.3 PILOT-SCALE INSTALLATION AT THE LORNE PARK WATER TREATMENT FACILITY .... 126

ix
LIST OF TABLES
Table 2.1: Experimental Conditions in Aqueous GAC-Ozone Studies ........................................................ 8 Table 2.2: Experimental Conditions in GAC-H2O2 Studies ....................................................................... 13 Table 2.3: GAC-H2O2 Studies in Drinking Water Applications ................................................................. 16 Table 2.4: Information of Experimental Set-up in Related Studies ............................................................ 18
Table 3.1: Carbon Pre-Exposure Operating Conditions ............................................................................. 28 Table 3.2: GAC adsorption and physical property test results .................................................................... 29 Table 3.3: Experimental Conditions for the H2O2 Kinetics Test in the Presence of GAC.......................... 31 Table 3.4: One-way ANOVA Results for the Effect of Carbon Age .......................................................... 34 Table 3.5: Tukey’s Post-hoc Test Results for HSD Analysis ..................................................................... 34 Table 3.6: Results of the Effect of H2O2 Addition during the Ageing Process ........................................... 37 Table 3.7: Two-way ANOVA Results ........................................................................................................ 38 Table 3.8: Comparison of H2O2 Quenching Performance among six GACs .............................................. 39 Table 3.9: Surface Functional Groups Analysis from XPS ........................................................................ 42
Table 4.1: Lorne Park GAC Contactors ...................................................................................................... 51 Table 4.2: Water Quality of Membrane Permeate ...................................................................................... 53 Table 4.3: Pilot-scale Columns Ageing Conditions .................................................................................... 53 Table 4.4: H2O2 Difference (mg/L) between GAC Aged with/without H2O2 ............................................. 56 Table 4.5: Ranking of GAC Performance for the Quenching of H2O2 ....................................................... 57 Table 4.6: Comparison of Pilot-scale GAC and Accelerated Ageing Test GAC ....................................... 58 Table 4.7: Student t-test for k Values Different between Pilot-scale and Accelerated Ageing Test GAC . 58 Table 4.8: Effect of the H2O2 Exposure during the Ageing Process on H2O2 Removal ............................. 60 Table 4.9: Percentage Difference of O and N Components between Aged and Virgin GAC .................... 62 Table 4.10: Surface Functional Group Analysis from XPS (25 000 bed volumes) .................................... 63 Table 4.11: Surface Functional Group Analysis from XPS (45 000 bed volumes) .................................... 63
Table 5.1: Multiple Regression Fitting Results........................................................................................... 79 Table 5.2: Adjustment of k Value from a Batch Reactor to a Column ....................................................... 80 Table 5.3: Paired t-test Results for the Difference between Model Prediction and Pilot-scale Data .......... 89
Table B.1: User Input for Modeling ............................................................................................................ 99 Table B.2: Parameters Calculated by Software........................................................................................... 99 Table B.3: Comparison of Different SPDFR ............................................................................................ 100 Table B.4: PSDM Results with Different Values of Freundlich Parameter .............................................. 101 Table B.5: Comparison of Pilot Scale Result and the PSDM Results ...................................................... 103
Table C.1: Comparison between Freeze-dried and Non-freeze Dried Virgin GAC ................................. 118 Table C.2: Comparison between Freeze-dried and Non-freeze Dried Aged GAC ................................... 118 Table C.3: Student t-test Result for Virgin GAC ...................................................................................... 119 Table C.4: Student t-test Result for Aged GAC ........................................................................................ 119

x
Table D.1: Comparison of Multiple Regression Fitting............................................................................ 123 Table D.2: Running Conditions for Each Column .................................................................................... 127

xi
LIST OF FIGURES
Figure 3.1: TOC Breakthrough Profile (C: effluent TOC; C0: influent TOC) ............................................ 28 Figure 3.2: Comparison of virgin Centaur and Centaur aged with NOM ................................................... 32 Figure 3.3: Comparison of virgin ADCAT and ADCAT aged with NOM ................................................ 32 Figure 3.4: Comparison of virgin GAC300 and GAC300 aged with NOM ............................................... 32 Figure 3.5: Comparison of virgin F300 and F300 aged with NOM ............................................................ 33 Figure 3.6: Comparison of virgin HD3000 and HD3000 aged with NOM ................................................ 33 Figure 3.7: Comparison of virgin TN5 and TN5 aged with NOM ............................................................. 33 Figure 3.8: Comparison of virgin Centaur and Centaur aged with NOM+H2O2 ........................................ 35 Figure 3.9: Comparison of virgin ADCAT and ADCAT aged with NOM+H2O2 ...................................... 35 Figure 3.10: Comparison of virgin F300 and F300 aged with NOM+H2O2 ............................................... 36 Figure 3.11: Comparison of virgin GAC300 and GAC300 aged with NOM+H2O2 ................................... 36 Figure 3.12: Comparison of virgin HD3000 and HD3000 aged with NOM+H2O2 .................................... 36 Figure 3.13: Comparison of virgin TN5 and TN5 aged with NOM+H2O2 ................................................. 37 Figure 3.14: Surface Elemental Analysis from XPS ................................................................................... 40 Figure 3.15: Spectrum of High-resolution Scanning for Carbon Bonding-Virgin Centaur ........................ 41 Figure 3.16: Spectrum of High-resolution Scanning for Carbon Bonding - Aged Centaur ........................ 41 Figure 3.17: SEM images for Centaur ........................................................................................................ 42 Figure 3.18: SEM images for ADCAT ....................................................................................................... 43 Figure 3.19: SEM images for F300 ............................................................................................................. 43 Figure 3.20: SEM images for GAC300 ...................................................................................................... 43 Figure 3.21: SEM images for HD3000 ....................................................................................................... 44 Figure 3.22: SEM images for TN5.............................................................................................................. 44
Figure 4.1: Schematic of Pilot-scale Column Design ................................................................................. 52 Figure 4.2: H2O2 Breakthrough, GAC aged with NOM (25 000 bed volumes) .......................................... 54 Figure 4.3: H2O2 Breakthrough, GAC aged with NOM+4mg/L H2O2 (25 000 bed volumes) ................... 55 Figure 4.4: H2O2 Breakthrough, GAC aged with NOM (45 000 bed volumes) .......................................... 55 Figure 4.5: H2O2 Breakthrough, GAC aged with NOM+4mg/L H2O2 (45 000 bed volumes) ................... 55 Figure 4.6: Comparison of Ranking between Pilot-scale Test and Accelerated Aged Test GAC .............. 59 Figure 4.7: Comparison of Ranking between Pilot-scale Test and Accelerated Aged Test GAC .............. 59 Figure 4.8: XPS Analysis for GAC Aged with NOM, and NOM+H2O2 (25000 bed volumes) ................. 61 Figure 4.9: XPS Analysis for GAC Aged with NOM, and with NOM+H2O2 (45 000 bed volumes) ........ 61 Figure 4.10: SEM images for Centaur ........................................................................................................ 64 Figure 4.11: SEM images for ADCAT ....................................................................................................... 64 Figure 4.12: SEM images for F300 ............................................................................................................. 64 Figure 4.13: SEM images for GAC300 ...................................................................................................... 65 Figure 4.14: SEM images for HD3000 ....................................................................................................... 65 Figure 4.15: SEM images for TN5.............................................................................................................. 65 Figure 4.16: Kinetics Test Results Using Full-scale GAC ......................................................................... 68 Figure 4.17: Kinetics Test Results Using Full-scale GAC at Different Depths .......................................... 68 Figure 4.18: Kinetics Test Results Using Full-scale GAC after H2O2 Breakthrough Tests ........................ 69 Figure 4.19: XPS Analysis for Full-scale GAC Samples at Different Depths ............................................ 70 Figure 4.20: SEM Images for GAC Sample from Full-Scale Contactor .................................................... 71
Figure 5.1: CSTR in Series Model for H2O2 Effluent Breakthrough Profile Prediction ............................. 77

xii
Figure 5.2: Comparison of k Value between Model prediction and Experimental Data ............................ 79 Figure 5.3: Model Prediction and Pilot-scale Results-Centaur ................................................................... 82 Figure 5.4: Model Prediction and Pilot-scale Results -ADCAT ................................................................. 83 Figure 5.5: Model Prediction and Pilot-scale Results -F300 ...................................................................... 84 Figure 5.6: Model Prediction and Pilot-scale Results -GAC300 ................................................................ 86 Figure 5.7: Model Prediction and Pilot-scale Results -HD3000 ................................................................. 87 Figure 5.8: Model Prediction and Pilot-scale Results -TN5 ....................................................................... 88
Figure B.1: PSDM Result with Organic Free Water................................................................................. 101 Figure B.2: Pilot Test Result from Peel Report ........................................................................................ 102 Figure B.3: Effect of NOM Fouling on GAC ........................................................................................... 103 Figure B.4: H2O2 Properties ...................................................................................................................... 104 Figure B.5: Fixed Bed Properties .............................................................................................................. 104 Figure B.6: Carbon Properties .................................................................................................................. 105 Figure B.7: Polanyi Parameters Calculated by AdDesignS
TM .................................................................. 105
Figure B.8: Dimensionless Groups Calculated by AdDesignSTM
............................................................. 105 Figure B.9: Kinetics Parameters Estimated by AdDesignS
TM .................................................................. 106
Figure B.10: H2O2 effluent concentration profiles with different kf and Ds .............................................. 110 Figure B.11: Bed Volume Treated at 50% Breakthrough with Different Freundlich Parameters ............ 110 Figure B.12: Empirical Kinetics Constants in NOM fouling Correlation................................................. 111 Figure B.13: Empirical Constants for specific chemical group with reference of TCE ........................... 111 Figure B.14: Modeling results for NOM fouling ...................................................................................... 112 Figure B.15: Cumulative H2O2 Quenched by Per Gram GAC.................................................................. 114 Figure B.16: Kinetics Test Results for Different Low Concentrations of H2O2 ....................................... 116 Figure D.1: Kinetics Test Results using GAC aged with NOM from Pilot-scale Column ....................... 121 Figure D.2: Kinetics Test Results using GAC aged with NOM+H2O2 from Pilot-scale Column ............ 121 Figure D.3: Kinetics Test Results using GAC aged with NOM from Pilot-scale Column ....................... 122 Figure D.4: Kinetics Test Results using GAC aged with NOM+H2O2 from Pilot-scale Column ............ 122 Figure D.5: Pilot-scale Installation at the Lorne Park Water Treatment Facility ..................................... 126 Figure D.6: Schematic Diagram of a Pilot-scale Column ......................................................................... 127

xiii
GLOSSARY AOP advanced oxidation process
C concentration
degrees Celsius
Cl2 chlorine
cm centimeter ( 1 cm = 10-2
m)
DBPs disinfection by-products
DO dissolved oxygen
Dp pore diffusivity based on pore void fraction
Ds surface diffusion coefficient
eV electron volts (1 eV = 1.6 x 10⁻¹⁹
J)
EBCT empty bed contact time
Fe iron
GAC granular activated carbon
H2O2 hydrogen peroxide
k pseudo first-order kinetics rate constant
kf film transfer diffusion coefficient
L liter
m meter
MDL minimum detection level
mg/L milligram per liter
m/s meter per second
mol mole
NOM natural organic matter
O2 oxygen
O3 ozone
OH- hydroxide ion
OH· hydroxyl radical

xiv
qe adsorbent phase concentration in equilibrium with influent concentration
R adsorbent radius
TOC total organic carbon
UV/H2O2 ultraviolet light coupled with hydrogen peroxide
WTP water treatment plant
porosity of the GAC
ϵ fraction of volumetric space in reactor unoccupied by adsorbent
ϵp fraction of volumetric space in adsorbent phase unoccupied by adsorbent on
the pore volume fraction
∅ sphericity of the GAC
ρa adsorbent density which includes pore volume
τ retention time

1
1 INTRODUCTION AND RESEARCH OBJECTIVES
1.1 INTRODUCTION
The use of ultraviolet light coupled with hydrogen peroxide (UV/H2O2) as an advanced
oxidation treatment for taste and odor control during drinking water treatment is an emerging
technology, with a new installation at the Lorne Park Water Treatment Facility in the Region of
Peel (Ontario, Canada). A challenge with UV/H2O2 is that the majority of the applied H2O2
remains in the water following UV/H2O2 treatment, and must be removed prior to secondary
disinfection since it exerts a strong chlorine demand (Dotson et al., 2010). The Lorne Park plant
is using a granular activated carbon (GAC) contactor to quench the residual H2O2. GAC has been
used for this purpose at several other plants previously (e.g. Aurora, Colorado, and Andijk in the
Netherlands), but there is little published information about its performance.
The fundamental chemistry of H2O2 decomposition in the presence of GAC has been
reported in some previous laboratory studies (Huang et al., 2003a; Castro et al., 2009; Rey et al.,
2011), however, none of these studies were based on water treatment applications. Metz et al.
(2011a) reported that GAC can quench excess H2O2 while removing unexpected degradation
products in drinking water treatment, however, the quenching process or mechanism was not
investigated. Whether the GAC may gradually lose its H2O2 quenching ability over time, or what
factors may affect the quenching rate, are largely unknown.
It is hypothesized that the performance of GAC to quench H2O2 will be affected by the
carbon type, age (i.e., bed volumes of natural water treated) and exposure to H2O2. These factors
are explored in this study.
1.2 RESEARCH OBJECTIVES
The study addressed the following objectives:
1. To evaluate the impact of carbon ageing (25 000, 35 000 and 45000 bed volumes of water
treated) and H2O2 exposure (0mg/L and 4 mg/L) on the performance of GAC for quenching
H2O2 (six types of GAC) by bench-scale H2O2 decomposition kinetics tests.

2
2. To investigate the H2O2 (10 mg/L in the influent) breakthrough profile under different
operating conditions (in the presence or absence of H2O2 during the ageing process for 25 000
and 45 000 bed volumes of water treated) at pilot-scale.
3. To compare the performance of six different types of GAC to quench H2O2 through both
bench-scale H2O2 decomposition kinetics tests and pilot-scale H2O2 breakthrough tests results.
4. To develop a GAC contactor model that will predict effluent H2O2 concentrations as a
function of influent H2O2, empty bed contact time (EBCT), bed volumes of water containing
natural organic matter (NOM) treated, and an empirical reaction kinetic parameter.
1.3 DESCRIPTION OF CHAPTERS
Chapter 2 provides background information about previous research related to this study,
including fundamentals of ultraviolet light/hydrogen peroxide (UV/H2O2) and granular
activated carbon (GAC), heterogeneous catalysis of GAC for quenching ozone and chlorine,
and the quenching of H2O2 using GAC.
Chapter 3 evaluates the quenching of H2O2 that is aged artificially in columns with different
exposures to H2O2, to examine the impact of H2O2 exposure on the kinetics of quenching, for
different carbon types.
Chapter 4 essentially repeats the work of Chapter 3, but uses a more realistic pilot-scale set-
up at the Lorne Park Water Treatment Facility. Results from pilot-scale tests are compared to
bench-scale test results in Chapter 3.
Chapter 5 puts forward a simplified continuous stirring tank reactor (CSTR)-in-series model
to study the H2O2 residual concentration in a column.
Chapter 6 summarizes the key findings of this research and provides recommendations for
future work.

3
1.4 REFERENCES
Castro, C.S., Oliveira, L.C.A., Guerreiro, M.C., 2009. Effect of hydrogen treatment on the catalytic activity of iron oxide based materials dispersed over activated carbon: investigations toward hydrogen peroxide decomposition. Catalysis Letters 133 (1-2), 41–48.
Dotson, A., Corwin, C., Rowley, C., Downs, M., Linden, K., 2010. Dynamic bench-scale
quenching of H2O2 by GAC. Savannah, Georgia, USA: AWWA WQTC. Huang, H.H., Lu, M.C. Chen, J.N., Lee, C.T., 2003. Catalytic decomposition of hydrogen
peroxide and 4-chlorophenol in the presence of modified activated carbons. Chemosphere 51 (9), 935–943.
Metz, D.H., Meyer, M., Dotson, A., Beerendonk, E. , Dionysiou, D.D., 2011. The effect of
UV/H2O2 teatment on disinfection by-product formation potential under simulated distribution system conditions. Water Research 45 (13), 3969-3980.
Rey, A., Zazo, J.A., Casas, J.A., Bahamonde, A., Rodriguez, J.J., 2011. Influence of the
structural and surface characteristics of activated carbon on the catalytic decomposition of hydrogen peroxide. Applied Catalysis A: General 402 (1-2), 146–155.
4
2 LITERATURE REVIEW
2.1 FUNDAMENTALS OF ULTRAVIOLET LIGHT / HYDROGEN PEROXIDE
2.1.1 Background
Ultraviolet light coupled with hydrogen peroxide (UV/H2O2) can be used as an advanced
oxidation process (AOP) in drinking water or wastewater treatment. The UV/H2O2 mechanism to
generate hydroxyl radicals has been summarized by Crittenden et al. (1999) as:
H2O2 + hv 2HO• (2-1)
H2O2 + HO• H2O+ HO2• (2-2)
HO2•+ H2O2 H2O +O2 + HO• (2-3)
2 HO2• H2O2 + O2 (2-4)
2.1.2 The Need to Quench Hydrogen Peroxide Residuals
A typical UV/H2O2 process might employ up to 10 mg/L H2O2, with only 5-20% of the
applied hydrogen peroxide undergoing photolysis (Watts et al., 2012). The remaining hydrogen
peroxide is not believed to be carcinogenic to human beings (CAS, 1995), however, eye or skin
irritation, or damage to the respiratory system may occur by inhalation or ingestion of high
concentrations (NOISH, 2010). Moreover, H2O2 exerts a chlorine demand that inhibits the
maintenance of the secondary chlorine residual. The H2O2 reaction with chlorine is very fast (in
the order of seconds) and occurs at approximately the stoichiometric ratio of 2.1 mg free chlorine
per 1 mg H2O2 (Dotson et al., 2010). H2O2 reacts more slowly with chloramines, with a second-
order rate constant of 2.76 10-2
M-1
s-1
(McKay et al., 2013). This suggests that 1 mg/L of
monochloramine would have a half-life in the order of 50 hours in the presence of 1 mg/L H2O2,
which may still be significant from the perspective of maintaining a chloramine residual in large
distribution systems. Formation of biofilm in the distribution system can be promoted as well
(Pantin, 2009). The Aurora Reservoir Water Purification Facility (Aurora, Colorado, US) and the
Andijk water treatment plant (WTP) in the Netherlands installed granular activated carbon
(GAC) contactors after UV/H2O2 AOP to quench H2O2 residuals (Kruithof et al., 2007; Pantin,
2009). In the full-scale practice at Andijk, GAC filtration was reported to successfully quench
H2O2 from 6 mg/L to less than 0.1 mg/L over more than 2 years of operation (Kruithof et al.,
2007).

5
2.2 FUNDAMENTALS OF GRANULAR ACTIVATED CARBON (GAC)
GAC is an effective method for removing a wide range of contaminants by adsorption.
GAC can also serve as a catalyst or catalyst support for hydrogen peroxide decomposition
(Calgon Carbon Corporation, 1987). The catalytic activity was found to increase with gradually
increasing temperature (from 423 – 573K) yma ski et a . The strength and
accessibility of surface acidic groups are important influencing factors, with less surface acidity
but higher accessibility to acidic groups leading to stronger catalytic activity yma ski et a
2002).
2.3 HETEROGENEOUS CATALYSIS OF GAC FOR QUENCHING OZONE AND CL2
2.3.1 Reaction of Chlorine Decomposition Using GAC
GAC was used for dechlorination in England since 1910 (Hung et al., 2007). The reaction
between GAC and chlorine was firstly assumed to be simple adsorption. However, Suidan et al.
(1977) proposed a mathematical model to predict the removal of aqueous chlorine with GAC
involving the formation of carbon oxides on the GAC surface during the chlorine decomposition
process. A detailed description of the model is presented by Suidan et al. (1977), but the general
chlorine decomposition process is:
C* + HOCl CHOCl* (2-5)
CHOCl* CO* + H+ + Cl- (2-6)
where CHOCl* represents the HOCl molecule on the carbon surface and CO* represents the
carbon oxides.
The model combined both a surface reaction model and a pore diffusion model. Semi-
batch reactor and closed batch reactor experiments were conducted to solve the reaction
constants in the process and then a model to predict fixed-bed performance for F400 GAC was
developed (Suidan et al., 1977).
The reaction of chlorine removal was considered as a very fast reaction compared to the
removal of organics with GAC, in the order of seconds (Desilva, 2000). Later, the decomposition
process was further studied and described as a first-order reaction by Skibinski et al. (2009), with
a lab-scale reaction rate constant of between 0.106 and 0.113 s-1
for the catalytic activated carbon
used. Unlike conducting semi-batch reactor and closed batch reactor experiments and then

6
evaluating surface reaction rate constants numerically by Suidan et al. (1977), Skibinski et al.
(2009) determined the reaction rate constant using activation energies from experiments.
The model and reaction kinetics studies developed for chlorine removal using GAC
provides clues for the quenching of H2O2. It is logical to assume a similar oxidation reaction
occurring on the GAC surface, resulting in the formation of carbon oxides on the surface.
2.3.2 GAC for Ozone Decomposition
The capability of activated carbon to accelerate ozone decomposition was investigated by
Jans and Hoigné (1998). In their study, ozone was observed to decompose three times faster in
the presence of a small amount of activated carbon (at the mg/L level). Activated carbon
promoted ozone decomposition by accelerating the transformation of ozone into the more
reactive hydroxyl radicals (Jans and Hoigné, 1998). Later, a completed model describing the
reaction mechanism pathway with GAC as an initiator was proposed by Alv rez et al. (2006). In
the model, a portion of dissolved ozone transferred from the external GAC surface to the internal
pore surface, while the remainder occupied the pore sites by physical adsorption. Then with
suitable GAC surface composition and under proper operating conditions, ozone decomposed
into more reactive hydroxyl radicals and peroxide radicals, with the formation of H2O2 in
aqueous solution. H2O2 was then disassociated to HO2- or transformed into OH radicals
depending on solution pH (Alv rez et al., 2006).
The influencing factors of this process were investigated in many studies (Dussert and
Kovacic, 1997; Jans and Hoigné, ans an oign n he -Polo and Rivera-Utrilla
2003; n he -Polo et al., 2005; n he -Polo et al., 2006; Alv rez et al., 2006), including the
surface characteristics of GAC (Alv re et a n he -Polo et al., 2006), the solution pH
(Alv rez et al., 2006), and the presence of hydroxyl radical scavengers n he -Po o et a
n he -Polo et al., 2006 ). The experimental conditions in different studies are shown in
Table 2.1.
In general, textural and chemical characteristics of GAC were found to govern the effect
on ozone decomposition (Alv rez et al., n he -Polo et al., 2006). With higher basicity
and less acidic surface groups, the promoting activity of GAC increases (Alv rez et al., 2006). In
addition, GAC with larger surface area is more effective n he -Polo et al., 2006). Secondly,
the promoting activity of GAC is favored at neutral or basic pH (Alv rez et al., 2006). Thirdly,
OH radical generation was enhanced with the presence of HCO3- and DOC, which are OH

7
radical scavengers, because HCO3- may be neutralized with the acidic surface groups on GAC
and DOC could be reduced by adsorption (Dussert and Kovacic, n he -Polo et al.,
2006).
In some studies (Jans and Hoigné 1998; Alv rez et al., 2006), H2O2 was detected during
the ozone decomposition process in the presence of activated carbon. However, Jans and Hoigné
(1998) found that activated carbon did not remove this part of H2O2 while dissociation of H2O2
was reported by Alv rez et al. (2006). The conflicting results may be because of different pH in
the two studies according to Alv rez et al. (2006), because H2O2 tended to disassociate by itself
at high pH (pKa = 11.6).
The GAC is affected by reaction with ozone. According to Dussert and Kovacic (1997),
the chemical properties of GAC changed after exposure to ozone, with the formation of acidic
surface groups, but the oxidation states of the surface were not changed. Jans and Hoigné (1998)
also found that the activity of activated carbon with respect to ozone decomposition did not
change upon pre-exposure to higher concentrations of ozone. However, others reported that if
exposed to ozone for a longer time, there would be more surface oxygen groups formed on the
carbon surface, consequently leading to a decrease in carbon promoting capability n he -Polo
et al., 2005; Alv rez et al., 2006).
8
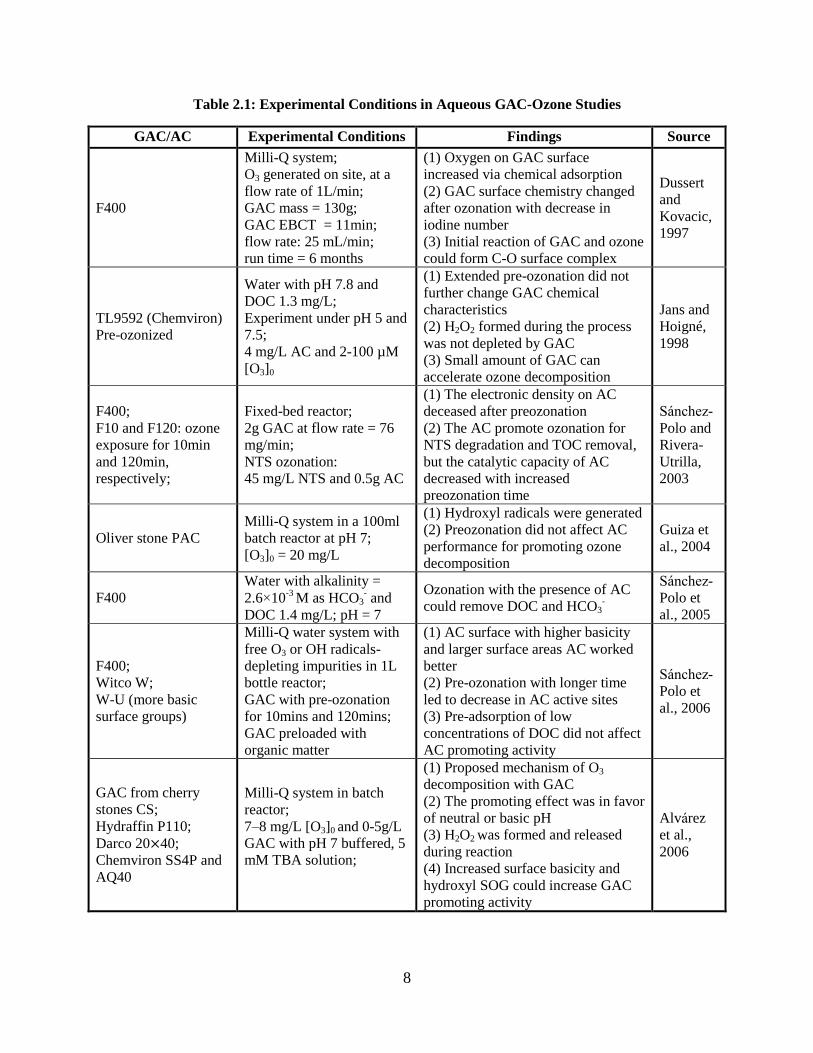
Table 2.1: Experimental Conditions in Aqueous GAC-Ozone Studies
GAC/AC Experimental Conditions Findings Source
F400
Milli-Q system;
O3 generated on site, at a
flow rate of 1L/min;
GAC mass = 130g;
GAC EBCT = 11min;
flow rate: 25 mL/min;
run time = 6 months
(1) Oxygen on GAC surface
increased via chemical adsorption
(2) GAC surface chemistry changed
after ozonation with decrease in
iodine number
(3) Initial reaction of GAC and ozone
could form C-O surface complex
Dussert
and
Kovacic,
1997
TL9592 (Chemviron)
Pre-ozonized
Water with pH 7.8 and
DOC 1.3 mg/L;
Experiment under pH 5 and
7.5;
4 mg/L AC and 2-100 µM
[O3]0
(1) Extended pre-ozonation did not
further change GAC chemical
characteristics
(2) H2O2 formed during the process
was not depleted by GAC
(3) Small amount of GAC can
accelerate ozone decomposition
Jans and
Hoigné,
1998
F400;
F10 and F120: ozone
exposure for 10min
and 120min,
respectively;
Fixed-bed reactor;
2g GAC at flow rate = 76
mg/min;
NTS ozonation:
45 mg/L NTS and 0.5g AC
(1) The electronic density on AC
deceased after preozonation
(2) The AC promote ozonation for
NTS degradation and TOC removal,
but the catalytic capacity of AC
decreased with increased
preozonation time
n he -
Polo and
Rivera-
Utrilla,
2003
Oliver stone PAC
Milli-Q system in a 100ml
batch reactor at pH 7;
[O3]0 = 20 mg/L
(1) Hydroxyl radicals were generated
(2) Preozonation did not affect AC
performance for promoting ozone
decomposition
Guiza et
al., 2004
F400
Water with alkalinity =
2.6 10-3
M as HCO3- and
DOC 1.4 mg/L; pH = 7
Ozonation with the presence of AC
could remove DOC and HCO3-
n he -
Polo et
al., 2005
F400;
Witco W;
W-U (more basic
surface groups)
Milli-Q water system with
free O3 or OH radicals-
depleting impurities in 1L
bottle reactor;
GAC with pre-ozonation
for 10mins and 120mins;
GAC preloaded with
organic matter
(1) AC surface with higher basicity
and larger surface areas AC worked
better
(2) Pre-ozonation with longer time
led to decrease in AC active sites
(3) Pre-adsorption of low
concentrations of DOC did not affect
AC promoting activity
n he -
Polo et
al., 2006
GAC from cherry
stones CS;
Hydraffin P110;
Darco 20 40;
Chemviron SS4P and
AQ40
Milli-Q system in batch
reactor;
7–8 mg/L [O3]0 and 0-5g/L
GAC with pH 7 buffered, 5
mM TBA solution;
(1) Proposed mechanism of O3
decomposition with GAC
(2) The promoting effect was in favor
of neutral or basic pH
(3) H2O2 was formed and released
during reaction
(4) Increased surface basicity and
hydroxyl SOG could increase GAC
promoting activity
Alv rez
et al.,
2006

9
2.4 QUENCHING OF HYDROGEN PEROXIDE BY GAC
2.4.1 Quenching Mechanism
Alternatives for quenching hydrogen peroxide in drinking water treatment have been
studied. Liu et al. (2003) reported that catalase has a high efficiency with a 0.2 mg/L dose able to
quench 145 mg/L H2O2. Some inorganic chemicals, such as sodium hypochlorite, sodium
thiosulfate and sodium sulfite also react with H2O2 stoichiometrically according to redox
reactions (Liu et al., 2003). Dose pacing when applying reducing agents, however, has reportedly
been difficult to achieve when the H2O2 residual concentration is unstable (Cotton et al., 2010).
To solve these problems from a practical perspective, GAC is gaining more attention due to its
heterogenic catalytic ability to quench H2O2 (Cotton et al., 2010). However, based on previous
studies related to H2O2 decomposition using GAC, the quenching mechanism is not fully
understood (Khalil et al., 2001; Huang et al., 2003a; Rey et al., 2011; Aguinaco et al., 2011).
Two major hypotheses have been put forward to understand the quenching mechanism.
Some studies suggested that the reaction occurs via generating •OH radicals and •OOH radicals
as intermediates (Lücking et al., 1998; Oliveira et al., 2004; Castro et al., 2009; Kurniawan and
Lo, 2009; Aguinaco et al., 2011). Other researchers proposed another pathway involving
functional group transfer between GAC and H2O2 on the GAC surface in basic medium (Rey et
al., 2009; Bach and Semiat, 2011).
The first hypothesis can be expressed as (Kurniawan and Lo, 2009):
AC + H2O2 AC+ + OH- + •OH (2-7)
AC+ AC + H+ + •OOH (2-8)
In this hypothesis, if H2O2 is in excess in basic medium, a chain reaction would follow to
decompose H2O2 and slow down the oxidation process, with the formation of less reactive
HO2•and O2- ion (Kurniawan and Lo, 2009). The chain reaction can be quoted as (Khalil et al.,
2001):
H2O2 + •OH H2O+ HO2• (2-9)
HO2• H+ + O2- (2-10)
O2- + H2O2 O2 + OH- + •OH (2-11)
To prove the formation of OH radicals, experiments of radical scavenger removal, such as dye
(Gomes et al., 2011) or tert-butanol (Aguinaco et al., 2011) were conducted.

10
For the second hypothesis, the reaction was proposed as (Bach and Semiat, 2011):
H2O2 H+ + OOH- (pKa = 11.6) (2-12)
AC-OH + H+ OOH- AC-OOH + H2O (2-13)
AC-OOH + H2O2 AC-OH + O2 + H2O (2-14)
This mechanism was supported by the observation that higher doses of GAC led to increased
decomposition of H2O2, by forming surface peroxide.
The disagreement between the two hypotheses might be caused by three major
influencing factors in experiments: (1) GAC characteristics (e.g. surface chemical and textural
composition) (Huang et al., 2003; Gomes et al., 2011); (2) water matrix (e.g. pH, temperature,
presence or absence of NOM) (Kurniawan and Lo, 2009; Aguinaco et al., 2011; Bach and
Semiat, 2011); and (3) reactants (e.g. H2O2 concentration, GAC dose) (Kurniawan and Lo,
2009). The experimental conditions and basic information of the related studies are shown in
Table 2.2.
The surface characteristics of GAC were widely investigated and proven to be a principal
factor contributing to the hydrogen peroxide decay in various studies (Khalil et al., 2001; Huang
et al., 2003a; Rey et al., 2011; Aguinaco et al., 2011). According to Khalil et al. (2001), the
chemical nature of GAC can be determined by surface functional groups, mainly including the
basic or acidic oxides. The formation of oxides depends on activation mode and precursors.
Results showed that GAC with acidic functional groups, which formed after impregnation with
H3PO4 (Khalil et al., 2001) or oxidation with HNO3 under heat treatment (Huang et al., 2003a;
Rey et al., 2011), tended to slow the H2O2 decay. This might be due to the blockage of reaction
sites by surface oxygen groups (Rey et al., 2011). In contrast, activated carbon pre-impregnated
with NH4Cl showed about six times higher efficiency than activated carbons impregnated with
H3PO4 at pH values between 4.9 and 9.5 (Khalil et al., 2001). In addition, the surface oxygenated
functional groups were reduced by hydrogen (Oliveira et al., 2004) or alkalinity pretreatment
(Kurniawan and Lo, 2009), with the introduction of more activated sites. However, a recent
study by Aguinaco et al. (2011) disagreed with previous studies, with the evidence that
Chemviron SSP-4 activated carbon, which has an acidic nature, decomposed hydrogen peroxide
faster than HydraffinP110, which has basic characteristics. The authors explained that the metal
on Chemviron SSP-4 could be the reason for this conflict, since Fenton reactions occurred
(Aguinaco et al., 2011). The promoting effect for H2O2 decay with metal ion was observed and
11
mentioned by Castro et al. (2009) as well. Thus, when comparing the surface nature of different
GAC, the presence of metal on the GAC surface should be considered as well.
In addition to surface functional groups, surface structure is another important factor,
with GAC having a more disorganized structure being more efficient (Rey et al., 2011). The
e omposition pro ess is a so in favor of more π-electrons on its graphenic layers (Kurniawan
and Lo, 2009). Unlike during adsorption processes, the porosity of GAC is not a predominant
factor for H2O2 decomposition, because GAC with large pore volumes or wider pores did not
speed the process (Khalil et al., 2001).
The effects of NOM, pH, temperature and existing ions on H2O2-GAC reaction have been
investigated, but not directly in the context of hydrogen peroxide quenching. Instead, the focus
has been on enhancing catalytic H2O2 oxidation using GAC for organic pollutant removal, such
as 4-CP (Lücking et al., 1998; Huang et al., 2003a), 2-CP (Huang et al., 2003b), dye (Oliveira et
al., 2004), raw leachate (Kurniawan and Lo, 2009). In these short-term experiments, the presence
of organic compounds showed a negative effect on the decomposition of H2O2 by competing for
reactive sites. The decomposition rate of H2O2 decreased while the removal rate of organics
increased (Huang, Lu et al., 2003a; Bach and Semiat, 2011). If GAC is saturated by organics, the
catalytic capability would decline dramatically. Bach and Semiat (2011) reported that the
decomposition rate of H2O2 with GAC that is 80% saturated by phenol is twice slower than
virgin GAC, due to the decrease in micropores. It indicates that with the presence of NOM in
treated water, long term fouling would have an adverse effect on the quenching process.
Solution pH can influence the quenching process mainly via affecting the stability of
H2O2 and surface characteristics of GAC (Aguinaco et al., 2011). H2O2 quenching is found to be
faster at high pH, especially higher than 8 (Kurniawan and Lo, 2009), reportedly because of the
disassociation of H2O2 into OOH- (Khalil et al., 2001). However, the effect of pH may be
confounded since both pH of the GAC surface and solution pH may have an impact on the H2O2
decomposition (Rey et al., 2011). Increased temperature can also promote the decomposition
efficiency (Aguinaco et al., 2011). Ions in buffering salts, such as phosphorus, have been found
to suppress the decomposition process (Khalil et al., 2001; Aguinaco et al., 2011).
While the decomposition rate varies with different GAC, GAC itself is oxidized by H2O2
in the quenching process. To understand how GAC changes during the process is fundamental
for optimization in drinking water treatment. Acidic functional groups or other oxides form on
12
the GAC surface during the reaction and thus reduce the catalytic efficiency (Huang et al.,
2003a). The surface area of micropores, where the catalytic activity mainly occurs, has been
reported to decrease 23.5% after H2O2 oxidation compared to virgin GAC (Bach and Semiat,
2011). However, the carbon activity showed good stability with 135 hours of H2O2 exposure
(Quintanilla et al., 2010).

13
Table 2.2: Experimental Conditions in GAC-H2O2 Studies
GAC/AC type Experimental
Conditions Findings Source
coal-based F300 (Calgon);
coal-based Darco GCW
(Norit);
peat-based ROW 0.8 Supra
(Norit);
peat-based and impregnated
with iron hydroxide RFZ 1
(Norit)
(1) 1g/L 4-CP dissolved
in batch reactor with DI
water at 30˚C;
(2) For flow experiment,
retention time = 26 min at
flow rate 3.51 ml/h under
pH = 3; 5.3g/L [H2O2]0
and 1.0g/L GAC
(1) Virgin F300 had slowest
removal rate in both situations
(2) Surface characteristics of
AC is important
(3) H2O2 decomposition rate
decreased with 4-CP
Lücking et
al., 1998
F300 (Chemiron);
F300 pre-impregnation with
H3PO4;
F300 pre-impregnation with
NH4Cl
20 mg AC with slurry pH
4.9-9.5 and 0.8mg/L
[H2O2]0 at 30˚C in a glass
cell with two way
connection
(1) Proposed mechanism of
oxonium-hydroxyl group
exchange on carbon surface
(2) With higher slurry pH,
H2O2 decomposed faster
(3) Higher T enhanced
catalytic activity
(4) P inhibited reaction
(5) Carbon activated with
NH4Cl or Steamed were better
Khalil et
al., 2001
F300 (Calgon);
GAC1; GAC2 oxidized with
H2O2;
GAC3 oxidized with HNO3
1000 mg/L GAC and
20mM [H2O2]0 with /
without 4-CP/2-CP in
batch reactor
(1) Higher pHpzc increased
H2O2 decomposition
(2) Surface reaction
dominated mass transfer rate
(3) Acidic functional groups
slowed catalytic activity
Huang et
al., 2003a;
Huang et
al., 2003b
Aldrich Darco G60 (Norit)
treated with H2 under 450-
800 °C during 1h
30 mg AC in 7 ml 3mol/L
H2O2 solution
(1) Treatment with H2 on AC
promoted catalytic action by
creating reducing site;
(2) Proposed radical pathway
Oliveira et
al., 2004
Commercial ACM (Merck);
ACR produced from spent
coffee ground with iron
oxide
30 mg AC in 7 ml 3mol/L
H2O2 solution
(1) Proposed radical
mechanism with phenol
experiment
(2) AC from residue is more
active than commercial one
Castro et
al., 2009
coconut shell-based GAC
modified with NaOH
0.5 to 5.0 g/L [H2O2]0 and
5 g/L GAC at pH 8.0 in
the raw leachate samples
(1) Excessive H2O2 can
expand chain reaction;
(2) pH 8~9 has best COD
removal efficiency with H2O2
and GAC
Kurniawan
and Lo,
2009
Commercial GAC (Merck)
2.5 g AC and [H2O2]0
5g/L with pHinlet 3.5 in a
trickle-bed reactor with
pure O2 at ˚C and 8
atm
QO2 = 91.6mL/min
Carbon activity had good
stability (after time = 135h)
Quintanilla
et al., 2010
14
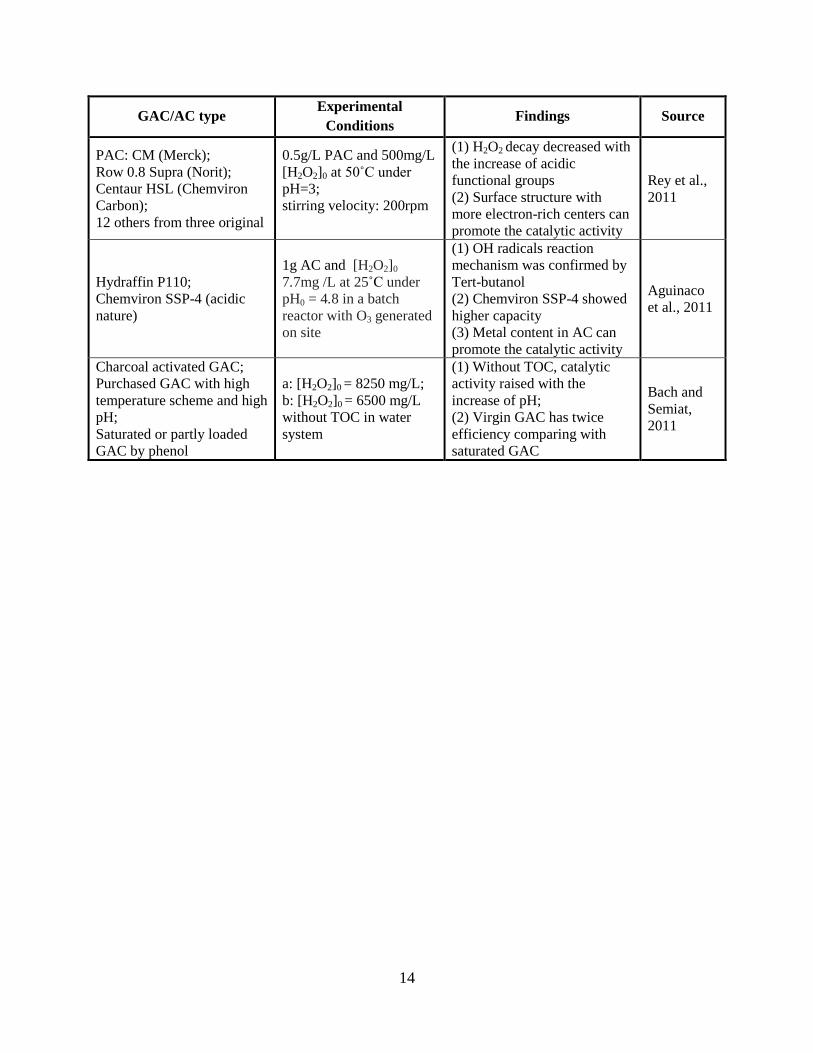
GAC/AC type Experimental
Conditions Findings Source
PAC: CM (Merck);
Row 0.8 Supra (Norit);
Centaur HSL (Chemviron
Carbon);
12 others from three original
0.5g/L PAC and 500mg/L
[H2O2]0 at ˚C un er
pH=3;
stirring velocity: 200rpm
(1) H2O2 decay decreased with
the increase of acidic
functional groups
(2) Surface structure with
more electron-rich centers can
promote the catalytic activity
Rey et al.,
2011
Hydraffin P110;
Chemviron SSP-4 (acidic
nature)
1g AC and [H2O2]0
7.7mg /L at 25˚C under
pH0 = 4.8 in a batch
reactor with O3 generated
on site
(1) OH radicals reaction
mechanism was confirmed by
Tert-butanol
(2) Chemviron SSP-4 showed
higher capacity
(3) Metal content in AC can
promote the catalytic activity
Aguinaco
et al., 2011
Charcoal activated GAC;
Purchased GAC with high
temperature scheme and high
pH;
Saturated or partly loaded
GAC by phenol
a: [H2O2]0 = 8250 mg/L;
b: [H2O2]0 = 6500 mg/L
without TOC in water
system
(1) Without TOC, catalytic
activity raised with the
increase of pH;
(2) Virgin GAC has twice
efficiency comparing with
saturated GAC
Bach and
Semiat,
2011

15
Only a few studies (Kruithof et al., 2007; Doom, 2008; Collins et al., 2010; Dotson et al.,
2010; Metz et al., 2011a) investigated GAC treatment after UV/H2O2 in drinking water treatment.
The synergetic effect of GAC and H2O2 can prevent DBP formation (Collins et al., 2010; Metz et
al., 2011a). As for the quenching process, H2O2 breakthrough was found in a GAC rapid small-
scale column test with an EBCT of less than 4 minutes (Doom, 2008; Dotson et al., 2010).
There are two drinking water treatment plants known to the author to have installed GAC
contactors for the purpose of quenching H2O2. One is the Aurora Reservoir Water Purification
Facility (Aurora, Colorado, US) and the Andijk water treatment plant in the Netherlands
(Kruithof et al., 2007; Pantin, 2009). Andjk uses GAC after UV/H2O2 AOP to remove H2O2, as
well as AOC and nitrite (Kruithof et al., 2007). The GAC is reported to be able to quench 15
mg/L H2O2 with an EBCT less than 5 minutes (Kruithof et al., 2007). Over the long-term, it has
been found that 6 mg/L H2O2 can be quenched to less than 0.1 mg/L following 2-years of
operation (Kruithof et al., 2007). Information about pilot-scale and full-scale GAC studies is
shown in Table 2.3.

16
Table 2.3: GAC-H2O2 Studies in Drinking Water Applications
GAC EBCT/min Experimental set-up Findings Source
Norit ROW
2CAT 40
2 step GAC filter after
UV/H2O2 with full-
scale installation in
Andijk WTP
(1) 15 mg/L H2O2 could be
removed within 5 minutes
(2) GAC could remove 6 mg/L
H2O2 to less than 0.1mg/L for 2
years
(3) AOC was reduced from 45–
142 Ac C to 3–31 Ac C eq/L
(4) Biofilm formation rate was
lower than recommended value
Kruithof et
al., 2007
Not
mentioned 1,2,4
(1) Jar Tests
(2) RSSCTs with 4
carbon sizes and 3
carbon ages with high
and low TOC in water
(1) H2O2 breakthrough happened
with EBCT less than 4 minutes
(2) The presence of TOC and
carbon size had no impact on
quenching kinetics
Doom,
2008
Catalytic 1,2;
Coal-based;
Coconut-
based
5
Loading rate =
12gpm/ft2 and [H2O2]0
= 7mg/L
(1) H2O2 complete quenching
with an EBCT < 2min
(2) The process increased
headloss and required pumping
(3) DBP precursors were reduced
Collins et
al., 2010
Not
mentioned
4×1min in
series of
1×11min
RSSCT with UV/H2O2
using water from
coagulated and filtered
Boulder Reservoir and
[H2O2]0 about 2 mg/L
(1) UV/H2O2 yielded more DBPs
(2) With an EBCT = 1min can get
> 60 % quenching of H2O2
(3) With an EBCT = 4min, 100%
quenching of H2O2
Dotson et
al., 2010
thermally
reactivated
GAC filter
15-20
A-year UV/H2O2 pilot
study;
[TOC]in ave = 1.9 mg/L;
[TOC]eff = 0.9 mg/L
and [H2O2]0 = 10mg/L
(1) GAC filter before or after
UV/H2O2 can both decrease the
formation of DBPs
(2) GAC can quench excess H2O2
when used after AOP
Metz et al.,
2011a
Coal-based
GAC 15
UV/H2O2 pilot study
with 10mg/L [H2O2]0
(1) GAC could remove TOC
efficiently
(2) Total AOC concentration was
40% lower with GAC after
UV/H2O2
Metz et al.,
2011b

17
2.4.2 Kinetics of the Quenching Process
From previous studies discussed in Section 2.4.1, the reaction between GAC and H2O2 is
likely not governed by physical adsorption, but a chemical redox reaction. Thus, the kinetics of
H2O2 decomposition is also in need of consideration, along with the thermodynamics. Different
variables have been studied, including the concentrations of H2O2 and GAC (Huang et al.,
2003a; Aguinaco et al., 2011; Bach and Semiat, 2011). It has been proven that the surface
reaction controls the overall efficiency via comparison of total molar flux (Huang et al., 2003a),
while internal diffusion mass transfer resistance is considered not negligible according to Mears’
criterion (Aguinaco et al., 2011). Jar tests characterizing mass transfer mechanisms conducted by
Doom (2008) showed that both external and internal reactions are important in the quenching
process. Huang et al. (2003a) reported that the rate constant of decomposition decreased
with the increase in initial . To further investigate the process, a modified Langmuir-
Hinshelwood kinetic rate model, which is typically used to describe heterogenic catalytic
reactions, was applied to find the rate constant (Huang et al., 2003a). The model can be
expressed as (Huang et al., 2003a):
(2-15)
where k is the binding constant and k is the reaction rate constant.
The first order kinetics law was used in several studies (Oliveira et al., 2004; Kurniawan
and Lo, 2009; Rey et al., 2011), with a coefficient correlation fit of over 0.99. Huang et al.
(2003a) found that the kinetic rate constant is related to the presence of organics. In the absence
of organics, the reaction followed first order kinetics, while second order kinetics was chosen in
the presence of 2-CP (Huang et al., 2003b). However, Bach and Semiat (2011) showed that
second-order kinetics was more suitable even in the absence of TOC, with a set of experiments
involving different GAC doses. Details about different studies are shown in Table 2.4. According
to Bach and Semiat (2011), the reaction rate expression can be quoted as:
(2-16)
where kn is the mass normalized rate coefficient.
This expression is inconsistent with the Huang et al. (2003b) equation with the presence
of 2-CP, as well as another study by Huang et al. (2003a) applying the modified L-H kinetics

18
model. The difference in kinetic models may result from various GAC doses, initial H2O2
concentrations, pH and the presence of organic matter.
Table 2.4: Information of Experimental Set-up in Related Studies
Experimental conditions Rate constant k Source
Without 4-CP
(GAC without
modification)
pH about 7.0; [H2O2]0=4–
30mM;
GAC =1000mg/L
Applied L-H model;
k= 5.93×10⁻³
/min;
kH = 2.33×10⁻²
/mM;
k increased with the increase of kH
Huang et al.,
2003a
Without 2-CP [H2O2]0=20mM; T=30˚C;
GAC = 0.5 g/L First order rate constant
Huang et al.,
2003b With 2-CP
[2-CP]=1.13mM;
[H2O2]0=20mM; T=30˚C;
GAC = 0.5 g/L
Second order rate constant
Without organics,
original AC
AC: 30 mg in 7 ml solution of
H2O2 (3 mol/L)
First order rate constant
k = 0.015/min
Oliveira et
al., 2004
In leachate
sample
Total reaction time: 60 min
pH = 8.0; COD = 8000 mg/L
GAC dose = 15 g/L
First order rate constant
30% H2O2: k= 6.6×10⁻²
/min;
15% H2O2: k= 1.24×10⁻¹
/min
Kurniawan
and Lo, 2009
Without TOC
[H2O2]0=8250 mg/l; GAC from
5 to 60 g/L
Follows a first order and kinetic
rate expression with respect to
H2O2 concentration Bach and
Semiat, 2011 [H2O2]0 =6500 mg/L ; pH
about 7
GAC concentration affects H2O2
decomposition rate;
Second order rate constant
2.5 SUMMARY
According to previous studies concerning GAC-H2O2 reaction (Lücking et al., 1998;
Oliveira et al., 2004; Castro et al., 2009; Kurniawan and Lo, 2009; Rey et al., 2009; Aguinaco et
al., 2011; Bach and Semiat, 2011), the reaction mechanism was hypothesized to be either
through a hydroxyl radical pathway (Lücking et al., 1998; Oliveira et al., 2004; Castro et al.,
2009; Kurniawan and Lo, 2009; Aguinaco et al., 2011), or by exchanging surface functional
groups between GAC and H2O2 (Rey et al., 2009; Bach and Semiat, 2011). The disagreement
between the two pathways was resulted from the differences of GAC characteristics (Huang et
al., 2003a; Gomes et al., 2011), water matrix (Kurniawan and Lo, 2009; Aguinaco et al., 2011;
Bach and Semiat, 2011), and reactants (Kurniawan and Lo, 2009) in the studies. The GAC-H2O2
reaction was found to be in favor of high temperature (Aguinaco et al., 2011), basic medium

19
(Kurniawan and Lo, 2009), and GAC with basic surface functional groups (Khalil et al., 2001,
Rey et al., 2011). The Aurora Reservoir Water Purification Facility (Aurora, Colorado, US) and
the Andijk water treatment plant in the Netherlands (Kruithof et al., 2007; Pantin, 2009) are
known to have installed GAC contactor after UV/H2O2 AOP in drinking water treatment. In full-
scale practice, GAC can effectively quench H2O2 residuals following 2-year operation (Kruithof
et al., 2007).
Nevertheless, most of the laboratory studies related to GAC-H2O2 reaction were not in
the context of drinking water treatment. How the performance of GAC for quenching H2O2
would be affected by long-term use, and which factors might affect that performance are not
elucidated. This led to the uncertainty on how to design and operate a GAC system for
quenching H2O2 following advanced oxidation process in drinking water treatment. In this work,
how the efficiency of this quenching process is affected by carbon type, age (i.e., bed volumes of
natural water) and other factors (e.g., exposure to H2O2) would be investigated by both bench-
scale and pilot-scale experiments.

20
2.6 REFERENCES
Aguinaco, A., Pocostales, J.P., García-Araya, J.F., Beltr n, F.J., 2011. Decomposition of hydrogen peroxide in the pesence of activated carbons with different characteristics. Journal of Chemical Technology & Biotechnology 86 (4), 595–600.
Alv rez, P.M., ar a-Araya, J.F., Beltr n, F.J., Gir ldez, I., Jaramillo, J., Gómez-Serrano, V.,
2006. The influence of various factors on aqueous ozone decomposition by granular activated carbons and the development of a mechanistic approach. Carbon 44 (14), 3102–3112.
Bach, A., Semiat, R., 2011. The role of activated carbon as a catalyst in GAC/iron oxide/H2O2
oxidation process. Desalination 273 (1), 57–63. Calgon Carbon Corporation, 1987. Granular activated carbon used as catalyst or catalyst support. CAS, 1995. Chemical summary for hydrogen peroxide. Chemical abstract, CAS. Castro, C.S., Oliveira, L.C.A., Guerreiro, M.C., 2009. Effect of hydrogen treatment on the
catalytic activity of iron oxide based materials dispersed over activated carbon: investigations toward hydrogen peroxide decomposition. Catalysis Letters 133 (1-2), 41–48.
Collins, J., Pirnie, M., Cotton, C., Jousset, S., Dotson, A., Linden, K., 2010. Evaluation of
hydrogen peroxide quenching alternatives for AOP treatment. Savannah, Georgia, USA: AWWA WQTC.
Cotton, C., Jousset, S., Linden, K., Collins, J., 2010. Applying UV-AOP at an existing WTP:
effects on disinfection strategy and DBP formation. Savannah, Georgia, USA: AWWA WQTC.
Crittenden, J.C., Hu, S., Hand, D.W., Green, S.A., 1999. A kinetic model for H2O2/ UV process
in a completely mixed batch reactor. Water Research 33 (10), 2315. Desilva, F., 2000. Activated carbon filtration. Water quality products magazine. Doom, T.R., 2008. Characterizing hydrogen peroxide degradation by granular activated carbon
for advanced oxidation processes in water treatment. Project presentation. Dotson, A.D., Keen, V.S., Metz, D., Linden, K.G., 2010. UV/H2O2 treatment of drinking water
increases post-chlorination DBP formation. Water Research 44 (12), 3703-3713. Dotson, A., Corwin, C., Rowley, C., Downs, M., Linden, K., 2010. Dynamic bench-scale
quenching of H2O2 by GAC. Savannah, Georgia, USA: AWWA WQTC. Dussert, B.W., Kovacic, S.L., 1997. Impact of drinking water preozonation on granular activated
carbon quality and performance. Ozone: Science & Engineering 19 (1), 1-11. Gomes, H.T., Miranda, S.M., Sampaio, M.J., Figueiredo, J.L., Silva, A.M.T., Faria, J.L., 2011.
The role of activated carbons functionalized with thiol and sulfonic acid groups in catalytic wet peroxide oxidation. Applied Catalysis B: Environmental 106 (3-4), 390–397.
21
Guiza, M., Ouederni, A., Ratel, A., 2004. Decomposition of dissolved ozone in the presence of activated carbon: an experimental study. Ozone: Science and Engineering 26 (3), 299–307.
Huang, H.H., Lu, M.C. Chen, J.N., Lee, C.T., 2003a. Catalytic decomposition of hydrogen
peroxide and 4-chlorophenol in the presence of modified activated carbons. Chemosphere 51 (9), 935–943.
Huang, H.H., Lu, M.C. Chen, J.N., Lee, C.T., 2003b. Influence of surface modification on
catalytic activity of activated carbon toward decomposition of hydrogen peroxide and 2-Chlorophenol. Journal of Environmental Science and Health Part A—Toxic/Hazardous Substances & Environmental Engineering A 38 (7), 1233–1246.
Hung, Y., Lo, H.H., Wang, L.K., Taricska, J.R., Li, K.H., 2007. Granular activated carbon
adsorption. Vol. 3, in handbook of environmental engineering, edited by Wang, L.K., Hung, Y.T., Shammas, N.K., 573-633. Totowa, NJ: The Humana Press Inc..
Jans, U., Hoigné, J., 2000. Atmospheric water: transformation of ozone into OH-radicals by
sensitized photoreactions or carbon black. Atmospheric Environment 34 (7), 1069-1085. Jans, U., Hoigné, J., 1998. Activated carbon and carbon black catalyzed transformation of
aqueous ozone into OH-radicals. Ozone: Science & Engineering: The Journal of the International Ozone Association 20 (1), 67-90.
Khalil, L.B., Girgis, B.S., Tawfik, T.A., 2001. Decomposition of H2O2 on activated carbon
obtained from olive stones. Journal of Chemical Technology and Biotechnology 76 (11), 1132-1140.
Kruithof, J.C., Kamp, P.C., Martijn, B.J., 2007. UV/H2O2 treatment: a practical solution for
organic contaminant control and primary disinfection. Ozone: Science and Engineering 29 (4), 273–280.
Kurniawan, T.A., Lo, W.H., 2009. Removal of refractory compounds from stabilized landfill
leachate using an integrated H2O2 oxidation and granular activated carbon (GAC) adsorption treatment. Water Research 43 (16), 4079-4091.
Lücking, F., Köser, H., Jank, M., Ritter, A., 1998. Iron powder, graphite and activated carbon as
catalysts for the oxidation of 4-chlorophenol with hydrogen peroxide in aqueous solution. Water Research 32 (9), 2607-2614.
Liu, W.J., Andrews, S.A., Stefan, M.I., Bolton, J.R., 2003. Optimal methods for quenching H2O2
residuals prior to UFC testing. Water Research. 37 (15), 3697–3703. McKay, G., Sjelin, B., Chagnon, M., Ishida, K.B., Mezyk, S.B., 2013, Kinetic study of the
reactions between chloramine disinfectants and hydrogen peroxide: temperature dependence and reaction mechanism. Chemosphere 92 (11), 1417–1422.
Metz, D.H., Meyer, M., Dotson, A., Beerendonk, E., Dionysiou, D.D., 2011a. The effect of
UV/H2O2 teatment on disinfection by-product formation potential under simulated distribution system conditions. Water Research 45 (13), 3969-3980.
Metz, D.H., Reynolds, K., Meyer, M., Dionysiou, D.D., 2011b. The effect of UV/H2O2 treatment
on biofilm formation potential. Water Research 45 (2), 497-508.

22
National Institute for Occupational Safety and Health (NIOSH), 2010. NIOSH pocket guide to
chemical hazards: hydrogen peroxide. Available Online: http://www.cdc.gov/niosh/npg /npgd0335 .html. Last revised: March 5th, 2012.
Oliveira, L.C.A., Silva, C.N., Yoshida, M.I., Lago, R.M., 2004. The effect of H2 treatment on the
activity of activated carbon for the oxidation of organic contaminants in water and the H2O2 decomposition. Carbon 42 (11), 2279–2284.
Pantin, S., 2009. Impacts of UV-H2O2 treatment for taste and odor control on secondary
disinfection. MASc Thesis, Toronto: University of Toronto, 112-115. Quintanilla, A., Casas, J.A., Rodriguez, J.J., 2010. Hydrogen peroxide-promoted-CWAO of
phenol with activated carbon. Applied Catalysis B: Environmental 93 (3-4), 339–345. Rey, A., Faraldos, M., Casas, J.A., Zazo, J.A., Bahamonde, A., Rodriguez, J.J., 2009. Catalytic
wet peroxide oxidation of phenol over Fe/AC catalysts: influence of iron precursor and activated carbon surface. Applied Catalysis B: Environmental 86 (1-2), 69–77.
Rey, A., Zazo, J.A., Casas, J.A., Bahamonde, A., Rodriguez, J.J., 2011. Influence of the
structural and surface characteristics of activated carbon on the catalytic decomposition of hydrogen peroxide. Applied Catalysis A: General 402 (1-2), 146–155.
n he -Polo, M., Rivera-Utrilla, J., 2003. Effect of the ozone–carbon reaction on the catalytic
activity of activated carbon during the degradation of 1,3,6-naphthalenetrisulphonic acid with ozone. Carbon 41(2), 303–307.
n he -Polo, M., Salhi, E., Rivera-Utrilla, J., Gunten, U.V., 2006. Combination of ozone with
activated carbon as an alternative to conventional advanced oxidation processes. Ozone: Science and Engineering 28 (4), 237–245.
n he -Polo, M., Gunten, U.V., Rivera-Utrilla, J., 2005. Efficiency of activated carbon to
transform ozone into OH radicals: influence of operational parameters. Water Research 39 (14), 3189–3198.
Skibinski, B., Müller, S., Uhl, W., 2009. Removal of free and combined chlorine at GAC
surfaces and impact on pool water quality. Swimming Pool & Spa International Conference. London: PWTAG.
Suidan, M.T., Sneyink, V.L., Schmitz, R.A., 1977. Reduction of aqueous free chlorine with
granular activated carbon-pH and temperature effects. Environmental Science & Technology 11 (8), 785-789.
Suidan, M.T., Snoeyink, V.L., ASCE, A.M., Schmitz, R.A., 1977. Reduction of aqueous HOCl
with acitvated carbon. American Society for Civil Engineering-Jounal of Environmental Engineering Division 103(4), 677-691.
yma ski .S., Karpi ski, Z., Biniak, S., Światkowski, A., 2002. The effect of the gradual
thermal decomposition of surface oxygen species on the chemical and catalytic properties of oxidized activated carbon. Carbon 40 (14), 2627–2639.
Vikesland, P.J., Ozekin, K., Valentine, R.L., 2001. Monochloramine decay in model and
distribution system waters. Water Research 35 (7), 1766-1776.

23
Watts, M.J., Hofmann, R., Rosenfeldt, E.J., 2012. Low-pressure UV/Cl2 for advanced oxidation of taste and odor. Journal American Water Works Association 104 (1), 47-48.
24
3 BENCH-SCALE ANALYSIS OF THE EFFECT OF H2O2
EXPOSURE AND CARBON TYPE ON H2O2 QUENCHING
USING GAC
ABSTRACT
The performance of six types of granular activated carbon (GAC) to quench H2O2 was
evaluated by bench-scale H2O2 decomposition kinetics tests. The objective of this study was to
investigate the effect of carbon ageing and the addition of H2O2 during the ageing process on the
GAC performance. The GAC samples in this study were aged by exposure to approximately
2000%, 3000% and 4000% total organic carbon (TOC) saturation levels. X-ray photoelectron
spectroscopy (XPS) analysis and scanning electron microscopy (SEM) imaging were applied to
understand the changes to the GAC surface characteristics.
The study showed that carbon ageing significantly reduced the kinetics of H2O2
quenching by the GAC, but that the greatest impacts occurred at the beginning of the ageing
process, with performance tending to stabilize with longer ageing. The addition of H2O2 in the
ageing process did not have as great an effect on the quenching performance as the addition of
natural organic matter (NOM). The catalytic carbon, ADCAT, had the most stable performance
among the six GACs when aged with either H2O2 exposure or exposure to NOM.

25
3.1 INTRODUCTION
The application of ultraviolet light coupled with hydrogen peroxide (UV/H2O2) as an
advanced oxidation process (AOP) in drinking water treatment to control taste and odour-causing
compounds is a new and emerging technique. In this process, only approximately 5-20% of the
H2O2 is consumed, and the excess H2O2 will exert chlorine and chloramine demand on the
distribution system (Dotson et al., 2010; Watts. et al., 2012; McKay et al., 2013). To quench the
H2O2 residuals prior to application of a secondary disinfectant, the Aurora Reservoir Water
Purification Facility (Aurora, Colorado, US) and the Andijk water treatment plant (WTP) in the
Netherlands (Kruithof et al., 2007; Pantin, 2009) have installed granular activated carbon (GAC)
contactors after UV/H2O2 AOP.
With more than two years full-scale practice at Andijk, GAC was reported to be capable
of quenching H2O2 from 6 mg/L to less than 0.1 mg/L (Kruithof et al., 2007), however, studies
related to H2O2 quenching using GAC in drinking water treatment are limited. Previous studies
(Lücking et al., 1998; Huang et al., 2003; Huang, Lu et al., 2003; Oliveira et al., 2004;
Kurniawan and Lo, 2009) have reported the enhanced catalytic H2O2 oxidation using GAC for
organic pollutant removal, such as 4-CP (Lücking et al., 1998; Huang et al., 2003), 2-CP (Huang,
Lu et al., 2003), dye (Oliveira et al., 2004), raw leachate (Kurniawan and Lo, 2009), but not in
the context of drinking water treatment. It remains unclear how the performance of GAC for
quenching H2O2 would be affected by long-term use, and which factors might affect that
performance.
NOM fouling is hypothesized to be one of the potential factors affecting H2O2 quenching
by GAC. To investigate the effect of NOM, virgin GAC was exposed to natural water
(containing NOM) collected from the Lorne Park water treatment plant (Peel Region, Ontario),
immediately downstream of ultrafiltration membranes. The Lorne Park plant employs
ultrafiltration followed by UV-H2O2 for taste and odour control, with GAC contactors to quench
residual H2O2. The water used for this study therefore represents the water from the full-scale
plant at the point of full-scale GAC application.
According to Snoeyink and Summers (1999), GAC will be saturated by NOM (i.e.
influent TOC equal to effluent TOC) after several thousand bed volumes of water treated. To
study the long-term performance of GAC, the ageing process was conducted by exposure to

26
three different levels of bed volumes treated after NOM saturation (i.e. approximately 2000%,
3000% and 4000% of NOM saturation).
Since the reasons that cause degradation of H2O2 quenching ability by GAC are not well
understood, H2O2 exposure during the ageing process was proposed as another potential
affecting factor. Another set of ageing was conducted to investigate the impact of H2O2 exposure
by spiking H2O2 into the water during the ageing process (i.e., ageing the GAC with
NOM+H2O2).
A bench-scale H2O2 decomposition kinetics test was selected to study the quenching
process between GAC and H2O2. Initially, the suitability of a bench-scale test to accurately
represent full-scale performance was unknown. One of the objectives of this work was to
generate bench-scale test data that could then be compared to similar larger (pilot) scale data
(described in Chapter 4), to determine whether fast and inexpensive bench-scale tests to evaluate
GAC effectiveness to quench H2O2 are appropriate.
Six types of GAC were used in this study to explore differences in their ability to quench
H2O2.
3.2 OBJECTIVE
The main objective was to evaluate the performance of granular activated carbon (GAC)
to quench H2O2 residuals after the UV/H2O2 process. The specific objectives included the
following:
(1) To investigate the effect of carbon ageing (2000%, 3000% and 4000% of NOM saturation)
and H2O2 exposure (0mg/L and 4 mg/L) during the ageing process on the GAC performance
to quench H2O2, using bench-scale H2O2 decomposition kinetics tests.
(2) To study the changes of GAC surface characteristics after the ageing process (aged with
NOM, and with NOM+H2O2) by X-ray photoelectron spectroscopy (XPS) analysis and
scanning electron microscopy (SEM) imaging.
(3) To compare the performance of six GACs (Centaur, ADCAT, F300, GAC300, HD3000 and
TN5) for the quenching of H2O2.

27
3.3 MATERIAL AND METHODS
3.3.1 Carbon Preparation
3.3.1.1 Activated Carbons
Six types of GAC (Centaur, F300 and TN5 from Calgon; HD3000 and GAC 300 from
Norit Canada; ADCAT from CarboTech) were tested. All carbons were received from
manufacturers with a particle size of 8×30 US sieve size. Pulverized activated carbon (95%
under 325 US sieve size) was prepared in the lab (in the Department of Mechanical and
Industrial Engineering at the University of Toronto) by using a ball mill (Fisher Scientific, OH,
US) and measured with a Mastersizer 2000 particle size analyzer (Malvern instruments,
Worcestershire, UK).
3.3.1.2 Carbon Ageing, Drying and Preservation
Carbon samples with six different pre-exposure histories were prepared at the Lorne Park
Water Treatment Plant using 1-inch glass columns through which plant membrane permeate
water flowed. Twenty grams of representative carbon samples were selected by the coning and
quartering technique (ASTM D346) and washed with Milli-Q water, then dried in the oven at
105oC overnight in order to remove impurities (Calgon Carbon Coporation, 1987). After that the
GACs were packed at the bottom of the column (7.5 cm) and continuously loaded with
membrane permeate at a flow rate of 158 mL/min (equivalent to an EBCT of 0.24 min).
During the pre-exposure process, both influent and effluent of the GAC columns were
collected for TOC analysis to determine the bed volumes of water treated to NOM saturation as
defined by no TOC reduction across the GAC column. According to Figure 3.1, NOM saturation
(i.e. greater than 70% TOC breakthrough in this study) on all types of GAC was observed after
approximately 1200 bed volumes of pre-loading. To study the long-term performance of GAC,
the ageing process was conducted by exposure to 25 000, 35 000 and 45 000 bed volumes treated
after NOM saturation (i.e. approximately 20, 30, and 40 times longer than time to NOM
saturation), which are equivalent to up to six months service duration. Another potential
affecting factor, H2O2 exposure, was studied by adding the average H2O2 concentration during
the full-scale daily operation at the Lorne Park Water Treatment Facility, 4 mg/L, into the
membrane permeate. A new set of representative virgin GAC samples was pre-exposed to the

28
membrane permeate with H2O2 for the same bed volumes of water treated as the ones without
H2O2. Operating conditions for the pre-exposure process are shown in Table 3.1.
Figure 3.1: TOC Breakthrough Profile (C: effluent TOC; C0: influent TOC)
Table 3.1: Carbon Pre-Exposure Operating Conditions
Carbon type Carbon weight (g) Pre-exposure histories Water information
Centaur
20.000
Aged with NOM:
1. 25 000 bed volumes
2. 35 000 bed volumes
3. 45 000 bed volumes
Aged with NOM + 4 mg/L H2O2:
1. 25 000 bed volumes
2. 35 000 bed volumes
3. 45 000 bed volumes
Ultrafiltration membrane
permeate
(TOC: 1.9-2.4mg/L)
F300
GAC300
ADCAT
HD3000
TN5
After pre-exposure to the natural water and H2O2, carbon samples were collected from
the columns and kept at 4oC until freeze dried (Andrews, 1990) in 20 mL vials in a freeze drier
(Dura-Dry MP, US) located in the Industrial BioDevelopment laboratory of the MaRs Centre
(Toronto, Ontario, Canada). The freeze-drying process involved an initial freeze for 1 hour, and
then the vacuum was turned on and the samples were freeze-dried for at least 96 hours. After
freeze-drying, carbon samples were collected in amber HDPE bottles (Fisher Scientific, ON,
0.0
0.2
0.4
0.6
0.8
1.0
0 200 400 600 800 1000 1200 1400
TOC
C/C
0
bed volumes treated
Centaur
F300
GAC300
ADCAT
HD3000
TN5

29
Canada) and sealed with Teflon tape, then stored in a desiccator at room temperature. Procedures
for freeze-drying are shown in Appendix A.3.
3.3.2 Carbon Characterization
3.3.2.1 Carbon Property Tests
The iodine number, trace capacity number (TCN), and apparent density were measured
for each activated carbon. Results from triplicate experiments are shown in Table 3.2. The
experimental set-up and operating procedures are provided in Appendix A.1.
Table 3.2: GAC adsorption and physical property test results
GAC type Material Iodine NO. (mg/g) TCN (mg/g) Apparent Density (g/L)
Centaur Bituminous coal-based;
catalytic 1044 7.8 530
ADCAT Hard coal-based;
catalytic 956 7.8 485
F300 Bituminous coal-based 847 5.5 501
GAC300 Coal-based 931 7.9 539
HD3000 Lignite coal-based; acid
washed 601 9.6 421
TN5 Coconut-based 861 7.1 599
3.3.2.2 X-ray photoelectron spectroscopy (XPS) Analysis
The surface characteristics of GAC, including surface structures and elements, were
investigated using X-ray photoelectron spectroscopy (XPS, in the Department of Chemical
Engineering at the University of Toronto) and scanning electron microscopy (SEM, in the
Department of Earth Science at the University of Toronto).
XPS analysis was conducted to study the elemental composition and functional groups on
the GAC surface. Carbon samples after freeze-drying were collected and run on the Thermo
Scientific Theta Probe XPS spectrometer (ThermoFisher, E. Grinstead, UK) located at the
University of Toronto.
The samples were run in standard mode (i.e. all angles collected for spectra). A
mono hromati A Kα X-ray sour e was use with a spot area of 4 μm. Where necessary,

30
charge compensation was provided utilizing the combined e-/Ar+ flood gun. The position of the
energy scale was adjusted to place the main C 1s feature (C-C) at 284.6 eV. A survey spectrum
was obtained at low resolution (pass energy = 200 eV) as well as for the regions of interest. The
C 1s region was also obtained at high-energy resolution (pass energy = 30 eV). The instrument
and all data processing were performed using the software (Avantage) provided with the
instrument.
3.3.2.3 Scanning Electron Microscopy (SEM) Imaging
The surface morphology of the GAC was investigated by the JSM-6610LV scanning
electron microscope (JEOL, MA, US) located in the Department of Earth Sciences at the
University of Toronto. Carbon samples after freeze-drying were coated with gold to improve the
image quality before scanning. The SEM was operated in secondary electron imaging (SEI)
mode with a spot size of 33 mm. The images were captured with different magnifications and
compared.
3.3.3 H2O2 Decomposition Kinetics Tests in the Presence of GAC
The H2O2 decomposition kinetics tests in the presence of GAC were conducted in 1L
capped amber glass bottles. Virgin and six types of GAC aged by different conditions were
tested in the kinetics tests. The reactors were prepared by adding 0.2500 g of selected
representative carbon sample to 500 mL Milli-Q water with 50 mM Na2CO3/NaHCO3 buffer, and
then the pH of the mixture was adjusted to 7.00±0.05. The reaction was initiated by adding H2O2.
After that the reactors were shaken in an orbital shaker at room temperature. Samples for H2O2
residual analysis were collected every hour during the 5-hour experiment and analyzed by the I3-
method according to Klassen et al. (1994) using a UV-Vis spectrometer (Agilent Tech, ON,
Canada). The minimum detection limit of this method was determined to be 0.02 mg/L. The pH
of the mixture was measured by an Orion Star A111 pH meter (Thermo Scientific, ON, Canada).
Duplicated experiments were conducted for each type of carbon. Table 3.3 shows experimental
conditions for the H2O2 decomposition kinetics tests.
After conducting the tests, the data were fitted to a kinetics reaction rate model and the
reaction rate constant k was calculated. Based on results from a preliminary test (Appendix C.3),
with the current GAC dose and H2O2 initial concentration, the GAC-H2O2 reaction followed

31
pseudo-first order kinetics as the GAC concentration was at an excess level compared to H2O2.
Thus, k was calculated as (Connors, 1991):
= - k (3-1)
where k is the pseudo-first order reaction rate constant, L/(mg min).
Table 3.3: Experimental Conditions for the H2O2 Kinetics Test in the Presence of GAC
GAC Temperature
(˚C)
Stirring speed
(RPM) pH
Carbon
dose (g)
Initial H2O2
conc. (mg/L)
Centaur
Room
Temperature,
21±2oC
Moderate,
around
180±10
7.00±0.05, buffered
with 50 mM
Na2CO3/NaHCO3;
adjusted by HCl
0.2500 5
ADCAT
F300
GAC300
HD3000
TN5
3.4 RESULTS AND DISCUSSION
3.4.1 Effect of Carbon Age on the Quenching of H2O2
Results of bench-scale H2O2 decomposition kinetics tests using GAC aged with NOM are
shown in Figure 3.2 to Figure 3.7. It was hypothesized that the reactivity between GAC and
H2O2 might slow down as the GAC continued to be exposed to water containing NOM, despite
being essentially exhausted as measured by TOC removal. To explore this, the number of bed
volumes treated to exhaustion in terms of TOC removal was first determined (1200 bed
volumes), and then the GAC samples were aged for approximately 20, 30, and 40 times longer.
This led to three different ageing levels of 25 000 bed volumes, 35 000 bed volumes and 45 000
bed volumes. The pseudo-first order reaction rate constant k was determined as the slope of the
experimental data linear regression equation and then compared among the GACs and
treatments. A one-way ANOVA was applied to evaluate the impact of carbon age on the GAC
performance for the quenching of H2O2. Results from the ANOVA are shown in Table 3.4.
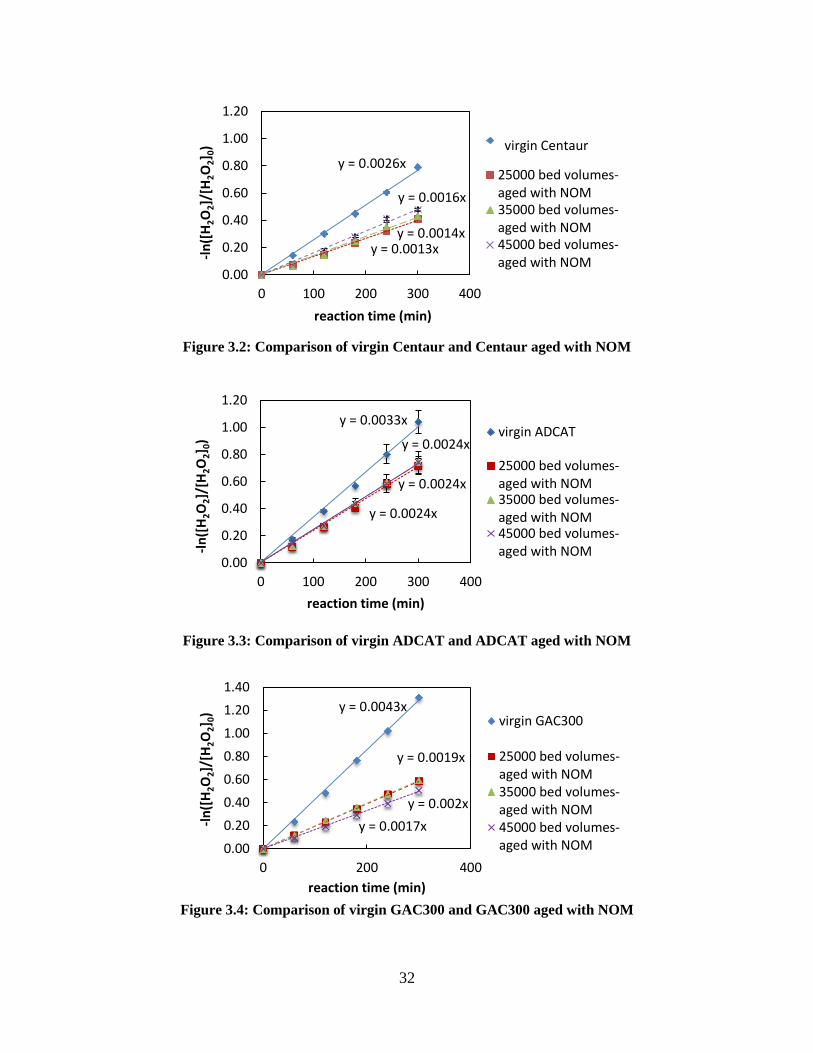
32
Figure 3.2: Comparison of virgin Centaur and Centaur aged with NOM
Figure 3.3: Comparison of virgin ADCAT and ADCAT aged with NOM
Figure 3.4: Comparison of virgin GAC300 and GAC300 aged with NOM
y = 0.0026x
y = 0.0013x y = 0.0014x
y = 0.0016x
0.00
0.20
0.40
0.60
0.80
1.00
1.20
0 100 200 300 400
-ln
([H
2O
2]/
[H2O
2] 0
)
reaction time (min)
Virgin Centaur
25000 bed volumes-aged with NOM35000 bed volumes-aged with NOM45000 bed volumes-aged with NOM
virgin Centaur
y = 0.0033x
y = 0.0024x
y = 0.0024x
y = 0.0024x
0.00
0.20
0.40
0.60
0.80
1.00
1.20
0 100 200 300 400
-ln
([H
2O
2]/
[H2O
2] 0
)
reaction time (min)
virgin ADCAT
25000 bed volumes-aged with NOM35000 bed volumes-aged with NOM45000 bed volumes-aged with NOM
y = 0.0043x
y = 0.0019x
y = 0.002x
y = 0.0017x
0.00
0.20
0.40
0.60
0.80
1.00
1.20
1.40
0 200 400
-ln
([H
2O
2]/
[H2O
2] 0
)
reaction time (min)
virgin GAC300
25000 bed volumes-aged with NOM35000 bed volumes-aged with NOM45000 bed volumes-aged with NOM

33
Figure 3.5: Comparison of virgin F300 and F300 aged with NOM
Figure 3.6: Comparison of virgin HD3000 and HD3000 aged with NOM
Figure 3.7: Comparison of virgin TN5 and TN5 aged with NOM
y = 0.0021x
y = 0.0012x
y = 0.0015x
y = 0.0013x
0.00
0.10
0.20
0.30
0.40
0.50
0.60
0.70
0 200 400
-ln
([H
2O
2]/
[H2O
2] 0
)
reaction time (min)
virgin F300
25000 bed volumes-aged with NOM35000 bed volumes-aged with NOM45000 bed volumes-aged with NOM
y = 0.0024x
y = 0.0015x
y = 0.00137x
y = 0.0014x
0.00
0.10
0.20
0.30
0.40
0.50
0.60
0.70
0.80
0 100 200 300 400
-ln
([H
2O
2]/
[H2O
2] 0
)
reaction time (min)
virgin HD3000
25000 bed volumes-aged with NOM35000 bed volumes-aged with NOM45000 bed volumes-aged with NOM
y = 0.0021x y = 0.0017x
y = 0.0016x
y = 0.0014x
0.00
0.10
0.20
0.30
0.40
0.50
0.60
0.70
0.80
0 100 200 300 400
-ln
([H
2O
2]/
[H2O
2] 0
)
reaction time (min)
virgin TN5
25000 bed volumes-aged with NOM
35000 bed volumes-aged with NOM
45000 bed volumes-aged with NOM
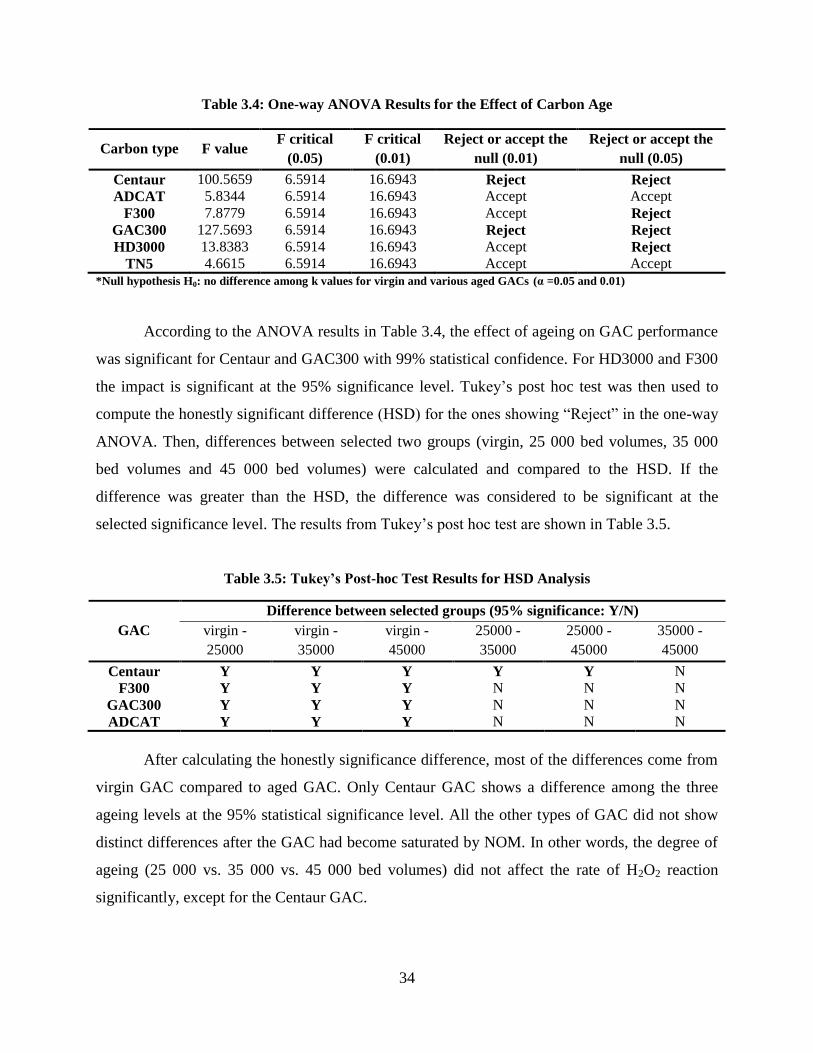
34
Table 3.4: One-way ANOVA Results for the Effect of Carbon Age
Carbon type F value F critical
(0.05)
F critical
(0.01)
Reject or accept the
null (0.01)
Reject or accept the
null (0.05)
Centaur 100.5659 6.5914 16.6943 Reject Reject
ADCAT 5.8344 6.5914 16.6943 Accept Accept
F300 7.8779 6.5914 16.6943 Accept Reject
GAC300 127.5693 6.5914 16.6943 Reject Reject
HD3000 13.8383 6.5914 16.6943 Accept Reject
TN5 4.6615 6.5914 16.6943 Accept Accept
*Null hypothesis H0: no difference among k values for virgin and various aged GACs (α =0.05 and 0.01)
According to the ANOVA results in Table 3.4, the effect of ageing on GAC performance
was significant for Centaur and GAC300 with 99% statistical confidence. For HD3000 and F300
the impact is significant at the 95% significance level. Tukey’s post hoc test was then used to
compute the honestly significant difference D for the ones showing “Reje t” in the one-way
ANOVA. Then, differences between selected two groups (virgin, 25 000 bed volumes, 35 000
bed volumes and 45 000 bed volumes) were calculated and compared to the HSD. If the
difference was greater than the HSD, the difference was considered to be significant at the
selected significance level. The resu ts from Tukey’s post ho test are shown in Table 3.5.
Table 3.5: Tukey’s Post-hoc Test Results for HSD Analysis
GAC
Difference between selected groups (95% significance: Y/N)
virgin -
25000
virgin -
35000
virgin -
45000
25000 -
35000
25000 -
45000
35000 -
45000
Centaur Y Y Y Y Y N
F300 Y Y Y N N N
GAC300 Y Y Y N N N
ADCAT Y Y Y N N N
After calculating the honestly significance difference, most of the differences come from
virgin GAC compared to aged GAC. Only Centaur GAC shows a difference among the three
ageing levels at the 95% statistical significance level. All the other types of GAC did not show
distinct differences after the GAC had become saturated by NOM. In other words, the degree of
ageing (25 000 vs. 35 000 vs. 45 000 bed volumes) did not affect the rate of H2O2 reaction
significantly, except for the Centaur GAC.

35
Overall, these data suggest that GAC rapidly loses some ability to react with H2O2 after
being exposed to the water (within 25 000 bed volumes), presumably through NOM loading, but
that the rate of deterioration quickly slows and stabilizes.
3.4.2 Effect of the Addition of H2O2 during the Ageing Process
The previous tests evaluated the rate of H2O2 quenching by GAC as the GAC was aged
through exposure to plant membrane permeate water containing NOM. It was also hypothesized
that exposure to H2O2, in addition to NOM, would cause the GAC to age and the reaction with
H2O2 to slow. Tests were therefore undertaken where the membrane permeate water was spiked
with 4 mg/L H2O2, and then the GAC was aged through 25 000, 35 000, and 45 000 bed volumes
as before. The data are shown in Figure 3.8 to Figure 3.13.
Figure 3.8: Comparison of virgin Centaur and Centaur aged with NOM+H2O2
Figure 3.9: Comparison of virgin ADCAT and ADCAT aged with NOM+H2O2
y = 0.0026x y = 0.0019x
y = 0.0013x
y = 0.0014x
0.00
0.20
0.40
0.60
0.80
1.00
0 100 200 300 400
-ln
([H
2O
2]/
[H2O
2] 0
)
reaction time (min)
virgin Centaur
25000 bed volumes-aged with NOM+H2O2
35000 bed volumes-aged with NOM+H2O2
45000 bed volumes-aged with NOM+H2O2
25000 bed volumes-aged with NOM+ H2O2
35000 bed volumes-aged with NOM+ H2O2
45000 bed volumes-aged with NOM+ H2O2
virgin Centaur
y = 0.0033x
y = 0.0024x
y = 0.0024x
y = 0.0024x
0.00
0.20
0.40
0.60
0.80
1.00
1.20
0 100 200 300 400
-ln
([H
2O
2]/
[H2O
2] 0
)
reaction time (min)
virgin ADCAT
25000 bed volumes-aged with NOM+H2O2
35000 bed volumes-aged with NOM+H2O2
45000 bed volumes-aged with NOM+H2O2
25000 bed volumes-aged with NOM+ H2O2
35000 bed volumes-aged with NOM+ H2O2
45000 bed volumes-aged with NOM+ H2O2
virgin ADCAT

36
Figure 3.10: Comparison of virgin F300 and F300 aged with NOM+H2O2
Figure 3.11: Comparison of virgin GAC300 and GAC300 aged with NOM+H2O2
Figure 3.12: Comparison of virgin HD3000 and HD3000 aged with NOM+H2O2
y = 0.0021x
y = 0.0014x
y = 0.0011x
y = 0.0011x
0.00
0.10
0.20
0.30
0.40
0.50
0.60
0.70
0 100 200 300 400
-ln
([H
2O
2]/
[H2O
2] 0
)
reaction time (min)
virgin F300
25000 bed volumes-aged with NOM+H2O2
35000 bed volumes-aged with NOM+H2O2
45000 bed volumes-aged with NOM+H2O2
25000 bed volumes-aged with NOM+ H2O2
35000 bed volumes-aged with NOM+ H2O2
45000 bed volumes-aged with NOM+ H2O2
virgin F300
y = 0.0043x
y = 0.0021x
y = 0.002x
y = 0.0019x
0.00
0.20
0.40
0.60
0.80
1.00
1.20
1.40
0 100 200 300 400
-ln
([H
2O
2]/
[H2O
2] 0
)
reaction time (min)
virgin GAC300
25000 bed volumes-aged with NOM+H2O2
35000 bed volumes-aged with NOM+H2O2
45000 bed volumes-aged with NOM+H2O2
25000 bed volumes-aged with NOM+ H2O2
35000 bed volumes-aged with NOM+ H2O2
virgin GAC300
45000 bed volumes-aged with NOM+ H2O2
y = 0.0024x y = 0.002x
y = 0.0017x
y = 0.0016x
0.00
0.10
0.20
0.30
0.40
0.50
0.60
0.70
0.80
0.90
0 100 200 300 400
-ln
([H
2O
2]/
[H2O
2] 0
)
reaction time (min)
virgin HD3000
25000 bed volumes-aged with NOM+H2O2
35000 bed volumes-aged with NOM+H2O2
45000 bed volumes-aged with NOM+H2O2
25000 bed volumes-aged with NOM+ H2O2
35000 bed volumes-aged with NOM+ H2O2
virgin HD3000
45000 bed volumes-aged with NOM+ H2O2

37
Figure 3.13: Comparison of virgin TN5 and TN5 aged with NOM+H2O2
A Student t-test was applied to compare the pseudo first-order reaction rate constant k for
GAC aged in the presence of H2O2 to the k value for GAC aged in the absence of H2O2, as
shown in Table 3.6. From Table 3.6, the H2O2 exposure caused the k values to change by less
than 46% in all cases, and usually by less than 30%. This impact may not be statistically
significant, but it should be taken into consideration.
Table 3.6: Results of the Effect of H2O2 Addition during the Ageing Process
GAC Ageing history
(bed volumes)
k (aged with
NOM)
k (aged with
NOM+H2O2)
P-value
(Two-tail)
95% significance
(Yes/No)
Centaur
25000 0.0013 0.0019 (+46.2%) 0.0148 Y
35000 0.0014 0.0013 (-7.1%) 0.0367 Y 45000 0.0016 0.0014 (-12.5%) 0.1056 N
ADCAT
25000 0.0024 0.0024 (0.0%) 0.6985 N
35000 0.0024 0.0024 (0.0%) 0.6985 N
45000 0.0024 0.0024 (0.0%) 1.0000 N
F300
25000 0.0012 0.0014 (+16.7%) 0.0982 N
35000 0.0015 0.0011 (-26.7%) 0.0887 Y 45000 0.0013 0.0011 (-15.4%) 0.3746 N
GAC300
25000 0.0019 0.0021 (+10.5%) 0.8083 N
35000 0.0020 0.0020 (0.0%) 1.0000 N
45000 0.0017 0.0019 (+11.8%) 0.1101 N
HD3000
25000 0.0015 0.0020 (+33.3%) 0.0565 N
35000 0.0014 0.0017 (+21.4%) 0.0256 Y
45000 0.0014 0.0016 (+14.3%) 0.3333 N
TN5
25000 0.0017 0.0020 (+17.6%) 0.0995 N
35000 0.0016 0.0016 (0.0%) 1.0000 N
45000 0.0014 0.0014 (0.0%) 0.8442 N
*Values in the ( ) indicate the difference between k for GAC aged with NOM+H2O2 and k for GAC aged with NOM
y = 0.0021x
y = 0.002x
y = 0.0016x
y = 0.0014x
0.00
0.10
0.20
0.30
0.40
0.50
0.60
0.70
0.80
0 100 200 300 400
-ln
([H
2O
2]/
[H2O
2] 0
)
reaction time (min)
virgin TN5
25000 bed volumes-agedwith NOM+H2O2
35000 bed volumes-agedwith NOM+H2O2
45000 bed volumes-agedwith NOM+H2O2
25000 bed volumes-aged with NOM+ H2O2
35000 bed volumes-aged with NOM+ H2O2
virgin TN5
45000 bed volumes-aged with NOM+ H2O2

38
A two-way ANOVA was conducted to determine whether the ageing duration (i.e. 0,
25 000, 35 000, or 45 000 bed volumes) or H2O2 exposure (i.e. k values in the presence or
absence of H2O2) in the ageing process dominates the impact on the GAC performance for
quenching H2O2. The results are shown in Table 3.7.
Table 3.7: Two-way ANOVA Results
GAC
Source of variance
Carbon age
95% significance (Yes/No)
The addition of H2O2
95% significance (Yes/No)
Interaction
95% significance (Yes/No)
Centaur Y N Y
ADCAT Y N N
F300 Y N Y
GAC300 Y N N
HD3000 Y Y N
TN5 Y N N
*Null hypothesis H0: no difference among the groups tested
The results demonstrated that the presence of H2O2 had only a marginal impact on the
deterioration in GAC quenching ability, relative to the impact of carbon age (i.e. exposure to
natural water for longer duration). In the table, the impact of carbon age was significant for all
types of GAC with 95% statistical confidence, while the impact of H2O2 exposure was
significant for HD3000 only. On the whole, the ageing process was controlled by the exposure to
natural water, presumably (but not conclusively) the NOM in the water.
3.4.3 Comparison of the six GACs
As shown in Table 3.2, the six types of GAC in this study are made from several types of
materials, and have various physical and chemical properties. The performances of the six GACs
were compared and are shown in Table 3.8. Among the six types of GAC tested, ADCAT had
relatively good performance both before and after ageing, while the F300 showed the poorest
performance. Interestingly, ADCAT has the poorest performance in terms of TOC removal
(Figure 3.1). It is possible that this rendered ADCAT the least affected by NOM fouling as a
mechanism of deterioration in H2O2 quenching ability.

39
Table 3.8: Comparison of H2O2 Quenching Performance among six GACs
GAC
Ranking of GAC performance with selected ageing conditions
Virgin carbon Average k for aged with NOM Average k for aged with
NOM+H2O2
Centaur 3 4 5
ADCAT 2 1 1
F300 5 6 6
GAC300 1 2 2
HD3000 4 4 3
TN5 5 3 4
3.4.4 Changes to GAC Element Composition and Surface Functional Groups
To better understand the changes to the GAC surface during the ageing process, samples
before and after treatment were analyzed using XPS for more information on element
composition and surface functional groups. To compare different elemental components among
samples, the abundance of other elements were normalized to the carbon abundance on each
sample, i.e., abundance of C = 1.0. Results of the elemental analysis on the GAC surface are
shown in Figure 3.14. The normalized oxygen (O) component of aged GAC increased 65% to
250% compared to the virgin GAC for most of the GACs. The normalized nitrogen (N)
components on aged GAC are 2-7 times of the virgin GACs. The binding of O or N with C could
o upy the “free” a tivate spa e of arbon an thus result in a decrease in quenching
performance. The XPS was then used in a high-resolution scanning mode to study the carbon
functional groups. Spectra of virgin and aged Centaur using XPS are shown as an example in
Figure 3.15 and Figure 3.16.

40
Figure 3.14: Surface Elemental Analysis from XPS
From Figure 3.15 and Figure 3.16, the peak due to C-C binding occurs at the binding
energy of 284.6 eV. However, comparing Figure 3.16 to Figure 3.15, the C-C peak has a
deflection due to other elements binding to the carbon. The shifts of the C-C peak are then
analyzed and quantified for surface functional group information according to binding energy
(Lee, 1993), with results shown in Table 3.9. It is observed that the ratio of unoccupied carbon
(i.e., -C- and -C-C- bonding) decreased after GAC was aged with NOM for 45 000 bed volumes,
while other functional groups involving carbon-oxygen binding increased for most of the GAC
analyzed. According to Rey et al. (2011), the bonding of O with carbon could compete for
electron-rich sites where H2O2 decomposition reaction mainly occurs, resulting in a decrease in
the H2O2 decay rate.
0.000
0.050
0.100
0.150
0.200
0.250
0.300N
orm
aliz
atio
n o
f e
lem
en
t ab
un
dan
ce (
C=1
.0) O
N
Fe
Ca
S
Si
Al
Cl

41
Figure 3.15: Spectrum of High-resolution Scanning for Carbon Bonding-Virgin Centaur
Figure 3.16: Spectrum of High-resolution Scanning for Carbon Bonding - Centaur Aged with NOM
at 45 000 Bed Volumes

42
Table 3.9: Surface Functional Groups Analysis from XPS
Sample -C- -C-O-C -C-C-
O-C-O or
RCOR
R1O(C=
O)OR2 O-C=O
At% At% At% At% At% At%
Centaur-virgin 54.38 12.8 7.34 7.31 9.38 3.94
Centaur aged with NOM
45 000 BV 51.10 20.44 7.18 10.3 4.12 3.64
F300-virgin 53.43 10.97 11.24 7.38 8.72 3.68
F300-aged with NOM
45 000 BV 50.75 20.11 7.48 10.67 3.46 3.79
GAC300-virgin 57.62 11.81 8.04 6.45 8.03 3.44
GAC300-aged with NOM
45 000 BV 51.96 18.69 8.06 10.59 3.95 3.51
ADCAT-virgin 60.28 12.11 5.93 6.94 6.53 3.35
ADCAT-aged with NOM
45 000 BV 56.10 17.71 6.27 8.73 4.71 3.03
HD3000-virgin 58.35 11.84 7.53 6.71 7.53 3.81
HD3000-aged with NOM
45 000 BV 59.65 11.72 9.75 7.31 5.38 6.19
TN5-virgin 62.34 9.15 9.39 8.04 5.76 5.33
TN5-aged with NOM
45 000 BV 60.92 12.52 8.69 10.01 2.3 5.56
* At% = atom percentage
3.4.5 SEM Images
SEM images for six virgin GACs and six GAC aged with NOM at 45 000 bed volumes
are shown in Figure 3.17 to Figure 3.22.
(a) (b)
Figure 3.17: SEM images for Centaur (a) virgin Centaur (b) Centaur aged with NOM at 45 000 bed
volumes

43
(a) (b)
Figure 3.18: SEM images for ADCAT (a) virgin ADCAT (b) ADCAT aged with NOM at 45 000 bed
volumes
(a) (b)
Figure 3.19: SEM images for F300 (a) virgin F300 (b) F300 aged with NOM at 45 000 bed volumes
(a) (b)
Figure 3.20: SEM images for GAC300 (a) virgin GAC300 (b) GAC300 aged with NOM at 45 000
bed volumes

44
(a) (b)
Figure 3.21: SEM images for HD3000 (a) virgin HD3000 (b) HD3000 aged with NOM at 45 000 bed
volumes
(a) (b)
Figure 3.22: SEM images for TN5 (a) virgin TN5 (b) TN5 aged with NOM at 45 000 bed volumes
The virgin GACs appeared to have more disordered surfaces, with a clear porous
structure, while the surface of aged GACs were more flat. The hypothesis in this study would be
that NOM fouling created a film on the GAC surface, resulting in the blockage of some active
sites. The observation of film forming on GAC surface after ageing was also reported in Yu et al.
(2009). However, this hypothesis lacks additional evidence.
3.5 SUMMARY AND CONCLUSION
Factors that may influence GAC performance for quenching H2O2, including carbon age
and the addition of H2O2 during the ageing process, were studied. Six types of GAC were aged
and evaluated by H2O2 decomposition kinetics tests, XPS analysis and SEM imaging.
The H2O2 decomposition rate decreased when GAC was aged both by membrane
permeate water (containing NOM), as well as when the same water was spiked with 4 mg/L of
H2O2. Interestingly, the addition of H2O2 had only a small to negligible impact on GAC

45
performance compared to exposure to the water (containing NOM) only. Furthermore, the
amount of ageing (25 000 vs. 35 000 vs. 45 000 bed volumes) did not have a great impact on
GAC performance, but all ageing levels showed significant deterioration in performance relative
to virgin GAC. This suggests that GAC performance deteriorates upon installation (within
25 000 bed volumes), but then the rate of deterioration slows considerably. Among the six types
of GAC tested, ADCAT showed relatively good performance both before and after ageing, while
the F300 showed the poorest performance.
XPS analysis and SEM imaging provided semi-quantitative and qualitative assessments
of both virgin and aged GAC. After exposure to 45 000 bed volumes of water, F300 had the
highest oxygen to carbon ratio, with the corresponding lowest k. For all aged GAC, the increase
of C-O bonding is theorized to lead to a decrease in H2O2 quenching performance.
3.6 RECOMMENDATIONS FOR FUTURE WORK
This bench-scale study demonstrated the potential impact of ageing on the performance
of GAC to quench H2O2. However, all the H2O2 decomposition kinetics tests were conducted at
neutral pH and room temperature. Repeating this work at different pH and temperatures would
be useful to be more representative of the full range of treatment plant conditions. Moreover, in
this study, all types of GAC were aged with membrane permeate water from the Lorne Park
Water Treatment Plant, which had a relatively low TOC. The impact of different sources and
levels of NOM is still unknown and thus worthy of more investigation. In addition, all GAC in
this study was received from manufacturers with the same US sieve size of 8 30. The potential
influence on H2O2 quenching caused by particle size and its distribution should be studied as
well.

46
3.7 REFERENCES
Andrews, R.C., 1990. Removal of low concentrations of chlorination by-products using activated
carbon. Ph.D dissertation, University of Alberta, Canada. ASTM D346/D346M–11. Standard practice for collection and preparation of coke samples for
laboratory analysis. ASTM International. Calgon Carbon Corporation, 1987. Granular activated carbon used as catalyst or catalyst support. Connors, K.A., 1991. Chemical knetics, the study of reaction rates in solution. US: VCH
Publishers. Crittenden, J.C., Hu, S., Hand, D.W., Green, S.A., 1999. A kinetic model for H2O2/ UV process
in a completely mixed batch reactor. Water Research 33 (10), 2315. Dotson, A.D., Keen, V.S., Metz, D., Linden, K.G., 2010. UV/H2O2 treatment of drinking water
increases post-chlorination DBP formation. Water Research 44 (12), 3703-3713. Huang, H.H., Lu, M.C. Chen, J.N., Lee, C.T.,2003a. Catalytic decomposition of hydrogen
peroxide and 4-chlorophenol in the presence of modified activated carbons. Chemosphere 51 (9), 935–943.
Klassen, N.V., Marchington, D., McGowan, H.C.E., 1994. H2O2 determination by the I3
- method
and by KMnO4 titration. Analytical Chemicstry 66 (18), 2921-2925. Kruithof, J.C., Kamp, P.C., Martijn, B.J., 2007. UV/H2O2 treatment: a practical solution for
organic contaminant control and primary disinfection. Ozone: Science and Engineering 29 (4), 273–280.
Kurniawan, T.A., Lo, W.H., 2009. Removal of refractory compounds from stabilized landfill
leachate using an integrated H2O2 oxidation and granular activated carbon (GAC) adsorption treatment. Water Research 43 (16), 4079-4091.
Lee, S.M., 1993. Handbook of composite reinforcements. California, US: VCH Publishers Inc.
pg 89. McKay, G., Sjelin, B., Chagnon, M., Ishida, K.B., Mezyk, S.B., 2013, Kinetic study of the
reactions between chloramine disinfectants and hydrogen peroxide: temperature dependence and reaction mechanism. Chemosphere 92 (11), 1417–1422.
Lücking, F., Köser, H., Jank, M., Ritter, A., 1998. Iron powder, graphite and activated carbon as
catalysts for the oxidation of 4-chlorophenol with hydrogen peroxide in aqueous solution. Water Research 32 (9), 2607-2614.
National Institute for Occupational Safety and Health (NIOSH), 2010. NIOSH pocket guide to
chemical hazards: hydrogen peroxide. Available Online: http://www.cdc.gov/niosh/npg /npgd0335 .html. Last revised: March 5th, 2012.
Oliveira, L.C.A., Silva, C.N., Yoshida, M.I., Lago, R.M., 2004. The effect of H2 treatment on the
activity of activated carbon for the oxidation of organic contaminants in water and the H2O2 decomposition. Carbon 42 (11), 2279–2284.

47
Pantin, S., 2009. Impacts of UV-H2O2 treatment for taste and odor control on secondary
disinfection. MASc Thesis, Toronto: University of Toronto, 112-115. Rey, A., Zazo, J.A., Casas, J.A., Bahamonde, A., Rodriguez, J.J., 2011. Influence of the
structural and surface characteristics of activated carbon on the catalytic decomposition of hydrogen peroxide. Applied Catalysis A: General 402 (1-2), 146–155.
Snoeyink, V.L., Summers, R.S., 1999. Water quality & treatment: a handbook on drinking
water 5th
edition. Editor: Edzwald, J.K., Colorado, US: American Water Works Association. Chapter 13.
Watts, M.J., Hofmann, R., Rosenfeldt, E.J., 2012. Low-pressure UV/Cl2 for advanced oxidation of taste and odor. Journal American Water Works Association 104 (1), 47-48.
Yu, Z.R., Peldszus, S., Huck, P.M., 2009. Adsorption of selected pharmaceuticals and an
endocrine disrupting compound by granular activated carbon. 1. adsorption capacity and kinetics. Environmental Science and Technology 43 (5), 1467–1473.

48
4 PILOT-SCALE STUDY FOR THE QUENCHING OF H2O2
USING GAC
ABSTRACT
The performance of six types of granular activated carbon (GAC) to quench H2O2 was
evaluated by pilot-scale H2O2 breakthrough tests and bench-scale H2O2 decomposition kinetics
tests. The objectives of this study were to investigate the effect of carbon ageing and H2O2
exposure during the ageing process on the GAC performance by pilot-scale column tests, and to
validate bench-scale H2O2 decomposition kinetics test results as introduced in Chapter 3. The
GAC samples in this study were aged by exposure to a cumulative flow that was the equivalent
of 25 to 45 times the treated water bed volumes required to achieve total organic carbon (TOC)
saturation levels in pilot-scale columns. X-ray photoelectron spectroscopy (XPS) analysis and
scanning electron microscopy (SEM) imaging were applied to understand the changes to the
GAC surface characteristics.
The impact of carbon ageing was carbon-type specific. Only TN5 and Centaur showed
breakthrough in the pilot-scale H2O2 breakthrough tests columns after 45 000 bed volumes when
aged with natural water only. The presence of H2O2 had an impact on the deterioration in GAC
quenching ability compared to exposure to natural water only, as indicated by a higher (more
than 10%) H2O2 breakthrough in the effluents, than that of GAC aged without H2O2, except
ADCAT. The impact of H2O2 exposure appeared to be stronger at the beginning of the ageing
duration, but then the rate of deterioration slowed with longer ageing. The bench-scale
quenching kinetics results for the GACs tested using accelerated ageing tests (as introduced in
Chapter 3) may overestimate the quenching performance of GAC based on pilot-scale studies.
The normalized oxygen and nitrogen abundance on the surface of GAC from pilot-scale
columns increased by 22% to 1246% compared to virgin GACs after ageing with natural water
only. When H2O2 was applied to the water, the normalized O and N abundance showed a
decrease compared to the GAC aged with natural water only.
Bench-scale H2O2 decomposition tests using Centaur from the Lorne Park Water
Treatment Plant’s full-scale contactor (operated by down-flow) showed that the sample from the

49
2-year old contactor had approximately a 20% slower quenching rate compared to the one with
1-year operation. Samples of the AC from the onta tor’s top layer had the best performance,
while GAC from the bottom layer had the worst.

50
4.1 INTRODUCTION
In Chapter 3, the effect of GAC ageing (exposure to natural water with and without
H2O2) on the reaction rate with H2O2 was explored. The ageing process, however, was somewhat
artificial. A small column (7.5 cm) containing GAC was exposed to a 158 mL/min flow for up to
45 000 bed volumes. The empty bed contact time (EBCT) of this process was around 0.24
minutes, while the EBCT of the full-scale GAC contactors at the Lorne Park Water Treatment
Facility is 4.12 minutes. Therefore, the accelerated ageing process may not be representative of
ageing of GAC in the full-scale contactors.
To provide a more realistic simulation of a full-scale GAC contactor, the work in Chapter
3 was reproduced at pilot-scale. If the pilot-scale results match the same trends as were observed
in the bench-scale tests, then it would indicate that the bench-scale tests adequately simulated
large-scale GAC performance for H2O2 quenching, and could be used in the future for exploring
other aspects of quenching without the time and expense associated with pilot tests. A case study
using GAC samples from the full-scale contactors at the Lorne Park Water Treatment Facility
(Mississauga, Ontario, Canada) was also conducted to validate pilot-scale and bench-scale
results.
4.2 OBJECTIVE
The main objective was to evaluate the performance of GAC for the quenching of H2O2
using pilot-scale columns. The specific objectives included the following:
(1) To evaluate the H2O2 quenching performance of six GACs (Centaur, ADCAT, F300,
GAC300, HD3000 and TN5) after different levels of ageing with NOM (25 000 bed volumes and
45 000 bed volumes), and after ageing with NOM+4 mg/L H2O2.
(2) To compare the H2O2 decomposition kinetics tests results using GAC samples from pilot-
scale columns with the ones using accelerated aged GAC (as introduced in Chapter 3) for
validation of bench-scale tests.
(3) To study the changes of GAC surface characteristics after the ageing process (aged with
NOM, and with NOM+H2O2 to 25 000 bed volumes, 45 000 bed volumes) by X-ray
photoelectron spectroscopy (XPS) analysis and scanning electron microscopy (SEM) imaging.
(4) To evaluate the impact of ageing with natural water containing NOM using GAC from the

51
full-scale contactors and to investigate the differences in quenching performance using GAC
sampled from different depths of the contactor.
4.3 MATERIAL AND METHODS
4.3.1 Pilot-Scale Set-up
4.3.1.1 Column design
To simulate full-scale GAC contactors, 22 pilot-scale glass columns were installed at the
Lorne Park Water Treatment Facility (Mississauga, Ontario, Canada). Glass columns were
selected to prevent any reaction between the GAC and the interior wall of the column. The
columns were 1 inch in diameter. While this diameter is smaller than traditionally recommended
for pilot filter columns (Mehta and Hawley, 1969), the GAC pilot contactors were not designed
for backwash, and preliminary testing proved that the flow through the columns was completely
plug flow, which are the main considerations when designing pilot filter columns for
conventional media filtration. The other dimensions and the operating parameters of the pilot-
scale columns were identical to the full-scale GAC contactors in the plant (Table 4.1). Four
sampling ports were located along the columns to allow observation of the H2O2 quenching
along the contactor depth (Figure 4.1). The detailed pilot column design is shown in Appendix
D.3.
Table 4.1: Lorne Park GAC Contactors
Parameters Value
Cross-sectional area (m2) 107
Average flow rate (L/day) 47 500 000
Media volume (m3) 136.01
Media depth (m) 1.27
EBCT (min) 4.12
Approach velocity (m/hr) 18.36

52
Figure 4.1: Schematic of Pilot-scale Column Design
4.3.1.2 Source Water and Carbon Preparation
The source water for this pilot study was ultrafiltration membrane permeate pumped from
the Lorne Park Water Treatment Facility. Water quality details are shown in Table 4.2. Six types
of GAC were used, as shown in Table 3.2. Representative GAC samples were obtained by the
coning and quartering method (ASTM D346) and washed with Mill-Q water before use.
membrane
permeate
pump
H2O
2 injection
clear glass column:
Height =1.28m;
Diameter = 1 inch
sampling
ports
influent
effluent

53
Table 4.2: Water Quality of Membrane Permeate
Parameters Average Value
Total organic matter (mg/L) 2.2
UV254 (cm-1
) 0.018
Alkalinity (mg/L as CaCO3) 98
pH 7.8
Turbidity (NTU) 0.116
4.3.1.3 Running Conditions
Twenty-two columns were run to investigate the ageing effect on GAC for H2O2
quenching. The conditions for the 22 columns are shown in Table 4.3. After being aged to the
desired NOM saturation level (e.g., at 25 000 bed volumes), the top layer of GAC sample
(approximately the top 2-3 cm) in each column was collected, freeze-dried and preserved for
H2O2 decomposition tests, as described in part 4.3.2.
Table 4.3: Pilot-scale Columns Ageing Conditions
GAC type Ageing conditions
Centaur
Aged with NOM to 25 000, 45 000 and
100 000 bed volumes, respectively
(in duplicate); 6 columns in total
Aged with NOM+ 4 mg/L H2O2 to 25 000,
45 000 and 100 000 bed volumes, respectively
(in duplicate); 6 columns in total
ADCAT Aged with NOM to 100 000 bed volumes
(25 000 bed volumes and 45 000 bed
volumes had 1 run breakthrough test
respectively); 5 columns in total
Aged with NOM+ 4mg/L H2O2 to 100 000 bed
volumes (25 000 bed volumes and 45 000 bed
volumes had 1 run breakthrough test
respectively); 5 columns in total
F300
GAC300
HD3000
TN5
4.3.2 Tests to Study Quenching Performance
The ability of the GAC to quench H2O2 was evaluated using two tests: a pilot-scale H2O2
breakthrough test, and a bench-scale H2O2 decomposition kinetics test. The pilot-scale
breakthrough test was simply a measurement of the H2O2 concentration profile along the depth
of the column when the influent water was temporarily spiked with 10 mg/L H2O2, which is
plausibly the maximum H2O2 concentration that might be applied in practice (note that the
normal exposure to H2O2 during the GAC ageing process was 4 mg/L, as per Table 4.3). The
duration of the spiking event prior to sampling H2O2 breakthrough was approximately 2 000 bed
volumes. The bench-scale decomposition test was as described in Chapter 3, and involved

54
collecting GAC samples from the top of pilot column after the breakthrough tests on-site, and
brought to the laboratory for batch H2O2 quenching kinetics tests.
H2O2 analysis for the breakthrough tests was performed using a K-5543 H2O2 test kit
(CHEMetrics, Virginia, US) and a Hach DR ™ portable spectrophotometer. This method is
based on the ferric thiocyanate method (Boltz and Howell, 1978). The minimum detection limit
of this method was determined to be 0.04 mg/L. Dissolve oxygen level was measured by an YSI
550A DO meter (Yellow Springs Inc., Ohio, US).
4.4 RESULTS AND DISCUSSION
4.4.1 H2O2 Breakthrough Tests
H2O2 breakthrough tests with an initial H2O2 concentration of 10 mg/L were conducted at
25 000 bed volumes (Figure 4.2 and Figure 4.3) and 45 000 bed volumes (Figure 4.4 and Figure
4.5) in pilot-scale columns. The differences between GAC aged with NOM and GAC aged with
NOM+H2O2 at all four sampling ports and effluents are shown in Table 4.4. The impact of
carbon age and H2O2 exposure, carbon performance at different depths in the column, and
comparison of six GACs would be discussed accordingly.
Figure 4.2: H2O2 Breakthrough, GAC aged with NOM (25 000 bed volumes)
0
20
40
60
80
100
120
140
0.00 2.00 4.00 6.00 8.00 10.00 12.00
GA
C c
olu
mn
dep
th (
cm)
H2O2 residual concentration(mg/L)
F300
TN5
Centaur
GAC300
HD3000
ADCAT
2mg/L

55
Figure 4.3: H2O2 Breakthrough, GAC aged with NOM+4mg/L H2O2 (25 000 bed volumes)
Figure 4.4: H2O2 Breakthrough, GAC aged with NOM (45 000 bed volumes)
Figure 4.5: H2O2 Breakthrough, GAC aged with NOM+4mg/L H2O2 (45 000 bed volumes)
0
20
40
60
80
100
120
140
0.00 2.00 4.00 6.00 8.00 10.00 12.00
GA
C c
olu
mn
dep
th (
cm)
H2O2 residual concentration(mg/L)
F300
TN5
Centaur
GAC300
HD3000
ADCAT
2mg/L
0
20
40
60
80
100
120
140
0.00 5.00 10.00 15.00
GA
C c
olu
mn
de
pth
(cm
)
H2O2 residual concentration(mg/L)
F300
TN5
Centaur
GAC300
HD3000
ADCAT
0
20
40
60
80
100
120
140
0.00 2.00 4.00 6.00 8.00 10.00 12.00
GA
C c
olu
mn
dep
th (
cm)
H2O2 residual concentration(mg/L)
F300
TN5
Centaur
GAC300
HD3000
ADCAT
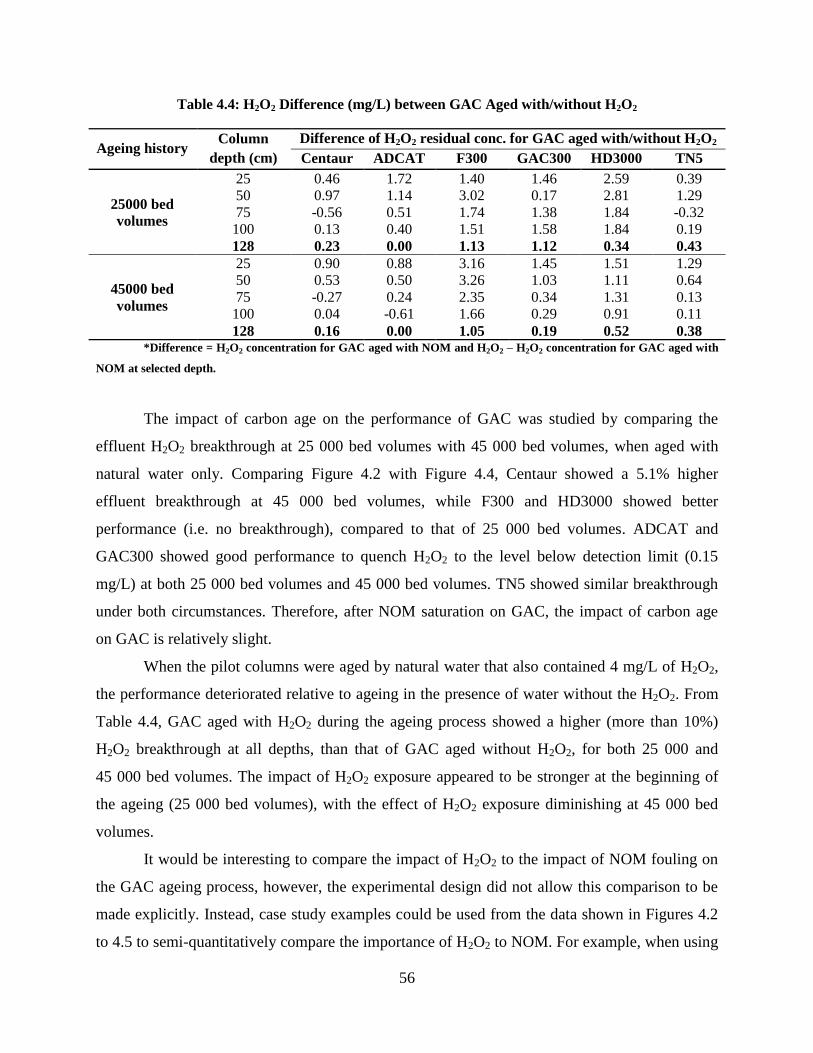
56
Table 4.4: H2O2 Difference (mg/L) between GAC Aged with/without H2O2
Ageing history Column
depth (cm)
Difference of H2O2 residual conc. for GAC aged with/without H2O2
Centaur ADCAT F300 GAC300 HD3000 TN5
25000 bed
volumes
25 0.46 1.72 1.40 1.46 2.59 0.39
50 0.97 1.14 3.02 0.17 2.81 1.29
75 -0.56 0.51 1.74 1.38 1.84 -0.32
100 0.13 0.40 1.51 1.58 1.84 0.19
128 0.23 0.00 1.13 1.12 0.34 0.43
45000 bed
volumes
25 0.90 0.88 3.16 1.45 1.51 1.29
50 0.53 0.50 3.26 1.03 1.11 0.64
75 -0.27 0.24 2.35 0.34 1.31 0.13
100 0.04 -0.61 1.66 0.29 0.91 0.11
128 0.16 0.00 1.05 0.19 0.52 0.38 *Difference = H2O2 concentration for GAC aged with NOM and H2O2 – H2O2 concentration for GAC aged with
NOM at selected depth.
The impact of carbon age on the performance of GAC was studied by comparing the
effluent H2O2 breakthrough at 25 000 bed volumes with 45 000 bed volumes, when aged with
natural water only. Comparing Figure 4.2 with Figure 4.4, Centaur showed a 5.1% higher
effluent breakthrough at 45 000 bed volumes, while F300 and HD3000 showed better
performance (i.e. no breakthrough), compared to that of 25 000 bed volumes. ADCAT and
GAC300 showed good performance to quench H2O2 to the level below detection limit (0.15
mg/L) at both 25 000 bed volumes and 45 000 bed volumes. TN5 showed similar breakthrough
under both circumstances. Therefore, after NOM saturation on GAC, the impact of carbon age
on GAC is relatively slight.
When the pilot columns were aged by natural water that also contained 4 mg/L of H2O2,
the performance deteriorated relative to ageing in the presence of water without the H2O2. From
Table 4.4, GAC aged with H2O2 during the ageing process showed a higher (more than 10%)
H2O2 breakthrough at all depths, than that of GAC aged without H2O2, for both 25 000 and
45 000 bed volumes. The impact of H2O2 exposure appeared to be stronger at the beginning of
the ageing (25 000 bed volumes), with the effect of H2O2 exposure diminishing at 45 000 bed
volumes.
It would be interesting to compare the impact of H2O2 to the impact of NOM fouling on
the GAC ageing process, however, the experimental design did not allow this comparison to be
made explicitly. Instead, case study examples could be used from the data shown in Figures 4.2
to 4.5 to semi-quantitatively compare the importance of H2O2 to NOM. For example, when using

57
the GAC300 data from Figures 4.2 and 4.3, if it were a design goal to reduce the H2O2
concentration to 2 mg/L, then it would take 60 cm of GAC depth to achieve the treatment goal at
25 000 bed volumes when the GAC300 was aged with natural water only, while it would take 80
cm (20 cm more GAC) when aged with H2O2 present in the water. This suggests that the
presence of H2O2 in the water that is flowing through the GAC contactor has a measurable, but
perhaps not overwhelming impact on the required bed depth to treat the water. Further research
is required in this area.
The overall performance (i.e. effluent H2O2 concentration) of each GAC is ranked in
Table 4.5. Catalytic ADCAT had the most stable performance under all circumstances, while the
coconut-based TN5 showed overall poorest performance for the quenching of H2O2.
Table 4.5: Ranking of GAC Performance for the Quenching of H2O2
Centaur ADCAT F300 GAC300 HD3000 TN5
25 000 bed volumes
with NOM 1 1 5 1 1 6
25 000 bed volumes
with NOM+H2O2 2 1 6 4 3 5
45 000 bed volumes
with NOM 5 1 1 1 4 6
45 000 bed volumes
with NOM+H2O2 3 1 5 2 4 5
*Same ranking indicates same effluent concentration for comparison. Rank “1” also indicates no breakthrough detected.
4.4.2 Validation of Bench-scale H2O2 Decomposition Kinetics Tests
Bench-scale H2O2 decomposition kinetics tests (introduced in Chapter 3) were
reproduced with GAC samples collected from pilot-scale columns. Results from the tests were
compared to the ones in Chapter 3 and shown in Table 4.6. The number in the parenthesis shows
the percentage difference between the k value for GAC from pilot-scale columns (Chapter 4) and
the k value from the accelerated ageing GAC test of Chapter 3.

58
Table 4.6: Comparison of Pilot-scale GAC and Accelerated Ageing Test GAC
GAC
Average k for pilot-scale GAC Average k for accelerated ageing test GAC
25000 bed volumes 45000 bed volumes 25000 bed volumes 45 000 bed volumes
NOM NOM+
H2O2 NOM
NOM+
H2O2 NOM
NOM+
H2O2 NOM
NOM+
H2O2
Centaur 0.0009
(-30.8%)
0.001
(-47.4%)
0.0007
(-56.3%)
0.0007
(-50.0%) 0.0013 0.0019 0.0016 0.0014
ADCAT 0.0014
(-41.7%)
0.0013
(-45.8%)
0.0011
(-54.2%)
0.0013
(-45.8%) 0.0024 0.0024 0.0024 0.0024
F300 0.0008
(-33.3%)
0.0006
(-57.1%)
0.0008
(-38.5%)
0.0005
(-54.5%) 0.0012 0.0014 0.0013 0.0011
GAC300 0.0013
(-31.6%)
0.0009
(-57.1%)
0.0012
(-29.4%)
0.0009
(-52.6%) 0.0019 0.0021 0.0017 0.0019
HD3000 0.0011
(-26.7%)
0.0007
(-65.0%)
0.0010
(-28.6%)
0.0005
(-68.8%) 0.0015 0.002 0.0014 0.0016
TN5 0.0008
(-52.9%)
0.0007
(-65.0%)
0.0008
(-42.9%)
0.0005
(-64.3%) 0.0017 0.002 0.0014 0.0014
According to Table 4.6, the k values for pilot-scale GAC samples were 25%-65% smaller
than the ones obtained by using the accelerated ageing test GAC described in Chapter 3,
suggesting that the H2O2 quenching process at pilot scale was significantly slower than predicted
when using the bench-scale batch tests. A tu ent’s t-test (Table 4.7) indicated that these
differences were almost all significant at the 95% level when comparing the pilot-scale versus
bench-scale test results for GAC aged with NOM and H2O2, but that only 5 out of 12 tests where
the GAC was aged only with NOM were significantly different at the 95% level (although, as per
Table 4.6, the average trend was universal). This suggests that the difference between the pilot-
scale and bench-scale tests is greater when ageing occurs by both NOM and H2O2.
Table 4.7: Student t-test Results for k Values Different between Pilot-scale and Accelerated Ageing
Test GAC
GAC
k value different between pilot-scale and accelerated ageing test GAC
(95% significance) (Yes/No)
25000 bed volumes 45000 bed volumes
NOM NOM+H2O2 NOM NOM+H2O2
Centaur Y Y Y Y
ADCAT N Y Y N
F300 N Y N Y
GAC300 Y Y Y Y
HD3000 N Y N Y
TN5 N Y Y Y
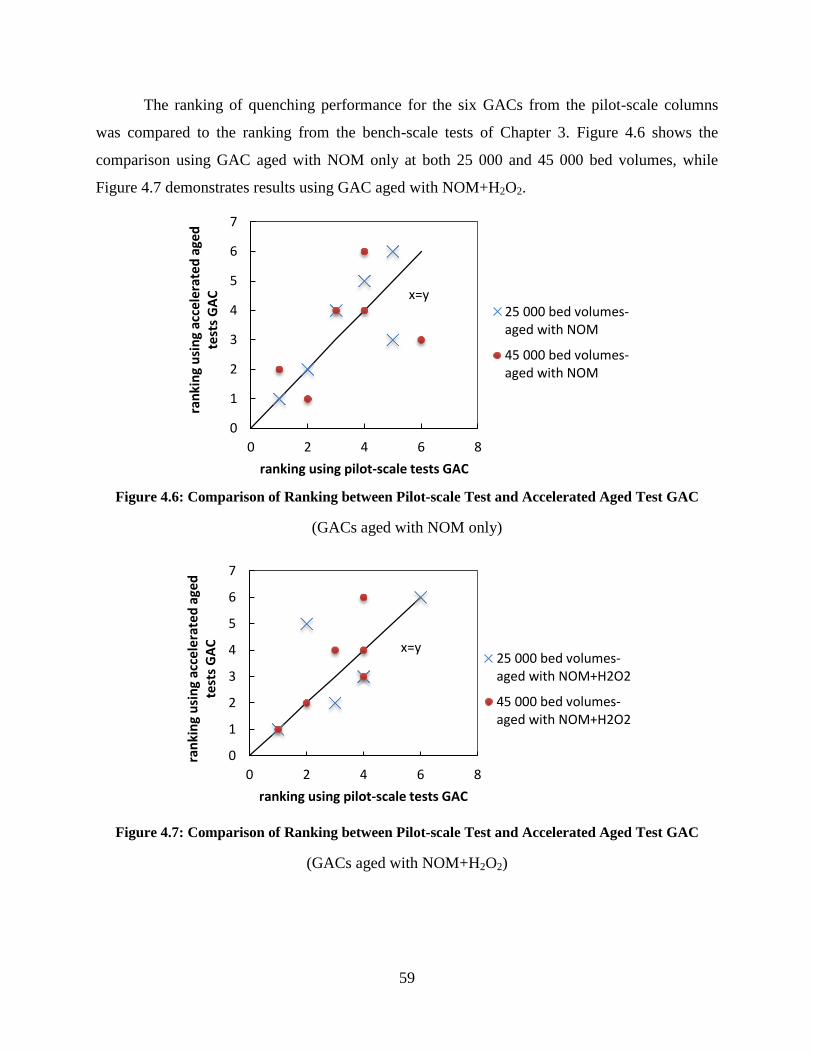
59
The ranking of quenching performance for the six GACs from the pilot-scale columns
was compared to the ranking from the bench-scale tests of Chapter 3. Figure 4.6 shows the
comparison using GAC aged with NOM only at both 25 000 and 45 000 bed volumes, while
Figure 4.7 demonstrates results using GAC aged with NOM+H2O2.
Figure 4.6: Comparison of Ranking between Pilot-scale Test and Accelerated Aged Test GAC
(GACs aged with NOM only)
Figure 4.7: Comparison of Ranking between Pilot-scale Test and Accelerated Aged Test GAC
(GACs aged with NOM+H2O2)
0
1
2
3
4
5
6
7
0 2 4 6 8
ran
kin
g u
sin
g ac
cele
rate
d a
ged
te
sts
GA
C
ranking using pilot-scale tests GAC
25 000 bed volumes-aged with NOM
45 000 bed volumes-aged with NOM
x=y
0
1
2
3
4
5
6
7
0 2 4 6 8
ran
kin
g u
sin
g ac
cele
rate
d a
ged
te
sts
GA
C
ranking using pilot-scale tests GAC
25 000 bed volumes-aged with NOM+H2O2
45 000 bed volumes-aged with NOM+H2O2
x=y

60
According to Figure 4.6, the ranking from accelerated aged tests GAC only provided 1/4
accurate predictions compared to that of pilot-scale tests GAC when aged with natural water only.
With the addition of H2O2 during ageing process, the accuracy of the ranking prediction was 50%
(Figure 4.7). Therefore, the accelerated aged test result may not be sufficient to predict pilot-
scale test results.
For the kinetics test result using pilot-scale GAC samples (Table 4.6 left side), the
ADCAT performed the best after ageing in the pilot-scale column, which is consistent with the
bench-scale test results of Chapter 3. In the previous TOC removal study (Figure 3.1), ADCAT
had the poorest performance in terms of TOC removal, so it is plausible that this leads to a
smaller fouling effect in terms of H2O2 quenching. For the other five types of GAC, the NOM
fouling effect was relatively close.
For the impact of H2O2 exposure on the quenching performance of GAC samples from
pilot-scale columns in H2O2 decomposition kinetics tests, Student t-tests were conducted to
compare pilot-scale column samples aged with NOM, and with NOM+H2O2 (Table 4.8). Three
types of GAC indicate that the H2O2 was significantly affecting the GAC performance with 95%
confidence at 25 000 bed volumes. But at 45 000 bed volumes, only one GAC showed a
significant difference with 95% confidence. This may indicate that the impact of H2O2 exposure
may be strong at the beginning, and then becomes weaker as the ageing process continues.
Table 4.8: Effect of the H2O2 Exposure during the Ageing Process on H2O2 Removal
GAC
k value different between GAC aged with/without H2O2 from pilot-scale columns
(95% significance ) (Yes/No)
25000 bed volumes 45000 bed volumes
Centaur N N
ADCAT N N
F300 N N
GAC300 Y Y
HD3000 Y N
TN5 Y N
4.4.3 XPS Analysis
Samples aged with NOM and with NOM+H2O2 were analyzed by XPS for surface
element composition (Figure 4.8 and Figure 4.9) and surface functional group information (Table

61
4.10 and Table 4.11) to observe whether either could be correlated directly to changes in H2O2
quenching performance.
Figure 4.8: XPS Analysis for GAC Aged with NOM, and NOM+H2O2 (25000 bed volumes)
Figure 4.9: XPS Analysis for GAC Aged with NOM, and with NOM+H2O2 (45 000 bed volumes)
Compared to virgin GACs, the normalized oxygen and nitrogen abundance on aged
GACs (i.e. aged with NOM, or NOM+H2O2 to 25 000 and 45 000 bed volumes) from pilot-scale
0.00
0.10
0.20
0.30
0.40
0.50
No
rmal
izat
ion
of
ele
me
nt
com
po
nen
t (C
=1.0
)
O
N
Mn
S
Ca
Fe
0.00
0.10
0.20
0.30
0.40
0.50
0.60
No
rmal
izat
ion
of
ele
me
nt
com
po
ne
nt
(C=1
.0)
O
N
S
Ca
Cl
Fe
Mn

62
columns appeared to increase, as shown in Table 4.9, by 22% to 1246%. For the impact of H2O2
exposure during the ageing process, the normalized O and N abundance showed a decrease for
most GACs aged with NOM+H2O2 compared to the ones aged with natural water only. The
hypothesis in this study would be that the reaction between H2O2 and NOM in the presence of
GAC led to the mineralization of NOM, presumably by the hydroxyl radicals generated on GAC
surface. According to Huang et al. (2003b), the removal of organic pollutant, 2-CP, was
increased when with both H2O2 and GAC, compared to with GAC only. It is likely that with less
NOM adsorbed on the GAC surface during this equilibrium, compared with GAC aged without
H2O2, the normalized O and N abundance subsequently decreased. But this hypothesis should be
further explored to be able to better understand the mechanism of GAC ageing.
The analysis of surface functional groups with carbon binding is shown in Table 4.11 and
Table 4.12. Compared to virgin GACs, the surface functional group containing a carbon-oxygen
double bond (R1O(C=O)OR2) on aged GACs at 45 000 bed volumes had a sharp decrease (73%-
92%), while the surface functional group containing carbon-oxygen single bond (-C-O-C or O-
C-O) increased. According to Rey et al. (2011), H2O2 decomposition on activated carbon
surfaces occurs predominantly on electron-rich sites. Therefore, a change from carbon-oxygen
double bonds to single bonds could lead to a decrease in the performance of quenching H2O2.
Table 4.9: Percentage Difference of O and N Components between Aged and Virgin GAC
Ageing
conditions
Centaur
(%)
ADCAT
(%)
F300
(%)
GAC300
(%)
HD3000
(%)
TN5
(%)
O N O N O N O N O N O N
with NOM
25 000 BVs 161 1507 105 410 221 1158 519 862 192 815 61 483
with NOM+H2O2
25 000 BVs 202 989 67 279 152 1012 190 534 166 908 23 415
with NOM
45 000 BVs 194 1246 243 616 416 954 780 1120 307 805 150 422
with NOM+H2O2
45 000 BVs 145 1031 132 520 178 1008 338 997 143 707 22 556
*Percentage Difference = (normalized component abundance of aged GAC- normalized component abundance of virgin
GAC)/ normalized component abundance of virgin GAC; BVs = bed volumes

63
Table 4.10: Surface Functional Group Analysis from XPS (25 000 bed volumes)
GAC type -C- -C-O-C -C-C*-
O-C-O or
RCOR O-C=O dummy
At% At% At% At% At% At%
Centaur-NOM 55.9 16.3 11.9 9.1 4.0 2.8
Centaur-NOM+H2O2 53.1 19.6 11.0 8.4 4.4 3.6
ADCAT-NOM 65.9 9.7 10.8 8.7 3.5 1.9
ADCAT-NOM+H2O2 67.0 6.8 10.9 7.6 3.0 4.7
F300-NOM 63.1 8.2 11.1 12.8 2.3 2.5
F300-NOM+H2O2 62.9 8.3 12.4 9.4 3.3 3.8
GAC300-NOM 57.9 11.9 13.2 11.6 0.8 4.6
GAC300-NOM+H2O2 62.0 10.6 10.6 7.3 6.3 3.1
HD3000-NOM 61.2 9.8 11.4 11.8 1.4 4.4
HD3000-NOM+H2O2 62.2 10.4 11.0 7.9 2.7 5.8
TN5-NOM 64.6 8.9 12.2 9.1 1.7 3.5
TN5-NOM+H2O2 62.5 9.4 12.3 9.2 1.0 5.6
*At% = atom percentage; dummy indicates the corresponding binding energy cannot be defined as specific known
surface functional group.
Table 4.11: Surface Functional Group Analysis from XPS (45 000 bed volumes)
-C- -C-C*- -C-O-C-
O-C-O or
RCOR O-C=O R1O(C=O)OR2
At% At% At% At% At% At%
Centaur-NOM 57.1 9.2 16.3 13.1 3.5 0.8
Centaur-NOM+H2O2 56.3 9.4 15.4 14.3 3.3 1.4
ADCAT-NOM 54.3 11.9 14.9 13.6 3.6 1.8
ADCAT-NOM+ H2O2 57.1 4.9 16.2 15.3 5.9 0.5
F300-NOM 48.9 12.7 15.1 17.1 4.1 2.2
F300-NOM+ H2O2 58.6 11.2 11.8 12.6 4.4 1.4
G300-NOM 48.1 10.2 16.7 19.1 4.5 1.5
G300-NOM+ H2O2 57.2 10.4 12.8 13.9 4.0 1.6
HD3000-NOM 55.6 7.6 14.9 17.2 3.5 1.1
HD3000-NOM+ H2O2 59.5 8.9 13.0 12.8 3.9 2.0
TN5-NOM 56.0 8.4 14.5 17.2 3.2 0.7
TN5-NOM+ H2O2 56.4 7.2 17.5 14.7 2.6 1.6
*At% = atom percentage
4.4.4 SEM Imaging
SEM images for six GACs aged with NOM, and with NOM+H2O2 at 45 000 bed
volumes, are shown in Figure 4.10 to Figure 4.15.
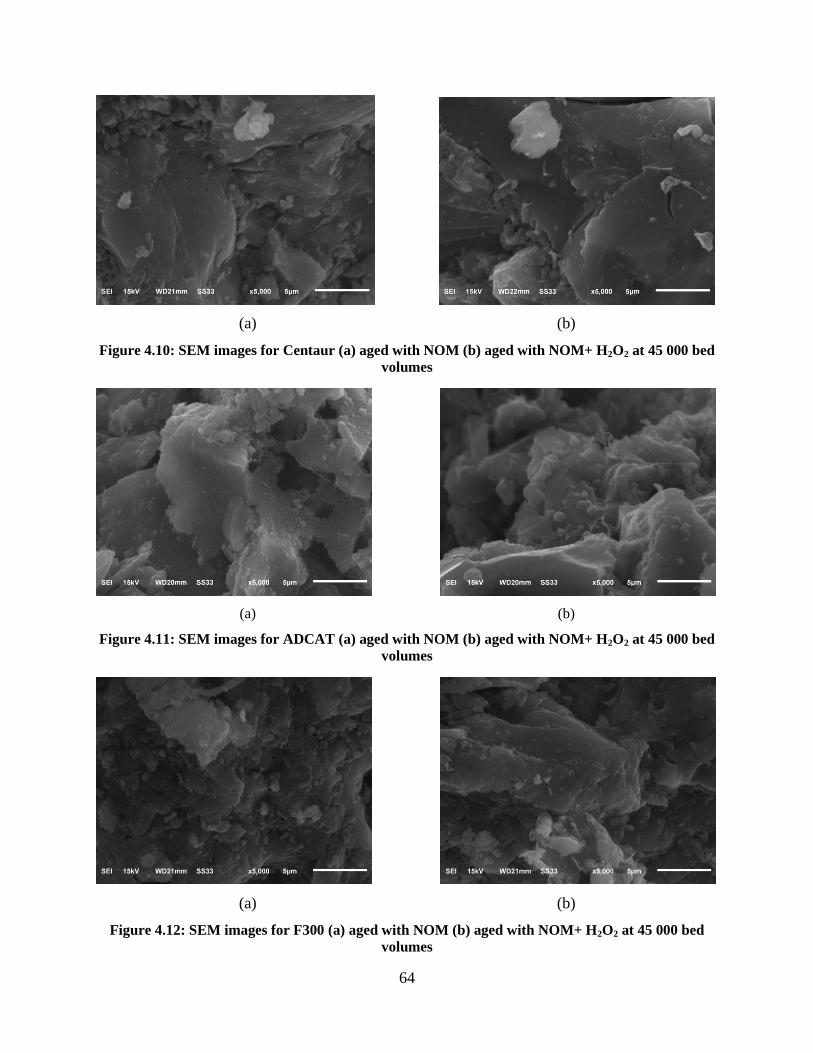
64
(a) (b)
Figure 4.10: SEM images for Centaur (a) aged with NOM (b) aged with NOM+ H2O2 at 45 000 bed
volumes
(a) (b)
Figure 4.11: SEM images for ADCAT (a) aged with NOM (b) aged with NOM+ H2O2 at 45 000 bed
volumes
(a) (b)
Figure 4.12: SEM images for F300 (a) aged with NOM (b) aged with NOM+ H2O2 at 45 000 bed
volumes

65
(a) (b)
Figure 4.13: SEM images for GAC300 (a) aged with NOM (b) aged with NOM+ H2O2 at 45 000 bed
volumes
(a) (b)
Figure 4.14: SEM images for HD3000 (a) aged with NOM (b) aged with NOM+ H2O2 at 45 000 bed
volumes
(a) (b)
Figure 4.15: SEM images for TN5 (a) aged with NOM (b) aged with NOM+ H2O2 at 45 000 bed
volumes

66
The surfaces of the aged GACs tended to be flat, either with or without H2O2 exposure
during the ageing process. As discussed in Chapter 3, the hypothesis in this study would be that
NOM fouling created a film on the GAC surface, resulting in the blockage of some active sites.
The observation of film forming on GAC surface after ageing was also reported by Yu et al.
(2009).
4.4.5 Study of Full-scale GAC Samples
4.4.5.1 Introduction
An additional study using GAC samples from two full-scale GAC contactors (GACCs) at
the Lorne Park Water Treatment Facility was conducted. The two GACCs, with Centaur as
media (US sieve size 8 30) have operated for either approximately 1 year (GACC2, equivalent
to 130 000 bed volumes of water treated) or 2 years (GACC8, equivalent to 260 000 bed
volumes of water treated). Both GACC2 and GACC8 were exposed to H2O2 on only one
occasion, from September 2012 to November 2012 (approximately 32 000 bed volumes), with an
average of 4 mg/L H2O2 during that period.
The specific objectives of this study included the following:
(1) To evaluate the impact of ageing with natural water containing NOM by comparing GAC
samples from the 1-year old and 2-year old full-scale GAC contactors.
(2) To investigate the differences of H2O2 quenching performance at various depths along the
contactor by comparing GAC samples from the bottom, middle and top layers.
(3) To study the effect of influent H2O2 concentrations (4 mg/L and 10 mg/L) in the full-scale
quenching process by conducting H2O2 decomposition kinetics tests using GAC samples after an
H2O2 breakthrough test (4 mg/L and 10 mg/L).
(4) To explore the surface characteristics of full-scale GAC samples (bottom, middle and top
layer samples from GACC2) by X-ray photoelectron spectroscopy (XPS) analysis and scanning
electron microscopy (SEM) imaging.
4.4.5.2 Methods and Materials
GAC samples were collected from GACC2 and GACC8 by a PVC sampling corer. The 0
cm, 60 cm and 128 cm positions on the core were marked and approximately 5-10 grams of
GAC around the marked line were collected for bench-scale H2O2 decomposition kinetics tests,

67
representing the top, middle and bottom layers, respectively. The rest of the samples were then
transferred into the pilot columns with the same stratification. To be specific, samples from the
top 1/3, middle 1/3 and bottom 1/3 of the core were unpacked from the core to clean sampling
bags, and labeled as top, middle and bottom layer. Then samples were packed into the pilot-scale
column with the same stratification. The samples for bench-scale kinetics tests were dried and
preserved as introduced in Chapter 3. H2O2 decomposition kinetics tests were conducted to
evaluate the quenching performance of the full-scale GAC samples.
4.4.5.3 H2O2 decomposition kinetics tests: Results and Discussion
Bench-scale H2O2 decomposition kinetics test results using samples from 1-year old and
2-year old contactors are shown in Figure 4.16. Samples from GACC2 at different depths were
studied as well, as shown in Figure 4.17. The results showed that the sample from the 2-year old
contactor had approximately a 20% slower quenching speed compared to the one with 1-year
operation, but that the difference is not statistically significant at 95% confidence level according
to a student t-test. This result was consistent with the kinetics tests results using accelerated aged
tests GAC and pilot-scale tests GAC, that the performance of GAC tends to stabilize with longer
ageing.
For the samples from three depths of one contactor, the GAC from the bottom of the
contactor was less reactive with H2O2. This may be related to the dissolved oxygen (DO) level
which was 32% higher at the bottom of the contactor than at the top. It is plausible that the H2O2
quenching in the top part of the contactor was generating DO that was washed downward toward
the bottom and then reacted with the GAC lower down to cause ageing. Therefore, the
hypothesis in this study would be that the oxygen was significantly affecting the GAC ageing
process.

68
Figure 4.16: Kinetics Test Results Using Full-scale GAC
Figure 4.17: Kinetics Test Results Using Full-scale GAC at Different Depths
An additional batch test was performed to observe the H2O2 quenching rate of the two
Centaur GACs (GACC2 and GACC8) compared to virgin Centaur GAC, while the GAC samples
were collected after H2O2 breakthrough tests in pilot-scale columns, with either 4 mg/L or 10
mg/L initial H2O2 concentration for the breakthrough tests (i.e., with exposure to 4 mg/L or 10
mg/L H2O2 for approximately 2 000 bed volumes). Results are shown in Figure 4.18.
y = 0.0011x
y = 0.0009x
0.000
0.050
0.100
0.150
0.200
0.250
0.300
0.350
0.400
0 100 200 300 400
-ln
([H
2O
2]/
[H2O
2] 0
)
reaction time (min)
GACC2-June
GACC8-June
y = 0.0011x
y = 0.0006x
y = 0.0005x
0.000
0.050
0.100
0.150
0.200
0.250
0.300
0.350
0.400
0 100 200 300 400
-ln
([H
2O
2]/
[H2O
2] 0
)
reaction time (min)
GACC2-surface
GACC2-middle
GACC2-bottom

69
Figure 4.18: Kinetics Test Results Using Full-scale GAC after H2O2 Breakthrough Tests
According to Figure 4.18, the aged Centaur GACs yielded reaction rate coefficients that
were approximately 50% smaller than virgin Centaur, however, the difference between GACC2
and GACC8 activated carbon was not notable. This result is consistent with the previous
observations whereby GAC quenching performance deteriorates rapid initially, but thereafter
tends to stabilize. In this case, the GAC that had been in service for 1 year and 2 years exhibited
similar H2O2 quenching speeds. Compared to Figure 4.16, which was from samples without
H2O2 breakthrough tests, the k values for both contactors have approximately 30% decrease.
Therefore, the H2O2 running in the breakthrough tests could have destroyed the GAC surface to a
certain level to affect its performance for further quenching of H2O2. The potential reaction
between NOM and H2O2 will need to be elucidated.
4.4.5.4 XPS Analysis for Full-scale GAC Samples
GAC samples from the 1-year old and 2-year old full-scale contactors were analyzed
using XPS, with results shown in Figure 4.19. For each contactor, samples were collected from 3
depths. Compared to virgin Centaur, the full-scale samples had distinctly higher normalized
oxygen and nitrogen abundance. Samples from the 1-year old contactor had a slightly lower
oxygen to carbon ratio than those from the 2-year old contactor. The data show that exposure to
water leads to more O and N on the surface, which we believe is correlated to a lower reactivity
y = 0.0017x
y = 0.0021x
y = 0.0007x y = 0.0008x
y = 0.0007x
y = 0.0006x
0.000
0.100
0.200
0.300
0.400
0.500
0.600
0.700
0 100 200 300 400
-ln
([H
2O
2]/
[H2O
2] 0
)
reaction time (min)
virgin Centaur-after 4mg/LH2O2breakthrough test
virgin Centaur-after 10mg/LH2O2 breakthrough test
GACC2 Centaur-after 4mg/LH2O2 breakthrough test
GACC2 Centaur-after 10mg/LH2O2 breakthrough test
GACC8 Centaur-after 4mg/LH2O2 breakthrought test
GACC8 Centaur-after 10mg/LH2O2 breakthrough test

70
with H2O2. The bottom layers have higher normalized oxygen and nitrogen abundance, and also
showed lower reactivity with H2O2 (Figure 4.17), which supports this theory.
Figure 4.19: XPS Analysis for Full-scale GAC Samples at Different Depths
4.4.5.5 SEM imaging of Full-Scale Samples
SEM images for GAC samples from top, middle, and bottom layer of GACC2 are shown
in Figure 4.20. The surfaces of the full-scale GACs were much flatter than virgin Centaur. When
comparing the samples from the top layer to the bottom and middle layers, the surface Centaur
showed a less disordered structure.
(a)
0.000.050.100.150.200.250.300.350.400.450.50
No
rmal
izat
ion
of
elem
ent
com
po
nen
t (C
=1.0
) O
N
Mn
S
Ca
Fe

71
(b)
(c)
Figure 4.20: SEM Images for GAC Sample from Full-Scale Contactor
(a: top; b: middle; c: bottom, samples from GACC2 in the plant)
4.5 SUMMARY AND CONCLUSION
The effects of carbon age and H2O2 exposure during the ageing process were studied with
a pilot-scale column installation at the Lorne Park Water Treatment Facility. To evaluate the
performance of six GACs for the quenching of H2O2, pilot-scale H2O2 breakthrough tests in the
columns were conducted.
The carbon ageing observed in the pilot column tests was not as fast as observed when
using the bench-scale accelerated aged tests in Chapter 3. Even after 45 000 bed volumes of
ageing with natural water, only TN5 and Centaur showed breakthrough in the pilot-scale H2O2
breakthrough tests.

72
The pilot column tests demonstrated that the performance of GAC for quenching H2O2
was affected by the presence of H2O2 more than would be predicted by the bench tests in Chapter
3, where the presence of H2O2 had only a negligible effect on ageing, as indicated by higher
H2O2 breakthrough at all depths (except for the ADCAT). This disagreement may be due to the
much smaller EBCT in the accelerated aged tests (0.24 min) compared to the EBCT of the pilot-
scale columns (4.12min), which shortened the time of GAC exposure to dissolved oxygen which
is believed to impair the GAC’s abi ity to quen h 2O2. In the H2O2 breakthrough tests, ADCAT
had the best performance in both ageing conditions while the coconut-based TN5 showed overall
poorest performance for the quenching of H2O2. The outstanding performance of ADCAT was
correlated to the lowest TOC removal (reported in Chapter 3), suggesting that the ADCAT may
have experienced less NOM fouling than the other GACs, leading to its superior H2O2
quenching.
To validate the bench-scale tests as introduced in Chapter 3, batch H2O2 decomposition
kinetics tests using GAC taken from the pilot-scale columns were repeated. The k values for the
GAC samples collected from the pilot columns were 25%-65% smaller than the ones obtained by
using the accelerated aged GAC. Thus, the bench-scale kinetics results from accelerated aged
tests may overestimate the performance of GAC from pilot-scale samples, especially with H2O2
exposure during the ageing process.
To study the changes of GAC surface characteristics after the ageing process, XPS
analysis and SEM imaging were applied. Both the normalized oxygen and nitrogen abundance
increased by 22% to 1246% compared to virgin GACs after ageing with natural water only (no
H2O2). When H2O2 was applied to the water ageing the GAC, the normalized O and N
abundance showed a decrease compared to the GAC aged with natural water only. This is
believed to relate to a reaction between H2O2 and NOM in the presence of GAC, which might
lead to the mineralization of NOM on GAC surface, presumably by the hydroxyl radicals
generated. With less NOM adsorbed during this equilibrium, compared to the GAC aged without
H2O2, the normalized O and N abundance was reduced. In addition, a change from carbon-
oxygen double bonds to single bonds on the surface functional groups was observed, which is
believed to lead to a decrease of the H2O2 quenching rate because H2O2 decomposition on
activated carbon surfaces occurs predominantly on electron-rich sites.

73
A case study using Centaur GAC from the Lorne Park p ant’s full-scale contactors was
conducted to evaluate the impact of ageing with natural water containing NOM and to
investigate the differences of quenching performance using GAC samples from different depths
of the contactor by H2O2 decomposition kinetics tests. Results showed that the sample from the
2-year old contactor had approximately a 20% slower quenching speed compared to the one with
1-year operation, but the difference was not statistically significant at the 95% confidence level.
This result is consistent with the kinetics tests results using accelerated aged tests GAC and pilot-
scale tests GAC, where the performance of GAC tends to stabilize with longer ageing. H2O2
decomposition kinetics tests using samples from different depths showed that the top layer of
GAC had the best performance, while the bottom had the worst. This may be related to the
dissolved oxygen level, that the DO level on the bottom was 32% higher than that on the surface.
It is plausible that the oxygen was significantly affecting the GAC ageing process.
4.6 RECOMMENDATIONS FOR FUTURE WORK
In this chapter, H2O2 addition during the GAC ageing process was demonstrated to have
a strong impact on the deterioration of H2O2 quenching performance, as demonstrated by pilot-
scale H2O2 breakthrough tests. The XPS analysis showed that the normalized oxygen and
nitrogen abundance on the GAC surface decreased when aged with H2O2 exposure compared to
that without H2O2. A reduction in surface abundance of O and N would tend to indicate a more
reactive GAC for H2O2, which conflicts with the observed results. This contradiction should be
further explored to be able to better understand the mechanism of GAC ageing. In the full-scale
study, the bottom GAC was less reactive with H2O2 compared to GAC on the surface. The
hypothesis in this study was that the oxygen could be a more significant factor for the GAC
ageing process than exposure to NOM or H2O2. Experiments for a direct comparison of the
magnitude of oxygen, H2O2 and NOM on GAC ageing for H2O2 quenching could be conducted.
In addition, this study included only one water. To generalize the findings concerning the
reaction among H2O2, GAC and NOM, and allow industry professionals to be able to predict,
with much more confidence, how best to design and operate a GAC system for quenching H2O2
following advanced oxidation treatment, ageing with different types of natural waters could be
conducted.

74
4.7 REFERENCES
ASTM D346/D346M–11. Standard practice for collection and preparation of coke samples for laboratory analysis. ASTM International.
Boltz, D.F., Howell, J.A., 1978. Colorimetric determination of nonmetals, 2
nd edition, Vol. 8.
John Wiley & Sons Inc. p. 304. Huang, H.H., Lu, M.C. Chen, J.N., Lee, C.T., 2003b. Influence of surface modification on
catalytic activity of activated carbon toward decomposition of hydrogen peroxide and 2-Chlorophenol. Journal of Environmental Science and Health Part A—Toxic/Hazardous Substances & Environmental Engineering A 38 (7), 1233–1246.
Mehta, D., Hawley, M.C., 1969. Wall effect in packed columns. Industrial and Engineering
Chemistry Process Design and Development 8 (2), 280–282. Rey, A., Zazo, J.A., Casas, J.A., Bahamonde, A., Rodriguez, J.J., 2011. Influence of the
structural and surface characteristics of activated carbon on the catalytic decomposition of hydrogen peroxide. Applied Catalysis A: General 402 (1-2), 146–155.

75
5 MODELLING HYDROGEN PEROXIDE QUENCHING WITH
GRANULAR ACTIVATED CARBON
ABSTRACT
A mathematical model to predict the performance of GAC to quench H2O2 residuals after
the UV/H2O2 process was investigated. A CSTR-in-series model was develop to predict effluent
H2O2 concentrations as a function of influent H2O2, EBCT, treated bed volumes, and an
empirical reaction kinetic parameter. Experimental data from specific sites would be required for
the application of the model since parameters used to develop the model were site-specific.
In the CSTR-in-series model the reaction kinetic parameter was correlated to bed
volumes treated, the H2O2 exposure during the ageing process and the interaction of these two
items, using the bench-scale H2O2 decomposition kinetics tests results for accelerated aged tests
GAC. The model was tested by the pilot-scale H2O2 breakthrough tests results at 25 000 bed
volumes and 45 000 bed volumes. The CSTR-in-series model provided a 50% accurate
prediction for H2O2 breakthrough at four sampling ports and effluents (95% significance level,
paired t-tests) for all the ageing conditions evaluated. When aged in the absence of H2O2,
approximately 70% (95% significance level, paired t-tests) of the model predictions for H2O2
breakthrough at four sampling ports and effluents were not significantly different from the pilot-
scale breakthrough tests results.

76
5.1 INTRODUCTION
A utility that uses GAC contactors to quench H2O2 would want to track their remaining
service life to be able to anticipate the need for replacement of the GAC. At present, there are no
tools available to guide this decision. It would be helpful if a model could be developed that
could accept easily-obtained data, such as from actual full-scale performance or laboratory tests
using GAC sampled from the contactor, and then predict the future performance of the contactor.
In this chapter, a relatively simplistic model is developed using the bench-scale data obtained in
Chapter 3 and is then validated against H2O2 data obtained from the pilot-scale columns.
5.2 OBJECTIVES
The objectives of this work were:
(1) To develop a GAC contactor model that would predict effluent H2O2 concentrations as a
function of (a) influent H2O2, (b) EBCT, (c) time (treated bed volumes), and (d) empirical
reaction kinetic parameter(s), using bench-scale H2O2 decomposition tests data from accelerated
aged tests GAC.
(2) To determine the accuracy of the model by comparison to pilot-scale H2O2 breakthrough data
(25 000 bed volumes and 45 000 bed volumes).
5.3 MODEL DESCRIPTION AND PARAMETERS
A continuous stirred tank reactor (CSTR)-in-series model was used to predict the H2O2
effluent breakthrough profile, based on the configuration of the pilot-scale columns described in
Chapter 4. The column configuration is shown in Figure 5.1.
Assuming perfect mixing and only chemical reaction occurring in each CSTR in series,
the basic CSTR model can be expressed as (Schmidt, 2004):
In – Out + Production = Accumulation (5-1)

77
Figure 5.1: CSTR in Series Model for H2O2 Effluent Breakthrough Profile Prediction
For the H2O2 decomposition in the reactor, a pseudo first order kinetics law is applied
(Connors, 1991):
= - k (5-2)
where k is the pseudo first order reaction rate constant, in L/(mg min)
For the first CSTR (with depth h), by integration of Equation 2:
eff
k t
k CT
(5-3)
where [H2O2]0 is the initial influent H2O2 concentration, mg/L;

78
k is the pseudo first-order reaction rate constant, L/(mg min);
EBCT is the empty bed contact time of the full-scale GAC bed (4.12 min for this study
according to the GAC contactor at the Lorne Park Water Treatment Facility);
is the porosity of the GAC (0.62 is chosen as per Clements and Haarhoff, 2004);
H is the total length of the GAC column, 128 cm in this study;
h is the height of one CSTR, 5 cm is chosen in this study.
For the ith
CSTR, where i ≤ n, the total number of conceptual CSTRs in series, the
influent concentration of H2O2 is the effluent concentration of the i-1th
CSTR. By iteration, for
the nth
CSTR,
n =
h (5-4)
eff
eff n
k t
eff n
k CT h
(5-5)
Using Equations 5-2, 5-3, 5-4, 5-5, the effluent H2O2 concentration of the nth
CSTR is
solved as:
k CT h
(5-6)
The Centaur GAC is taken as an example to show the development of the model. The
H2O2 decomposition kinetic rate constant k can be correlated to bed volumes of water treated and
H2O2 exposure during the ageing process by a multiple linear regression model:
(5-7)
where k is the reaction rate constant, L/(mg min);
X1 is the bed volumes of water treated;
X2 is the concentration of H2O2 exposure during ageing process, mg/L;
X X is the interaction of two factors (i.e. bed volumes of water treated and H2O2
exposure)
is the standard error of the regression.

79
According to Chapter 3, k values from the H2O2 decomposition tests using accelerated
aged test GAC appeared to decrease rapidly at the beginning and then tended to stabilize. To
model this trend, the X1, X2 and X1X2 parameters in Equation 5-7 are transformed to
,
e and e
. Then, multiple regression fitting was run in Excel. The results are shown in
Table 5.1.
Table 5.1: Multiple Regression Fitting Results
Parameters in the regression R2
, e and e
0.8592
, e 0.8587
e and e
0.4245
and e
0.8590
With the highest R2, regression with all three items is chosen. The regression equation is
calculated to be:
(5-8)
Equation 5-8 is plotted in Figure 5.2, with k values from bench-scale H2O2
decomposition tests using accelerated aged GAC shown in the graph.
Figure 5.2: Comparison of k Value between Model prediction and Experimental Data
0.000
0.001
0.002
0.003
0.004
0.005
0 10000 20000 30000 40000
reac
tio
n r
ate
co
nst
ant
k (L
/(m
g·m
in)
bed volumes treated
model prediction-aged withNOM
model prediction-aged withNOM+H2O2
Bench-scale k -with NOM
Bench-scale k- withNOM+H2O2

80
To model the quenching process in a column, the k values from the prediction are
proportionally adjusted, i.e., increased volumetrically by multiplying by the ratio of GAC
percentage in a column and GAC in a batch reactor, according to Bach and Semiat (2011). The
calculation for Centaur is shown in Table 5.2.
Table 5.2: Adjustment of k Value from a Batch Reactor to a Column
GAC
Batch reactor Pilot-scale column
k value volume percentage of GAC k value volume percentage of GAC
Centaur 0.00264 0.094% 2.696 96.2% *volume percentage of GAC in a batch reactor = volume of GAC/volume of solution;
volume percentage of GAC in a pilot-scale column = (mass of GAC/apparent density of GAC)/(mass of GAC/bed density)
With Equation 5-5 and 5-7, for Centaur, the effluent concentration of H2O2 is a function
of sampling port depth, column depth, EBCT, bed volumes treated, initial concentration of H2O2
in the breakthrough test and the concentration of H2O2 exposure, as shown in Equation 5-9.
(5-9)
The development of the model for the other five types of GAC is shown in Appendix D.2.
5.4 MODELING RESULTS AND DISCUSSION
5.4.1 Prediction of H2O2 Effluent Breakthrough
H2O2 effluent breakthrough results for each type of GAC were predicted using the CSTR-
in-series model. In the model, the H2O2 exposure during the ageing process was 4 mg/L, the
same as the average influent concentration at the Lorne Park Water Treatment Facility. The
influent H2O2 was 10mg/L.
Results for 25 000 bed volumes and 45 000 bed volumes are shown from Figure 5.3 to
Figure 5.8. The prediction from the CSTR-in-series model was compared to pilot-scale
breakthrough data at different depths. In all the figures, the dashed line indicates the model
prediction.

81
(a)
(b)
(c)
0
20
40
60
80
100
120
140
0 5 10 15
colu
mn
dep
th (
cm)
H2O2 residual concentration (mg/L)
Centaur NOM-prediction-25 000bed volumes
Centaur with NOM-pilot-scale-25 000bed volumes
0
20
40
60
80
100
120
140
0 5 10 15
colu
mn
de
pth
(cm
)
H2O2 residual concentration (mg/L)
Centaur NOM+H2O2-prediction-25 000 bedvolumes
Centaur NOM+H2O2-pilot-scale test-25 000bed volumes
0
20
40
60
80
100
120
140
0 5 10 15
colu
mn
dep
th (
cm)
H2O2 residual concentration (mg/L)
Centaur NOM-prediction-45 000bed volumes
Centaur NOM-pilot-scale test-45 000bed volumes
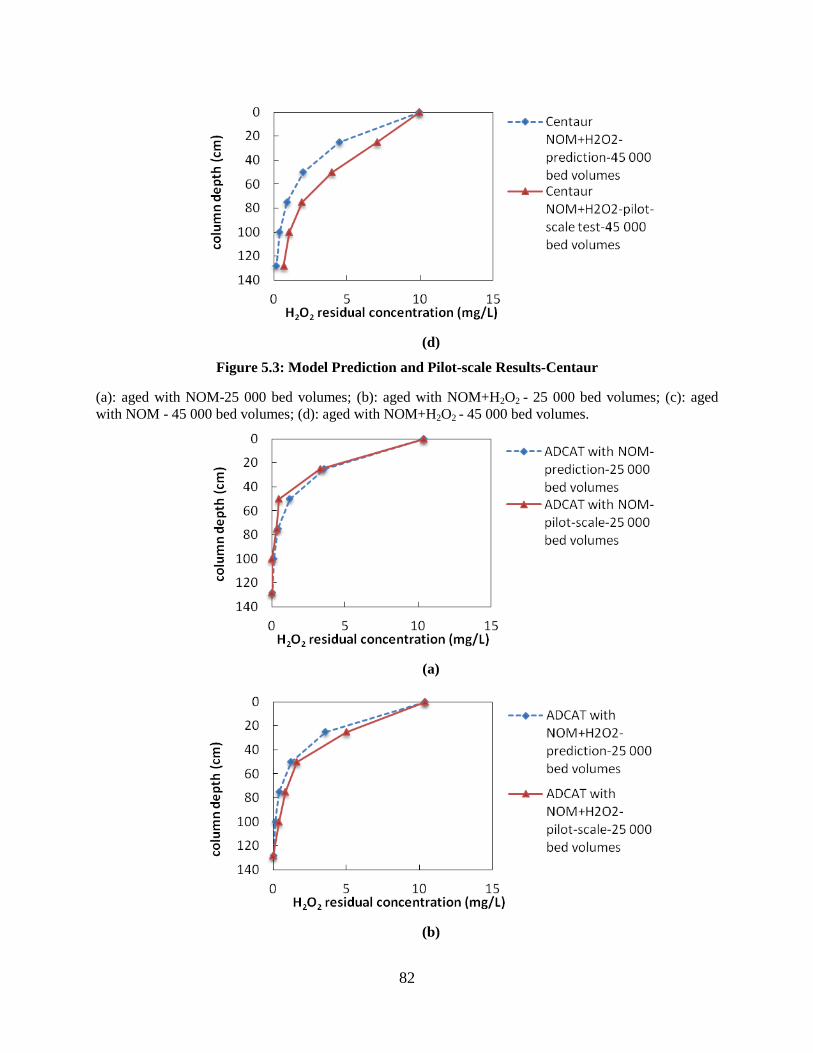
82
(d)
Figure 5.3: Model Prediction and Pilot-scale Results-Centaur
(a): aged with NOM-25 000 bed volumes; (b): aged with NOM+H2O2 - 25 000 bed volumes; (c): aged
with NOM - 45 000 bed volumes; (d): aged with NOM+H2O2 - 45 000 bed volumes.
(a)
(b)

83
(c)
(d)
Figure 5.4: Model Prediction and Pilot-scale Results -ADCAT
(a): aged with NOM-25 000 bed volumes; (b): aged with NOM+H2O2 - 25 000 bed volumes; (c): aged
with NOM - 45 000 bed volumes; (d): aged with NOM+H2O2 - 45 000 bed volumes.
(a)

84
(b)
(c)
(d)
Figure 5.5: Model Prediction and Pilot-scale Results -F300
(a): aged with NOM-25 000 bed volumes; (b): aged with NOM+H2O2 - 25 000 bed volumes; (c): aged
with NOM - 45 000 bed volumes; (d): aged with NOM+H2O2 - 45 000 bed volumes.

85
(a)
(b)
(c)

86
(d)
Figure 5.6: Model Prediction and Pilot-scale Results -GAC300
(a): aged with NOM-25 000 bed volumes; (b): aged with NOM+H2O2 -25 000 bed volumes; (c): aged
with NOM - 45 000 bed volumes; (d): aged with NOM+H2O2 - 45 000 bed volumes.
(a)
(b)
0
20
40
60
80
100
120
140
0 5 10 15
colu
mn
dep
th (
cm)
H2O2 residual concentration (mg/L)
HD3000 withNOM+H2O2-prediction-25 000bed volumes
HD3000 withNOM+H2O2-pilot-scale-25 000 bedvolumes

87
(c)
(d)
Figure 5.7: Model Prediction and Pilot-scale Results -HD3000
(a): aged with NOM-25 000 bed volumes; (b): aged with NOM+H2O2 - 25 000 bed volumes; (c): aged
with NOM - 45 000 bed volumes; (d): aged with NOM+H2O2 - 45 000 bed volumes.
(a)
0
20
40
60
80
100
120
140
0 5 10 15
colu
mn
de
pth
(cm
)
H2O2 residual concentration (mg/L)
HD3000 withNOM+H2O2-prediction-45 000bed volumes
HD3000 withNOM+H2O2-pilot-scale-45 000 bedvolumes

88
(b)
(c)
(d)
Figure 5.8: Model Prediction and Pilot-scale Results -TN5
(a): aged with NOM-25 000 bed volumes; (b): aged with NOM+H2O2 - 25 000 bed volumes; (c): aged
with NOM - 45 000 bed volumes; (d): aged with NOM+H2O2 - 45 000 bed volumes.

89
5.4.2 Evaluation of the Accuracy of the CSTR-in-Series Model
The accuracy of the CSTR-in-series model was evaluated by paired t-tests of the H2O2
breakthrough at five sampling depths (25 cm, 50 cm, 75 cm, 100 cm, 128 cm). The null
hypothesis in the paired t-test was that no difference existed between the group of model
prediction (all depths evaluated) and pilot-scale data.
The statistical difference of model prediction and pilot-scale data was analyzed with 95%
significance level, and results are shown in Table 5.3.
Table 5.3: Paired t-test Results for the Difference between Model Prediction and Pilot-scale Data
95% significance (Y/N)
Centaur ADCAT F300 GAC300 HD3000 TN5
25 000 bed volumes
with NOM N N N N Y Y
25 000 bed volumes
with NOM+H2O2 N N Y Y Y Y
45 000 bed volumes
with NOM Y N N N N Y
45 000 bed volumes
with NOM+H2O2 Y N Y N Y Y
According to Table 5.3, 50% of the predictions by the CSTR-in-series model were not
statistically different from the pilot-scale breakthrough results (at the 95% significant level)
under all ageing conditions. For ageing with natural water only, approximately 70% of the model
predictions were not significantly different from pilot-scale breakthrough tests results. But with
the presence of H2O2 during to ageing process, the accuracy dropped to around 33% and the
predicted H2O2 effluent breakthrough was 1%-11% smaller than the pilot-scale results.
Moreover, there are more significant model inaccuracies for the shallower depths in both ageing
conditions by observation. Therefore, the CSTR-in-series model would be more suitable for
H2O2 breakthrough prediction when the GAC contactor is not exposed to H2O2 during daily
operation, but the observed inaccuracy for the shallower depths should also be considered.

90
5.5 SUMMARY AND CONCLUSION
In this chapter, a CSTR-in-series model was proposed to predict the H2O2 effluent
breakthrough profile in column tests. The model is based on the correlation of a pseudo-first
order kinetic rate constant k to two major affecting factors in this study, the carbon age (bed
volumes treated) and H2O2 exposure during the ageing process. k values from bench-scale H2O2
decomposition kinetics tests using accelerated aged GAC (as introduced in Chapter 3) were
applied to develop the CSTR-in-series model. The H2O2 breakthrough test results from pilot-
scale tests at 25 000 bed volumes and 45 000 bed volumes were used to validate the model. From
the comparison, 50% of the model predictions for H2O2 breakthrough at five sampling locations
were not significantly different from the pilot-scale results (95% significance level, paired t-
tests). The model prediction for H2O2 breakthrough at five sampling locations had approximately
70% accuracy when GACs were aged without H2O2.
5.6 RECOMMENDATIONS FOR FUTURE WORK
The model described in this chapter did not provide a very good prediction of H2O2
concentrations across the depth of the pilot columns. As discussed in Chapter 4, dissolved
oxygen may be a significant factor affecting the GAC ageing process: a phenomenon that was
not accurately modeled in the batch tests that generated the data for the models. To improve the
model accuracy, methods should be developed to account for the impact of oxygen generated
from H2O2 decomposition on ageing (i.e. the k values) of the GAC.

91
5.7 REFERENCES
Bach, A., Semiat, R., 2011. The role of activated carbon as a catalyst in GAC/iron oxide/H2O2 oxidation process. Desalination 273 (1), 57–63.
Clements, M., Haarhoff, J., 2004. Practical experiences with granular activated carbon (GAC) at
the Rietvlei water treatment plant. Water SA 30 (1), 89-95. Connors, K.A., 1991. Chemical kinetics, the study of reaction rates in solution. US: VCH
Publishers. Schmidt, L.D., 2004. The engineering of chemical reactions. 2nd edition. US: Oxford University
Press.

92
6 SUMMARY, CONCLUSION AND RECOMMENDATIONS
6.1 SUMMARY AND CONCLUSION
The performance of six types of GAC to quench H2O2 was evaluated by bench-scale
H2O2 decomposition kinetics tests using GAC from accelerated aged tests, and pilot-scale H2O2
breakthrough tests in columns. A CSTR-in-series model was proposed to predict the H2O2
breakthrough in the GAC contactor. The effects of carbon ageing and H2O2 exposure during the
ageing process on the GAC performance were investigated. XPS analysis and SEM imaging
were applied to understand the changes to the GAC surface characteristics.
In the bench-scale H2O2 decomposition kinetics tests using accelerated aged tests GAC,
the addition of H2O2 had only a small to negligible impact on GAC performance compared to
exposure to the water (containing NOM) only. Furthermore, the amount of ageing (25 000 vs.
35 000 vs. 45 000 bed volumes) did not have a great impact on GAC performance, but all ageing
levels showed significant deterioration in performance relative to virgin GAC. This suggests that
GAC performance rapidly deteriorates upon installation (within 25 000 bed volumes), but then
the rate of deterioration tends to stabilize.
The pilot column tests demonstrated that the performance of GAC for quenching H2O2
was more affected by the presence of H2O2 than would be predicted by the bench tests in Chapter
3, where the presence of H2O2 had only a negligible effect on ageing, as indicated by a higher
(more than 10%) H2O2 breakthrough in the effluents, than that of GAC aged without H2O2,
except ADCAT. But whether the impact of H2O2 addition is more significant than the impact of
NOM fouling is not elucidated. The carbon ageing observed in the pilot column tests was not as
fast as observed when using the bench-scale accelerated aged tests in Chapter 3. Even after
45 000 bed volumes of ageing with natural water, only TN5 and Centaur showed breakthrough in
the pilot-scale H2O2 breakthrough tests. It is possible that the presence of dissolved oxygen
generated by the H2O2 caused more significant ageing in the pilot columns than would be
experienced in the batch test, where much of the generated DO could have escaped from the
system.
XPS analysis and SEM imaging showed that the increase of normalized oxygen and
nitrogen abundances on the surface of aged GAC compared to virgin GACs, which was
presumed to be caused by NOM saturation, could result in the decrease of the H2O2 quenching

93
performance by the GAC. When GAC was aged with H2O2, the normalized O and N abundance
showed a decrease compared to the GAC aged with natural water only. In this study, the
hypothesis would be that a reaction between H2O2 and NOM in the presence of GAC occurred,
which might lead to the mineralization of NOM on GAC surface, presumably by the hydroxyl
radicals generated.
An additional study about H2O2 decomposition using samples from different depths of
the full-scale contactor at the Lorne Park Water Treatment Facility showed an interesting result,
that the bottom GAC was less reactive than the top layer of GAC. It is plausible that the oxygen
was significantly affecting the GAC ageing process, since the dissolved oxygen level on the
bottom was 32% higher than that on the top layer.
A CSTR-in-series model was developed to predict effluent H2O2 concentrations as a
function of influent H2O2, EBCT, treated bed volumes, and an empirical reaction kinetic
parameter. The model was tested using the H2O2 breakthrough tests results from pilot-scale tests
at 25 000 bed volumes and 45 000 bed volumes. 50% of the model predictions for H2O2
breakthrough at five sampling locations were not significantly different from the pilot-scale
results (95% significance level, paired t-tests). When GAC was aged without H2O2, the model
prediction for H2O2 breakthrough at five sampling locations could provide approximately 70%
accurate prediction.
6.2 RECOMMENDATIONS FOR FUTURE WORK
The recommendations from this thesis are to:
Reproduce bench-scale H2O2 decomposition kinetics tests at different pH and temperatures to
be more representative of the full range of treatment plant conditions.
Reproduce the ageing process with different types of natural waters.
Conduct experiments for a direct comparison of the magnitude of oxygen, H2O2 and NOM
on GAC ageing for H2O2 quenching.
Conduct mesh size sieving to study the potential influence on H2O2 quenching caused by
particle size and its distribution.
Correlate the DO level with reaction rate constant to improve the accuracy of the CSTR-in-
series model.

94
APPENDICES
95
A: EXPERIMENTAL PROTOCOLS

96
A.1 CARBON PROPERTY DETERMINATION
A.1.1 Apparent density measurement
Set-up and method were obtained from Smith (2011), Appendix B.5.1 APPARENT DENSITY.
A.1.2 Iodine number test
Set-up and method were obtained from Smith (2011), Appendix B.6.1 IODINE NUMBER
TEST.
A.1.3 Trace capacity number test
Set-up and method were obtained from Smith (2011), Appendix B.6.2 TRACE CAPACITY
NUMBER.
A.2 TOTAL ORGANIC CARBON ANALYSIS
Method was obtained from Smith (2011), Appendix B.7 TOTAL ORGANIC CARBON.
A.3 CARBON DRYING
Method was obtained from Andrews (1990), Appendix I.4 Procedure for Freeze-Drying Granular
Activated Carbon.
REFERENCE
Smith, K.M. (2011). Characterization of Activated Carbon for Taste and Odour Control. MASc Thesis, Toronto: University of Toronto, 112-115.
Andrews, R.C. (1990). Removal of Low Concentrations of Chlorination By-products Using
Activated Carbon. Ph.D dissertation, University of Alberta, Canada.

97
B: PRELIMINARY TESTS

98
B.1 MODELING WITH ADDESIGNSTM
B.1.1 Introduction
This part aims to discuss the suitability of applying AdDesignSTM
software to predict the
capacity of a specific GAC (Calgon Centaur Carbon) for quenching H2O2. The porous and
surface diffusion model (PSDM) incorporated in the software is selected to develop an H2O2
effluent concentration profile.
The detailed description of the PSDM can be found elsewhere (Zhang 2012). The model
assumes a constant flow rate with local adsorption equilibrium existing between the solute and
adsorbent particles. A linear driving force is used to describe the bulk phase mass flux at the
exterior surface of the adsorbent, while the intraparticle mass flux is expressed by surface
diffusion and pore diffusion. The Freundlich isotherm equation is used to model single
compound adsorption equilibrium (Crittenden et al., 1987). Similar to the HSDM model, this
model does not consider liquid-phase mass transfer resistance when estimating surface diffusion
coefficients (Chakravort et al., 1974).
To determine the suitability of using this model, the first problem is whether the model
can take into account both the chemical redox reaction and adsorption processes between H2O2
and GAC. The initial assumption made in this work is that the chemical oxidation rate of H2O2
adsorbed to the surface of GAC is fast relative to the adsorption rate. This allows the oxidation
reaction to be ignored when modeling the removal of H2O2 from the water phase when using the
AdDesignSTM
software. The assumption will be tested subsequently in this work. Another
assumption that is inherent in the AdDesignSTM
software, that liquid-mass transfer resistance is
negligible, can be proven by either calculating the surface Biot number, i.e. the ratio of the
liquid-phase mass transfer rate to the intraparticle mass transfer rate (Hand et al., 1984), or
conducting a completely mixed batch reactor (CMBR) experiment as described by Hand et al.
(1983). The proof will be shown and discussed in section B.1.3. In addition, AdDesignSTM
requires the input of Freundlich isotherm parameters. While adsorption isotherm tests can be
performed using H2O2, since the removal of H2O2 is due to a combination of adsorption and
chemical reaction on the surface of the activated carbon, the appropriateness of using a
Freundlich adsorption isotherm model is unknown, and will be explored as part of this research.

99
B.1.2 Parameters Required in AdDesignSTM
Input for modeling by user
Table B.1: User Input for Modeling
Water properties pressure; temperature
Fixed bed properties bed length; bed diameter; bed mass; flow rate;
EBCT
Adsorbent properties name; apparent density; particle radius; porosity; particle shape
factor
Component properties
name; molecular weight; molar volume at NBP*; boiling point;
initial concentration; liquid density; solubility; vapor pressure;
refractive index; CAS number
Freundlich isotherm parameters k; 1/n
Kinetics surface to pore diffusion flux ratio (SPDFR); tortuosity
Fouling of GAC water type; chemical type *NBP: Normal boiling point
H2O2 properties were generated from the StEPPTM
software database, which is incorporated in
the AdDesignSTM
software, or selected from reference (Nikitin et al., 1995). Details about input
and calculated parameters are shown as following.
Parameters calculated by software
Table B.2: Parameters Calculated by Software
Adsorbent dimensionless groups
Stanton number; surface diffusivity modulus; pore diffusivity
modulus; pore Biot number; surface Biot number; pore solute
distribution parameter; surface solute distribution parameter
Fixed bed properties bed density; bed porosity; superficial velocity; interstitial velocity
Kinetics parameters film diffusion; surface diffusion; pore diffusion
The correlation or equations to estimate or calculate parameters are shown in B.1.6.
B.1.3 Testing Model Assumptions
The Biot number, which is defined as the ratio of the liquid-phase mass transfer rate to
the intraparticle mass transfer rate (Hand et al., 1984), was calculated to check the accuracy of
the assumption that the liquid-phase mass transfer resistance is negligible. If Biot number
increases, the liquid-phase mass transfer becomes faster and thus intraparticle mass transfer rate
dominates the adsorption rate (Hand et al., 1984). AdDesignSTM
was used to calculate the Biot
number based on the input activated carbon and adsorbate parameters. From results shown in
B.1.6, the surface Biot number of 63.9 is assumed to be great enough (more than 30) to conclude

100
that intraparticle mass transfer controls the adsorption process and therefore the liquid-phase
mass transfer resistance can be neglected, as assumed (Hand et al., 1984). Thus, CMBR
experiments will not be conducted.
In the AdDesignSTM
software, the surface and pore diffusion flux ratio (SPDFR) and
Freundlich parameters are input by the user. Therefore, these variables may have impact on the
modeling results. To elucidate the effects, the PSDM were run with different values of
parameters to compare the corresponding results.
According to Sontheimer et al.(1988), the mean SPDFR value is 6.58 with a 95%
confidence interval of 4.60 to 8.56. The true SPDFR value for H2O2 on activated carbon is
unknown, so a sensitivity analysis was performed by calculating the predicted bed volumes of
water treated to 50% breakthrough while assuming SPDFR values over the entire expected range
of 5 to 8. The results, shown Table B.3 (along with several other parameters describing
breakthrough characteristics) indicate that the breakthrough of H2O2 is not supposed to be
significantly affected by the assumed value of the SPDFR. As such, an average value of 6.58
(Hand et al., 1996) is used for the rest of the modeling if not mentioned specifically.
Table B.3: Comparison of Different SPDFR
SPDFR 5.0 6.0 6.58 7.0 7.25 7.3 7.5 7.95 8.0
MTZ/cm 22.914 23.376 24.165 24.372 / 25.13 25.521 26.403 /
50%
breakthrough/days 68.18 67.83 67.80 67.79 / 67.76 67.75 67.71 /
BVT/(×104 m
3/m
3) 2.03 2.03 2.04 2.05 / 2.06 2.06 2.07 /
*“/” in i ates that the mo e returne an error when using the orrespon ing PDFR
For Freundlich parameters, k and 1/n were doubled or half reduced to evaluate the
influence of Freundlich parameter on the corresponding H2O2 effluent profiles. The results,
shown in Table B.4 (along with several other parameters describing breakthrough characteristics)
indicate that the model is sensitive to k and 1/n. By either increasing the k or 1/n respectively can
both expand the bed volume treated and extend the 50% breakthrough days. But the length of
mass transfer zone does not follow a distinct trend.

101
Table B.4: PSDM Results with Different Values of Freundlich Parameter
k[(mg/g)*(L/mg)1/n
] 228.13 228.13 228.13 456.26 114.065 456.26 456.26
1/n 0.1342 0.2684 0.067 0.1342 0.1342 0.067 0.2684
MTZ/cm 24.165 26.928 19.109 22.846 / 19.093 NA
50%
breakthrough/days 66.75 90.41 57.01 133 / 114 181
BVT×104 (m
3/m
3) 2.04 2.81 1.7 4.05 / 3.4 NA
*“/” in i ates that the mo e returne an error with the input values (may be out of the software operating range); data in bold is
original Freundlich parameter values from Peel Region Report; to reduce software error, the value of SPDFR used here is 5.00
B.1.4 Results from the PSDM
AdDesignSTM
estimates the diffusion coefficients by using correlations reported in other
literature (Sontheimer et al., 1988). Details about these correlations and a discussion about
parameter sensitivity are shown in Section B.1.6. By running the PSDM with and without the
presence of NOM respectively, the predicted H2O2 effluent concentration profiles were generated.
With the absence of NOM, as shown in Figure B.1, 50 % breakthrough occurred around 18100
bed volumes treated.
Figure B.1: PSDM Result with Organic Free Water
Peel Region conducted a pilot test to study the quenching of H2O2 by Centaur carbon in
order to evaluate the service life of GAC. In the pilot test, 10mg/L H2O2 was injected into a GAC
contactor and sampled at different time. In the result from this pilot test, as shown in Figure B.1-

102
2, the flow rate Q and EBCT is 2.59 L/min and 5.38min, respectively. Then the bed volume
treated in this test can be calculated as ςeςen an Aktaς
Bed Volume Treated (m3/m3) =
(B-1)
According to Figure B.1, it shows that less than 50% breakthrough was found within all the
operating time, which demonstrated that 50% breakthrough occurs at more than 14870 bed
volume treated.
Figure B.2: Pilot Test Result from Peel Report
(*Port 4 represents the effluent sampling position)
In the model prediction, bed volume treated at 50% breakthrough is 18100, which is in
the range of pilot scale results. However, the water matrix in the pilot test is not real UV/H2O2
effluent, but membrane permeated water from another pilot site instead, which may contains
more NOM and leads to the uncertainty of whether the two results are comparable.
In order to improve the accuracy of the PSDM in simulating the prediction of the H2O2
effluent concentration profile, scenario with the presence of NOM was studied by operating the
PSDM model with NOM fouling mode. Comparison of modeling results with and without the

103
presence of NOM is shown in Figure B.3. The H2O2 breakthrough occurs earlier with NOM
fouling.
Figure B.3: Effect of NOM Fouling on GAC
Comparing with the pilot column test results in Figure B.2, the 50% breakthrough bed
volumes treated predicted by PSDM is around 18000, which is also in the range of pilot scale
results. Thus, the PSDM can predict the breakthrough accurately to the same magnitude level
without considering the impact of NOM characteristics.
B.1.5 Summary and Conclusions
Table B.5: Comparison of Pilot Scale Result and the PSDM Results
Scenario Pilot scale PSDM without NOM PSDM with NOM
50% breakthrough/
bed volume treated > 14870 18100 18000
From the results shown in Table B.5, it can be concluded that the PSDM incorporated in
the AdDesignSTM
can accurately predict the H2O2 effluent concentration profiles to the same
magnitude level. However, it is still not confident enough to draw a conclusion that the software
can be used for the design of GAC contactor alone. One reason is the lacking of real matrix
fouling parameters concerning specific compound and GAC used in this research. Another
reason is that the AdDesignSTM
only takes into account the adsorption process, rather than both
chemical reaction and adsorption in an H2O2-quenching system using GAC. To better evaluate
the feasibility of using AdDesignSTM
to design a GAC contactor for the quenching of H2O2
0.00
0.20
0.40
0.60
0.80
1.00
1.20
0 10000 20000 30000 40000
C/C
0
Bed Volume Treated/ (m3/m3)
without fouling
with fouling

104
residual, bench scale and pilot scale experiments, which are introduced in the next chapter, will
be conducted for comparison and validation of the modeling results.
B.1.6 Supplementary Information
B.1.6.1 Information on Input and Output in AdDesignSTM
(1) H2O2 properties:
Figure B.4: H2O2 Properties
*Solubility: since H2O2 is miscible in water, the solubility value is set using the maximum value
available in the software. According to the identical results of different solubility trials, the
solubility value input will not have effect on the H2O2 effluent concentration profiles developed
by the software.
(2) Fixed bed properties:
Figure B.5: Fixed Bed Properties

105
(3) Carbon properties:
Figure B.6: Carbon Properties
(4) Polanyi parameters:
Figure B.7: Polanyi Parameters Calculated by AdDesignSTM
(5) Dimensionless groups
Figure B.8: Dimensionless Groups Calculated by AdDesignSTM
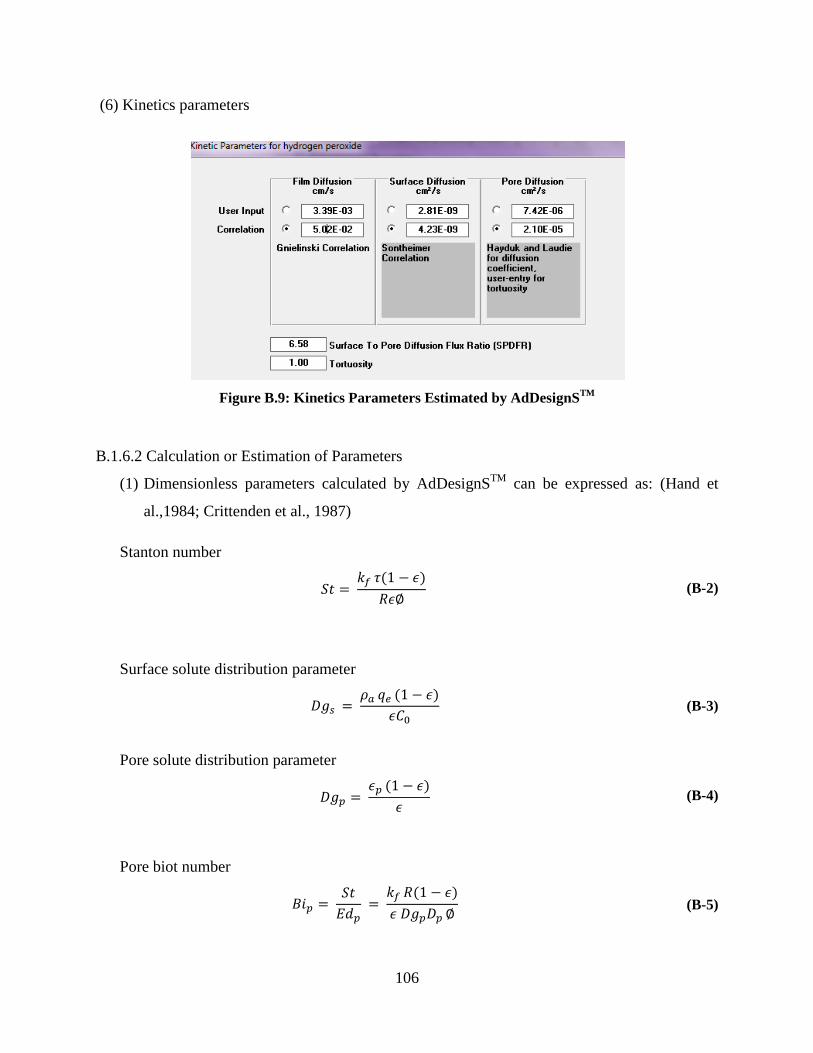
106
(6) Kinetics parameters
Figure B.9: Kinetics Parameters Estimated by AdDesignSTM
B.1.6.2 Calculation or Estimation of Parameters
(1) Dimensionless parameters calculated by AdDesignSTM
can be expressed as: (Hand et
al.,1984; Crittenden et al., 1987)
Stanton number
∅ (B-2)
Surface solute distribution parameter
(B-3)
Pore solute distribution parameter
(B-4)
Pore biot number
∅ (B-5)

107
Surface biot number
∅ (B-6)
Pore diffusivity modulus
(B-7)
Surface diffusivity modulus
(B-8)
Where
C0 is initial influent concentration (kg/m3)
Dp is pore diffusivity based on pore void fraction (m2
/s)
Ds is surface diffusion coefficient (m2/s)
kf is film transfer diffusion coefficient (m/s)
qe is adsorbent phase concentration in equilibrium with influent concentration (kg/kg)
R is adsorbent radius (m)
ϵ is fraction of volumetric space in reactor unoccupied by adsorbent, or void fraction
ϵp is fraction of volumetric space in adsorbent phase unoccupied by adsorbent on the
pore volume fraction
∅ is sphericity of adsorbent
ρa is adsorbent density which includes pore volume (kg/m3)
τ is fluid residence time in packed bed, or packed bed contact time (s)
(2) Film transfer diffusion coefficient kf (m/s)
It is estimated using the Gnielinski correlation (Sontheimer et al. 1988):
(B-9)
Where
dp is the adsorbent particle diameter (m)

108
DL is the adsorbate liquid phase diffusivity (m2
/s)
is fraction of volumetric space in reactor unoccupied by adsorbent, or void fraction
Re is Reynolds numbers, calculated as
; ρ is the iqui phase ensity kg/m
3), V
is iqui phase interstitia ve o ity m/s an μ is the iqui phase vis osity kg/m/s)
Sc is Schmidt numbers, calculated as
This correlation is valid when Re is within 1 to 100 and Sc is between 0.6 and 10000
(Sontheimer et al. 1988) and is generally used for activated carbon fixed-bed adsrobers.
(3) Liquid diffusivity (cm2/s)
The correlation given by Hayduk and Laudie (1974) can be quoted as:
(B-10)
Where
Vb is the molar volume of the chemical at the normal boiling point (cm3/mol)
μ is the liquid phase viscosity (kg/m/s)
This correlation was developed based on three previous correlations, from direct experimental
result from the diffusivities of vinyl chloride monomer in water and used on 89 compounds to
evaluate the accuracy.
(4) Pore Diffusion Coefficient Dp
The pore diffusion coefficient is related to the adsorbate diffusivity and the intra-particle
physical properties. The calculation can be expressed as (Sontheimer et al. 1988):
(B-11)
Where
DL is the adsorbate liquid phase diffusivity (cm2/s)
τp is the adsorbent tortuosity
This is a rough estimation of pore diffusion coefficient. It assumes that the diffusion of the
adsorbate molecules in the pore liquid can describe the transport resistance within the adsorbent
grain (Sontheimer et al., 1988).

109
(5) Surface Diffusion Coefficient Ds
The surface diffusion coefficient is obtained by relating the surface diffusion flux to the pore
diffusion flux by a correlation factor, the surface to pore diffusion flux ratio (SPDFR). The
surface diffusion coefficient can be calculated as (Sontheimer et al. 1988):
(B-12)
Where
C0 is initial influent concentration (mg/L)
DL is the adsorbate liquid phase diffusivity (cm2/s)
Ds is surface diffusion coefficient (cm2/s)
qo is solid phase concentration in equilibrium with Co for a single-solute equilibrium
(mg/g)
ρa is adsorbent density which includes pore volume (g/L)
p is fraction of volumetric space in reactor unoccupied by adsorbent, or void fraction
τp is the adsorbent tortuosity
SPDFR is input by user. Tortuosity can be determined by user or using a correlation
provided by software. When fouling is considered, pore diffusion is the predominant intraparticle
mass transfer mechanism and the correlation of time and tortuosity is used. When t < 70 days, τp
When t ≥ ays τp is estimated as (Sontheimer et al. 1988):
(B-13)
Where
t is the operating time (day)
(6) Discussion on the Sensitivity of Film Transfer Diffusion Coefficient kf and Surface
Diffusion Coefficient Ds
To determine the parameter sensitivity to PSDM, changes of effluent profile for kf,
Ds, respectively and simultaneously are modeled in AdDesignSTM
. Results are shown in Figure
B.10.

110
Figure B.10: H2O2 effluent concentration profiles with different kf and Ds
(* Model cannot run if kf and Ds are increased or decreased simultaneously)
According to the study of parameter sensitivity, it can be found that the changes of kf or
Ds did not have strong impact on the effluent concentration profiles. Thus, it is acceptable to
estimate the coefficients by correlation.
B.1.6.3 Effect of Freundlich Parameter
Figure B.11: Bed Volume Treated at 50% Breakthrough with Different Freundlich Parameters
0.00
0.20
0.40
0.60
0.80
1.00
1.20
0 20000 40000 60000
C/C
0
Bed Volume Treated/ (m3/m3)
original kfand Ds0.75Kf
1.25Kf
0.75Ds
0
10000
20000
30000
40000
50000
60000
0 0.1 0.2 0.3Bed
vo
lum
e t
reat
ed
/(
m3/m
3)
at 5
0%
bre
akth
rou
gh
1/n
k=228.13
k=456.26

111
B.1.6.4 Effect of NOM Fouling
Figure B.12: Empirical Kinetics Constants in NOM fouling Correlation
Details of empirical kinetics constants for NOM fouling in different water matrix can be
found elsewhere (Jarvie et al., 2005). GAC adsorption capacity can be reduced due to the
presence of background organic matter in surface and ground waters (Jarvie et al., 2005),
represented by the reduction of Freundlich parameter k. Thus, an empirical equation was
developed to describe this trend (Sontheimer et al., 1988):
(B-14)
Where
K (t) is the Freundlich coefficient of a solute within a specific water matrix with NOM, at time
(t) of exposure to the NOM (μmol/g[L/ μmol]1/n
)
t is the adsorber operation time (min)
Ki is the empirical kinetic constants specific to a given SOC, water matrix and GAC
type (i = 1,2,3,4)
Figure B.13: Empirical Constants for specific chemical group with reference of TCE
Since the empirical kinetics constants in equation 3-13 were determined using TCE, for other
compounds, similar correlation of Freundlich parameter K can be decided with the reference of
TCE. The correlation is summarized by Jarvie et al. (2005):

112
(B-15)
Results for NOM fouling are shown in Figure B.14:
Figure B.14: Modeling results for NOM fouling

113
B.1.7 References
ςeςen F Aktaς, O., 2011. Activated carbon for water and wastewater treatment by ςeςen, F., Aktaς, O., ©Wiley- VCH Verlag & Co.: 11-20.
Chakravorti. T., Weber, W., Ranjit, K., 1974. Pore and solid diffusion models for fixed-bed
adsorbers. AlChE Journal 20 (2), 228-238. Crittenden, J.C., ASCE, M., Berrigan, J.K., Hand, D.W., ASCE, A.M., Lykins, B., 1987. Design
of rapid fixed-bed adsorption tests for nonconstant diffusivities. Journal of Environmental Engineering. 113 (2), 243-259.
Nikitin, D., Pavel, E., Pavlov, A., Popov, A.P., Nikitina, H.E., 1995. Critical properties of
hydrogen peroxide. Journal of Chemical Thermodynamics 27 (9), 945-952. Doom, T.R., 2008. Characterizing hydrogen peroxide degradation by granular activated carbon
for advanced oxidation processes in water treatment. project presentation. Hand, D.W., Crittenden, J.C., Hokanson, D.R., Bulloch, J.L., 1996. Predicting the performance
of fixed-bed granular activated carbon adsorbers. IAWQ Specialized Conference on Adsorption in Water Environment and Treatment Processes. Shirahama, Wakayama: IAWQ.
Hand, D.W., Crittenden, J.C., ASCE, M., Thacker, W.E., 1983. User-oriented batch reactor
solutions to the homogeneous surface diffusion model. Jounal of Environmental Engineering 109 (1), 82-101.
Hand, D.W., Crittenden, J.C., ASCE, M., Thacker, W.E., 1984. Simplified models for design of
fixed-bed adsorption systems. Journal of Environmental Engineering 110 (2), 440-456. Hayduk, W., Laudie, H., 1974. Prediction of diffusion coefficients for nonelectrolytes in dilute
aqueous solutions. AlChE Journal 20 (3), 611-615. Jarvie, M.E., Hand, D.W., Bhuvendralingam, S., Crittenden, J.C., Hokanson, D.R., 2005.
Simulating the performance of fixed-bed granular activated carbon adsorbers: Removal of synthetic organic chemicals in the presence of background organic matter. Water Research 39 (11), 2407–2421.
Sontheimer, H., Crittenden, J.C., Summers, R.S., 1988. Activated carbon for watertreatment.
Michigan: DVGW-Forschungsstelle, Engler-Bunte-Institut, Universitat Karlsruhe (TH). Zhang, J., 2012. Control of emerging contaminants by granular activated carbon and the impact
of natural organic matter. MASc Thesis, Toronto: University of Toronto, 112-115.
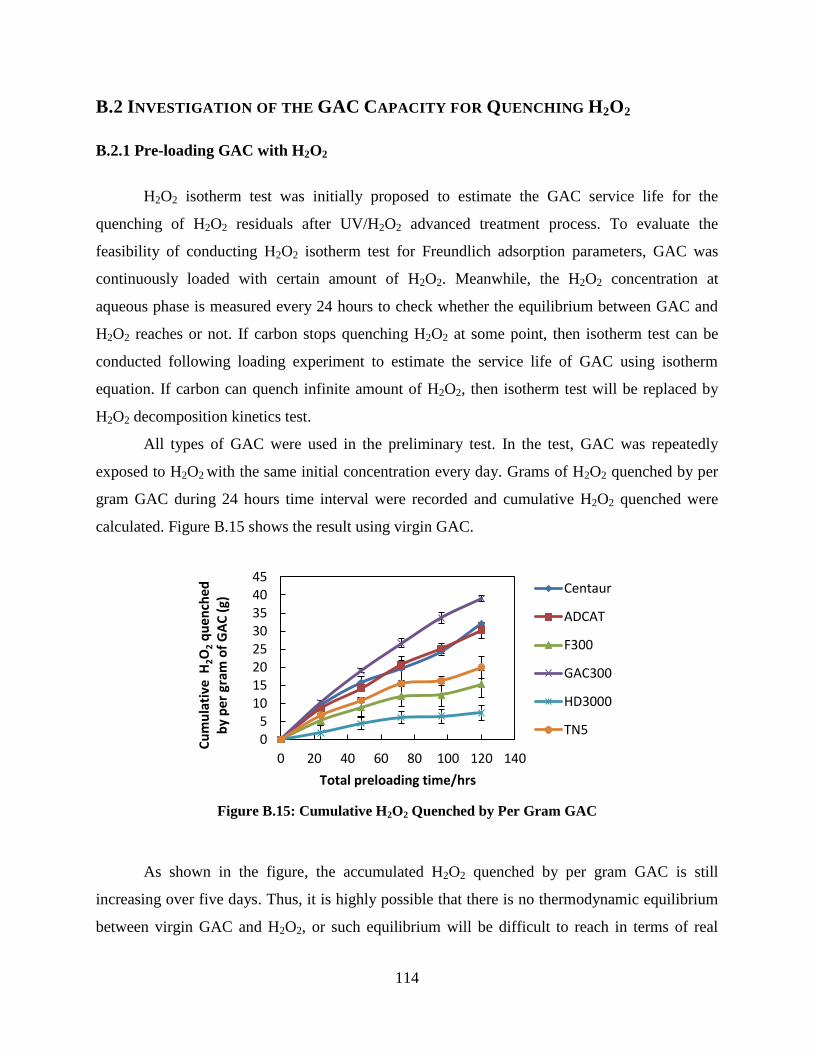
114
B.2 INVESTIGATION OF THE GAC CAPACITY FOR QUENCHING H2O2
B.2.1 Pre-loading GAC with H2O2
H2O2 isotherm test was initially proposed to estimate the GAC service life for the
quenching of H2O2 residuals after UV/H2O2 advanced treatment process. To evaluate the
feasibility of conducting H2O2 isotherm test for Freundlich adsorption parameters, GAC was
continuously loaded with certain amount of H2O2. Meanwhile, the H2O2 concentration at
aqueous phase is measured every 24 hours to check whether the equilibrium between GAC and
H2O2 reaches or not. If carbon stops quenching H2O2 at some point, then isotherm test can be
conducted following loading experiment to estimate the service life of GAC using isotherm
equation. If carbon can quench infinite amount of H2O2, then isotherm test will be replaced by
H2O2 decomposition kinetics test.
All types of GAC were used in the preliminary test. In the test, GAC was repeatedly
exposed to H2O2 with the same initial concentration every day. Grams of H2O2 quenched by per
gram GAC during 24 hours time interval were recorded and cumulative H2O2 quenched were
calculated. Figure B.15 shows the result using virgin GAC.
Figure B.15: Cumulative H2O2 Quenched by Per Gram GAC
As shown in the figure, the accumulated H2O2 quenched by per gram GAC is still
increasing over five days. Thus, it is highly possible that there is no thermodynamic equilibrium
between virgin GAC and H2O2, or such equilibrium will be difficult to reach in terms of real
05
1015202530354045
0 20 40 60 80 100 120 140
Cu
mu
lati
ve H
2O
2 q
ue
nch
ed
b
y p
er g
ram
of
GA
C (
g)
Total preloading time/hrs
Centaur
ADCAT
F300
GAC300
HD3000
TN5

115
application. Then it is hard or even impossible to conduct H2O2 isotherm test with virgin GAC.
Kinetics test for the quenching of H2O2 using GAC will be conducted as substitute.
From Figure B.15, it can also be found that the amount of H2O2 quenched by GAC during
the 24-hour time interval is decreasing, which may because of the modification of GAC surface
characteristics. The GAC surface could have some sites to be destroyed by H2O2. Therefore, the
aim of the experiment was changed to find a suitable model to describe this reaction. Current
catalytic reaction models cannot completely apply to this case.
The carbon repeatedly loaded with H2O2 experiment was conducted with different high
initial H2O2 concentrations to explore the relationship between activated GAC concentration and
cumulative H2O2 quenched by per gram GAC.
Each type of GAC was exposed to1000mg/L, 2000mg/L and 3000mg/L H2O2 solutions
respectively. In this test, the reaction between GAC and H2O2 was assumed to follow second-
order kinetics model:
(B-16)
k was etermine by measuring the initia rea tion rate after minutes’ rea tion The k values
from different high concentrations were found to be different.
Carbon pre-loaded with high concentrations of H2O2 were then removed from H2O2
solution and put in Milli-Q water for 14 days rest. After the rest, there was no H2O2 washing out
from carbon. In addition, the GAC performance for quenching H2O2 is not recovered when
exposed to new high concentration of H2O2 solution.
B.2.2 H2O2 Decomposition Kinetics Pre-test
In or er to fin an a urate rea tion rate onstant “k” for AC apa ity experiment,
kinetics tests for high concentrations of H2O2 decay were conducted. From test results, it is time
consuming to finish one kinetics test when initial H2O2 concentration is relatively high. In full-
scale operation, GAC is always at an excess level compared to the concentration of H2O2. If the
concentration of one reactant is much larger than the other one, the concentration of the excess
reactant could be regarded as constant and then pseudo first-order kinetics model can be applied.
Experiments with several low concentrations of H2O2 and a fixed GAC dose were conducted. In

116
this set of kinetics test, 5mg/L, 10mg/L and 15mg/L were selected and the GAC dose is set to be
0.25 gram. Results are shown in Figure B.16. One-way ANOVA was conducted to compare the
difference of k values among three low concentrations. The ANOVA result shows a P-value of
0.422 to indicate the difference among three concentrations is not statistically significant with
95% confidence. Thus, pseudo-first order kinetics reaction law is chosen for the expression of
H2O2 decomposition kinetics tests in the presence of GAC. 5mg/L H2O2 and 0.25 gram GAC
dose are selected for future kinetics tests.
Figure B.16: Kinetics Test Results for Different Low Concentrations of H2O2
5mg/L: y = 0.0017xR² = 0.99374
10mg/L: y = 0.0019xR² = 0.99816
15mg/L: y = 0.0017xR² = 0.99795
0.000
0.100
0.200
0.300
0.400
0.500
0.600
0.700
0 100 200 300 400
-ln
([H
2O
2]/
[H2O
2] 0
)
Reaction time/min
5mg/L
10mg/L
15mg/L

117
C: QA/QC

118
QUALITY CONTROL TEST FOR FREEZE-DRYING METHOD
In order to evaluate the impact of freeze-drying method, both virgin GAC and aged GAC
were tests using samples with and without freeze-drying. k values from H2O2 kinetics tests are
shown in Table C.1 and Table C.2.
Table C.1:Comparison between Freeze-dried and Non-freeze Dried Virgin GAC
GAC freeze dried 1 freeze dried 2 STD non-freeze dried 1 non-freeze dried 2 STD
Centaur 0.0023 0.0029 0.000424 0.0027 0.0029 0.000141
F300 0.0017 0.0018 0.000071 0.0021 0.0021 0.000000
GAC300 0.0041 0.0042 0.000071 0.0041 0.0045 0.000283
ADCAT 0.0032 0.0028 0.000283 0.0036 0.0030 0.000424
HD3000 0.0031 0.0027 0.000283 0.0024 0.0025 0.000071
TN5 0.0019 0.0021 0.000141 0.00209 0.00210 0.000007
*STD = standard deviation
Table C.2: Comparison between Freeze-dried and Non-freeze Dried Aged GAC
GAC freeze dried 1 freeze dried 2 STD non-freeze dried 1 non-freeze dried 2 STD
Centaur 0.0009 0.001 0.000071 0.0012 0.0013 0.000071
F300 0.0008 0.0006 0.000141 0.001 0.0009 0.000071
GAC300 0.0017 0.0018 0.000071 0.0017 0.0019 0.000141
ADCAT 0.00151 0.00148 0.000021 0.0015 0.0017 0.000141
HD3000 0.001 0.0009 0.000071 0.00112 0.00113 0.000007
TN5 0.000631 0.000616 0.000011 0.0010 0.0009 0.000071
Student t-test (two samples assuming equal variances) was conducted to calculate the P
value in order to determine the significance of freeze-drying impact on the k value. 50%
significance level is also selected for a non-conservative analysis since the sample size is
relatively small, and the potential impact is not clear in previous studies. Results shown in Table
C.3 and Table C.4 indicate that freeze-drying method shows significant impact on most of the
samples tested. For further experiments, the impact should be taken into consideration.

119
Table C.3: Student t-test Result for Virgin GAC
Carbon type P-value
(Two-tail)
95%
significance (Yes/No)
50% significance
(Yes/No)
Centaur 0.5918 N N
ADCAT 0.4929 N Y
F300 0.0198 Y Y
GAC300 0.5425 N N
HD3000 0.1607 N Y
TN5 0.4227 N Y
Table C.4: Student t-test Result for Aged GAC
Carbon type P-value
(Two-tail)
95%
significance (Yes/No)
50% significance
(Yes/No)
Centaur 0.05131 N Y
ADCAT 0.4227 N Y
F300 0.1548 N Y
GAC300 0.6985 N N
HD3000 0.0955 N Y
TN5 0.0198 Y Y
120
D: SUPPLEMENTARY DATA

121
D.1 H2O2 DECOMPOSITION KINETICS TEST USING GAC FROM PILOT-SCALE
COLUMNS
Samples from pilot-scale columns after 25 000 bed volumes and 45 000 bed volumes
were collected for H2O2 decomposition kinetics tests. Results for six types of GAC aged with
NOM, and six aged with NOM+H2O2 are shown in Figure D.1 to Figure D.4, respectively.
Figure D.1: Kinetics Test Results using GAC aged with NOM from Pilot-scale Column
(25 000 bed volumes)
Figure D.2: Kinetics Test Results using GAC aged with NOM+H2O2 from Pilot-scale Column
(25 000 bed volumes)

122
Figure D.3: Kinetics Test Results using GAC aged with NOM from Pilot-scale Column
(45 000 bed volumes)
Figure D.4: Kinetics Test Results using GAC aged with NOM+H2O2 from Pilot-scale Column
(45 000 bed volumes)

123
D.2 CSTR-IN-SERIES MODEL DEVELOPMENT FOR ALL TYPES OF GAC
D.2.1 Selection of Parameters for k Expression
According to the results in Chapter 3 and Chapter 4, H2O2 decomposition kinetics rate
constant k can be correlated to bed volumes of water treated and H2O2 exposure during ageing
process by a multiple linear regression model:
(D-1)
where, k is the reaction rate constant, L/(mg min);
X1 is the bed volumes of water treated;
X2 is the concentration of H2O2 exposure during ageing process, mg/L;
X X is the interaction of two factors (i.e. bed volumes of water treated and H2O2 exposure)
is the standard error of the regression.
k values from H2O2 decomposition tests using pilot-scale GAC samples appear to
decrease rapidly at the beginning and then tend to be stabilized. To model this trend, the X1, X2
and X1X2 in equation D-1 are transformed to be
, and
, respectively. Then
multiple regression fitting was run in Excel. Results of fitting are shown in Table D.1. With the
highest R2, regression with all three items is chosen for all types of GAC.
Table D.1: Comparison of Multiple Regression Fitting
Parameters in the regression R
2
Centaur ADCAT F300 GAC300 HD3000 TN5
, e and e
0.8592 0.8033 0.8148 0.9786 0.8585 0.2718
, e 0.8587 0.8033 0.8048 0.9780 0.8255 0.1964
e and e
0.4246 0.4198 0.3435 0.5334 0.39551 0.6494
and e
0.8590 0.8033 0.7836 0.9762 0.92231 0.7192

124
D.2.2 Model for Each GAC
The coefficients for selected multiple regression models were computed in Microsoft
Excel. The equations to interpret k value with correlation to bed volumes and H2O2 exposure for
each type of GAC are shown in Equation D-2 to D-7.
For Centaur:
(
(D-2)
For ADCAT:
(
(D-3)
For F300:
(
(D-4)
For GAC300:
(
(D-5)
For HD3000:
(
(D-6)
For TN5:
(
(D-7)
The k values from the prediction are proportionally adjusted, i.e., increased
volumetrically by multiplying by the ratio of GAC percentage in a column and GAC in a batch
reactor. And then substitute into the CSTR-in-series model:
k CT h
where, [H2O2]0 is the initial influent H2O2 concentration, mg/L;
k is the pseudo first-order reaction rate constant, L/(mg min);

125
EBCT is the empty bed contact time of the full-scale GAC bed (4.12 min for this study according
to the GAC contactor at the Lorne Park Water Treatment Facility);
is the porosity of the GAC (0.62 is chosen as per Clements and Haarhoff, 2004);
H is the total length of the GAC column, 128cm in this study;
h is the height of one CSTR, 5cm is chosen in this study.

126
D.3 PILOT-SCALE INSTALLATION AT THE LORNE PARK WATER TREATMENT
FACILITY
Figure D.5: Pilot-scale Installation at the Lorne Park Water Treatment Facility
(A: Full pilot-scale set-up, with 22 columns; B: sampling ports, four ports on each column)
A
B

127
Figure D.6 Figure D.6: Schematic Diagram of a Pilot-scale Column
(22 columns with the same configuration)
Table D.2: Running Conditions for Each Column
GAC type Ageing conditions
Centaur
Aged with NOM to 25 000, 45 000 and
100 000 bed volumes, respectively
(in duplicate); 6 columns in total
Aged with NOM+ 4 mg/L H2O2 to 25 000,
45 000 and 100 000 bed volumes, respectively
(in duplicate); 6 columns in total
ADCAT Aged with NOM to 100 000 bed volumes
(25 000 bed volumes and 45 000 bed
volumes had 1 run breakthrough test
respectively); 5 columns in total
Aged with NOM+ 4mg/L H2O2 to 100 000 bed
volumes (25 000 bed volumes and 45 000 bed
volumes had 1 run breakthrough test
respectively); 5 columns in total
F300
GAC300
HD3000
TN5
membrane
permeate: TOC
1.9-2.4 mg/L
Pump
H2O
2 injection:
4mg/L
1-inch clear glass column:
Height =1.28m;
EBCT: 4.12 min
sampling
ports: 25,
50, 75,
100cm
Influent flow rate: 18.36 m/hr
effluent