
Granular Activated Carbons From Agricultural By-Products ...

1
Adsorption and Bioadsorption of Granular Activated Carbon (GAC)
for Dissolved Organic Carbon (DOC) Removal in Wastewater
W. Xing, H. H. Ngo*, S. H. Kim, W. S. Guo and P. Hagare
University of Technology, Sydney, PO Box 123, Broadway, NSW 2007, Australia
* Corresponding author (Tel: 61-2-95141693, Fax: 61-2-95142633, Email: [email protected])
Abstract
In this study, the performances of GAC adsorption and GAC bioadsorption in terms of
dissolved organic carbon (DOC) removal were investigated with synthetic biologically
treated sewage effluent (BTSE), synthetic primary treated sewage effluent (PTSE), real
BTSE and real PTSE. The main aims of this study are to verify and compare the
efficiency of DOC removal by GAC (adsorption) and acclimatized GAC
(bioadsorption). The results indicated that the performance of bioadsorption was
significantly better than that of adsorption in all cases, showing the practical use of
biological granular activated carbon (BGAC) in filtration process. The most
significance was observed at a real PTSE with a GAC dose of 5 g/L, having 54% and
96% of DOC removal by adsorption and bioadsorption, respectively. In addition, it was
found that GAC adsorption equilibrium was successfully predicted by a hybrid
Langmuir - Freundlich model whilst integrated linear driving force approximation
(LDFA) + hybrid isotherm model could describe well the adsorption kinetics. Both
adsorption isotherm and kinetic coefficients determined by these models will be useful
to model the adsorption/bioadsorption process in DOC removal of BGAC filtration
system.
2
Keywords: GAC adsorption; GAC bioadsorption; adsorption modeling; dissolved
organic carbon; wastewater
1. Introduction
The domestic wastewater typically contains pathogens, suspended solids, nutrients
(nitrogen and phosphorus) and other organic pollutants. For curtailing the
environmental and health hazards, these pollutants need to be removed to permissible
limits for safe disposal of wastewater (Devi and Dahiya, 2008). Consequently, removal
of the organic contaminants and pathogens from wastewater is very important for its
reuse in different activities.
Activated carbon adsorption has been widely applied in removing organic matters from
wastewater as it has a strong affinity for attaching organic substances even at low
concentration. Having large surface area for adsorption, granular activated carbon
(GAC) is one of the best adsorbents for removing various organic contaminants
(Nishijima et al, 1997). The GAC adsorption systems are therefore considered to apply
for producing the effluent of high quality from sewage treatment plant which can be
reused for various purposes. However, even though it has high adsorption capacity,
GAC can only maintain its adsorption for a short time after its available adsorption site
becomes exhausted with adsorbed organic pollutants (Aktas and Cecen, 2007). It is
well known that GAC is also a good support media for microbial growth. Thus,

3
biological GAC (BGAC) with attached biomass can effectively remove organic
contaminants both by adsorption and biodegradation (Nishijima et al, 1997; Carvalho
et al, 2007). The concept of bioadsorption is that adsorption is more dominant before
GAC is in full adsorption capacity and the biodegradation play major role after that
(Hoang, 2005; Aktas and Cecen, 2007). The GAC bioadsorption is usually applied in
the bioreactors either fixed bed or fluidized bed configurations (Aktas and Cecen,
2007). The previous studies showed that GAC bioadsorption systems were very
efficient (Zhao et al., 1999; Maloney et al, 2002; Loh and Ranganath, 2005; Persson et
al., 2005; Hoa et al., 2008) due to their simultaneous adsorption of non-biodegradable
matter and oxidation of biodegradable contaminants in a single reactor.
The main objectives of this study are: (i) to compare the adsorption and bioadsorption
capacity of GAC in terms of dissolved organic carbon (DOC) removal from different
wastewaters; and (ii) to develop the suitable adsorption isotherm and kinetic models
which can be used for a column model to predict DOC removal in the BGAC filtration
system.
2. Experimental
2.1 Materials
2.1.1 Wastewaters used
A. Synthetic wastewaters
1. Primary treated sewage effluent (PTSE)
4
The compositions of synthetic wastewater used in this study are presented in Table 1. It
represents the wastewater after primary treatment. The average DOC concentration of
this synthetic PTSE is around 120 mg/L.
2. Biologically treated sewage effluent (BTSE)
Table 1 also shows the composition of BTSE used in this study. It is the representative
of the effluent from biological treatment. The average DOC concentration of synthetic
BTSE is about 10mg/L.
Table 1 Composition of synthetic BTSE and PTSE
B. Real wastewaters
1. Real PTSE
The sewage was collected from the SOPA (Sydney Olympic Park Authority)
Wastewater Treatment Plant. The average DOC of real PTSE is around 55mg/L.
2. Real BTSE
The real BTSE was also derived from the SOPA Wastewater Treatment Plant. It is the
effluent from the sequencing batch bioreactor (SBR) process and the DOC is around
10mg/L.
2.1.2 GAC used
The coal based GAC (ACTICARB GS1300, Activated Carbon Technologies Pty Ltd,
Australia) was used in this study. This coal based GAC has a surface area of > 1100
BET m2/g, an iodine number of > 1100 mg/ (g.min) and maximum ash and moisture

5
contents of 10% and 3% respectively. Prior to use in experiments, the GAC was rinsed
with distilled water to remove fines and dried at 105oC in the oven.
2.2 Experiments
2.2.1 GAC adsorption isotherm and kinetics
Equilibrium adsorption experiments were conducted at room temperature (25oC) with
synthetic BTSE, synthetic PTSE, real BTSE and real PTSE, respectively. Sodium
hydrogen chloride (NaOCl) was added into wastewater to prevent microorganism
growth. Different doses of GAC were distributed into 250 ml flask containing 100 ml
wastewater. To avoid the influence of the light, all flasks were covered by aluminum
foil. All samples were shaken continuously for 90 hours on a shaking table at speed
130 rpm. After 90 hours shaking, samples of wastewater were taken from all flasks and
filtered through 0.45µm filter prior to DOC analysis. The adsorbed amount (q) from
equilibrium experimental data was calculated by the following equation:
M
CCVq ei )( −
= (Eq.1)
Where q is the adsorbed amount (mg/g), V is the volume (L) of solution, iC is the
initial DOC concentration of wastewater (mg/L), eC is the equilibrium DOC
concentration (mg/L), M is the amount of adsorbents (g)
In the experiment of kinetics adsorption, GAC was distributed into 2 liters beaker filled
with wastewater at three different concentrations. The solutions with GAC were mixed
using mechanical stirrer at speed of 110 rpm for 6 hours and 72hours, respectively.

6
During the kinetic experiment, samples were taken from these three beakers at
different period of time and filtered through 0.45µm filter before analyzing DOC. The
performance of GAC adsorption was evaluated in terms of DOC removal efficiency
(%), which is estimated by the following equation:
( )100×
C
CC=RE
i
ti (Eq.2)
Where iC and tC are the initial and equilibrium DOC concentration.
2.2.2 BGAC experiments
For the comparison study, same procedure as in GAC adsorption isotherm experiments
was adopted for BGAC experiments. Fresh GAC was acclimatized to the synthetic
wastewater in a 10L aeration tank. Certain volume of GAC was taken from tank to
measure the biomass. As soon as the biomass attached on GAC reaches the steady
phase, these acclimatized GAC will be used in the BGAC experiments.
2.3 Analysis
DOC concentration of water sample was measured using Analytikjena Multi N/C 2000
analyzer. The biomass (monitored as mixed liquor volatile suspended solid, MLVSS)
was measured by APHA Standard Method (1998). For measuring MLVSS, two
samples were taken each time and calculated the average. YSI 5300 Biological Oxygen
Monitor was used to measure the specific oxygen uptake rate (SOUR).
3. Theoretical approach
3.1 Adsorption isotherm

7
Adsorption isotherm is basic requirement for designing any adsorption system.
Isotherm express the relation between the amounts of adsorbate removed from liquid
phase by unit of mass of adsorbent at fixed temperature. Since adsorption is one of the
fundamental surface phenomena, it is important to have a satisfactory description of an
equilibrium state in order to successfully represent the kinetic adsorption behavior of
any species from the fluid to the solid phase.
An accurate mathematical description of equilibrium adsorption capacity is
indispensable for reliable prediction of adsorption parameters and quantitative
comparison of adsorption behavior for different adsorbent system. These parameters of
equilibrium isotherm often provide some insight into sorption mechanism, surface
properties and affinity of the adsorbent (Passos et al., 2008).
In general, the three or more -parameter models fitted the experimental data better than
the two-parameter models. Thus, a four-parameter hybrid Langmuir-Freundlich
isotherm model was employed to describe the adsorption equilibrium in this study.
This hybrid isotherm model is based on Langmuir and Freundlich equations. It is
expressed by Equation 3:
nm CkCb
Cbqq
/1
1⋅+
⋅+
⋅⋅= (Eq. 3)
Where, q is the adsorbed amount (mg/g), C is the equilibrium organic concentration
(mg/L), qm, b, k and n are hybrid Langmuir-Freundlich constants.
At low sorbate concentration, it effectively reduces to a Freundlich isotherm and thus
do not obey Henry’s Law. At high adsorbate concentrations, it predicts the monolayer

8
sorpotion capacity characteristics of the Langmuir isotherm (Cooney, 1998).
3.2 Adsorption kinetic
Adsorption kinetics study is important in treatment of aqueous effluents as it provides
valuable information on the reaction pathway and in the mechanism of adsorption
reactions. The adsorption kinetics was described by Linear driving force approximation
(LDFA) model with total batch mass balance. It was selected because of its simplicity
and use of DOC concentration to represent the liquid phase concentration of the system
(Lee et al., 1997). The material balance in the batch reactor can be described by
(Gordon, 1996; Bansal and Goyal, 2005)
dt
dq
V
M
dt
dC−= (Eq.4)
The mass transfer rate between liquid and solid phase represented by LDFA model
(Equation 5):
( )si
p
fcc
R
k
dt
dq−
×
×=
ρ
3 (Eq.5)
Where R is radius of adsorbent (m), fk is overall mass transfer coefficient (m/s), pρ is
density of particle (kg/m3),
ic is initial concentration of adsorbate in fluid phase (mg/L),
sc is concentration of adsorbate in fluid phase at equilibrium (mg/L).
It is assumed that the adsorption rate of adsorbate by GAC is linearly proportional to a
driving force using the LDFA model, defined as the difference between the surface
concentration and the average adsorbed-phase concentration. The value of kf can be
computed using the isotherm parameters in Equations 4 and 5. It could be applied to

9
predict the kinetic experimental data. Regardless of the amount of the adsorbents,
kinetic constants had the same value with same concentration and temperature (Lee et
al., 2007).
4. Results and discussion
4.1 Performance of GAC adsorption
The adsorption isotherms of GAC in four different kinds of wastewaters are shown in
Table 2. The results indicate that the DOC removal efficiencies enhanced with
increasing in GAC dosage whilst decreasing in the equilibrium adsorbed amount. For
example, varying the dosage of GAC from 0.25g/l to 5g/L increased the DOC removal
efficiencies from 40% to 93%. However, the amount of organic matter adsorbed on
GAC dropped from 13.88 mg/g to 1.58 mg/g from synthetic BTSE. The similar results
could also be seen from the experiments of equilibrium adsorption with other
wastewaters. This could be explained that as at higher GAC dosage, the ratio of the
initial concentration of organic matters to the GAC available site is low and
subsequently the fraction of sorption is independent of the initial concentration. On the
other hand, at the lower GAC dosage, the available sites became fewer compared to the
amount of organic matter and hence resulted in the lower DOC removal efficiency. The
results also found that the optimum doses of the GAC in removing organic matter from
synthetic BTSE, synthetic PTSE, real BTSE and real PTSE were 5g/L, 50g/L, 1g/L and
40g/L, which resulted in approximately 93%, 84%, 99% and 83% DOC removal
efficiency, respectively.
Table 2 Performance of GAC adsorption
10
Description of adsorption equilibrium by an appropriate isotherm is the most important
step to design an adsorption system as it reflects the capacity or affinity of an adsorbent
for a particular adsorbate. In this study, a hybrid Langmuir-Freundlich isotherm model
was found to fit well with GAC equilibrium results. The values of hybrid Langmuir
-Freundlich isotherm constants, qm, b, k, n estimated from the plots along with the
coefficients are listed in Table 3. The qm is attributable to the saturation amount of
organic matters adsorbed. Relative low intensities of adsorption were displayed with
four kinds of wastewaters, which correspond to low degrees of favourability of
adsorption (n<1). The model results indicated that the GAC adsorption was
successfully predicted by hybrid Langmuir-Freundlich model (R2>0.9). Hence, the
combined model was able to describe and simulate the GAC adsorption equilibrium
results.
Table 3 Hybrid Langmuir-Freundlich isotherm constants of GAC adsorption (25oC)
In the GAC adsorption kinetics experiments, DOC in four different wastewaters were
quickly adsorbed within the first 90 minutes and remained consistent after that. In the
other words, during the first 90 minutes, the available sites in the coal based GAC
surface for adsorption were abundant. When all the adsorption sites were occupied and
the rates of adsorption and desorption were balanced, DOC removals by adsorption
were constant.
11
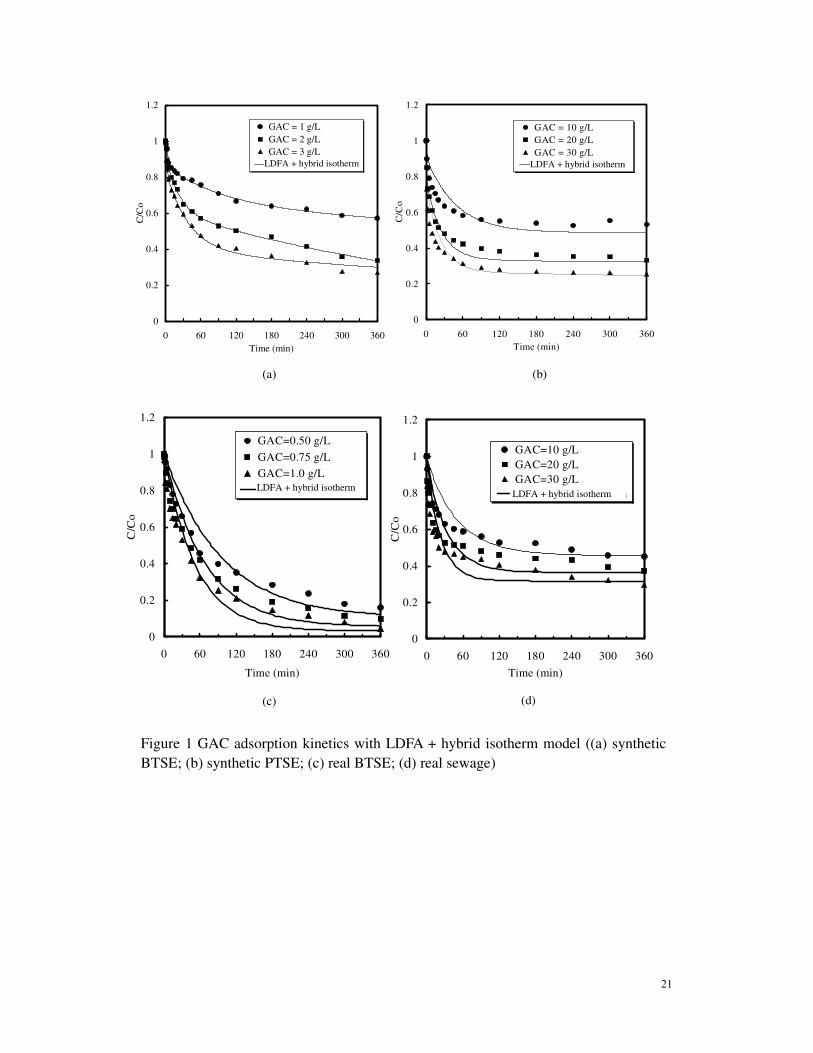
The study of adsorption kinetics is extremely relevant to the design of an adsorption
system because it yields the necessary data to estimate the mass transfer from the bulk
solution to adsorbent surface and to the interior of the adsorbent particle. In the kinetics
adsorption study, LDFA model was employed to describe and predict particle diffusion
mechanism and organics removal by GAC. As can be seen from Figure 1, the GAC
adsorption can be successfully predicted by LDFA - hybrid isotherm model. The film
mass transfer coefficient (kf) was found to be higher in case of synthetic wastewater
than that of real wastewater. For example, kf (synthetic PTSE) was 2.1 x 10⁶ compared
to kf of 2.1 x 10⁵ (real PTSE) while kf of 5.2 x 10
5 (synthetic BSTE) compared to 3.1 x
104 (real BSTE).
Figure 1 GAC adsorption kinetics with LDFA + hybrid isotherm model ((a) synthetic
BTSE; (b) synthetic PTSE; (c) real BTSE; (d) real sewage)
4.2 Performance of BGAC bioadsorption
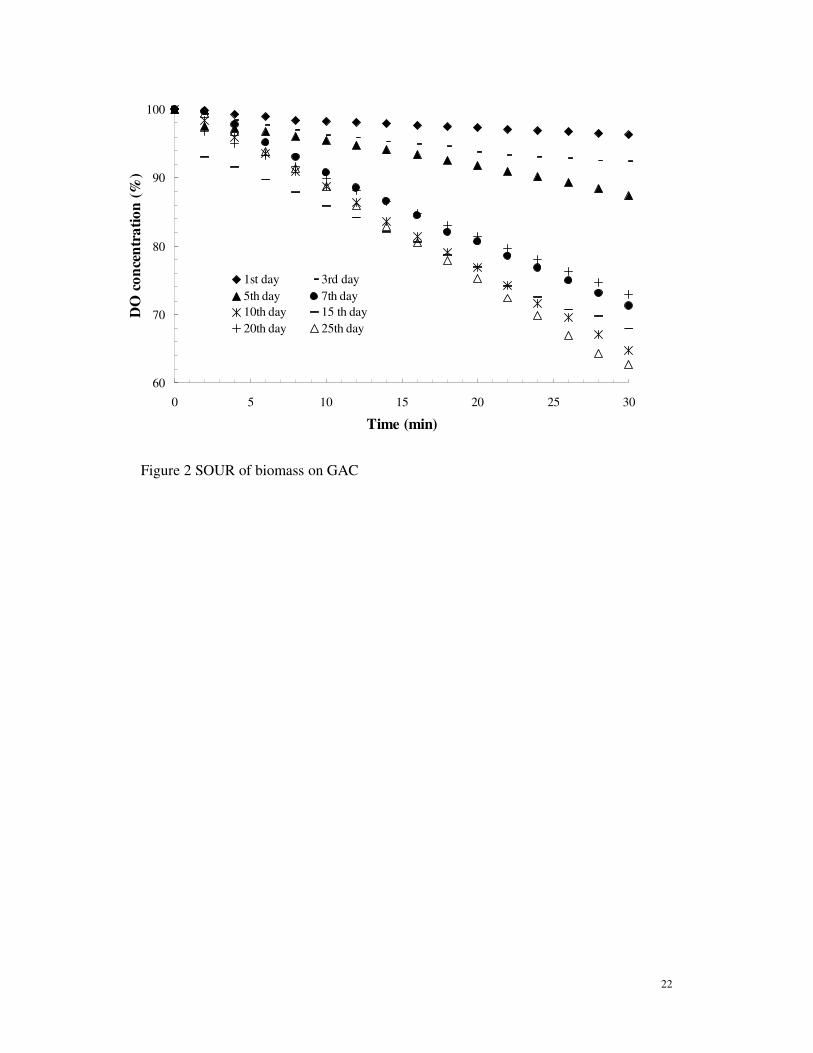
4.2.1 Biomass growth on GAC
The results showed that the biomass attached onto the GAC reached the steady phase
after 15 days with an amount of approximately 3 g/L. During the acclimatization, the 5
ml of GAC was taken from tank at different period of time to measure the specific
oxygen uptake rate (SOUR), indicating the microbial activity of the biomass on GAC.
The SOUR results indicated that the microbial activity was stronger after 5th
day which
corresponds to the higher dissolved oxygen (DO) consumption value. SOURs were
achieved to 37.7% and 34.7% within 30 minutes on the 10th
day and15th
day,
12
respectively (Figure 2).
Figure 2 SOUR of biomass on GAC
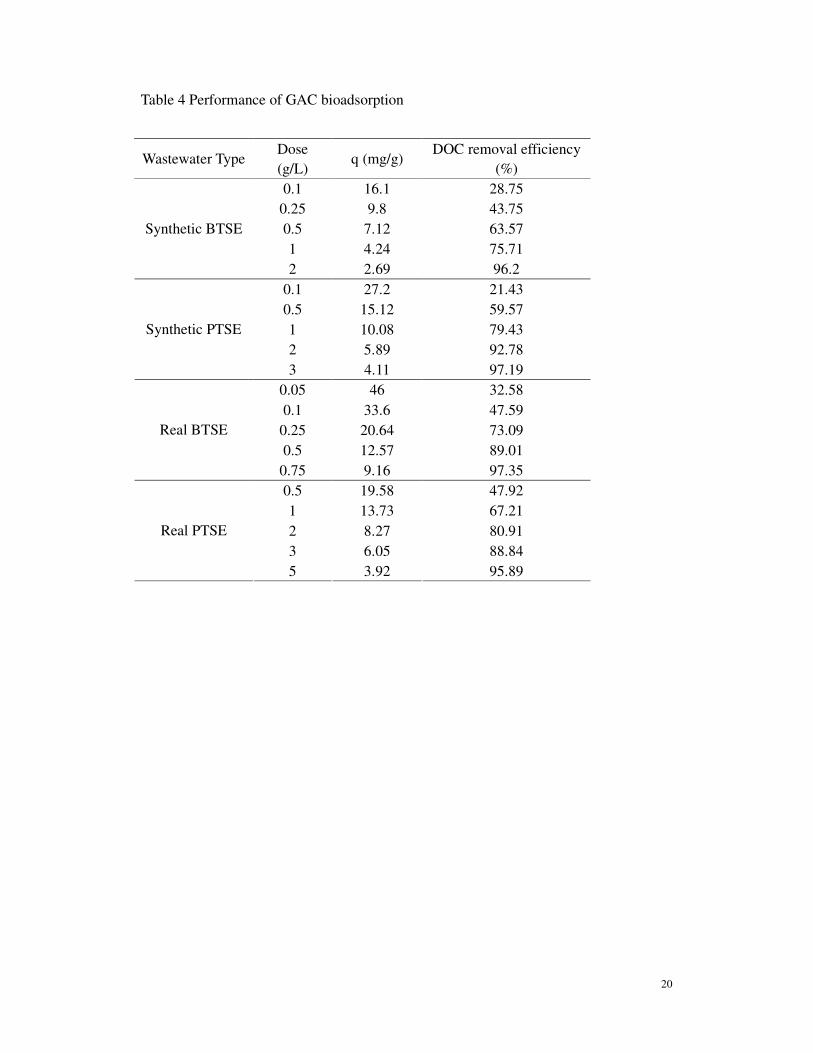
4.2.2 BGAC bioadsorption in DOC removal
As same as GAC adsorption, the higher dosage BGAC resulted in the higher DOC
removal. This is due to the available sites for adsorption and more number of
micro-organisms attached onto the GAC for organic biodegradation. The DOC
removal efficiency increased from 29% to 96% (BGAC from 0.1 g/L to 2g/L) in case
of the experiments done with synthetic BTSE. With synthetic PTSE, an amount of 3.5
g/L BGAC could almost remove 100% DOC while only 21% DOC removal with
BGAC dose of 0.1 g/L. The BGAC bioadsorption also performed well on DOC
removal from real wastewater. Table 4 shows that the DOC removal efficiencies in real
BTSE decreased from 96% to 48% when BGAC dose reduced from 0.75 g/L to 0.1 g/L.
For the BGAC bioadsorption with real PTSE, the optimum dose is 5g/L which resulted
in approximately 97% removal efficiency.
Table 4 Performance of GAC bioadsorption
Compared with GAC adsorption, GAC bioadsorption had significantly better
performance (Figure 3). The results indicate that only 2.5g/L of BGAC bioadsorption
resulted in as same DOC removals (84%) as 50g/L of GAC adsorption from real PTSE.
Thus, BGAC, with both adsorption and biodegradation mechanisms in removing
organic contaminants from wastewater, has the advantage of lowing the cost and

13
prolonging the life of GAC.
Figure 3 Performance comparisons of GAC adsorption and GAC bioadsorption
It was found that BGAC bioadsorption with wastewaters required longer equilibrium
time for all the dosages investigated. Dissolved organics were removed from wastewater
quickly within the first 6 hours, and then the removal rates increased gradually during
the next 66 hours. It can be explained that at beginning the adsorption of GAC was
more predominant and after the available sites were occupied, the organic matters were
biodegraded by the activity of microorganisms which colonized the external surface and
macro-pores of the GAC.
5. Conclusions
• DOC could be effectively removed by either GAC adsorption or bioadsorption
from different kinds of wastewater;
• BGAC bioadsorption performed significantly better than GAC adsorption,
• BGAC bioadsorption could lower the GAC dose and prolong the life time of
GAC,
• Hybrid Langmuir-Freundlich model could successfully describe the GAC
adsorption equilibriums with different wastewaters. The adsorption kinetics
model with organic matters was also well predicted by LDFA + hybrid isotherm
model.
Acknowledgements

14
This research was funded by ARC linkage project (LP 0775149). The authors are also
grateful to the supports of Sydney Olympic Park Authority (SOPA) and Activated
Carbon Technologies Pty Ltd.
References
Aktas, O., Cecen,F., 2007. Biorefgeneration of activated carbon: A review.
International Biodeterioration & Bioderadation, 59, 257-272.
APHA ,1998. Standard Methods for the Examination of Water and Wastewater, 20th
ed.
American Public Health Association, Washington, DC.
Bansal, R.C., Goyal, M., 2005. Activated carbon adsrotpion, CRC press, USA
Carvalho, M.F., Duque, A.F., Goncalves, I.C.,Castro, P.M.L., 2007. Adsorption of
fluorobenzene onto granular activated carbon: Isotherm and bioavailability studies.
Bioresource Technology, 98, 3423-3430.
Cooney, D.O., 1998. Adsorption design for wastewater treatment, Lewis Publisher,
New York.
Devi, R., Dahiya, R.P., 2008. COD and BOD removal from domestic wastewater
generated in decentralised sectors. Bioresource Technology, 998,344-349.
Gordon M., 1996. Use of Adsorbents for the removal of pollutants from wastewater,
CRC press.
Hoa, K.L., Chung, Y.C., Lin, Y.H. and Tseng C.P., 2008. Microbial populations
analysis and field application of biofilter for the removal of volatile-sulfur
compounds from swine wastewater treatment system. Journal of Hazardous
Materials 152(2), 580-588.

15
Hoang, T.T.L., 2005. Granular activated carbon (GAC) biofilter in water and
wastewater treatment, M.E.thesis, University of Technology, Sydney.
Lee, J.W., Yang, T.H., Shim, W.G., Kwon, T.O., Moon, I.S., 2007. Equilibria and
dynamics of liquid-phase trinitrotoluene adsorption on granular activated carbon:
Effect of temperature and pH, Journal of Hazardous Materials, 141(1) 185-192.
Lee, S.H., Vigneswaran, S., Moon, H., 1997. Adsorption of phosphorus in saturated
slag media columns, Sparation and Purification Technology, 12,109-118.
Loh, K.C. and Ranganath, S., 2005. External-loop fluidized bed airlift bioreactor
(EFBAB) for the cometabolic biotransformation of 4-chlorophenol (4-cp) in the
presence of phenol. Chemical Engineering Science, 60, 6313-6319.
Maloney, S.M., Adrian, N.R., Hickey, R.F. and Heine, L., 2002. Anaerobic treatment of
pinkwater in a fluidized bed reactor containing GAC. Journal of Hazardous Materials,
92, 77-88.
Nishijima, W., Akama, T., Shoto, E. and Okada, M., 1997. Effect of adsorbed
substances on bioactivity of attached bacteria on granular activated carbon. Water
Science and Technology, 35(8), 203-208.
Persson, F., Ngnark, J.L., Heinike, G., Hedberg, T., Tobiason, J., Stenstro, T.A. and
Hermansson, M.., 2005. Characterisation of the behaviour of particles in biofilters
for pre-treatment of drinking water. Water Research, 39, 3791-3800.
Passos, C.G., Lima, E.C., Arenas, L.T., Simon, N.M., Cunha, B.M., Brasil, J.L., Costa,
T.M.H., Benvenutti, E.V., 2008. Use of 7-amine-4 azahepthylsilica and 10-amine-4

16
azadecylsilica xerogels as adsrorbent for Pb(II) kinetics and equilibrium study.
Colloids and Surfaces A: Physicochem.Eng.Aspect, 316 (1-3), 297-306.
Zhao X., Hickey, R. F. and Voice,T.C., 1999. Long-term evaluation of adsorption
capacity in a biological activated carbon fluidized bed reactor system. Water Science
and Technology, 33(13), 2983-2991.

17
Table 1 Composition of synthetic BTSE and PTSE
Concentration (mg/L) Compound
BTSE PTSE
Glucose - 230
NH4HCO3 19.8 -
(NH4)2SO4 7.1 71
K2HPO4 7 -
KH2PO4 - 13.2
Peptone 2.7 2.7
Humic acid 4.2 4.2
Tannic acid 4.2 4.2
(Sodium) lignin sulfonate 2.4 2.4
Sodium lauryle sulphate 0.94 0.94
Acacia gum powder 4.7 4.7
Arabic acid (polysaccharide) 5 5
Trace nutrient
MgSO4.7H2O 0.71 5.07
CaCl2.2H2O 0.0184 0.368
MnCl2.4H2O 0.01375 0.275
ZnSO4.7H2O 0.022 0.44
FeCl3 0.0725 1.45
CuSO4.5H2O 0.01995 0.391
CoCl2.6H2O 0.021 0.42
Na2MoO4.2H2O 0.063 1.26
Beef extract 1.8 -
Yeast extract - 20

18
Table 2 Performance of GAC adsorption
Wastewater Type Dose
(g/L) q (mg/g)
DOC removal
efficiency (%)
0.25 13.88 40.63
0.5 8.52 49.88
1 5.10 59.72
2.5 2.47 72.25
Synthetic BTSE
5 1.58 92.85
2.5 9.82 21.67
5 7.26 32.05
10 5.37 47.40
25 3.21 70.80
Synthetic PTSE
50 1.89 83.57
0.1 45.80 50.78
0.25 25.84 71.62
0.5 16.52 91.60
0.75 11.60 96.46
Real BTSE
1 9.02 99.89
2.5 10.12 48.65
5 5.60 53.85
10 3.16 60.75
25 1.51 72.40
Real PTSE
40 1.07 82.16

19
Table 3 Hybrid Langmuir -Freundlich isotherm constants (25oC)
Synthetic BTSE Synthetic PTSE Real BTSE Real PTSE
qm 1.472 9.06 1.25 2.96E-03
b 4.884E+05 1.60E-02 2.37E+08 1.22E-06
k 5.492E-02 2.77E-11 3.21 8.43E-05
n 2.97E-01 1.72E-01 6.39E-01 2.80E-01
GAC
adsorption
R2 0.975 0.988 0.912 0.963
20
Table 4 Performance of GAC bioadsorption
Wastewater Type Dose
(g/L) q (mg/g)
DOC removal efficiency
(%)
0.1 16.1 28.75
0.25 9.8 43.75
0.5 7.12 63.57
1 4.24 75.71
Synthetic BTSE
2 2.69 96.2
0.1 27.2 21.43
0.5 15.12 59.57
1 10.08 79.43
2 5.89 92.78
Synthetic PTSE
3 4.11 97.19
0.05 46 32.58
0.1 33.6 47.59
0.25 20.64 73.09
0.5 12.57 89.01
Real BTSE
0.75 9.16 97.35
0.5 19.58 47.92
1 13.73 67.21
2 8.27 80.91
3 6.05 88.84
Real PTSE
5 3.92 95.89
21
Figure 1 GAC adsorption kinetics with LDFA + hybrid isotherm model ((a) synthetic
BTSE; (b) synthetic PTSE; (c) real BTSE; (d) real sewage)
(c)
0
0.2
0.4
0.6
0.8
1
1.2
0 60 120 180 240 300 360
Time (min)
C/C
o
GAC=0.50 g/L
GAC=0.75 g/L
GAC=1.0 g/L
LDFA+Dual isothermLDFA + hybrid isotherm
(a)
0
0.2
0.4
0.6
0.8
1
1.2
0 60 120 180 240 300 360
Time (min)
C/C
o
GAC = 1 g/L
GAC = 2 g/L
GAC = 3 g/L
LDFA + Dual isotherm LDFA + hybrid isotherm
(d)
0
0.2
0.4
0.6
0.8
1
1.2
0 60 120 180 240 300 360
Time (min)
C/C
o
GAC=10 g/L
GAC=20 g/L
GAC=30 g/L
LDFA + Dual isotherm LDFA + hybrid isotherm
(b)
0
0.2
0.4
0.6
0.8
1
1.2
0 60 120 180 240 300 360
Time (min)
C/C
o
GAC = 10 g/L
GAC = 20 g/L
GAC = 30 g/L
LDFA + Dual isotherm
LDFA + hybrid isotherm
22
Figure 2 SOUR of biomass on GAC
60
70
80
90
100
0 5 10 15 20 25 30
Time (min)
DO
co
nce
ntr
ati
on
(%
)
1st day 3rd day
5th day 7th day
10th day 15 th day
20th day 25th day

23
Figure 3 Performance comparisons of GAC adsorption and GAC bioadsorption
0
10
20
30
40
50
60
70
80
90
100
Synthetic BTSE
(dose : 2g/L)
Real BTSE
(dose: 0.75g/L)
Synthetic PTSE
(dose 2.5g/L)
Real PTSE
(dose: 5g/L)
DO
C R
emo
val
Eff
icie
ncy
(%
)
GAC adsorption GAC bioadsorption


