
QUARTERLY REVIEW - Bombardier Recreational … Reports...brp inc. - fy18 q1 3 josÉ boisjoli...
21
1 Presentation title Month date, year QUARTERLY REVIEW FIRST QUARTER ENDED APRIL 30, 2017
Transcript of QUARTERLY REVIEW - Bombardier Recreational … Reports...brp inc. - fy18 q1 3 josÉ boisjoli...

1 Presentation title
Month date, year
QUARTERLY REVIEW FIRST QUARTER ENDED APRIL 30, 2017
2 BRP Inc. - FY18 Q1
Forward-Looking Statements
Certain information included in this release, including, but not limited to, statements relating to our Fiscal Year 2018 financial outlook (including revenues,
gross profit margin, operating expenses, Normalized EBITDA, Effective Tax Rate, Normalized net income and Normalized earnings per share), statements
relating to the declaration and payment of dividends, statements relating to the launch and the terms of the proposed substantial issuer bid and other
statements that are not historical facts, are “forward-looking statements” within the meaning of Canadian securities laws..
Forward-looking statements are based on estimates and assumptions made by the Company in light of its experience and perception of historical trends,
current conditions and expected future developments, as well as other factors that the Company believes are appropriate and reasonable in the
circumstances, but there can be no assurance that such estimates and assumptions will prove to be correct or that the Company ’s business guidance,
objectives, plans and strategic priorities will be achieved.
Many factors could cause the Company’s actual results, level of activity, performance or achievements or future events or developments to differ materially
from those expressed or implied by the forward-looking statements, including, without limitation, the following factors, which are discussed in greater detail
under the heading “Risk Factors” of the Company’s Management Discussion and Analysis for the quarter ended January 31, 2017 dated March 24, 2017:
impact of adverse economic conditions on consumer spending; decline in social acceptability of the Company’s products; fluctuations in foreign currency
exchange rates; high levels of indebtedness; unavailability of additional capital; unfavourable weather conditions; seasonal sales fluctuations; inability to
comply with product safety, health, environmental and noise pollution laws; large fixed cost base; inability of dealers and distributors to secure adequate
access to capital; supply problems, termination or interruption of supply arrangements or increases in the cost of materials; competition in product lines;
inability to successfully execute growth strategy; international sales and operations; failure of information technology systems or security breach; loss of
members of management team or employees who possess specialized market knowledge and technical skills; inability to maintain and enhance reputation
and brands; significant product liability claim; significant product repair and/or replacement due to product warranty claims or product recalls; reliance on a
network of independent dealers and distributors; inability to successfully manage inventory levels; intellectual property infringement and litigation; inability to
successfully execute manufacturing strategy; covenants in financing and other material agreements; changes in tax laws and unanticipated tax liabilities;
deterioration in relationships with employees; pension plan liabilities; natural disasters; failure to carry proper insurance coverage; volatile market price for
BRP’s subordinate voting shares; conduct of business through subsidiaries; significant influence by Beaudier Inc. and 4338618 Canada Inc. (together the
“Beaudier Group”) and Bain Capital Luxembourg Investments S. à r. l. (“Bain Capital”); and future sales of BRP’s shares by Beaudier Group, Bain Capital,
directors, officers or senior management of the Company. These factors are not intended to represent a complete list of the factors that could affect the
Company; however, these factors should be considered carefully.
The purpose of the forward-looking statements is to provide the reader with a description of management’s expectations regarding the Company’s financial
performance and may not be appropriate for other purposes; readers should not place undue reliance on forward-looking statements made herein.
Furthermore, unless otherwise stated, the forward-looking statements contained in this Annual Information Form are made as of the date of this Annual
Information Form, and the Company has no intention and undertakes no obligation to update or revise any forward-looking statements, whether as a result of
new information, future events or otherwise, except as required by applicable securities regulations. The forward-looking statements contained in this Annual
Information Form are expressly qualified by this cautionary statement.

3 BRP Inc. - FY18 Q1
JOSÉ BOISJOLI PRESIDENT & CHIEF EXECUTIVE OFFICER
QUARTERLY REVIEW FIRST QUARTER ENDED APRIL 30, 2017

4 BRP Inc. - FY18 Q1
Increase of 3% in revenues primarily driven by higher wholesale SSV, PWC and PAC
Gross profit margin increased 80 basis point to 21.7%
Normalized EBITDA[1] grew 41% to $80.7M, Normalized net income[1] grew $23.5M
to $28.3M and Normalized diluted earnings per share[1] was up $0.21 to $0.25
Net loss of $18.5M, a decrease of $129.2M
North American BRP retail sales for Seasonal Products and Year-Round Products
increased 4%
Increase of 3% in revenues primarily driven by higher wholesale SSV, PWC and PAC
Gross profit margin increased 80 basis point to 21.7%
Normalized EBITDA[1] grew 41% to $80.7M, Normalized net income[1] grew $23.5M
to $28.3M and Normalized diluted earnings per share[1] was up $0.21 to $0.25
Net loss of $18.5M, a decrease of $129.2M
North American BRP retail sales for Seasonal Products and Year-Round Products
increased 4% primarily driven by continued strong momentum for SSV and PWC in
the United States, partially offset by an overall weak powersports industry in Canada
$0,04
$0,25
FY17 Q1 FY18 Q1
$929,9 $956,2
FY17 Q1 FY18 Q1
FY18 Q1 Revenues and Normalized EPS[1]
Revenues
CA$ millions
Normalized EPS - Diluted[1]
CA$
$0.21 3%
[1] For a reconciliation of net income to Normalized Net Income and Normalized EBITDA, see the reconciliation tables in appendix
Highlights vs. Year Ago

5 BRP Inc. - FY18 Q1
ATV Period: July to April
SSV Period: July to April
SPYDER Period: November to April
Year-Round Products
$400,2 $390,4
FY17 Q1 FY18 Q1
Revenue decrease of 2%:
Mainly driven by lower Spyder vehicle volume,
partially offset by a higher wholesale and favourable
product mix in SSV due to the introduction of the
Can-Am Maverick X3
Off-Road Vehicles
Ten months into the 2017 season, North American
ATV industry is down mid-single digit %
Can-Am ATV retail is up low-single digit %
Season-to-date, North American SSV industry is up
mid-single digit %
Can-Am SSV retail is up about 30%
Record market share for Can-Am SSV
season-to-date
Spyder Vehicles
Six months into the 2017 season, North American
three-wheel motorcycle industry is down low-teen %
Can-Am Spyder retail is down mid-single digit %
impacted by unfavourable weather conditions in
Canada
Dedicated teams in key U.S. states driving
positive retail momentum
Revenues
CA$ millions
Business Dynamics
2%
Can-Am Outpacing the Industry North American Industries
Retail Sales Growth - Season-to-date 2017
GROWTH DECLINE INDUSTRY
MID-SINGLE
DIGIT %
MID-SINGLE
DIGIT %
LOW-
TEEN %
BRP
LOW-SINGLE
DIGIT %
ABOUT
30%
MID-SINGLE
DIGIT %

6 BRP Inc. - FY18 Q1
MY18 Can-Am ORV: Maverick X3 Upgrade
Maintaining the performance leadership in the Sport SSV category
18HP Now delivering
172HP
HORSEPOWER UPGRADE AVAILABLE
ON BOTH THE MAVERICK X3 AND THE
MAVERICK X3 MAX

7 BRP Inc. - FY18 Q1
Notable MY18 Can-Am ORV News
Reinforcing our ORV line-up to continue gaining market shares
Outlander X xc 1000R The ultimate high-performance Rec-Ute ATV
Commander New 92 hp 1000R engine and 14 inches offset wheels
Outlander North Edition Performance with comfort for the winter
Defender MAX HD8 Entry-level 6-passenger Defender
Maverick X3 Turbo R Now at 172 hp - Up 18 hp from the previous Maverick X3 generation
Defender MAX HD10 XT CAB Factory-built 6-passenger Defender with a full cab

8 BRP Inc. - FY18 Q1
Ski-Doo performed very well within the current model
year units in season 2017, driven by the introduction of
the Gen4 platform, and achieved record market share in
current model year units
Seasonal Products
Revenues
CA$ millions
Business Dynamics
Revenue increase of 7%:
Primarily driven by higher volume and favourable
product mix of PWC sold
Snowmobiles
North American snowmobile industry retail ended
season 2017 down mid-single digit %
Ski-Doo retail was down high-single digit % due
much lower availability of non-current units vs.
the competition
Ski-Doo achieved its highest market share ever in
the current model year units segment
Season-to-date, the Scandinavian industry is down
mid-single digit %
BRP retail was up low-single digit % driven by the
success of the Gen4 platform
PWCs
Early in the season, the North American PWC
industry retail was up mid-teen %
Sea-Doo retail sales were up low-teen % over the
same period
Strong boat show certificates momentum so far
this season despite unfavourable weather
$286,8 $306,5
FY17 Q1 FY18 Q1
7%
New Gen4 Platform Driving Share Gains
Current Non-Current
North American 2017 Snowmobile Season
Retail Sales Mix by Model Year
Ski-Doo Rest of the Industry
9 BRP Inc. - FY18 Q1
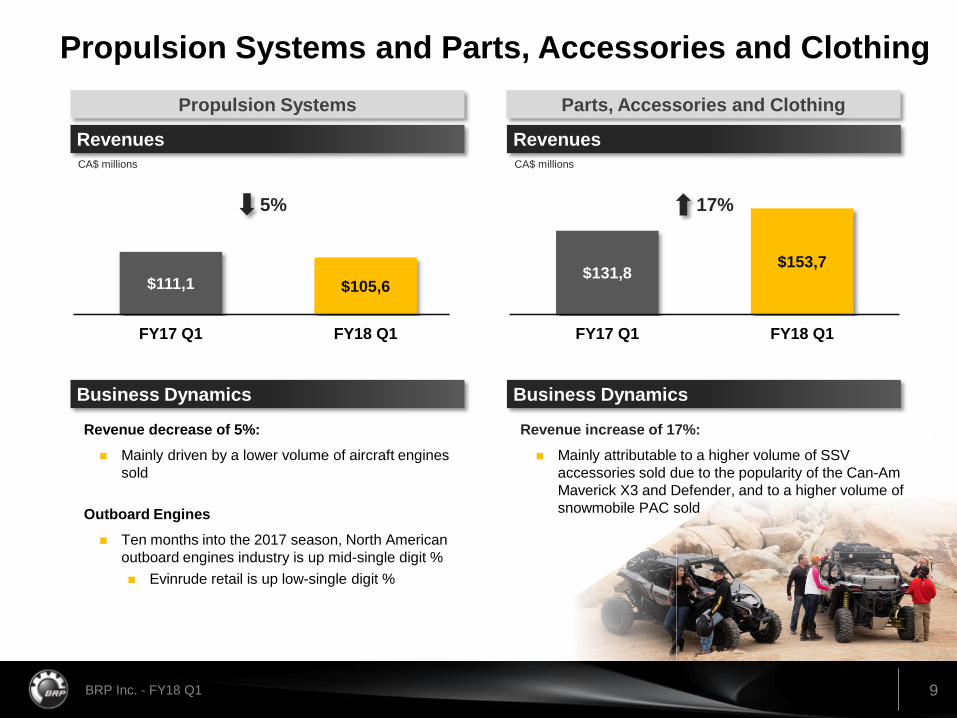
$111,1 $105,6
FY17 Q1 FY18 Q1
Revenues
CA$ millions
5%
Propulsion Systems and Parts, Accessories and Clothing
Propulsion Systems Parts, Accessories and Clothing
Business Dynamics
Revenue increase of 17%:
Mainly attributable to a higher volume of SSV
accessories sold due to the popularity of the Can-Am
Maverick X3 and Defender, and to a higher volume of
snowmobile PAC sold
$131,8 $153,7
FY17 Q1 FY18 Q1
Revenues
CA$ millions
17%
Business Dynamics
Revenue decrease of 5%:
Mainly driven by a lower volume of aircraft engines
sold
Outboard Engines
Ten months into the 2017 season, North American
outboard engines industry is up mid-single digit %
Evinrude retail is up low-single digit %

10 BRP Inc. - FY18 Q1
SÉBASTIEN MARTEL CHIEF FINANCIAL OFFICER
QUARTERLY REVIEW FIRST QUARTER ENDED APRIL 30, 2017
11 BRP Inc. - FY18 Q1
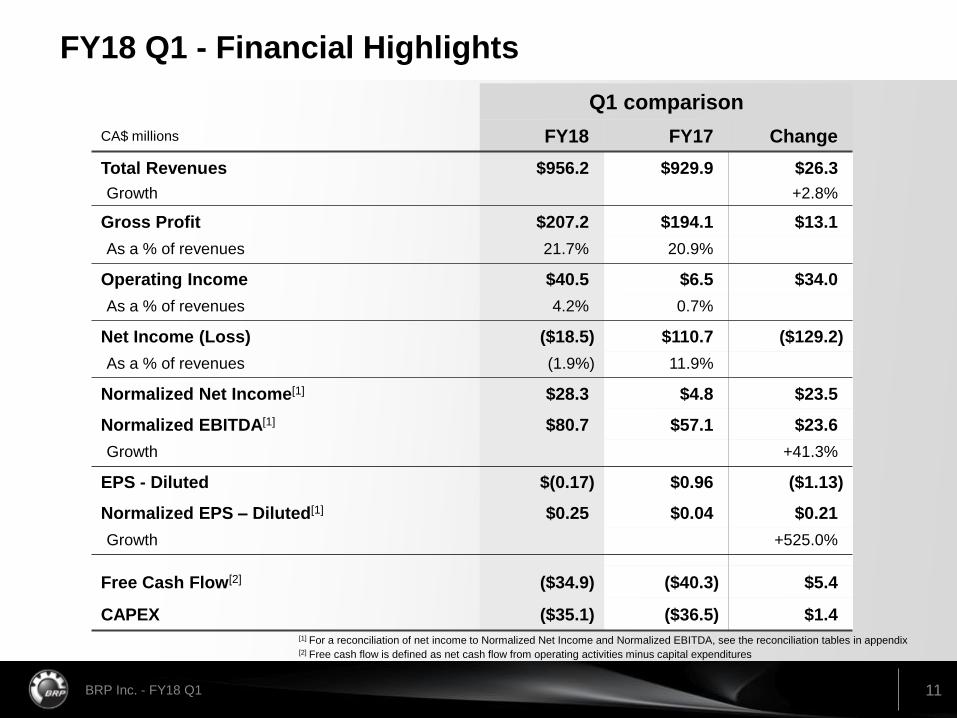
FY18 Q1 - Financial Highlights
[1] For a reconciliation of net income to Normalized Net Income and Normalized EBITDA, see the reconciliation tables in appendix
Q1 comparison
CA$ millions FY18 FY17 Change
Total Revenues $956.2 $929.9 $26.3
Growth +2.8%
Gross Profit $207.2 $194.1 $13.1
As a % of revenues 21.7% 20.9%
Operating Income $40.5 $6.5 $34.0
As a % of revenues 4.2% 0.7%
Net Income (Loss) ($18.5) $110.7 ($129.2)
As a % of revenues (1.9%) 11.9%
Normalized Net Income[1] $28.3 $4.8 $23.5
Normalized EBITDA[1] $80.7 $57.1 $23.6
Growth +41.3%
EPS - Diluted $(0.17) $0.96 ($1.13)
Normalized EPS – Diluted[1] $0.25 $0.04 $0.21
Growth +525.0%
Free Cash Flow[2] ($34.9) ($40.3) $5.4
CAPEX ($35.1) ($36.5) $1.4
[2] Free cash flow is defined as net cash flow from operating activities minus capital expenditures

12 BRP Inc. - FY18 Q1
FY18 Q1 - Normalized Net Income[1] Bridge CA$ millions
$23M increase in Normalized Net Income[1] for the quarter
5
28 15
4
11
(7)
FY17 Q1 Volume, Mix, Pricing and
Sales Programs
Production Costs and Operating Expenses
Net Financing Costs and
Normalized Income Tax Expense
Foreign Exchange Rates and Others
FY18 Q1
[1] See “Non-IFRS Measures” section in appendix

13 BRP Inc. - FY18 Q1
BRP North American Powersports Dealer Inventory
Dealer inventory[1] ended FY18 Q1 up 12%
from FY17 Q1 level
Increase primarily driven by:
higher level of snowmobile inventory due to
the weak snow conditions, notably in the
U.S. Central and North East regions
the shipments ramp-up of the Can-Am
Defender and Maverick X3, and;
the increase in the number of dealers
Partially offset by a reduction in network
inventory for the rest of the line-up, notably for
Spyder vehicles
Dealer Inventory Level
Units, Excluding Outboard Engines
FY18 FY16 FY17
[1] Network inventory excluding Propulsion Systems
Dealer Inventory Bridge
Units, Excluding Outboard Engines
FY17 Q1 Can-Am Maverick X3
Can-Am Defender
New Dealers
Rest of the Line-up
FY18 Q1 Excluding
Snowmobile Inventory Increase
Snowmobile FY18 Q1
Q1 Q2 Q3 Q4
+12%
+5%
14 BRP Inc. - FY18 Q1
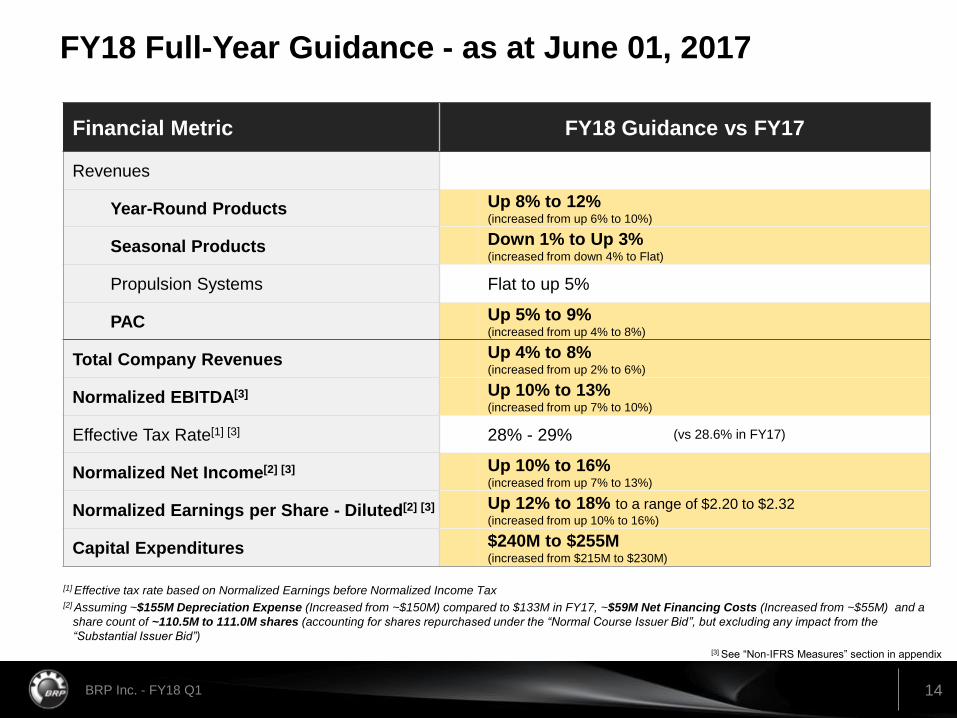
FY18 Full-Year Guidance - as at June 01, 2017
[1] Effective tax rate based on Normalized Earnings before Normalized Income Tax [2] Assuming ~$155M Depreciation Expense (Increased from ~$150M) compared to $133M in FY17, ~$59M Net Financing Costs (Increased from ~$55M) and a
share count of ~110.5M to 111.0M shares (accounting for shares repurchased under the “Normal Course Issuer Bid”, but excluding any impact from the
“Substantial Issuer Bid”)
Financial Metric FY18 Guidance vs FY17
Revenues
Year-Round Products Up 8% to 12% (increased from up 6% to 10%)
Seasonal Products Down 1% to Up 3% (increased from down 4% to Flat)
Propulsion Systems Flat to up 5%
PAC Up 5% to 9% (increased from up 4% to 8%)
Total Company Revenues Up 4% to 8% (increased from up 2% to 6%)
Normalized EBITDA[3] Up 10% to 13% (increased from up 7% to 10%)
Effective Tax Rate[1] [3] 28% - 29%
Normalized Net Income[2] [3] Up 10% to 16% (increased from up 7% to 13%)
Normalized Earnings per Share - Diluted[2] [3] Up 12% to 18% to a range of $2.20 to $2.32 (increased from up 10% to 16%)
Capital Expenditures $240M to $255M (increased from $215M to $230M)
(vs 28.6% in FY17)
[3] See “Non-IFRS Measures” section in appendix
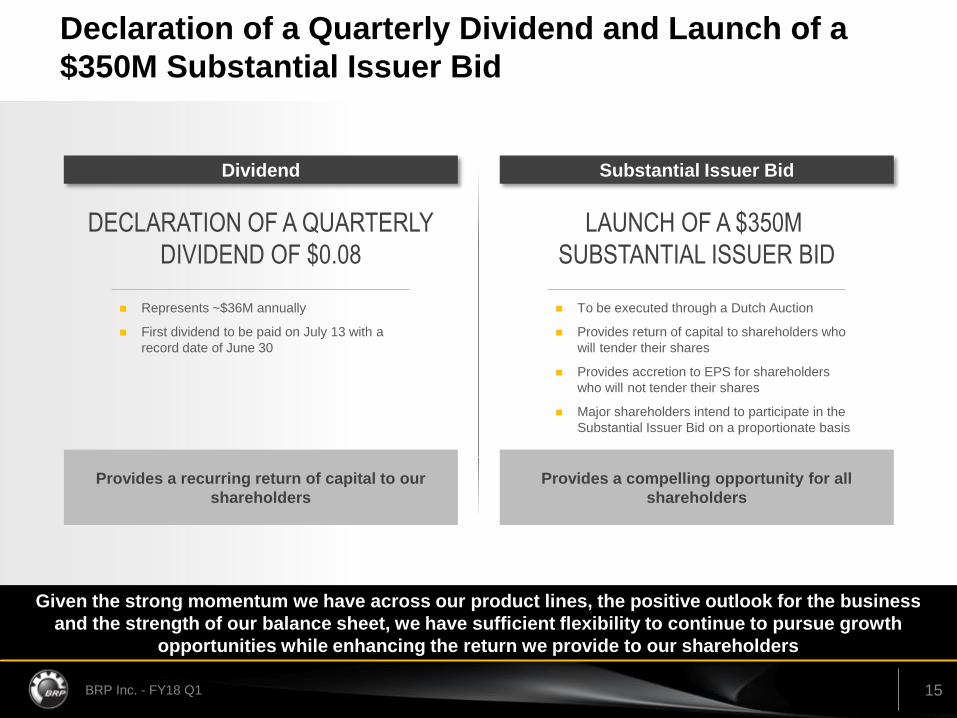
15 BRP Inc. - FY18 Q1
Declaration of a Quarterly Dividend and Launch of a
$350M Substantial Issuer Bid
Dividend Substantial Issuer Bid
Given the strong momentum we have across our product lines, the positive outlook for the business
and the strength of our balance sheet, we have sufficient flexibility to continue to pursue growth
opportunities while enhancing the return we provide to our shareholders
Represents ~$36M annually
First dividend to be paid on July 13 with a
record date of June 30
DECLARATION OF A QUARTERLY
DIVIDEND OF $0.08
Provides a recurring return of capital to our
shareholders
Provides a compelling opportunity for all
shareholders
To be executed through a Dutch Auction
Provides return of capital to shareholders who
will tender their shares
Provides accretion to EPS for shareholders
who will not tender their shares
Major shareholders intend to participate in the
Substantial Issuer Bid on a proportionate basis
LAUNCH OF A $350M
SUBSTANTIAL ISSUER BID

16 BRP Inc. - FY18 Q1 © 2017 BRP all rights reserved. Ski-Doo, Lynx, Sea-Doo, Evinrude, Rotax, Can-Am and the BRP logo
are trademarks of Bombardier Recreational Products Inc. or its affiliates.
SKI-DOO©
LYNX©
SEA-DOO©
EVINRUDE©
ROTAX©
CAN-AM©
CLOSING REMARKS
QUARTERLY REVIEW FIRST QUARTER ENDED APRIL 30, 2017

17 BRP Inc. - FY18 Q1 © 2017 BRP all rights reserved. Ski-Doo, Lynx, Sea-Doo, Evinrude, Rotax, Can-Am and the BRP logo
are trademarks of Bombardier Recreational Products Inc. or its affiliates.
SKI-DOO©
LYNX©
SEA-DOO©
EVINRUDE©
ROTAX©
CAN-AM©
Q&A PERIOD
QUARTERLY REVIEW FIRST QUARTER ENDED APRIL 30, 2017

18 BRP Inc. - FY18 Q1
Seasonal Products
Outboard
Engines
Global Leader in Powersports Vehicles and Engines
Propulsion Systems
Ski-Doo Snowmobiles
All-Terrain Vehicles Roadsters Side-by-Side Vehicles
Personal Watercraft
Diversified Product Portfolio AND Powerful Brands
OEM Engines
Lynx Snowmobiles
Year-Round Products

19 BRP Inc. - FY18 Q1 © 2017 BRP all rights reserved. Ski-Doo, Lynx, Sea-Doo, Evinrude, Rotax, Can-Am and the BRP logo
are trademarks of Bombardier Recreational Products Inc. or its affiliates.
SKI-DOO©
LYNX©
SEA-DOO©
EVINRUDE©
ROTAX©
CAN-AM©
APPENDIX
QUARTERLY REVIEW FIRST QUARTER ENDED APRIL 30, 2017

20 BRP Inc. - FY18 Q1
Reconciliation Tables
[1] The Company is involved, from time to time, in restructuring and reorganization activities in order to gain flexibility and improve efficiency. The costs related to these activities are mainly composed of
severance costs and retention salaries.
[2] During the three and twelve-month periods ended April 30, 2017 and 2016, the Company recorded expenses of respectively $4.8 million and $19.5 million related to patent infringement litigation cases with one
of its competitors.
Three-month periods ended
CA$ millions Apr. 30, 2017 Apr. 30, 2016
Net Income (Loss) $(18.5) $110.7
Normalized elements:
Foreign exchange (gain) loss on long-term debt 42.9 (119.2)
Restructuring costs reversal[1] - (0.5)
Loss on litigation[2] 4.8 19.5
Income taxes adjustment (0.9) (5.7)
Normalized Net Income 28.3 4.8
Normalized income taxes expense 3.9 5.6
Financing costs 13.8 15.8
Financing income (0.7) (0.7)
Depreciation expense 35.4 31.6
Normalized EBITDA $80.7 $57.1
Non-IFRS Measures: Normalized EBITDA is defined as net income before financing costs, financing income, income taxes expense (recovery), depreciation expense and normalized elements. Normalized Net
Income is defined as net income before normalized elements adjusted to reflect the tax effect on these elements. Normalized income taxes expense is defined as income taxes expense adjusted to reflect the tax
effect on normalized elements. Normalized earnings per share – diluted is calculated by dividing the normalized net income by the weighted average number of shares – diluted. For more details on non-IFRS
measures, refer to the section entitled Non-IFRS Measures of the Company's MD&A for the first quarter of the year ending January 31, 2018.

21 BRP Inc. - FY18 Q1


![BRP History | BRP · PDF fileBRP History | BRP USA 9/21/2015 2:59:15 PM] BRP HISTORY 1937 Right on track Joseph](https://static.fdocuments.in/doc/165x107/5abb3ab47f8b9a321b8c9c65/brp-history-brp-history-brp-usa-9212015-25915-pm-brp-history-1937-right.jpg)