Quarterly outlook and model portfolio allocations...Short-term government bond yields are...
6
AGF ASSET ALLOCATION COMMITTEE Q3 2020 Quarterly outlook and model portfolio allocations Asset allocation The AGF Asset Allocation Committee is positioned modestly overweight equities as global markets recover with the help of fiscal and monetary stimulus. Some economies have begun reopening with little disruption thus far, however other a resurgence of COVID-19 cases in other key markets may trigger bouts of volatility along the way. We expect the direction of the virus will ultimately define the strength of financial markets in the upcoming quarter. The AAC’s overweight position towards equities is slightly increased to 63.0% with assets reallocated from cash. The underweight to fixed income remains as well as a modest allocation to cash to soften the impact of volatility. 0% 10% 20% 30% 40% 50% 60% 70% Cash Fixed Income Equity 62.5 35.0 2.5 63.0 35.0 2.0 60.0 40.0 0.0 FIGURE 1: Asset allocations Q2-2020 Model Q3-2020 Model Benchmark Source: AGF Asset Allocation Committee, as of July 2020. Benchmark: 10% Bloomberg Barclays Canada Aggregate Bond Index / 25% Bloomberg Barclays Global Aggregate Bond Index / 2.5% Bank of America/Merrill Lynch U.S. High Yield Master II Total Return Index / 2.5% JPMorgan EMBI Global Total Return Index / 16.5% S&P/TSX Capped Composite Total Return Index / 24.2% S&P 500 Total Return Index / 9.3% MSCI Europe / 3.5% MSCI Japan / 1.7% MSCI Pacific ex-Japan / 4.8% MSCI Emerging Markets
Transcript of Quarterly outlook and model portfolio allocations...Short-term government bond yields are...

A G F A S S E T ALLOCATION COMMIT TEE
Q3 2020
Quarterly outlook and model portfolio allocations
Asset allocation
The AGF Asset Allocation Committee is positioned modestly
overweight equities as global markets recover with the help
of fiscal and monetary stimulus. Some economies have
begun reopening with little disruption thus far, however
other a resurgence of COVID-19 cases in other key markets
may trigger bouts of volatility along the way. We expect the
direction of the virus will ultimately define the strength of
financial markets in the upcoming quarter.
The AAC’s overweight position towards equities is slightly
increased to 63.0% with assets reallocated from cash. The
underweight to fixed income remains as well as a modest
allocation to cash to soften the impact of volatility.
0%
10%
20%
30%
40%
50%
60%
70%
CashFixed IncomeEquity
0%
10%
20%
30%
40%
50%
60%
70%
CashFixed IncomeEquity
62.5
35.0
2.5
63.0
35.0
2.0
60.0
40.0
0.0
FIGURE 1: Asset allocations
Q2-2020 Model Q3-2020 Model Benchmark
Source: AGF Asset Allocation Committee, as of July 2020.
Benchmark: 10% Bloomberg Barclays Canada Aggregate Bond Index / 25% Bloomberg Barclays Global Aggregate Bond Index / 2.5% Bank of America/Merrill Lynch U.S. High Yield Master II Total Return Index / 2.5% JPMorgan EMBI Global Total Return Index / 16.5% S&P/TSX Capped Composite Total Return Index / 24.2% S&P 500 Total Return Index / 9.3% MSCI Europe / 3.5% MSCI Japan / 1.7% MSCI Pacifi c ex-Japan / 4.8% MSCI Emerging Markets
AAC OUTLOOK Q3 2020
2
Source: AGF Asset Allocation Committee, as of July 2020. Benchmark: 16.5% S&P/TSX Capped Composite Total Return Index / 24.2% S&P 500 Total Return Index / 9.3% MSCI Europe / 3.5% MSCI Japan / 1.7% MSCI Pacific ex-Japan / 4.8% MSCI Emerging Markets
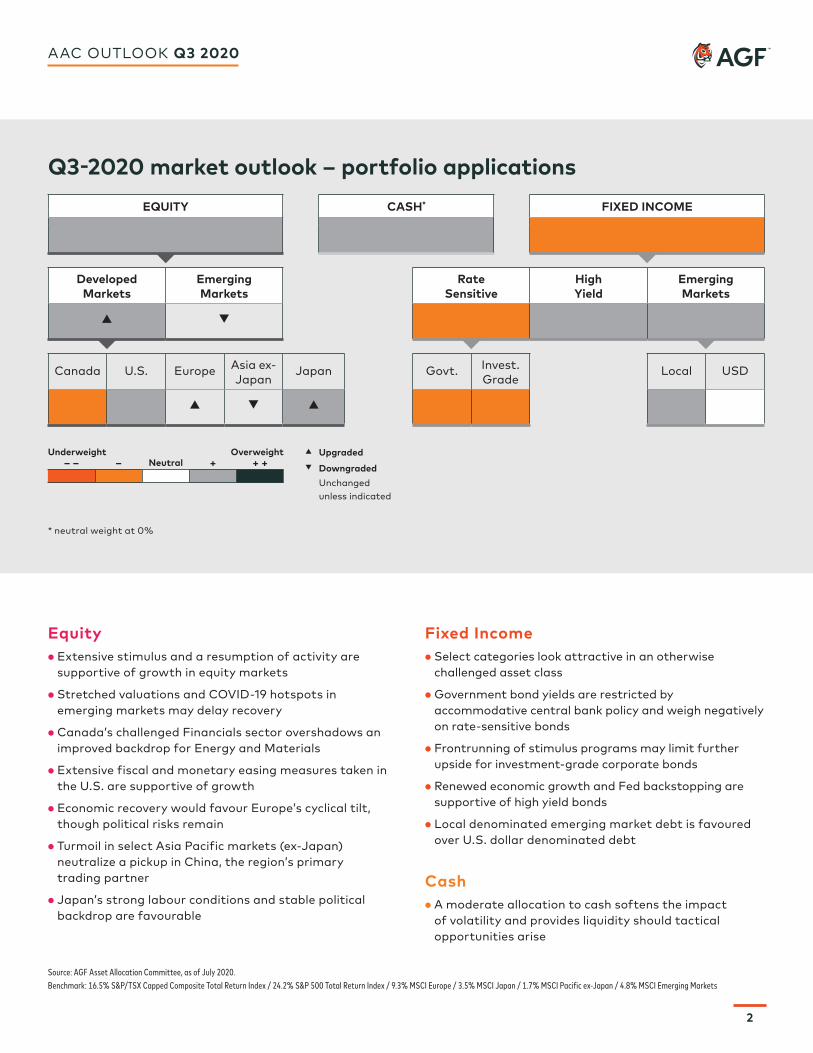
Equity• Extensive stimulus and a resumption of activity are
supportive of growth in equity markets
• Stretched valuations and COVID-19 hotspots in emerging markets may delay recovery
• Canada’s challenged Financials sector overshadows an improved backdrop for Energy and Materials
• Extensive fiscal and monetary easing measures taken in the U.S. are supportive of growth
• Economic recovery would favour Europe’s cyclical tilt, though political risks remain
• Turmoil in select Asia Pacific markets (ex-Japan) neutralize a pickup in China, the region’s primary trading partner
• Japan’s strong labour conditions and stable political backdrop are favourable
Fixed Income• Select categories look attractive in an otherwise
challenged asset class
• Government bond yields are restricted by accommodative central bank policy and weigh negatively on rate-sensitive bonds
• Frontrunning of stimulus programs may limit further upside for investment-grade corporate bonds
• Renewed economic growth and Fed backstopping are supportive of high yield bonds
• Local denominated emerging market debt is favoured over U.S. dollar denominated debt
Cash• A moderate allocation to cash softens the impact
of volatility and provides liquidity should tactical opportunities arise
Q3-2020 market outlook – portfolio applications
Underweight Overweight– – – Neutral + + +
▴ Upgraded
▾ Downgraded
Unchanged unless indicated
EQUITY CASH** FIXED INCOME
Canada U.S. Europe Asia ex-Japan
Japan Govt. Invest. Grade
Local USD
▴ ▾ ▴
Developed Markets
Emerging Markets
Rate Sensitive
High Yield
Emerging Markets
▴ ▾
* neutral weight at 0%

AAC OUTLOOK Q3 2020
3
Equity allocationThe small overweight to equities is increased as monetary
and fiscal stimulus are supportive of continued recovery
into the second half of 2020. Beyond government
stimulus, however, a lack of near-term catalysts may
limit upside potential. Equity market growth may be
bifurcated between those able to maintain a pace of
reopening without a resurgence in cases versus those
who suffer setbacks.
The Committee prefers developed markets (DM) over
emerging markets (EM) for the upcoming quarter. A
restart in manufacturing activity and inflating DM
central bank balance sheets should positively impact
EM countries over the longer term, however stretched
fundamentals and COVID-19 hotspots lead to a neutral
view at this time.
Developed market equities remain attractive, though
the Committee’s constructive view is generally focused
towards select countries.
Canada’s dependence on its challenged Financials sector
overshadows improved near-term conditions for Energy
and Materials. The Committee has further increased their
underweight position for the upcoming quarter.
Extensive fiscal aid and monetary easing measures
implemented in the U.S. are supportive of growth.
Company fundamentals remain constructive and leading
efforts towards a COVID-vaccine reflect positively on
equities. The U.S. is experiencing a resurgence in virus
cases, however, which may lead to elevated volatility and
disrupt the resumption in business activity.
The Committee’s outlook for Europe is improved to a
neutral position. A global economic recovery would favour
the region’s tilt towards cyclicals and manufacturing
industries, also helped by monetary stimulus. Political
overhang may limit upside, however, in regards to Brexit
proceedings and U.S. trade tariffs.
Asia Pacific Markets (ex-Japan) are supported by a pickup
in Chinese activity, however geopolitical risk in Hong Kong
and a challenged backdrop in Australia weigh negatively
on the group. The Committee has reduced its overweight
to a neutral position for the upcoming quarter.
Japan is among the most favoured developed markets.
The country has been less impacted by the COVID-19 virus
as compared to other regions, causing fewer disruptions
in employment and economic activity. Room for further
fiscal stimulus remains as well, if required.
FIGURE 2: Equity allocations
0%
5%
10%
15%
20%
25%
30%
Emerging marketsJapanAsia Pacific (ex-Japan)EuropeUnited StatesCanada
0%
5%
10%
15%
20%
25%
30%
Emerging marketsJapanAsia Pacific (ex-Japan)EuropeUnited StatesCanada
12.0 11.5
16.5
27.029.0
24.2
7.09.0 9.3
3.0 2.0 1.74.5
6.5
3.5
9.0
5.0 4.8
Q2-2020 Model Q3-2020 Model Benchmark
Source: AGF Asset Allocation Committee, as of July 2020.Benchmark: 16.5% S&P/TSX Capped Composite Total Return Index / 24.2% S&P 500 Total Return Index / 9.3% MSCI Europe / 3.5% MSCI Japan / 1.7% MSCI Pacific ex-Japan / 4.8% MSCI Emerging Markets
4
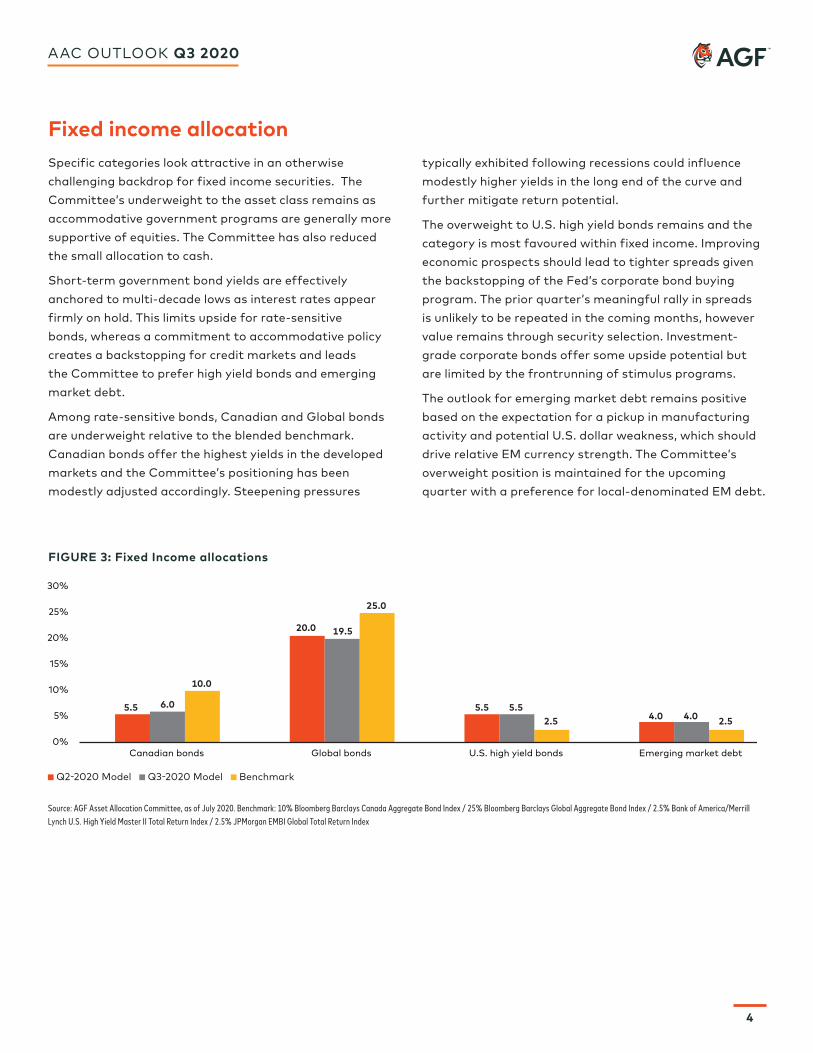
Fixed income allocationSpecific categories look attractive in an otherwise
challenging backdrop for fixed income securities. The
Committee’s underweight to the asset class remains as
accommodative government programs are generally more
supportive of equities. The Committee has also reduced
the small allocation to cash.
Short-term government bond yields are effectively
anchored to multi-decade lows as interest rates appear
firmly on hold. This limits upside for rate-sensitive
bonds, whereas a commitment to accommodative policy
creates a backstopping for credit markets and leads
the Committee to prefer high yield bonds and emerging
market debt.
Among rate-sensitive bonds, Canadian and Global bonds
are underweight relative to the blended benchmark.
Canadian bonds offer the highest yields in the developed
markets and the Committee’s positioning has been
modestly adjusted accordingly. Steepening pressures
typically exhibited following recessions could influence
modestly higher yields in the long end of the curve and
further mitigate return potential.
The overweight to U.S. high yield bonds remains and the
category is most favoured within fixed income. Improving
economic prospects should lead to tighter spreads given
the backstopping of the Fed’s corporate bond buying
program. The prior quarter’s meaningful rally in spreads
is unlikely to be repeated in the coming months, however
value remains through security selection. Investment-
grade corporate bonds offer some upside potential but
are limited by the frontrunning of stimulus programs.
The outlook for emerging market debt remains positive
based on the expectation for a pickup in manufacturing
activity and potential U.S. dollar weakness, which should
drive relative EM currency strength. The Committee’s
overweight position is maintained for the upcoming
quarter with a preference for local-denominated EM debt.
6.0
10.0
5.5
19.5
25.0
20.0
5.52.5
5.54.0 2.54.0
0%
5%
10%
15%
20%
25%
30%
Emerging market debtU.S. high yield bondsGlobal bondsCanadian bonds
FIGURE 3: Fixed Income allocations
Q2-2020 Model Q3-2020 Model Benchmark
Source: AGF Asset Allocation Committee, as of July 2020. Benchmark: 10% Bloomberg Barclays Canada Aggregate Bond Index / 25% Bloomberg Barclays Global Aggregate Bond Index / 2.5% Bank of America/Merrill Lynch U.S. High Yield Master II Total Return Index / 2.5% JPMorgan EMBI Global Total Return Index
AAC OUTLOOK Q3 2020

AAC OUTLOOK Q3 2020
5
Q2-2020 economic recap
Global financial markets recovered strongly in the
second quarter of 2020 with the backing of monetary
and fiscal policy as well as advancement in the fight
against COVID-19. The spread of cases slowed in select
major economies which allowed for partial resumption of
manufacturing and other business activity, while hopes
of progress towards a vaccine led to improved consumer
confidence. Elevated levels of volatility carried into the
second quarter, however, as a global response to racial
injustices and an uptick of COVID-19 cases in the U.S.
contributed to investor angst.
The U.S. Federal Reserve (Fed) led major central banks in
efforts to support the global economy by inflating their
balance sheet to over US$7 trillion, while policymakers in
Congress enacted the US$2 trillion CARES act. Lagged
effects of the shutdown were rampant in reported
economic data during the quarter as the U.S. lost over 20
million jobs in April and the unemployment rate reached a
post-war high of 14.7% before partially improving towards
the end of the quarter. After falling to decade-lows of 41.5
in April, the ISM Manufacturing PMI returned to modest
expansionary levels of 52.6 in June.
The Bank of Canada expanded its newly introduced
quantitative easing program with up to $50 billion of
provincial bonds and up to $10 billion of investment
grade corporate bonds in addition to weekly government
bond buying already in place. The gradual reopening
of manufacturing and vehicle mobility led to increased
Energy demand and thus higher crude oil prices, though
at around $40 by the mid-year point, held well below
levels entering 2020. The path of Canada’s labour market
resembled that of the U.S., with historic losses to begin
the quarter followed by remarkable gains announced for
May, yet with only a fraction of losses recouped, risk of
permanent job losses continued to grow.
Eurozone manufacturing rebounded close to pre-virus
levels in June though remained in contraction territory
for the 17th straight month to end the quarter. The
European Central Bank maintained its €1.1 trillion easing
programme which supported a strong equity rebound. The
recovery was also helped by the quelling of virus cases in
Italy and Spain, two of Europe’s hardest hit countries.
Japan’s stable political backdrop and social cohesion in
general continued in the second quarter, though ongoing
deflation challenges were exacerbated by the COVID-19
pandemic.
U.S. dollar strength weighed negatively on emerging
markets in general, as did elevated case counts in
Brazil and India. However, partial reopening of China’s
economy supported market growth as the China Caixin
Manufacturing PMI returned to expansionary territory
during the quarter.
AAC OUTLOOK Q3 2020
™ The ‘AGF’ logo and ‘Invested in Discipline’ are trademarks of AGF Management Limited and used under licence. The commentaries contained herein are provided as a general source of information based on information available as of June 30, 2020 and should not be considered as personal investment advice or an offer or solicitation to buy and/or sell securities. Every effort has been made to ensure accuracy in these commentaries at the time of publication, however accuracy cannot be guaranteed. Market conditions may change and the manager accepts no responsibility for individual investment decision arising from the use or reliance on the information contained herein. Commissions, trailing commissions, management fees and expenses all may be associated with mutual fund investments. Please read the prospectus before investing. Mutual funds are not guaranteed; their values change frequently and past performance may not be repeated. The MSCI information may only be used for your internal use, may not be reproduced or redisseminated in any form and may not be used as a basis for or a component of any financial instruments or products or indices. None of the MSCI information is intended to constitute investment advice or a recommendation to make (or refrain from making) any kind of investment decision and may not be relied on as such. Historical data and analysis should not be taken as an indication or guarantee of any future performance analysis, forecast or prediction. The MSCI information is provided on an “as is” basis and the user of this information assumes the entire risk of any use made of this information. MSCI, each of its affiliates and each other person involved in or related to compiling, computing or creating any MSCI information (collectively, the “MSCI Parties”) expressly disclaims all warranties (including, without limitation, any warranties of originality, accuracy, completeness, timeliness, non-infringement, merchantability and fitness for a particular purpose) with respect to this information. Without limiting any of the foregoing, in no event shall any MSCI Party have any liability for any direct, indirect, special, incidental, punitive, consequential (including, without limitation, lost profits) or any other damages. (www.msci.com). AGF Investments is a group of wholly owned subsidiaries of AGF Management Limited, a Canadian reporting issuer. The subsidiaries included in AGF Investments are AGF Investments Inc. (AGFI), Highstreet Asset Management Inc. (Highstreet), AGF Investments America Inc. (AGFA), AGF Asset Management (Asia) Limited (AGF AM Asia) and AGF International Advisors Company Limited (AGFIA). AGFA is a registered advisor in the U.S. AGFI and Highstreet are registered as portfolio managers across Canadian securities commissions. AGFIA is regulated by the Central Bank of Ireland and registered with the Australian Securities & Investments Commission. AGF AM Asia is registered as a portfolio manager in Singapore. The subsidiaries that form AGF Investments manage a variety of mandates comprised of equity, fixed income and balanced assets. Publication date: July 20, 2020
For more information on the AGF Asset Allocation Committee visit AGF.com.
FU
ND
98
6 0
7-20
-E
AGF Asset Allocation Committee The AGF Asset Allocation Committee is comprised of experienced investment professionals, specializing in various areas
of the global bond and equity markets. Members provide insight into risks and opportunities, shaping the outlook of their
respective asset class, which leads to an optimized asset allocation view. This top-down view guides the allocations for all
funds managed by the Committee.