Quarterly Investor Relations Presentation
38
Quarterly Investor Relations Presentation At and for the three months ended December 31, 2020
Transcript of Quarterly Investor Relations Presentation

Quarterly Investor Relations PresentationAt and for the three months ended December 31, 2020

Footprint
2
COMPANY SNAPSHOT
• Full-service regional commercial bank focused on relationship-based business and agribusiness banking
• Headquartered in Sioux Falls, SD with 175 banking branches across nine states: Arizona, Colorado, Iowa, Kansas, Minnesota, Missouri, Nebraska, North Dakota and South Dakota; approximately 1,600 FTEs
• Bank charter originated in 1935; purchased by National Australia Bank ("NAB") in 2008; NAB sold 100% of its stake in GWB to public investors in a series of three equity offerings, completed in 2015
• 7th largest farm lender bank in the U.S. as of 09/30/201
1QFY21 Financial Highlights
BalanceSheet ($MM)
Total Assets $12,814Total Loans $9,518Total Deposits $11,373Loan / Deposit Ratio 83.7 %Tangible Common Equity2 $1,063Total Equity $1,069
Capital
Tang. Common Equity / Tang. Assets2 8.3 %Tier 1 Leverage Ratio 9.7 %CET1 Ratio 12.0 %Tier 1 Capital Ratio 12.7 %Total Capital Ratio 14.3 %
Profitablility
Adjusted Net Interest Margin2 3.52 %Cost of Deposits 0.21 %Return on Avg. Total Assets 1.30 %Return on Avg. Common Equity2 15.2 %Return on Avg. Tangible Common Equity2 15.3 %Efficiency Ratio2 46.2 %
AssetQuality
NPAs / Assets 2.42 %NCOs / Avg. Loans 1.22 %Non-accrual Loans / Loans 3.07 %ACL / Loans 3.24 %
1 Source: American Banker's Association2 Non-GAAP measures; see Appendix for reconciliation

EXPERIENCED MANAGEMENT TEAM
3
Executive Officers x x Industry experience (yrs)
Great Western Bank experience (yrs)1
Mark BorreccoPresident & CEO
x Responsible for overall leadership and executive oversight of GWB, serves on the Board of Directors, Former President & CEO and Board Director of Rabobank; EVP Chief Retail Banking Officer, Prior senior management roles at Bank of the West and World Savings Bank/Wachovia
24 <1
Peter ChapmanExecutive VP & CFO
x Responsible for financial / regulatory reporting, planning and strategy, project management, treasury, loan and deposit operations and information technologyPrior U.S. experience with E&Y
27 17
Karlyn KnieriemExecutive VP & CRO
x Responsible for risk framework across GWB including Enterprise Risk, Compliance, BSA and Risk Asset ReviewPrior experience includes senior management roles with First National Bank of Omaha 23 4
Steve YoseExecutive VP & CCO
Responsible for leading overall credit strategy, management, and portfolio administration for our bank, Former Executive Vice President and Chief Credit Officer for First Interstate Bank, Prior Executive Vice President and Senior credit roles at KeyBank 36 <1
Non-Executive Officers x x x x
Eric BauerDirector of Agribusiness
x Former Group President, Chief Credit Officer of Ag, Regional Credit Manager, Business Banking Manager and Retail Manager for our bank. Prior experience with Wells Fargo and First Savings & Loan 27 19
Ryan BoscheeRegional President SD, ND & MN
x Prior experience includes Group President roles for multiple markets along with Treasury Management in South Dakota for our bank 22 20
Scott ErkonenChief Information Officer
x Prior leadership role representing the United States internationally in the areas of IT Governance and Information Security — ISO (International Organization for Standardization) 25 14
Bart FloydRegional President IA & MO
x Prior experience with US Bank, Wells Fargo/South Trust Bank, and commercial banking and private financing for organizations in Iowa, Colorado, and Texas 25 9
Gail GrantRegional President CO & AZ
x Former Group President for Northern Colorado and Arizona for our bank.Prior experience with Wells Fargo/Norwest 32 12
Amy JohnsonDirector of Treasury Mgmt
Prior experience as Treasury Mgmt Senior Vice President of a large national bank; served in Regional, Divisional, and National roles with sales management, service, technology, and process improvement 20 <1
Andy PedersonHead of P&C and L&D
x Prior experience includes Senior Human Resource Generalist for Citibank and Wells Fargo 21 12
Corinne SaffordDirector of Retail
x Former Regional Retail Manager, Senior Retail Manager, Branch Manager, Education & Development Officer and Universal Banker for our bank 19 19
Donald StrakaGeneral Counsel and Corporate Secretary
x Prior experience includes attorney and executive in banking, securities and M&A 33 7
Chris WiedenfeldRegional President NE & KS
x Prior experience with American National Bank, US Bank, and Lauritzen Corporation 25 7
NOTE: For Mr. Chapman, includes experience at National Australia Bank, Ltd. and subsidiaries; For Mr. Erkonen, includes experience at HF Financial Corp.

KEY DEVELOPMENTS
4
Bolster Credit Risk Management
• Nonaccrual loans decreased by 10% and classified loans decreased by 7%
• Sales of $209 million of hotel loans to reduce risk
• Loans on deferral decreased to 1.29% of total loans excluding PPP loans
Measured Actions
• Prudent NIM management through reduced borrowings and deposit rates
• Capital generation strong for the quarter
• Adopted CECL on Oct 1: ACL is 3.50% of total loans excluding PPP loans
Organizational Alignment forIncreased Specialization
• Hired Rick Robinson as President of Wealth Management
• Progress on small business platform
• Progress on business line build out

LOAN PORTFOLIO COMPOSITION
5
1 Residential RE, Consumer and Other

COMMERCIAL LOANS
6
Commercial Segments1Balance ($MM)
% of Total
LoansReal Estate &
LeasingLessors of Non Residential RE $1,253 13.2 %Lessors of Residential RE/Oth $526 5.5 %
Accommodation & Food/Drink
Hotel (excl Casino Hotels) $846 8.9 %Food/Drink $160 1.7 %Casino Hotels $125 1.3 %Other Accommodation $9 0.1 %
Health Care & Social Assistance
Senior Care $323 3.4 %Skilled Nursing $224 2.4 %Hospitals $221 2.3 %Health Services $196 2.1 %
Retail TradeMotor Vehicle & Parts Dealers $159 1.7 %Convenience Stores $114 1.2 %Other Retail Trade $208 2.2 %Construction $479 5.0 %Prof, Scien, Tech Oth Services $420 4.4 %Manufacturing $337 3.5 %Wholesale Trade $319 3.3 %Other $204 2.1 %Finance and Insurance $212 2.2 %Transportation & Warehousing $167 1.8 %Arts Entertainment and Recreation $121 1.3 %Total $6,623 69.6 %
• Real Estate & Leasing◦ Major property types are 17.1% multifamily residential,
18.4% office buildings, 14.7% warehouses & manufacturing, 9.8% retail stores and 11.2% retail strip malls
• Accommodation & Food/Drink▪ See following Key Loan Segments slides for additional
details
• Health Care & Social Assistance▪ See following Key Loan Segments slides for additional
details
• Retail Trade◦ Largely comprised of automobile and other motorized vehicle
dealers (33%), convenience stores (24%) and various other segments like furniture stores, building materials, and other retailers (43%)
• Construction◦ Diversified mix with 41% in various specialty contractors,
19% in civil engineering and construction, and 40% in building construction
• Manufacturing◦ Top 3 categories in cement & mineral-based, food and metal
fabrication
1 Reflects C&I, CRE and C&D and certain Multifamily loans utilizing NAICS classifications

KEY LOAN SEGMENTS
7
1 Consists of 126 PPP loans, most of which are related to non-PPP relationships reflected in the chart2 Includes AK $23, CA $18, FL $19, among others, and mostly relates to experienced in-footprint customers
• Accommodation portfolio comprised of $822.6 million in hotels (excl casino hotels), $117.9 million of casino hotels, and $30.8 million of PPP loans across both segments
◦ Casino hotels are $94.5 million C&I and exhibiting lower risk ratings
• 88% of the accommodation balance is concentrated within the bank's footprint
• Diversified across more than 100 cities with largest balances in Colorado Springs, CO, Rapid City, SD, Des Moines, IA, Omaha, NE, Denver, CO, and Sioux Falls, SD
• LTV of approximately 60% for accommodation relationships over $1 million (84% of balance)
• 88% of hotel (excl casino hotels) relationships over $1 million are flagged (83% of balance)
• Minimal line commitment exposure with 88.6% of balances and commitments operational, 9.6% under construction, and 1.8% committed and not started
NOTE: Accommodation portfolio consists of hotels (excl casino hotels) and casino hotels segmented by NAICS. Chart values exclude $0.4 million of balances with NAICS of hotel (excl casino hotels) that do not have a commercial classification.

KEY LOAN SEGMENTS (cont'd)
8
• Senior Care is $333 million or 3.5% of total loans, 96% CRE, and consists of approximately 45 relationships
• Skilled nursing is $224 million or 2.4% of total loans, 94% CRE, and consists of approximately 38 relationships
• Hospitals are $221 million or 2.3% of total loans, more aligned to C&I at 55% and consist of approximately 28 relationships
• All other health care is $186 million or 2.0% of total loans, is also higher in C&I at 53%, and is much more fragmented across 442 relationships that include physicians, dentists, optometrists, therapists, and other specialty services as well as social assistance
• Ag portfolio remains well diversified across key sub-segments
• Strong demand is driving price support for grain producers into 2021
• WASDE January 12, 2021 report projected a decrease in 2020/21 corn ending stocks by 9% to 1.55 billion bushels and a 5% increase in average farm price to $4.20 per bushel
• Soybean projected ending stocks for 2020/21 were reduced by 20% to 140 million bushels and projected average farm price increased 6% to $11.15 per bushel
• Dairy market conditions remain supportive with Class III milk price at $15.72 in December, down from $23.34 in November and $21.61 in October
*References to World Agricultural Supply and Demand Estimate (WASDE) and pricing can be found at www.usda.gov
Total $1.6B
Total $1.0B

ASSET QUALITY METRICS
9
• Net charge-offs were $30.4 million, or 1.22% of average total loans (annualized) for the quarter, up $15.2 million and 63 basis points from the prior quarter, respectively
◦ The sale of $208.8 million in hotel loans at a 12.0% discount resulted in $25.6 million of chargeoffs
◦ Excluding hotel loan sales, net charge-offs were $4.8 million, or 0.19% of average total loans (annualized)
• Nonaccrual loans were $292.4 million, a decrease of $32.6 million, or 10%, from the prior quarter
• Classified loans were $716.9 million, a decrease of $52.6 million from the prior quarter

CREDIT INITIATIVES
10
Effective Credit Risk Management
• Improved asset quality metrics in nonaccrual and classified loans
• Risk rating system providing enhanced early warnings
• Consistency in risk culture and decisioning
Portfolio Management• Hotel portfolio sales improved portfolio risk
• Loans on deferral at 1.29% as of January 13, 2021
Specialized Credit Administration
• Small business initiative for efficient underwriting and oversight
• Commercial loan workout focus
• Centralized management of agribusiness portfolio

HOTEL SALES & LOAN DEFERRALS
11
3QFY20 4QFY20 Current 1
SegmentsBalance ($MM)
% of Segment
LoansBalance ($MM)
% of Segment
LoansBalance ($MM)
% of Segment
LoansAccommodation (Hotel and Casino Hotel) $861 72% $111 9% $69 7%Arts Entertainment and Recreation $79 61% $3 3% $8 7%Food & Drink $68 41% $4 3% $5 5%Transportation and Warehousing $41 20% $1 1% $0 0%Retail Trade $93 19% $14 3% — —Real Estate and Rental and Leasing $359 14% $19 1% $11 1%Other Services (except Public Administration) $22 13% $2 1% $2 2%Manufacturing $25 7% $14 4% $1 0%Wholesale Trade $19 6% $1 0% $0 0%Health Care and Social Assistance $63 6% $1 0% $9 1%Agriculture Forestry Fishing and Hunting $19 1% $2 0% — —Other $45 2% $11 1% $8 0%
$1,694 $183 $113
16.4% of Total Loans
17.7% excl PPP
1.84% of Total Loans
1.98% excl PPP
1 Current data as of January 13, 2021
• Hotel Sales
◦ In the quarter we completed multiple transactions involving the sale of $208.8 million in hotel loans◦ Proceeds of $183.2 million at a 12.0% discount on loans resulted in a $25.6 million chargeoff
• Deferrals
◦ Loans on deferral have decreased further to $113 million as of January 13, 2021, which is 1.20% of total loans and 1.29% of total loans excluding PPP loans◦ Hotel and casino hotel loans on deferral total $69 million, which is 7% of the total hotel portfolio excluding PPP
1.20% of Total Loans
1.29% excl PPP

CREDIT COVERAGE & CECL
12
• The ACL was $308.8 million as of December 31, 2020, an increase of $158.9 million from the allowance for loan and lease losses of $149.9 million as of September 30, 2020
◦ Adoption of CECL on October 1, 2020, led to a Day 1 increase in the ACL of $177.3 million
• The ratio of ACL to total loans was 3.24% as of December 31, 2020, an increase from 1.49% as of September 30, 2020. Excluding PPP loans the ratio was 3.50%
• Economic Factors: Oxford GDP and Unemployment
◦ Decrease driven primarily by improved unemployment forecasts
• Portfolio Changes: change in loan volumes and terms, credit quality, chargeoffs, and qualitative adjustments
◦ Increase from COVID-19 loan concentration risk offset by chargeoffs and reduced volumes
2018 2019 2020 21Q1 21Q2 21Q3 21Q4 2022
GDP2 2.2 3.6 -3.6 2.8 2.9 3.2 3.2 3
Unemployment2 3.9 3.7 8.3 6.9 6.7 6.5 6.2 5.6
• ACL excludes Unfunded Commitment Reserve
◦ October 1 = $2.4 million
◦ December 31 = $2.3 million
• FV adjustment reflects effective coverage on the loan portfolio accounted for at fair value
Total Credit Coverage1 = 3.56%Excluding PPP1 = 3.84%
1 Total Credit Coverage is ACL, FV Adjustment and Unfunded Commitment Reserve2 Source: Oxford Economics - Annual Percentage Change

AG LOAN ASSET QUALITY
13
1 Annualized for partial year periods2 Includes vegetable, cotton and other specialty Ag categories
• Net charge-offs in the first quarter of FY21 were 0.02% of total loans annualized, tracking well below 0.18% in the first quarter of the prior year and below 0.20% for the full fiscal year 2020
• Charge-offs in the grain segment were offset with recoveries in beef and other specialty segments
• Classified loans at $321 million decreased by $69 million (18%) from the prior quarter due to a number of paydowns in dairy and grain relationships

INVESTMENTS & BORROWINGS
14
• Investment portfolio weighted average life of 3.4 years as of December 31, 2020 and yield of 1.69% for the quarter ended December 31, 2020, a decrease of 17 basis points compared to the prior quarter
• Spot yield on the portfolio at December 31, 2020 was 1.64%
• Borrowings portfolio yield of 2.19% for the quarter ended December 31, 2020, a decrease of 30 basis points compared to the prior quarter
Total $0.3BTotal $2.1B

LIQUIDITY DETAIL
15
• $35 million of subordinated debt issued in 2015 with an adjustable rate of 3.15% above 3-month LIBOR
◦ Maturing August 2025 with a 5 year non-call (first call date of August 2020, at par)
◦ Fixed-to-floating rate coupon, with a 4.875% fixed rate for the initial 5 year period
◦ The fixed rate expired in August 2020, shifting to a floating rate of 3 month LIBOR +315 basis points
• $73.9 million of trust preferred securities outstanding
◦ The securities are on floating rates between 3 month LIBOR +148 basis points to 3 month LIBOR +335 basis points
◦ The trust preferred securities will mature between January 2033 to October 2037
◦ All trust preferred are currently callable, at par
Additional Sources of Bank Funding
Type
AmountOutstanding
($MM)Available
($MM)
Cash and Unencumbered Securities $1,816
FHLB, Notes Payable $120 $1,991FHLB Fed Funds Advance $0FRB Discount Window $0 $944Unsecured Federal Funds $0 $125
Total $120 $4,876
Holding Company Detail
Type
AmountOutstanding
($MM)Available
($MM)
Cash and Due from Banks $34
Subordinated Debt $35Trust Preferred $74
Total $109 $34

DEPOSITS
16
• Total deposits were $11.37 billion as of December 31, 2020, an increase of $364.5 million from the prior quarter
◦ $438.5 million increase in checking and savings balances
◦ $67.9 million decrease in time deposits driven in part by lower offering rates
• Deposit yields decreased 7 basis points to 0.21% driven by a reduction in time deposits yields of 26 basis points to 0.68% and by the impact on mix from increased noninterest bearing deposits

GROWTH - METRO VS RURAL
• Historically, the Company's core Midwestern presence was focused in Iowa, Nebraska and South Dakota in rural markets largely supported by agricultural economies
• M&A activity and de novo expansion have expanded the footprint to include more metro 1 markets including metro markets in Colorado and Arizona
• While loan and deposit balances in the core rural markets remain important, growth prospects are much more robust in Metro markets
• Compound average growth over the last five years in metro markets has been 5% for loans and 6% for deposits, compared to (5)% and 5%, respectively, in rural markets
1 Metro markets generally include MSAs with >100K populations
17
Loans ($MM) Deposits ($MM)

CAPITAL
18
• Tier 1 and total capital ratios were 12.7% and 14.3%, respectively, as of December 31, 2020, compared to 11.8% and 13.3% as of September 30, 2020
• The common equity tier 1 (CET1) capital ratio and tier 1 leverage ratio were 12.0% and 9.7%, respectively, as of December 31, 2020, compared to 11.0% and 9.4% as of September 30, 2020
◦ Tangible common equity ratio1 of 8.3% (8.8% excluding PPP loans)
◦ All regulatory capital ratios remain above regulatory minimums to be considered "well capitalized"
◦ The Company has elected the 5 year CECL transition for regulatory capital ratios, resulting in an add-back of $129.5 million to common equity tier 1 capital
• On January 27, 2021, the Company's Board of Directors declared a dividend of $0.01 per common share payable on February 26, 2021 to stockholders of record as of close of business on February 12, 2021
1 Non-GAAP measures, see appendix for reconciliations2 Excludes PPP loans
2

◦ Investment portfolio weighted average life of 3.4 years
◦ Fixed loans and rate floors are providing portfolio1 support▪ $4.2 billion of fixed loans with a yield of 4.34%
▪ $1.9 billion of variable loans have reached their floors with a yield 4.20%
▪ $1.2 billion of variable loans repricing after 90 days with a yield of 4.45%
• Relatively short average tenor of the loan portfolio (1.5 years at December 31, 2020) due to higher proportion of 12-month revolving lines of credit and certain fixed-rate loans swapped to floating
INTEREST RATE SENSITIVITY
19
1 Excludes PPP loans

Income Statement Summary
EARNINGS OVERVIEW
21
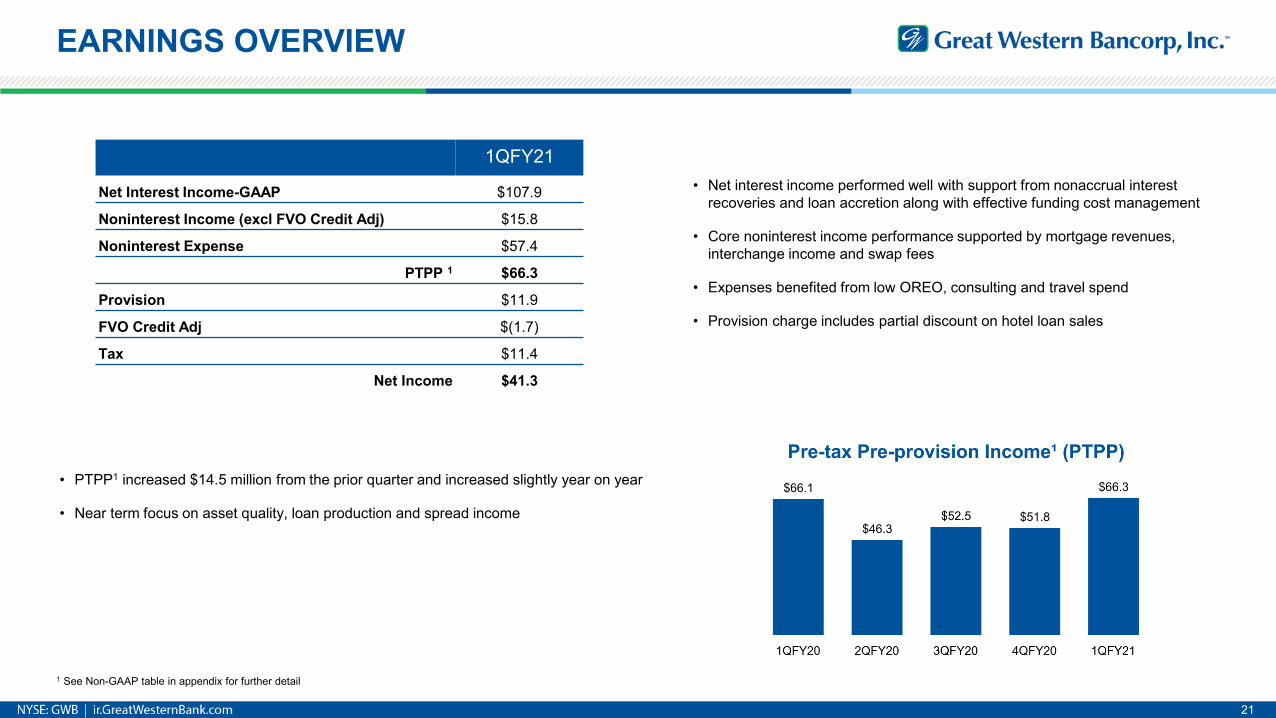
1QFY21
Net Interest Income-GAAP $107.9
Noninterest Income (excl FVO Credit Adj) $15.8
Noninterest Expense $57.4
PTPP 1 $66.3
Provision $11.9
FVO Credit Adj $(1.7)
Tax $11.4
Net Income $41.3
• Net interest income performed well with support from nonaccrual interest recoveries and loan accretion along with effective funding cost management
• Core noninterest income performance supported by mortgage revenues, interchange income and swap fees
• Expenses benefited from low OREO, consulting and travel spend
• Provision charge includes partial discount on hotel loan sales
• PTPP1 increased $14.5 million from the prior quarter and increased slightly year on year
• Near term focus on asset quality, loan production and spread income
1 See Non-GAAP table in appendix for further detail

NET INTEREST INCOME
22
• Net interest income was $109.5 million, an increase of $2.0 million from the prior quarter
• Adjusted net interest income1 was $106.1 million, an increase of $2.1 million from the prior quarter
◦ Interest income was lower by $1.2 million as $3.6 million in interest recoveries partially offset the decrease from lower loan and securities yields
◦ Interest expense was lower by $3.2 million driven by a $1.8 million decrease in deposit interest and a $1.4 million decrease in borrowings interest
• Net interest margin was 3.63%, an increase of 12 basis points from the prior quarter
• Adjusted net interest margin1 was 3.52%, an increase of 12 basis points from the prior quarter
◦ Excluding an 18 basis point lift from interest recoveries and accretion, underlying NIM was 3.34%, largely related to increased liquidity
1 Non-GAAP measures, see appendix for reconciliations.
NOTE: All references to net interest income and net interest margin are presented on a fully-tax equivalent basis unless otherwise noted.

NET INTEREST INCOME (cont'd)
23
• PPP loan income was $5.5 million for the quarter, with $1.8 million of interest and $3.7 million of amortized fees
◦ Remaining PPP fee income to be recognized is $12.3 million
◦ $27.8 million of PPP loans processed for forgiveness in the quarter
• Fixed loans, rate floors and repricing beyond 90 days are providing yield support on approximately 80% of the loan portfolio
◦ $4.2 billion of fixed loans with a yield of 4.34%
◦ $1.9 billion of variable loans have reached their floors with a yield of 4.20%
◦ $1.2 billion of variable loans repricing after 90 days with a yield of 4.45%
•Chart shows volumes and yields at the quarter end
•Variable/Adjustable: 36% Prime, 28% 5 yr Treasury, 36% all other
PPP Summary
Original CurrentBalance ($MM) Balance ($MM) # Loans Average
Under $150k $137.9 $135.0 3,780 $35,713$150k to $350k $105.2 $104.6 466 $224,412$350k to $2MM $323.1 $301.9 394 $766,213$2MM+ $161.1 $158.0 44 $3,591,208Total $727.3 $699.5 4,684 $149,332
Jun20 Sep20 Dec20 RemainFee Schedule ($MM) $2.6 $4.4 $3.7 $12.3

24
NONINTEREST INCOME
• Noninterest income was $14.1 million for the quarter, an increase of $18.1 million from the prior quarter, driven by a $2.0 million increase in core revenue items and a $23.7 million improvement in fair value adjustments and derivative interest items, offset by a $7.6 million decrease in securities gains
◦ The increase in core fee revenue was driven by slight increases in mortgage banking revenue on strong origination demand and in service charges from a continued rebound in customer transaction activity, along with a $1.2 million increase in swap sales revenue
◦ The improvement in fair value adjustments and derivative interest was driven primarily by a $21.5 million decrease in charges due to improvements in fair value adjustments and lower realized losses on certain FVO loans
1 Service charges, wealth management, mortgage, swap sales and other

25
EXPENSES & PROVISION
• Total noninterest expense was $57.4 million for the quarter, a decrease of $17.5 million from the prior quarter
◦ $12.3 million total decrease in costs associated with FHLB prepayment, FDIC loss-sharing agreement, severance, closure, consulting and unfunded commitment reserve, all of which were incurred in the prior quarter
◦ $4.0 million decrease in OREO costs with lower provisioning
◦ $1.6 million decrease in professional services with lower consulting costs and FDIC insurance premium
• Provision for credit losses was $11.9 million for the quarter, compared to $16.9 million in the prior quarter under the incurred loss model

Forward Looking Statements: This press release contains forward-looking statements within the meaning of the Private Securities Litigation Reform Act of 1995.Statements about Great Western Bancorp, Inc.’s expectations, beliefs, plans, strategies, predictions, forecasts, objectives, assumptions or future events orperformance are not historical facts and may be forward-looking. These statements are often, but not always, made through the use of words or phrases such as“anticipates,” “believes,” “can,” “could,” “may,” “predicts,” “potential,” “should,” “will,” “estimate,” “plans,” “projects,” “continuing,” “ongoing,” “expects,” “views,”“intends” and similar words or phrases. In particular, the statements included in this press release concerning Great Western Bancorp, Inc.’s expected performanceand strategy, strategies for managing troubled loans, the impact on the business arising from the COVID-19 pandemic and the interest rate environment are nothistorical facts and are forward-looking. Accordingly, the forward-looking statements in this press release are only predictions and involve estimates, known andunknown risks, assumptions and uncertainties that could cause actual results to differ materially from those expressed. All forward-looking statements are necessarilyonly estimates of future results, and there can be no assurance that actual results will not differ materially from expectations, and, therefore, you are cautioned not toplace undue reliance on such statements. Any forward-looking statements are qualified in their entirety by reference to the factors discussed in the sections titled“Item 1A. Risk Factors” and "Cautionary Note Regarding Forward-Looking Statements" in Great Western Bancorp, Inc.’s Annual Report on Form 10-K for the mostrecently ended fiscal year, and in other periodic filings with the Securities and Exchange Commission. Further, any forward-looking statement speaks only as of thedate on which it is made, and Great Western Bancorp, Inc. undertakes no obligation to update any forward-looking statement to reflect events or circumstances afterthe date on which the statement is made or to reflect the occurrence of unanticipated events.
Non-GAAP Financial Measures: This presentation contains non-GAAP measures which our management relies on in making financial and operational decisions about our business and which exclude certain items that we do not consider reflective of our business performance. We believe that the presentation of these measures provides investors with greater transparency and supplemental data relating to our financial condition and results of operations. These non-GAAP measures should be considered in context with our GAAP results. A reconciliation of these non-GAAP measures appears in our earnings release dated January 27, 2021 and in Appendix 1 to this presentation. Our earnings release and this presentation are available in the Investor Relations section of our website at www.greatwesternbank.com. Our earnings release and this presentation are also available as part of our Current Report on Form 8-K filed with the Securities and Exchange Commission on January 27, 2021.
Explanatory Note: In this presentation, all financial information presented refers to the financial results of Great Western Bancorp, Inc. combined with those of its predecessor, Great Western Bancorporation, Inc. Also note loan balance information is presented using unpaid principal balances (UPB) unless otherwise noted.
DISCLOSURES
26

Appendix 1Non-GAAP Measures

NON-GAAP MEASURES
28
At or for the three months ended:December 31,
2020September 30,
2020June 30,
2020March 31,
2020December 31,
2019
Adjusted net income and adjusted earnings per common share:Net income (loss) - GAAP $ 41,319 $ 11,136 $ 5,400 $ (740,618) $ 43,274
Add: COVID-19 related impairment of goodwill and certain intangible assets, net of tax — — — 713,013 —
Add: COVID-19 impact on credit and other related charges, net of tax — — — 56,685 —
Adjusted net income $ 41,319 $ 11,136 $ 5,400 $ 29,080 $ 43,274
Weighted average diluted common shares outstanding 55,247,343 55,164,548 55,145,619 55,906,002 56,457,967
Earnings per common share - diluted $ 0.75 $ 0.20 $ 0.10 $ (13.25) $ 0.77
Adjusted earnings per common share - diluted $ 0.75 $ 0.20 $ 0.10 $ 0.52 $ 0.77
Pre-tax pre-provision income ("PTPP"):Income (loss) before income taxes - GAAP 52,708 10,279 5,878 (778,348) 55,873
Add: Provision for credit losses - GAAP 11,899 16,853 21,641 71,795 8,103
Add: Change in fair value of FVO loans and related derivatives - GAAP 1,672 24,648 25,001 10,533 2,124
Add: Goodwill impairment - GAAP — — — 742,352 —
Pre-tax pre-provision income $ 66,279 $ 51,780 $ 52,520 $ 46,332 $ 66,100
Tangible net income and return on average tangible common equity: x x x x xNet income (loss) - GAAP $ 41,319 $ 11,136 $ 5,400 $ (740,618) $ 43,274
Add: Amortization of intangible assets and COVID-19 related impairment of goodwill and certain intangible assets, net of tax 261 261 261 713,440 377
Tangible net income (loss) $ 41,580 $ 11,397 $ 5,661 $ (27,178) $ 43,651
Average common equity $ 1,082,077 $ 1,174,996 $ 1,163,724 $ 1,918,035 $ 1,908,519
Less: Average goodwill and other intangible assets 6,004 6,265 6,527 741,257 748,146
Average tangible common equity $ 1,076,073 $ 1,168,731 $ 1,157,197 $ 1,176,778 $ 1,160,373
Return on average common equity * 15.2 % 3.8 % 1.9 % (155.3)% 9.0 %
Return on average tangible common equity ** 15.3 % 3.9 % 2.0 % (9.3)% 15.0 %
* Calculated as net income - GAAP divided by average common equity. Annualized for partial-year periods.** Calculated as tangible net income divided by average tangible common equity. Annualized for partial-year periods.

NON-GAAP MEASURES
29
At or for the three months ended:December 31,
2020September 30,
2020June 30,
2020March 31,
2020December 31,
2019
Adjusted net interest income and adjusted net interest margin (fully-tax equivalent basis):Net interest income - GAAP $ 107,908 $ 106,018 $ 106,251 $ 101,983 $ 105,173
Add: Tax equivalent adjustment 1,598 1,508 1,601 1,514 1,523
Net interest income (FTE) 109,506 107,526 107,852 103,497 106,696
Add: Current realized derivative gain (loss) (3,393) (3,541) (3,040) (1,250) (890)
Adjusted net interest income (FTE) $ 106,113 $ 103,985 $ 104,812 $ 102,247 $ 105,806
Average interest-earning assets $11,965,55
5 $12,184,09
3 $12,156,50
5 $11,590,45
3 $11,543,61
0
Net interest margin (FTE) * 3.63 % 3.51 % 3.57 % 3.59 % 3.68 %
Adjusted net interest margin (FTE) ** 3.52 % 3.40 % 3.47 % 3.55 % 3.65 %
* Calculated as net interest income (FTE) divided by average interest earning assets. Annualized for partial-year periods.** Calculated as adjusted net interest income (FTE) divided by average interest earning assets. Annualized for partial-year periods.
Adjusted interest income and adjusted yield (fully-tax equivalent basis), on non-ASC 310-30 loans: x x x x xInterest income - GAAP $ 107,323 $ 106,305 $ 107,725 $ 111,970 $ 117,709
Add: Tax equivalent adjustment 1,598 1,508 1,601 1,514 1,523
Interest income (FTE) 108,921 107,813 109,326 113,484 119,232
Add: Current realized derivative gain (loss) (3,393) (3,541) (3,040) (1,250) (890)
Adjusted interest income (FTE) $ 105,528 $ 104,272 $ 106,286 $ 112,234 $ 118,342
Average non-ASC310-30 loans $ 9,567,679 $ 9,977,591 $ 9,974,802 $ 9,496,153 $ 9,554,161
Yield (FTE) * 4.52 % 4.30 % 4.41 % 4.81 % 4.96 %
Adjusted yield (FTE) ** 4.38 % 4.16 % 4.29 % 4.75 % 4.93 %
* Calculated as interest income (FTE) divided by average loans. Annualized for partial-year periods.** Calculated as adjusted interest income (FTE) divided by average loans. Annualized for partial-year periods.

NON-GAAP MEASURES
30
At or for the three months ended:December 31,
2020September 30,
2020June 30,
2020March 31,
2020December 31,
2019
Efficiency ratio:Total revenue - GAAP $ 122,056 $ 102,068 $ 94,568 $ 101,900 $ 120,906
Add: Tax equivalent adjustment 1,598 1,508 1,601 1,514 1,523
Total revenue (FTE) $ 123,654 $ 103,576 $ 96,169 $ 103,414 $ 122,429
Noninterest expense $ 57,449 $ 74,936 $ 67,049 $ 808,453 $ 56,930
Less: Amortization of intangible assets and COVID-19 related impairment of goodwill and certain intangible assets 261 261 278 742,779 427
Tangible noninterest expense $ 57,188 $ 74,675 $ 66,771 $ 65,674 $ 56,503
Efficiency ratio * 46.2 % 72.1 % 69.4 % 63.5 % 46.2 %
* Calculated as the ratio of tangible noninterest expense to total revenue (FTE).
Tangible common equity and tangible common equity to tangible assets: x x x x xTotal stockholders' equity $ 1,068,501 $ 1,162,933 $ 1,160,644 $ 1,153,464 $ 1,920,669
Less: Goodwill and other intangible assets 5,904 6,164 6,425 6,703 749,481
Tangible common equity $ 1,062,597 $ 1,156,769 $ 1,154,219 $ 1,146,761 $ 1,171,188
Total assets $12,814,38
3 $12,604,43
9 $12,934,32
8 $12,387,80
8 $12,851,66
5
Less: Goodwill and other intangible assets 5,904 6,164 6,425 6,703 749,481
Tangible assets $12,808,47
9 $12,598,27
5 $12,927,90
3 $12,381,10
5 $12,102,18
4
Tangible common equity to tangible assets 8.3 % 9.2 % 8.9 % 9.3 % 9.7 %x x x x x x
Tangible book value per share: x x x x xTotal stockholders' equity $ 1,068,501 $ 1,162,933 $ 1,160,644 $ 1,153,464 $ 1,920,669
Less: Goodwill and other intangible assets 5,904 6,164 6,425 6,703 749,481
Tangible common equity $ 1,062,597 $ 1,156,769 $ 1,154,219 $ 1,146,761 $ 1,171,188
Common shares outstanding 55,105,105 55,014,189 55,014,047 55,013,928 56,382,915
Book value per share - GAAP $ 19.39 $ 21.14 $ 21.10 $ 20.97 $ 34.06
Tangible book value per share $ 19.28 $ 21.03 $ 20.98 $ 20.84 $ 20.77
Appendix 2Supplemental Ag & Hotel Portfolio Characteristics

AG LOAN PORTFOLIO
32
• Portfolio is balanced across sub segments
• 10 largest Ag exposures represent 18.8% of total Ag and average $31 million
• Approximately 3,000 customers with an average exposure size of $590,000
• COVID-19 pandemic impacts on pricing and government support being closely monitored
• Charge-offs in FY20 and into FY21 are driven by a small number of cattle and grain relationships
NOTE: All customer references are aggregated based on CIF and do not group CIFs with related ownership groups. Industry disclosures based on NAICS codes.

MORE ON HOTELS
33
• Loan to value is approximately 60% on outstanding balances over $1M (more than 84% of the hotel portfolio)
• Minimal line commitment exposure with 88.6% of balances and commitments operational, 9.6% under construction, and 1.8% committed and not started
• 85.3% of the balance is term debt and 14.7% is lines of credit
• 88% of hotel relationships over $1 million are flagged (83% of portfolio balance)

Appendix 3Agriculture Lending & Economy

FARM INCOME
35
• Total farm income in 2019 increased by 6% year over year, driven by a $2 billion decrease in cash receipts for both crops and animal products and a $9 billion increase from government programs
• 2020 was forecasted to increase by 23%, resulting from government programs and improved export demands
• Farm income by state was well-balanced with 29% in footprint, 29% adjacent to footprint, and 42% non-adjacent
• Average net income per farm in 2019 improved year over year in all key Ag sectors, with lower stocks providing price support
Source: USDA/ERS Farm Income and Wealth Statistics as of September 2, 20201 Data through 20192 KS = $2.8M, AZ = $2.0M, CO = $1.9M

FARM BALANCE SHEETS
36
• Land values remain firm following a 3.5% increase from 2017-2020 despite a decrease in general commodity prices
• Farm debt to equity remains low relative to historic levels; 2019 increased slightly to 15.8% and is forecasted at 16.2% in 2020, as more modest profits are resulting in slightly increased leverage to support growth in operations, land purchases and investments
• Equity increased 1.2% to $2.66 trillion but slightly outpaced by a 4.1% increase in debt to $419 billion
• The industry debt service ratio, which measures how much production income is committed to debt servicing, remained flat with recent years and is forecasted to be 25.0% for 2020
Source: USDA/ERS Farm Income and Wealth Statistics as of September 2, 2020
Source: 2019 Iowa State University Farmland Value Survey

Appendix 4Peer Group

PEER GROUP
38
• BancorpSouth Bank • Fulton Financial Corporation
• Banner Corporation • Glacier Bancorp, Inc.
• Berkshire Hills Bancorp, Inc. • Heartland Financial USA, Inc.
• Columbia Banking System, Inc. • Old National Bancorp
• Community Bank System, Inc. • Renasant Corporation
• Customers Bancorp, Inc. • Trustmark Corporation
• CVB Financial Corp. • UMB Financial Corporation
• First BanCorp. • United Bankshares, Inc.
• First Midwest Bancorp, Inc. • United Community Banks, Inc.