ABOUT US - Investor Relations - Sherwin-Williams Investor Relations
85
Annual Report 2012
Transcript of ABOUT US - Investor Relations - Sherwin-Williams Investor Relations
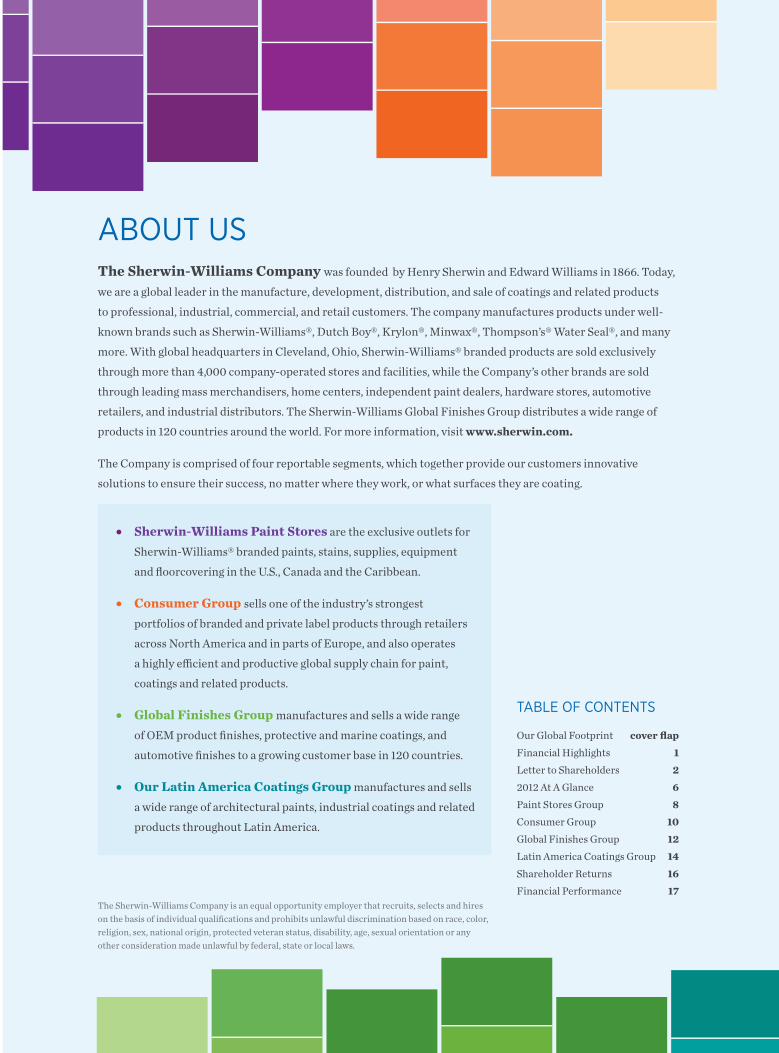
The Sherwin-Williams Company was founded by Henry Sherwin and Edward Williams in 1866. Today,
we are a global leader in the manufacture, development, distribution, and sale of coatings and related products
to professional, industrial, commercial, and retail customers. The company manufactures products under well-
known brands such as Sherwin-Williams®, Dutch Boy®, Krylon®, Minwax®, Thompson’s® Water Seal®, and many
more. With global headquarters in Cleveland, Ohio, Sherwin-Williams® branded products are sold exclusively
through more than 4,000 company-operated stores and facilities, while the Company’s other brands are sold
through leading mass merchandisers, home centers, independent paint dealers, hardware stores, automotive
retailers, and industrial distributors. The Sherwin-Williams Global Finishes Group distributes a wide range of
products in 120 countries around the world. For more information, visit www.sherwin.com.
The Company is comprised of four reportable segments, which together provide our customers innovative
solutions to ensure their success, no matter where they work, or what surfaces they are coating.
TABLE OF CONTENTS
Our Global Footprint cover flapFinancial Highlights 1Letter to Shareholders 22012 At A Glance 6Paint Stores Group 8Consumer Group 10Global Finishes Group 12Latin America Coatings Group 14Shareholder Returns 16Financial Performance 17
The Sherwin-Williams Company is an equal opportunity employer that recruits, selects and hires on the basis of individual qualifications and prohibits unlawful discrimination based on race, color, religion, sex, national origin, protected veteran status, disability, age, sexual orientation or any other consideration made unlawful by federal, state or local laws.
● Sherwin-Williams Paint Stores are the exclusive outlets for
Sherwin-Williams® branded paints, stains, supplies, equipment
and floorcovering in the U.S., Canada and the Caribbean.
● Consumer Group sells one of the industry’s strongest
portfolios of branded and private label products through retailers
across North America and in parts of Europe, and also operates
a highly efficient and productive global supply chain for paint,
coatings and related products.
● Global Finishes Group manufactures and sells a wide range
of OEM product finishes, protective and marine coatings, and
automotive finishes to a growing customer base in 120 countries.
● Our Latin America Coatings Group manufactures and sells
a wide range of architectural paints, industrial coatings and related
products throughout Latin America.
ABOUT US
Annual Report
2012The Sherwin-Williams Company101 W. Prospect Avenue
Cleveland, Ohio 44115-1075
www.sherwin-williams.com
35161_Cover_Wt.indd 1 2/25/13 9:55 AM
UNITED STATES
CANADA
ASIA/PACIFIC
EUROPE
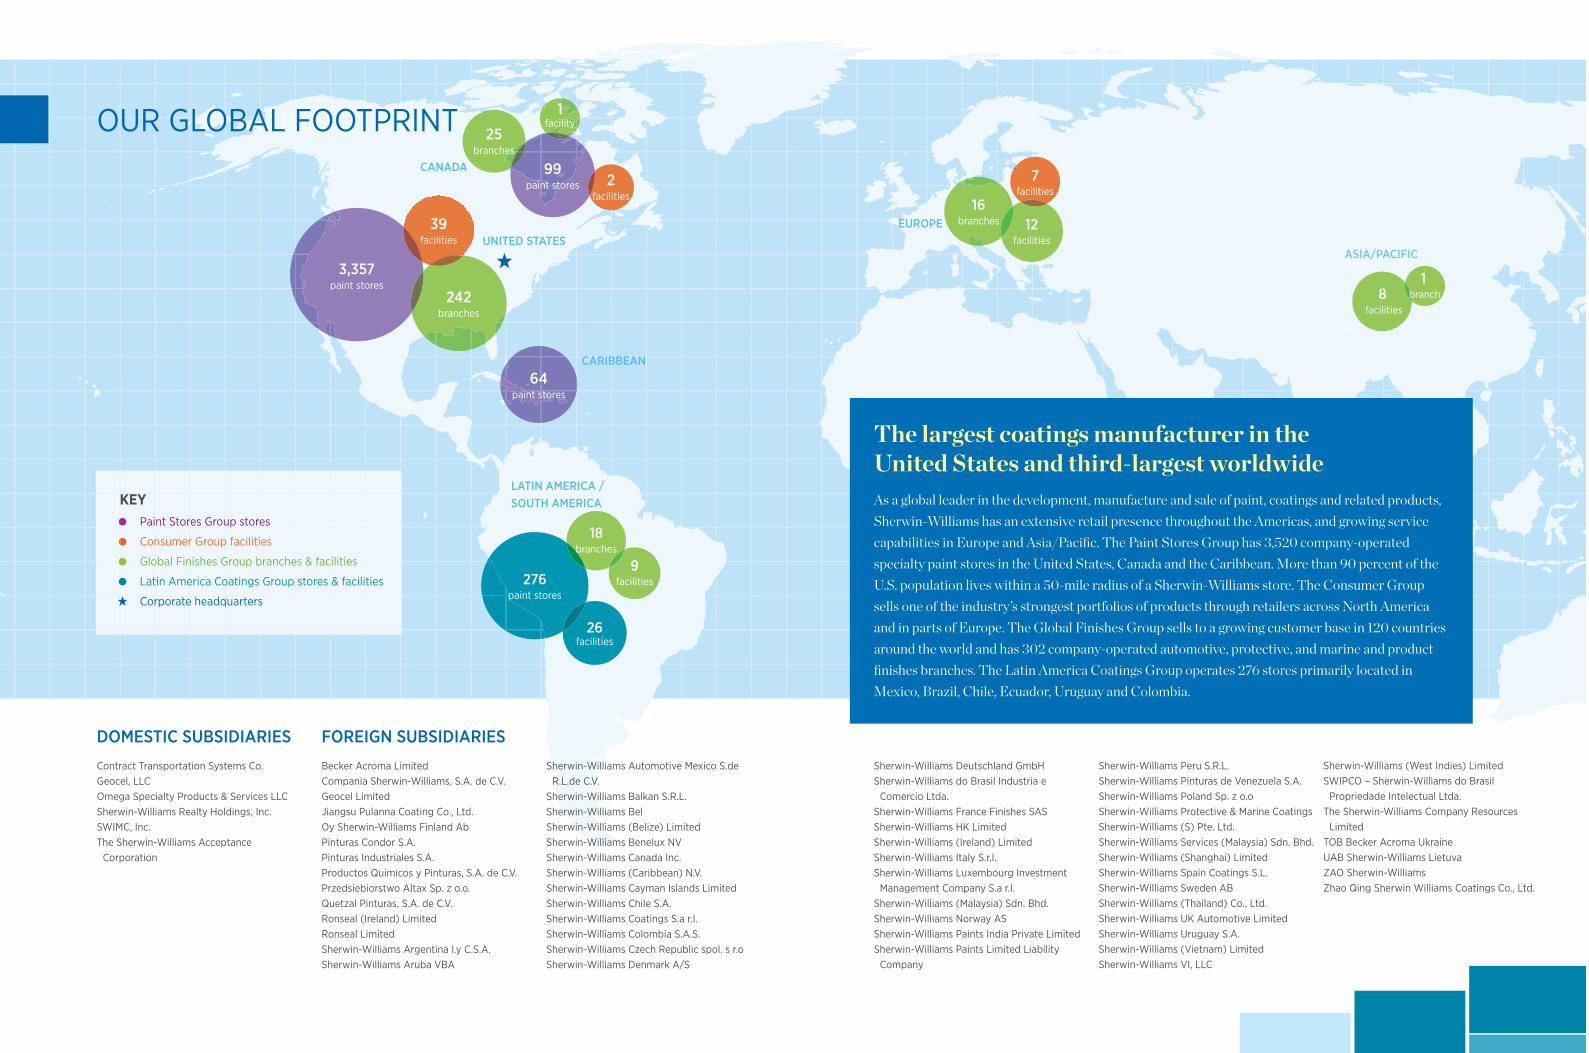
OUR GLOBAL FOOTPRINT
The largest coatings manufacturer in the United States and third-largest worldwideAs a global leader in the development, manufacture and sale of paint, coatings and related products, Sherwin-Williams has an extensive retail presence throughout the Americas, and growing service capabilities in Europe and Asia/Pacific. The Paint Stores Group has 3,520 company-operated specialty paint stores in the United States, Canada and the Caribbean. More than 90 percent of the U.S. population lives within a 50-mile radius of a Sherwin-Williams store. The Consumer Group sells one of the industry’s strongest portfolios of products through retailers across North America and in parts of Europe. The Global Finishes Group sells to a growing customer base in 120 countries around the world and has 302 company-operated automotive, protective, and marine and product finishes branches. The Latin America Coatings Group operates 276 stores primarily located in Mexico, Brazil, Chile, Ecuador, Uruguay and Colombia.
39 facilities
276 paint stores
26 facilities
64 paint stores
2 facilities
242 branches
18 branches
9 facilities
25 branches
16 branches 12
facilities
8 facilities
1 branch
3,357 paint stores
99 paint stores
7 facilities
CARIBBEAN
LATIN AMERICA / SOUTH AMERICAKEY
Paint Stores Group stores
Consumer Group facilities
Global Finishes Group branches & facilities
Latin America Coatings Group stores & facilities
Corporate headquarters
1facility
Becker Acroma LimitedCompania Sherwin-Williams, S.A. de C.V.Geocel LimitedJiangsu Pulanna Coating Co., Ltd.Oy Sherwin-Williams Finland AbPinturas Condor S.A.Pinturas Industriales S.A.Productos Quimicos y Pinturas, S.A. de C.V.Przedsiebiorstwo Altax Sp. z o.o.Quetzal Pinturas, S.A. de C.V.Ronseal (Ireland) LimitedRonseal LimitedSherwin-Williams Argentina I.y C.S.A.Sherwin-Williams Aruba VBA
FOREIGN SUBSIDIARIES
Contract Transportation Systems Co.Geocel, LLCOmega Specialty Products & Services LLCSherwin-Williams Realty Holdings, Inc.SWIMC, Inc.The Sherwin-Williams Acceptance
Corporation
DOMESTIC SUBSIDIARIES
Sherwin-Williams Automotive Mexico S.de R.L.de C.V.
Sherwin-Williams Balkan S.R.L.Sherwin-Williams BelSherwin-Williams (Belize) LimitedSherwin-Williams Benelux NVSherwin-Williams Canada Inc.Sherwin-Williams (Caribbean) N.V.Sherwin-Williams Cayman Islands LimitedSherwin-Williams Chile S.A.Sherwin-Williams Coatings S.a r.l.Sherwin-Williams Colombia S.A.S.Sherwin-Williams Czech Republic spol. s r.oSherwin-Williams Denmark A/S
Sherwin-Williams Deutschland GmbHSherwin-Williams do Brasil Industria e
Comercio Ltda.Sherwin-Williams France Finishes SASSherwin-Williams HK LimitedSherwin-Williams (Ireland) LimitedSherwin-Williams Italy S.r.l.Sherwin-Williams Luxembourg Investment
Management Company S.a r.l.Sherwin-Williams (Malaysia) Sdn. Bhd.Sherwin-Williams Norway ASSherwin-Williams Paints India Private LimitedSherwin-Williams Paints Limited Liability
Company
Sherwin-Williams Peru S.R.L.Sherwin-Williams Pinturas de Venezuela S.A.Sherwin-Williams Poland Sp. z o.oSherwin-Williams Protective & Marine CoatingsSherwin-Williams (S) Pte. Ltd. Sherwin-Williams Services (Malaysia) Sdn. Bhd.Sherwin-Williams (Shanghai) LimitedSherwin-Williams Spain Coatings S.L.Sherwin-Williams Sweden ABSherwin-Williams (Thailand) Co., Ltd.Sherwin-Williams UK Automotive LimitedSherwin-Williams Uruguay S.A.Sherwin-Williams (Vietnam) LimitedSherwin-Williams VI, LLC
Sherwin-Williams (West Indies) LimitedSWIPCO – Sherwin-Williams do Brasil
Propriedade Intelectual Ltda.The Sherwin-Williams Company Resources
LimitedTOB Becker Acroma UkraineUAB Sherwin-Williams LietuvaZAO Sherwin-WilliamsZhao Qing Sherwin Williams Coatings Co., Ltd.
2012 DIRECTORS
1. JOHN M. STROPKI, 62 Executive Chairman Lincoln Electric Holdings, Inc.
2. RICHARD K. SMUCKER, 64 Chief Executive Officer The J. M. Smucker Company
3. ARTHUR F. ANTON, 55* President and Chief Executive Officer Swagelok Company
4. SUSAN J. KROPF, 64 Retired, former President and Chief Operating Officer Avon Products, Inc.
5. CHRISTOPHER M. CONNOR, 56 Chairman and Chief Executive Officer The Sherwin-Williams Company
6. THOMAS G. KADIEN, 56* Senior Vice President Consumer Packaging and IP Asia International Paper Company
7. RICHARD J. KRAMER, 49* Chairman of the Board, Chief Executive Officer and President The Goodyear Tire & Rubber Company
8. A . MALACHI MIXON, III, 72 Chairman Invacare Corporation
9. DAVID F. HODNIK, 65* Retired, former President and Chief Executive Officer Ace Hardware Corporation
1 2 34
5
6
78
9
*Audit Committee Member
35161_Cover_Wt.indd 2 2/25/13 9:55 AM
■ 1
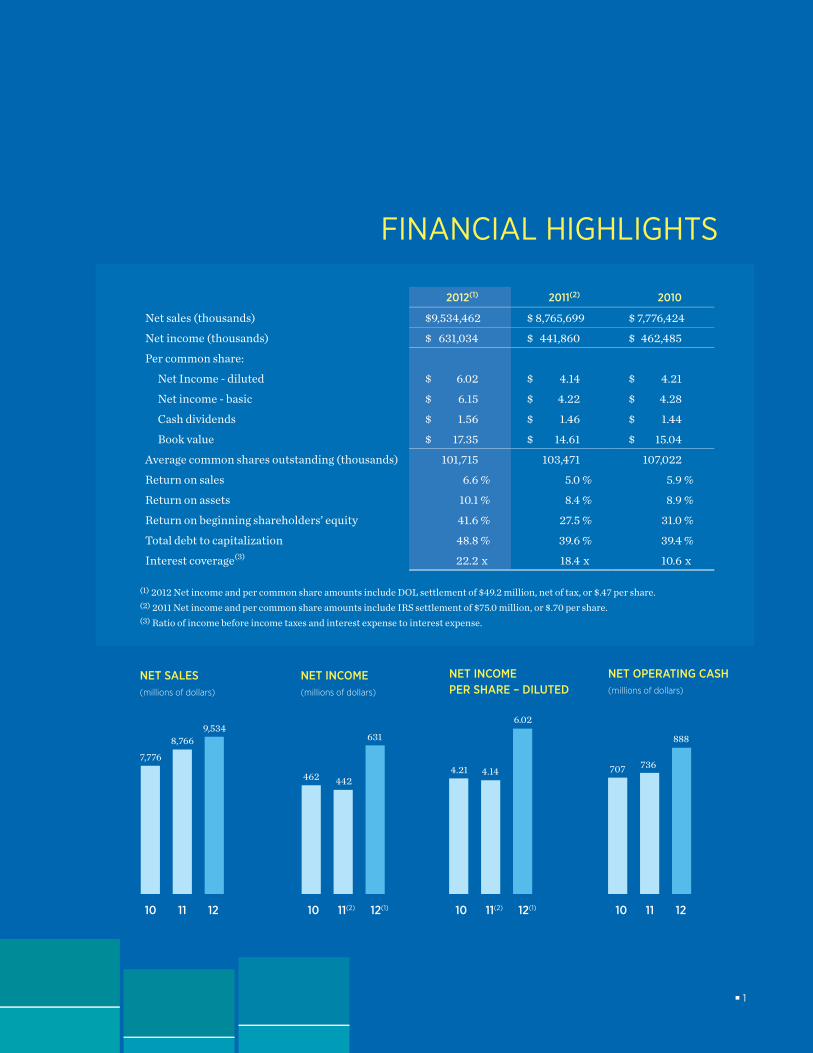
(1) 2012 Net income and per common share amounts include DOL settlement of $49.2 million, net of tax, or $.47 per share. (2) 2011 Net income and per common share amounts include IRS settlement of $75.0 million, or $.70 per share. (3) Ratio of income before income taxes and interest expense to interest expense.
2012(1) 2011(2) 2010
Net sales (thousands) $ 9,534,462 $ 8,765,699 $ 7,776,424
Net income (thousands) $ 631,034 $ 441,860 $ 462,485
Per common share:
Net Income - diluted $ 6.02 $ 4.14 $ 4.21
Net income - basic $ 6.15 $ 4.22 $ 4.28
Cash dividends $ 1.56 $ 1.46 $ 1.44
Book value $ 17.35 $ 14.61 $ 15.04
Average common shares outstanding (thousands) 101,715 103,471 107,022
Return on sales 6.6 % 5.0 % 5.9 %
Return on assets 10.1 % 8.4 % 8.9 %
Return on beginning shareholders’ equity 41.6 % 27.5 % 31.0 %
Total debt to capitalization 48.8 % 39.6 % 39.4 %
Interest coverage(3) 22.2 x 18.4 x 10.6 x
FINANCIAL HIGHLIGHTS
NET INCOME (millions of dollars)
NET SALES(millions of dollars)
NET INCOME PER SHARE – DILUTED
NET OPERATING CASH (millions of dollars)
7,776
4624.21 707
8,766
4424.14
736
9,534631
6.02
888
10 11 12 10 11(2) 12(1) 10 11(2) 12(1) 10 11 12
35161_Text_Wt.indd 1 2/25/13 11:33 AM
■ 2
LETTER TO SHAREHOLDERS
We finished 2012 with consolidated sales of $9.53 billion, an increase of 8.8 percent over our previous all-time revenue peak set in 2011. Income before taxes grew 22.4 percent to $907.3 million, net income increased 42.8 percent to $631.0 million, and diluted net income per common share increased 45.4 percent to $6.02 per share from $4.14 per share last year.
Our results for income before taxes, net income and earnings per share include a one-time payment of $80.0 million to the Company’s Employee Stock Ownership Plan to resolve a complaint by the U.S. Department of Labor. The payment resulted in an after-tax charge to earnings of $49.2 million, or $.47 per diluted common share, in Sherwin-Williams’ fourth quarter and year ended December 31, 2012. In
accordance with U.S. Generally Accepted Accounting Principles, the Company is required to recognize the resolution of this matter as a subsequent event in its 2012 fiscal year results because the event is related to conditions that existed at the balance sheet date of December 31, 2012.
During the year, our Paint Stores Group eclipsed the 3,500-store mark for the first time ever. We recruited an unprecedented 1,087 college graduates into our Management Training Programs. Finally, in November, we announced a definitive agreement to acquire Consorcio Comex, S.A. de C.V., a leader in the paint and coatings market in Mexico. Once this transaction is completed, it will be the largest acquisition in our Company’s history.
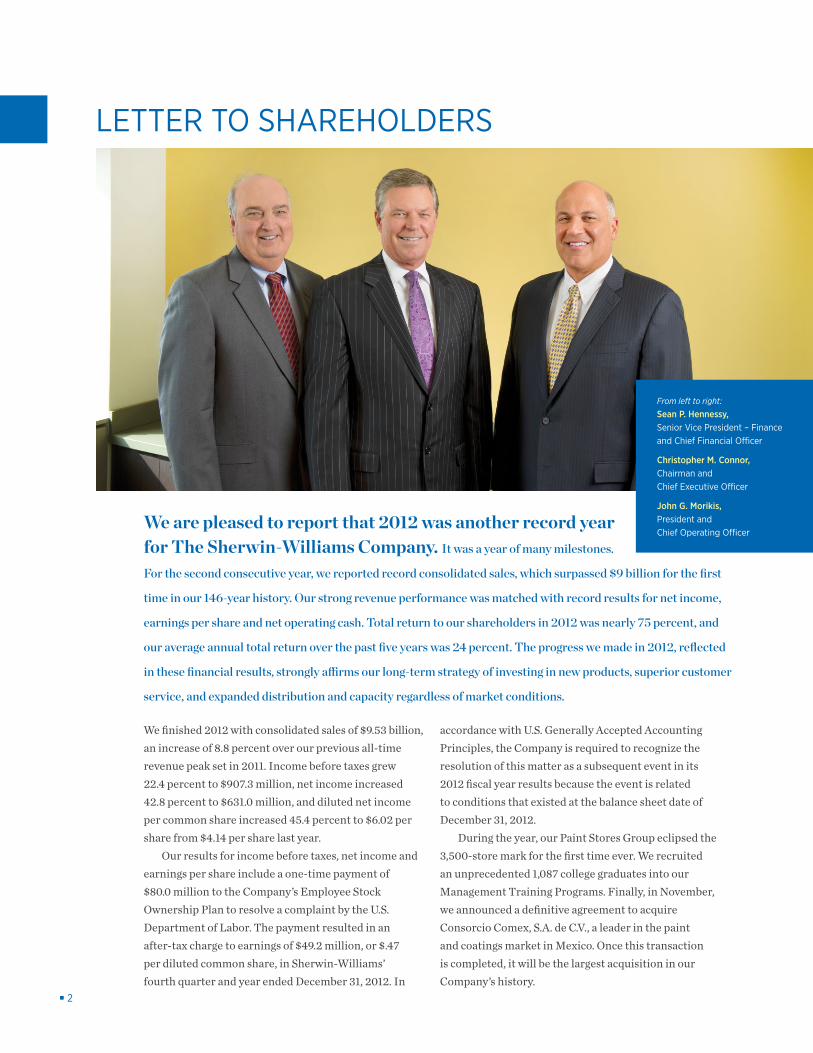
We are pleased to report that 2012 was another record year for The Sherwin-Williams Company. It was a year of many milestones.
For the second consecutive year, we reported record consolidated sales, which surpassed $9 billion for the first
time in our 146-year history. Our strong revenue performance was matched with record results for net income,
earnings per share and net operating cash. Total return to our shareholders in 2012 was nearly 75 percent, and
our average annual total return over the past five years was 24 percent. The progress we made in 2012, reflected
in these financial results, strongly affirms our long-term strategy of investing in new products, superior customer
service, and expanded distribution and capacity regardless of market conditions.
From left to right:
Sean P. Hennessy,Senior Vice President – Finance and Chief Financial Officer
Christopher M. Connor,Chairman and Chief Executive Officer
John G. Morikis, President and Chief Operating Officer
35161_Text_Wt.indd 2 2/22/13 3:31 PM
■ 3
These milestones, and many others we celebrated in 2012, were the direct result of our decision to continue to make prudent investments in our business even as market conditions were collapsing back in 2008 and 2009. Since 2009, we have opened more than 170 new company-operated stores throughout the Americas, invested $373 million to develop and commercialize new products, significantly reduced the cost and increased the productivity of our global manufacturing and distribution operations, and recruited more than 2,800 future leaders into our Management Training Programs. We believe the benefits of these investments will be felt cumulatively over time, and the outcomes we achieved this past year are repeatable.
Consistent investment relies on strong, dependable cash generation. In 2012, our net operating cash increased $152 million to $888 million, or approximately 9.3 percent of net sales. After adding back the cash settlement paid to the IRS in the first quarter of 2012, cash from operations for the year approached 10 percent of net sales, a long-term objective for the Company.
A portion of the increase in net operating cash came from our continued progress in working capital management. Our working capital ratio – accounts receivable plus inventory minus accounts payable, divided by sales – declined to 10.8 percent of sales at year-end, compared with 10.9 percent of sales at the end of 2011.
During the year, we returned more than $718 million in cash to shareholders through treasury stock purchases and quarterly dividends. The Company acquired 4.6 million shares of its common stock on the open market at an average cost of $121.25 per share and a total investment of $558 million. At year-end, we had remaining authorization from our Board to purchase an additional 16.5 million shares. We also increased our annual dividend by $.10 to $1.56 per share, extending our string of dividend increases to 34 consecutive years.
In anticipation of closing the Comex acquisition in the first half of 2013, we issued $1 billion of new debt in five- and 30-year maturities in December at a blended average rate of 2.1 percent. As a result, we finished the year with a cash balance of $863 million.
Throughout the year, we saw steady improvement in demand for many of our products, particularly in North
America. Even as year-over-year sales comparisons grew more difficult in the second half, our architectural paint volumes remained strong and we finished the year on a positive trajectory.
PAINT STORES GROUPOur Paint Stores Group is the leading operator of specialty paint stores in North America, servicing the needs of architectural and industrial painting contractors and do-it-yourself homeowners. Net sales for the Group finished the year at $5.41 billion, an increase of 13.2 percent over 2011. Comparable-store sales – sales by stores open more than 12 months – increased 12.5 percent during the year. The segment’s profit increased 33.5 percent to $861.8 million. As a percentage of sales, Paint Stores Group profit increased to a record 15.9 percent, up from 13.5 percent in 2011.
In 2012, our Paint Stores Group added 70 net new stores, bringing our store count in the U.S., Canada and the Caribbean to 3,520 locations, compared with 3,450 a year ago. Our plan for 2013 calls for net new store openings in the range of 70 to 80 locations.
Our commitment to store growth and quality staffing, combined with outstanding new products, marketing programs and sales initiatives over the past four years, has resulted in steady market share gains across most of our focus market segments. In 2012, sales to all customer segments served by our Paint Stores Group grew by more than 10 percent, led by the new residential and residential repaint segments, which were up double digits in both revenues and gallon volume.
CONSUMER GROUPOur Consumer Group fulfills a dual mission for the Company: supplying branded and private-label products to retailers throughout North America, and supporting our other North America businesses with new product research and development, manufacturing, distribution and logistics. The Group manages a highly efficient supply chain consisting of 34 manufacturing plants and seven distribution centers in the U.S. and Canada and maintains one of the safest transport operations in the world. In addition, the Consumer Group leads our worldwide architectural coatings research and development effort.
In 2012, Consumer Group sales increased 3.7 percent to $1.32 billion as a result of acquisitions and selling price increases. Acquisitions increased net sales by 3.2 percent. Segment profit increased 24.6 percent to $216.4 million as price increases and better operating efficiencies more than offset higher raw material costs. Segment profit margin expanded to 16.4 percent of sales from 13.6 percent in 2011.
Total return to our shareholders in 2012 was nearly 75 percent, and our average annual total return over the past five years was 24 percent.
35161_Text_Wt.indd 3 2/22/13 3:31 PM
In June, our Consumer Group completed the acquisition of Geocel Holdings Corporation, a leading producer of innovative sealants and adhesives for construction and repair applications in commercial, residential, industrial and transport non-automotive markets. Founded in 1974, Geocel® branded products are distributed throughout the U.S. and United Kingdom. Geocel was the first U.S.-based sealant manufacturer to receive ISO 9001 registration.
GLOBAL FINISHES GROUPOur Global Finishes Group manufactures and sells industrial coatings, automotive finishes, and protective and marine coatings to a growing customer base in 120 countries around the world. We go to market through independent retailers, dedicated dealers, jobbers and distributors as well as through our company-operated branches. Acquisitions have played a particularly important role in this segment in recent years, bringing new technology and needed capacity to key geographic regions.
Net sales for our Global Finishes Group increased 4.4 percent to $1.96 billion. In local currencies, sales grew 7.9 percent, driven by higher selling prices and volume and a 1.8 percent contribution from acquisitions. Segment profit for the year increased 63 percent to $147.2 million, despite an $11.9 million negative impact from currency translation and acquisitions. As a percentage of net sales, the Global Finishes Group’s profit increased to 7.5 percent from 4.8 percent in 2011.
In December, we completed the acquisition of Jiangsu Pulanna Coating Co., Ltd., a leading manufacturer of automotive coatings for the Chinese aftermarket. This acquisition increases Sherwin-Williams’ presence in China’s automotive sector, where passenger car sales have grown strongly in recent years, increasing from 6.8 million vehicles in 2008 to more than 16 million in 2012. Auto sales in China are forecasted to continue rising at an annual rate of approximately 10 percent for the next decade.
LATIN AMERICA COATINGS GROUPOur Latin America Coatings Group develops, manufactures, licenses and sells a variety of architectural paint and coatings, and related products throughout Latin America.
Sherwin-Williams® and other controlled brand products are distributed through company-operated specialty paint stores and by a direct sales staff and outside sales representatives to retailers, dealers, licensees and other third-party distributors. In 2012, we opened 11 net new company-operated stores in the region for a total of 276 locations.
In 2012, unfavorable currency exchange rates in many Latin America countries posed a significant challenge to revenue and profit growth in our Latin America Coatings Group. Sales in U.S. dollars increased less than 1 percent to $836.1 million, while sales in local currencies grew more than 10 percent. Profit for the segment, stated in U.S. dollars, increased 7.6 percent to $81.2 million, as price increases and higher sales volume more than offset the drag from higher raw material costs and unfavorable currency translation. Unfavorable currency translation reduced segment profit by $9.7 million in the year. As a percentage of net sales, segment profit was 9.7 percent for the year compared with 9.1 percent in 2011.
BOARD CHANGESAt our 2012 annual meeting of shareholders, Richard J. Kramer was elected to our Board of Directors and appointed to the Audit Committee. Mr. Kramer is Chairman of the Board, Chief Executive Officer and President of The Goodyear Tire & Rubber Company. He has demonstrated strong leadership for 13 years at Goodyear, and his broad financial and international experience will serve the Board and our shareholders well. We look forward to his contributions to Sherwin-Williams for many years.
In 2013, A. Malachi Mixon III will reach mandatory retirement age from our Board of Directors. Since 1993, Mr. Mixon has served our Company as a director and as a member of the Audit Committee, the Compensation and Management Development Committee, and the Nominating and Corporate Governance Committee, including serving as Chair of the Compensation and Management Development Committee. Hisstrong leadership and sage advice have proven to be of great value to the Company and its shareholders over the years. We offer Mal our heartfelt thanks and best wishes for good health and happiness in the years ahead.
MANAGEMENT CHANGESIn August, David Sewell was appointed President of our Product Finishes Division, which is part of our Global Finishes Group. David joined Sherwin-Williams in 2007 and has held a variety of leadership positions, including Senior Vice President of our Automotive Finishes Division, responsible for our automotive, aerospace, OEM and distribution businesses, and Vice President of Marketing for Automotive Finishes.
During the year, we returned more than $718 million in cash to shareholders through treasury stock purchases and quarterly dividends.
■ 4
35161_Text_Wt.indd 4 2/21/13 3:52 PM
Christopher M. ConnorChairman and Chief Executive Officer
■ 5
OUTLOOK FOR 2013We begin each year with some level of uncertainty, and 2013 is no exception. Despite the steadily improving health of many of our end markets and the positive trends we’ve seen in the cost of certain commodities, we remain cautious. Market demand and volume recovery have been erratic across geographies and end markets, and that will likely continue. Unfavorable currency translation is also likely to remain a headwind to sales and earnings throughout the year, particularly in some Latin America markets.
The market for new construction in the U.S. provides the greatest source of optimism. Housing starts increased approximately 27 percent in 2012, but new home completions grew at less than half that rate, suggesting a pipeline of projects that will be painted in 2013. Residential starts in the coming year are forecasted to grow at a healthy high-teens rate, and non-residential starts, which increased about 4 percent in the fourth quarter of 2012, should accelerate. As new construction picks up, repaint activity – the lion’s share of the market – should follow.
Raw material costs, which have been an impediment to earnings growth over the past three years, remain biased toward inflation, but the rate of inflation should be manageable. While we have seen some easing in TiO2 pricing over the back half of 2012, propylene, a key raw material feedstock, has increased 30 percent from $.55 per pound early in the fourth quarter of 2012 to approximately $.72 per pound early in the first quarter of 2013. This is likely to keep upward pressure on the price of monomers and latex in the first half of 2013.
If the past five years have taught us anything, it is that we are not – and should not be – reliant on favorable market conditions to produce better results. Our continued focus on better serving a diverse and increasingly global professional customer base, expanding our distribution domestically and abroad, developing new and innovative products, managing expenses and working capital, generating cash, and continuing to invest in our people will enable us to grow and prosper in the year ahead regardless of market conditions. We are equally confident that these same factors will produce superior results and returns for our shareholders over the long term.
To the men and women of Sherwin-Williams, I offer my heartfelt thanks for all of your hard work, skills and commitment; I truly believe that having the best team in the business is integral to our success. On behalf of all Sherwin-Williams employees around the world, we offer our thanks and appreciation to our customers, suppliers and shareholders for their continued trust and confidence.
Milestones• Surpassed $9 billion in
consolidated sales for the first
time in our 146-year history.
• Recorded all-time highs in net
income ($631.0 million), diluted
net income per share ($6.02 per
share), and net operating cash
($888 million).
• Returned more than $718 million
in cash to shareholders through
treasury stock purchases and
quarterly dividends.
• Achieved across-the-board
record financial results in the
Paint Stores Group: net sales of
$5.41 billion, operating profit of
$861.8 million, and profit as a
percentage of sales of
15.9 percent.
• Eclipsed the mark of 3,500
Sherwin-Williams paint stores
for the first time ever.
• Recruited an all-time high of
1,087 college graduates into our
Management Training Programs.
■ 5
35161_Text_Wt.indd 5 2/22/13 3:32 PM
■ 6
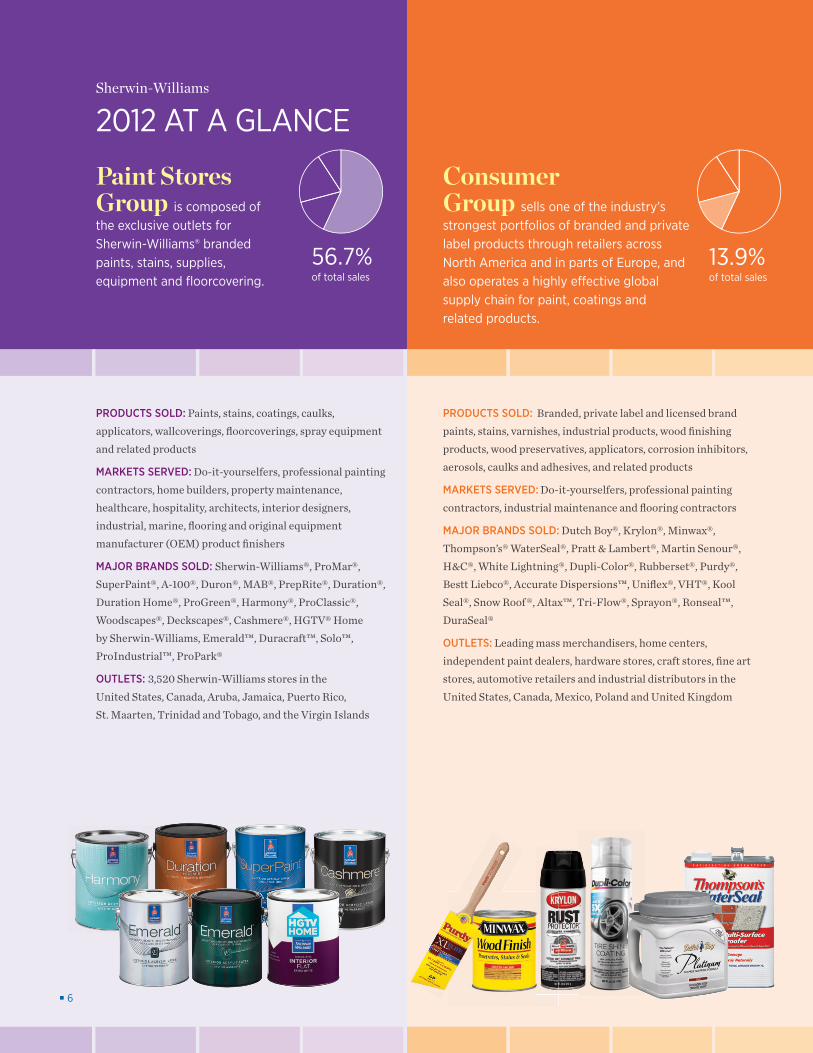
PRODUCTS SOLD: Paints, stains, coatings, caulks, applicators, wallcoverings, floorcoverings, spray equipment and related products
MARKETS SERVED: Do-it-yourselfers, professional painting contractors, home builders, property maintenance, healthcare, hospitality, architects, interior designers, industrial, marine, flooring and original equipment manufacturer (OEM) product finishers
MAJOR BRANDS SOLD: Sherwin-Williams®, ProMar®, SuperPaint®, A-100®, Duron®, MAB®, PrepRite®, Duration®, Duration Home®, ProGreen®, Harmony®, ProClassic®, Woodscapes®, Deckscapes®, Cashmere®, HGTV® Home by Sherwin-Williams, Emerald™, Duracraft™, Solo™, ProIndustrial™, ProPark®
OUTLETS: 3,520 Sherwin-Williams stores in the United States, Canada, Aruba, Jamaica, Puerto Rico, St. Maarten, Trinidad and Tobago, and the Virgin Islands
PRODUCTS SOLD: Branded, private label and licensed brand paints, stains, varnishes, industrial products, wood finishing products, wood preservatives, applicators, corrosion inhibitors, aerosols, caulks and adhesives, and related products
MARKETS SERVED: Do-it-yourselfers, professional painting contractors, industrial maintenance and flooring contractors
MAJOR BRANDS SOLD: Dutch Boy®, Krylon®, Minwax®, Thompson’s® WaterSeal®, Pratt & Lambert®, Martin Senour®, H&C®, White Lightning®, Dupli-Color®, Rubberset®, Purdy®, Bestt Liebco®, Accurate Dispersions™, Uniflex®, VHT®, Kool Seal®, Snow Roof®, Altax™, Tri-Flow®, Sprayon®, Ronseal™, DuraSeal®
OUTLETS: Leading mass merchandisers, home centers, independent paint dealers, hardware stores, craft stores, fine art stores, automotive retailers and industrial distributors in the United States, Canada, Mexico, Poland and United Kingdom
13.9% of total sales
56.7% of total sales
Consumer Group sells one of the industry’s strongest portfolios of branded and private label products through retailers across North America and in parts of Europe, and also operates a highly effective global supply chain for paint, coatings and related products.
Paint Stores Group is composed of the exclusive outlets for Sherwin-Williams® branded paints, stains, supplies, equipment and floorcovering.
Sherwin-Williams
2012 AT A GLANCE
35161_Text_Wt.indd 6 2/21/13 3:52 PM
■ 7
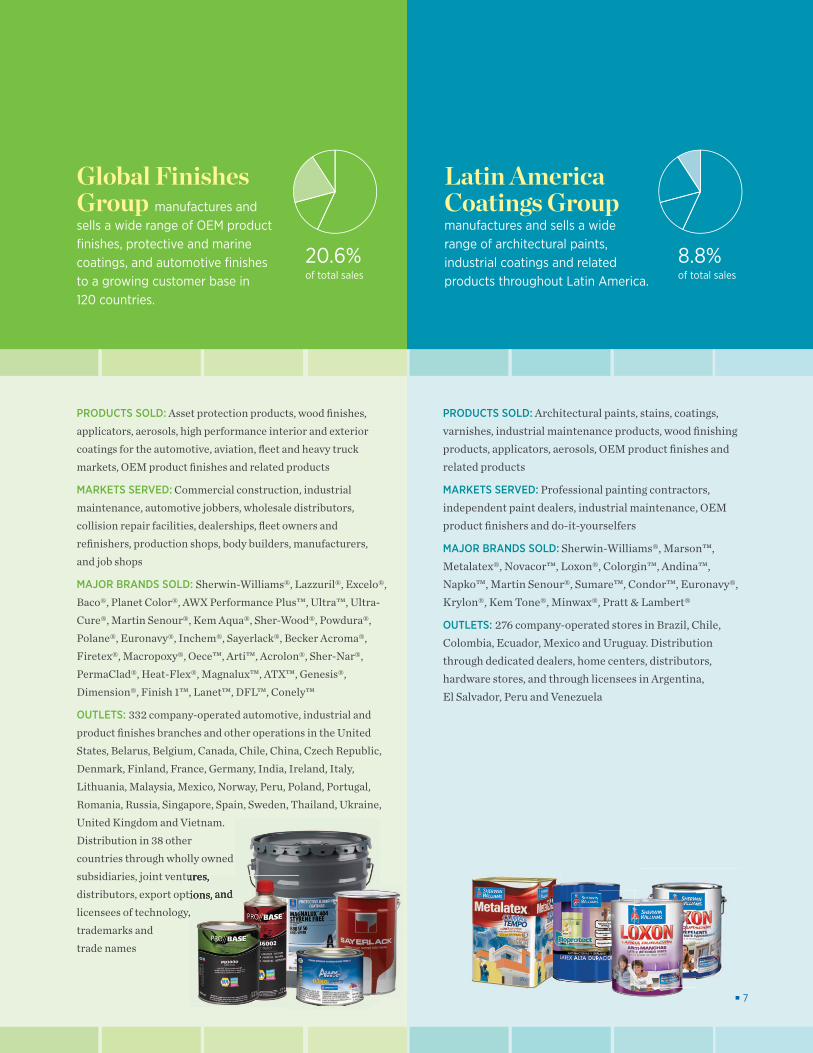
PRODUCTS SOLD: Asset protection products, wood finishes, applicators, aerosols, high performance interior and exterior coatings for the automotive, aviation, fleet and heavy truck markets, OEM product finishes and related products
MARKETS SERVED: Commercial construction, industrial maintenance, automotive jobbers, wholesale distributors, collision repair facilities, dealerships, fleet owners and refinishers, production shops, body builders, manufacturers, and job shops
MAJOR BRANDS SOLD: Sherwin-Williams®, Lazzuril®, Excelo®, Baco®, Planet Color®, AWX Performance Plus™, Ultra™, Ultra-Cure®, Martin Senour®, Kem Aqua®, Sher-Wood®, Powdura®, Polane®, Euronavy®, Inchem®, Sayerlack®, Becker Acroma®, Firetex®, Macropoxy®, Oece™, Arti™, Acrolon®, Sher-Nar®, PermaClad®, Heat-Flex®, Magnalux™, ATX™, Genesis®, Dimension®, Finish 1™, Lanet™, DFL™, Conely™
OUTLETS: 332 company-operated automotive, industrial and product finishes branches and other operations in the United States, Belarus, Belgium, Canada, Chile, China, Czech Republic, Denmark, Finland, France, Germany, India, Ireland, Italy, Lithuania, Malaysia, Mexico, Norway, Peru, Poland, Portugal, Romania, Russia, Singapore, Spain, Sweden, Thailand, Ukraine, United Kingdom and Vietnam. Distribution in 38 other countries through wholly owned subsidiaries, joint ventures, distributors, export options, and licensees of technology, trademarks and trade names
PRODUCTS SOLD: Architectural paints, stains, coatings, varnishes, industrial maintenance products, wood finishing products, applicators, aerosols, OEM product finishes and related products
MARKETS SERVED: Professional painting contractors, independent paint dealers, industrial maintenance, OEM product finishers and do-it-yourselfers
MAJOR BRANDS SOLD: Sherwin-Williams®, Marson™, Metalatex®, Novacor™, Loxon®, Colorgin™, Andina™, Napko™, Martin Senour®, Sumare™, Condor™, Euronavy®, Krylon®, Kem Tone®, Minwax®, Pratt & Lambert®
OUTLETS: 276 company-operated stores in Brazil, Chile, Colombia, Ecuador, Mexico and Uruguay. Distribution through dedicated dealers, home centers, distributors, hardware stores, and through licensees in Argentina, El Salvador, Peru and Venezuela
Global Finishes Group manufactures and sells a wide range of OEM product finishes, protective and marine coatings, and automotive finishes to a growing customer base in 120 countries.
Latin America Coatings Group manufactures and sells a wide range of architectural paints, industrial coatings and related products throughout Latin America.
20.6% of total sales
8.8% of total sales
ventures, options, and
technology,
35161_Text_Wt.indd 7 2/21/13 3:53 PM
■ 8
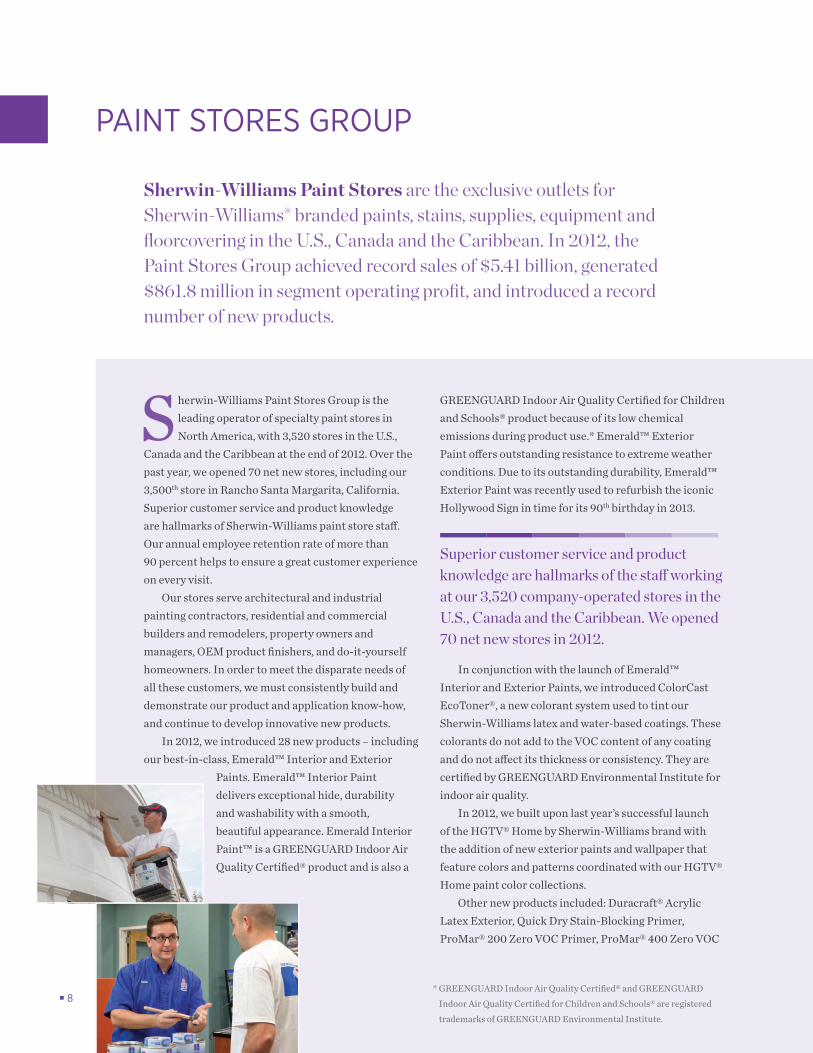
Sherwin-Williams Paint Stores Group is the leading operator of specialty paint stores in North America, with 3,520 stores in the U.S.,
Canada and the Caribbean at the end of 2012. Over the past year, we opened 70 net new stores, including our 3,500th store in Rancho Santa Margarita, California. Superior customer service and product knowledge are hallmarks of Sherwin-Williams paint store staff. Our annual employee retention rate of more than 90 percent helps to ensure a great customer experience on every visit.
Our stores serve architectural and industrial painting contractors, residential and commercial builders and remodelers, property owners and managers, OEM product finishers, and do-it-yourself homeowners. In order to meet the disparate needs of all these customers, we must consistently build and demonstrate our product and application know-how, and continue to develop innovative new products.
In 2012, we introduced 28 new products – including our best-in-class, Emerald™ Interior and Exterior
Paints. Emerald™ Interior Paint delivers exceptional hide, durability and washability with a smooth, beautiful appearance. Emerald Interior Paint™ is a GREENGUARD Indoor Air Quality Certified® product and is also a
PAINT STORES GROUP
GREENGUARD Indoor Air Quality Certified for Children and Schools® product because of its low chemical emissions during product use.* Emerald™ Exterior Paint offers outstanding resistance to extreme weather conditions. Due to its outstanding durability, Emerald™ Exterior Paint was recently used to refurbish the iconic Hollywood Sign in time for its 90th birthday in 2013.
In conjunction with the launch of Emerald™ Interior and Exterior Paints, we introduced ColorCast EcoToner®, a new colorant system used to tint our Sherwin-Williams latex and water-based coatings. These colorants do not add to the VOC content of any coating and do not affect its thickness or consistency. They are certified by GREENGUARD Environmental Institute for indoor air quality.
In 2012, we built upon last year’s successful launch of the HGTV® Home by Sherwin-Williams brand with the addition of new exterior paints and wallpaper that feature colors and patterns coordinated with our HGTV® Home paint color collections.
Other new products included: Duracraft® Acrylic Latex Exterior, Quick Dry Stain-Blocking Primer, ProMar® 200 Zero VOC Primer, ProMar® 400 Zero VOC
Sherwin-Williams Paint Stores are the exclusive outlets for Sherwin-Williams® branded paints, stains, supplies, equipment and floorcovering in the U.S., Canada and the Caribbean. In 2012, the Paint Stores Group achieved record sales of $5.41 billion, generated $861.8 million in segment operating profit, and introduced a record number of new products.
Superior customer service and product knowledge are hallmarks of the staff working at our 3,520 company-operated stores in the U.S., Canada and the Caribbean. We opened 70 net new stores in 2012.
* GREENGUARD Indoor Air Quality Certified® and GREENGUARD Indoor Air Quality Certified for Children and Schools® are registered trademarks of GREENGUARD Environmental Institute.
35161_Text_Wt.indd 8 2/21/13 3:53 PM
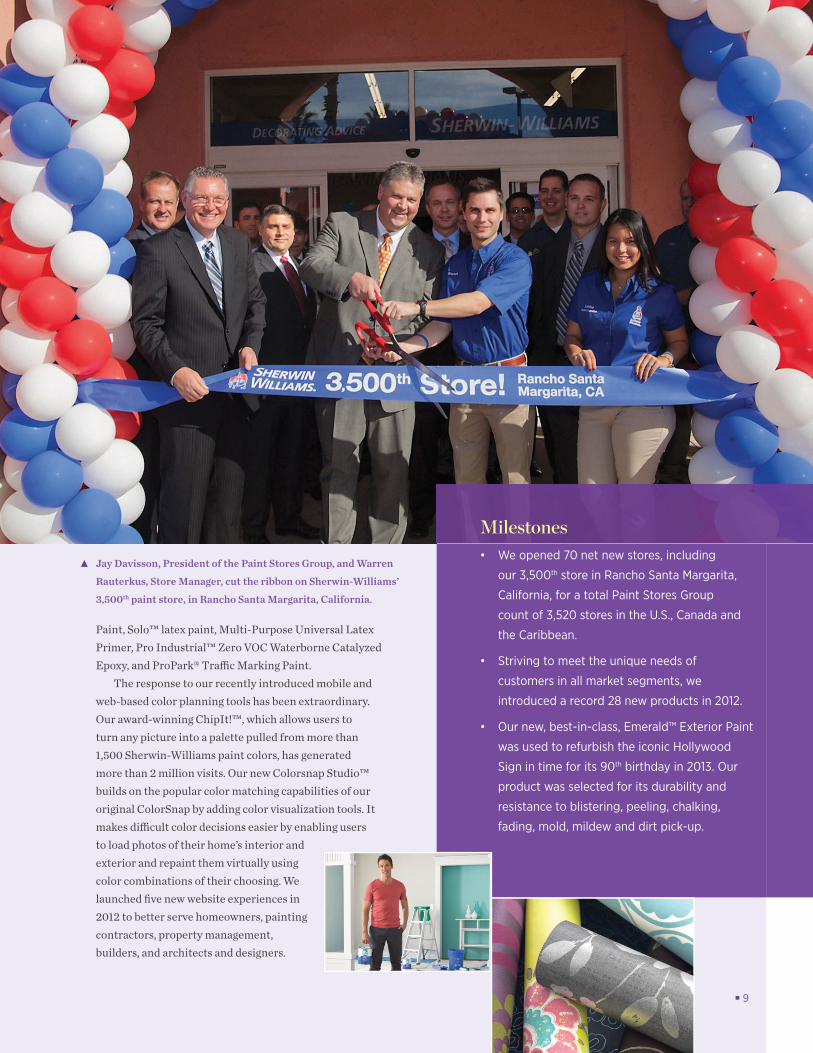
Milestones• Weopened70netnewstores,including
our3,500thstoreinRanchoSantaMargarita,
California,foratotalPaintStoresGroup
countof3,520storesintheU.S.,Canadaand
theCaribbean.
• Strivingtomeettheuniqueneedsof
customersinallmarketsegments,we
introducedarecord28newproductsin2012.
• Ournew,best-in-class,Emerald™ExteriorPaint
wasusedtorefurbishtheiconicHollywood
Signintimeforits90thbirthdayin2013.Our
productwasselectedforitsdurabilityand
resistancetoblistering,peeling,chalking,
fading,mold,mildewanddirtpick-up.
■ 9
Paint, Solo™ latex paint, Multi-Purpose Universal Latex Primer, Pro Industrial™ Zero VOC Waterborne Catalyzed Epoxy, and ProPark® Traffic Marking Paint.
The response to our recently introduced mobile and web-based color planning tools has been extraordinary. Our award-winning ChipIt!™, which allows users to turn any picture into a palette pulled from more than 1,500 Sherwin-Williams paint colors, has generated more than 2 million visits. Our new Colorsnap Studio™ builds on the popular color matching capabilities of our original ColorSnap by adding color visualization tools. It makes difficult color decisions easier by enabling users to load photos of their home’s interior and exterior and repaint them virtually using color combinations of their choosing. We launched five new website experiences in 2012 to better serve homeowners, painting contractors, property management, builders, and architects and designers.
Jay Davisson, President of the Paint Stores Group, and Warren
Rauterkus, Store Manager, cut the ribbon on Sherwin-Williams’
3,500th paint store, in Rancho Santa Margarita, California.
35161_Text_Wt.indd 9 2/21/13 3:53 PM
CONSUMER GROUP
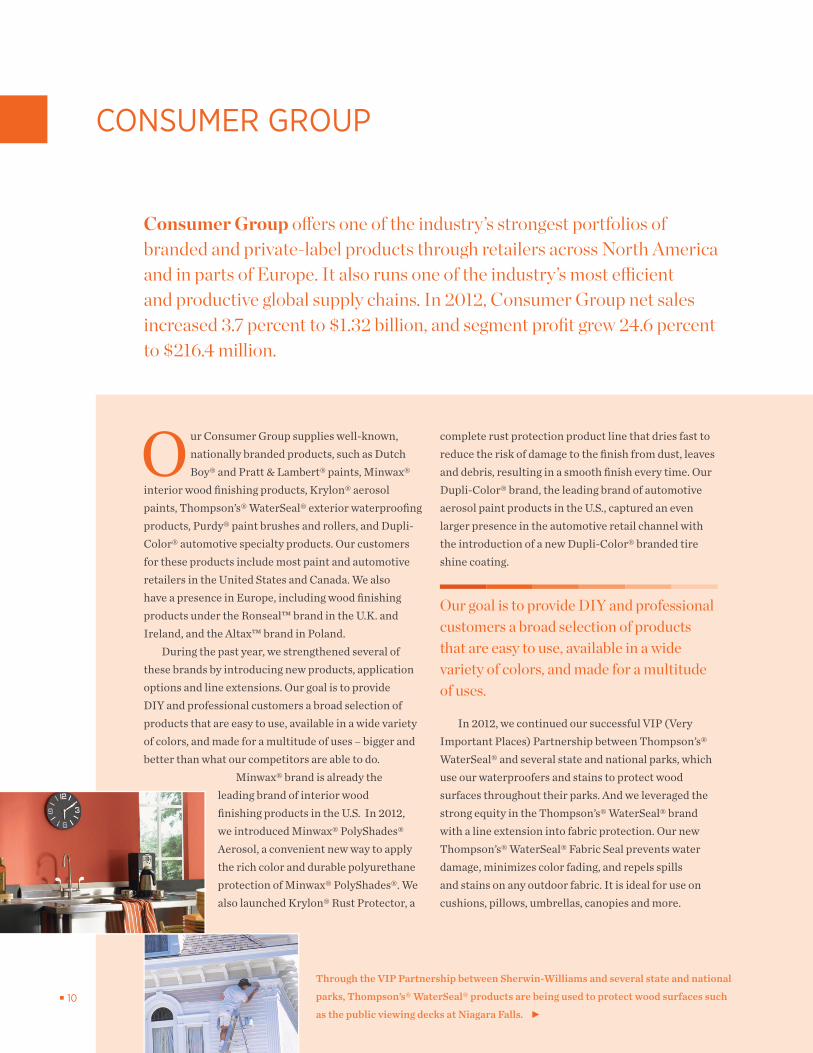
Consumer Group offers one of the industry’s strongest portfolios of branded and private-label products through retailers across North America and in parts of Europe. It also runs one of the industry’s most efficient and productive global supply chains. In 2012, Consumer Group net sales increased 3.7 percent to $1.32 billion, and segment profit grew 24.6 percent to $216.4 million.
Our Consumer Group supplies well-known, nationally branded products, such as Dutch Boy® and Pratt & Lambert® paints, Minwax®
interior wood finishing products, Krylon® aerosol paints, Thompson’s® WaterSeal® exterior waterproofing products, Purdy® paint brushes and rollers, and Dupli-Color® automotive specialty products. Our customers for these products include most paint and automotive retailers in the United States and Canada. We also have a presence in Europe, including wood finishing products under the Ronseal™ brand in the U.K. and Ireland, and the Altax™ brand in Poland.
During the past year, we strengthened several of these brands by introducing new products, application options and line extensions. Our goal is to provide DIY and professional customers a broad selection of products that are easy to use, available in a wide variety of colors, and made for a multitude of uses – bigger and better than what our competitors are able to do.
Minwax® brand is already the leading brand of interior wood finishing products in the U.S. In 2012, we introduced Minwax® PolyShades® Aerosol, a convenient new way to apply the rich color and durable polyurethane protection of Minwax® PolyShades®. We also launched Krylon® Rust Protector, a
complete rust protection product line that dries fast to reduce the risk of damage to the finish from dust, leaves and debris, resulting in a smooth finish every time. Our Dupli-Color® brand, the leading brand of automotive aerosol paint products in the U.S., captured an even larger presence in the automotive retail channel with the introduction of a new Dupli-Color® branded tire shine coating.
In 2012, we continued our successful VIP (Very Important Places) Partnership between Thompson’s® WaterSeal® and several state and national parks, which use our waterproofers and stains to protect wood surfaces throughout their parks. And we leveraged the strong equity in the Thompson’s® WaterSeal® brand with a line extension into fabric protection. Our new Thompson’s® WaterSeal® Fabric Seal prevents water damage, minimizes color fading, and repels spills and stains on any outdoor fabric. It is ideal for use on cushions, pillows, umbrellas, canopies and more.
■ 10
Our goal is to provide DIY and professional customers a broad selection of products that are easy to use, available in a wide variety of colors, and made for a multitude of uses.
Through the VIP Partnership between Sherwin-Williams and several state and national
parks, Thompson’s® WaterSeal® products are being used to protect wood surfaces such
as the public viewing decks at Niagara Falls.
35161_Text_Wt.indd 10 2/21/13 3:53 PM

During the year, we acquired Geocel Holdings Corporation, a leading brand of sealants for roofing distribution and the transport industry in the U.S. and the U.K. Geocel has been best known for its paintable, “crystal clear” sealant technology, and features a broad portfolio of tripolymer, hybrid, polyurethane and silicone formulations.
In 2012, we consolidated various operations and supply chain functions around the world into one focused organization. The goal of this initiative is
to facilitate the sharing of systems, tools, processes and best practices in manufacturing, distribution and logistics worldwide. Our Six Sigma and Lean Continuous Improvement initiatives delivered the 11th consecutive year of increased operational excellence savings. Further, we recorded our highest service levels ever, had the lowest distressed batch rate in our recorded history and had zero mislabels.
Milestones• WelaunchedourGlobalSupplyChainOrganization,whichenabledusto
consolidateourworldwideoperationsandsupplychainfunctionsintoone
focusedorganization,resultinginadditionalcompetitiveadvantageforthe
Company.
• UnderourVIP(VeryImportantPlaces)Partnershipwithseveralstate
andnationalparks,Thompson’s®WaterSeal®waterproofersandstainsarebeingusedonthewoodsurfacesatNiagaraFallsStatePark,Glacier
NationalPark,YellowstoneNationalPark,andGrandCanyonNationalPark.
• Our2012acquisitionofGeocel,aleadingbrandofsealantsforroofing
distributionandthetransportindustry,providesuswithabroadportfolio
oftripolymer,hybrid,polyurethaneandsiliconeformulations.
■ 11
35161_Text_Wt.indd 11 2/21/13 3:53 PM
■ 12
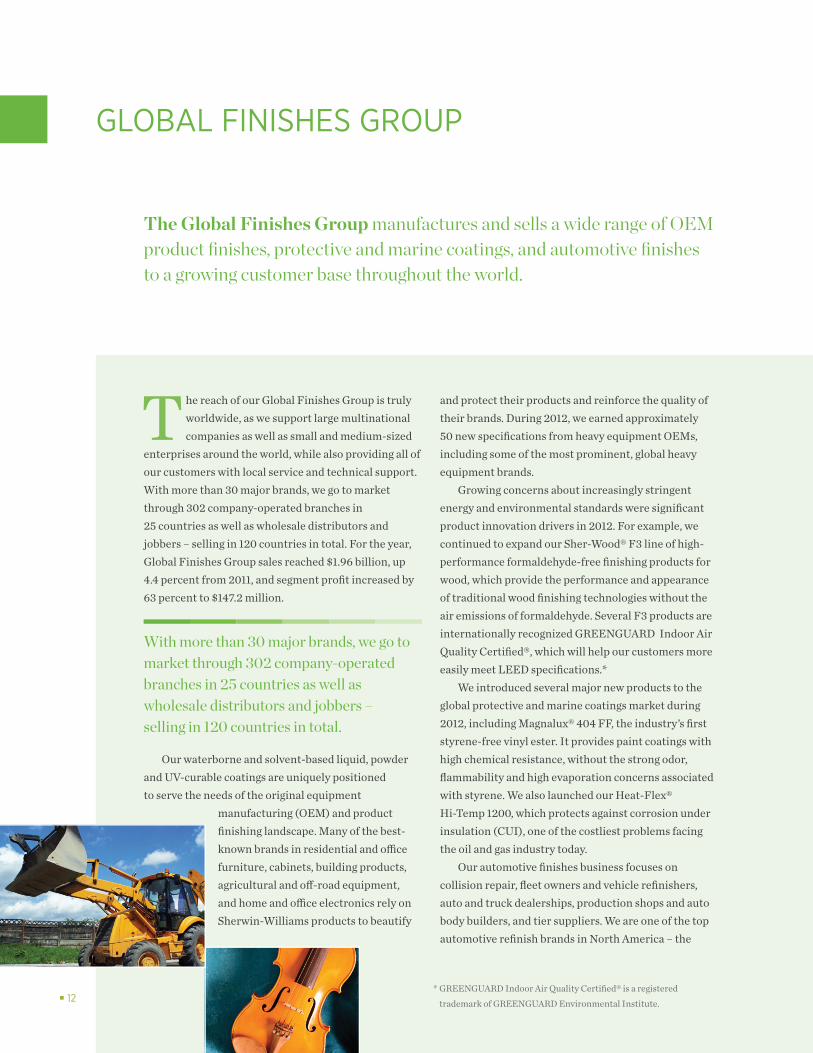
The reach of our Global Finishes Group is truly worldwide, as we support large multinational companies as well as small and medium-sized
enterprises around the world, while also providing all of our customers with local service and technical support. With more than 30 major brands, we go to market through 302 company-operated branches in 25 countries as well as wholesale distributors and jobbers – selling in 120 countries in total. For the year, Global Finishes Group sales reached $1.96 billion, up 4.4 percent from 2011, and segment profit increased by 63 percent to $147.2 million.
Our waterborne and solvent-based liquid, powder and UV-curable coatings are uniquely positioned to serve the needs of the original equipment
manufacturing (OEM) and product finishing landscape. Many of the best-known brands in residential and office furniture, cabinets, building products, agricultural and off-road equipment, and home and office electronics rely on Sherwin-Williams products to beautify
and protect their products and reinforce the quality of their brands. During 2012, we earned approximately 50 new specifications from heavy equipment OEMs, including some of the most prominent, global heavy equipment brands.
Growing concerns about increasingly stringent energy and environmental standards were significant product innovation drivers in 2012. For example, we continued to expand our Sher-Wood® F3 line of high-performance formaldehyde-free finishing products for wood, which provide the performance and appearance of traditional wood finishing technologies without the air emissions of formaldehyde. Several F3 products are internationally recognized GREENGUARD Indoor Air Quality Certified®, which will help our customers more easily meet LEED specifications.*
We introduced several major new products to the global protective and marine coatings market during 2012, including Magnalux® 404 FF, the industry’s first styrene-free vinyl ester. It provides paint coatings with high chemical resistance, without the strong odor, flammability and high evaporation concerns associated with styrene. We also launched our Heat-Flex® Hi-Temp 1200, which protects against corrosion under insulation (CUI), one of the costliest problems facing the oil and gas industry today.
Our automotive finishes business focuses on collision repair, fleet owners and vehicle refinishers, auto and truck dealerships, production shops and auto body builders, and tier suppliers. We are one of the top automotive refinish brands in North America – the
The Global Finishes Group manufactures and sells a wide range of OEM product finishes, protective and marine coatings, and automotive finishes to a growing customer base throughout the world.
GLOBAL FINISHES GROUP
With more than 30 major brands, we go to market through 302 company-operated branches in 25 countries as well as wholesale distributors and jobbers – selling in 120 countries in total.
* GREENGUARD Indoor Air Quality Certified® is a registered trademark of GREENGUARD Environmental Institute.
35161_Text_Wt.indd 12 2/21/13 3:54 PM

■ 13
market leader in the production shop segment – and the leading supplier of coatings to the Latin America automotive refinish market. New products in 2012 included upgrades in our AWX Performance Plus™ waterborne technology; the ATX™ 3.5 VOC solvent-borne system for vehicle undercoats, basecoats and clears; the “adaptive” Clearcoat Technology platform to ensure consistent auto finishing under a wide variety of conditions; and a wider range of Genesis® Direct coatings for direct-to-metal applications. In December, we completed theacquisition of Jiangsu Pulanna Coating Co., Ltd., headquartered in Changzou, China, which has elevated our market share in automotive finishes to a top three position in China.
Milestones• Weearned50newspecificationsfromheavyequipmentOEMs,
addingtoourever-expandinglistofspecificationapprovals.
• Ourhigh-qualityFIRETEX®intumescentfireprotectioncoatings
wereusedon7,500tonnesofsteelforTheShardatLondon
Bridge,thetallestbuildingintheEuropeanUnion.Othersignature
protectiveandmarineprojectsfortheGlobalFinishesGroup
includedtheRefineriadeCartagena,thelargestcapitalexpansion
ofanoilrefineryinSouthAmerica;andthemassiveEarthoidwater
tankinGermantown,Maryland,whichisvisiblefromouterspace.
• WeacquiredJiangsuPulannaCoatingCo.,Ltd.,headquartered
inChangzou,China,whichhaselevatedourmarketsharein
automotivefinishestoatopthreepositioninChina.
FIRETEX® fire protection coatings protect
The Shard at London Bridge, one of the most
impressive and tallest buildings in the
European Union.
35161_Text_Wt.indd 13 2/21/13 3:54 PM
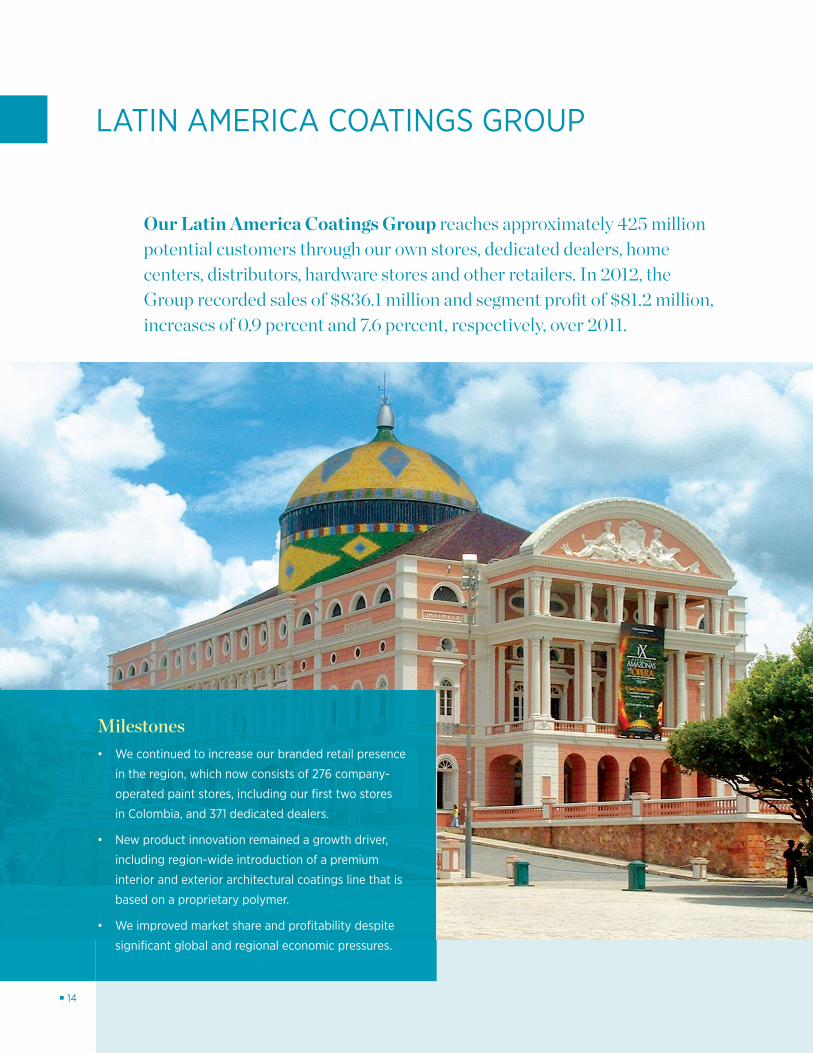
Milestones• Wecontinuedtoincreaseourbrandedretailpresence
intheregion,whichnowconsistsof276company-
operatedpaintstores,includingourfirsttwostores
inColombia,and371dedicateddealers.
• Newproductinnovationremainedagrowthdriver,
includingregion-wideintroductionofapremium
interiorandexteriorarchitecturalcoatingslinethatis
basedonaproprietarypolymer.
• Weimprovedmarketshareandprofitabilitydespite
significantglobalandregionaleconomicpressures.
■ 14
Our Latin America Coatings Group reaches approximately 425 million potential customers through our own stores, dedicated dealers, home centers, distributors, hardware stores and other retailers. In 2012, the Group recorded sales of $836.1 million and segment profit of $81.2 million, increases of 0.9 percent and 7.6 percent, respectively, over 2011.
LATIN AMERICA COATINGS GROUP
35161_Text_Wt.indd 14 2/21/13 3:54 PM
■ 15
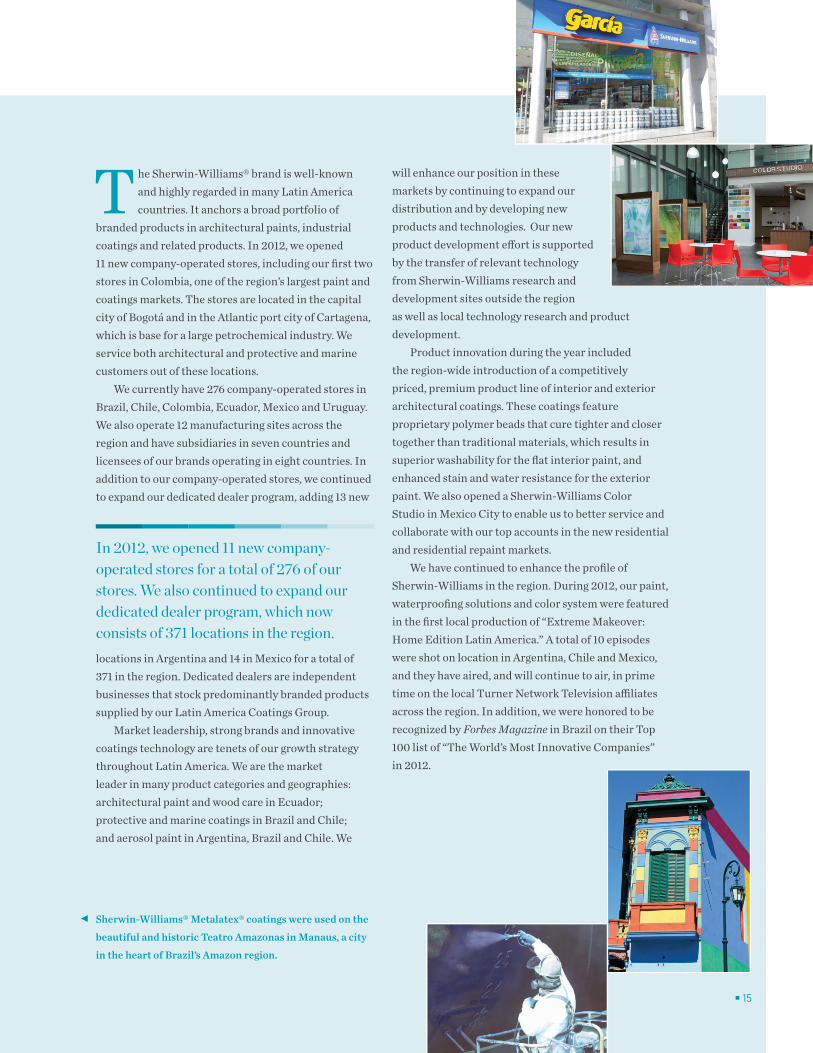
The Sherwin-Williams® brand is well-known and highly regarded in many Latin America countries. It anchors a broad portfolio of
branded products in architectural paints, industrial coatings and related products. In 2012, we opened 11 new company-operated stores, including our first two stores in Colombia, one of the region’s largest paint and coatings markets. The stores are located in the capital city of Bogotá and in the Atlantic port city of Cartagena, which is base for a large petrochemical industry. We service both architectural and protective and marine customers out of these locations.
We currently have 276 company-operated stores in Brazil, Chile, Colombia, Ecuador, Mexico and Uruguay. We also operate 12 manufacturing sites across the region and have subsidiaries in seven countries and licensees of our brands operating in eight countries. In addition to our company-operated stores, we continued to expand our dedicated dealer program, adding 13 new
locations in Argentina and 14 in Mexico for a total of 371 in the region. Dedicated dealers are independent businesses that stock predominantly branded products supplied by our Latin America Coatings Group.
Market leadership, strong brands and innovative coatings technology are tenets of our growth strategy throughout Latin America. We are the market leader in many product categories and geographies: architectural paint and wood care in Ecuador; protective and marine coatings in Brazil and Chile; and aerosol paint in Argentina, Brazil and Chile. We
will enhance our position in these markets by continuing to expand our distribution and by developing new products and technologies. Our new product development effort is supported by the transfer of relevant technology from Sherwin-Williams research and development sites outside the region as well as local technology research and product development.
Product innovation during the year included the region-wide introduction of a competitively priced, premium product line of interior and exterior architectural coatings. These coatings feature proprietary polymer beads that cure tighter and closer together than traditional materials, which results in superior washability for the flat interior paint, and enhanced stain and water resistance for the exterior paint. We also opened a Sherwin-Williams Color Studio in Mexico City to enable us to better service and collaborate with our top accounts in the new residential and residential repaint markets.
We have continued to enhance the profile of Sherwin-Williams in the region. During 2012, our paint, waterproofing solutions and color system were featured in the first local production of “Extreme Makeover: Home Edition Latin America.” A total of 10 episodes were shot on location in Argentina, Chile and Mexico, and they have aired, and will continue to air, in prime time on the local Turner Network Television affiliates across the region. In addition, we were honored to be recognized by Forbes Magazine in Brazil on their Top 100 list of “The World’s Most Innovative Companies” in 2012.
In 2012, we opened 11 new company- operated stores for a total of 276 of our stores. We also continued to expand our dedicated dealer program, which now consists of 371 locations in the region.
Sherwin-Williams® Metalatex® coatings were used on the
beautiful and historic Teatro Amazonas in Manaus, a city
in the heart of Brazil’s Amazon region.
35161_Text_Wt.indd 15 2/22/13 4:05 PM
■ 16
SHAREHOLDER RETURNS
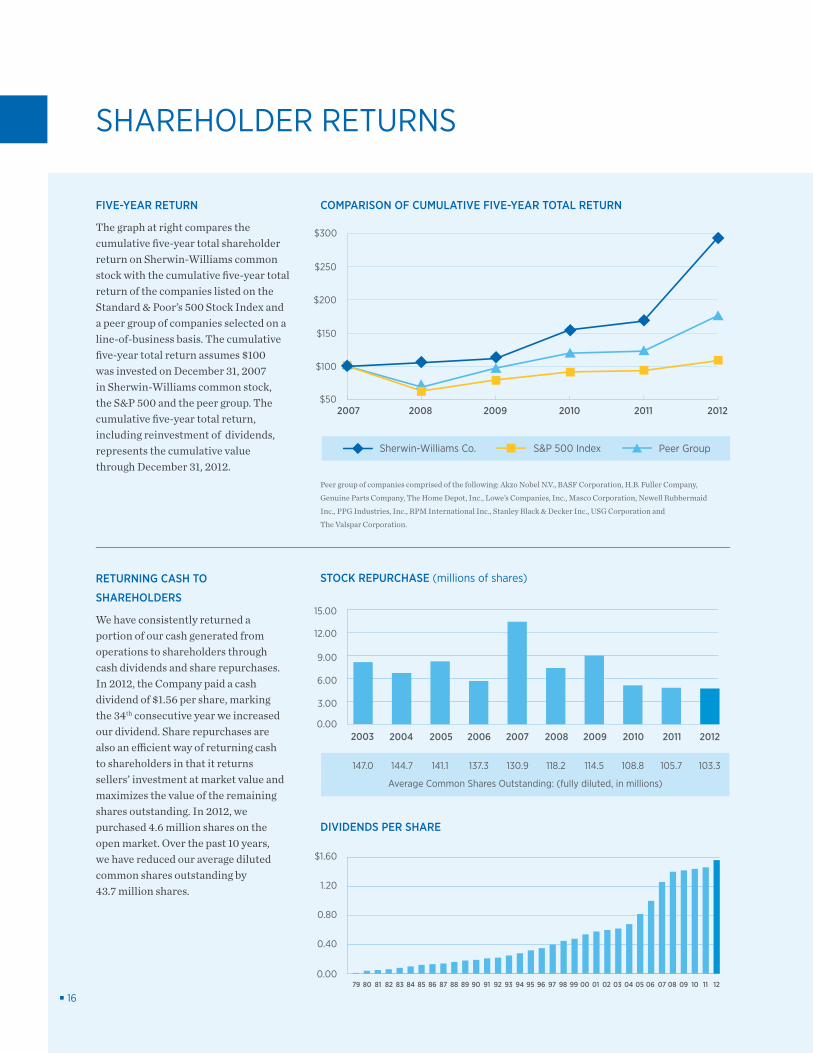
FIVE-YEAR RETURN
The graph at right compares the cumulative five-year total shareholder return on Sherwin-Williams common stock with the cumulative five-year total return of the companies listed on the Standard & Poor’s 500 Stock Index and a peer group of companies selected on a line-of-business basis. The cumulative five-year total return assumes $100 was invested on December 31, 2007 in Sherwin-Williams common stock, the S&P 500 and the peer group. The cumulative five-year total return, including reinvestment of dividends, represents the cumulative value through December 31, 2012.
RETURNING CASH TO
SHAREHOLDERS
We have consistently returned a portion of our cash generated from operations to shareholders through cash dividends and share repurchases. In 2012, the Company paid a cash dividend of $1.56 per share, marking the 34th consecutive year we increased our dividend. Share repurchases are also an efficient way of returning cash to shareholders in that it returns sellers’ investment at market value and maximizes the value of the remaining shares outstanding. In 2012, we purchased 4.6 million shares on the open market. Over the past 10 years, we have reduced our average diluted common shares outstanding by 43.7 million shares.
0.00
3.00
6.00
9.00
12.00
15.00
2003 2004 2005 2006 2007 2008 2009 2010 2011 2012
Peer group of companies comprised of the following: Akzo Nobel N.V., BASF Corporation, H.B. Fuller Company,
Genuine Parts Company, The Home Depot, Inc., Lowe’s Companies, Inc., Masco Corporation, Newell Rubbermaid
Inc., PPG Industries, Inc., RPM International Inc., Stanley Black & Decker Inc., USG Corporation and
The Valspar Corporation.
Average Common Shares Outstanding: (fully diluted, in millions)
COMPARISON OF CUMULATIVE FIVE-YEAR TOTAL RETURN
STOCK REPURCHASE (millions of shares)
$1.60
1.20
0.80
0.40
0.0079 80 81 82 83 84 85 86 87 88 89 90 91 92 93 94 95 96 97 98 99 00 01 02 03 04 05 06 07 08 09 10 11 12
DIVIDENDS PER SHARE
Peer GroupSherwin-Williams Co. S&P 500 Index
$300
$250
$200
$150
$100
$502007 2008 2009 2010 2011 2012
147.0 144.7 141.1 137.3 130.9 118.2 114.5 108.8 105.7 103.3
35161_Text_Wt.indd 16 2/21/13 3:54 PM

■ 17
FINANCIAL TABLE OF CONTENTS
Financial Summary .....................................................................................................................................................................18
Management’s Discussion and Analysis of Financial Condition and Results of Operations .........................19
Reports of Management and the Independent Registered Public Accounting Firm .................................... 40
Consolidated Financial Statements and Notes ..............................................................................................................44
Cautionary Statement Regarding Forward-Looking Information .......................................................................... 77
Shareholder Information .........................................................................................................................................................78
Corporate Officers and Operating Management ..........................................................................................................80
FINANCIAL PERFORMANCE
35161_Financials_Wt.indd 17 2/21/13 4:06 PM
■ 18
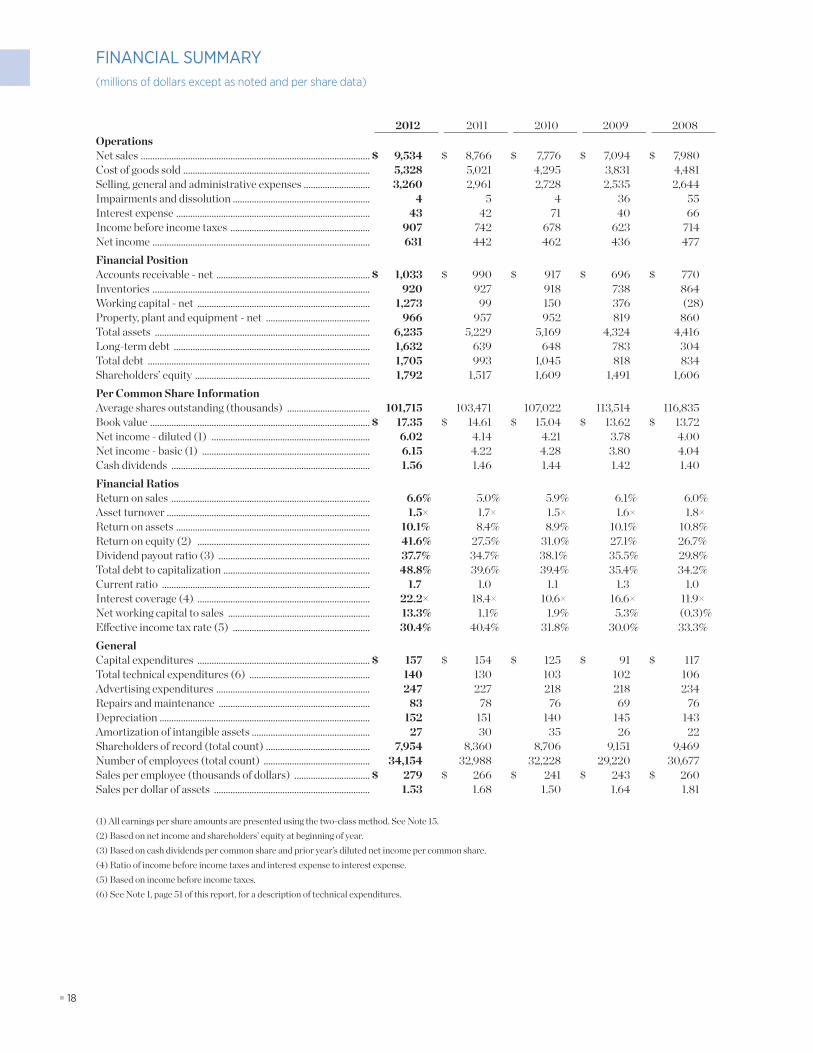
FINANCIAL SUMMARY(millions of dollars except as noted and per share data)
2012 2011 2010 2009 2008OperationsNet sales ................................................................................................. $ 9,534 $ 8,766 $ 7,776 $ 7,094 $ 7,980Cost of goods sold ............................................................................... 5,328 5,021 4,295 3,831 4,481Selling, general and administrative expenses ............................ 3,260 2,961 2,728 2,535 2,644Impairments and dissolution .......................................................... 4 5 4 36 55Interest expense .................................................................................. 43 42 71 40 66Income before income taxes ........................................................... 907 742 678 623 714Net income ............................................................................................ 631 442 462 436 477Financial PositionAccounts receivable - net ................................................................. $ 1,033 $ 990 $ 917 $ 696 $ 770Inventories ............................................................................................ 920 927 918 738 864Working capital - net ......................................................................... 1,273 99 150 376 (28)Property, plant and equipment - net ............................................ 966 957 952 819 860Total assets ........................................................................................... 6,235 5,229 5,169 4,324 4,416Long-term debt ................................................................................... 1,632 639 648 783 304Total debt .............................................................................................. 1,705 993 1,045 818 834Shareholders’ equity .......................................................................... 1,792 1,517 1,609 1,491 1,606Per Common Share InformationAverage shares outstanding (thousands) ................................... 101,715 103,471 107,022 113,514 116,835Book value ............................................................................................. $ 17.35 $ 14.61 $ 15.04 $ 13.62 $ 13.72Net income - diluted (1) ................................................................... 6.02 4.14 4.21 3.78 4.00Net income - basic (1) ....................................................................... 6.15 4.22 4.28 3.80 4.04Cash dividends .................................................................................... 1.56 1.46 1.44 1.42 1.40Financial RatiosReturn on sales .................................................................................... 6.6% 5.0% 5.9% 6.1% 6.0%Asset turnover ...................................................................................... 1.5× 1.7× 1.5× 1.6× 1.8×Return on assets .................................................................................. 10.1% 8.4% 8.9% 10.1% 10.8%Return on equity (2) ......................................................................... 41.6% 27.5% 31.0% 27.1% 26.7%Dividend payout ratio (3) ................................................................ 37.7% 34.7% 38.1% 35.5% 29.8%Total debt to capitalization .............................................................. 48.8% 39.6% 39.4% 35.4% 34.2%Current ratio ........................................................................................ 1.7 1.0 1.1 1.3 1.0Interest coverage (4) ......................................................................... 22.2× 18.4× 10.6× 16.6× 11.9×Net working capital to sales ............................................................ 13.3% 1.1% 1.9% 5.3% (0.3)%Effective income tax rate (5) .......................................................... 30.4% 40.4% 31.8% 30.0% 33.3%GeneralCapital expenditures ......................................................................... $ 157 $ 154 $ 125 $ 91 $ 117Total technical expenditures (6) ................................................... 140 130 103 102 106Advertising expenditures ................................................................. 247 227 218 218 234Repairs and maintenance ................................................................ 83 78 76 69 76Depreciation ......................................................................................... 152 151 140 145 143Amortization of intangible assets .................................................. 27 30 35 26 22Shareholders of record (total count) ............................................ 7,954 8,360 8,706 9,151 9,469Number of employees (total count) ............................................. 34,154 32,988 32,228 29,220 30,677Sales per employee (thousands of dollars) ................................ $ 279 $ 266 $ 241 $ 243 $ 260Sales per dollar of assets .................................................................. 1.53 1.68 1.50 1.64 1.81
(1) All earnings per share amounts are presented using the two-class method. See Note 15.(2) Based on net income and shareholders’ equity at beginning of year.(3) Based on cash dividends per common share and prior year’s diluted net income per common share.(4) Ratio of income before income taxes and interest expense to interest expense.(5) Based on income before income taxes.(6) See Note 1, page 51 of this report, for a description of technical expenditures.
35161_Financials_Wt.indd 18 2/21/13 3:10 PM
■ 19■ 19
MANAGEMENT’S DISCUSSION AND ANALYSIS OF FINANCIAL CONDITION AND RESULTS OF OPERATIONS
SUMMARYThe Sherwin-Williams Company, founded in 1866, and
its consolidated wholly owned subsidiaries (collectively, the “Company”) are engaged in the development, manufacture, distribution and sale of paint, coatings and related products to professional, industrial, commercial and retail customers primarily in North and South America with additional opera-tions in the Caribbean region, Europe and Asia. The Company is structured into four reportable segments – Paint Stores Group, Consumer Group, Global Finishes Group and Latin America Coatings Group (collectively, the “Reportable Segments”) – and an Administrative Segment in the same way it is internally organized for assessing performance and making decisions regarding allocation of resources. See pages 8 through 15 of this report and Note 18, on pages 74 through 76 of this report, for more information concerning the Reportable Segments.
The Company’s financial condition and liquidity remained strong in 2012 and net operating cash improved primarily due to improving domestic architectural paint demand. Net working capital improved $1.17 billion at December 31, 2012 compared to 2011 due primarily to a significant increase in cash and cash equivalents and a decrease in current liabilities. On December 4, 2012, the Company issued $700.0 million of 1.35% Senior Notes due 2017, and $300.0 million of 4.00% Senior Notes due 2042, which was the primary reason for the large increase in cash and cash equivalents. The Company has been able to arrange sufficient short-term borrowing capacity at reasonable rates and the Company has sufficient total available borrowing capacity to fund its current operating needs. Net operating cash increased $152.1 million to $887.9 million in 2012, which included a first quarter payment of $59.1 million relating to a settlement reached in the fourth quarter of 2011 with the Internal Revenue Service (the “IRS Settlement”), from $735.8 million in 2011, which included a fourth quarter IRS Settlement payment of $60.0 million. Strong net operating cash provided the funds necessary to invest in new stores, manufacturing and distribution facilities, acquire businesses, pay down debt, maintain financial stability and return cash to shareholders through dividends and treasury stock purchases.
Results of operations for the Company were strong and improved in many areas in 2012, primarily due to an improving domestic architectural paint market. Consolidated net sales increased 8.8 percent in 2012 to $9.53 billion from $8.77 billion in 2011 due primarily to higher paint sales volume in the Paint Stores Group and selling price increases. Acquisitions increased consolidated net sales 0.9 percent in 2012. Gross profit as a per-cent of consolidated net sales increased to 44.1 percent in 2012 from 42.7 percent in 2011 due primarily to increased paint sales volume and selling price increases partially offset by increases in raw material costs. Selling, general and administrative expenses
(SG&A) increased $298.8 million in 2012 compared to 2011 due primarily to new stores, increased service expenses to support higher sales levels and maintain customer service, a settle-ment with the United States Department of Labor (the “DOL Settlement”) and acquisitions partially offset by foreign currency translation rate fluctuations. See “2012 Subsequent Event - DOL Settlement” on page 33 and Note 9 on page 67. SG&A increased as a percent of consolidated net sales to 34.2 percent in 2012 as compared to 33.8 percent in 2011 due primarily to the DOL Settlement partially offset by higher sales levels and good cost control in all Reportable Segments. Trademark impairment charges of $4.1 million occurred in 2012 due to planned conver-sion of various acquired brands. Impairments of trademarks were $5.5 million in 2011. Interest expense increased $0.3 million in 2012. The effective income tax rate was 30.4 percent for 2012 and 40.4 percent for 2011, which included $75.0 million related to the IRS Settlement. Excluding the impact of the IRS Settlement would result in an effective income tax rate for 2011 of 30.3 percent. Diluted net income per common share increased 45.4 percent to $6.02 per share for 2012, which included charges relating to the DOL Settlement ($.47 per share), from $4.14 per share a year ago, which included charges relating to the IRS Settlement ($.70 per share).
CRITICAL ACCOUNTING POLICIES AND ESTIMATESThe preparation and fair presentation of the consolidated
financial statements, accompanying notes and related financial information included in this report are the responsibility of man-agement. The consolidated financial statements, accompanying notes and related financial information included in this report have been prepared in accordance with U.S. generally accepted accounting principles. The consolidated financial statements contain certain amounts that were based upon management’s best estimates, judgments and assumptions. Management utilized certain outside economic sources of information when developing the bases for their estimates and assumptions. Management used assumptions based on historical results, considering the current economic trends, and other assumptions to form the basis for determining appropriate carrying values of assets and liabilities that were not readily available from other sources. Actual results could differ from those estimates. Also, materially different amounts may result under materially different conditions, materially different economic trends or from using materially different assumptions. However, manage-ment believes that any materially different amounts resulting from materially different conditions or material changes in facts or circumstances are unlikely to significantly impact the current valuation of assets and liabilities that were not readily available from other sources.
35161_Financials_Wt.indd 19 2/21/13 3:10 PM
■ 20■ 20
MANAGEMENT’S DISCUSSION AND ANALYSIS OFFINANCIAL CONDITION AND RESULTS OF OPERATIONS
All of the significant accounting policies that were followed in the preparation of the consolidated financial statements are disclosed in Note 1, on pages 48 through 51 of this report. The following procedures and assumptions utilized by manage-ment directly impacted many of the reported amounts in the consolidated financial statements.
Non-Traded InvestmentsThe Company has invested in the U. S. affordable housing
and historic renovation real estate markets. These investments have been identified as variable interest entities. However, the Company is not the primary beneficiary and did not consolidate the operations of the investments. The carrying amounts of these non-traded investments, which approximate market value, were determined based on cost less related income tax credits determined by the effective yield method. The Company’s risk of loss from these non-traded investments is limited to the amount of its contributed capital. The Company has no ongoing capital commitments, loan requirements or guarantees with the general partners that would require any future cash contributions other than the contractually committed capital contributions that are disclosed in the contractual obligations table on page 29 of this report. See Note 1, on page 48 of this report, for more information on non-traded investments.
Accounts ReceivableAccounts receivable were recorded at the time of credit sales
net of provisions for sales returns and allowances. All provisions for allowances for doubtful collection of accounts are included in Selling, general and administrative expenses and were based on management’s best judgment and assessment, including an analysis of historical bad debts, a review of the aging of Accounts receivable and a review of the current creditworthiness of customers. Management recorded allowances for such accounts which were believed to be uncollectible, including amounts for the resolution of potential credit and other collection issues such as disputed invoices, customer satisfaction claims and pricing discrepancies. However, depending on how such potential issues are resolved, or if the financial condition of any of the Company’s customers were to deteriorate and their ability to make required payments became impaired, increases in these allowances may be required. At December 31, 2012, no individual customer constituted more than 5 percent of Accounts receivable.
InventoriesInventories were stated at the lower of cost or market with
cost determined principally on the last-in, first-out (LIFO) method based on inventory quantities and costs determined dur-ing the fourth quarter. Inventory quantities were adjusted during the fourth quarter as a result of annual physical inventory counts
taken at all locations. If inventories accounted for on the LIFO method are reduced on a year-over-year basis, liquidation of certain quantities carried at costs prevailing in prior years occurs. Management recorded the best estimate of net realizable value for obsolete and discontinued inventories based on historical experience and current trends through reductions to inventory cost by recording a provision included in Cost of goods sold. Where management estimated that the reasonable market value was below cost or determined that future demand was lower than current inventory levels, based on historical experience, current and projected market demand, current and projected volume trends and other relevant current and projected factors associated with the current economic conditions, a reduction in inventory cost to estimated net realizable value was made. See Note 3, on page 52 of this report, for more information regarding the impact of the LIFO inventory valuation.
Purchase Accounting, Goodwill and Intangible AssetsIn accordance with the Business Combinations Topic of the
ASC, the Company used the purchase method of accounting to allocate costs of acquired businesses to the assets acquired and liabilities assumed based on their estimated fair values at the dates of acquisition. The excess costs of acquired busi-nesses over the fair values of the assets acquired and liabilities assumed were recognized as Goodwill. The valuations of the acquired assets and liabilities will impact the determination of future operating results. In addition to using management estimates and negotiated amounts, the Company used a variety of information sources to determine the estimated fair values of acquired assets and liabilities including: third-party appraisals for the estimated value and lives of identifiable intangible assets and property, plant and equipment; third-party actuaries for the estimated obligations of defined benefit pension plans and similar benefit obligations; and legal counsel or other experts to assess the obligations associated with legal, environmental and other contingent liabilities. The business and technical judg-ment of management was used in determining which intangible assets have indefinite lives and in determining the useful lives of finite-lived intangible assets in accordance with the Goodwill and Other Intangibles Topic of the ASC.
As required by the Goodwill and Other Intangibles Topic of the ASC, management performs impairment tests of goodwill and indefinite-lived intangible assets on an annual basis, as well as whenever an event occurs or circumstances change that indicate impairment has more likely than not occurred. The optional qualitative assessment, which allows companies to skip the annual two-step quantitative test if it is not more likely than not that impairment has occurred, is performed when deemed appropriate.
35161_Financials_Wt.indd 20 2/21/13 3:10 PM
■ 21■ 21
MANAGEMENT’S DISCUSSION AND ANALYSIS OF FINANCIAL CONDITION AND RESULTS OF OPERATIONS
In accordance with the Goodwill and Other Intangibles Topic of the ASC, management tests goodwill for impairment at the reporting unit level. A reporting unit is an operating segment per the Segment Reporting Topic of the ASC or one level below the operating segment (component level) as determined by the availability of discrete financial information that is regularly reviewed by operating segment management or an aggregate of component levels of an operating segment having similar economic characteristics. At the time of goodwill impairment testing (if performing a quantitative assessment), management determines fair value through the use of a discounted cash flow valuation model incorporating discount rates commensurate with the risks involved for each reporting unit. If the calculated fair value is less than the current carrying value, impairment of the reporting unit may exist. The use of a discounted cash flow valuation model to determine estimated fair value is common practice in impairment testing. The key assumptions used in the discounted cash flow valuation model for impairment testing include discount rates, growth rates, cash flow projections and terminal value rates. Discount rates are set by using the Weighted Average Cost of Capital (“WACC”) methodology. The WACC methodology considers market and industry data as well as Company-specific risk factors for each reporting unit in determining the appropriate discount rates to be used. The discount rate utilized for each reporting unit is indicative of the return an investor would expect to receive for investing in such a business. Operational management, considering industry and Company-specific historical and projected data, develops growth rates, sales projections and cash flow projections for each reporting unit. Terminal value rate determination follows com-mon methodology of capturing the present value of perpetual cash flow estimates beyond the last projected period assuming a constant WACC and low long-term growth rates. As an indicator that each reporting unit has been valued appropriately through the use of the discounted cash flow valuation model, the aggregate of all reporting units fair value is reconciled to the total market capitalization of the Company.
The Company performed the optional qualitative as-sessment for its 2012 goodwill impairment test for each of its reporting units. The 2011 goodwill impairment test, in which the fair values of each of the reporting units exceeded their respective carrying values by more than ten percent, served as the starting point. Management identified future projected net income, return on average net assets employed and discount rate as the most relevant drivers affecting the fair value calcula-tions. A budget-to-actual analysis was performed in which each reporting unit’s key metrics were compared against budgeted amounts in order to assess the validity of future projected net income used in the 2011 analysis. Management evaluated whether there were any capital investment or working capital
deviations from budget that would significantly affect return on average net assets employed. Management considered how the discount rates used in the fair value calculation would have changed since the 2011 goodwill impairment test, and performed a sensitivity analysis noting that it would require a discount rate significantly higher than what would be expected in order for any reporting unit to have a fair value not more than 10% in excess of its carrying value. Management also analyzed macroeconomic conditions, industry and market considerations, cost factors, overall financial performance of the Company, entity-specific events and reporting unit-specific events. Based on the results of the qualitative assessment, management determined that it was not more likely than not that any of the reporting units were impaired and did not need to perform a quantitative test for any of the reporting units.
In accordance with the Goodwill and Other Intangibles Topic of the ASC, management tests indefinite-lived intangible assets for impairment at the asset level, as determined by appropriate asset valuations at acquisition. Management utilizes the royalty savings method and valuation model to determine the estimated fair value for each indefinite-lived intangible asset or trademark. In this method, management estimates the royalty savings arising from the ownership of the intangible asset. The key assumptions used in estimating the royalty savings for impairment testing include discount rates, royalty rates, growth rates, sales projections and terminal value rates. Discount rates used are similar to the rates developed by the WACC methodol-ogy considering any differences in Company-specific risk factors between reporting units and trademarks. Royalty rates are established by management and valuation experts and periodi-cally substantiated by valuation experts. Operational manage-ment, considering industry and Company-specific historical and projected data, develops growth rates and sales projections for each significant trademark. Terminal value rate determination follows common methodology of capturing the present value of perpetual sales estimates beyond the last projected period assuming a constant WACC and low long-term growth rates. The royalty savings valuation methodology and calculations used in 2012 impairment testing are consistent with prior years.
The discounted cash flow and royalty savings valuation meth-odologies require management to make certain assumptions based upon information available at the time the valuations are performed. Actual results could differ from these assumptions. Management believes the assumptions used are reflective of what a market participant would have used in calculating fair value considering the current economic conditions. See Notes 2 and 4, on pages 51 through 53 of this report, for a discus-sion of businesses acquired, the estimated fair values of goodwill and identifiable intangible assets recorded at acquisition date and reductions in carrying value of goodwill and indefinite-lived
35161_Financials_Wt.indd 21 2/21/13 3:10 PM
■ 22■ 22
MANAGEMENT’S DISCUSSION AND ANALYSIS OFFINANCIAL CONDITION AND RESULTS OF OPERATIONS
intangible assets recorded as a result of impairment tests in accordance with the Goodwill and Other Intangibles Topic of the ASC.
Property, Plant and Equipment and Impairment of Long-Lived Assets
Property, plant and equipment was stated on the basis of cost and depreciated principally on a straight-line basis using industry standards and historical experience to estimate useful lives. In accordance with the Property, Plant and Equipment Topic of the ASC, if events or changes in circumstances indicated that the carrying value of long-lived assets may not be recoverable or the useful life had changed, impairment tests were performed or the useful life was adjusted. Undiscounted future cash flows were used to calculate the recoverable value of long-lived assets to determine if such assets were impaired. Where impairment was identified, management determined fair values for assets using a discounted cash flow valuation model, incorporating discount rates commensurate with the risks involved for each group of assets. Growth models were developed using both industry and company historical results and forecasts. If the usefulness of an asset was determined to be impaired, management estimated a new useful life based on the period of time for projected uses of the asset. Such models and changes in useful life required management to make certain assumptions based upon informa-tion available at the time the valuation or determination was performed. Actual results could differ from these assumptions. Management believes the assumptions used are reflective of what a market participant would have used in calculating fair value or useful life considering the current economic conditions. All tested long-lived assets or groups of long-lived assets had undiscounted cash flows that were substantially in excess of their carrying value, except as noted in Note 4. See Notes 4 and 5, on pages 52 through 56 of this report, for a discussion of the reductions in carrying value or useful life of long-lived assets in accordance with the Property, Plant and Equipment Topic of the ASC.
Exit or Disposal ActivitiesManagement is continually re-evaluating the Company’s
operating facilities against its long-term strategic goals. Liabilities associated with exit or disposal activities are recog-nized as incurred in accordance with the Exit or Disposal Cost Obligations Topic of the ASC and property, plant and equipment is tested for impairment in accordance with the Property, Plant and Equipment Topic of the ASC. Provisions for qualified exit costs are made at the time a facility is no longer operational, in-clude amounts estimated by management and primarily include post-closure rent expenses or costs to terminate the contract before the end of its term and costs of employee terminations.
Adjustments may be made to liabilities accrued for qualified exit costs if information becomes available upon which more accurate amounts can be reasonably estimated. If impairment of property, plant and equipment exists, the carrying value is reduced to fair value estimated by management. Additional impairment may be recorded for subsequent revisions in estimated fair value. See Note 5, on pages 54 through 56 of this report, for informa-tion concerning impairment of property, plant and equipment and accrued qualified exit costs.
Other LiabilitiesThe Company is self-insured for certain liabilities, primarily
worker’s compensation claims, employee medical benefits, and automobile, property, general and product liability claims. Estimated amounts were accrued for certain worker’s compensa-tion, employee medical and disability benefits, automobile and property claims filed but unsettled and estimated claims incurred but not reported based upon management’s estimated aggregate liability for claims incurred using historical experience, actuarial assumptions followed in the insurance industry and actuarially-developed models for estimating certain liabilities. Certain estimated general and product liability claims filed but unsettled were accrued based on management’s best estimate of ultimate settlement or actuarial calculations of potential liability using industry experience and actuarial assumptions developed for similar types of claims.
Defined Benefit Pension and Other Postretirement Benefit Plans
To determine the Company’s ultimate obligation under its defined benefit pension plans and postretirement benefit plans other than pensions, management must estimate the future cost of benefits and attribute that cost to the time period during which each covered employee works. To determine the obligations of such benefit plans, management uses actuaries to calculate such amounts using key assumptions such as discount rates, inflation, long-term investment returns, mortality, employee turnover, rate of compensation increases and medical and prescription drug costs. Management reviews all of these assumptions on an ongoing basis to ensure that the most current information available is being considered. An increase or decrease in the assumptions or economic events outside management’s control could have a direct impact on the Company’s results of opera-tions or financial condition.
In accordance with the Retirement Benefits Topic of the ASC, the Company recognizes each plan’s funded status as an asset for overfunded plans and as a liability for unfunded or underfunded plans. Actuarial gains and losses and prior service costs are recognized and recorded in Cumulative other compre-hensive loss, a component of Shareholders’ equity. The amounts
35161_Financials_Wt.indd 22 2/21/13 3:10 PM
■ 23■ 23
MANAGEMENT’S DISCUSSION AND ANALYSIS OF FINANCIAL CONDITION AND RESULTS OF OPERATIONS
recorded in Cumulative other comprehensive loss will continue to be modified as actuarial assumptions and service costs change, and all such amounts will be amortized to expense over a period of years through the net pension and net periodic benefit costs.
Effective July 1, 2009, the domestic salaried defined benefit pension plan was revised. Prior to July 1, 2009, the contribution was based on six percent of compensation for certain covered employees. Under the revised plan, such participants are credited with certain contribution credits that range from two percent to seven percent of compensation based on an age and service formula.
A reduction in the over-funded status of the Company’s defined benefit pension plans at December 31, 2008, due to the decrease in market value of equity securities held by the plans, increased the future amortization of actuarial losses recognized in Cumulative comprehensive loss. This amortization increased net pension costs in 2010, 2011, and 2012. An increase in market value of equity securities held by the plans during 2010 and 2011 will decrease the future amortization of actuarial losses recognized in Cumulative comprehensive loss, but not enough to offset the full extent of losses experienced in 2008. The excess in market value of equity securities held by the plans versus the expected returns in 2012 will decrease the future amortization of actuarial losses. The amortization of actuarial losses on plan assets, partially offset by a decrease in discount rates on projected benefit obligations, will decrease net pension costs in 2013. See Note 6, on pages 56 through 62 of this report, for information concerning the Company’s defined benefit pension plans and postretirement benefit plans other than pensions.
DebtThe fair values of the Company’s publicly traded long-term
debt were based on quoted market prices. The fair values of the Company’s non-traded long-term debt were estimated using discounted cash flow analyses, based on the Company’s current incremental borrowing rates for similar types of borrowing arrangements. See Note 1, on page 48 of this report, for the carrying amounts and fair values of the Company’s long-term debt, and Note 7, on pages 62 and 63 of this report, for a description of the Company’s long-term debt arrangements.
Environmental MattersThe Company is involved with environmental investigation
and remediation activities at some of its currently and formerly owned sites and at a number of third-party sites. The Company accrues for environmental-related activities for which commit-ments or clean-up plans have been developed and for which costs can be reasonably estimated based on industry standards and professional judgment. All accrued amounts were recorded on an undiscounted basis. Environmental-related expenses included
direct costs of investigation and remediation and indirect costs such as compensation and benefits for employees directly involved in the investigation and remediation activities and fees paid to outside engineering, actuarial, consulting and law firms. Due to uncertainties surrounding environmental investigations and remediation activities, the Company’s ultimate liability may result in costs that are significantly higher than currently accrued. See pages 27 through 29 and Note 8, on pages 63 and 64 of this report, for information concerning the accrual for extended environmental-related activities and a discussion concerning unaccrued future loss contingencies.
Litigation and Other Contingent LiabilitiesIn the course of its business, the Company is subject to a
variety of claims and lawsuits, including litigation relating to product liability and warranty, personal injury, environmental, intellectual property, commercial and contractual claims. Management believes that the Company has properly accrued for all known liabilities that existed and those where a loss was deemed probable for which a fair value was available or an amount could be reasonably estimated in accordance with all present U.S. generally accepted accounting principles. However, because litigation is inherently subject to many uncertainties and the ultimate result of any present or future litigation is unpre-dictable, the Company’s ultimate liability may result in costs that are significantly higher than currently accrued. In the event that the Company’s loss contingency is ultimately determined to be significantly higher than currently accrued, the recording of the liability may result in a material impact on net income for the annual or interim period during which such liability is accrued. Additionally, due to the uncertainties involved, any potential liability determined to be attributable to the Company arising out of such litigation may have a material adverse effect on the Company’s results of operations, liquidity or financial condition. See pages 31 through 34 of this report and Note 9, on pages 64 through 67 of this report, for information concerning litigation.
In addition, the Company may be subject to potential liabili-ties for which a loss was not deemed probable at this time and an amount could not be reasonably estimated due to uncertainties involved. See pages 30 and 31 of this report for more information concerning contingent liabilities.
Income TaxesThe Company estimated income taxes in each jurisdiction
that it operated. This involved estimating taxable earnings, specific taxable and deductible items, the likelihood of generat-ing sufficient future taxable income to utilize deferred tax assets and possible exposures related to future tax audits. To the extent these estimates change, adjustments to deferred and
35161_Financials_Wt.indd 23 2/21/13 3:10 PM
■ 24■ 24
MANAGEMENT’S DISCUSSION AND ANALYSIS OFFINANCIAL CONDITION AND RESULTS OF OPERATIONS
accrued income taxes will be made in the period in which the changes occur.
In October 2011, the Company reached a settlement of the IRS’ audit of the Company’s employee stock ownership plan (ESOP). The Company has fully resolved all IRS issues for the 2003 through 2009 tax years relating to the matters challenging the ESOP related federal income tax deductions claimed by the Company and proposing substantial excise taxes and penalties. The IRS Settlement (including interest), which resolved all ESOP related tax issues, resulted in an after-tax charge related to federal and state income taxes totaling approximately $75.0 million, or $.70 per diluted common share, and an additional reduction in Shareholders’ equity of approximately $51.2 million in the Company’s fourth quarter of 2011. The Company paid $60.0 million of the IRS Settlement to the IRS during 2011 and made a final payment of approximately $59.1 million in the first quarter of 2012. The Company received a refund of $8.9 million for other issues related to the 2006 and 2007 audit period. The IRS commenced an examination of the Company’s U.S. income tax returns for the 2008 and 2009 tax years in the third quarter of 2011. Fieldwork is expected to be completed during 2013. At this time, the Company has determined that an insignificant refund is due for issues under review during this audit period.
See Note 14, on pages 71 and 72 of this report, for in-formation concerning the Company’s unrecognized tax benefits, interest and penalties and current and deferred tax expense.
Stock-Based CompensationThe cost of the Company’s stock-based compensation is
recorded in accordance with the Stock Compensation Topic of the ASC. The Company follows the “modified prospective” method as described in the Topic whereby compensation cost is recognized for all share-based payments granted after December 31, 2005.
The Company estimates the fair value of option rights using a Black-Scholes-Merton option pricing model which requires management to make estimates for certain assumptions. Management and a consultant continuously review the following significant assumptions: risk-free interest rate, expected life of options, expected volatility of stock and expected dividend yield of stock. An increase or decrease in the assumptions or economic events outside management’s control could have a direct impact on the Company’s results of operations. See Note 12, on pages 69 and 70 of this report, for more information on stock-based compensation.
Revenue RecognitionThe Company’s revenue was primarily generated from
the sale of products. All sales of products were recognized when shipped and title had passed to unaffiliated customers.
Collectibility of amounts recorded as revenue is reasonably assured at time of sale. Discounts were recorded as a reduction to sales in the same period as the sale resulting in an appropriate net sales amount for the period. Standard sales terms are final and returns or exchanges are not permitted unless expressly stated. Estimated provisions for returns or exchanges, recorded as a reduction resulting in net sales, were established in cases where the right of return existed. The Company offered a variety of programs, primarily to its retail customers, designed to promote sales of its products. Such programs required periodic payments and allowances based on estimated results of specific programs and were recorded as a reduction resulting in net sales. The Company accrued the estimated total payments and allowances associated with each transaction at the time of sale. Additionally, the Company offered programs directly to consum-ers to promote the sale of its products. Promotions that reduced the ultimate consumer sale prices were recorded as a reduction resulting in net sales at the time the promotional offer was made, generally using estimated redemption and participation levels. The Company continually assesses the adequacy of accruals for customer and consumer promotional program costs earned but not yet paid. To the extent total program payments differ from estimates, adjustments may be necessary. Historically, these total program payments and adjustments have not been material.
FINANCIAL CONDITION, LIQUIDITY AND CASH FLOWOverview
The Company’s financial condition and liquidity remained strong in 2012 and net operating cash improved primarily due to improving domestic architectural paint demand. Net working capital improved $1.17 billion at December 31, 2012 compared to 2011 due primarily to a significant increase in cash and cash equivalents of $829.9 million and a decrease in current liabilities. On December 4, 2012, the Company issued $700.0 million of 1.35% Senior Notes due 2017 and $300.0 million of 4.00% Senior Notes due 2042, which was the primary reason for the large increase in cash and cash equivalents. Accounts receiv-able were up $42.6 million while Inventories were down $6.5 million. Deferred tax net assets were down $22.5 million while the remaining current assets increased $44.1 million. Accounts payable decreased $42.2 million, Accrued taxes decreased $68.5 million, and Short-term borrowings decreased $277.3 million while all other current liabilities increased $101.7 million. The Company’s current ratio improved to 1.68 at December 31, 2012 from 1.05 at December 31, 2011. Total debt at December 31, 2012 increased $711.5 million to $1.70 billion from $993.4 million at December 31, 2011 due primarily to the debt issuance on December 4, 2012. Total debt increased as a percentage of total capitalization to 48.8 percent from 39.6 percent at the end
35161_Financials_Wt.indd 24 2/21/13 3:10 PM
■ 25■ 25
MANAGEMENT’S DISCUSSION AND ANALYSIS OF FINANCIAL CONDITION AND RESULTS OF OPERATIONS
of 2011. At December 31, 2012, the Company had remaining borrowing ability of $2.20 billion. Net operating cash increased $152.1 million to $887.9 million in 2012 from $735.8 million in 2011 due primarily to an increase in net income of $189.2 million partially offset by cash used to decrease Accrued taxes by $70.3 million. Net operating cash increased as a percent to sales to 9.3 percent in 2012 compared to 8.4 percent in 2011. Strong Net op-erating cash provided the funds necessary to invest in new stores, manufacturing and distribution facilities, acquire businesses, and return cash to shareholders through dividends and treasury stock purchases. In 2012, the Company used Net operating cash to invest $157.1 million in capital additions and improvements, purchase $557.8 million in treasury stock, pay $160.9 million in cash dividends to its shareholders of common stock, and invest $99.2 million in acquisitions.
Net Working CapitalTotal current assets less Total current liabilities (net
working capital) improved $1.17 billion to a surplus of $1.27 billion at December 31, 2012 from a surplus of $98.9 million at December 31, 2011. The improvement in net working capital related primarily to a significant increase in cash and cash equivalents of $829.9 million and a decrease in current liabilities. Accounts receivable were up $42.6 million while Inventories were down $6.5 million. Deferred tax net assets were down $22.5 million while the remaining current assets increased $44.1 mil-lion. Accounts payable decreased $42.2 million, Accrued taxes decreased $68.5 million, and Short-term borrowings decreased $277.3 million while all other current liabilities increased $101.7 million. The Company has sufficient total available borrowing ca-pacity to fund its current operating needs. The increase in Total current assets and the decrease in Total current liabilities caused the Company’s current ratio to improve to 1.68 at December 31, 2012 from 1.05 at December 31, 2011. Accounts receivable as a percent of Net sales decreased to 10.8 percent in 2012 from 11.3 percent in 2011 as sales increased more than accounts receiv-ables due primarily to a full year of sales for businesses acquired during 2011 versus only a partial year with comparable accounts receivable balances in each period. Accounts receivable days outstanding decreased to 55 days in 2012 from 56 days 2011. In 2012, provisions for allowance for doubtful collection of accounts decreased $4.1 million, or 7.9 percent. Inventories decreased as a percent of Net sales to 9.7 percent in 2012 from 10.6 percent in 2011 due primarily to a full year of sales for businesses acquired during 2011 versus only a partial year in 2011 with comparable inventory levels in each period partially offset by rising raw material costs. Inventory days outstanding decreased to 90 days in 2012 from 96 days in 2011. Accounts payable decreased in 2012 to $923.0 million compared to $965.1 million last year due primarily to timing of payments.
Goodwill and Intangible AssetsGoodwill, which represents the excess of cost over the fair
value of net assets acquired in purchase business combinations, increased $48.0 million in 2012 due primarily to $42.1 million additional goodwill resulting from acquisitions.
Intangible assets increased $41.7 million in 2012. Acquired finite-lived and indefinite-lived intangible assets of $66.5 million and $3.8 million of capitalized software costs more than offset amortization of finite-lived intangible assets of $27.0 million and impairments of indefinite-lived intangible assets of $4.1 million. Acquired finite-lived intangible assets included assets such as covenants not to compete, customer lists and product formulations. Costs related to designing, developing, obtaining and implementing internal use software are capitalized and am-ortized in accordance with the Goodwill and Other Intangibles Topic of the ASC. See Notes 2 and 4, on pages 51 through 53 of this report, for a description of acquired goodwill, identifiable intangible assets and asset impairments recorded in accordance with the Goodwill and Other Intangibles Topic of the ASC and summaries of the remaining carrying values of goodwill and intangible assets.
Deferred Pension and Other AssetsDeferred pension assets of $249.9 million at December 31,
2012 represent the excess of the fair value of assets over the actuarially determined projected benefit obligations, primarily of the domestic salaried defined benefit pension plan. The increase in Deferred pension assets during 2012 of $21.6 million, from $228.4 million last year, was due primarily to an increase in the fair value of equity securities held by the salaried defined benefit pension plan partially offset by increased projected benefit obligations resulting from changes in actuarial assumptions. In accordance with the accounting prescribed by the Retirement Benefits Topic of the ASC, the increase in the value of the Deferred pension assets is offset in Cumulative other compre-hensive loss and is amortized as a component of Net pension costs over a defined period of pension service. See Note 6, on pages 56 through 62 of this report, for more information concerning the excess fair value of assets over projected benefit obligations of the salaried defined benefit pension plan and the amortization of actuarial gains or losses relating to changes in the excess assets and other actuarial assumptions.
Other assets decreased $2.8 million to $366.1 million at December 31, 2012 due primarily to amortization of investments related to the affordable housing and historic renovation real estate properties.
Property, Plant and EquipmentNet property, plant and equipment increased $9.4 million
to $965.9 million at December 31, 2012 due primarily to capital
35161_Financials_Wt.indd 25 2/21/13 3:10 PM
■ 26■ 26
MANAGEMENT’S DISCUSSION AND ANALYSIS OFFINANCIAL CONDITION AND RESULTS OF OPERATIONS
expenditures of $157.1 million, acquired assets of $11.4 million and currency translation adjustments of $5.2 million partially offset by depreciation expense of $152.2 million and sale or disposition of assets with remaining net book value of $12.2 million. Capital expenditures during 2012 in the Paint Stores Group were primarily attributable to the opening of new paint stores and improvements in existing stores. In the Consumer Group, capital expenditures during 2012 were primarily related to efficiency improvements and maintenance items in existing production and distribution facilities. Capital expenditures in the Global Finishes Group were primarily attributable to improve-ments in existing manufacturing and distribution facilities. Capital expenditures in the Latin America Coatings Group were primarily attributable to the opening of new specialty stores and improvements in existing manufacturing and distribution facili-ties. The Administrative segment incurred capital expenditures primarily for headquarters building and information systems hardware. In 2013, the Company expects to spend slightly more than 2012 for capital expenditures. The predominant share of the capital expenditures in 2013 is expected to be for various productivity improvement and maintenance projects at existing manufacturing and distribution facilities, new store openings and new or upgraded information systems hardware. The Company does not anticipate the need for any specific long-term external financing to support these capital expenditures.
DebtThere were no borrowings outstanding under the domestic
commercial paper program at December 31, 2012. Borrowings outstanding under this program at December 31, 2011 and 2010 were $264.9 million and $173.5 million, respectively, with weighted-average interest rates of 0.2 percent for both years. Borrowings outstanding under various foreign programs at December 31, 2012 were $69.0 million with a weighted-average interest rate of 2.8 percent. At December 31, 2011 and December 31, 2010, foreign borrowings were $81.4 million and $215.1 million with weighted-average interest rates of 4.9 percent and 2.9 percent, respectively. Long-term debt, including the current portion, increased a net $988.8 million during 2012 due primarily to the Senior Notes debt issuance totaling $1.00 billion on December 4, 2012, partially offset by regularly scheduled principal payments made on short-term debt. The Senior Notes are covered under a shelf registration filed with the Securities and Exchange Commission (SEC) on December 16, 2009 . The proceeds from the issuance of the Senior Notes will be used for general corporate purposes, including repayment of short-term borrowings and financing acquisitions.
On July 19, 2010, Sherwin-Williams Luxembourg S.à r.l., a wholly-owned subsidiary of the Company, entered into a €200.0 million (Euro) credit facility. On December 28, 2010, the
Company reduced the aggregate amount of this credit facility to €150.0 million (Euro). During 2011, the aggregate amount of this credit facility was further reduced to €97.0 million (Euro). On September 19, 2012, this credit facility was replaced by a new €95.0 million (Euro) five-year revolving credit facility. On July 19, 2010, Sherwin-Williams Canada Inc., a wholly-owned subsidiary of the Company, entered into a CAD 75.0 million credit facility. On June 29, 2012, this credit facility was replaced by a new CAD 75.0 million five-year credit facility. These credit facilities are being used for general corporate purposes, including refinancing indebtedness and for acquisitions.
On January 30, 2012, the Company entered into a five-year credit agreement, subsequently amended on multiple dates, which gives the Company the right to borrow and to obtain the issuance, renewal, extension and increase of a letter of credit of up to an aggregate availability of $500.0 million. On April 23, 2012, the Company entered into a five-year credit agreement, subsequently amended on multiple dates, which gives the Company the right to borrow and to obtain the issuance, renewal, extension and increase of a letter of credit up to an aggregate availability of $250.0 million. On November 14, 2012, the Company entered into a three-year credit agreement, subse-quently amended on multiple dates, which gives the Company the right to borrow and to obtain the issuance, renewal, extension and increase of a letter of credit up to an aggregate availability of $250.0 million. The three credit agreements entered into in 2012 replace prior credit facilities that matured in 2012 and 2011. At December 31, 2012, 2011 and 2010, there were no borrowings outstanding under any of these credit agreements.
The Company uses a revolving credit agreement primarily to satisfy its commercial paper program’s dollar for dollar liquidity requirement. On January 8, 2010, the Company terminated the existing $845.0 million revolving credit agreement and entered into a new $500.0 million revolving credit agreement. On July 8, 2011, the Company entered into a new five-year $1.05 billion revolving credit agreement, which replaced the existing three-year $500.0 million credit agreement. The new credit agreement allows the Company to extend the maturity of the facility with two one-year extension options and to increase the aggregate amount of the facility to $1.30 billion, both of which are subject to the discretion of each lender.
See Note 7, on pages 62 and 63 of this report, for a detailed description of the Company’s debt outstanding and other available financing programs.
Defined Benefit Pension and Other Postretirement Benefit Plans
In accordance with the accounting prescribed by the Retirement Benefits Topic of the ASC, the Company’s total liabil-ity for unfunded or underfunded defined benefit pension plans
35161_Financials_Wt.indd 26 2/21/13 3:10 PM
■ 27■ 27
MANAGEMENT’S DISCUSSION AND ANALYSIS OF FINANCIAL CONDITION AND RESULTS OF OPERATIONS
increased $7.4 million to $40.0 million. Postretirement benefits other than pensions increased $21.3 million to $338.1 million at December 31, 2012. The increase in the liability was due to the increase in the actuarially determined postretirement benefit obligation due primarily to changes in the actuarial assumptions and unfavorable claims experience and other demographics.
Effective July 1, 2009, the domestic salaried defined benefit pension plan was revised. Prior to July 1, 2009, the contribution was based on six percent of compensation for covered em-ployees. Under the revised plan, such participants are credited with certain contribution credits that range from two percent to seven percent of compensation based on an age and service formula. Amounts previously recorded in Cumulative other comprehensive loss in accordance with the provisions of the Retirement Benefits Topic of the ASC were modified in 2009 resulting in a decrease in comprehensive loss due primarily to the change in the domestic salaried defined benefit pension plan and an increase in the excess plan assets over the actuarially calculated projected benefit obligation in the domestic defined benefit pension plans. Partially offsetting this decreased loss were modifications to actuarial assumptions used to calculate projected benefit obligations.
Effective October 1, 2011, participation in The Sherwin-Williams Company Salaried Employees’ Pension Investment Plan, a defined benefit plan, was frozen for new hires. All newly hired U.S. non-collectively bargained employees will be eligible to participate in The Sherwin-Williams Company Salaried Employees’ Revised Pension Investment Plan.
The assumed discount rate used to determine the actuarial present value of projected defined benefit pension and other postretirement benefit obligations for domestic plans was decreased from 4.40 percent to 3.73 percent at December 31, 2012 due to decreased rates of high-quality, long-term invest-ments and was slightly higher for foreign defined benefit pension plans. The rate of compensation increases used to determine the projected benefit obligations remained at 4.0 percent for domes-tic pension plans and was slightly higher on most foreign plans. In deciding on the rate of compensation increases, management considered historical Company increases as well as expectations for future increases. The expected long-term rate of return on assets remained at 7.5 percent for 2012 for domestic pension plans and was slightly lower for most foreign plans. In establish-ing the expected long-term rate of return on plan assets for 2012, management considered the historical rates of return, the nature of investments and an expectation for future investment strate-gies. The assumed health care cost trend rates used to determine the net periodic benefit cost of postretirement benefits other than pensions for 2012 were 8.0 percent for medical and prescription drug cost increases, both decreasing gradually to 5.0 percent in 2019. The assumed health care cost trend rates used
to determine the benefit obligation at December 31, 2012 were 8.0 percent for medical and prescription drug cost increases. In developing the assumed health care cost trend rates, manage-ment considered industry data, historical Company experience and expectations for future health care costs.
For 2013 Net pension cost and Net periodic benefit cost rec-ognition for domestic plans, the Company will use a discount rate of 3.73 percent, an expected long-term rate of return on assets of 6.0 percent, a rate of compensation increase of 4.0 percent and cost trend rates of 8.0 percent for health care and prescription drug cost increases. Slightly higher discount rates and rates of compensation increases and lower expected long-term rates of return on plan assets will be used for most foreign plans. Use of these assumptions, a change in the domestic salaried defined benefit pension plan, and amortization of actuarial gains will result in a domestic Net pension cost in 2013 that is expected to be approximately $2.4 million lower than in 2012 and a Net periodic benefit cost for postretirement benefits other than pensions that is expected to increase slightly in 2013 compared to 2012. See Note 6, on pages 56 through 62 of this report, for more information on the Company’s obligations and funded status of its defined benefit pension plans and postretirement benefits other than pensions.
Other Long-Term LiabilitiesOther long-term liabilities increased $1.2 million during
2012 due primarily to an increase in accruals for extended environmental-related liabilities of $8.0 million, an increase in deferred compensation liabilities of $5.2 million, an increase in long-term pension liabilities of $1.6 million, and an increase in long-term commitments related to the affordable housing and historic renovation real estate properties of $2.5 million partially offset by a decrease in non-current deferred tax liabilities of $14.9 million. See below and Note 8, on pages 63 and 64 of this report, for further information on environmental-related long-term liabilities.
Environmental-Related LiabilitiesThe operations of the Company, like those of other compa-
nies in the same industry, are subject to various federal, state and local environmental laws and regulations. These laws and regula-tions not only govern current operations and products, but also impose potential liability on the Company for past operations. Management expects environmental laws and regulations to impose increasingly stringent requirements upon the Company and the industry in the future. Management believes that the Company conducts its operations in compliance with applicable environmental laws and regulations and has implemented vari-ous programs designed to protect the environment and promote continued compliance.
35161_Financials_Wt.indd 27 2/21/13 3:10 PM
■ 28■ 28
MANAGEMENT’S DISCUSSION AND ANALYSIS OFFINANCIAL CONDITION AND RESULTS OF OPERATIONS
Depreciation of capital expenditures and other expenses related to ongoing environmental compliance measures were in-cluded in the normal operating expenses of conducting business. The Company’s capital expenditures, depreciation and other expenses related to ongoing environmental compliance measures were not material to the Company’s financial condition, liquidity, cash flow or results of operations during 2012. Management does not expect that such capital expenditures, depreciation and other expenses will be material to the Company’s financial condition, liquidity, cash flow or results of operations in 2013.
The Company is involved with environmental investigation and remediation activities at some of its currently and formerly owned sites (including sites which were previously owned and/or operated by businesses acquired by the Company). In addition, the Company, together with other parties, has been designated a potentially responsible party under federal and state environmental protection laws for the investigation and remediation of environmental contamination and hazardous waste at a number of third-party sites, primarily Superfund sites. In general, these laws provide that potentially responsible parties may be held jointly and severally liable for investigation and remediation costs regardless of fault. The Company may be similarly designated with respect to additional third-party sites in the future.
The Company accrues for estimated costs of investigation and remediation activities at its currently or formerly owned sites and third-party sites for which commitments or clean-up plans have been developed and when such costs can be reason-ably estimated based on industry standards and professional judgment. These estimated costs are determined based on currently available facts regarding each site. The Company accrues a specific estimated amount when such an amount and a time frame in which the costs will be incurred can be reasonably determined. If the best estimate of costs can only be identified as a range and no specific amount within that range can be determined more likely than any other amount within the range, the minimum of the range is accrued by the Company in accordance with applicable accounting rules and interpretations. The Company continuously assesses its potential liability for investigation and remediation activities and adjusts its envi-ronmental-related accruals as information becomes available upon which more accurate costs can be reasonably estimated. At December 31, 2012, 2011 and 2010, the Company had total cur-rent and long-term accruals for environmental-related activities of $114.3 million, $132.1 million and $149.6 million, respectively.
Due to the uncertainties of the scope and magnitude of contamination and the degree of investigation and remediation activities that may be necessary at certain currently or formerly owned sites and third-party sites, it is reasonably likely that fur-ther extensive investigations may be required and that extensive
remedial actions may be necessary not only on such sites but on adjacent properties. Depending on the extent of the additional investigations and remedial actions necessary, the Company’s ultimate liability may result in costs that are significantly higher than currently accrued. If the Company’s future loss contingency is ultimately determined to be at the maximum of the range of possible outcomes for every site for which costs can be reasonably estimated, the Company’s aggregate accruals for environmental-related activities would be $88.7 million higher than the accruals at December 31, 2012.
Two of the Company’s formerly owned sites, described be-low, account for the majority of the accruals for environmental-related activities and the unaccrued maximum of the estimated range of possible outcomes at December 31, 2012, 2011 and 2010. At December 31, 2012, $59.1 million, or 51.7 percent, of the total accrual for environmental-related activities related directly to these two sites. Of the aggregate unaccrued exposure at December 31, 2012, $57.0 million, or 64.2 percent, related to the two manufacturing sites. While environmental investigations and remedial actions are in different stages at these sites, additional investigations, remedial actions and/or monitoring will likely be required at each site.
Both of the sites are formerly owned manufacturing facilities in New Jersey that are in various stages of the environmental-related process. At the first site, extensive soil remediation was conducted on-site and completed in 2010 under an agency approved work plan. A small portion of soil remediation remains to be conducted on-site as well as some additional determina-tion of possible off-site soil impacts. Investigation of the area groundwater continues to determine the degree and extent of contamination, both on-site and off-site. Although contamina-tion determined to be associated with historical operations of the Company exists at the second site and adjacent areas, the extent and magnitude of the contamination has not yet been fully quan-tified, a final remedial action plan has not yet been formulated or no clean up goals have been approved by the lead governmental agency. It is reasonably likely that further extensive investiga-tions may be required or that extensive remedial actions may be necessary at this formerly owned site, in adjacent areas or along adjacent waterways. At both sites, depending on the extent of the additional remedial actions necessary, the ultimate liability for these sites may exceed the amounts currently accrued and the maximum of the ranges of reasonably possible outcomes currently estimated by management.
Management cannot presently estimate the ultimate potential loss contingencies related to these two sites or other less significant sites until such time as a substantial portion of the investigative activities at each site is completed and remedial action plans are developed.
35161_Financials_Wt.indd 28 2/21/13 3:10 PM
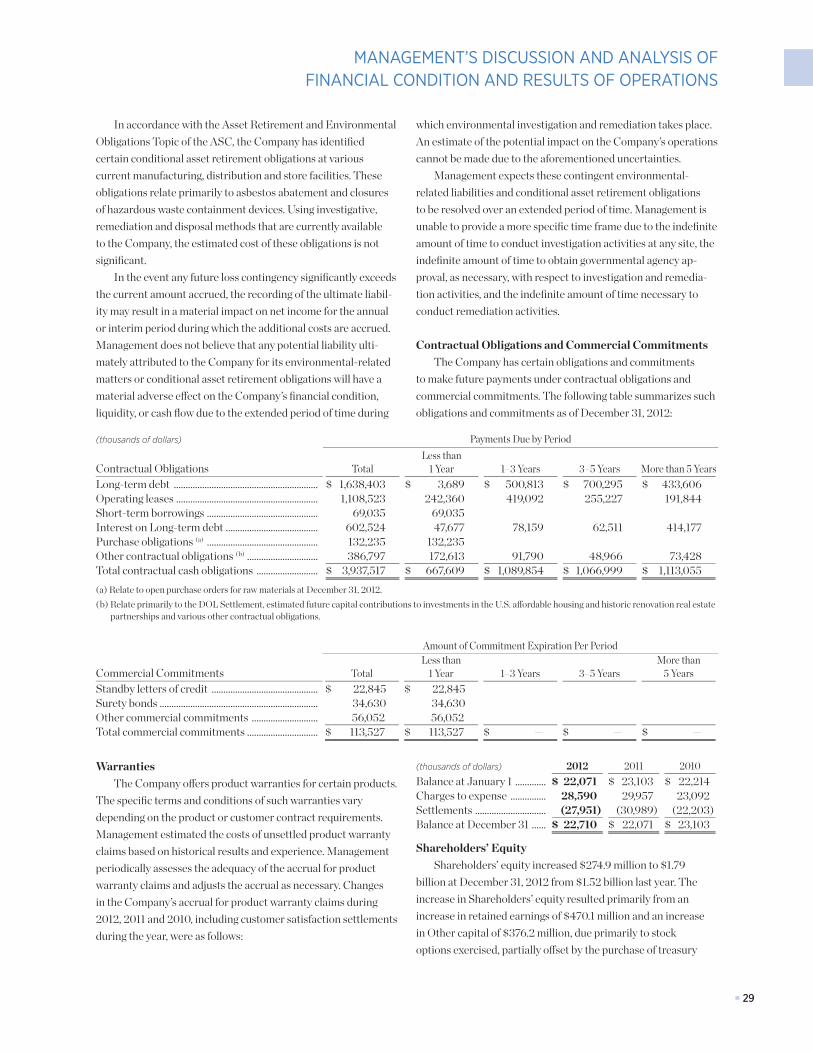
■ 29■ 29
MANAGEMENT’S DISCUSSION AND ANALYSIS OF FINANCIAL CONDITION AND RESULTS OF OPERATIONS
In accordance with the Asset Retirement and Environmental Obligations Topic of the ASC, the Company has identified certain conditional asset retirement obligations at various current manufacturing, distribution and store facilities. These obligations relate primarily to asbestos abatement and closures of hazardous waste containment devices. Using investigative, remediation and disposal methods that are currently available to the Company, the estimated cost of these obligations is not significant.
In the event any future loss contingency significantly exceeds the current amount accrued, the recording of the ultimate liabil-ity may result in a material impact on net income for the annual or interim period during which the additional costs are accrued. Management does not believe that any potential liability ulti-mately attributed to the Company for its environmental-related matters or conditional asset retirement obligations will have a material adverse effect on the Company’s financial condition, liquidity, or cash flow due to the extended period of time during
which environmental investigation and remediation takes place. An estimate of the potential impact on the Company’s operations cannot be made due to the aforementioned uncertainties.
Management expects these contingent environmental-related liabilities and conditional asset retirement obligations to be resolved over an extended period of time. Management is unable to provide a more specific time frame due to the indefinite amount of time to conduct investigation activities at any site, the indefinite amount of time to obtain governmental agency ap-proval, as necessary, with respect to investigation and remedia-tion activities, and the indefinite amount of time necessary to conduct remediation activities.
Contractual Obligations and Commercial CommitmentsThe Company has certain obligations and commitments
to make future payments under contractual obligations and commercial commitments. The following table summarizes such obligations and commitments as of December 31, 2012:
(thousands of dollars) Payments Due by Period
Contractual Obligations TotalLess than
1 Year 1–3 Years 3–5 Years More than 5 YearsLong-term debt ............................................................. $ 1,638,403 $ 3,689 $ 500,813 $ 700,295 $ 433,606Operating leases ............................................................ 1,108,523 242,360 419,092 255,227 191,844Short-term borrowings ............................................... 69,035 69,035Interest on Long-term debt ....................................... 602,524 47,677 78,159 62,511 414,177Purchase obligations (a) ............................................... 132,235 132,235Other contractual obligations (b) .............................. 386,797 172,613 91,790 48,966 73,428Total contractual cash obligations .......................... $ 3,937,517 $ 667,609 $ 1,089,854 $ 1,066,999 $ 1,113,055(a) Relate to open purchase orders for raw materials at December 31, 2012.(b) Relate primarily to the DOL Settlement, estimated future capital contributions to investments in the U.S. affordable housing and historic renovation real estate
partnerships and various other contractual obligations.
Amount of Commitment Expiration Per Period
Commercial Commitments TotalLess than
1 Year 1–3 Years 3–5 YearsMore than
5 YearsStandby letters of credit ............................................. $ 22,845 $ 22,845Surety bonds ................................................................... 34,630 34,630Other commercial commitments ............................ 56,052 56,052 Total commercial commitments .............................. $ 113,527 $ 113,527 $ — $ — $ —
WarrantiesThe Company offers product warranties for certain products.
The specific terms and conditions of such warranties vary depending on the product or customer contract requirements. Management estimated the costs of unsettled product warranty claims based on historical results and experience. Management periodically assesses the adequacy of the accrual for product warranty claims and adjusts the accrual as necessary. Changes in the Company’s accrual for product warranty claims during 2012, 2011 and 2010, including customer satisfaction settlements during the year, were as follows:
(thousands of dollars) 2012 2011 2010Balance at January 1 ............. $ 22,071 $ 23,103 $ 22,214Charges to expense ............... 28,590 29,957 23,092Settlements .............................. (27,951) (30,989) (22,203)Balance at December 31 ...... $ 22,710 $ 22,071 $ 23,103
Shareholders’ EquityShareholders’ equity increased $274.9 million to $1.79
billion at December 31, 2012 from $1.52 billion last year. The increase in Shareholders’ equity resulted primarily from an increase in retained earnings of $470.1 million and an increase in Other capital of $376.2 million, due primarily to stock options exercised, partially offset by the purchase of treasury
35161_Financials1_Wt.indd 29 2/25/13 10:19 AM
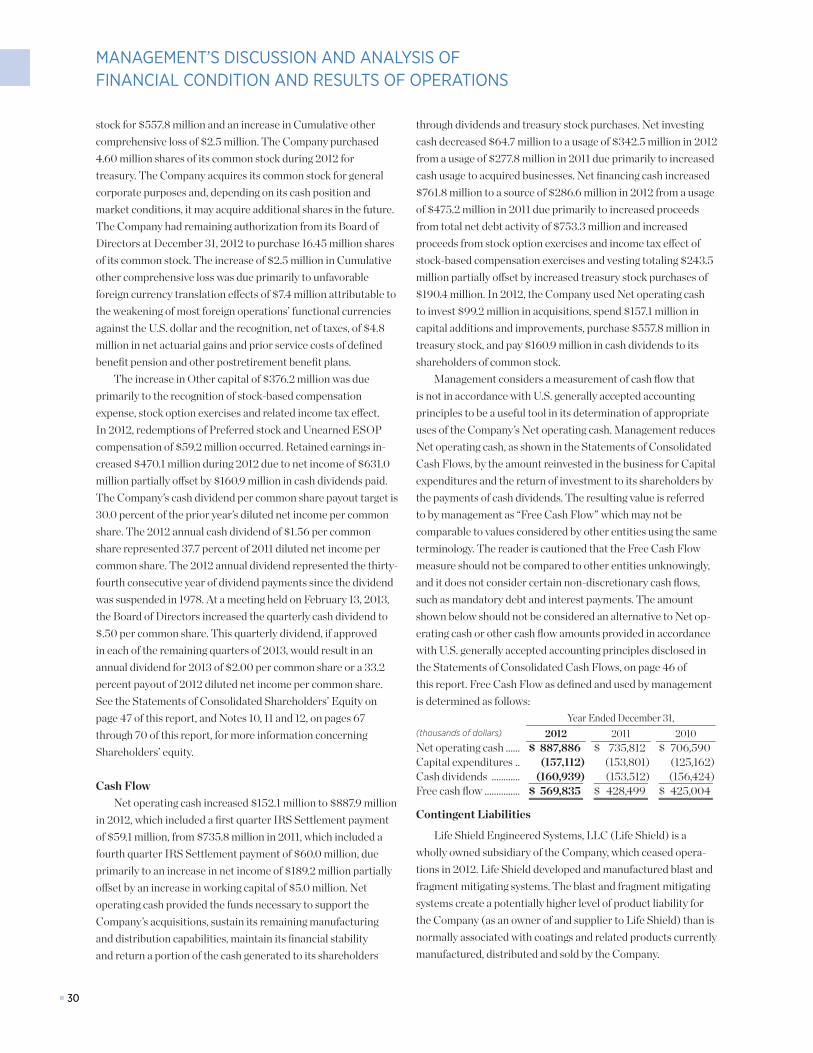
■ 30■ 30
MANAGEMENT’S DISCUSSION AND ANALYSIS OFFINANCIAL CONDITION AND RESULTS OF OPERATIONS
stock for $557.8 million and an increase in Cumulative other comprehensive loss of $2.5 million. The Company purchased 4.60 million shares of its common stock during 2012 for treasury. The Company acquires its common stock for general corporate purposes and, depending on its cash position and market conditions, it may acquire additional shares in the future. The Company had remaining authorization from its Board of Directors at December 31, 2012 to purchase 16.45 million shares of its common stock. The increase of $2.5 million in Cumulative other comprehensive loss was due primarily to unfavorable foreign currency translation effects of $7.4 million attributable to the weakening of most foreign operations’ functional currencies against the U.S. dollar and the recognition, net of taxes, of $4.8 million in net actuarial gains and prior service costs of defined benefit pension and other postretirement benefit plans.
The increase in Other capital of $376.2 million was due primarily to the recognition of stock-based compensation expense, stock option exercises and related income tax effect. In 2012, redemptions of Preferred stock and Unearned ESOP compensation of $59.2 million occurred. Retained earnings in-creased $470.1 million during 2012 due to net income of $631.0 million partially offset by $160.9 million in cash dividends paid. The Company’s cash dividend per common share payout target is 30.0 percent of the prior year’s diluted net income per common share. The 2012 annual cash dividend of $1.56 per common share represented 37.7 percent of 2011 diluted net income per common share. The 2012 annual dividend represented the thirty-fourth consecutive year of dividend payments since the dividend was suspended in 1978. At a meeting held on February 13, 2013, the Board of Directors increased the quarterly cash dividend to $.50 per common share. This quarterly dividend, if approved in each of the remaining quarters of 2013, would result in an annual dividend for 2013 of $2.00 per common share or a 33.2 percent payout of 2012 diluted net income per common share. See the Statements of Consolidated Shareholders’ Equity on page 47 of this report, and Notes 10, 11 and 12, on pages 67 through 70 of this report, for more information concerning Shareholders’ equity.
Cash FlowNet operating cash increased $152.1 million to $887.9 million
in 2012, which included a first quarter IRS Settlement payment of $59.1 million, from $735.8 million in 2011, which included a fourth quarter IRS Settlement payment of $60.0 million, due primarily to an increase in net income of $189.2 million partially offset by an increase in working capital of $5.0 million. Net operating cash provided the funds necessary to support the Company’s acquisitions, sustain its remaining manufacturing and distribution capabilities, maintain its financial stability and return a portion of the cash generated to its shareholders
through dividends and treasury stock purchases. Net investing cash decreased $64.7 million to a usage of $342.5 million in 2012 from a usage of $277.8 million in 2011 due primarily to increased cash usage to acquired businesses. Net financing cash increased $761.8 million to a source of $286.6 million in 2012 from a usage of $475.2 million in 2011 due primarily to increased proceeds from total net debt activity of $753.3 million and increased proceeds from stock option exercises and income tax effect of stock-based compensation exercises and vesting totaling $243.5 million partially offset by increased treasury stock purchases of $190.4 million. In 2012, the Company used Net operating cash to invest $99.2 million in acquisitions, spend $157.1 million in capital additions and improvements, purchase $557.8 million in treasury stock, and pay $160.9 million in cash dividends to its shareholders of common stock.
Management considers a measurement of cash flow that is not in accordance with U.S. generally accepted accounting principles to be a useful tool in its determination of appropriate uses of the Company’s Net operating cash. Management reduces Net operating cash, as shown in the Statements of Consolidated Cash Flows, by the amount reinvested in the business for Capital expenditures and the return of investment to its shareholders by the payments of cash dividends. The resulting value is referred to by management as “Free Cash Flow” which may not be comparable to values considered by other entities using the same terminology. The reader is cautioned that the Free Cash Flow measure should not be compared to other entities unknowingly, and it does not consider certain non-discretionary cash flows, such as mandatory debt and interest payments. The amount shown below should not be considered an alternative to Net op-erating cash or other cash flow amounts provided in accordance with U.S. generally accepted accounting principles disclosed in the Statements of Consolidated Cash Flows, on page 46 of this report. Free Cash Flow as defined and used by management is determined as follows:
Year Ended December 31,(thousands of dollars) 2012 2011 2010Net operating cash ...... $ 887,886 $ 735,812 $ 706,590Capital expenditures .. (157,112) (153,801) (125,162)Cash dividends ............ (160,939) (153,512) (156,424)Free cash flow ............... $ 569,835 $ 428,499 $ 425,004
Contingent Liabilities
Life Shield Engineered Systems, LLC (Life Shield) is a wholly owned subsidiary of the Company, which ceased opera-tions in 2012. Life Shield developed and manufactured blast and fragment mitigating systems. The blast and fragment mitigating systems create a potentially higher level of product liability for the Company (as an owner of and supplier to Life Shield) than is normally associated with coatings and related products currently manufactured, distributed and sold by the Company.
35161_Financials_Wt.indd 30 2/21/13 3:10 PM
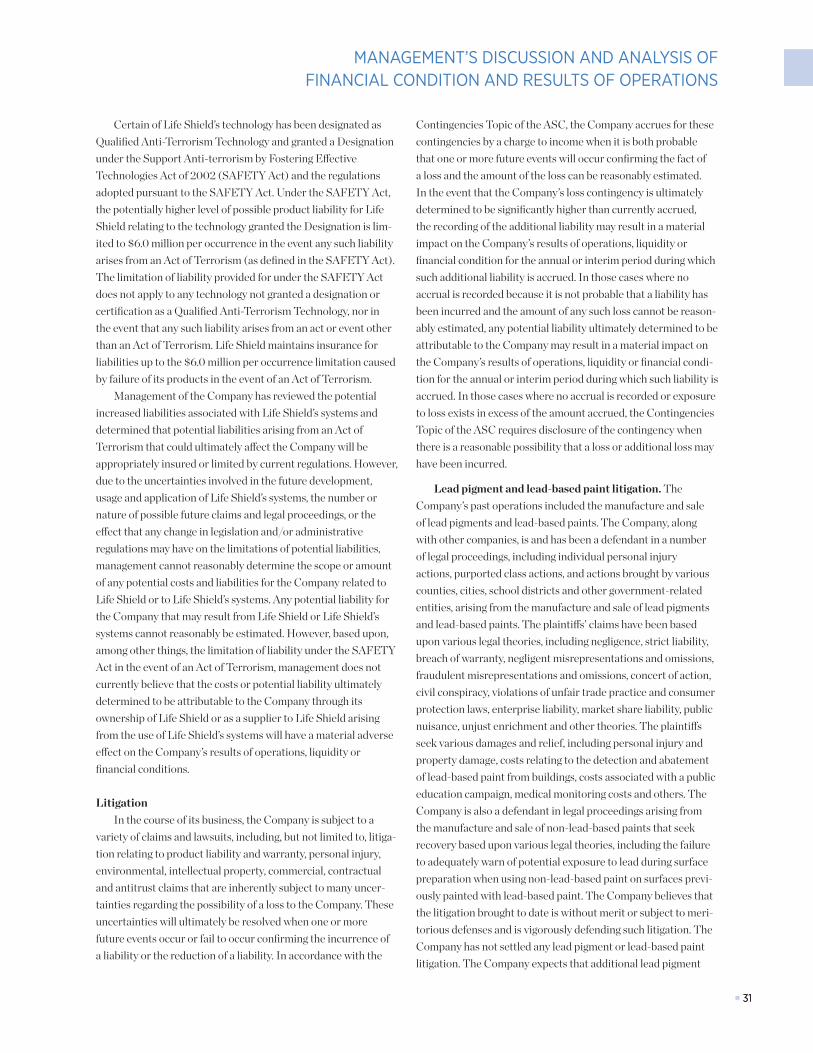
■ 31■ 31
MANAGEMENT’S DISCUSSION AND ANALYSIS OF FINANCIAL CONDITION AND RESULTS OF OPERATIONS
Certain of Life Shield’s technology has been designated as Qualified Anti-Terrorism Technology and granted a Designation under the Support Anti-terrorism by Fostering Effective Technologies Act of 2002 (SAFETY Act) and the regulations adopted pursuant to the SAFETY Act. Under the SAFETY Act, the potentially higher level of possible product liability for Life Shield relating to the technology granted the Designation is lim-ited to $6.0 million per occurrence in the event any such liability arises from an Act of Terrorism (as defined in the SAFETY Act). The limitation of liability provided for under the SAFETY Act does not apply to any technology not granted a designation or certification as a Qualified Anti-Terrorism Technology, nor in the event that any such liability arises from an act or event other than an Act of Terrorism. Life Shield maintains insurance for liabilities up to the $6.0 million per occurrence limitation caused by failure of its products in the event of an Act of Terrorism.
Management of the Company has reviewed the potential increased liabilities associated with Life Shield’s systems and determined that potential liabilities arising from an Act of Terrorism that could ultimately affect the Company will be appropriately insured or limited by current regulations. However, due to the uncertainties involved in the future development, usage and application of Life Shield’s systems, the number or nature of possible future claims and legal proceedings, or the effect that any change in legislation and/or administrative regulations may have on the limitations of potential liabilities, management cannot reasonably determine the scope or amount of any potential costs and liabilities for the Company related to Life Shield or to Life Shield’s systems. Any potential liability for the Company that may result from Life Shield or Life Shield’s systems cannot reasonably be estimated. However, based upon, among other things, the limitation of liability under the SAFETY Act in the event of an Act of Terrorism, management does not currently believe that the costs or potential liability ultimately determined to be attributable to the Company through its ownership of Life Shield or as a supplier to Life Shield arising from the use of Life Shield’s systems will have a material adverse effect on the Company’s results of operations, liquidity or financial conditions.
LitigationIn the course of its business, the Company is subject to a
variety of claims and lawsuits, including, but not limited to, litiga-tion relating to product liability and warranty, personal injury, environmental, intellectual property, commercial, contractual and antitrust claims that are inherently subject to many uncer-tainties regarding the possibility of a loss to the Company. These uncertainties will ultimately be resolved when one or more future events occur or fail to occur confirming the incurrence of a liability or the reduction of a liability. In accordance with the
Contingencies Topic of the ASC, the Company accrues for these contingencies by a charge to income when it is both probable that one or more future events will occur confirming the fact of a loss and the amount of the loss can be reasonably estimated. In the event that the Company’s loss contingency is ultimately determined to be significantly higher than currently accrued, the recording of the additional liability may result in a material impact on the Company’s results of operations, liquidity or financial condition for the annual or interim period during which such additional liability is accrued. In those cases where no accrual is recorded because it is not probable that a liability has been incurred and the amount of any such loss cannot be reason-ably estimated, any potential liability ultimately determined to be attributable to the Company may result in a material impact on the Company’s results of operations, liquidity or financial condi-tion for the annual or interim period during which such liability is accrued. In those cases where no accrual is recorded or exposure to loss exists in excess of the amount accrued, the Contingencies Topic of the ASC requires disclosure of the contingency when there is a reasonable possibility that a loss or additional loss may have been incurred.
Lead pigment and lead-based paint litigation. The Company’s past operations included the manufacture and sale of lead pigments and lead-based paints. The Company, along with other companies, is and has been a defendant in a number of legal proceedings, including individual personal injury actions, purported class actions, and actions brought by various counties, cities, school districts and other government-related entities, arising from the manufacture and sale of lead pigments and lead-based paints. The plaintiffs’ claims have been based upon various legal theories, including negligence, strict liability, breach of warranty, negligent misrepresentations and omissions, fraudulent misrepresentations and omissions, concert of action, civil conspiracy, violations of unfair trade practice and consumer protection laws, enterprise liability, market share liability, public nuisance, unjust enrichment and other theories. The plaintiffs seek various damages and relief, including personal injury and property damage, costs relating to the detection and abatement of lead-based paint from buildings, costs associated with a public education campaign, medical monitoring costs and others. The Company is also a defendant in legal proceedings arising from the manufacture and sale of non-lead-based paints that seek recovery based upon various legal theories, including the failure to adequately warn of potential exposure to lead during surface preparation when using non-lead-based paint on surfaces previ-ously painted with lead-based paint. The Company believes that the litigation brought to date is without merit or subject to meri-torious defenses and is vigorously defending such litigation. The Company has not settled any lead pigment or lead-based paint litigation. The Company expects that additional lead pigment
35161_Financials_Wt.indd 31 2/21/13 3:10 PM
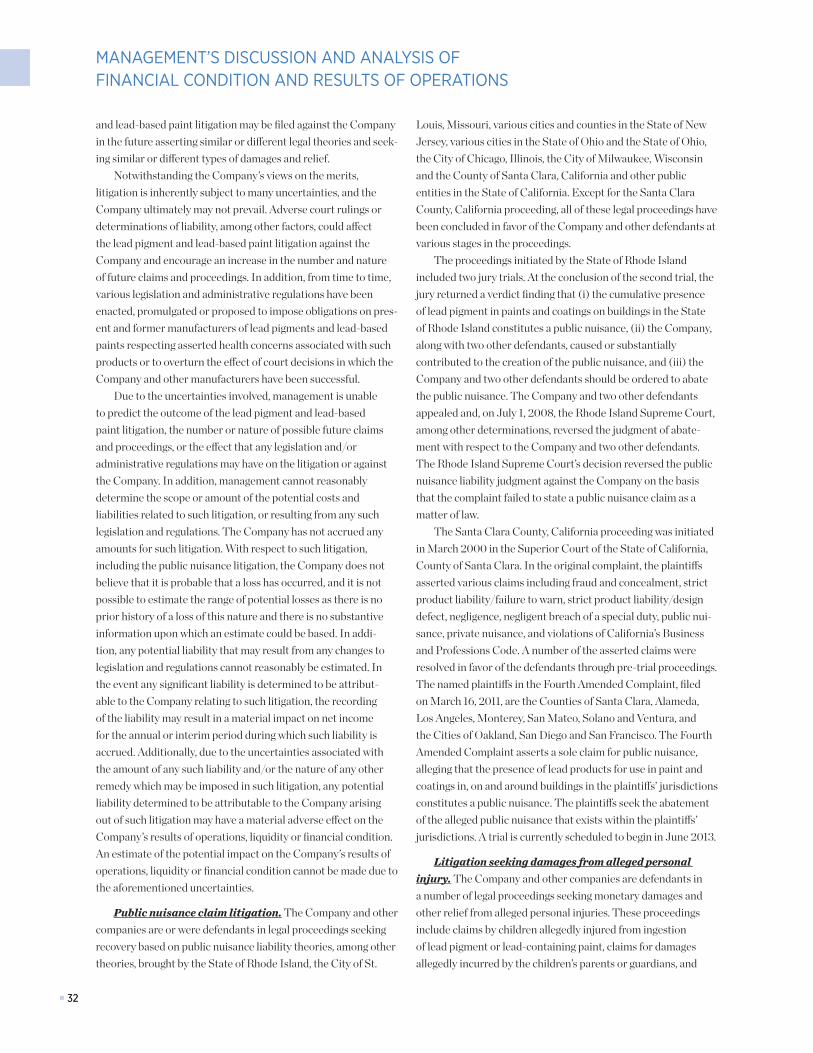
■ 32■ 32
MANAGEMENT’S DISCUSSION AND ANALYSIS OFFINANCIAL CONDITION AND RESULTS OF OPERATIONS
and lead-based paint litigation may be filed against the Company in the future asserting similar or different legal theories and seek-ing similar or different types of damages and relief.
Notwithstanding the Company’s views on the merits, litigation is inherently subject to many uncertainties, and the Company ultimately may not prevail. Adverse court rulings or determinations of liability, among other factors, could affect the lead pigment and lead-based paint litigation against the Company and encourage an increase in the number and nature of future claims and proceedings. In addition, from time to time, various legislation and administrative regulations have been enacted, promulgated or proposed to impose obligations on pres-ent and former manufacturers of lead pigments and lead-based paints respecting asserted health concerns associated with such products or to overturn the effect of court decisions in which the Company and other manufacturers have been successful.
Due to the uncertainties involved, management is unable to predict the outcome of the lead pigment and lead-based paint litigation, the number or nature of possible future claims and proceedings, or the effect that any legislation and/or administrative regulations may have on the litigation or against the Company. In addition, management cannot reasonably determine the scope or amount of the potential costs and liabilities related to such litigation, or resulting from any such legislation and regulations. The Company has not accrued any amounts for such litigation. With respect to such litigation, including the public nuisance litigation, the Company does not believe that it is probable that a loss has occurred, and it is not possible to estimate the range of potential losses as there is no prior history of a loss of this nature and there is no substantive information upon which an estimate could be based. In addi-tion, any potential liability that may result from any changes to legislation and regulations cannot reasonably be estimated. In the event any significant liability is determined to be attribut-able to the Company relating to such litigation, the recording of the liability may result in a material impact on net income for the annual or interim period during which such liability is accrued. Additionally, due to the uncertainties associated with the amount of any such liability and/or the nature of any other remedy which may be imposed in such litigation, any potential liability determined to be attributable to the Company arising out of such litigation may have a material adverse effect on the Company’s results of operations, liquidity or financial condition. An estimate of the potential impact on the Company’s results of operations, liquidity or financial condition cannot be made due to the aforementioned uncertainties.
Public nuisance claim litigation. The Company and other companies are or were defendants in legal proceedings seeking recovery based on public nuisance liability theories, among other theories, brought by the State of Rhode Island, the City of St.
Louis, Missouri, various cities and counties in the State of New Jersey, various cities in the State of Ohio and the State of Ohio, the City of Chicago, Illinois, the City of Milwaukee, Wisconsin and the County of Santa Clara, California and other public entities in the State of California. Except for the Santa Clara County, California proceeding, all of these legal proceedings have been concluded in favor of the Company and other defendants at various stages in the proceedings.
The proceedings initiated by the State of Rhode Island included two jury trials. At the conclusion of the second trial, the jury returned a verdict finding that (i) the cumulative presence of lead pigment in paints and coatings on buildings in the State of Rhode Island constitutes a public nuisance, (ii) the Company, along with two other defendants, caused or substantially contributed to the creation of the public nuisance, and (iii) the Company and two other defendants should be ordered to abate the public nuisance. The Company and two other defendants appealed and, on July 1, 2008, the Rhode Island Supreme Court, among other determinations, reversed the judgment of abate-ment with respect to the Company and two other defendants. The Rhode Island Supreme Court’s decision reversed the public nuisance liability judgment against the Company on the basis that the complaint failed to state a public nuisance claim as a matter of law.
The Santa Clara County, California proceeding was initiated in March 2000 in the Superior Court of the State of California, County of Santa Clara. In the original complaint, the plaintiffs asserted various claims including fraud and concealment, strict product liability/failure to warn, strict product liability/design defect, negligence, negligent breach of a special duty, public nui-sance, private nuisance, and violations of California’s Business and Professions Code. A number of the asserted claims were resolved in favor of the defendants through pre-trial proceedings. The named plaintiffs in the Fourth Amended Complaint, filed on March 16, 2011, are the Counties of Santa Clara, Alameda, Los Angeles, Monterey, San Mateo, Solano and Ventura, and the Cities of Oakland, San Diego and San Francisco. The Fourth Amended Complaint asserts a sole claim for public nuisance, alleging that the presence of lead products for use in paint and coatings in, on and around buildings in the plaintiffs’ jurisdictions constitutes a public nuisance. The plaintiffs seek the abatement of the alleged public nuisance that exists within the plaintiffs’ jurisdictions. A trial is currently scheduled to begin in June 2013.
Litigation seeking damages from alleged personal injury. The Company and other companies are defendants in a number of legal proceedings seeking monetary damages and other relief from alleged personal injuries. These proceedings include claims by children allegedly injured from ingestion of lead pigment or lead-containing paint, claims for damages allegedly incurred by the children’s parents or guardians, and
35161_Financials_Wt.indd 32 2/21/13 3:10 PM
■ 33■ 33
MANAGEMENT’S DISCUSSION AND ANALYSIS OF FINANCIAL CONDITION AND RESULTS OF OPERATIONS
claims for damages allegedly incurred by professional painting contractors. These proceedings generally seek compensatory and punitive damages, and seek other relief including medical monitoring costs. These proceedings include purported claims by individuals, groups of individuals and class actions.
The plaintiff in Thomas v. Lead Industries Association, et al., initiated an action in state court against the Company, other alleged former lead pigment manufacturers and the Lead Industries Association in September 1999. The claims against the Company and the other defendants included strict liability, negligence, negligent misrepresentation and omissions, fraudu-lent misrepresentation and omissions, concert of action, civil conspiracy and enterprise liability. Implicit within these claims is the theory of “risk contribution” liability (Wisconsin’s theory which is similar to market share liability) due to the plaintiff’s in-ability to identify the manufacturer of any product that allegedly injured the plaintiff. The case ultimately proceeded to trial and, on November 5, 2007, the jury returned a defense verdict, finding that the plaintiff had ingested white lead carbonate, but was not brain damaged or injured as a result. The plaintiff appealed and, on December 16, 2010, the Wisconsin Court of Appeals affirmed the final judgment in favor of the Company and other defendants.
Wisconsin is the only jurisdiction to date to apply a theory of liability with respect to alleged personal injury (i.e., risk contribu-tion/market share liability) that does not require the plaintiff to identify the manufacturer of the product that allegedly injured the plaintiff in the lead pigment and lead-based paint litigation. Although the risk contribution liability theory was applied during the Thomas trial, the constitutionality of this theory as applied to the lead pigment cases has not been judicially determined by the Wisconsin state courts. However, in an unrelated action filed in the United States District Court for the Eastern District of Wisconsin, Gibson v. American Cyanamid, et al., on November 15, 2010, the District Court held that Wisconsin’s risk contribution theory as applied in that case violated the defen-dants’ right to substantive due process and is unconstitutionally retroactive. The District Court’s decision in Gibson v. American Cyanamid, et al., has been appealed by the plaintiff.
Insurance coverage litigation. The Company and its liability insurers, including certain Underwriters at Lloyd’s of London, initiated legal proceedings against each other to primar-ily determine, among other things, whether the costs and liabili-ties associated with the abatement of lead pigment are covered under certain insurance policies issued to the Company. The Company’s action, filed on March 3, 2006 in the Common Pleas Court, Cuyahoga County, Ohio, is currently stayed and inactive. The liability insurers’ action, which was filed on February 23, 2006 in the Supreme Court of the State of New York, County of New York, has been dismissed. An ultimate loss in the insur-ance coverage litigation would mean that insurance proceeds
could be unavailable under the policies at issue to mitigate any ultimate abatement related costs and liabilities. The Company has not recorded any assets related to these insurance policies or otherwise assumed that proceeds from these insurance policies would be received in estimating any contingent liability accrual. Therefore, an ultimate loss in the insurance coverage litigation without a determination of liability against the Company in the lead pigment or lead-based paint litigation will have no impact on the Company’s results of operation, liquidity or financial condition. As previously stated, however, the Company has not accrued any amounts for the lead pigment or lead-based paint litigation and any significant liability ultimately determined to be attributable to the Company relating to such litigation may result in a material impact on the Company’s results of operations, liquidity or financial condition for the annual or interim period during which such liability is accrued.
2012 Subsequent Event - DOL Settlement. On February 20, 2013, the Company reached a settlement with the DOL of the previously disclosed investigation of transactions related to the ESOP that were implemented on August 1, 2006 and August 27, 2003. The DOL had notified the Company, certain current and former directors of the Company and the ESOP trustee of poten-tial enforcement claims asserting breaches of fiduciary obliga-tions. The DOL sought compensatory and equitable remedies, including monetary damages to the ESOP for alleged losses to the ESOP relating to third-party valuation of the Company’s convertible serial preferred stock. The Company believes that the DOL’s claims are subject to meritorious defenses, however, the Company’s management and Board of Directors have decided that it would be in the best interest of the Company and its shareholders to avoid potentially costly litigation and enter into this settlement to resolve these claims.
The Company agreed to resolve all ESOP related claims with the DOL by making a one-time payment of $80.0 million to the ESOP and has recorded a $49.2 million after tax charge to earnings. In accordance with U.S. generally accepted accounting principles, the Company is required to recognize this subsequent event in its 2012 fiscal year results since this subsequent event is related to conditions that existed at the balance sheet date of December 31, 2012. The Company’s financial results for the quarter and year ended December 31, 2012, which were set forth in the Company’s earnings release issued on January 31, 2013 and furnished on the Company’s Current Report on Form 8-K dated January 31, 2013, have been revised and furnished on the Company’s Current Report on Form 8-K dated February 20, 2013 to reflect this subsequent event. As a result of recording this accrual in the Administrative segment, Cost of goods sold increased $16.0 million and Selling, general and administrative expense increased $64.0 million while income tax expense decreased $30.8 million and diluted net income per common
35161_Financials_Wt.indd 33 2/21/13 3:10 PM
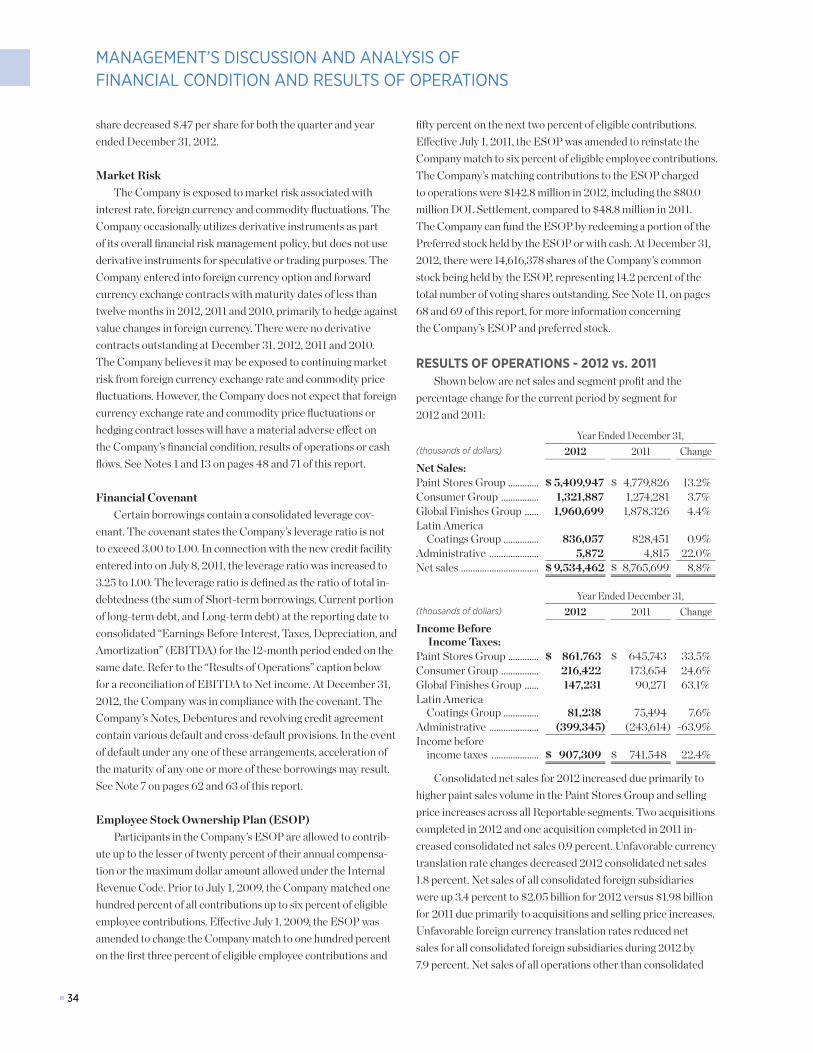
■ 34■ 34
MANAGEMENT’S DISCUSSION AND ANALYSIS OFFINANCIAL CONDITION AND RESULTS OF OPERATIONS
share decreased $.47 per share for both the quarter and year ended December 31, 2012.
Market RiskThe Company is exposed to market risk associated with
interest rate, foreign currency and commodity fluctuations. The Company occasionally utilizes derivative instruments as part of its overall financial risk management policy, but does not use derivative instruments for speculative or trading purposes. The Company entered into foreign currency option and forward currency exchange contracts with maturity dates of less than twelve months in 2012, 2011 and 2010, primarily to hedge against value changes in foreign currency. There were no derivative contracts outstanding at December 31, 2012, 2011 and 2010. The Company believes it may be exposed to continuing market risk from foreign currency exchange rate and commodity price fluctuations. However, the Company does not expect that foreign currency exchange rate and commodity price fluctuations or hedging contract losses will have a material adverse effect on the Company’s financial condition, results of operations or cash flows. See Notes 1 and 13 on pages 48 and 71 of this report.
Financial CovenantCertain borrowings contain a consolidated leverage cov-
enant. The covenant states the Company’s leverage ratio is not to exceed 3.00 to 1.00. In connection with the new credit facility entered into on July 8, 2011, the leverage ratio was increased to 3.25 to 1.00. The leverage ratio is defined as the ratio of total in-debtedness (the sum of Short-term borrowings, Current portion of long-term debt, and Long-term debt) at the reporting date to consolidated “Earnings Before Interest, Taxes, Depreciation, and Amortization” (EBITDA) for the 12-month period ended on the same date. Refer to the “Results of Operations” caption below for a reconciliation of EBITDA to Net income. At December 31, 2012, the Company was in compliance with the covenant. The Company’s Notes, Debentures and revolving credit agreement contain various default and cross-default provisions. In the event of default under any one of these arrangements, acceleration of the maturity of any one or more of these borrowings may result. See Note 7 on pages 62 and 63 of this report.
Employee Stock Ownership Plan (ESOP)Participants in the Company’s ESOP are allowed to contrib-
ute up to the lesser of twenty percent of their annual compensa-tion or the maximum dollar amount allowed under the Internal Revenue Code. Prior to July 1, 2009, the Company matched one hundred percent of all contributions up to six percent of eligible employee contributions. Effective July 1, 2009, the ESOP was amended to change the Company match to one hundred percent on the first three percent of eligible employee contributions and
fifty percent on the next two percent of eligible contributions. Effective July 1, 2011, the ESOP was amended to reinstate the Company match to six percent of eligible employee contributions. The Company’s matching contributions to the ESOP charged to operations were $142.8 million in 2012, including the $80.0 million DOL Settlement, compared to $48.8 million in 2011. The Company can fund the ESOP by redeeming a portion of the Preferred stock held by the ESOP or with cash. At December 31, 2012, there were 14,616,378 shares of the Company’s common stock being held by the ESOP, representing 14.2 percent of the total number of voting shares outstanding. See Note 11, on pages 68 and 69 of this report, for more information concerning the Company’s ESOP and preferred stock.
RESULTS OF OPERATIONS - 2012 vs. 2011Shown below are net sales and segment profit and the
percentage change for the current period by segment for 2012 and 2011:
Year Ended December 31,(thousands of dollars) 2012 2011 ChangeNet Sales:Paint Stores Group ............. $ 5,409,947 $ 4,779,826 13.2%Consumer Group ................ 1,321,887 1,274,281 3.7%Global Finishes Group ...... 1,960,699 1,878,326 4.4%Latin America
Coatings Group ............... 836,057 828,451 0.9%Administrative ..................... 5,872 4,815 22.0%Net sales ................................. $ 9,534,462 $ 8,765,699 8.8%
Year Ended December 31,(thousands of dollars) 2012 2011 ChangeIncome Before
Income Taxes:Paint Stores Group ............. $ 861,763 $ 645,743 33.5%Consumer Group ................ 216,422 173,654 24.6%Global Finishes Group ...... 147,231 90,271 63.1%Latin America
Coatings Group ............... 81,238 75,494 7.6%Administrative ..................... (399,345) (243,614) -63.9%Income before
income taxes .................... $ 907,309 $ 741,548 22.4%
Consolidated net sales for 2012 increased due primarily to higher paint sales volume in the Paint Stores Group and selling price increases across all Reportable segments. Two acquisitions completed in 2012 and one acquisition completed in 2011 in-creased consolidated net sales 0.9 percent. Unfavorable currency translation rate changes decreased 2012 consolidated net sales 1.8 percent. Net sales of all consolidated foreign subsidiaries were up 3.4 percent to $2.05 billion for 2012 versus $1.98 billion for 2011 due primarily to acquisitions and selling price increases. Unfavorable foreign currency translation rates reduced net sales for all consolidated foreign subsidiaries during 2012 by 7.9 percent. Net sales of all operations other than consolidated
35161_Financials_Wt.indd 34 2/21/13 3:10 PM
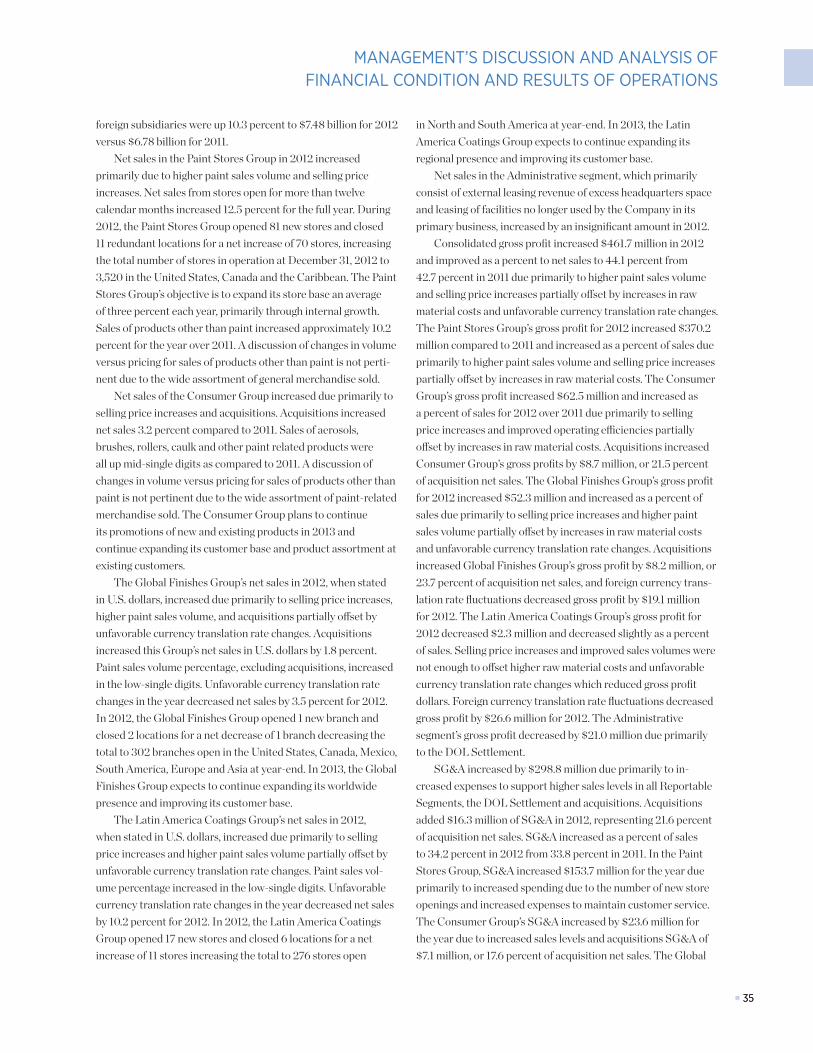
■ 35■ 35
MANAGEMENT’S DISCUSSION AND ANALYSIS OF FINANCIAL CONDITION AND RESULTS OF OPERATIONS
foreign subsidiaries were up 10.3 percent to $7.48 billion for 2012 versus $6.78 billion for 2011.
Net sales in the Paint Stores Group in 2012 increased primarily due to higher paint sales volume and selling price increases. Net sales from stores open for more than twelve calendar months increased 12.5 percent for the full year. During 2012, the Paint Stores Group opened 81 new stores and closed 11 redundant locations for a net increase of 70 stores, increasing the total number of stores in operation at December 31, 2012 to 3,520 in the United States, Canada and the Caribbean. The Paint Stores Group’s objective is to expand its store base an average of three percent each year, primarily through internal growth. Sales of products other than paint increased approximately 10.2 percent for the year over 2011. A discussion of changes in volume versus pricing for sales of products other than paint is not perti-nent due to the wide assortment of general merchandise sold.
Net sales of the Consumer Group increased due primarily to selling price increases and acquisitions. Acquisitions increased net sales 3.2 percent compared to 2011. Sales of aerosols, brushes, rollers, caulk and other paint related products were all up mid-single digits as compared to 2011. A discussion of changes in volume versus pricing for sales of products other than paint is not pertinent due to the wide assortment of paint-related merchandise sold. The Consumer Group plans to continue its promotions of new and existing products in 2013 and continue expanding its customer base and product assortment at existing customers.
The Global Finishes Group’s net sales in 2012, when stated in U.S. dollars, increased due primarily to selling price increases, higher paint sales volume, and acquisitions partially offset by unfavorable currency translation rate changes. Acquisitions increased this Group’s net sales in U.S. dollars by 1.8 percent. Paint sales volume percentage, excluding acquisitions, increased in the low-single digits. Unfavorable currency translation rate changes in the year decreased net sales by 3.5 percent for 2012. In 2012, the Global Finishes Group opened 1 new branch and closed 2 locations for a net decrease of 1 branch decreasing the total to 302 branches open in the United States, Canada, Mexico, South America, Europe and Asia at year-end. In 2013, the Global Finishes Group expects to continue expanding its worldwide presence and improving its customer base.
The Latin America Coatings Group’s net sales in 2012, when stated in U.S. dollars, increased due primarily to selling price increases and higher paint sales volume partially offset by unfavorable currency translation rate changes. Paint sales vol-ume percentage increased in the low-single digits. Unfavorable currency translation rate changes in the year decreased net sales by 10.2 percent for 2012. In 2012, the Latin America Coatings Group opened 17 new stores and closed 6 locations for a net increase of 11 stores increasing the total to 276 stores open
in North and South America at year-end. In 2013, the Latin America Coatings Group expects to continue expanding its regional presence and improving its customer base.
Net sales in the Administrative segment, which primarily consist of external leasing revenue of excess headquarters space and leasing of facilities no longer used by the Company in its primary business, increased by an insignificant amount in 2012.
Consolidated gross profit increased $461.7 million in 2012 and improved as a percent to net sales to 44.1 percent from 42.7 percent in 2011 due primarily to higher paint sales volume and selling price increases partially offset by increases in raw material costs and unfavorable currency translation rate changes. The Paint Stores Group’s gross profit for 2012 increased $370.2 million compared to 2011 and increased as a percent of sales due primarily to higher paint sales volume and selling price increases partially offset by increases in raw material costs. The Consumer Group’s gross profit increased $62.5 million and increased as a percent of sales for 2012 over 2011 due primarily to selling price increases and improved operating efficiencies partially offset by increases in raw material costs. Acquisitions increased Consumer Group’s gross profits by $8.7 million, or 21.5 percent of acquisition net sales. The Global Finishes Group’s gross profit for 2012 increased $52.3 million and increased as a percent of sales due primarily to selling price increases and higher paint sales volume partially offset by increases in raw material costs and unfavorable currency translation rate changes. Acquisitions increased Global Finishes Group’s gross profit by $8.2 million, or 23.7 percent of acquisition net sales, and foreign currency trans-lation rate fluctuations decreased gross profit by $19.1 million for 2012. The Latin America Coatings Group’s gross profit for 2012 decreased $2.3 million and decreased slightly as a percent of sales. Selling price increases and improved sales volumes were not enough to offset higher raw material costs and unfavorable currency translation rate changes which reduced gross profit dollars. Foreign currency translation rate fluctuations decreased gross profit by $26.6 million for 2012. The Administrative segment’s gross profit decreased by $21.0 million due primarily to the DOL Settlement.
SG&A increased by $298.8 million due primarily to in-creased expenses to support higher sales levels in all Reportable Segments, the DOL Settlement and acquisitions. Acquisitions added $16.3 million of SG&A in 2012, representing 21.6 percent of acquisition net sales. SG&A increased as a percent of sales to 34.2 percent in 2012 from 33.8 percent in 2011. In the Paint Stores Group, SG&A increased $153.7 million for the year due primarily to increased spending due to the number of new store openings and increased expenses to maintain customer service. The Consumer Group’s SG&A increased by $23.6 million for the year due to increased sales levels and acquisitions SG&A of $7.1 million, or 17.6 percent of acquisition net sales. The Global
35161_Financials_Wt.indd 35 2/21/13 3:10 PM
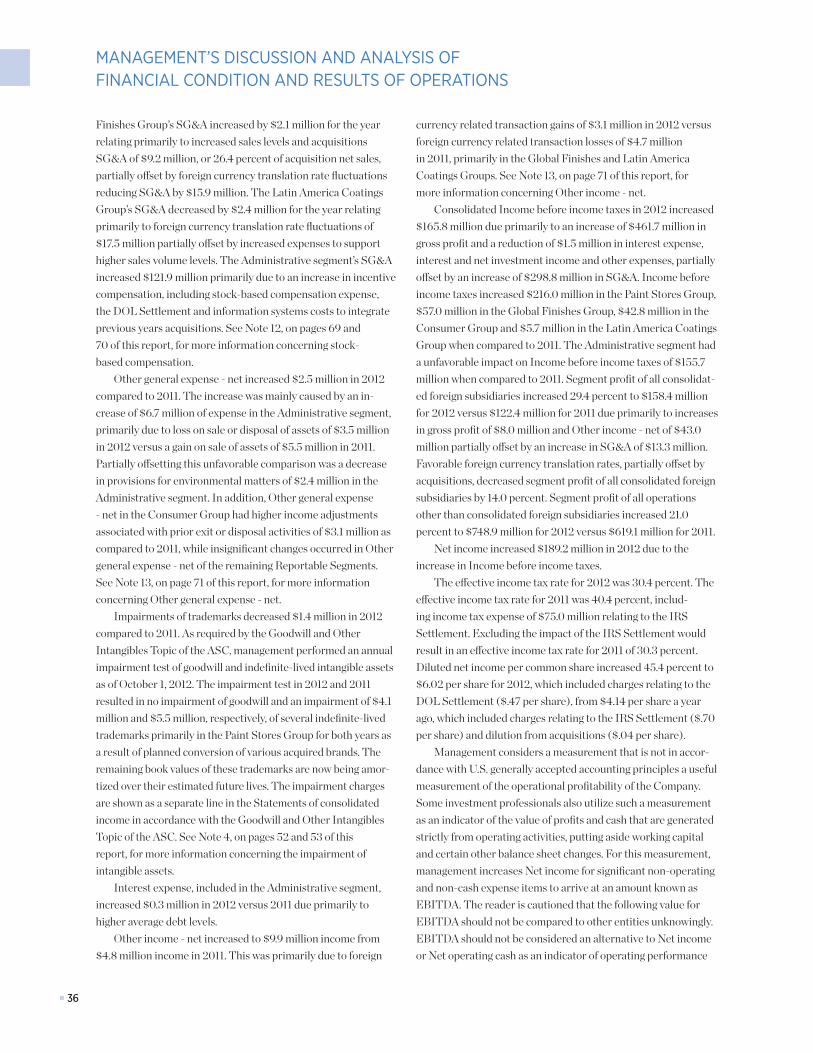
■ 36■ 36
MANAGEMENT’S DISCUSSION AND ANALYSIS OFFINANCIAL CONDITION AND RESULTS OF OPERATIONS
Finishes Group’s SG&A increased by $2.1 million for the year relating primarily to increased sales levels and acquisitions SG&A of $9.2 million, or 26.4 percent of acquisition net sales, partially offset by foreign currency translation rate fluctuations reducing SG&A by $15.9 million. The Latin America Coatings Group’s SG&A decreased by $2.4 million for the year relating primarily to foreign currency translation rate fluctuations of $17.5 million partially offset by increased expenses to support higher sales volume levels. The Administrative segment’s SG&A increased $121.9 million primarily due to an increase in incentive compensation, including stock-based compensation expense, the DOL Settlement and information systems costs to integrate previous years acquisitions. See Note 12, on pages 69 and 70 of this report, for more information concerning stock-based compensation.
Other general expense - net increased $2.5 million in 2012 compared to 2011. The increase was mainly caused by an in-crease of $6.7 million of expense in the Administrative segment, primarily due to loss on sale or disposal of assets of $3.5 million in 2012 versus a gain on sale of assets of $5.5 million in 2011. Partially offsetting this unfavorable comparison was a decrease in provisions for environmental matters of $2.4 million in the Administrative segment. In addition, Other general expense - net in the Consumer Group had higher income adjustments associated with prior exit or disposal activities of $3.1 million as compared to 2011, while insignificant changes occurred in Other general expense - net of the remaining Reportable Segments. See Note 13, on page 71 of this report, for more information concerning Other general expense - net.
Impairments of trademarks decreased $1.4 million in 2012 compared to 2011. As required by the Goodwill and Other Intangibles Topic of the ASC, management performed an annual impairment test of goodwill and indefinite-lived intangible assets as of October 1, 2012. The impairment test in 2012 and 2011 resulted in no impairment of goodwill and an impairment of $4.1 million and $5.5 million, respectively, of several indefinite-lived trademarks primarily in the Paint Stores Group for both years as a result of planned conversion of various acquired brands. The remaining book values of these trademarks are now being amor-tized over their estimated future lives. The impairment charges are shown as a separate line in the Statements of consolidated income in accordance with the Goodwill and Other Intangibles Topic of the ASC. See Note 4, on pages 52 and 53 of this report, for more information concerning the impairment of intangible assets.
Interest expense, included in the Administrative segment, increased $0.3 million in 2012 versus 2011 due primarily to higher average debt levels.
Other income - net increased to $9.9 million income from $4.8 million income in 2011. This was primarily due to foreign
currency related transaction gains of $3.1 million in 2012 versus foreign currency related transaction losses of $4.7 million in 2011, primarily in the Global Finishes and Latin America Coatings Groups. See Note 13, on page 71 of this report, for more information concerning Other income - net.
Consolidated Income before income taxes in 2012 increased $165.8 million due primarily to an increase of $461.7 million in gross profit and a reduction of $1.5 million in interest expense, interest and net investment income and other expenses, partially offset by an increase of $298.8 million in SG&A. Income before income taxes increased $216.0 million in the Paint Stores Group, $57.0 million in the Global Finishes Group, $42.8 million in the Consumer Group and $5.7 million in the Latin America Coatings Group when compared to 2011. The Administrative segment had a unfavorable impact on Income before income taxes of $155.7 million when compared to 2011. Segment profit of all consolidat-ed foreign subsidiaries increased 29.4 percent to $158.4 million for 2012 versus $122.4 million for 2011 due primarily to increases in gross profit of $8.0 million and Other income - net of $43.0 million partially offset by an increase in SG&A of $13.3 million. Favorable foreign currency translation rates, partially offset by acquisitions, decreased segment profit of all consolidated foreign subsidiaries by 14.0 percent. Segment profit of all operations other than consolidated foreign subsidiaries increased 21.0 percent to $748.9 million for 2012 versus $619.1 million for 2011.
Net income increased $189.2 million in 2012 due to the increase in Income before income taxes.
The effective income tax rate for 2012 was 30.4 percent. The effective income tax rate for 2011 was 40.4 percent, includ-ing income tax expense of $75.0 million relating to the IRS Settlement. Excluding the impact of the IRS Settlement would result in an effective income tax rate for 2011 of 30.3 percent. Diluted net income per common share increased 45.4 percent to $6.02 per share for 2012, which included charges relating to the DOL Settlement ($.47 per share), from $4.14 per share a year ago, which included charges relating to the IRS Settlement ($.70 per share) and dilution from acquisitions ($.04 per share).
Management considers a measurement that is not in accor-dance with U.S. generally accepted accounting principles a useful measurement of the operational profitability of the Company. Some investment professionals also utilize such a measurement as an indicator of the value of profits and cash that are generated strictly from operating activities, putting aside working capital and certain other balance sheet changes. For this measurement, management increases Net income for significant non-operating and non-cash expense items to arrive at an amount known as EBITDA. The reader is cautioned that the following value for EBITDA should not be compared to other entities unknowingly. EBITDA should not be considered an alternative to Net income or Net operating cash as an indicator of operating performance
35161_Financials_Wt.indd 36 2/21/13 3:10 PM
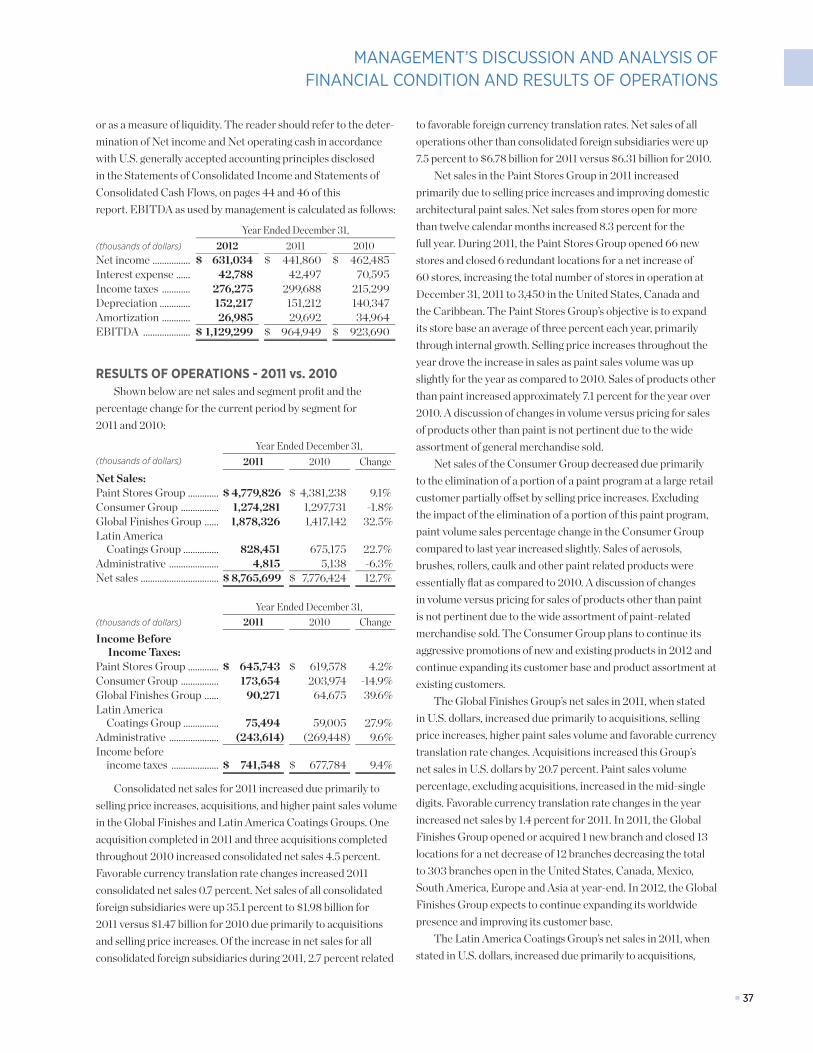
■ 37■ 37
MANAGEMENT’S DISCUSSION AND ANALYSIS OF FINANCIAL CONDITION AND RESULTS OF OPERATIONS
or as a measure of liquidity. The reader should refer to the deter-mination of Net income and Net operating cash in accordance with U.S. generally accepted accounting principles disclosed in the Statements of Consolidated Income and Statements of Consolidated Cash Flows, on pages 44 and 46 of this report. EBITDA as used by management is calculated as follows:
Year Ended December 31,(thousands of dollars) 2012 2011 2010Net income ................ $ 631,034 $ 441,860 $ 462,485Interest expense ...... 42,788 42,497 70,595Income taxes ............ 276,275 299,688 215,299Depreciation ............. 152,217 151,212 140,347Amortization ............ 26,985 29,692 34,964EBITDA .................... $ 1,129,299 $ 964,949 $ 923,690
RESULTS OF OPERATIONS - 2011 vs. 2010Shown below are net sales and segment profit and the
percentage change for the current period by segment for 2011 and 2010:
Year Ended December 31,(thousands of dollars) 2011 2010 ChangeNet Sales:Paint Stores Group ............. $ 4,779,826 $ 4,381,238 9.1%Consumer Group ................ 1,274,281 1,297,731 -1.8%Global Finishes Group ...... 1,878,326 1,417,142 32.5%Latin America
Coatings Group ............... 828,451 675,175 22.7%Administrative ..................... 4,815 5,138 -6.3%Net sales ................................. $ 8,765,699 $ 7,776,424 12.7%
Year Ended December 31,(thousands of dollars) 2011 2010 ChangeIncome Before
Income Taxes:Paint Stores Group ............. $ 645,743 $ 619,578 4.2%Consumer Group ................ 173,654 203,974 -14.9%Global Finishes Group ...... 90,271 64,675 39.6%Latin America
Coatings Group ............... 75,494 59,005 27.9%Administrative ..................... (243,614) (269,448) 9.6%Income before
income taxes .................... $ 741,548 $ 677,784 9.4%
Consolidated net sales for 2011 increased due primarily to selling price increases, acquisitions, and higher paint sales volume in the Global Finishes and Latin America Coatings Groups. One acquisition completed in 2011 and three acquisitions completed throughout 2010 increased consolidated net sales 4.5 percent. Favorable currency translation rate changes increased 2011 consolidated net sales 0.7 percent. Net sales of all consolidated foreign subsidiaries were up 35.1 percent to $1.98 billion for 2011 versus $1.47 billion for 2010 due primarily to acquisitions and selling price increases. Of the increase in net sales for all consolidated foreign subsidiaries during 2011, 2.7 percent related
to favorable foreign currency translation rates. Net sales of all operations other than consolidated foreign subsidiaries were up 7.5 percent to $6.78 billion for 2011 versus $6.31 billion for 2010.
Net sales in the Paint Stores Group in 2011 increased primarily due to selling price increases and improving domestic architectural paint sales. Net sales from stores open for more than twelve calendar months increased 8.3 percent for the full year. During 2011, the Paint Stores Group opened 66 new stores and closed 6 redundant locations for a net increase of 60 stores, increasing the total number of stores in operation at December 31, 2011 to 3,450 in the United States, Canada and the Caribbean. The Paint Stores Group’s objective is to expand its store base an average of three percent each year, primarily through internal growth. Selling price increases throughout the year drove the increase in sales as paint sales volume was up slightly for the year as compared to 2010. Sales of products other than paint increased approximately 7.1 percent for the year over 2010. A discussion of changes in volume versus pricing for sales of products other than paint is not pertinent due to the wide assortment of general merchandise sold.
Net sales of the Consumer Group decreased due primarily to the elimination of a portion of a paint program at a large retail customer partially offset by selling price increases. Excluding the impact of the elimination of a portion of this paint program, paint volume sales percentage change in the Consumer Group compared to last year increased slightly. Sales of aerosols, brushes, rollers, caulk and other paint related products were essentially flat as compared to 2010. A discussion of changes in volume versus pricing for sales of products other than paint is not pertinent due to the wide assortment of paint-related merchandise sold. The Consumer Group plans to continue its aggressive promotions of new and existing products in 2012 and continue expanding its customer base and product assortment at existing customers.
The Global Finishes Group’s net sales in 2011, when stated in U.S. dollars, increased due primarily to acquisitions, selling price increases, higher paint sales volume and favorable currency translation rate changes. Acquisitions increased this Group’s net sales in U.S. dollars by 20.7 percent. Paint sales volume percentage, excluding acquisitions, increased in the mid-single digits. Favorable currency translation rate changes in the year increased net sales by 1.4 percent for 2011. In 2011, the Global Finishes Group opened or acquired 1 new branch and closed 13 locations for a net decrease of 12 branches decreasing the total to 303 branches open in the United States, Canada, Mexico, South America, Europe and Asia at year-end. In 2012, the Global Finishes Group expects to continue expanding its worldwide presence and improving its customer base.
The Latin America Coatings Group’s net sales in 2011, when stated in U.S. dollars, increased due primarily to acquisitions,
35161_Financials_Wt.indd 37 2/21/13 3:10 PM
■ 38■ 38
MANAGEMENT’S DISCUSSION AND ANALYSIS OFFINANCIAL CONDITION AND RESULTS OF OPERATIONS
selling price increases, higher paint sales volume and favorable currency translation rate changes. Acquisitions increased this Group’s net sales in U.S. dollars by 8.7 percent. Paint sales volume percentage, excluding acquisitions, increased in the mid-single digits. Favorable currency translation rate changes in the year increased net sales by 3.0 percent for 2011. In 2011, the Latin America Coatings Group opened or acquired 19 new stores and closed 3 locations for a net increase of 16 stores increasing the total to 265 stores open in North and South America at year-end. In 2012, the Latin America Coatings Group expects to continue expanding its regional presence and improving its customer base.
Net sales in the Administrative segment, which primarily consist of external leasing revenue of excess headquarters space and leasing of facilities no longer used by the Company in its primary business, decreased by an insignificant amount in 2011.
Consolidated gross profit increased $263.5 million related primarily to higher sales in 2011, but decreased as a percent to net sales to 42.7 percent from 44.8 percent in 2010 due primarily to increasing raw material costs and the dilutive impact of acquisitions partially offset by selling price increases, increased paint volume and good inventory management and cost control. The Paint Stores Group’s gross profit for 2011 increased $129.7 million compared to 2010, but decreased as a percent of sales due primarily to increasing raw material costs partially offset by selling price increases throughout 2011. The Consumer Group’s gross profit decreased $28.5 million for 2011 over 2010 due primarily to the elimination of a portion of a paint program at a large retail customer. As a percent of sales, Consumer Group’s gross profit decreased primarily due to increasing raw material costs partially offset by selling price increases and good cost control. The Global Finishes Group’s gross profit for 2011 increased $109.8 million and decreased as a percent of sales. Acquisitions, selling price increases, increased sales volumes, and favorable foreign currency translation exchange rate changes increased the gross profit dollars. Increasing raw material costs and the dilutive impact of acquisitions partially offset by selling price increases and increased paint volume decreased gross profit as a percent of sales. Acquisitions increased Global Finishes Group’s gross profit by $79.5 million, or 27.1 percent of acquisition net sales, and foreign currency translation rate fluctuations increased gross profit by $7.2 million for 2011. The Latin America Coatings Group’s gross profit for 2011 increased $48.1 million and decreased as a percent of sales. Acquisitions, selling price increases, increased sales volumes, and favorable foreign currency translation exchange rate changes increased the gross profit dollars. Increasing raw material costs and the dilutive impact of acquisitions partially offset by selling price increases and increased paint volume decreased gross profit as a percent of sales. Acquisitions increased Latin America Coatings Group’s gross profit by $15.2 million, or 25.7 percent of acquisition net
sales, and foreign currency translation rate fluctuations increased gross profit by $7.2 million for 2011. The Administrative seg-ment’s gross profit increased by an insignificant amount.
SG&A increased by $232.7 million due primarily to acquisitions and increased expenses to support higher sales levels in the Paint Stores, Global Finishes and Latin America Coatings Groups. Acquisitions added $95.8 million of SG&A in 2011, representing 27.2 percent of acquisition net sales. SG&A decreased as a percent of sales to 33.8 percent in 2011 from 35.1 percent in 2010. In the Paint Stores Group, SG&A increased $103.0 million for the year due primarily to increased spending due to the number of new store openings and increased expenses to maintain customer service. The Consumer Group’s SG&A decreased by $3.1 million for the year due to good expense control. The Global Finishes Group’s SG&A increased by $85.2 million for the year relating primarily to acquisitions SG&A of $82.1 million, or 28.0 percent of acquisition net sales, and foreign currency translation rate fluctuations of $5.7 million. The Latin America Coatings Group’s SG&A increased by $31.0 million for the year relating primarily to acquisitions SG&A of $13.7 million, or 23.2 percent of acquisition net sales, foreign currency transla-tion rate fluctuations of $5.5 million and increased expenses to support higher sales levels. The Administrative segment’s SG&A increased $16.6 million primarily due to an increase in stock-based compensation expense and information systems costs to integrate the 2010 acquisitions. See Note 12, on pages 69 and 70 of this report, for more information concerning stock-based compensation.
Other general expense - net decreased $1.1 million in 2011 compared to 2010. The decrease was mainly caused by a decrease of $2.3 million in the Administrative segment, primarily due to an increase of $4.2 million in the gain on sale of assets partially offset by an increase in provisions for environmental matters of $2.0 million. In addition, Other general expense - net in the Consumer Group had lower income adjustments associ-ated with exit or disposal activities of $3.1 million as compared to 2010, while insignificant changes occurred in Other general expense - net of the remaining Reportable Segments. See Note 13, on page 71 of this report, for more information concerning Other general expense - net.
Impairments of trademarks increased $1.0 million in 2011 compared to 2010. As required by the Goodwill and Other Intangibles Topic of the ASC, management performed an annual impairment test of goodwill and indefinite-lived intangible assets as of October 1, 2011. The impairment test in 2011 resulted in no impairment of goodwill and an impairment of $5.5 million of several indefinite-lived trademarks primarily in the Paint Stores Group. There were no material changes in goodwill and indef-inite-lived intangible assets carrying values in 2010. However, reductions in the carrying value of $4.5 million were recorded for
35161_Financials_Wt.indd 38 2/21/13 3:10 PM
■ 39■ 39
MANAGEMENT’S DISCUSSION AND ANALYSIS OF FINANCIAL CONDITION AND RESULTS OF OPERATIONS
definite-lived intangible assets whose undiscounted cash flows were lower than the assets carrying values in the Global Finishes Group. The impairment charges are shown as a separate line in the Statements of consolidated income in accordance with the Goodwill and Other Intangibles Topic of the ASC. See Note 4, on pages 52 and 53 of this report, for more information concerning the impairment of intangible assets.
Interest expense, included in the Administrative segment, decreased $28.1 million in 2011 versus 2010 due primarily to costs related to the repurchase of a majority of the Company’s 7.45% Debentures in 2010.
Other income - net fluctuated to $4.8 million income from $0.8 million income in 2010. Increased income from other miscellaneous income and expense items of $6.5 million, primarily in the Administrative segment, was partially offset by unfavorable foreign currency related transaction losses of $4.7 million, primarily in the Global Finishes and Latin America Coatings Groups. See Note 13, on page 71 of this report, for more information concerning Other income - net.
Consolidated Income before income taxes in 2011 increased $63.8 million due primarily to an increase in gross profit of $263.5 million and a reduction of $34.0 million in interest expense, interest and net investment income and other expenses, partially offset by an increase in SG&A of $232.7 million and an increase in trademark impairment charges of $1.0 million. Income before income taxes increased $26.2 million in the Paint Stores Group, $25.6 million in the Global Finishes Group and $16.5 million in the Latin America Coatings Group and decreased $30.3 million in the Consumer Group when compared to 2010. The Administrative segment had a favorable impact on
Income before income taxes of $25.8 million when compared to 2010. Segment profit of all consolidated foreign subsidiaries increased 40.8 percent to $122.4 million for 2011 versus $87.0 million for 2010 due primarily to an increase in gross profit of $152.2 million partially offset by an increase in SG&A of $121.6 million. Favorable foreign currency translation rates, partially offset by acquisitions, increased segment profit of all consolidated foreign subsidiaries by 1.2 percent. Segment profit of all operations other than consolidated foreign subsidiaries increased 4.8 percent to $619.1 million for 2011 versus $590.8 million for 2010.
Net income decreased $20.6 million in 2011 due to the impact of the IRS Settlement partially offset by the increase in Income before income taxes.
The effective income tax rate for 2011 was 40.4 percent, including an increase in income tax expense of $75.0 million relating to the IRS Settlement. Excluding the impact of the IRS Settlement would results in an effective income tax rate for 2011 of 30.3 percent. The effective income tax rate for 2010 was 31.8 percent, including a one-time increase in income tax expense of $11.4 million relating to the Patient Protection and Affordable Care Act and the Health Care and Education Reconciliation Act of 2010 (the “Acts”). Diluted net income per common share, including charges relating to the IRS Settlement ($.70 per share) and dilution from acquisitions ($.04 per share) both in 2011, decreased 1.7 percent to $4.14 per share for 2011 from $4.21 per share a year ago, which included charges relating to the Acts ($.10 per share), repurchase of a majority of the Company’s 7.45% debentures ($.12 per share), and dilution from acquisi-tions ($.10 per share).
35161_Financials_Wt.indd 39 2/21/13 3:10 PM
■ 40
ShareholdersThe Sherwin-Williams Company
We are responsible for establishing and maintaining adequate internal control over financial reporting as defined in Rules 13a-15(f) and 15d-15(f) under the Securities Exchange Act of 1934, as amended. We recognize that internal control over financial report-ing cannot provide absolute assurance of achieving financial reporting objectives because of its inherent limitations. Internal control over financial reporting is a process that involves human diligence and is subject to the possibility of human error or the circumvention or the overriding of internal control. Therefore, there is a risk that material misstatements may not be prevented or detected on a timely basis by internal control over financial reporting. However, we believe we have designed into the process safeguards to reduce, though not eliminate, this risk. Projections of any evaluation of effectiveness to future periods are subject to the risk that controls may become inadequate because of changes in conditions, or that the degree of compliance with the policies or procedures may deteriorate.
In order to ensure that the Company’s internal control over financial reporting was effective as of December 31, 2012, we conducted an assessment of its effectiveness under the supervision and with the participation of our management group, including our principal executive officer and principal financial officer. This assessment was based on criteria established in Internal Control – Integrated Framework issued by the Committee of Sponsoring Organizations of the Treadway Commission.
Based on our assessment of internal control over financial reporting under the criteria established in Internal Control – Integrated Framework, we have concluded that, as of December 31, 2012, the Company’s internal control over financial reporting was effec-tive to provide reasonable assurance regarding the reliability of financial reporting and the preparation of financial statements for external purposes in accordance with U.S. generally accepted accounting principles. Our internal control over financial reporting as of December 31, 2012 has been audited by Ernst & Young LLP, an independent registered public accounting firm, and their report on the effectiveness of our internal control over financial reporting is included on page 41 of this report.
C. M. ConnorChairman and Chief Executive Officer
S. P. HennessySenior Vice President - Finance and Chief Financial Officer
A. J. MistysynVice President - Corporate ControllerA. J. Mistysyn
REPORT OF MANAGEMENT ON INTERNAL CONTROLOVER FINANCIAL REPORTING
S. P. Hennessy
35161_Financials_Wt.indd 40 2/21/13 3:10 PM
■ 41
Shareholders and Board of DirectorsThe Sherwin-Williams Company
We have audited The Sherwin-Williams Company’s internal control over financial reporting as of December 31, 2012, based on criteria established in Internal Control – Integrated Framework issued by the Committee of Sponsoring Organizations of the Treadway Commission (the COSO criteria). The Sherwin-Williams Company’s management is responsible for maintaining effective internal control over financial reporting, and for its assessment of the effectiveness of internal control over financial reporting included in the accompanying Report of Management on Internal Control over Financial Reporting. Our responsibility is to express an opinion on the company’s internal control over financial reporting based on our audit.
We conducted our audit in accordance with the standards of the Public Company Accounting Oversight Board (United States). Those standards require that we plan and perform the audit to obtain reasonable assurance about whether effective internal control over financial reporting was maintained in all material respects. Our audit included obtaining an understanding of internal control over financial reporting, assessing the risk that a material weakness exists, testing and evaluating the design and operating effectiveness of internal control based on the assessed risk, and performing such other procedures as we considered necessary in the circumstances. We believe that our audit provides a reasonable basis for our opinion.
A company’s internal control over financial reporting is a process designed to provide reasonable assurance regarding the reli-ability of financial reporting and the preparation of financial statements for external purposes in accordance with generally accepted accounting principles. A company’s internal control over financial reporting includes those policies and procedures that (1) pertain to the maintenance of records that, in reasonable detail, accurately and fairly reflect the transactions and dispositions of the assets of the company; (2) provide reasonable assurance that transactions are recorded as necessary to permit preparation of financial statements in accordance with generally accepted accounting principles, and that receipts and expenditures of the company are being made only in accordance with authorizations of management and directors of the company; and (3) provide reasonable assurance regarding prevention or timely detection of unauthorized acquisition, use, or disposition of the company’s assets that could have a material effect on the financial statements.
Because of its inherent limitations, internal control over financial reporting may not prevent or detect misstatements. Also, projections of any evaluation of effectiveness to future periods are subject to the risk that controls may become inadequate because of changes in conditions, or that the degree of compliance with the policies or procedures may deteriorate.
In our opinion, The Sherwin-Williams Company maintained, in all material respects, effective internal control over financial reporting as of December 31, 2012, based on the COSO criteria.
We also have audited, in accordance with the standards of the Public Company Accounting Oversight Board (United States), the consolidated balance sheets of The Sherwin-Williams Company as of December 31, 2012, 2011 and 2010, and the related statements of consolidated income and comprehensive income, cash flows and shareholders’ equity for the years then ended and our report dated February 28, 2013 expressed an unqualified opinion thereon.
Cleveland, OhioFebruary 28, 2013
REPORT OF THE INDEPENDENT REGISTERED PUBLIC ACCOUNTING FIRMON INTERNAL CONTROL OVER FINANCIAL REPORTING
Cleveland, Ohio
35161_Financials_Wt.indd 41 2/21/13 3:10 PM
■ 42
ShareholdersThe Sherwin-Williams Company
We are responsible for the preparation and fair presentation of the consolidated financial statements, accompanying notes and related financial information included in this report of The Sherwin-Williams Company and its consolidated subsidiaries (collectively, the “Company”) as of December 31, 2012, 2011 and 2010 and for the years then ended in accordance with U.S. generally accepted accounting principles. The consolidated financial information included in this report contains certain amounts that were based upon our best estimates, judgments and assumptions that we believe were reasonable under the circumstances.
We have conducted an assessment of the effectiveness of internal control over financial reporting based on criteria established in Internal Control – Integrated Framework issued by the Committee of Sponsoring Organizations of the Treadway Commission. As discussed in the Report of Management on Internal Control Over Financial Reporting on page 40 of this report, we concluded that the Company’s internal control over financial reporting was effective as of December 31, 2012.
The Board of Directors pursues its responsibility for the oversight of the Company’s accounting policies and procedures, financial statement preparation and internal control over financial reporting through the Audit Committee, comprised exclusively of inde-pendent directors. The Audit Committee is responsible for the appointment and compensation of the independent registered public accounting firm. The Audit Committee meets at least quarterly with financial management, internal auditors and the independent registered public accounting firm to review the adequacy of financial controls, the effectiveness of the Company’s internal control over financial reporting and the nature, extent and results of the audit effort. Both the internal auditors and the independent registered public accounting firm have private and confidential access to the Audit Committee at all times.
We believe that the consolidated financial statements, accompanying notes and related financial information included in this report fairly reflect the form and substance of all material financial transactions and fairly present, in all material respects, the consolidated financial position, results of operations and cash flows as of and for the periods presented.
C. M. ConnorChairman and Chief Executive Officer
S. P. HennessySenior Vice President - Finance and Chief Financial Officer
A. J. MistysynVice President - Corporate Controller
S. P. Hennessy
A. J. Mistysyn
REPORT OF MANAGEMENT ON THECONSOLIDATED FINANCIAL STATEMENTS
35161_Financials_Wt.indd 42 2/21/13 3:10 PM
■ 43
Shareholders and Board of DirectorsThe Sherwin-Williams Company
We have audited the accompanying consolidated balance sheets of The Sherwin-Williams Company as of December 31, 2012, 2011 and 2010, and the related statements of consolidated income and comprehensive income, cash flows and shareholders’ equity for the years then ended. These financial statements are the responsibility of the Company’s management. Our responsibility is to express an opinion on these financial statements based on our audits.
We conducted our audits in accordance with the standards of the Public Company Accounting Oversight Board (United States). Those standards require that we plan and perform the audit to obtain reasonable assurance about whether the financial statements are free of material misstatement. An audit includes examining, on a test basis, evidence supporting the amounts and disclosures in the financial statements. An audit also includes assessing the accounting principles used and significant estimates made by management, as well as evaluating the overall financial statement presentation. We believe that our audits provide a reasonable basis for our opinion.
In our opinion, the financial statements referred to above present fairly, in all material respects, the consolidated financial position of The Sherwin-Williams Company at December 31, 2012, 2011 and 2010, and the consolidated results of its operations and its cash flows for the years then ended, in conformity with U.S. generally accepted accounting principles.
We also have audited, in accordance with the standards of the Public Company Accounting Oversight Board (United States), The Sherwin-Williams Company’s internal control over financial reporting as of December 31, 2012, based on criteria established in Internal Control-Integrated Framework issued by the Committee of Sponsoring Organizations of the Treadway Commission and our report dated February 28, 2013 expressed an unqualified opinion thereon.
Cleveland, OhioFebruary 28, 2013
REPORT OF THE INDEPENDENT REGISTERED PUBLIC ACCOUNTING FIRMON THE CONSOLIDATED FINANCIAL STATEMENTS
Cleveland, Ohio
35161_Financials_Wt.indd 43 2/21/13 3:10 PM
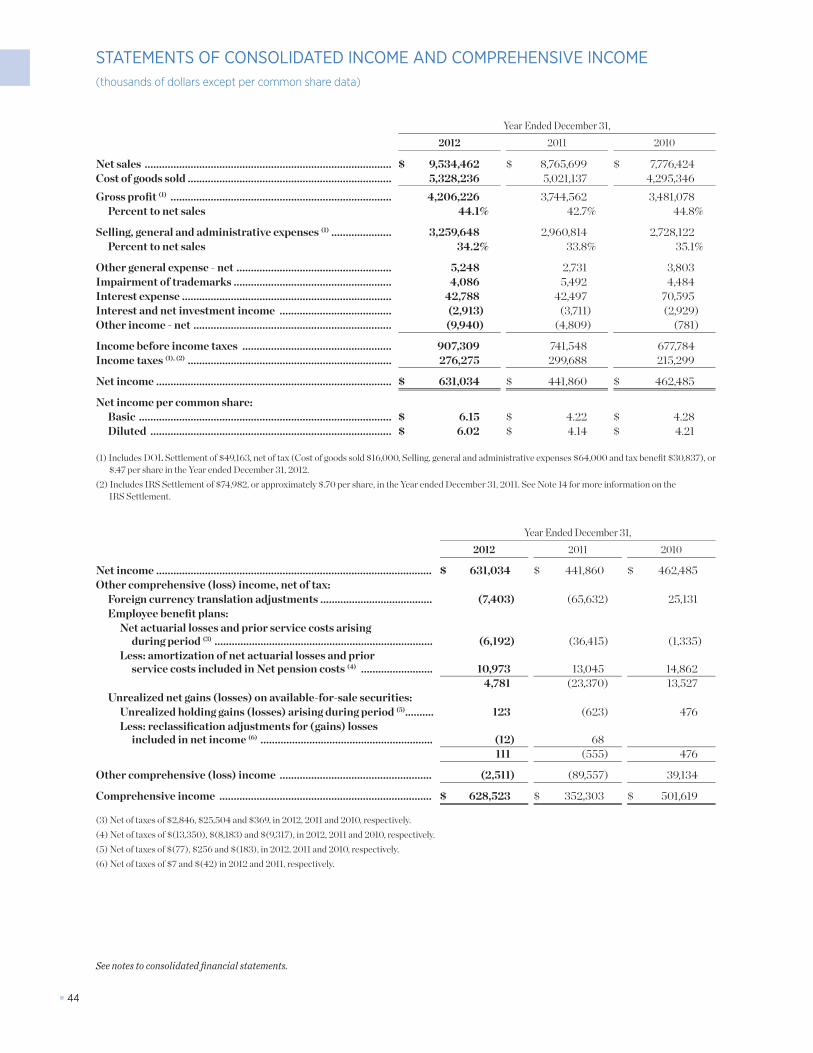
■ 44
STATEMENTS OF CONSOLIDATED INCOME AND COMPREHENSIVE INCOME(thousands of dollars except per common share data)
Year Ended December 31,2012 2011 2010
Net sales ...................................................................................... $ 9,534,462 $ 8,765,699 $ 7,776,424Cost of goods sold ....................................................................... 5,328,236 5,021,137 4,295,346Gross profit (1) ............................................................................. 4,206,226 3,744,562 3,481,078
Percent to net sales 44.1% 42.7% 44.8%
Selling, general and administrative expenses (1) ..................... 3,259,648 2,960,814 2,728,122Percent to net sales 34.2% 33.8% 35.1%
Other general expense - net ...................................................... 5,248 2,731 3,803Impairment of trademarks ....................................................... 4,086 5,492 4,484Interest expense ......................................................................... 42,788 42,497 70,595Interest and net investment income ....................................... (2,913) (3,711) (2,929)Other income - net ..................................................................... (9,940) (4,809) (781)
Income before income taxes .................................................... 907,309 741,548 677,784Income taxes (1), (2) ....................................................................... 276,275 299,688 215,299
Net income .................................................................................. $ 631,034 $ 441,860 $ 462,485
Net income per common share:Basic ........................................................................................ $ 6.15 $ 4.22 $ 4.28Diluted .................................................................................... $ 6.02 $ 4.14 $ 4.21
(1) Includes DOL Settlement of $49,163, net of tax (Cost of goods sold $16,000, Selling, general and administrative expenses $64,000 and tax benefit $30,837), or $.47 per share in the Year ended December 31, 2012.
(2) Includes IRS Settlement of $74,982, or approximately $.70 per share, in the Year ended December 31, 2011. See Note 14 for more information on the IRS Settlement.
Year Ended December 31,2012 2011 2010
Net income ................................................................................................ $ 631,034 $ 441,860 $ 462,485Other comprehensive (loss) income, net of tax:
Foreign currency translation adjustments ....................................... (7,403) (65,632) 25,131Employee benefit plans:
Net actuarial losses and prior service costs arising during period (3) ............................................................................ (6,192) (36,415) (1,335)
Less: amortization of net actuarial losses and prior service costs included in Net pension costs (4) ......................... 10,973 13,045 14,862
4,781 (23,370) 13,527Unrealized net gains (losses) on available-for-sale securities:
Unrealized holding gains (losses) arising during period (5).......... 123 (623) 476Less: reclassification adjustments for (gains) losses
included in net income (6) ............................................................ (12) 68 111 (555) 476
Other comprehensive (loss) income ..................................................... (2,511) (89,557) 39,134
Comprehensive income .......................................................................... $ 628,523 $ 352,303 $ 501,619
(3) Net of taxes of $2,846, $25,504 and $369, in 2012, 2011 and 2010, respectively.(4) Net of taxes of $(13,350), $(8,183) and $(9,317), in 2012, 2011 and 2010, respectively.(5) Net of taxes of $(77), $256 and $(183), in 2012, 2011 and 2010, respectively.(6) Net of taxes of $7 and $(42) in 2012 and 2011, respectively.
See notes to consolidated financial statements.
35161_Financials_Wt.indd 44 2/21/13 3:10 PM
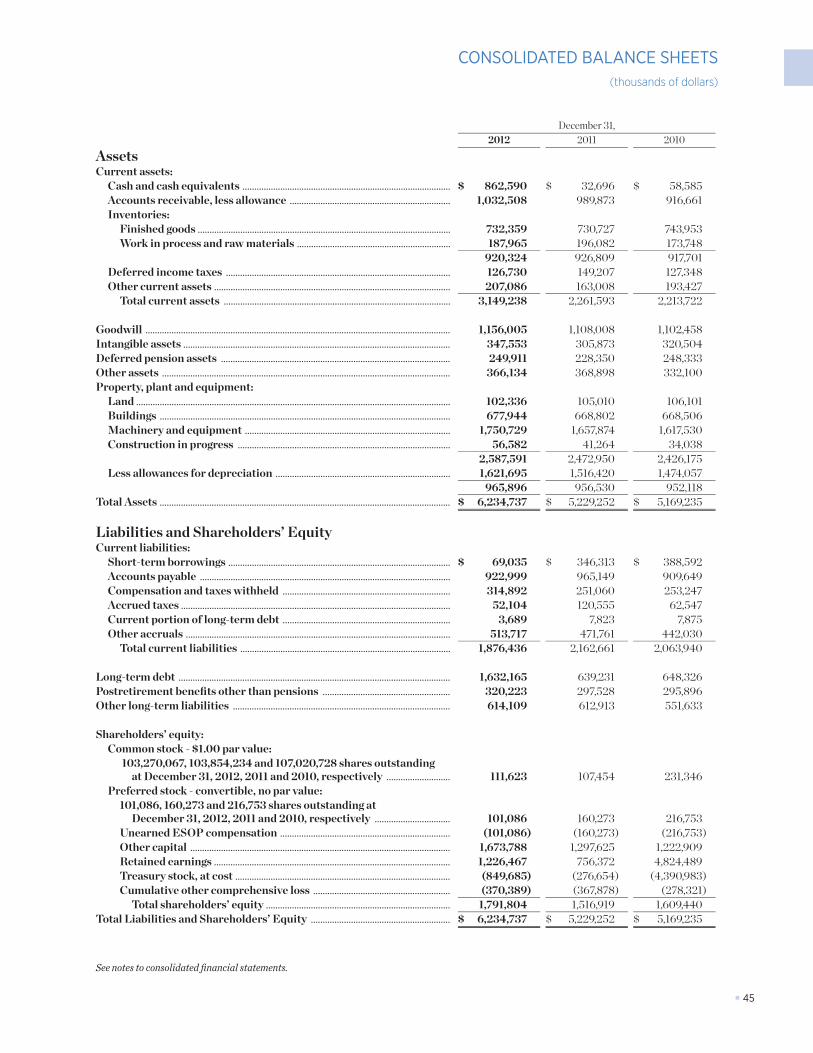
■ 45
CONSOLIDATED BALANCE SHEETS(thousands of dollars)
December 31,2012 2011 2010
AssetsCurrent assets:
Cash and cash equivalents ........................................................................................ $ 862,590 $ 32,696 $ 58,585Accounts receivable, less allowance .................................................................... 1,032,508 989,873 916,661Inventories:
Finished goods ........................................................................................................... 732,359 730,727 743,953Work in process and raw materials ................................................................. 187,965 196,082 173,748
920,324 926,809 917,701Deferred income taxes ............................................................................................... 126,730 149,207 127,348Other current assets .................................................................................................... 207,086 163,008 193,427
Total current assets ................................................................................................ 3,149,238 2,261,593 2,213,722
Goodwill ................................................................................................................................. 1,156,005 1,108,008 1,102,458Intangible assets ................................................................................................................. 347,553 305,873 320,504Deferred pension assets ................................................................................................. 249,911 228,350 248,333Other assets .......................................................................................................................... 366,134 368,898 332,100Property, plant and equipment:
Land ..................................................................................................................................... 102,336 105,010 106,101Buildings ........................................................................................................................... 677,944 668,802 668,506Machinery and equipment ....................................................................................... 1,750,729 1,657,874 1,617,530Construction in progress .......................................................................................... 56,582 41,264 34,038
2,587,591 2,472,950 2,426,175Less allowances for depreciation .......................................................................... 1,621,695 1,516,420 1,474,057
965,896 956,530 952,118Total Assets ........................................................................................................................... $ 6,234,737 $ 5,229,252 $ 5,169,235
Liabilities and Shareholders’ EquityCurrent liabilities:
Short-term borrowings .............................................................................................. $ 69,035 $ 346,313 $ 388,592Accounts payable .......................................................................................................... 922,999 965,149 909,649Compensation and taxes withheld ....................................................................... 314,892 251,060 253,247Accrued taxes .................................................................................................................. 52,104 120,555 62,547Current portion of long-term debt ....................................................................... 3,689 7,823 7,875Other accruals ................................................................................................................ 513,717 471,761 442,030
Total current liabilities ......................................................................................... 1,876,436 2,162,661 2,063,940
Long-term debt ................................................................................................................... 1,632,165 639,231 648,326Postretirement benefits other than pensions ...................................................... 320,223 297,528 295,896Other long-term liabilities ............................................................................................ 614,109 612,913 551,633
Shareholders’ equity:Common stock - $1.00 par value:
103,270,067, 103,854,234 and 107,020,728 shares outstanding at December 31, 2012, 2011 and 2010, respectively ........................... 111,623 107,454 231,346
Preferred stock - convertible, no par value: 101,086, 160,273 and 216,753 shares outstanding at
December 31, 2012, 2011 and 2010, respectively ................................ 101,086 160,273 216,753Unearned ESOP compensation ........................................................................ (101,086) (160,273) (216,753)Other capital .............................................................................................................. 1,673,788 1,297,625 1,222,909Retained earnings .................................................................................................... 1,226,467 756,372 4,824,489Treasury stock, at cost ........................................................................................... (849,685) (276,654) (4,390,983)Cumulative other comprehensive loss .......................................................... (370,389) (367,878) (278,321)
Total shareholders’ equity .............................................................................. 1,791,804 1,516,919 1,609,440Total Liabilities and Shareholders’ Equity ........................................................... $ 6,234,737 $ 5,229,252 $ 5,169,235
See notes to consolidated financial statements.
35161_Financials_Wt.indd 45 2/25/13 11:53 AM
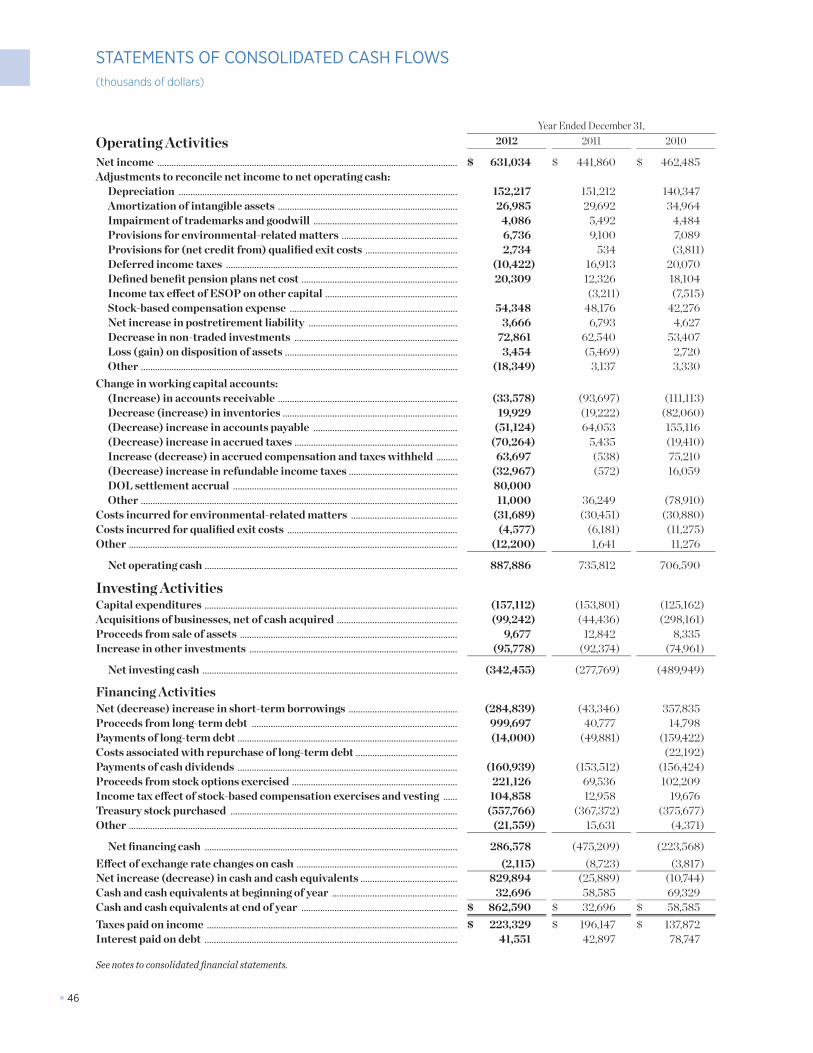
■ 46
STATEMENTS OF CONSOLIDATED CASH FLOWS(thousands of dollars)
Year Ended December 31,
Operating Activities 2012 2011 2010
Net income ............................................................................................................................... $ 631,034 $ 441,860 $ 462,485Adjustments to reconcile net income to net operating cash:
Depreciation ...................................................................................................................... 152,217 151,212 140,347Amortization of intangible assets ............................................................................ 26,985 29,692 34,964Impairment of trademarks and goodwill ............................................................. 4,086 5,492 4,484Provisions for environmental-related matters ................................................. 6,736 9,100 7,089Provisions for (net credit from) qualified exit costs ....................................... 2,734 534 (3,811)Deferred income taxes .................................................................................................. (10,422) 16,913 20,070Defined benefit pension plans net cost .................................................................. 20,309 12,326 18,104Income tax effect of ESOP on other capital ........................................................ (3,211) (7,515)Stock-based compensation expense ....................................................................... 54,348 48,176 42,276Net increase in postretirement liability ............................................................... 3,666 6,793 4,627Decrease in non-traded investments ..................................................................... 72,861 62,540 53,407Loss (gain) on disposition of assets ......................................................................... 3,454 (5,469) 2,720Other ...................................................................................................................................... (18,349) 3,137 3,330
Change in working capital accounts:(Increase) in accounts receivable ............................................................................ (33,578) (93,697) (111,113)Decrease (increase) in inventories .......................................................................... 19,929 (19,222) (82,060)(Decrease) increase in accounts payable ............................................................. (51,124) 64,053 155,116(Decrease) increase in accrued taxes ..................................................................... (70,264) 5,435 (19,410)Increase (decrease) in accrued compensation and taxes withheld ......... 63,697 (538) 75,210(Decrease) increase in refundable income taxes .............................................. (32,967) (572) 16,059DOL settlement accrual ............................................................................................... 80,000Other ...................................................................................................................................... 11,000 36,249 (78,910)
Costs incurred for environmental-related matters ............................................. (31,689) (30,451) (30,880)Costs incurred for qualified exit costs ........................................................................ (4,577) (6,181) (11,275)Other ........................................................................................................................................... (12,200) 1,641 11,276
Net operating cash ........................................................................................................... 887,886 735,812 706,590
Investing ActivitiesCapital expenditures ........................................................................................................... (157,112) (153,801) (125,162)Acquisitions of businesses, net of cash acquired ................................................... (99,242) (44,436) (298,161)Proceeds from sale of assets ............................................................................................ 9,677 12,842 8,335Increase in other investments ........................................................................................ (95,778) (92,374) (74,961)
Net investing cash ............................................................................................................ (342,455) (277,769) (489,949)
Financing ActivitiesNet (decrease) increase in short-term borrowings .............................................. (284,839) (43,346) 357,835Proceeds from long-term debt ....................................................................................... 999,697 40,777 14,798Payments of long-term debt ............................................................................................. (14,000) (49,881) (159,422)Costs associated with repurchase of long-term debt ........................................... (22,192)Payments of cash dividends ............................................................................................. (160,939) (153,512) (156,424)Proceeds from stock options exercised ...................................................................... 221,126 69,536 102,209Income tax effect of stock-based compensation exercises and vesting ...... 104,858 12,958 19,676Treasury stock purchased ................................................................................................ (557,766) (367,372) (375,677)Other ........................................................................................................................................... (21,559) 15,631 (4,371)
Net financing cash ........................................................................................................... 286,578 (475,209) (223,568)Effect of exchange rate changes on cash .................................................................... (2,115) (8,723) (3,817)Net increase (decrease) in cash and cash equivalents ......................................... 829,894 (25,889) (10,744)Cash and cash equivalents at beginning of year ..................................................... 32,696 58,585 69,329Cash and cash equivalents at end of year .................................................................. $ 862,590 $ 32,696 $ 58,585Taxes paid on income .......................................................................................................... $ 223,329 $ 196,147 $ 137,872Interest paid on debt ........................................................................................................... 41,551 42,897 78,747
See notes to consolidated financial statements.
35161_Financials_Wt.indd 46 2/21/13 3:10 PM
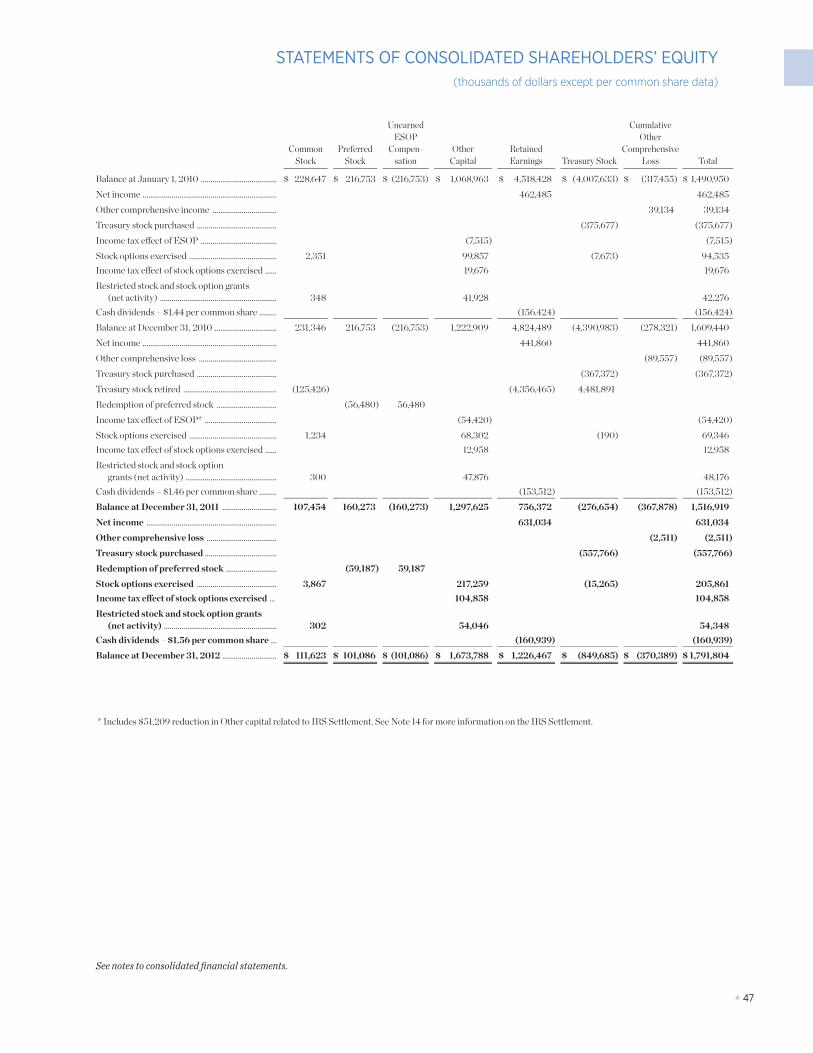
■ 47
STATEMENTS OF CONSOLIDATED SHAREHOLDERS’ EQUITY(thousands of dollars except per common share data)
Common Stock
Preferred Stock
Unearned ESOP
Compen-sation
Other Capital
Retained Earnings Treasury Stock Total
Balance at January 1, 2010 ....................................... $ 228,647 $ 216,753 $ (216,753) $ 1,068,963 $ 4,518,428 $ (4,007,633) $ (317,455) $ 1,490,950Net income ..................................................................... 462,485 462,485Other comprehensive income ................................. 39,134 39,134Treasury stock purchased ......................................... (375,677) (375,677)Income tax effect of ESOP ....................................... (7,515) (7,515)Stock options exercised ............................................. 2,351 99,857 (7,673) 94,535Income tax effect of stock options exercised ...... 19,676 19,676Restricted stock and stock option grants
(net activity) ............................................................ 348 41,928 42,276Cash dividends – $1.44 per common share ......... (156,424) (156,424)Balance at December 31, 2010 ................................ 231,346 216,753 (216,753) 1,222,909 4,824,489 (4,390,983) (278,321) 1,609,440Net income ..................................................................... 441,860 441,860Other comprehensive loss ........................................ (89,557) (89,557)Treasury stock purchased ......................................... (367,372) (367,372)Treasury stock retired ................................................ (125,426) (4,356,465) 4,481,891Redemption of preferred stock ............................... (56,480) 56,480Income tax effect of ESOP* ..................................... (54,420) (54,420)Stock options exercised ............................................. 1,234 68,302 (190) 69,346Income tax effect of stock options exercised ...... 12,958 12,958Restricted stock and stock option
grants (net activity) ............................................... 300 47,876 48,176Cash dividends – $1.46 per common share ......... (153,512) (153,512)Balance at December 31, 2011 ............................ 107,454 160,273 (160,273) 1,297,625 756,372 (276,654) (367,878) 1,516,919Net income ................................................................... 631,034 631,034Other comprehensive loss .................................... (2,511) (2,511)Treasury stock purchased ..................................... (557,766) (557,766)Redemption of preferred stock .......................... (59,187) 59,187Stock options exercised ......................................... 3,867 217,259 (15,265) 205,861Income tax effect of stock options exercised ... 104,858 104,858Restricted stock and stock option grants
(net activity) .......................................................... 302 54,046 54,348Cash dividends – $1.56 per common share ... (160,939) (160,939)Balance at December 31, 2012 ............................ $ 111,623 $ 101,086 $ (101,086) $ 1,673,788 $ 1,226,467 $ (849,685) $ (370,389) $ 1,791,804
Cumulative Other
Comprehensive Loss
* Includes $51,209 reduction in Other capital related to IRS Settlement. See Note 14 for more information on the IRS Settlement.
See notes to consolidated financial statements.
35161_Financials_Wt.indd 47 2/21/13 3:10 PM
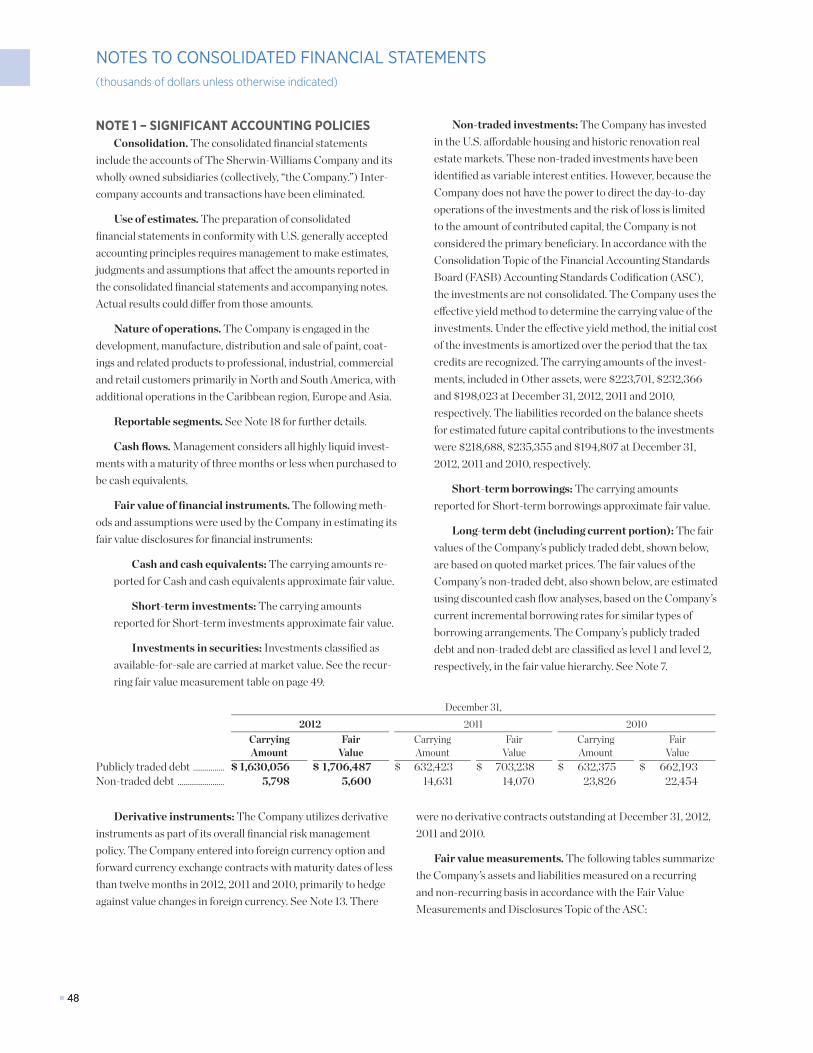
■ 48■ 48
NOTES TO CONSOLIDATED FINANCIAL STATEMENTS(thousands of dollars unless otherwise indicated)
December 31, 2012 2011 2010
Carrying Amount
Fair Value
Carrying Amount
Fair Value
Carrying Amount
Fair Value
Publicly traded debt ................ $ 1,630,056 $ 1,706,487 $ 632,423 $ 703,238 $ 632,375 $ 662,193Non-traded debt ........................ 5,798 5,600 14,631 14,070 23,826 22,454
Derivative instruments: The Company utilizes derivative instruments as part of its overall financial risk management policy. The Company entered into foreign currency option and forward currency exchange contracts with maturity dates of less than twelve months in 2012, 2011 and 2010, primarily to hedge against value changes in foreign currency. See Note 13. There
were no derivative contracts outstanding at December 31, 2012, 2011 and 2010.
Fair value measurements. The following tables summarize the Company’s assets and liabilities measured on a recurring and non-recurring basis in accordance with the Fair Value Measurements and Disclosures Topic of the ASC:
NOTE 1 – SIGNIFICANT ACCOUNTING POLICIESConsolidation. The consolidated financial statements
include the accounts of The Sherwin-Williams Company and its wholly owned subsidiaries (collectively, “the Company.”) Inter-company accounts and transactions have been eliminated.
Use of estimates. The preparation of consolidated financial statements in conformity with U.S. generally accepted account ing principles requires management to make estimates, judgments and assumptions that affect the amounts reported in the consolidated financial statements and accompanying notes. Actual results could differ from those amounts.
Nature of operations. The Company is engaged in the development, manufacture, distribution and sale of paint, coat-ings and related products to professional, industrial, commercial and retail customers primarily in North and South America, with additional operations in the Caribbean region, Europe and Asia.
Reportable segments. See Note 18 for further details.
Cash flows. Management considers all highly liquid invest-ments with a maturity of three months or less when purchased to be cash equivalents.
Fair value of financial instruments. The following meth-ods and assumptions were used by the Company in estimating its fair value disclosures for financial instruments:
Cash and cash equivalents: The carrying amounts re-ported for Cash and cash equivalents approximate fair value.
Short-term investments: The carrying amounts reported for Short-term investments approximate fair value.
Investments in securities: Investments classified as available-for-sale are carried at market value. See the recur-ring fair value measurement table on page 49.
Non-traded investments: The Company has invested in the U.S. affordable housing and historic renovation real estate markets. These non-traded investments have been identified as variable interest entities. However, because the Company does not have the power to direct the day-to-day operations of the investments and the risk of loss is limited to the amount of contributed capital, the Company is not considered the primary beneficiary. In accordance with the Consolidation Topic of the Financial Accounting Standards Board (FASB) Accounting Standards Codification (ASC), the investments are not consolidated. The Company uses the effective yield method to determine the carrying value of the investments. Under the effective yield method, the initial cost of the investments is amortized over the period that the tax credits are recognized. The carrying amounts of the invest-ments, included in Other assets, were $223,701, $232,366 and $198,023 at December 31, 2012, 2011 and 2010, respectively. The liabilities recorded on the balance sheets for estimated future capital contributions to the investments were $218,688, $235,355 and $194,807 at December 31, 2012, 2011 and 2010, respectively.
Short-term borrowings: The carrying amounts reported for Short-term borrowings approximate fair value.
Long-term debt (including current portion): The fair values of the Company’s publicly traded debt, shown below, are based on quoted market prices. The fair values of the Company’s non-traded debt, also shown below, are estimated using discounted cash flow analyses, based on the Company’s current incremental borrowing rates for similar types of borrowing arrangements. The Company’s publicly traded debt and non-traded debt are classified as level 1 and level 2, respectively, in the fair value hierarchy. See Note 7.
35161_Financials_Wt.indd 48 2/21/13 3:10 PM
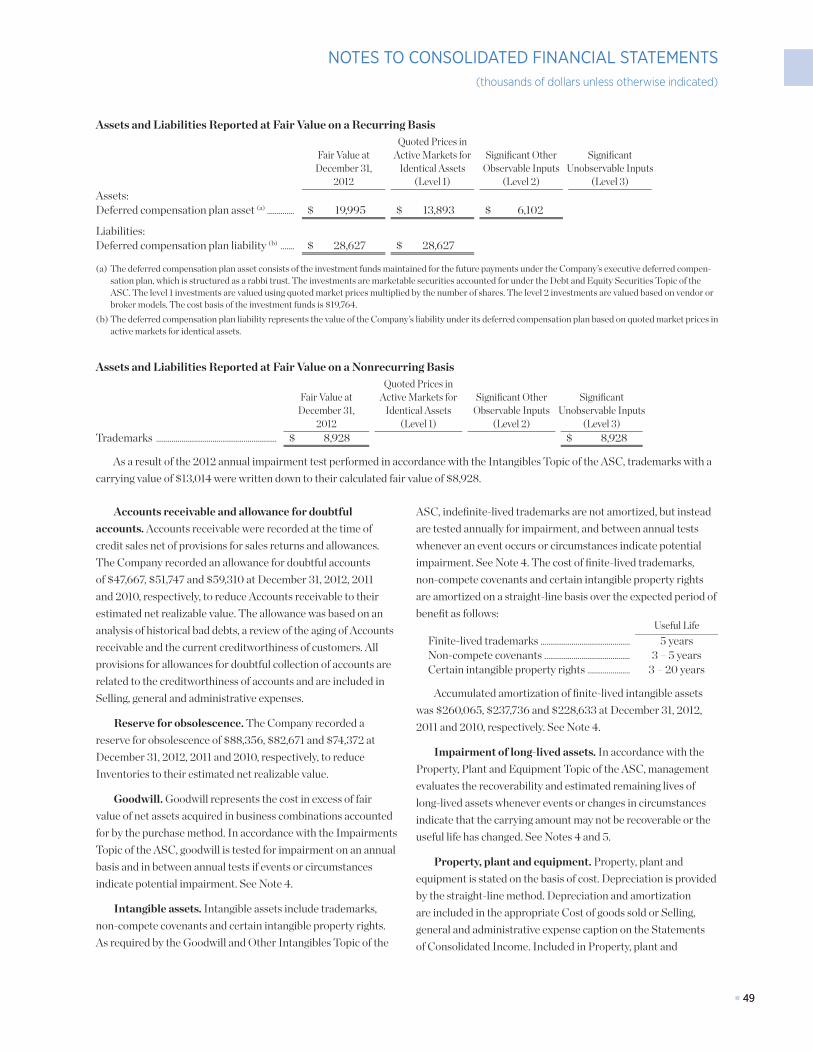
■ 49■ 49
NOTES TO CONSOLIDATED FINANCIAL STATEMENTS(thousands of dollars unless otherwise indicated)
Assets and Liabilities Reported at Fair Value on a Recurring Basis
Fair Value at December 31,
2012
Quoted Prices in Active Markets for
Identical Assets (Level 1)
Significant Other Observable Inputs
(Level 2)
Significant Unobservable Inputs
(Level 3)Assets:Deferred compensation plan asset (a) .............. $ 19,995 $ 13,893 $ 6,102
Liabilities:Deferred compensation plan liability (b) ....... $ 28,627 $ 28,627
(a) The deferred compensation plan asset consists of the investment funds maintained for the future payments under the Company’s executive deferred compen-sation plan, which is structured as a rabbi trust. The investments are marketable securities accounted for under the Debt and Equity Securities Topic of the ASC. The level 1 investments are valued using quoted market prices multiplied by the number of shares. The level 2 investments are valued based on vendor or broker models. The cost basis of the investment funds is $19,764.
(b) The deferred compensation plan liability represents the value of the Company’s liability under its deferred compensation plan based on quoted market prices in active markets for identical assets.
Assets and Liabilities Reported at Fair Value on a Nonrecurring Basis
Fair Value at December 31,
2012
Quoted Prices in Active Markets for
Identical Assets (Level 1)
Significant Other Observable Inputs
(Level 2)
Significant Unobservable Inputs
(Level 3)Trademarks .............................................................. $ 8,928 $ 8,928
As a result of the 2012 annual impairment test performed in accordance with the Intangibles Topic of the ASC, trademarks with a carrying value of $13,014 were written down to their calculated fair value of $8,928.
Accounts receivable and allowance for doubtful accounts. Accounts receivable were recorded at the time of credit sales net of provisions for sales returns and allowances. The Company recorded an allowance for doubtful accounts of $47,667, $51,747 and $59,310 at December 31, 2012, 2011 and 2010, respectively, to reduce Accounts receivable to their estimated net realizable value. The allowance was based on an analysis of historical bad debts, a review of the aging of Accounts receivable and the current creditworthiness of customers. All provisions for allowances for doubtful collection of accounts are related to the creditworthiness of accounts and are included in Selling, general and administrative expenses.
Reserve for obsolescence. The Company recorded a reserve for obsolescence of $88,356, $82,671 and $74,372 at December 31, 2012, 2011 and 2010, respectively, to reduce Inventories to their estimated net realizable value.
Goodwill. Goodwill represents the cost in excess of fair value of net assets acquired in business combinations accounted for by the purchase method. In accordance with the Impairments Topic of the ASC, goodwill is tested for impairment on an annual basis and in between annual tests if events or circumstances indicate potential impairment. See Note 4.
Intangible assets. Intangible assets include trademarks, non-compete covenants and certain intangible property rights. As required by the Goodwill and Other Intangibles Topic of the
ASC, indefinite-lived trademarks are not amortized, but instead are tested annually for impairment, and between annual tests whenever an event occurs or circumstances indicate potential impairment. See Note 4. The cost of finite-lived trademarks, non-compete covenants and certain intangible property rights are amortized on a straight-line basis over the expected period of benefit as follows:
Useful LifeFinite-lived trademarks .............................................. 5 yearsNon-compete covenants ............................................ 3 – 5 yearsCertain intangible property rights ...................... 3 – 20 years
Accumulated amortization of finite-lived intangible assets was $260,065, $237,736 and $228,633 at December 31, 2012, 2011 and 2010, respectively. See Note 4.
Impairment of long-lived assets. In accordance with the Property, Plant and Equipment Topic of the ASC, management evaluates the recoverability and estimated remaining lives of long-lived assets whenever events or changes in circumstances indicate that the carrying amount may not be recoverable or the useful life has changed. See Notes 4 and 5.
Property, plant and equipment. Property, plant and equipment is stated on the basis of cost. Depreciation is provided by the straight-line method. Depreciation and amortization are included in the appropriate Cost of goods sold or Selling, general and administrative expense caption on the Statements of Consolidated Income. Included in Property, plant and
35161_Financials1_Wt.indd 49 2/25/13 10:19 AM
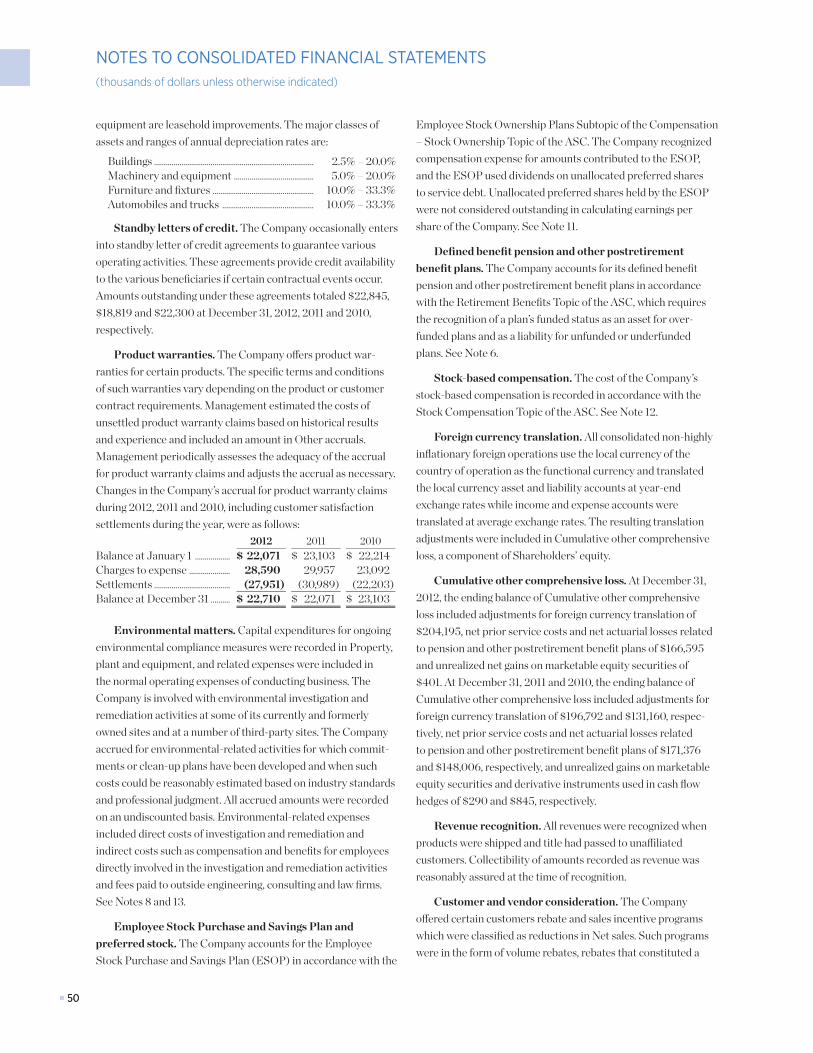
■ 50■ 50
NOTES TO CONSOLIDATED FINANCIAL STATEMENTS(thousands of dollars unless otherwise indicated)
equipment are leasehold improvements. The major classes of assets and ranges of annual depreciation rates are:
Buildings .................................................................................. 2.5% – 20.0%Machinery and equipment ......................................... 5.0% – 20.0%Furniture and fixtures .................................................... 10.0% – 33.3%Automobiles and trucks ............................................... 10.0% – 33.3%
Standby letters of credit. The Company occasionally enters into standby letter of credit agreements to guarantee various operating activities. These agreements provide credit availability to the various beneficiaries if certain contractual events occur. Amounts outstanding under these agreements totaled $22,845, $18,819 and $22,300 at December 31, 2012, 2011 and 2010, respectively.
Product warranties. The Company offers product war-ranties for certain products. The specific terms and conditions of such warranties vary depending on the product or customer contract requirements. Management estimated the costs of unsettled product warranty claims based on historical results and experience and included an amount in Other accruals. Management periodically assesses the adequacy of the accrual for product warranty claims and adjusts the accrual as necessary. Changes in the Company’s accrual for product warranty claims during 2012, 2011 and 2010, including customer satisfaction settlements during the year, were as follows:
2012 2011 2010Balance at January 1 .................. $ 22,071 $ 23,103 $ 22,214Charges to expense ..................... 28,590 29,957 23,092Settlements ....................................... (27,951) (30,989) (22,203)Balance at December 31 .......... $ 22,710 $ 22,071 $ 23,103
Environmental matters. Capital expenditures for ongoing environmental compliance measures were recorded in Property, plant and equipment, and related expenses were included in the normal operating expenses of conducting business. The Company is involved with environmental investigation and remediation activities at some of its currently and formerly owned sites and at a number of third-party sites. The Company accrued for environmental-related activities for which commit-ments or clean-up plans have been developed and when such costs could be reasonably estimated based on industry standards and professional judgment. All accrued amounts were recorded on an undiscounted basis. Environmental-related expenses included direct costs of investigation and remediation and indirect costs such as compensation and benefits for employees directly involved in the investigation and remediation activities and fees paid to outside engineering, consulting and law firms. See Notes 8 and 13.
Employee Stock Purchase and Savings Plan and preferred stock. The Company accounts for the Employee Stock Purchase and Savings Plan (ESOP) in accordance with the
Employee Stock Ownership Plans Subtopic of the Compensation – Stock Ownership Topic of the ASC. The Company recognized compensation expense for amounts contributed to the ESOP, and the ESOP used dividends on unallocated preferred shares to service debt. Unallocated preferred shares held by the ESOP were not considered outstanding in calculating earnings per share of the Company. See Note 11.
Defined benefit pension and other postretirement benefit plans. The Company accounts for its defined benefit pension and other postretirement benefit plans in accordance with the Retirement Benefits Topic of the ASC, which requires the recognition of a plan’s funded status as an asset for over-funded plans and as a liability for unfunded or underfunded plans. See Note 6.
Stock-based compensation. The cost of the Company’s stock-based compensation is recorded in accordance with the Stock Compensation Topic of the ASC. See Note 12.
Foreign currency translation. All consolidated non-highly inflationary foreign operations use the local currency of the country of operation as the functional currency and translated the local currency asset and liability accounts at year-end exchange rates while income and expense accounts were translated at average exchange rates. The resulting translation adjustments were included in Cumulative other comprehensive loss, a component of Shareholders’ equity.
Cumulative other comprehensive loss. At December 31, 2012, the ending balance of Cumulative other comprehensive loss included adjustments for foreign currency translation of $204,195, net prior service costs and net actuarial losses related to pension and other postretirement benefit plans of $166,595 and unrealized net gains on marketable equity securities of $401. At December 31, 2011 and 2010, the ending balance of Cumulative other comprehensive loss included adjustments for foreign currency translation of $196,792 and $131,160, respec-tively, net prior service costs and net actuarial losses related to pension and other postretirement benefit plans of $171,376 and $148,006, respectively, and unrealized gains on marketable equity securities and derivative instruments used in cash flow hedges of $290 and $845, respectively.
Revenue recognition. All revenues were recognized when products were shipped and title had passed to unaffiliated customers. Collectibility of amounts recorded as revenue was reasonably assured at the time of recognition.
Customer and vendor consideration. The Company offered certain customers rebate and sales incentive programs which were classified as reductions in Net sales. Such programs were in the form of volume rebates, rebates that constituted a
35161_Financials_Wt.indd 50 2/21/13 3:10 PM
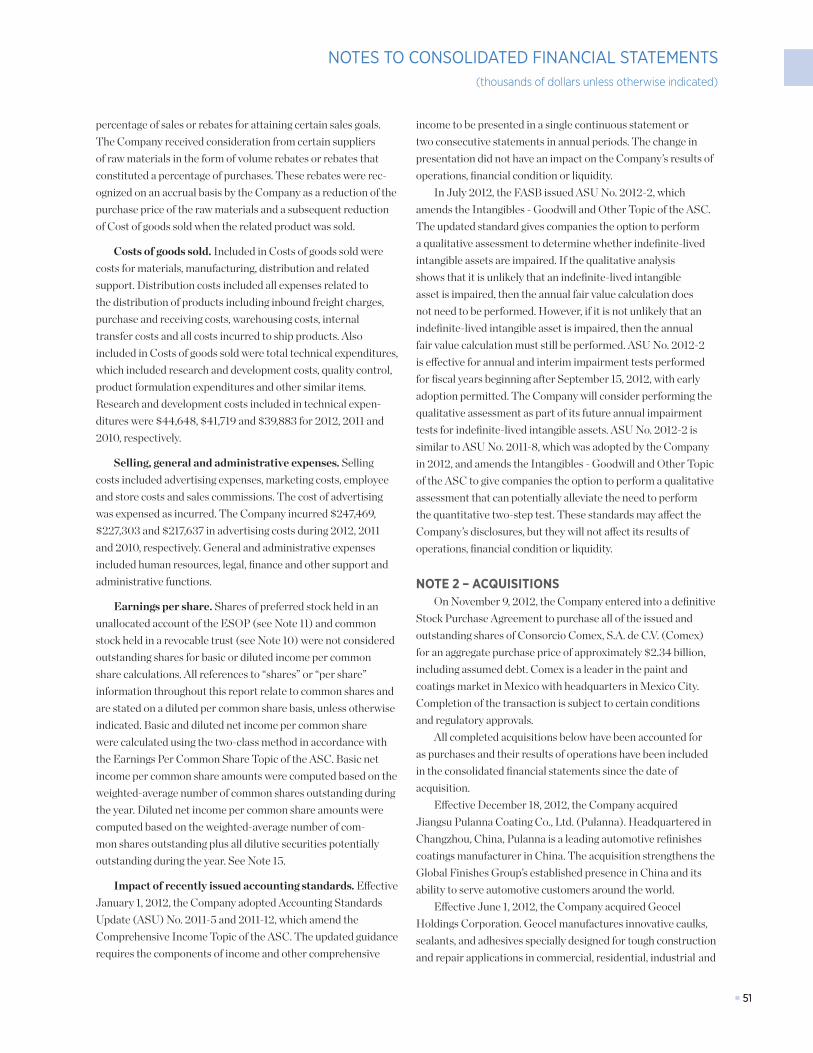
■ 51■ 51
NOTES TO CONSOLIDATED FINANCIAL STATEMENTS(thousands of dollars unless otherwise indicated)
percentage of sales or rebates for attaining certain sales goals. The Company received consideration from certain suppliers of raw materials in the form of volume rebates or rebates that constituted a percentage of purchases. These rebates were rec-ognized on an accrual basis by the Company as a reduction of the purchase price of the raw materials and a subsequent reduction of Cost of goods sold when the related product was sold.
Costs of goods sold. Included in Costs of goods sold were costs for materials, manufacturing, distribution and related support. Distribution costs included all expenses related to the distribution of products including inbound freight charges, purchase and receiving costs, warehousing costs, internal transfer costs and all costs incurred to ship products. Also included in Costs of goods sold were total technical expenditures, which included research and development costs, quality control, product formulation expenditures and other similar items. Research and development costs included in technical expen-ditures were $44,648, $41,719 and $39,883 for 2012, 2011 and 2010, respectively.
Selling, general and administrative expenses. Selling costs included advertising expenses, marketing costs, employee and store costs and sales commissions. The cost of advertising was expensed as incurred. The Company incurred $247,469, $227,303 and $217,637 in advertising costs during 2012, 2011 and 2010, respectively. General and administrative expenses included human resources, legal, finance and other support and administrative functions.
Earnings per share. Shares of preferred stock held in an unallocated account of the ESOP (see Note 11) and common stock held in a revocable trust (see Note 10) were not considered outstanding shares for basic or diluted income per common share calculations. All references to “shares” or “per share” information throughout this report relate to common shares and are stated on a diluted per common share basis, unless otherwise indicated. Basic and diluted net income per common share were calculated using the two-class method in accordance with the Earnings Per Common Share Topic of the ASC. Basic net income per common share amounts were computed based on the weighted-average number of common shares outstanding during the year. Diluted net income per common share amounts were computed based on the weighted-average number of com-mon shares outstanding plus all dilutive securities potentially outstanding during the year. See Note 15.
Impact of recently issued accounting standards. Effective January 1, 2012, the Company adopted Accounting Standards Update (ASU) No. 2011-5 and 2011-12, which amend the Comprehensive Income Topic of the ASC. The updated guidance requires the components of income and other comprehensive
income to be presented in a single continuous statement or two consecutive statements in annual periods. The change in presentation did not have an impact on the Company’s results of operations, financial condition or liquidity.
In July 2012, the FASB issued ASU No. 2012-2, which amends the Intangibles - Goodwill and Other Topic of the ASC. The updated standard gives companies the option to perform a qualitative assessment to determine whether indefinite-lived intangible assets are impaired. If the qualitative analysis shows that it is unlikely that an indefinite-lived intangible asset is impaired, then the annual fair value calculation does not need to be performed. However, if it is not unlikely that an indefinite-lived intangible asset is impaired, then the annual fair value calculation must still be performed. ASU No. 2012-2 is effective for annual and interim impairment tests performed for fiscal years beginning after September 15, 2012, with early adoption permitted. The Company will consider performing the qualitative assessment as part of its future annual impairment tests for indefinite-lived intangible assets. ASU No. 2012-2 is similar to ASU No. 2011-8, which was adopted by the Company in 2012, and amends the Intangibles - Goodwill and Other Topic of the ASC to give companies the option to perform a qualitative assessment that can potentially alleviate the need to perform the quantitative two-step test. These standards may affect the Company’s disclosures, but they will not affect its results of operations, financial condition or liquidity.
NOTE 2 – ACQUISITIONSOn November 9, 2012, the Company entered into a definitive
Stock Purchase Agreement to purchase all of the issued and outstanding shares of Consorcio Comex, S.A. de C.V. (Comex) for an aggregate purchase price of approximately $2.34 billion, including assumed debt. Comex is a leader in the paint and coatings market in Mexico with headquarters in Mexico City. Completion of the transaction is subject to certain conditions and regulatory approvals.
All completed acquisitions below have been accounted for as purchases and their results of operations have been included in the consolidated financial statements since the date of acquisition.
Effective December 18, 2012, the Company acquired Jiangsu Pulanna Coating Co., Ltd. (Pulanna). Headquartered in Changzhou, China, Pulanna is a leading automotive refinishes coatings manufacturer in China. The acquisition strengthens the Global Finishes Group’s established presence in China and its ability to serve automotive customers around the world.
Effective June 1, 2012, the Company acquired Geocel Holdings Corporation. Geocel manufactures innovative caulks, sealants, and adhesives specially designed for tough construction and repair applications in commercial, residential, industrial and
35161_Financials1_Wt.indd 51 2/25/13 10:20 AM
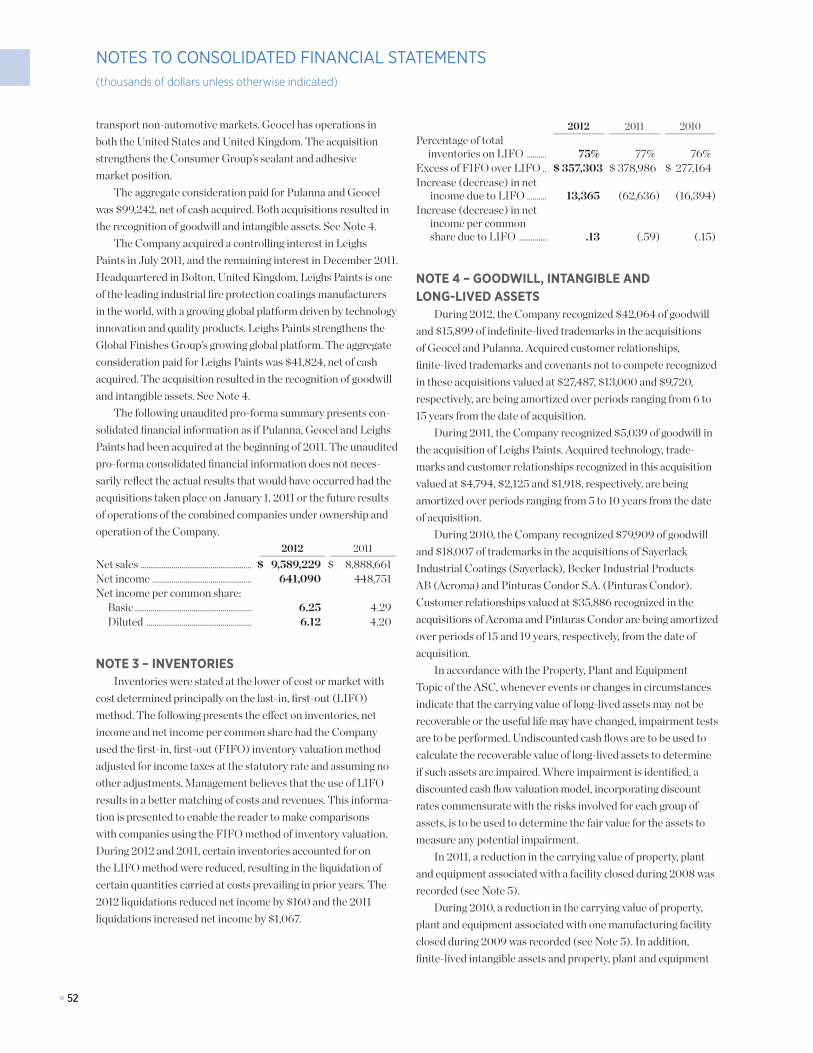
■ 52■ 52
NOTES TO CONSOLIDATED FINANCIAL STATEMENTS(thousands of dollars unless otherwise indicated)
transport non-automotive markets. Geocel has operations in both the United States and United Kingdom. The acquisition strengthens the Consumer Group’s sealant and adhesive market position.
The aggregate consideration paid for Pulanna and Geocel was $99,242, net of cash acquired. Both acquisitions resulted in the recognition of goodwill and intangible assets. See Note 4.
The Company acquired a controlling interest in Leighs Paints in July 2011, and the remaining interest in December 2011. Headquartered in Bolton, United Kingdom, Leighs Paints is one of the leading industrial fire protection coatings manufacturers in the world, with a growing global platform driven by technology innovation and quality products. Leighs Paints strengthens the Global Finishes Group’s growing global platform. The aggregate consideration paid for Leighs Paints was $41,824, net of cash acquired. The acquisition resulted in the recognition of goodwill and intangible assets. See Note 4.
The following unaudited pro-forma summary presents con-solidated financial information as if Pulanna, Geocel and Leighs Paints had been acquired at the beginning of 2011. The unaudited pro-forma consolidated financial information does not neces-sarily reflect the actual results that would have occurred had the acquisitions taken place on January 1, 2011 or the future results of operations of the combined companies under ownership and operation of the Company.
2012 2011Net sales ......................................................... $ 9,589,229 $ 8,888,661Net income ................................................... 641,090 448,751Net income per common share:
Basic ............................................................ 6.25 4.29Diluted ...................................................... 6.12 4.20
NOTE 3 – INVENTORIESInventories were stated at the lower of cost or market with
cost determined principally on the last-in, first-out (LIFO) method. The following presents the effect on inventories, net income and net income per common share had the Company used the first-in, first-out (FIFO) inventory valuation method adjusted for income taxes at the statutory rate and assuming no other adjustments. Management believes that the use of LIFO results in a better matching of costs and revenues. This informa-tion is presented to enable the reader to make comparisons with companies using the FIFO method of inventory valuation. During 2012 and 2011, certain inventories accounted for on the LIFO method were reduced, resulting in the liquidation of certain quantities carried at costs prevailing in prior years. The 2012 liquidations reduced net income by $160 and the 2011 liquidations increased net income by $1,067.
2012 2011 2010Percentage of total
inventories on LIFO .......... 75% 77% 76%Excess of FIFO over LIFO .. $ 357,303 $ 378,986 $ 277,164Increase (decrease) in net
income due to LIFO .......... 13,365 (62,636) (16,394)Increase (decrease) in net
income per common share due to LIFO .............. .13 (.59) (.15)
NOTE 4 – GOODWILL, INTANGIBLE AND LONG-LIVED ASSETS
During 2012, the Company recognized $42,064 of goodwill and $15,899 of indefinite-lived trademarks in the acquisitions of Geocel and Pulanna. Acquired customer relationships, finite-lived trademarks and covenants not to compete recognized in these acquisitions valued at $27,487, $13,000 and $9,720, respectively, are being amortized over periods ranging from 6 to 15 years from the date of acquisition.
During 2011, the Company recognized $5,039 of goodwill in the acquisition of Leighs Paints. Acquired technology, trade-marks and customer relationships recognized in this acquisition valued at $4,794, $2,125 and $1,918, respectively, are being amortized over periods ranging from 5 to 10 years from the date of acquisition.
During 2010, the Company recognized $79,909 of goodwill and $18,007 of trademarks in the acquisitions of Sayerlack Industrial Coatings (Sayerlack), Becker Industrial Products AB (Acroma) and Pinturas Condor S.A. (Pinturas Condor). Customer relationships valued at $35,886 recognized in the acquisitions of Acroma and Pinturas Condor are being amortized over periods of 15 and 19 years, respectively, from the date of acquisition.
In accordance with the Property, Plant and Equipment Topic of the ASC, whenever events or changes in circumstances indicate that the carrying value of long-lived assets may not be recoverable or the useful life may have changed, impairment tests are to be performed. Undiscounted cash flows are to be used to calculate the recoverable value of long-lived assets to determine if such assets are impaired. Where impairment is identified, a discounted cash flow valuation model, incorporating discount rates commensurate with the risks involved for each group of assets, is to be used to determine the fair value for the assets to measure any potential impairment.
In 2011, a reduction in the carrying value of property, plant and equipment associated with a facility closed during 2008 was recorded (see Note 5).
During 2010, a reduction in the carrying value of property, plant and equipment associated with one manufacturing facility closed during 2009 was recorded (see Note 5). In addition, finite-lived intangible assets and property, plant and equipment
35161_Financials_Wt.indd 52 2/21/13 3:10 PM
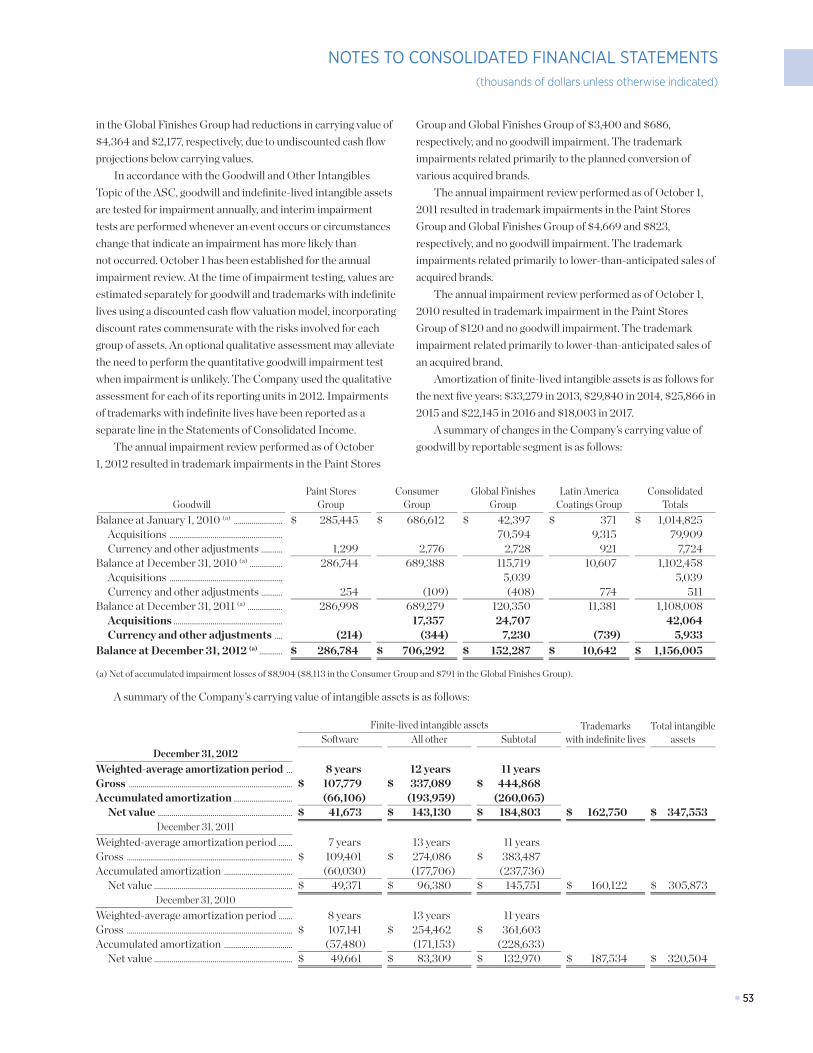
■ 53■ 53
NOTES TO CONSOLIDATED FINANCIAL STATEMENTS(thousands of dollars unless otherwise indicated)
in the Global Finishes Group had reductions in carrying value of $4,364 and $2,177, respectively, due to undiscounted cash flow projections below carrying values.
In accordance with the Goodwill and Other Intangibles Topic of the ASC, goodwill and indefinite-lived intangible assets are tested for impairment annually, and interim impairment tests are performed whenever an event occurs or circumstances change that indicate an impairment has more likely than not occurred. October 1 has been established for the annual impairment review. At the time of impairment testing, values are estimated separately for goodwill and trademarks with indefinite lives using a discounted cash flow valuation model, incorporating discount rates commensurate with the risks involved for each group of assets. An optional qualitative assessment may alleviate the need to perform the quantitative goodwill impairment test when impairment is unlikely. The Company used the qualitative assessment for each of its reporting units in 2012. Impairments of trademarks with indefinite lives have been reported as a separate line in the Statements of Consolidated Income.
The annual impairment review performed as of October 1, 2012 resulted in trademark impairments in the Paint Stores
Group and Global Finishes Group of $3,400 and $686, respectively, and no goodwill impairment. The trademark impairments related primarily to the planned conversion of various acquired brands.
The annual impairment review performed as of October 1, 2011 resulted in trademark impairments in the Paint Stores Group and Global Finishes Group of $4,669 and $823, respectively, and no goodwill impairment. The trademark impairments related primarily to lower-than-anticipated sales of acquired brands.
The annual impairment review performed as of October 1, 2010 resulted in trademark impairment in the Paint Stores Group of $120 and no goodwill impairment. The trademark impairment related primarily to lower-than-anticipated sales of an acquired brand.
Amortization of finite-lived intangible assets is as follows for the next five years: $33,279 in 2013, $29,840 in 2014, $25,866 in 2015 and $22,145 in 2016 and $18,003 in 2017.
A summary of changes in the Company’s carrying value of goodwill by reportable segment is as follows:
GoodwillPaint Stores
GroupConsumer
GroupGlobal Finishes
GroupLatin America
Coatings GroupConsolidated
TotalsBalance at January 1, 2010 (a) ......................... $ 285,445 $ 686,612 $ 42,397 $ 371 $ 1,014,825
Acquisitions .......................................................... 70,594 9,315 79,909Currency and other adjustments ........... 1,299 2,776 2,728 921 7,724
Balance at December 31, 2010 (a) ................. 286,744 689,388 115,719 10,607 1,102,458Acquisitions .......................................................... 5,039 5,039Currency and other adjustments ........... 254 (109) (408) 774 511
Balance at December 31, 2011 (a) .................. 286,998 689,279 120,350 11,381 1,108,008Acquisitions ........................................................ 17,357 24,707 42,064Currency and other adjustments .... (214) (344) 7,230 (739) 5,933
Balance at December 31, 2012 (a) ............ $ 286,784 $ 706,292 $ 152,287 $ 10,642 $ 1,156,005
(a) Net of accumulated impairment losses of $8,904 ($8,113 in the Consumer Group and $791 in the Global Finishes Group).
A summary of the Company’s carrying value of intangible assets is as follows:
Finite-lived intangible assets Trademarks with indefinite lives
Total intangible assetsSoftware All other Subtotal
December 31, 2012Weighted-average amortization period ... 8 years 12 years 11 yearsGross .................................................................................... $ 107,779 $ 337,089 $ 444,868Accumulated amortization .............................. (66,106) (193,959) (260,065)
Net value ..................................................................... $ 41,673 $ 143,130 $ 184,803 $ 162,750 $ 347,553December 31, 2011
Weighted-average amortization period ....... 7 years 13 years 11 yearsGross ..................................................................................... $ 109,401 $ 274,086 $ 383,487Accumulated amortization ................................... (60,030) (177,706) (237,736)
Net value ....................................................................... $ 49,371 $ 96,380 $ 145,751 $ 160,122 $ 305,873December 31, 2010
Weighted-average amortization period ....... 8 years 13 years 11 yearsGross ..................................................................................... $ 107,141 $ 254,462 $ 361,603Accumulated amortization ................................... (57,480) (171,153) (228,633)
Net value ....................................................................... $ 49,661 $ 83,309 $ 132,970 $ 187,534 $ 320,504
35161_Financials_Wt.indd 53 2/21/13 3:10 PM
■ 54■ 54
NOTES TO CONSOLIDATED FINANCIAL STATEMENTS(thousands of dollars unless otherwise indicated)
NOTE 5 – EXIT OR DISPOSAL ACTIVITIESManagement is continually re-evaluating the Company’s op-
erating facilities, including acquired operating facilities, against its long-term strategic goals. Liabilities associated with exit or disposal activities are recognized as incurred in accordance with the Exit or Disposal Cost Obligations Topic of the ASC. Provisions for qualified exit costs are made at the time a facility is no longer operational. Qualified exit costs primarily include post-closure rent expenses or costs to terminate the contract before the end of its term and costs of employee terminations. Adjustments may be made to liabilities accrued for qualified exit costs if information becomes available upon which more accurate amounts can be reasonably estimated. Concurrently, property, plant and equipment is tested for impairment in accordance with the Property, Plant and Equipment Topic of the ASC, and if impairment exists, the carrying value of the related assets is reduced to estimated fair value. Additional impairment may be recorded for subsequent revisions in estimated fair value. Adjustments to prior provisions and additional impairment charges for property, plant and equipment of closed sites being held for disposal are recorded in Other general expense – net.
During 2012, 19 stores and branches were closed due to lower demand or redundancy. Provisions for severance and other qualified exit cost of $7,363 and $313 were charged to the Global Finishes Group and Paint Stores Group, respectively. There were no provisions for severance and other qualified exit costs charged to the Consumer Group or Latin America Coatings Group. Adjustments to prior provisions related to manufacturing facilities, distribution facilities, stores and branches closed prior to 2012 of $(4,942) were recorded.
During 2011, 22 stores and branches were closed due to lower demand or redundancy. Provisions for severance and
other qualified exit costs of $913, $339 and $182 were charged to the Global Finishes Group, Consumer Group and Paint Stores Group, respectively. There were no provisions for severance and other qualified exit costs charged to the Latin America Coatings Group. Adjustments to prior provisions related to manufacturing facilities, distribution facilities, stores and branches closed prior to 2011 of $(900) were recorded. In 2011, a reduction of $3,263 in the carrying value of property, plant and equipment associ-ated with a facility closed in 2008 was recorded in the Paint Stores Group.
During 2010, 23 stores and branches were closed due to lower demand or redundancy. Provisions for severance and other qualified exit costs of $1,314, $457 and $182 were charged to the Global Finishes Group, Consumer Group and Paint Stores Group, respectively. Adjustments to prior provisions related to manufacturing facilities, distribution facilities, stores and branches closed prior to 2010 of $(5,764) were recorded. In 2010, a reduction of $1,164 in the carrying value of the property, plant and equipment associated with a manufacturing facility closed in 2009 was recorded.
At December 31, 2012, a portion of the remaining accrual for qualified exit costs relating to facilities shutdown prior to 2010 is expected to be incurred by the end of 2013. The remaining portion of the ending accrual for facilities shutdown prior to 2010 primarily represented post-closure contractual expenses related to certain owned facilities which are closed and being held for disposal or involved in ongoing environmental-related activities. The Company cannot reasonably estimate when such matters will be concluded to permit disposition.
The tables on the following pages summarize the activity and remaining liabilities associated with qualified exit costs:
35161_Financials_Wt.indd 54 2/21/13 3:10 PM
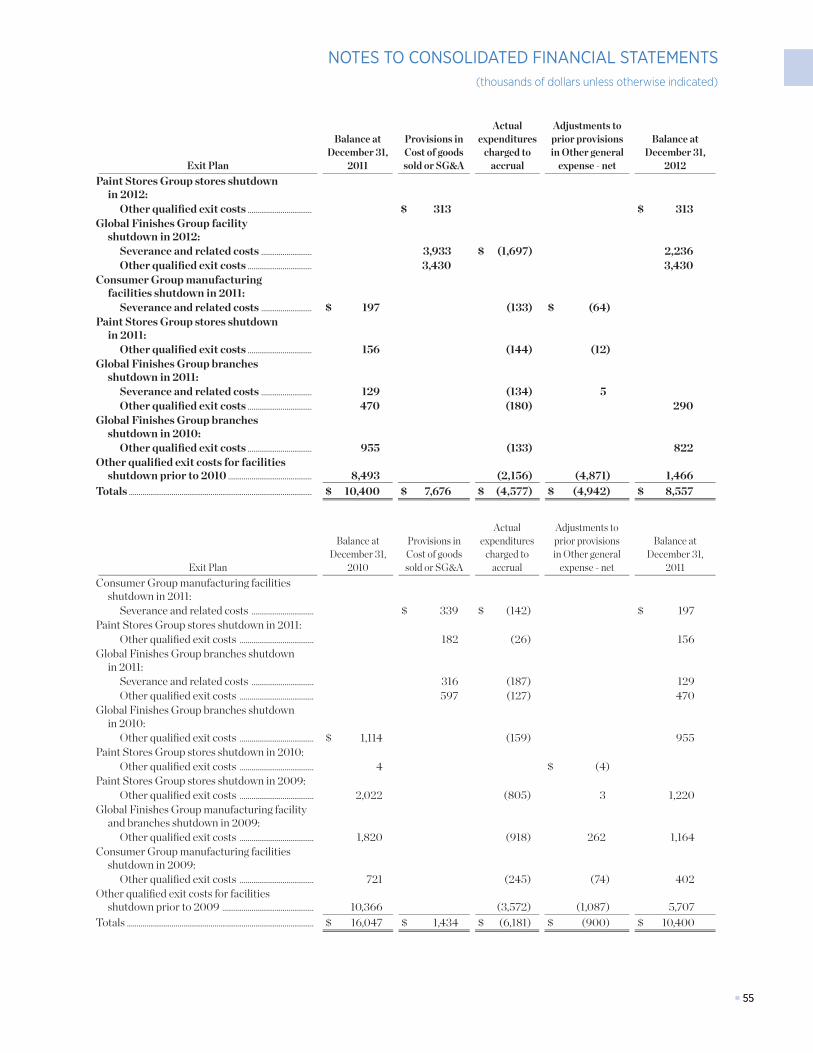
■ 55■ 55
NOTES TO CONSOLIDATED FINANCIAL STATEMENTS(thousands of dollars unless otherwise indicated)
Exit Plan
Balance at December 31,
2011
Provisions in Cost of goods sold or SG&A
Actual expenditures
charged to accrual
Adjustments to prior provisions in Other general
expense - net
Balance at December 31,
2012Paint Stores Group stores shutdown
in 2012:Other qualified exit costs ................................. $ 313 $ 313
Global Finishes Group facility shutdown in 2012:
Severance and related costs .......................... 3,933 $ (1,697) 2,236Other qualified exit costs ................................. 3,430 3,430
Consumer Group manufacturing facilities shutdown in 2011:
Severance and related costs .......................... $ 197 (133) $ (64)Paint Stores Group stores shutdown
in 2011:Other qualified exit costs ................................. 156 (144) (12)
Global Finishes Group branches shutdown in 2011:
Severance and related costs .......................... 129 (134) 5Other qualified exit costs ................................. 470 (180) 290
Global Finishes Group branches shutdown in 2010:
Other qualified exit costs ................................. 955 (133) 822Other qualified exit costs for facilities
shutdown prior to 2010 ........................................... 8,493 (2,156) (4,871) 1,466Totals .............................................................................................. $ 10,400 $ 7,676 $ (4,577) $ (4,942) $ 8,557
Exit Plan
Balance at December 31,
2010
Provisions in Cost of goods sold or SG&A
Actual expenditures
charged to accrual
Adjustments to prior provisions in Other general
expense - net
Balance at December 31,
2011Consumer Group manufacturing facilities
shutdown in 2011:Severance and related costs ................................ $ 339 $ (142) $ 197
Paint Stores Group stores shutdown in 2011:Other qualified exit costs ...................................... 182 (26) 156
Global Finishes Group branches shutdown in 2011:
Severance and related costs ................................ 316 (187) 129Other qualified exit costs ...................................... 597 (127) 470
Global Finishes Group branches shutdown in 2010:
Other qualified exit costs ...................................... $ 1,114 (159) 955Paint Stores Group stores shutdown in 2010:
Other qualified exit costs ...................................... 4 $ (4)Paint Stores Group stores shutdown in 2009:
Other qualified exit costs ...................................... 2,022 (805) 3 1,220Global Finishes Group manufacturing facility
and branches shutdown in 2009:Other qualified exit costs ...................................... 1,820 (918) 262 1,164
Consumer Group manufacturing facilities shutdown in 2009:
Other qualified exit costs ...................................... 721 (245) (74) 402Other qualified exit costs for facilities
shutdown prior to 2009 ............................................... 10,366 (3,572) (1,087) 5,707Totals ................................................................................................ $ 16,047 $ 1,434 $ (6,181) $ (900) $ 10,400
35161_Financials_Wt.indd 55 2/21/13 3:10 PM
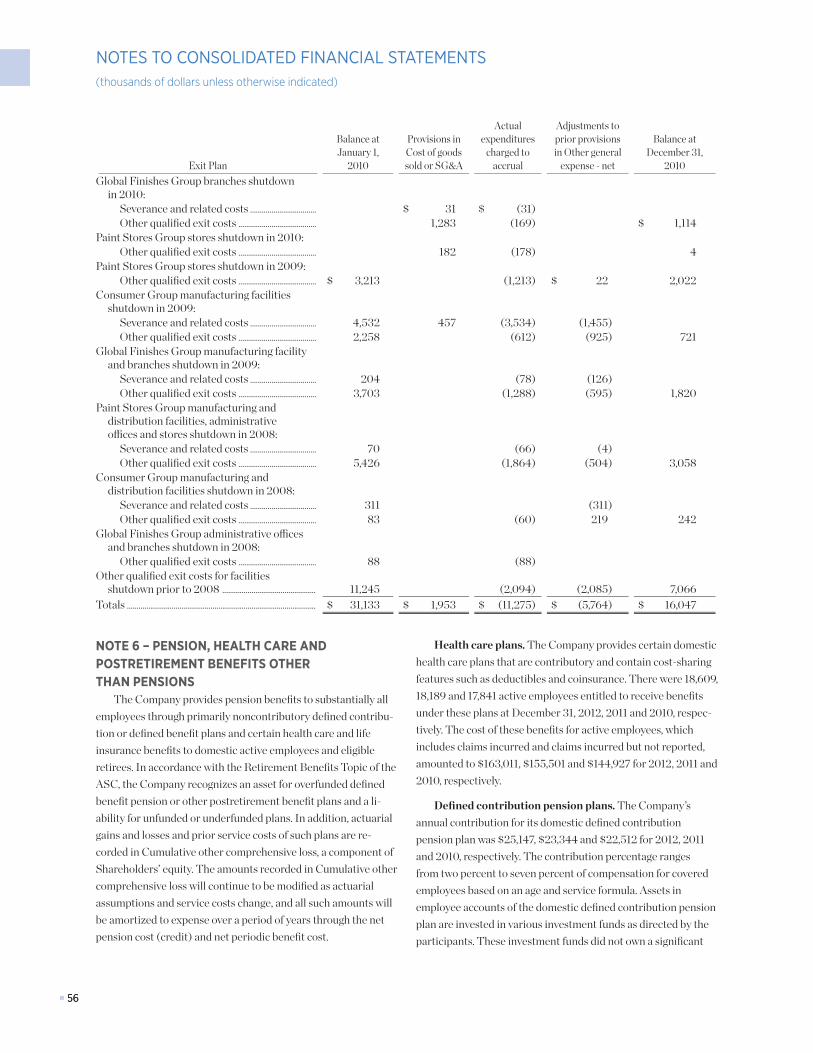
■ 56■ 56
NOTES TO CONSOLIDATED FINANCIAL STATEMENTS(thousands of dollars unless otherwise indicated)
Exit Plan
Balance at January 1,
2010
Provisions in Cost of goods sold or SG&A
Actual expenditures
charged to accrual
Adjustments to prior provisions in Other general
expense - net
Balance at December 31,
2010Global Finishes Group branches shutdown
in 2010:Severance and related costs .................................. $ 31 $ (31)Other qualified exit costs ........................................ 1,283 (169) $ 1,114
Paint Stores Group stores shutdown in 2010:Other qualified exit costs ........................................ 182 (178) 4
Paint Stores Group stores shutdown in 2009:Other qualified exit costs ........................................ $ 3,213 (1,213) $ 22 2,022
Consumer Group manufacturing facilities shutdown in 2009:
Severance and related costs .................................. 4,532 457 (3,534) (1,455)Other qualified exit costs ........................................ 2,258 (612) (925) 721
Global Finishes Group manufacturing facility and branches shutdown in 2009:
Severance and related costs .................................. 204 (78) (126)Other qualified exit costs ........................................ 3,703 (1,288) (595) 1,820
Paint Stores Group manufacturing and distribution facilities, administrative offices and stores shutdown in 2008:
Severance and related costs .................................. 70 (66) (4)Other qualified exit costs ........................................ 5,426 (1,864) (504) 3,058
Consumer Group manufacturing and distribution facilities shutdown in 2008:
Severance and related costs .................................. 311 (311)Other qualified exit costs ........................................ 83 (60) 219 242
Global Finishes Group administrative offices and branches shutdown in 2008:
Other qualified exit costs ........................................ 88 (88)Other qualified exit costs for facilities
shutdown prior to 2008 ................................................ 11,245 (2,094) (2,085) 7,066Totals ................................................................................................. $ 31,133 $ 1,953 $ (11,275) $ (5,764) $ 16,047
NOTE 6 – PENSION, HEALTH CARE AND POSTRETIREMENT BENEFITS OTHER THAN PENSIONS
The Company provides pension benefits to substantially all employees through primarily noncontributory defined contribu-tion or defined benefit plans and certain health care and life insurance benefits to domestic active employees and eligible retirees. In accordance with the Retirement Benefits Topic of the ASC, the Company recognizes an asset for overfunded defined benefit pension or other postretirement benefit plans and a li-ability for unfunded or underfunded plans. In addition, actuarial gains and losses and prior service costs of such plans are re-corded in Cumulative other comprehensive loss, a component of Shareholders’ equity. The amounts recorded in Cumulative other comprehensive loss will continue to be modified as actuarial assumptions and service costs change, and all such amounts will be amortized to expense over a period of years through the net pension cost (credit) and net periodic benefit cost.
Health care plans. The Company provides certain domestic health care plans that are contributory and contain cost-sharing features such as deductibles and coinsurance. There were 18,609, 18,189 and 17,841 active employees entitled to receive benefits under these plans at December 31, 2012, 2011 and 2010, respec-tively. The cost of these benefits for active employees, which includes claims incurred and claims incurred but not reported, amounted to $163,011, $155,501 and $144,927 for 2012, 2011 and 2010, respectively.
Defined contribution pension plans. The Company’s annual contribution for its domestic defined contribution pension plan was $25,147, $23,344 and $22,512 for 2012, 2011 and 2010, respectively. The contribution percentage ranges from two percent to seven percent of compensation for covered employees based on an age and service formula. Assets in employee accounts of the domestic defined contribution pension plan are invested in various investment funds as directed by the participants. These investment funds did not own a significant
35161_Financials_Wt.indd 56 2/21/13 3:10 PM
■ 57■ 57
NOTES TO CONSOLIDATED FINANCIAL STATEMENTS(thousands of dollars unless otherwise indicated)
number of shares of the Company’s common stock for any year presented.
The Company’s annual contribution for its foreign defined contribution pension plans, which is based on various percent-ages of compensation for covered employees up to certain limits, was $4,621, $3,807 and $3,968 for 2012, 2011 and 2010, respectively. Assets in employee accounts of the foreign defined contribution pension plans are invested in various invest-ment funds. These investment funds did not own a significant number of shares of the Company’s common stock for any year presented.
Defined benefit pension plans. The Company has one salaried and one hourly domestic defined benefit pension plan, and fifteen foreign defined benefit pension plans, including two European plans acquired in connection with the 2011 and 2010 acquisitions of Leighs Paints and Acroma. All participants in the domestic salaried defined benefit pension plan prior to January 1, 2002 retain the previous defined benefit formula for computing benefits with certain modifications for active employees. Eligible domestic salaried employees hired or re-hired between January 1, 2002 and September 30, 2011 became participants in the revised domestic salaried defined benefit pension plan upon completion of six months of service. All employees who became participants on or after January 1, 2002 and before January 1, 2005 were credited with certain contribution credits equivalent to six percent of their salary. All employees who became participants on or after January 1, 2005 were credited with certain contribution credits that range from two percent to seven percent of compensation based on an age and service formula. Effective July 1, 2009, the domestic salaried defined benefit pension plan was revised, and all employees who become participants on or after January 1, 2002 were credited with certain contribution credits that range from two percent to seven percent of compensation based on an age and service formula. Contribution credits are converted into units to account for each participant’s benefits. Participants will receive a variable annuity benefit upon retirement or a lump sum distribution upon termination (if vested). The variable annuity benefit is subject to the hypothetical returns achieved on each participant’s allocation of units from investments in various investment funds as directed by the participant. Contribution credits to the revised domestic salaried defined benefit pension plan are being funded through existing plan assets. Effective October 1, 2011, the domestic salaried defined benefit pension plan was frozen for new hires,
and all newly hired U.S. non-collectively bargained employees are eligible to participate in the Company’s domestic defined contribution plan.
At December 31, 2012, the domestic salaried defined benefit pension plan was overfunded, with a projected benefit obligation of $313,964, fair value of plan assets of $559,552 and excess plan assets of $245,588. The domestic hourly defined benefit pension plan was underfunded, with a projected benefit obligation of $152,863, fair value of plan assets of $144,011 and a deficiency of plan assets of $8,852. The plans are funded in accordance with all applicable regulations at December 31, 2012 and no funding will be required in 2013. At December 31, 2011, the domestic salaried defined benefit pension plan was overfunded, with a projected benefit obligation of $269,314, fair value of plan assets of $487,990 and excess plan assets of $218,676, and the domestic hourly defined benefit pension plan was underfunded, with a projected benefit obligation of $140,715, fair value of plan assets of $126,473 and a deficiency of plan assets of $14,242. At December 31, 2010, the domestic salaried defined benefit pension plan was overfunded, with a projected benefit obligation of $261,996, fair value of plan assets of $502,707 and excess plan assets of $240,711, and the domestic hourly defined benefit pension plan was overfunded, with a projected benefit obligation of $128,261, fair value of plan assets of $132,018 and excess plan assets of $3,757.
At December 31, 2012, twelve of the Company’s foreign defined benefit pension plans were unfunded or underfunded, with combined projected benefit obligations, fair values of net assets and deficiencies of plan assets of $105,045, $65,026 and $40,019, respectively. An increase of $27,294 from 2011 in the combined projected benefit obligations of all foreign defined benefit pension plans was primarily due to changes in plan assumptions.
The Company expects to make the following benefit pay-ments for all domestic and foreign defined benefit pension plans: $41,784 in 2013; $42,435 in 2014; $43,457 in 2015; $43,631 in 2016; $43,992 in 2017; and $225,564 in 2018 through 2022.
The estimated net actuarial losses and prior service (credits) for the defined benefit pension plans that are expected to be amortized from Cumulative other comprehensive loss into the net pension costs in 2013 are $15,111 and $(310), respectively.
The following table summarizes the components of the net pension costs and Cumulative other comprehensive loss related to the defined benefit pension plans:
35161_Financials_Wt.indd 57 2/21/13 3:10 PM
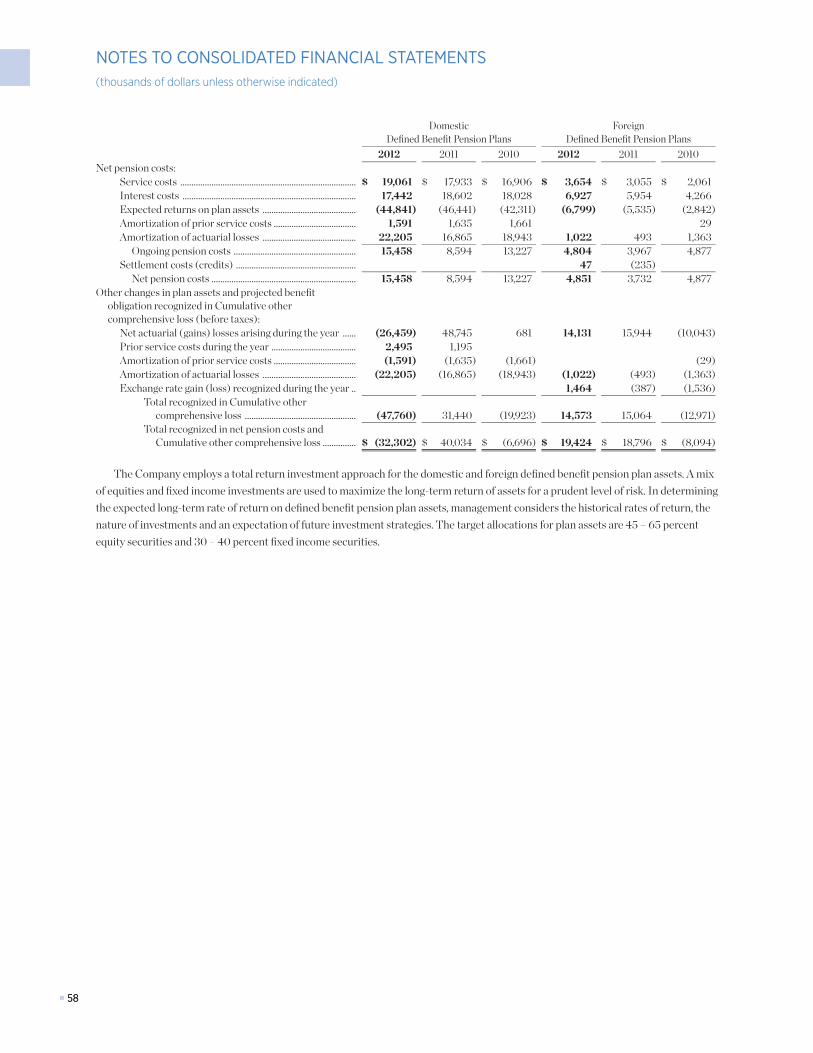
■ 58■ 58
NOTES TO CONSOLIDATED FINANCIAL STATEMENTS(thousands of dollars unless otherwise indicated)
Domestic Defined Benefit Pension Plans
Foreign Defined Benefit Pension Plans
2012 2011 2010 2012 2011 2010Net pension costs:
Service costs ............................................................................... $ 19,061 $ 17,933 $ 16,906 $ 3,654 $ 3,055 $ 2,061Interest costs .............................................................................. 17,442 18,602 18,028 6,927 5,954 4,266Expected returns on plan assets .......................................... (44,841) (46,441) (42,311) (6,799) (5,535) (2,842)Amortization of prior service costs ..................................... 1,591 1,635 1,661 29Amortization of actuarial losses .......................................... 22,205 16,865 18,943 1,022 493 1,363
Ongoing pension costs ....................................................... 15,458 8,594 13,227 4,804 3,967 4,877Settlement costs (credits) ...................................................... 47 (235)
Net pension costs ................................................................. 15,458 8,594 13,227 4,851 3,732 4,877Other changes in plan assets and projected benefit
obligation recognized in Cumulative other comprehensive loss (before taxes):
Net actuarial (gains) losses arising during the year ...... (26,459) 48,745 681 14,131 15,944 (10,043)Prior service costs during the year ...................................... 2,495 1,195Amortization of prior service costs ..................................... (1,591) (1,635) (1,661) (29)Amortization of actuarial losses .......................................... (22,205) (16,865) (18,943) (1,022) (493) (1,363)Exchange rate gain (loss) recognized during the year .. 1,464 (387) (1,536)
Total recognized in Cumulative other comprehensive loss .................................................. (47,760) 31,440 (19,923) 14,573 15,064 (12,971)
Total recognized in net pension costs and Cumulative other comprehensive loss ............... $ (32,302) $ 40,034 $ (6,696) $ 19,424 $ 18,796 $ (8,094)
The Company employs a total return investment approach for the domestic and foreign defined benefit pension plan assets. A mix of equities and fixed income investments are used to maximize the long-term return of assets for a prudent level of risk. In determining the expected long-term rate of return on defined benefit pension plan assets, management considers the historical rates of return, the nature of investments and an expectation of future investment strategies. The target allocations for plan assets are 45 – 65 percent equity securities and 30 – 40 percent fixed income securities.
35161_Financials_Wt.indd 58 2/21/13 3:10 PM
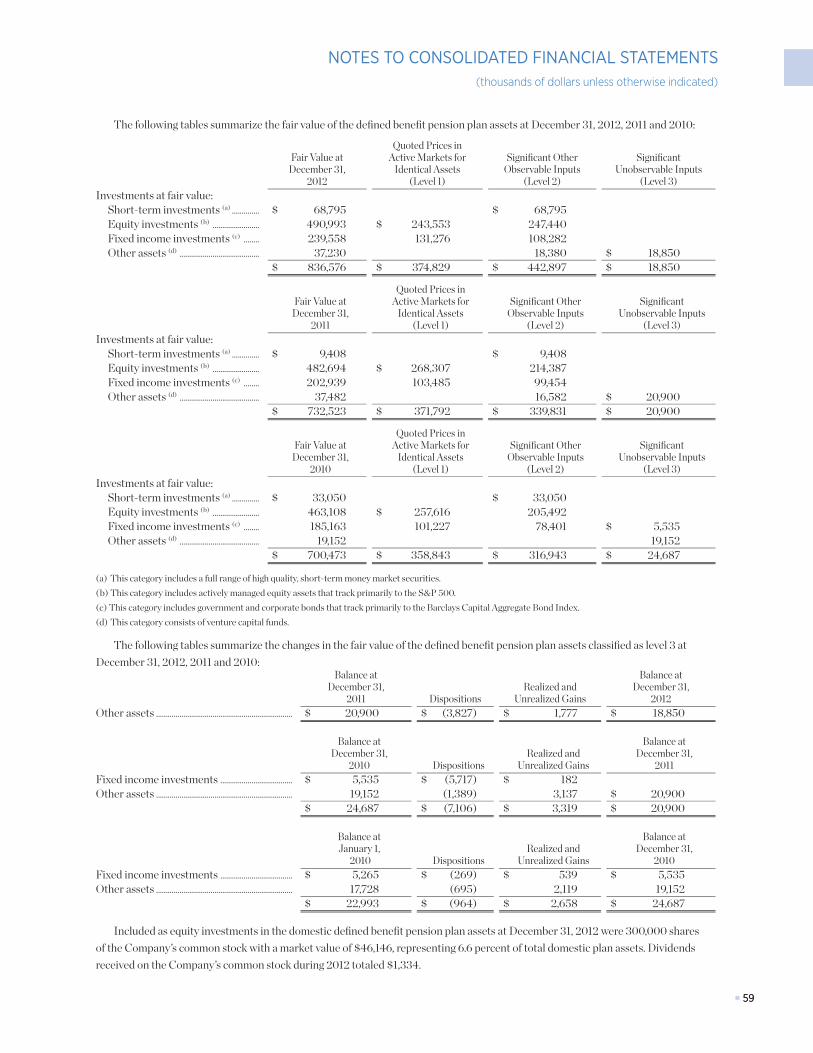
■ 59■ 59
NOTES TO CONSOLIDATED FINANCIAL STATEMENTS(thousands of dollars unless otherwise indicated)
The following tables summarize the fair value of the defined benefit pension plan assets at December 31, 2012, 2011 and 2010:
Fair Value at December 31,
2012
Quoted Prices in Active Markets for
Identical Assets (Level 1)
Significant Other Observable Inputs
(Level 2)
Significant Unobservable Inputs
(Level 3)Investments at fair value:
Short-term investments (a) .............. $ 68,795 $ 68,795Equity investments (b) ........................ 490,993 $ 243,553 247,440Fixed income investments (c) ........ 239,558 131,276 108,282Other assets (d) ......................................... 37,230 18,380 $ 18,850
$ 836,576 $ 374,829 $ 442,897 $ 18,850
Fair Value at December 31,
2011
Quoted Prices in Active Markets for
Identical Assets (Level 1)
Significant Other Observable Inputs
(Level 2)
Significant Unobservable Inputs
(Level 3)Investments at fair value:
Short-term investments (a) .............. $ 9,408 $ 9,408Equity investments (b) ........................ 482,694 $ 268,307 214,387Fixed income investments (c) ........ 202,939 103,485 99,454Other assets (d) ......................................... 37,482 16,582 $ 20,900
$ 732,523 $ 371,792 $ 339,831 $ 20,900
Fair Value at December 31,
2010
Quoted Prices in Active Markets for
Identical Assets (Level 1)
Significant Other Observable Inputs
(Level 2)
Significant Unobservable Inputs
(Level 3)Investments at fair value:
Short-term investments (a) .............. $ 33,050 $ 33,050Equity investments (b) ........................ 463,108 $ 257,616 205,492Fixed income investments (c) ........ 185,163 101,227 78,401 $ 5,535Other assets (d) ......................................... 19,152 19,152
$ 700,473 $ 358,843 $ 316,943 $ 24,687
(a) This category includes a full range of high quality, short-term money market securities.(b) This category includes actively managed equity assets that track primarily to the S&P 500.(c) This category includes government and corporate bonds that track primarily to the Barclays Capital Aggregate Bond Index.(d) This category consists of venture capital funds.
The following tables summarize the changes in the fair value of the defined benefit pension plan assets classified as level 3 at December 31, 2012, 2011 and 2010:
Balance at December 31,
2011 DispositionsRealized and
Unrealized Gains
Balance at December 31,
2012Other assets ...................................................................... $ 20,900 $ (3,827) $ 1,777 $ 18,850
Balance at December 31,
2010 DispositionsRealized and
Unrealized Gains
Balance at December 31,
2011Fixed income investments ..................................... $ 5,535 $ (5,717) $ 182Other assets ...................................................................... 19,152 (1,389) 3,137 $ 20,900
$ 24,687 $ (7,106) $ 3,319 $ 20,900
Balance at January 1,
2010 DispositionsRealized and
Unrealized Gains
Balance at December 31,
2010Fixed income investments ..................................... $ 5,265 $ (269) $ 539 $ 5,535Other assets ...................................................................... 17,728 (695) 2,119 19,152
$ 22,993 $ (964) $ 2,658 $ 24,687
Included as equity investments in the domestic defined benefit pension plan assets at December 31, 2012 were 300,000 shares of the Company’s common stock with a market value of $46,146, representing 6.6 percent of total domestic plan assets. Dividends received on the Company’s common stock during 2012 totaled $1,334.
35161_Financials_Wt.indd 59 2/21/13 3:10 PM
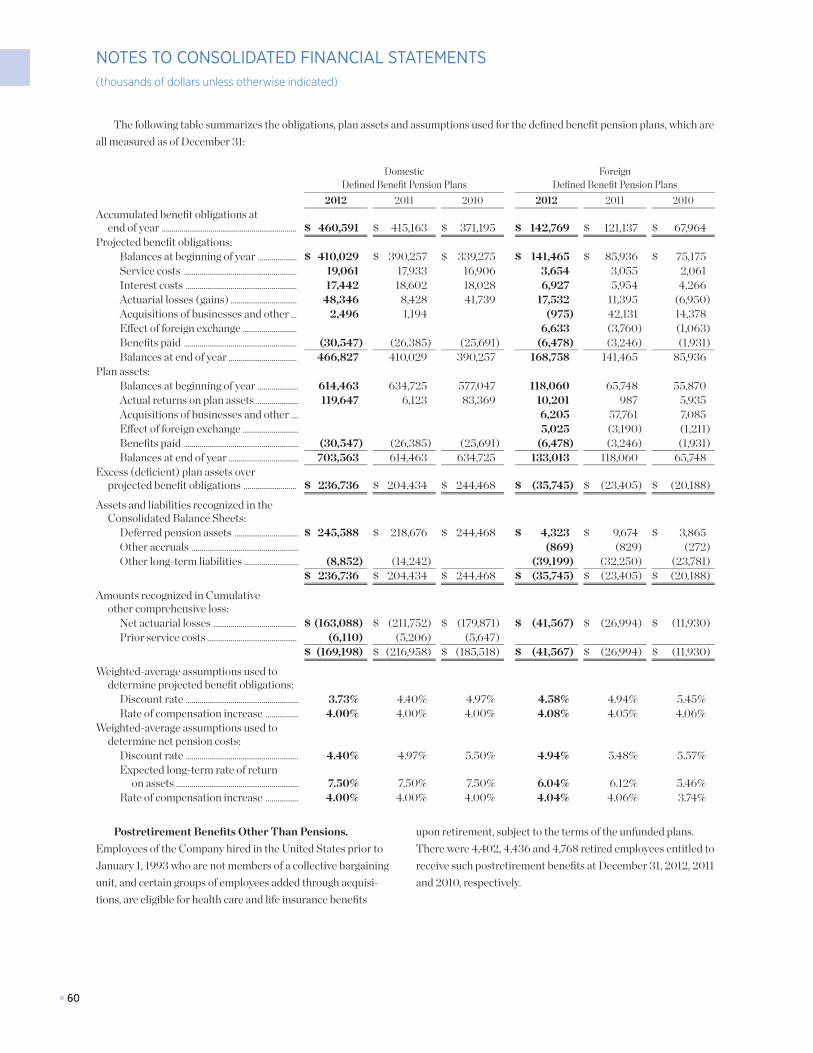
■ 60■ 60
NOTES TO CONSOLIDATED FINANCIAL STATEMENTS(thousands of dollars unless otherwise indicated)
The following table summarizes the obligations, plan assets and assumptions used for the defined benefit pension plans, which are all measured as of December 31:
Domestic
Defined Benefit Pension PlansForeign
Defined Benefit Pension Plans2012 2011 2010 2012 2011 2010
Accumulated benefit obligations at end of year ..................................................................... $ 460,591 $ 415,163 $ 371,195 $ 142,769 $ 121,137 $ 67,964
Projected benefit obligations:Balances at beginning of year .................... $ 410,029 $ 390,257 $ 339,275 $ 141,465 $ 85,936 $ 75,175Service costs .......................................................... 19,061 17,933 16,906 3,654 3,055 2,061Interest costs ......................................................... 17,442 18,602 18,028 6,927 5,954 4,266Actuarial losses (gains) .................................. 48,346 8,428 41,739 17,532 11,395 (6,950)Acquisitions of businesses and other ... 2,496 1,194 (975) 42,131 14,378Effect of foreign exchange ............................ 6,633 (3,760) (1,063)Benefits paid .......................................................... (30,547) (26,385) (25,691) (6,478) (3,246) (1,931)Balances at end of year ................................... 466,827 410,029 390,257 168,758 141,465 85,936
Plan assets:Balances at beginning of year ..................... 614,463 634,725 577,047 118,060 65,748 55,870Actual returns on plan assets ...................... 119,647 6,123 83,369 10,201 987 5,935Acquisitions of businesses and other .... 6,205 57,761 7,085Effect of foreign exchange ............................. 5,025 (3,190) (1,211)Benefits paid ........................................................... (30,547) (26,385) (25,691) (6,478) (3,246) (1,931)Balances at end of year .................................... 703,563 614,463 634,725 133,013 118,060 65,748
Excess (deficient) plan assets over projected benefit obligations ........................... $ 236,736 $ 204,434 $ 244,468 $ (35,745) $ (23,405) $ (20,188)
Assets and liabilities recognized in the Consolidated Balance Sheets:
Deferred pension assets ................................. $ 245,588 $ 218,676 $ 244,468 $ 4,323 $ 9,674 $ 3,865Other accruals ....................................................... (869) (829) (272)Other long-term liabilities ............................ (8,852) (14,242) (39,199) (32,250) (23,781)
$ 236,736 $ 204,434 $ 244,468 $ (35,745) $ (23,405) $ (20,188)
Amounts recognized in Cumulative other comprehensive loss:
Net actuarial losses ........................................... $ (163,088) $ (211,752) $ (179,871) $ (41,567) $ (26,994) $ (11,930)Prior service costs .............................................. (6,110) (5,206) (5,647)
$ (169,198) $ (216,958) $ (185,518) $ (41,567) $ (26,994) $ (11,930)
Weighted-average assumptions used to determine projected benefit obligations:
Discount rate .......................................................... 3.73% 4.40% 4.97% 4.58% 4.94% 5.45%Rate of compensation increase ................. 4.00% 4.00% 4.00% 4.08% 4.05% 4.06%
Weighted-average assumptions used to determine net pension costs:
Discount rate .......................................................... 4.40% 4.97% 5.50% 4.94% 5.48% 5.57%Expected long-term rate of return
on assets ............................................................... 7.50% 7.50% 7.50% 6.04% 6.12% 5.46%Rate of compensation increase ................. 4.00% 4.00% 4.00% 4.04% 4.06% 3.74%
Postretirement Benefits Other Than Pensions.
Employees of the Company hired in the United States prior to January 1, 1993 who are not members of a collective bargaining unit, and certain groups of employees added through acquisi-tions, are eligible for health care and life insurance benefits
upon retirement, subject to the terms of the unfunded plans. There were 4,402, 4,436 and 4,768 retired employees entitled to receive such postretirement benefits at December 31, 2012, 2011 and 2010, respectively.
35161_Financials_Wt.indd 60 2/21/13 3:10 PM
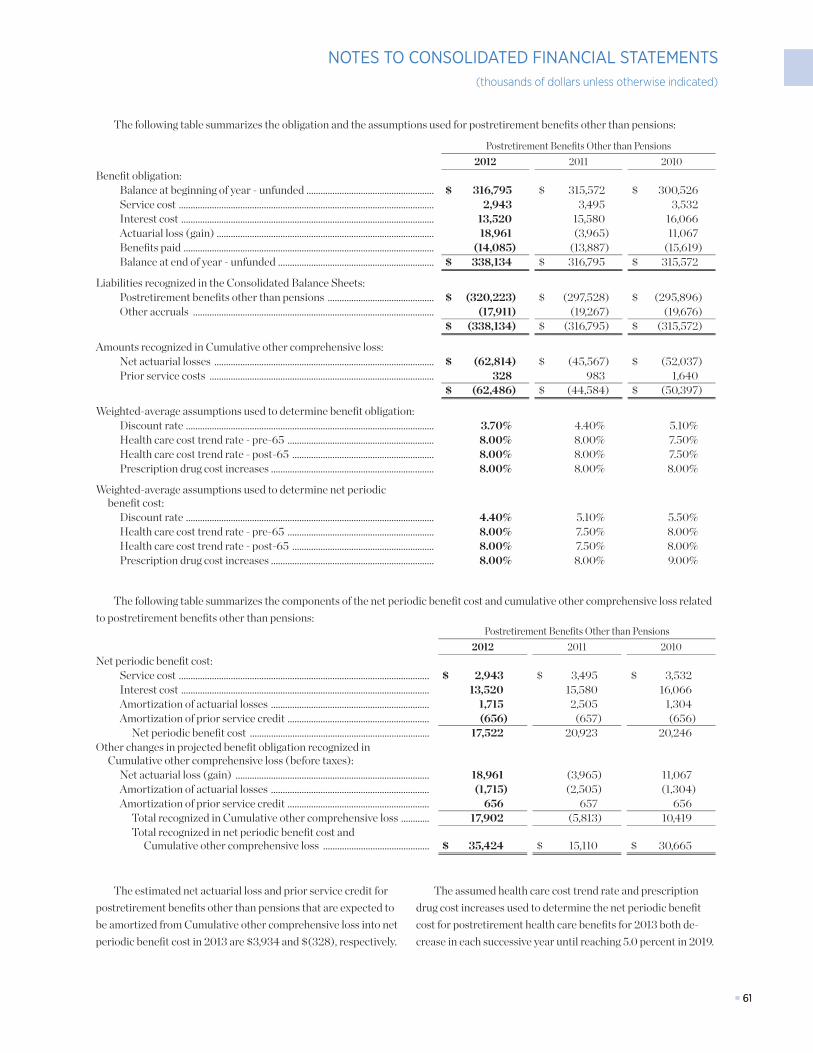
■ 61■ 61
NOTES TO CONSOLIDATED FINANCIAL STATEMENTS(thousands of dollars unless otherwise indicated)
The following table summarizes the obligation and the assumptions used for postretirement benefits other than pensions:
Postretirement Benefits Other than Pensions2012 2011 2010
Benefit obligation:Balance at beginning of year - unfunded ...................................................... $ 316,795 $ 315,572 $ 300,526Service cost ............................................................................................................ 2,943 3,495 3,532Interest cost ........................................................................................................... 13,520 15,580 16,066Actuarial loss (gain) ............................................................................................ 18,961 (3,965) 11,067Benefits paid .......................................................................................................... (14,085) (13,887) (15,619)Balance at end of year - unfunded .................................................................. $ 338,134 $ 316,795 $ 315,572
Liabilities recognized in the Consolidated Balance Sheets:Postretirement benefits other than pensions ............................................. $ (320,223) $ (297,528) $ (295,896)Other accruals ...................................................................................................... (17,911) (19,267) (19,676)
$ (338,134) $ (316,795) $ (315,572)
Amounts recognized in Cumulative other comprehensive loss:Net actuarial losses ............................................................................................. $ (62,814) $ (45,567) $ (52,037)Prior service costs ............................................................................................... 328 983 1,640
$ (62,486) $ (44,584) $ (50,397)
Weighted-average assumptions used to determine benefit obligation:Discount rate ......................................................................................................... 3.70% 4.40% 5.10%Health care cost trend rate - pre-65 .............................................................. 8.00% 8.00% 7.50%Health care cost trend rate - post-65 ............................................................ 8.00% 8.00% 7.50%Prescription drug cost increases ..................................................................... 8.00% 8.00% 8.00%
Weighted-average assumptions used to determine net periodic benefit cost:
Discount rate ......................................................................................................... 4.40% 5.10% 5.50%Health care cost trend rate - pre-65 .............................................................. 8.00% 7.50% 8.00%Health care cost trend rate - post-65 ............................................................ 8.00% 7.50% 8.00%Prescription drug cost increases ..................................................................... 8.00% 8.00% 9.00%
The following table summarizes the components of the net periodic benefit cost and cumulative other comprehensive loss related to postretirement benefits other than pensions:
Postretirement Benefits Other than Pensions2012 2011 2010
Net periodic benefit cost:Service cost .......................................................................................................... $ 2,943 $ 3,495 $ 3,532Interest cost ......................................................................................................... 13,520 15,580 16,066Amortization of actuarial losses ................................................................... 1,715 2,505 1,304Amortization of prior service credit ............................................................ (656) (657) (656)
Net periodic benefit cost ............................................................................ 17,522 20,923 20,246Other changes in projected benefit obligation recognized in
Cumulative other comprehensive loss (before taxes):Net actuarial loss (gain) .................................................................................. 18,961 (3,965) 11,067Amortization of actuarial losses ................................................................... (1,715) (2,505) (1,304)Amortization of prior service credit ............................................................ 656 657 656
Total recognized in Cumulative other comprehensive loss ............ 17,902 (5,813) 10,419Total recognized in net periodic benefit cost and
Cumulative other comprehensive loss ............................................. $ 35,424 $ 15,110 $ 30,665
The estimated net actuarial loss and prior service credit for postretirement benefits other than pensions that are expected to be amortized from Cumulative other comprehensive loss into net periodic benefit cost in 2013 are $3,934 and $(328), respectively.
The assumed health care cost trend rate and prescription drug cost increases used to determine the net periodic benefit cost for postretirement health care benefits for 2013 both de-crease in each successive year until reaching 5.0 percent in 2019.
35161_Financials_Wt.indd 61 2/21/13 3:10 PM
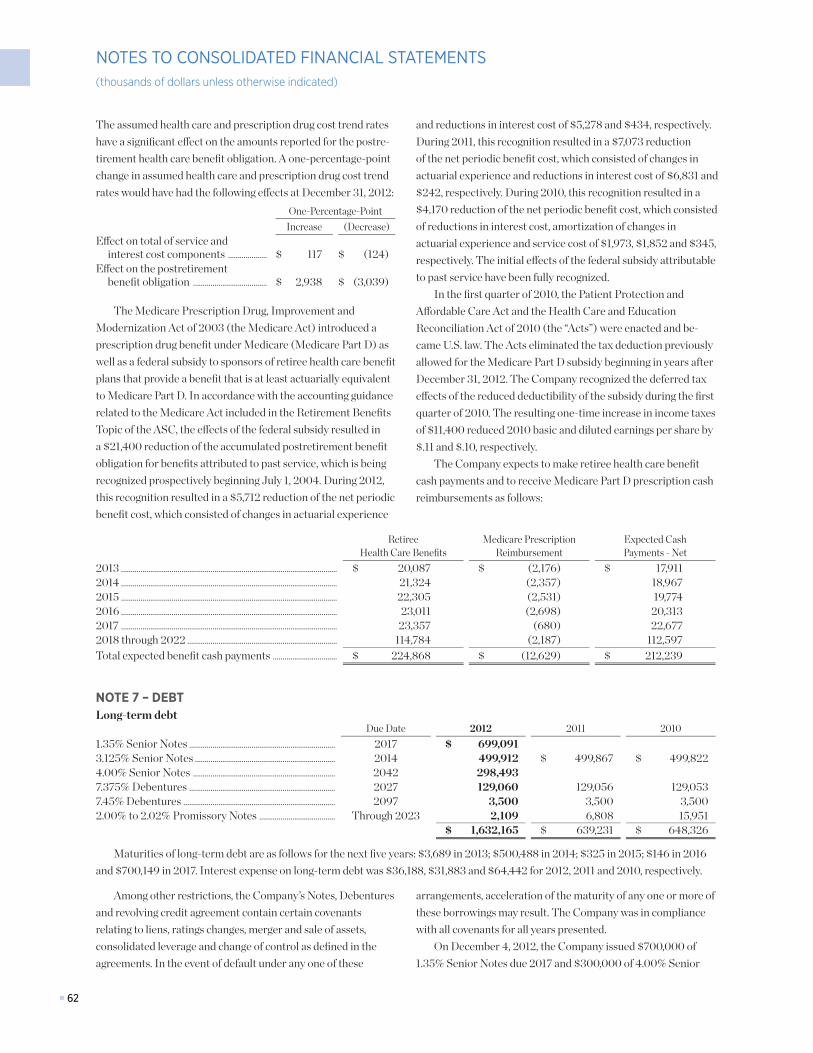
■ 62■ 62
NOTES TO CONSOLIDATED FINANCIAL STATEMENTS(thousands of dollars unless otherwise indicated)
The assumed health care and prescription drug cost trend rates have a significant effect on the amounts reported for the postre-tirement health care benefit obligation. A one-percentage-point change in assumed health care and prescription drug cost trend rates would have had the following effects at December 31, 2012:
One-Percentage-PointIncrease (Decrease)
Effect on total of service and interest cost components .................... $ 117 $ (124)
Effect on the postretirement benefit obligation ...................................... $ 2,938 $ (3,039)
The Medicare Prescription Drug, Improvement and Modernization Act of 2003 (the Medicare Act) introduced a prescription drug benefit under Medicare (Medicare Part D) as well as a federal subsidy to sponsors of retiree health care benefit plans that provide a benefit that is at least actuarially equivalent to Medicare Part D. In accordance with the accounting guidance related to the Medicare Act included in the Retirement Benefits Topic of the ASC, the effects of the federal subsidy resulted in a $21,400 reduction of the accumulated postretirement benefit obligation for benefits attributed to past service, which is being recognized prospectively beginning July 1, 2004. During 2012, this recognition resulted in a $5,712 reduction of the net periodic benefit cost, which consisted of changes in actuarial experience
and reductions in interest cost of $5,278 and $434, respectively. During 2011, this recognition resulted in a $7,073 reduction of the net periodic benefit cost, which consisted of changes in actuarial experience and reductions in interest cost of $6,831 and $242, respectively. During 2010, this recognition resulted in a $4,170 reduction of the net periodic benefit cost, which consisted of reductions in interest cost, amortization of changes in actuarial experience and service cost of $1,973, $1,852 and $345, respectively. The initial effects of the federal subsidy attributable to past service have been fully recognized.
In the first quarter of 2010, the Patient Protection and Affordable Care Act and the Health Care and Education Reconciliation Act of 2010 (the “Acts”) were enacted and be-came U.S. law. The Acts eliminated the tax deduction previously allowed for the Medicare Part D subsidy beginning in years after December 31, 2012. The Company recognized the deferred tax effects of the reduced deductibility of the subsidy during the first quarter of 2010. The resulting one-time increase in income taxes of $11,400 reduced 2010 basic and diluted earnings per share by $.11 and $.10, respectively.
The Company expects to make retiree health care benefit cash payments and to receive Medicare Part D prescription cash reimbursements as follows:
Retiree Health Care Benefits
Medicare Prescription Reimbursement
Expected Cash Payments - Net
2013 ............................................................................................................... $ 20,087 $ (2,176) $ 17,9112014 ............................................................................................................... 21,324 (2,357) 18,9672015 ............................................................................................................... 22,305 (2,531) 19,7742016 ............................................................................................................... 23,011 (2,698) 20,3132017 ............................................................................................................... 23,357 (680) 22,6772018 through 2022 ............................................................................. 114,784 (2,187) 112,597Total expected benefit cash payments ................................. $ 224,868 $ (12,629) $ 212,239
NOTE 7 – DEBTLong-term debt
Due Date 2012 2011 20101.35% Senior Notes ........................................................................... 2017 $ 699,0913.125% Senior Notes ........................................................................ 2014 499,912 $ 499,867 $ 499,8224.00% Senior Notes ......................................................................... 2042 298,4937.375% Debentures ........................................................................... 2027 129,060 129,056 129,0537.45% Debentures .............................................................................. 2097 3,500 3,500 3,5002.00% to 2.02% Promissory Notes ....................................... Through 2023 2,109 6,808 15,951
$ 1,632,165 $ 639,231 $ 648,326
Maturities of long-term debt are as follows for the next five years: $3,689 in 2013; $500,488 in 2014; $325 in 2015; $146 in 2016 and $700,149 in 2017. Interest expense on long-term debt was $36,188, $31,883 and $64,442 for 2012, 2011 and 2010, respectively.
Among other restrictions, the Company’s Notes, Debentures and revolving credit agreement contain certain covenants relating to liens, ratings changes, merger and sale of assets, consolidated leverage and change of control as defined in the agreements. In the event of default under any one of these
arrangements, acceleration of the maturity of any one or more of these borrowings may result. The Company was in compliance with all covenants for all years presented.
On December 4, 2012, the Company issued $700,000 of 1.35% Senior Notes due 2017 and $300,000 of 4.00% Senior
35161_Financials_Wt.indd 62 2/21/13 3:10 PM
■ 63■ 63
NOTES TO CONSOLIDATED FINANCIAL STATEMENTS(thousands of dollars unless otherwise indicated)
Notes due 2042. The Senior Notes are covered under a shelf registration filed with the Securities and Exchange Commission (SEC) on December 16, 2009. The proceeds will be used for general corporate purposes, including repayment of short-term borrowings and financing acquisitions.
During 2010, the Company repurchased $136,500 of its publicly traded 7.45% Debentures due 2097. Costs related to the repurchase increased interest expense by $24,165.
Short-term borrowings. At December 31, 2012, there were no borrowings outstanding under the domestic commercial paper program. At December 31, 2011 and 2010, borrowings outstanding under the domestic commercial paper program totaled $264,902 and $173,490, respectively, and were included in Short-term borrowings. The weighted-average interest rate related to these borrowings was 0.2% at December 31, 2011 and 2010. Borrowings outstanding under various foreign programs of $69,035, $81,375 and $215,102 at December 31, 2012, 2011 and 2010, respectively, were included in Short-term borrowings. The weighted-average interest rate related to these borrowings was 2.8%, 4.9% and 2.9% at December 31, 2012, 2011 and 2010, respectively.
On July 19, 2010, Sherwin-Williams Luxembourg S.à r.l., a wholly-owned subsidiary of the Company, entered into a €200,000 (Euro) credit facility. On December 28, 2010, the Company reduced the aggregate amount of this credit facility to €150,000 (Euro). During 2011, the aggregate amount of this credit facility was further reduced to €97,000 (Euro). On September 19, 2012, this credit facility was replaced by a new €95,000 (Euro) five-year revolving credit facility. On July 19, 2010, Sherwin-Williams Canada Inc., a wholly-owned subsidiary of the Company, entered into a CAD 75,000 credit facility. On June 29, 2012, this credit facility was replaced by a new CAD 75,000 five-year credit facility. These credit facilities are being used for general corporate purposes, including refinancing indebtedness and for acquisitions.
On January 30, 2012, the Company entered into a five-year credit agreement, subsequently amended on multiple dates, which gives the Company the right to borrow and to obtain the issuance, renewal, extension and increase of a letter of credit of up to an aggregate availability of $500,000. On April 23, 2012, the Company entered into a five-year credit agreement, subse-quently amended on multiple dates, which gives the Company the right to borrow and to obtain the issuance, renewal, extension and increase of a letter of credit up to an aggregate availability of $250,000. On November 14, 2012, the Company entered into a three-year credit agreement, subsequently amended on multiple dates, which gives the Company the right to borrow and to obtain the issuance, renewal, extension and increase of a letter of credit up to an aggregate availability of $250,000. The three credit agreements entered into in 2012 replace prior credit facilities
that matured in 2012 and 2011. At December 31, 2012, 2011 and 2010, there were no borrowings outstanding under any of these credit agreements.
The Company uses a revolving credit agreement primarily to satisfy its commercial paper program’s dollar for dollar liquidity requirement. On January 8, 2010, the Company terminated the existing $845,000 revolving credit agreement and entered into a new $500,000 revolving credit agreement. On July 8, 2011, the Company entered into a new five-year $1.05 billion revolv-ing credit agreement, which replaced the existing three-year $500,000 credit agreement. The new credit agreement allows the Company to extend the maturity of the facility with two one-year extension options and to increase the aggregate amount of the facility to $1.30 billion, both of which are subject to the discretion of each lender.
NOTE 8 – OTHER LONG-TERM LIABILITIESThe operations of the Company, like those of other compa-
nies in our industry, are subject to various domestic and foreign environmental laws and regulations. These laws and regulations not only govern current operations and products, but also impose potential liability on the Company for past operations. Management expects environmental laws and regulations to impose increasingly stringent requirements upon the Company and the industry in the future. Management believes that the Company conducts its operations in compliance with applicable environmental laws and regulations and has implemented vari-ous programs designed to protect the environment and promote continued compliance.
The Company is involved with environmental investigation and remediation activities at some of its currently and formerly owned sites (including sites which were previously owned and/or operated by businesses acquired by the Company). In addition, the Company, together with other parties, has been designated a potentially responsible party under federal and state environmental protection laws for the investigation and remediation of environmental contamination and hazardous waste at a number of third-party sites, primarily Superfund sites. In general, these laws provide that potentially responsible parties may be held jointly and severally liable for investigation and remediation costs regardless of fault. The Company may be similarly designated with respect to additional third-party sites in the future.
The Company initially provides for estimated costs of environmental-related activities relating to its past operations and third-party sites for which commitments or clean-up plans have been developed and when such costs can be reasonably estimated based on industry standards and professional judgment. These estimated costs are determined based on currently available facts regarding each site. If the best estimate
35161_Financials_Wt.indd 63 2/25/13 12:21 PM
■ 64■ 64
NOTES TO CONSOLIDATED FINANCIAL STATEMENTS(thousands of dollars unless otherwise indicated)
of costs can only be identified as a range and no specific amount within that range can be determined more likely than any other amount within the range, the minimum of the range is provided. The Company continuously assesses its potential liability for investigation and remediation-related activities and adjusts its environmental-related accruals as information becomes available upon which more accurate costs can be reasonably estimated and as additional accounting guidelines are issued. Included in Other long-term liabilities at December 31, 2012, 2011, and 2010 were accruals for extended environmental-related activities of $97,220, $89,266 and $89,562, respectively. Included in Other accruals at December 31, 2012, 2011, and 2010 were accruals for estimated costs of current investigation and remediation activities of $17,101, $42,847 and $60,048, respectively.
Actual costs incurred may vary from the accrued estimates due to the inherent uncertainties involved including, among others, the number and financial condition of parties involved with respect to any given site, the volumetric contribution which may be attributed to the Company relative to that attributed to other parties, the nature and magnitude of the wastes involved, the various technologies that can be used for remediation and the determination of acceptable remediation with respect to a particular site. If the Company’s future loss contingency is ultimately determined to be at the unaccrued maximum of the estimated range of possible outcomes for every site for which costs can be reasonably estimated, the Company’s accrual for environmental-related activities would be $88,671 higher than the minimum accruals at December 31, 2012.
Two of the Company’s currently and formerly owned manufacturing sites account for the majority of the accrual for environmental-related activities and the unaccrued maximum of the estimated range of possible outcomes at December 31, 2012. At December 31, 2012, $59,132, or 51.7 percent of the total accrual, related directly to these two sites. In the aggregate unaccrued maximum of $88,671 at December 31, 2012, $56,952, or 64.2 percent, related to the two manufacturing sites. While environmental investigations and remedial actions are in different stages at these sites, additional investigations, remedial actions and monitoring will likely be required at each site.
Management cannot presently estimate the ultimate potential loss contingencies related to these sites or other less significant sites until such time as a substantial portion of the investigation at the sites is completed and remedial action plans are developed. In the event any future loss contingency signifi-cantly exceeds the current amount accrued, the recording of the ultimate liability may result in a material impact on net income for the annual or interim period during which the additional costs are accrued. Management does not believe that any potential liability ultimately attributed to the Company for its
environmental-related matters will have a material adverse effect on the Company’s financial condition, liquidity, or cash flow due to the extended period of time during which environmental investigation and remediation takes place. An estimate of the potential impact on the Company’s operations cannot be made due to the aforementioned uncertainties.
Management expects these contingent environmental-related liabilities to be resolved over an extended period of time. Management is unable to provide a more specific time frame due to the indefinite amount of time to conduct investigation activities at any site, the indefinite amount of time to obtain environmental agency approval, as necessary, with respect to investigation and remediation activities, and the indefinite amount of time necessary to conduct remediation activities.
The Asset Retirement and Environmental Obligations Topic of the ASC requires a liability to be recognized for the fair value of a conditional asset retirement obligation if a settlement date and fair value can be reasonably estimated. The Company recognizes a liability for any conditional asset retirement obligation when sufficient information is available to reasonably estimate a settlement date to determine the fair value of such a liability. The Company has identified certain conditional asset retirement obligations at various current and closed manufactur-ing, distribution and store facilities. These obligations relate primarily to asbestos abatement, hazardous waste Resource Conservation and Recovery Act (RCRA) closures, well abandon-ment, transformers and used oil disposals and underground storage tank closures. Using investigative, remediation and disposal methods that are currently available to the Company, the estimated costs of these obligations were accrued and are not significant. The recording of additional liabilities for future conditional asset retirement obligations may result in a material impact on net income for the annual or interim period during which the costs are accrued. Management does not believe that any potential liability ultimately attributed to the Company for its conditional asset retirement obligations will have a material adverse effect on the Company’s financial condition, liquidity, or cash flow due to the extended period of time over which suf-ficient information may become available regarding the closure or modification of any one or group of the Company’s facilities. An estimate of the potential impact on the Company’s operations cannot be made due to the aforementioned uncertainties.
NOTE 9 – LITIGATIONIn the course of its business, the Company is subject to a
variety of claims and lawsuits, including, but not limited to, litiga-tion relating to product liability and warranty, personal injury, environmental, intellectual property, commercial, contractual and antitrust claims that are inherently subject to many uncer-tainties regarding the possibility of a loss to the Company. These
35161_Financials_Wt.indd 64 2/21/13 3:10 PM
■ 65■ 65
NOTES TO CONSOLIDATED FINANCIAL STATEMENTS(thousands of dollars unless otherwise indicated)
uncertainties will ultimately be resolved when one or more future events occur or fail to occur confirming the incurrence of a liability or the reduction of a liability. In accordance with the Contingencies Topic of the ASC, the Company accrues for these contingencies by a charge to income when it is both probable that one or more future events will occur confirming the fact of a loss and the amount of the loss can be reasonably estimated. In the event that the Company’s loss contingency is ultimately determined to be significantly higher than currently accrued, the recording of the additional liability may result in a material impact on the Company’s results of operations, liquidity or financial condition for the annual or interim period during which such additional liability is accrued. In those cases where no accrual is recorded because it is not probable that a liability has been incurred and the amount of any such loss cannot be reason-ably estimated, any potential liability ultimately determined to be attributable to the Company may result in a material impact on the Company’s results of operations, liquidity or financial condi-tion for the annual or interim period during which such liability is accrued. In those cases where no accrual is recorded or exposure to loss exists in excess of the amount accrued, the Contingencies Topic of the ASC requires disclosure of the contingency when there is a reasonable possibility that a loss or additional loss may have been incurred.
Lead pigment and lead-based paint litigation. The Company’s past operations included the manufacture and sale of lead pigments and lead-based paints. The Company, along with other companies, is and has been a defendant in a number of legal proceedings, including individual personal injury actions, purported class actions, and actions brought by various counties, cities, school districts and other government-related entities, arising from the manufacture and sale of lead pigments and lead-based paints. The plaintiffs’ claims have been based upon various legal theories, including negligence, strict liability, breach of warranty, negligent misrepresentations and omissions, fraudulent misrepresentations and omissions, concert of action, civil conspiracy, violations of unfair trade practice and consumer protection laws, enterprise liability, market share liability, public nuisance, unjust enrichment and other theories. The plaintiffs seek various damages and relief, including personal injury and property damage, costs relating to the detection and abatement of lead-based paint from buildings, costs associated with a public education campaign, medical monitoring costs and others. The Company is also a defendant in legal proceedings arising from the manufacture and sale of non-lead-based paints that seek recovery based upon various legal theories, including the failure to adequately warn of potential exposure to lead during surface preparation when using non-lead-based paint on surfaces previously painted with lead-based paint. The Company believes that the litigation brought to date is without merit or subject to
meritorious defenses and is vigorously defending such litigation. The Company has not settled any lead pigment or lead-based paint litigation. The Company expects that additional lead pigment and lead-based paint litigation may be filed against the Company in the future asserting similar or different legal theo-ries and seeking similar or different types of damages and relief.
Notwithstanding the Company’s views on the merits, litigation is inherently subject to many uncertainties, and the Company ultimately may not prevail. Adverse court rulings or determinations of liability, among other factors, could affect the lead pigment and lead-based paint litigation against the Company and encourage an increase in the number and nature of future claims and proceedings. In addition, from time to time, various legislation and administrative regulations have been enacted, promulgated or proposed to impose obligations on pres-ent and former manufacturers of lead pigments and lead-based paints respecting asserted health concerns associated with such products or to overturn the effect of court decisions in which the Company and other manufacturers have been successful.
Due to the uncertainties involved, management is unable to predict the outcome of the lead pigment and lead-based paint litigation, the number or nature of possible future claims and proceedings, or the effect that any legislation and/or administrative regulations may have on the litigation or against the Company. In addition, management cannot reasonably determine the scope or amount of the potential costs and liabilities related to such litigation, or resulting from any such legislation and regulations. The Company has not accrued any amounts for such litigation. With respect to such litigation, including the public nuisance litigation, the Company does not believe that it is probable that a loss has occurred, and it is not possible to estimate the range of potential losses as there is no prior history of a loss of this nature and there is no substantive information upon which an estimate could be based. In addi-tion, any potential liability that may result from any changes to legislation and regulations cannot reasonably be estimated. In the event any significant liability is determined to be attribut-able to the Company relating to such litigation, the recording of the liability may result in a material impact on net income for the annual or interim period during which such liability is accrued. Additionally, due to the uncertainties associated with the amount of any such liability and/or the nature of any other remedy which may be imposed in such litigation, any potential liability determined to be attributable to the Company arising out of such litigation may have a material adverse effect on the Company’s results of operations, liquidity or financial condition. An estimate of the potential impact on the Company’s results of operations, liquidity or financial condition cannot be made due to the aforementioned uncertainties.
35161_Financials1_Wt.indd 65 2/25/13 10:15 AM
■ 66■ 66
NOTES TO CONSOLIDATED FINANCIAL STATEMENTS(thousands of dollars unless otherwise indicated)
Public nuisance claim litigation. The Company and other companies are or were defendants in legal proceedings seeking recovery based on public nuisance liability theories, among other theories, brought by the State of Rhode Island, the City of St. Louis, Missouri, various cities and counties in the State of New Jersey, various cities in the State of Ohio and the State of Ohio, the City of Chicago, Illinois, the City of Milwaukee, Wisconsin and the County of Santa Clara, California and other public entities in the State of California. Except for the Santa Clara County, California proceeding, all of these legal proceedings have been concluded in favor of the Company and other defendants at various stages in the proceedings.
The proceedings initiated by the State of Rhode Island included two jury trials. At the conclusion of the second trial, the jury returned a verdict finding that (i) the cumulative presence of lead pigment in paints and coatings on buildings in the State of Rhode Island constitutes a public nuisance, (ii) the Company, along with two other defendants, caused or substantially contributed to the creation of the public nuisance, and (iii) the Company and two other defendants should be ordered to abate the public nuisance. The Company and two other defendants appealed and, on July 1, 2008, the Rhode Island Supreme Court, among other determinations, reversed the judgment of abate-ment with respect to the Company and two other defendants. The Rhode Island Supreme Court’s decision reversed the public nuisance liability judgment against the Company on the basis that the complaint failed to state a public nuisance claim as a matter of law.
The Santa Clara County, California proceeding was initiated in March 2000 in the Superior Court of the State of California, County of Santa Clara. In the original complaint, the plaintiffs asserted various claims including fraud and concealment, strict product liability/failure to warn, strict product liability/design defect, negligence, negligent breach of a special duty, public nui-sance, private nuisance, and violations of California’s Business and Professions Code. A number of the asserted claims were resolved in favor of the defendants through pre-trial proceedings. The named plaintiffs in the Fourth Amended Complaint, filed on March 16, 2011, are the Counties of Santa Clara, Alameda, Los Angeles, Monterey, San Mateo, Solano and Ventura, and the Cities of Oakland, San Diego and San Francisco. The Fourth Amended Complaint asserts a sole claim for public nuisance, alleging that the presence of lead products for use in paint and coatings in, on and around buildings in the plaintiffs’ jurisdictions constitutes a public nuisance. The plaintiffs seek the abatement of the alleged public nuisance that exists within the plaintiffs’ jurisdictions. A trial is currently scheduled to begin in June 2013.
Litigation seeking damages from alleged personal injury. The Company and other companies are defendants in a number of legal proceedings seeking monetary damages and
other relief from alleged personal injuries. These proceedings include claims by children allegedly injured from ingestion of lead pigment or lead-containing paint, claims for damages allegedly incurred by the children’s parents or guardians, and claims for damages allegedly incurred by professional painting contractors. These proceedings generally seek compensatory and punitive damages, and seek other relief including medical monitoring costs. These proceedings include purported claims by individuals, groups of individuals and class actions.
The plaintiff in Thomas v. Lead Industries Association, et al., initiated an action in state court against the Company, other alleged former lead pigment manufacturers and the Lead Industries Association in September 1999. The claims against the Company and the other defendants included strict liability, negligence, negligent misrepresentation and omissions, fraudu-lent misrepresentation and omissions, concert of action, civil conspiracy and enterprise liability. Implicit within these claims is the theory of “risk contribution” liability (Wisconsin’s theory which is similar to market share liability) due to the plaintiff’s in-ability to identify the manufacturer of any product that allegedly injured the plaintiff. The case ultimately proceeded to trial and, on November 5, 2007, the jury returned a defense verdict, finding that the plaintiff had ingested white lead carbonate, but was not brain damaged or injured as a result. The plaintiff appealed and, on December 16, 2010, the Wisconsin Court of Appeals affirmed the final judgment in favor of the Company and other defendants.
Wisconsin is the only jurisdiction to date to apply a theory of liability with respect to alleged personal injury (i.e., risk contribu-tion/market share liability) that does not require the plaintiff to identify the manufacturer of the product that allegedly injured the plaintiff in the lead pigment and lead-based paint litigation. Although the risk contribution liability theory was applied during the Thomas trial, the constitutionality of this theory as applied to the lead pigment cases has not been judicially determined by the Wisconsin state courts. However, in an unrelated action filed in the United States District Court for the Eastern District of Wisconsin, Gibson v. American Cyanamid, et al., on November 15, 2010, the District Court held that Wisconsin’s risk contribution theory as applied in that case violated the defen-dants’ right to substantive due process and is unconstitutionally retroactive. The District Court’s decision in Gibson v. American Cyanamid, et al., has been appealed by the plaintiff.
Insurance coverage litigation. The Company and its liability insurers, including certain Underwriters at Lloyd’s of London, initiated legal proceedings against each other to primar-ily determine, among other things, whether the costs and liabili-ties associated with the abatement of lead pigment are covered under certain insurance policies issued to the Company. The Company’s action, filed on March 3, 2006 in the Common Pleas Court, Cuyahoga County, Ohio, is currently stayed and inactive.
35161_Financials_Wt.indd 66 2/21/13 3:10 PM
■ 67■ 67
NOTES TO CONSOLIDATED FINANCIAL STATEMENTS(thousands of dollars unless otherwise indicated)
The liability insurers’ action, which was filed on February 23, 2006 in the Supreme Court of the State of New York, County of New York, has been dismissed. An ultimate loss in the insur-ance coverage litigation would mean that insurance proceeds could be unavailable under the policies at issue to mitigate any ultimate abatement related costs and liabilities. The Company has not recorded any assets related to these insurance policies or otherwise assumed that proceeds from these insurance policies would be received in estimating any contingent liability accrual. Therefore, an ultimate loss in the insurance coverage litigation without a determination of liability against the Company in the lead pigment or lead-based paint litigation will have no impact on the Company’s results of operation, liquidity or financial condition. As previously stated, however, the Company has not accrued any amounts for the lead pigment or lead-based paint litigation and any significant liability ultimately determined to be attributable to the Company relating to such litigation may result in a material impact on the Company’s results of operations, liquidity or financial condition for the annual or interim period during which such liability is accrued.
2012 Subsequent Event - DOL Settlement. On February 20, 2013, the Company reached a settlement with the DOL of the previously disclosed investigation of transactions related to the ESOP that were implemented on August 1, 2006 and August 27, 2003. The DOL had notified the Company, certain current and former directors of the Company and the ESOP trustee of poten-tial enforcement claims asserting breaches of fiduciary obliga-tions. The DOL sought compensatory and equitable remedies, including monetary damages to the ESOP for alleged losses to the ESOP relating to third-party valuation of the Company’s convertible serial preferred stock. The Company believes that the DOL’s claims are subject to meritorious defenses, however, the Company’s management and Board of Directors have decided that it would be in the best interest of the Company and its shareholders to avoid potentially costly litigation and enter into this settlement to resolve these claims.
The Company agreed to resolve all ESOP related claims with the DOL by making a one-time payment of $80,000 to the ESOP and has recorded a $49,163 after tax charge to earnings. In accordance with U.S. generally accepted accounting principles, the Company is required to recognize this subsequent event in its 2012 fiscal year results since this subsequent event is related to
conditions that existed at the balance sheet date of December 31, 2012. The Company’s financial results for the quarter and year ended December 31, 2012, which were set forth in the Company’s earnings release issued on January 31, 2013 and furnished on the Company’s Current Report on Form 8-K dated January 31, 2013, have been revised and furnished on the Company’s Current Report on Form 8-K dated February 20, 2013 to reflect this subsequent event. As a result of recording this accrual in the Administrative segment, Cost of goods sold increased $16,000 and Selling, general and administrative expense increased $64,000 while income tax expense decreased $30,837 and diluted net income per common share decreased $.47 per share for both the quarter and year ended December 31, 2012.
NOTE 10 – CAPITAL STOCKAt December 31, 2012, there were 300,000,000 shares of
common stock and 30,000,000 shares of serial preferred stock authorized for issuance. Of the authorized serial preferred stock, 3,000,000 shares are designated as cumulative redeemable se-rial preferred and 1,000,000 shares are designated as convertible serial preferred stock. See Note 11. Effective April 21, 2010, the 2006 Equity and Performance Incentive Plan (2006 Employee Plan) was amended and restated to increase the number of common shares that may be issued or transferred by 9,200,000 shares to 19,200,000 shares. See Note 12. An aggregate of 13,558,565, 18,013,429 and 19,835,391 shares of common stock at December 31, 2012, 2011 and 2010, respectively, were reserved for future grants of restricted stock and the exercise and future grants of option rights. See Note 12. Common shares outstanding shown in the following table included 484,872, 475,628 and 475,628 shares of common stock held in a revocable trust at December 31, 2012, 2011 and 2010, respectively. The revocable trust is used to accumulate assets for the purpose of funding the ultimate obligation of certain non-qualified benefit plans. Transactions between the Company and the trust are accounted for in accordance with the Deferred Compensation – Rabbi Trusts Subtopic of the Compensation Topic of the ASC, which requires the assets held by the trust be consolidated with the Company’s accounts. Effective March 31, 2011, the company retired 125,425,977 common shares held in treasury, which resulted in decreases in Treasury stock, common stock and retained earnings.
35161_Financials1_Wt.indd 67 2/25/13 10:17 AM
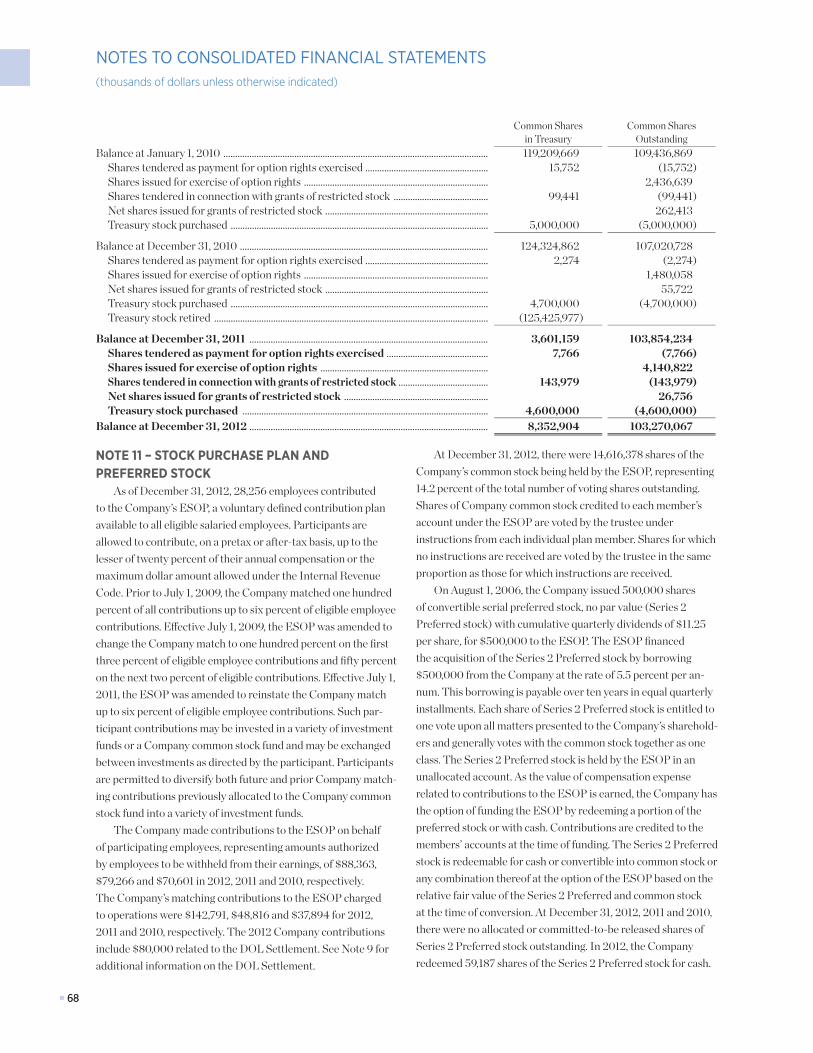
■ 68■ 68
NOTES TO CONSOLIDATED FINANCIAL STATEMENTS(thousands of dollars unless otherwise indicated)
Common Shares in Treasury
Common Shares Outstanding
Balance at January 1, 2010 ................................................................................................................ 119,209,669 109,436,869Shares tendered as payment for option rights exercised .................................................... 15,752 (15,752)Shares issued for exercise of option rights .............................................................................. 2,436,639Shares tendered in connection with grants of restricted stock ........................................ 99,441 (99,441)Net shares issued for grants of restricted stock ..................................................................... 262,413Treasury stock purchased ............................................................................................................. 5,000,000 (5,000,000)
Balance at December 31, 2010 ......................................................................................................... 124,324,862 107,020,728Shares tendered as payment for option rights exercised .................................................... 2,274 (2,274)Shares issued for exercise of option rights .............................................................................. 1,480,058Net shares issued for grants of restricted stock ..................................................................... 55,722Treasury stock purchased ............................................................................................................. 4,700,000 (4,700,000)Treasury stock retired .................................................................................................................... (125,425,977)
Balance at December 31, 2011 ..................................................................................................... 3,601,159 103,854,234Shares tendered as payment for option rights exercised ........................................... 7,766 (7,766)Shares issued for exercise of option rights ....................................................................... 4,140,822Shares tendered in connection with grants of restricted stock ...................................... 143,979 (143,979)Net shares issued for grants of restricted stock ............................................................. 26,756Treasury stock purchased ........................................................................................................ 4,600,000 (4,600,000)
Balance at December 31, 2012 ..................................................................................................... 8,352,904 103,270,067
NOTE 11 – STOCK PURCHASE PLAN AND PREFERRED STOCK
As of December 31, 2012, 28,256 employees contributed to the Company’s ESOP, a voluntary defined contribution plan available to all eligible salaried employees. Participants are allowed to contribute, on a pretax or after-tax basis, up to the lesser of twenty percent of their annual compensation or the maximum dollar amount allowed under the Internal Revenue Code. Prior to July 1, 2009, the Company matched one hundred percent of all contributions up to six percent of eligible employee contributions. Effective July 1, 2009, the ESOP was amended to change the Company match to one hundred percent on the first three percent of eligible employee contributions and fifty percent on the next two percent of eligible contributions. Effective July 1, 2011, the ESOP was amended to reinstate the Company match up to six percent of eligible employee contributions. Such par-ticipant contributions may be invested in a variety of investment funds or a Company common stock fund and may be exchanged between investments as directed by the participant. Participants are permitted to diversify both future and prior Company match-ing contributions previously allocated to the Company common stock fund into a variety of investment funds.
The Company made contributions to the ESOP on behalf of participating employees, representing amounts authorized by employees to be withheld from their earnings, of $88,363, $79,266 and $70,601 in 2012, 2011 and 2010, respectively. The Company’s matching contributions to the ESOP charged to operations were $142,791, $48,816 and $37,894 for 2012, 2011 and 2010, respectively. The 2012 Company contributions include $80,000 related to the DOL Settlement. See Note 9 for additional information on the DOL Settlement.
At December 31, 2012, there were 14,616,378 shares of the Company’s common stock being held by the ESOP, representing 14.2 percent of the total number of voting shares outstanding. Shares of Company common stock credited to each member’s account under the ESOP are voted by the trustee under instructions from each individual plan member. Shares for which no instructions are received are voted by the trustee in the same proportion as those for which instructions are received.
On August 1, 2006, the Company issued 500,000 shares of convertible serial preferred stock, no par value (Series 2 Preferred stock) with cumulative quarterly dividends of $11.25 per share, for $500,000 to the ESOP. The ESOP financed the acquisition of the Series 2 Preferred stock by borrowing $500,000 from the Company at the rate of 5.5 percent per an-num. This borrowing is payable over ten years in equal quarterly installments. Each share of Series 2 Preferred stock is entitled to one vote upon all matters presented to the Company’s sharehold-ers and generally votes with the common stock together as one class. The Series 2 Preferred stock is held by the ESOP in an unallocated account. As the value of compensation expense related to contributions to the ESOP is earned, the Company has the option of funding the ESOP by redeeming a portion of the preferred stock or with cash. Contributions are credited to the members’ accounts at the time of funding. The Series 2 Preferred stock is redeemable for cash or convertible into common stock or any combination thereof at the option of the ESOP based on the relative fair value of the Series 2 Preferred and common stock at the time of conversion. At December 31, 2012, 2011 and 2010, there were no allocated or committed-to-be released shares of Series 2 Preferred stock outstanding. In 2012, the Company redeemed 59,187 shares of the Series 2 Preferred stock for cash.
35161_Financials_Wt.indd 68 2/21/13 3:10 PM
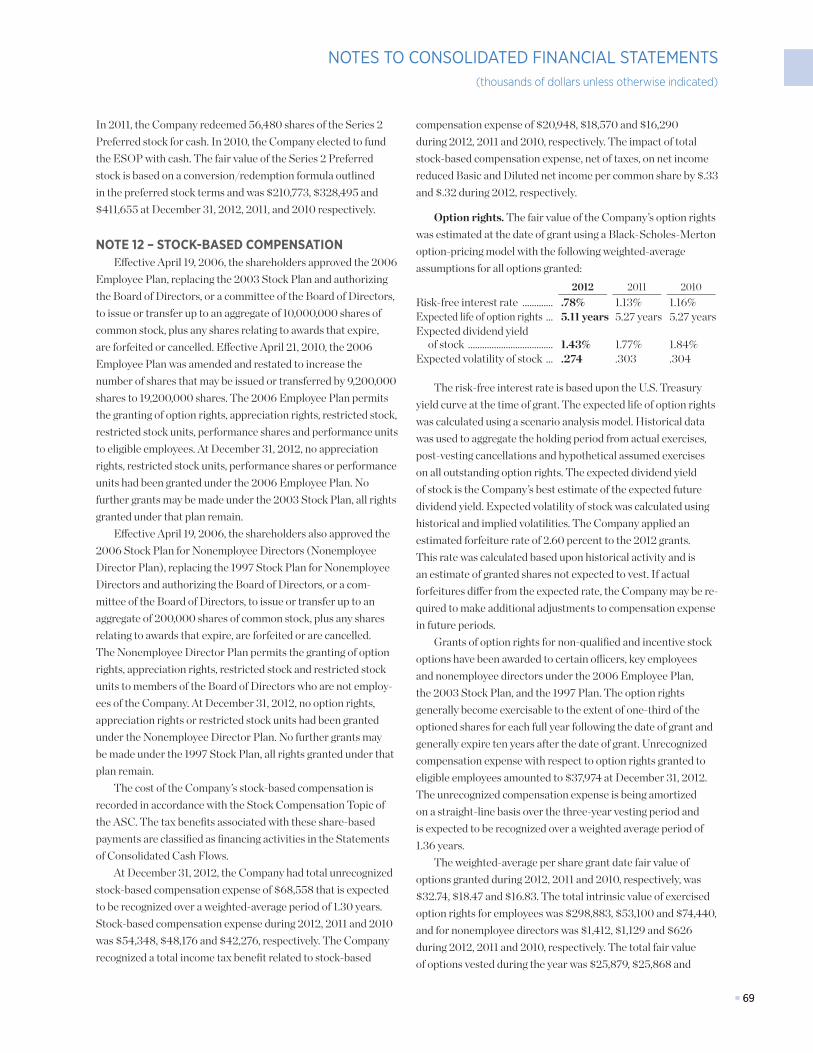
■ 69■ 69
NOTES TO CONSOLIDATED FINANCIAL STATEMENTS(thousands of dollars unless otherwise indicated)
In 2011, the Company redeemed 56,480 shares of the Series 2 Preferred stock for cash. In 2010, the Company elected to fund the ESOP with cash. The fair value of the Series 2 Preferred stock is based on a conversion/redemption formula outlined in the preferred stock terms and was $210,773, $328,495 and $411,655 at December 31, 2012, 2011, and 2010 respectively.
NOTE 12 – STOCK-BASED COMPENSATIONEffective April 19, 2006, the shareholders approved the 2006
Employee Plan, replacing the 2003 Stock Plan and authorizing the Board of Directors, or a committee of the Board of Directors, to issue or transfer up to an aggregate of 10,000,000 shares of common stock, plus any shares relating to awards that expire, are forfeited or cancelled. Effective April 21, 2010, the 2006 Employee Plan was amended and restated to increase the number of shares that may be issued or transferred by 9,200,000 shares to 19,200,000 shares. The 2006 Employee Plan permits the granting of option rights, appreciation rights, restricted stock, restricted stock units, performance shares and performance units to eligible employees. At December 31, 2012, no appreciation rights, restricted stock units, performance shares or performance units had been granted under the 2006 Employee Plan. No further grants may be made under the 2003 Stock Plan, all rights granted under that plan remain.
Effective April 19, 2006, the shareholders also approved the 2006 Stock Plan for Nonemployee Directors (Nonemployee Director Plan), replacing the 1997 Stock Plan for Nonemployee Directors and authorizing the Board of Directors, or a com-mittee of the Board of Directors, to issue or transfer up to an aggregate of 200,000 shares of common stock, plus any shares relating to awards that expire, are forfeited or are cancelled. The Nonemployee Director Plan permits the granting of option rights, appreciation rights, restricted stock and restricted stock units to members of the Board of Directors who are not employ-ees of the Company. At December 31, 2012, no option rights, appreciation rights or restricted stock units had been granted under the Nonemployee Director Plan. No further grants may be made under the 1997 Stock Plan, all rights granted under that plan remain.
The cost of the Company’s stock-based compensation is recorded in accordance with the Stock Compensation Topic of the ASC. The tax benefits associated with these share-based payments are classified as financing activities in the Statements of Consolidated Cash Flows.
At December 31, 2012, the Company had total unrecognized stock-based compensation expense of $68,558 that is expected to be recognized over a weighted-average period of 1.30 years. Stock-based compensation expense during 2012, 2011 and 2010 was $54,348, $48,176 and $42,276, respectively. The Company recognized a total income tax benefit related to stock-based
compensation expense of $20,948, $18,570 and $16,290 during 2012, 2011 and 2010, respectively. The impact of total stock-based compensation expense, net of taxes, on net income reduced Basic and Diluted net income per common share by $.33 and $.32 during 2012, respectively.
Option rights. The fair value of the Company’s option rights was estimated at the date of grant using a Black-Scholes-Merton option-pricing model with the following weighted-average assumptions for all options granted:
2012 2011 2010Risk-free interest rate ............. .78% 1.13% 1.16%Expected life of option rights ... 5.11 years 5.27 years 5.27 yearsExpected dividend yield
of stock .................................... 1.43% 1.77% 1.84%Expected volatility of stock ... .274 .303 .304
The risk-free interest rate is based upon the U.S. Treasury yield curve at the time of grant. The expected life of option rights was calculated using a scenario analysis model. Historical data was used to aggregate the holding period from actual exercises, post-vesting cancellations and hypothetical assumed exercises on all outstanding option rights. The expected dividend yield of stock is the Company’s best estimate of the expected future dividend yield. Expected volatility of stock was calculated using historical and implied volatilities. The Company applied an estimated forfeiture rate of 2.60 percent to the 2012 grants. This rate was calculated based upon historical activity and is an estimate of granted shares not expected to vest. If actual forfeitures differ from the expected rate, the Company may be re-quired to make additional adjustments to compensation expense in future periods.
Grants of option rights for non-qualified and incentive stock options have been awarded to certain officers, key employees and nonemployee directors under the 2006 Employee Plan, the 2003 Stock Plan, and the 1997 Plan. The option rights generally become exercisable to the extent of one-third of the optioned shares for each full year following the date of grant and generally expire ten years after the date of grant. Unrecognized compensation expense with respect to option rights granted to eligible employees amounted to $37,974 at December 31, 2012. The unrecognized compensation expense is being amortized on a straight-line basis over the three-year vesting period and is expected to be recognized over a weighted average period of 1.36 years.
The weighted-average per share grant date fair value of options granted during 2012, 2011 and 2010, respectively, was $32.74, $18.47 and $16.83. The total intrinsic value of exercised option rights for employees was $298,883, $53,100 and $74,440, and for nonemployee directors was $1,412, $1,129 and $626 during 2012, 2011 and 2010, respectively. The total fair value of options vested during the year was $25,879, $25,868 and
35161_Financials_Wt.indd 69 2/21/13 3:10 PM
■ 70■ 70
NOTES TO CONSOLIDATED FINANCIAL STATEMENTS(thousands of dollars unless otherwise indicated)
$25,073 during 2012, 2011 and 2010, respectively. The outstand-ing option rights for nonemployee directors were 3,500, 17,500 and 37,500 for 2012, 2011 and 2010, respectively. The Company issues new shares upon exercise of option rights or granting of restricted stock.
A summary of the Company’s non-qualified and incentive stock option right activity for employees and nonemployee direc-tors, and related information for the years ended December 31 is shown in the following table:
2012 2011 2010
Optioned Shares
Weighted- Average
Exercise Price Per Share
Aggregate Intrinsic
ValueOptioned
Shares
Weighted- Average
Exercise Price Per Share
Aggregate Intrinsic
ValueOptioned
Shares
Weighted- Average
Exercise Price Per Share
Aggregate Intrinsic
ValueOutstanding
beginning of year .. 9,857,695 $ 60.31 10,009,385 $ 55.82 10,897,652 $ 50.30Granted ......................... 1,089,240 152.93 1,407,259 78.72 1,586,984 72.48Exercised ...................... (4,140,822) 53.40 (1,480,058) 47.15 (2,436,639) 41.95Forfeited ....................... (57,730) 78.01 (76,354) 67.02 (34,999) 58.90Expired .......................... (257) 72.65 (2,537) 53.65 (3,613) 54.71 Outstanding end
of year ....................... 6,748,126 $ 79.39 $ 494,699 9,857,695 $ 60.31 $ 287,526 10,009,385 $ 55.82 $ 281,349Exercisable at end
of year ....................... 4,245,891 $ 61.43 $ 386,484 6,908,116 $ 54.24 $ 243,440 6,655,569 $ 50.78 $ 220,647
The weighted average remaining term for options outstand-ing at the end of 2012, 2011 and 2010, respectively, was 6.99, 6.54 and 6.76 years. The weighted average remaining term for options exercisable at the end of 2012, 2011 and 2010, respectively, was 5.79, 5.39 and 5.58 years. Shares reserved for future grants of option rights and restricted stock were 6,810,439, 8,155,734 and 9,826,006 at December 31, 2012, 2011 and 2010, respectively.
Restricted stock. Grants of restricted stock, which generally require three years of continuous employment from the date of grant before vesting and receiving the stock without restric-tion, have been awarded to certain officers and key employees under the 2006 Employee Plan. Prior to 2010, all awards were performance-based, and the shares of stock to be received with-out restriction under these plans were based on the Company’s achievement of specified financial goals relating to average return on average equity and earnings before interest, taxes, de-preciation and amortization. The February 2012, 2011 and 2010 grants consisted of approximately two-thirds performance-based awards that vest at the end of a three year period based on the Company’s achievement of specified financial goals relating to average return on average equity and earnings per share (for the February 2010 grant) and earnings per share (for the February 2011 and 2012 grants) and one-third time-based awards that vest at the end of a three year period based on continuous employment. Unrecognized compensation expense with respect to grants of restricted stock to eligible employees amounted to $29,286 at December 31, 2012 and is being amortized on a
straight-line basis over the vesting period and is expected to be recognized over a weighted average period of 1.12 years.
Grants of restricted stock have been awarded to nonem-ployee directors under the Nonemployee Plan and the 1997 Plan. These grants generally vest and stock is received without restriction to the extent of one-third of the granted stock for each year following the date of grant. Unrecognized compensation expense with respect to grants of restricted stock to nonem-ployee directors amounted to $1,298 at December 31, 2012 and is being amortized on a straight-line basis over the three-year vesting period and is expected to be recognized over a weighted average period of 1.43 years.
A summary of grants of restricted stock to certain officers, key employees and nonemployee directors during each year is as follows:
2012 2011 2010Restricted stock granted .......... 301,856 300,677 348,460Weighted-average per share
fair value of restricted stock granted during the year ........ $ 99.47 $ 84.86 $ 64.49
A summary of the Company’s restricted stock activity for the years ended December 31 is shown in the following table:
2012 2011 2010Outstanding at
beginning of year .............. 1,304,891 1,266,201 1,304,386Granted .................................... 301,856 300,677 348,460Vested ....................................... (412,859) (16,072) (300,598)Forfeited .................................. (274,140) (245,915) (86,047)Outstanding at
end of year .......................... 919,748 1,304,891 1,266,201
35161_Financials_Wt.indd 70 2/21/13 3:10 PM
■ 71■ 71
NOTES TO CONSOLIDATED FINANCIAL STATEMENTS(thousands of dollars unless otherwise indicated)
NOTE 13 – OTHEROther general expense - net. Included in Other general
expense - net were the following:2012 2011 2010
Provisions for environmental matters - net ............................... $ 6,736 $ 9,100 $ 7,089
Loss (gain) on disposition of assets ....................................... 3,454 (5,469) 2,720
Net income of exit or disposal activities ....................................... (4,942) (900) (6,006)
Total ................................................... $ 5,248 $ 2,731 $ 3,803
Provisions for environmental matters–net represent initial provisions for site-specific estimated costs of environmental investigation or remediation and increases or decreases to environmental-related accruals as information becomes available upon which more accurate costs can be reasonably estimated and as additional accounting guidelines are issued. Environmental-related accruals are not recorded net of insur-ance proceeds in accordance with the Offsetting Subtopic of the Balance Sheet Topic of the ASC. See Note 8 for further details on the Company’s environmental-related activities.
The loss (gain) on disposition of assets represents net realized gains and losses associated with the disposal of property, plant and equipment and intangible assets previously used in the conduct of the primary business of the Company.
The net income of exit or disposal activities includes changes to accrued qualified exit costs as information becomes available upon which more accurate amounts can be reasonably estimated, initial impairments of carrying value and additional impairments for subsequent reductions in estimated fair value of property, plant and equipment held for disposal. See Note 5 for further details on the Company’s exit or disposal activities.
Other income - net. Included in Other income - net were the following:
2012 2011 2010Dividend and royalty
income ................................... $ (4,666) $ (4,963) $ (3,857)Net expense from
financing activities ............. 9,220 8,023 9,256Foreign currency transaction
related (gains) losses ........ (3,071) 4,748 22Other income ........................... (21,074) (22,167) (14,059)Other expense .......................... 9,651 9,550 7,857Total ............................................ $ (9,940) $ (4,809) $ (781)
The Net expense from financing activities includes the net expense relating to changes in the Company’s financing fees.
Foreign currency transaction related (gains) losses represent net realized (gains) losses on U.S. dollar-denominated liabilities of foreign subsidiaries and net realized and unrealized (gains) losses from foreign currency option and forward contracts. There were no foreign currency option and forward contracts outstand-ing at December 31, 2012, 2011 and 2010.
Other income and Other expense included items of revenue, gains, expenses and losses that were unrelated to the primary business purpose of the Company. There were no items within Other income or Other expense that were individually significant.
NOTE 14 – INCOME TAXESDeferred income taxes reflect the net tax effects of tempo-
rary differences between the carrying amounts of assets and liabilities for financial reporting purposes and the amounts used for income tax purposes using the enacted tax rates and laws that are currently in effect. Significant components of the Company’s deferred tax assets and liabilities as of December 31, 2012, 2011 and 2010 were as follows:
2012 2011 2010Deferred tax assets:Exit costs, environmental
and other similar items ... $ 45,403 $ 53,928 $ 64,773Deferred employee
benefit items ..................... 93,039 74,577 57,810Other items (each less than
5 percent of total assets) ... 73,388 83,192 79,014Total deferred tax assets ... $ 211,830 $ 211,697 $ 201,597Deferred tax liabilities:Depreciation and
amortization ..................... $ 202,891 $ 192,035 $ 165,917
Netted against the Company’s other deferred tax assets were valuation reserves of $11,474, $8,017 and $17,756 at December 31, 2012, 2011 and 2010, respectively, resulting from the uncertainty as to the realization of the tax benefits from certain foreign net operating losses and certain other foreign assets. The Company has $8,650 of domestic net operating loss carryforwards acquired through acquisitions that have expiration dates through the tax year 2030 and foreign net operating losses of $47,412. The foreign net operating losses are related to various jurisdictions that provide for either indefinite carryforward periods or carryforward periods with various expiration periods.
Significant components of the provisions for income taxes were as follows:
2012 2011 2010Current:
Federal ......................... $ 207,791 $ 204,284 $ 127,498Foreign ........................ 51,264 50,272 50,765State and local ........... 27,642 28,219 16,966
Total current ........ 286,697 282,775 195,229Deferred:
Federal ......................... 8,692 20,713 27,903Foreign ........................ (16,964) (3,922) (7,145)State and local ........... (2,150) 122 (688)
Total deferred ...... (10,422) 16,913 20,070Total provisions for
income taxes .............. $ 276,275 $ 299,688 $ 215,299
35161_Financials_Wt.indd 71 2/21/13 3:10 PM
■ 72■ 72
NOTES TO CONSOLIDATED FINANCIAL STATEMENTS(thousands of dollars unless otherwise indicated)
The provisions for income taxes included estimated taxes payable on that portion of retained earnings of foreign subsidiar-ies expected to be received by the Company. The effect of the repatriation provisions of the American Jobs Creation Act of 2004 and the provisions of the Income Taxes Topic of the ASC, was $7,572 in 2012, $(491) in 2011 and $1,885 in 2010. A provi-sion was not made with respect to $19,274 of retained earnings at December 31, 2012 that have been invested by foreign subsidiar-ies. The unrecognized deferred tax liability related to those earnings is approximately $1.0 million.
Significant components of income before income taxes as used for income tax purposes, were as follows:
2012 2011 2010Domestic ................. $ 712,873 $ 560,395 $ 539,120Foreign ..................... 194,436 181,153 138,664
$ 907,309 $ 741,548 $ 677,784
A reconciliation of the statutory federal income tax rate to the effective tax rate follows:
2012 2011 2010Statutory federal income tax rate ....... 35.0% 35.0% 35.0%
Effect of:State and local income taxes ........... 1.8 2.1 1.6Investment vehicles ........................... (2.1) (1.9) (1.6)ESOP IRS audit settlement ............ 10.1Domestic production activities ...... (1.9) (2.4) (2.5)Other - net ............................................. (2.4) (2.5) (0.7)
Effective tax rate ...................................... 30.4% 40.4% 31.8%
The 2012 state and local income tax and investment vehicles components of the effective tax rate were consistent with the 2011 tax year. The domestic production activities component of the effective tax rate decreased compared to 2011 due to the domestic taxable income limitation as set forth in the Internal Revenue Code. During the fourth quarter of 2011, the Company reached a settlement with the Internal Revenue Service (IRS) that resolved all ESOP related tax issues for the 2003 through 2009 tax years. The settlement negatively impacted the effective tax rate for 2011.
On January 2, 2013, the American Taxpayer Relief Act (ATRA) was enacted which retroactively reinstated and ex-tended the Federal Research and Development Tax Credit from January 1, 2012 to December 31, 2013. As a result, the Company expects to recognize an immaterial discrete tax benefit during the first quarter of 2013. The other provisions of the Act will have a negligible impact on the Company’s effective tax rate in 2013.
The Company and its subsidiaries file income tax returns in the U.S. federal jurisdiction, and various state and foreign juris-dictions. The IRS commenced an examination of the Company’s U.S. income tax returns for the 2008 and 2009 tax years in the third quarter of 2011. Fieldwork is expected to be completed
during 2013. At this time, the Company has determined that an insignificant refund is due for issues under review during this au-dit period. The Company has fully resolved all IRS issues for the 2003 through 2009 tax years relating to the matters challenging the ESOP related federal income tax deductions claimed by the Company. With the exception of $2.0 million of interest related to the 2008 tax year, all ESOP related settlement payments have been made to the IRS.
As of December 31, 2012, the Company is subject to non-U.S. income tax examinations for the tax years of 2005 through 2012. In addition, the Company is subject to state and local income tax examinations for the tax years 2002 through 2012.
A reconciliation of the beginning and ending amount of unrecognized tax benefits is as follows:
2012 2011 2010Balance at beginning
of year ................................ $ 29,666 $ 31,268 $ 36,963Additions based on tax
positions related to the current year ............... 3,760 2,807 3,109
Additions for tax positions of prior years .................... 7,392 1,354 1,841
Reductions for tax positions of prior years ..................... (6,583) (3,339) (9,123)
Settlements ............................ (1,139) (1,089) (55)Lapses of Statutes of
Limitations ....................... (4,977) (1,335) (1,467)Balance at end of year ........ $ 28,119 $ 29,666 $ 31,268
Included in the balance of unrecognized tax benefits at December 31, 2012, 2011 and 2010 is $25,011, $25,569 and $27,428 in unrecognized tax benefits, the recognition of which would have an effect on the effective tax rate.
Included in the balance of unrecognized tax benefits at December 31, 2012 is $6,981 related to tax positions for which it is reasonably possible that the total amounts could significantly change during the next twelve months. This amount represents a decrease in unrecognized tax benefits comprised primarily of items related to federal audits of partnership investments, assessed state income tax audits, state settlement negotiations currently in progress and expiring statutes in federal, foreign and state jurisdictions.
The Company classifies all income tax related interest and penalties as income tax expense. During the years ended December 31, 2012, 2011 and 2010, the Company recognized a release of $1,532, $1,163 and $1,544, respectively, in income tax interest and penalties. At December 31, 2012, 2011 and 2010, the Company has accrued $6,178, $8,095 and $10,197, respectively, for the potential payment of interest and penalties.
35161_Financials_Wt.indd 72 2/21/13 3:10 PM
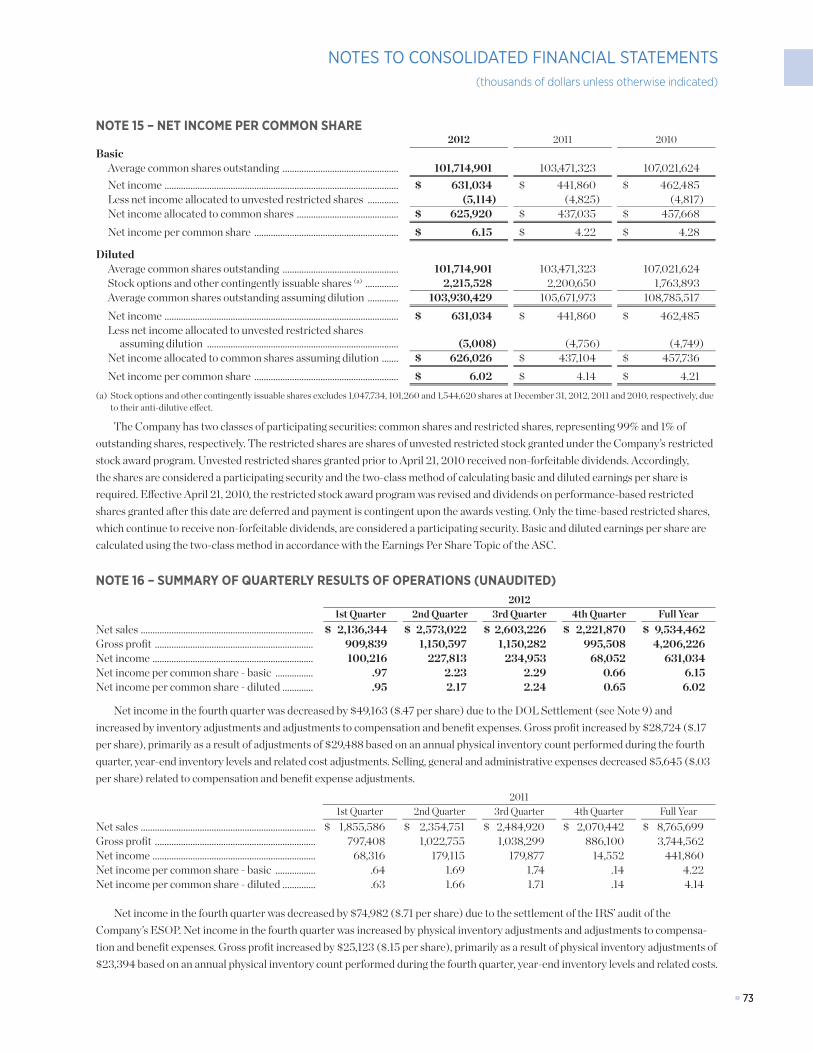
■ 73■ 73
NOTES TO CONSOLIDATED FINANCIAL STATEMENTS(thousands of dollars unless otherwise indicated)
NOTE 15 – NET INCOME PER COMMON SHARE2012 2011 2010
BasicAverage common shares outstanding ................................................. 101,714,901 103,471,323 107,021,624Net income ................................................................................................... $ 631,034 $ 441,860 $ 462,485Less net income allocated to unvested restricted shares ............. (5,114) (4,825) (4,817)Net income allocated to common shares ........................................... $ 625,920 $ 437,035 $ 457,668Net income per common share ............................................................. $ 6.15 $ 4.22 $ 4.28
DilutedAverage common shares outstanding ................................................. 101,714,901 103,471,323 107,021,624Stock options and other contingently issuable shares (a) .............. 2,215,528 2,200,650 1,763,893Average common shares outstanding assuming dilution ............. 103,930,429 105,671,973 108,785,517Net income ................................................................................................... $ 631,034 $ 441,860 $ 462,485Less net income allocated to unvested restricted shares
assuming dilution ................................................................................. (5,008) (4,756) (4,749)Net income allocated to common shares assuming dilution ....... $ 626,026 $ 437,104 $ 457,736Net income per common share ............................................................. $ 6.02 $ 4.14 $ 4.21
(a) Stock options and other contingently issuable shares excludes 1,047,734, 101,260 and 1,544,620 shares at December 31, 2012, 2011 and 2010, respectively, due to their anti-dilutive effect.
The Company has two classes of participating securities: common shares and restricted shares, representing 99% and 1% of outstanding shares, respectively. The restricted shares are shares of unvested restricted stock granted under the Company’s restricted stock award program. Unvested restricted shares granted prior to April 21, 2010 received non-forfeitable dividends. Accordingly, the shares are considered a participating security and the two-class method of calculating basic and diluted earnings per share is required. Effective April 21, 2010, the restricted stock award program was revised and dividends on performance-based restricted shares granted after this date are deferred and payment is contingent upon the awards vesting. Only the time-based restricted shares, which continue to receive non-forfeitable dividends, are considered a participating security. Basic and diluted earnings per share are calculated using the two-class method in accordance with the Earnings Per Share Topic of the ASC.
NOTE 16 – SUMMARY OF QUARTERLY RESULTS OF OPERATIONS (UNAUDITED)2012
1st Quarter 2nd Quarter 3rd Quarter 4th Quarter Full YearNet sales ......................................................................... $ 2,136,344 $ 2,573,022 $ 2,603,226 $ 2,221,870 $ 9,534,462Gross profit ................................................................... 909,839 1,150,597 1,150,282 995,508 4,206,226Net income .................................................................... 100,216 227,813 234,953 68,052 631,034Net income per common share - basic ................ .97 2.23 2.29 0.66 6.15Net income per common share - diluted ............. .95 2.17 2.24 0.65 6.02
Net income in the fourth quarter was decreased by $49,163 ($.47 per share) due to the DOL Settlement (see Note 9) and increased by inventory adjustments and adjustments to compensation and benefit expenses. Gross profit increased by $28,724 ($.17 per share), primarily as a result of adjustments of $29,488 based on an annual physical inventory count performed during the fourth quarter, year-end inventory levels and related cost adjustments. Selling, general and administrative expenses decreased $5,645 ($.03 per share) related to compensation and benefit expense adjustments.
20111st Quarter 2nd Quarter 3rd Quarter 4th Quarter Full Year
Net sales .......................................................................... $ 1,855,586 $ 2,354,751 $ 2,484,920 $ 2,070,442 $ 8,765,699Gross profit .................................................................... 797,408 1,022,755 1,038,299 886,100 3,744,562Net income ..................................................................... 68,316 179,115 179,877 14,552 441,860Net income per common share - basic ................. .64 1.69 1.74 .14 4.22Net income per common share - diluted .............. .63 1.66 1.71 .14 4.14
Net income in the fourth quarter was decreased by $74,982 ($.71 per share) due to the settlement of the IRS’ audit of the Company’s ESOP. Net income in the fourth quarter was increased by physical inventory adjustments and adjustments to compensa-tion and benefit expenses. Gross profit increased by $25,123 ($.15 per share), primarily as a result of physical inventory adjustments of $23,394 based on an annual physical inventory count performed during the fourth quarter, year-end inventory levels and related costs.
35161_Financials_Wt.indd 73 2/21/13 3:10 PM
■ 74■ 74
NOTES TO CONSOLIDATED FINANCIAL STATEMENTS(thousands of dollars unless otherwise indicated)
NOTE 17 – OPERATING LEASESThe Company leases certain stores, warehouses, manufac-
turing facilities, office space and equipment. Renewal options are available on the majority of leases and, under certain conditions, options exist to purchase certain properties. Rental expense for operating leases, recognized on a straight-line basis over the lease term in accordance with the Leases Topic of the ASC was $310,109, $292,516 and $282,309 for 2012, 2011 and 2010, respectively. Certain store leases require the payment of con-tingent rentals based on sales in excess of specified minimums. Contingent rentals included in rent expense were $39,340, $36,917 and $37,602 in 2012, 2011 and 2010, respectively. Rental income, as lessor, from real estate leasing activities and sublease rental income for all years presented was not significant. The following schedule summarizes the future minimum lease payments under noncancellable operating leases having initial or remaining terms in excess of one year at December 31, 2012:2013 ................................................................................ $ 242,3602014 ................................................................................ 226,9752015 ................................................................................ 192,1172016 ................................................................................ 151,6542017 ................................................................................ 103,573Later years ................................................................... 191,844Total minimum lease payments ............................ $ 1,108,523
NOTE 18 – REPORTABLE SEGMENT INFORMATIONThe Company reports its segment information in the same
way that management internally organizes its business for as-sessing performance and making decisions regarding allocation of resources in accordance with the Segment Reporting Topic of the ASC. The Company has determined that it has four reportable operating segments: Paint Stores Group, Consumer Group, Global Finishes Group and Latin America Coatings Group (individually, a “Reportable Segment” and collectively, the “Reportable Segments”). Factors considered in determining the four Reportable Segments of the Company include the nature of business activities, the management structure directly account-able to the Company’s chief operating decision maker (CODM) for operating and administrative activities, availability of discrete financial information and information presented to the Board of Directors. The Company reports all other business activities and immaterial operating segments that are not reportable in the Administrative segment. See pages 8 through 15 of this report for more information about the Reportable Segments.
The Company’s CODM has been identified as the Chief Executive Officer because he has final authority over performance assessment and resource allocation decisions. Because of the diverse operations of the Company, the CODM regularly receives discrete financial information about each Reportable Segment as well as a significant amount of additional
financial information about certain divisions, business units or subsidiaries of the Company. The CODM uses all such financial information for performance assessment and resource alloca-tion decisions. The CODM evaluates the performance of and allocates resources to the Reportable Segments based on profit or loss before income taxes and cash generated from operations. The accounting policies of the Reportable Segments are the same as those described in Note 1 of this report.
The Paint Stores Group consisted of 3,520 company-oper-ated specialty paint stores in the United States, Canada, Puerto Rico, Virgin Islands, Trinidad and Tobago, St. Maarten, Jamaica, Curacao and Aruba at December 31, 2012. Each store in this seg-ment is engaged in the related business activity of selling paint, coatings and related products to end-use customers. The Paint Stores Group markets and sells Sherwin-Williams® branded architectural paint and coatings, protective and marine products, OEM product finishes and related items. These products are produced by manufacturing facilities in the Consumer Group. In addition, each store sells selected purchased associated products. The loss of any single customer would not have a material adverse effect on the business of this segment. During 2012, this segment opened 70 net new stores, consisting of 81 new stores opened (63 in the United States, 14 in Canada, 1 in Puerto Rico and 3 in Trinidad) and 11 stores closed in the United States. In 2011 and 2010, this segment opened 60 and 36 net new stores, respectively. A map on the cover flap of this report shows the number of paint stores and their geographic location. The CODM uses discrete financial information about the Paint Stores Group, supplemented with information by geographic region, product type and customer type, to assess performance of and allocate resources to the Paint Stores Group as a whole. In accordance with ASC 280-10-50-9, the Paint Stores Group as a whole is considered the operating segment, and because it meets the criteria in ASC 280-10-50-10, it is also considered a Reportable Segment.
The Consumer Group develops, manufactures and distrib-utes a variety of paint, coatings and related products to third party customers primarily in the United States and Canada and the Paint Stores Group. Approximately 64 percent of the total sales of the Consumer Group in 2012 were inter-segment transfers of products primarily sold through the Paint Stores Group. Sales and marketing of certain controlled brand and private labeled products is performed by a direct sales staff. The products distributed through third party customers are intended for resale to the ultimate end-user of the product. The Consumer Group had sales to certain customers that, individually, may be a significant portion of the sales of the segment. However, the loss of any single customer would not have a material adverse effect on the overall profitability of the segment. This segment incurred most of the Company’s capital expenditures related to ongoing
35161_Financials_Wt.indd 74 2/21/13 3:10 PM
■ 75■ 75
NOTES TO CONSOLIDATED FINANCIAL STATEMENTS(thousands of dollars unless otherwise indicated)
environmental compliance measures. The CODM uses discrete financial information about the Consumer Group, supplemented with information by product types and customer, to assess performance of and allocate resources to the Consumer Group as a whole. In accordance with ASC 280-10-50-9, the Consumer Group as a whole is considered the operating segment, and because it meets the criteria in ASC 280-10-50-10, it is also considered a Reportable Segment.
The Global Finishes Group develops, licenses, manufactures, distributes and sells a variety of protective and marine products, automotive finishes and refinish products, OEM product finishes and related products in North and South America, Europe and Asia. This segment meets the demands of its customers for a consistent worldwide product development, manufacturing and distribution presence and approach to doing business. This segment licenses certain technology and trade names worldwide. Sherwin-Williams® and other controlled brand products are distributed through the Paint Stores Group and this segment’s 302 company-operated branches and by a direct sales staff and outside sales representatives to retailers, dealers, jobbers, licensees and other third party distributors. During 2012, this segment opened 1 new branch in the United States and closed 2 in the United States for a net decrease of 1 branch. At December 31, 2012, the Global Finishes Group consisted of operations in the United States, subsidiaries in 34 foreign countries and income from licensing agreements in 16 foreign countries. The CODM uses discrete financial information about the Global Finishes Group reportable segment, supplemented with information about geographic divisions, business units, and subsidiaries, to assess performance of and allocate resources to the Global Finishes Group as a whole. In accordance with ASC 280-10-50-9, the Global Finishes Group as a whole is considered the operating segment, and because it meets the criteria in ASC 280-10-50-10, it is also considered a Reportable Segment. A map on the cover flap of this report shows the number of branches and their geographic locations.
The Latin America Coatings Group develops, licenses, manu-factures, distributes and sells a variety of architectural paint and coatings, protective and marine products, OEM product finishes and related products in North and South America. This segment meets the demands of its customers for consistent regional product development, manufacturing and distribution presence and approach to doing business. Sherwin-Williams® and other controlled brand products are distributed through this segment’s 276 company-operated stores and by a direct sales staff and outside sales representatives to retailers, dealers, licensees and other third party distributors. During 2012, this segment opened 17 new stores (9 in South America and 8 in Mexico) and closed 6 in South America for a net increase of 11 stores. At December 31, 2012, the Latin America Coatings Group consisted of operations
from subsidiaries in 9 foreign countries, 4 foreign joint ventures and income from licensing agreements in 10 foreign countries. The CODM uses discrete financial information about the Latin America Coatings Group, supplemented with information about geographic divisions, business units, and subsidiaries, to assess performance of and allocate resources to the Latin America Coatings Group as a whole. In accordance with ASC 280-10-50-9, the Latin America Coatings Group as a whole is considered the operating segment, and because it meets the criteria in ASC 280-10-50-10, it is also considered a Reportable Segment. A map on the cover flap of this report shows the number of stores and their geographic locations.
The Administrative segment includes the administrative expenses of the Company’s corporate headquarters site. Also included in the Administrative segment was interest expense, interest and investment income, certain expenses related to closed facilities and environmental-related matters, and other expenses which were not directly associated with the Reportable Segments. The Administrative segment did not include any sig-nificant foreign operations. Also included in the Administrative segment was a real estate management unit that is responsible for the ownership, management and leasing of non-retail properties held primarily for use by the Company, including the Company’s headquarters site, and disposal of idle facilities. Sales of this segment represented external leasing revenue of excess headquarters space or leasing of facilities no longer used by the Company in its primary businesses. Gains and losses from the sale of property were not a significant operating factor in determining the performance of the Administrative segment.
Net external sales of all consolidated foreign subsidiaries were $2,049,814, $1,982,859 and $1,468,116 for 2012, 2011 and 2010, respectively. Segment profit of all consolidated foreign subsidiaries was $158,377, $122,436 and $86,951 for 2012, 2011 and 2010, respectively. Domestic operations accounted for the remaining net external sales and segment profits. Long-lived assets consisted of Property, plant and equipment, Goodwill, Intangible assets, Deferred pension assets and Other assets. The aggregate total of long-lived assets for the Company was $3,085,499, $2,967,660 and, $2,955,513 at December 31, 2012, 2011 and 2010, respectively. Long-lived assets of consolidated foreign subsidiaries totaled $718,409, $650,681 and $664,547 at December 31, 2012, 2011 and 2010, respectively. Total Assets of the Company were $6,234,737, $5,229,252 and $5,169,235 at December 31, 2012, 2011 and 2010, respectively. Total assets of consolidated foreign subsidiaries were $1,598,996, $1,443,034 and $1,467,969, which represented 25.6 percent, 27.6 percent and 28.4 percent of the Company’s total assets at December 31, 2012, 2011 and 2010, respectively. No single geographic area outside the United States was significant relative to consolidated net sales or operating profits. Export sales and sales to any individual
35161_Financials_Wt.indd 75 2/21/13 3:10 PM
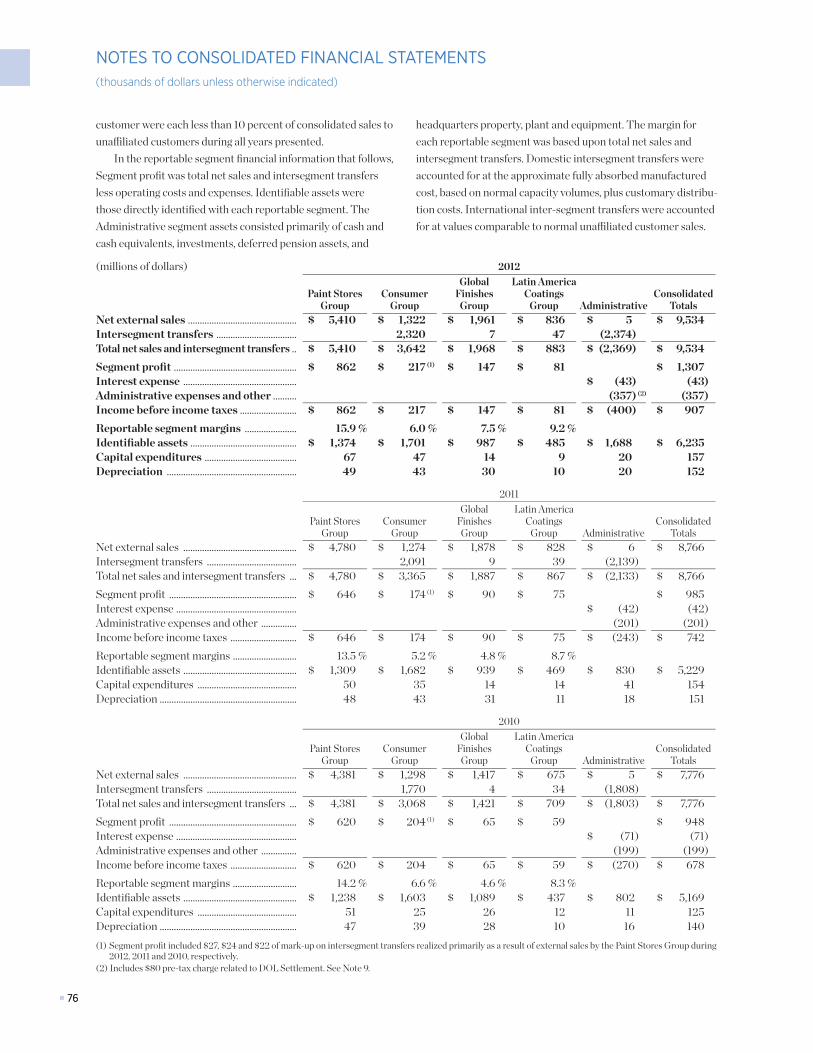
■ 76■ 76
NOTES TO CONSOLIDATED FINANCIAL STATEMENTS(thousands of dollars unless otherwise indicated)
customer were each less than 10 percent of consolidated sales to unaffiliated customers during all years presented.
In the reportable segment financial information that follows, Segment profit was total net sales and intersegment transfers less operating costs and expenses. Identifiable assets were those directly identified with each reportable segment. The Administrative segment assets consisted primarily of cash and cash equivalents, investments, deferred pension assets, and
headquarters property, plant and equipment. The margin for each reportable segment was based upon total net sales and intersegment transfers. Domestic intersegment transfers were accounted for at the approximate fully absorbed manufactured cost, based on normal capacity volumes, plus customary distribu-tion costs. International inter-segment transfers were accounted for at values comparable to normal unaffiliated customer sales.
(millions of dollars) 2012
Paint Stores Group
Consumer Group
Global Finishes
Group
Latin America Coatings
Group AdministrativeConsolidated
TotalsNet external sales .............................................. $ 5,410 $ 1,322 $ 1,961 $ 836 $ 5 $ 9,534Intersegment transfers .................................. 2,320 7 47 (2,374) Total net sales and intersegment transfers .. $ 5,410 $ 3,642 $ 1,968 $ 883 $ (2,369) $ 9,534Segment profit .................................................... $ 862 $ 217 (1) $ 147 $ 81 $ 1,307 Interest expense ................................................ $ (43) (43)Administrative expenses and other .......... (357) (2) (357)Income before income taxes ........................ $ 862 $ 217 $ 147 $ 81 $ (400) $ 907Reportable segment margins ...................... 15.9 % 6.0 % 7.5 % 9.2 %Identifiable assets ............................................. $ 1,374 $ 1,701 $ 987 $ 485 $ 1,688 $ 6,235Capital expenditures ....................................... 67 47 14 9 20 157Depreciation ....................................................... 49 43 30 10 20 152
2011
Paint Stores Group
Consumer Group
Global Finishes
Group
Latin America Coatings
Group AdministrativeConsolidated
TotalsNet external sales ................................................ $ 4,780 $ 1,274 $ 1,878 $ 828 $ 6 $ 8,766Intersegment transfers ...................................... 2,091 9 39 (2,139) Total net sales and intersegment transfers ... $ 4,780 $ 3,365 $ 1,887 $ 867 $ (2,133) $ 8,766Segment profit ...................................................... $ 646 $ 174 (1) $ 90 $ 75 $ 985Interest expense ................................................... $ (42) (42)Administrative expenses and other ............... (201) (201)Income before income taxes ............................ $ 646 $ 174 $ 90 $ 75 $ (243) $ 742Reportable segment margins ........................... 13.5 % 5.2 % 4.8 % 8.7 %Identifiable assets ................................................ $ 1,309 $ 1,682 $ 939 $ 469 $ 830 $ 5,229Capital expenditures .......................................... 50 35 14 14 41 154Depreciation .......................................................... 48 43 31 11 18 151
2010
Paint Stores Group
Consumer Group
Global Finishes
Group
Latin America Coatings
Group AdministrativeConsolidated
TotalsNet external sales ................................................ $ 4,381 $ 1,298 $ 1,417 $ 675 $ 5 $ 7,776Intersegment transfers ...................................... 1,770 4 34 (1,808) Total net sales and intersegment transfers ... $ 4,381 $ 3,068 $ 1,421 $ 709 $ (1,803) $ 7,776Segment profit ...................................................... $ 620 $ 204 (1) $ 65 $ 59 $ 948Interest expense ................................................... $ (71) (71)Administrative expenses and other ............... (199) (199)Income before income taxes ............................ $ 620 $ 204 $ 65 $ 59 $ (270) $ 678Reportable segment margins ........................... 14.2 % 6.6 % 4.6 % 8.3 %Identifiable assets ................................................ $ 1,238 $ 1,603 $ 1,089 $ 437 $ 802 $ 5,169Capital expenditures .......................................... 51 25 26 12 11 125Depreciation .......................................................... 47 39 28 10 16 140(1) Segment profit included $27, $24 and $22 of mark-up on intersegment transfers realized primarily as a result of external sales by the Paint Stores Group during
2012, 2011 and 2010, respectively.(2) Includes $80 pre-tax charge related to DOL Settlement. See Note 9.
35161_Financials_Wt.indd 76 2/21/13 3:10 PM
■ 77
Certain statements contained in “Management’s Discussion and Analysis of Financial Condition and Results of Operations,” “Letter to Shareholders” and elsewhere in this report constitute “forward-looking statements” within the meaning of Section 27A of the Securities Act of 1933 and Section 21E of the Securities Exchange Act of 1934. These forward-looking statements are based upon management’s current expectations, estimates, assumptions and beliefs concerning future events and condi-tions and may discuss, among other things, anticipated future performance (including sales and earnings), expected growth, future business plans and the costs and potential liability for environmental-related matters and the lead pigment and lead-based paint litigation. Any statement that is not historical in nature is a forward-looking statement and may be identified by the use of words and phrases such as “expects,” “anticipates,” “believes,” “will,” “will likely result,” “will continue,” “plans to” and similar expressions.
Readers are cautioned not to place undue reliance on any forward-looking statements. Forward-looking statements are necessarily subject to risks, uncertainties and other factors, many of which are outside the control of the Company, that could cause actual results to differ materially from such statements and from the Company’s historical results and experience. These risks, uncertainties and other factors include such things as: (a) the duration and severity of the current negative global economic and financial conditions; (b) general business conditions, strengths of retail and manufacturing economies and the growth in the coatings industry; (c) competitive factors, including pricing pressures and product innovation and quality; (d) changes in raw material and energy supplies and pricing; (e) changes in the Company’s relationships with customers and suppliers; (f) the Company’s ability to attain cost savings from productivity initiatives; (g) the Company’s ability to successfully integrate past and future acquisitions into its existing operations, including the planned acquisition of Comex and the recent
acquisitions of Leighs Paints, Geocel and Jiangsu Pulanna, as well as the performance of the businesses acquired; (h) risks and uncertainties associated with the Company’s ownership of Life Shield Engineered Systems LLC; (i) changes in general domestic economic conditions such as inflation rates, interest rates, tax rates, unemployment rates, higher labor and healthcare costs, recessions, and changing government policies, laws and regula-tions; ( j) risks and uncertainties associated with the Company’s expansion into and its operations in Asia, Europe, Mexico, South America and other foreign markets, including general economic conditions, inflation rates, recessions, foreign currency exchange rates, foreign investment and repatriation restrictions, legal and regulatory constraints, civil unrest and other external economic and political factors; (k) the achievement of growth in foreign markets, such as Asia, Europe, Mexico and South America; (l) increasingly stringent domestic and foreign governmental regulations including those affecting health, safety and the environment; (m) inherent uncertainties involved in assessing the Company’s potential liability for environmental-related activities; (n) other changes in governmental policies, laws and regulations, including changes in accounting policies and stan-dards and taxation requirements (such as new tax laws and new or revised tax law interpretations); (o) the nature, cost, quantity and outcome of pending and future litigation and other claims, including the lead pigment and lead-based paint litigation, and the effect of any legislation and administrative regulations relating thereto; and (p) unusual weather conditions.
Readers are cautioned that it is not possible to predict or identify all of the risks, uncertainties and other factors that may affect future results and that the above list should not be considered to be a complete list. Any forward-looking statement speaks only as of the date on which such statement is made, and the Company undertakes no obligation to update or revise any forward-looking statement, whether as a result of new informa-tion, future events or otherwise.
CAUTIONARY STATEMENT REGARDING(FORWARD-LOOKING INFORMATION)
35161_Financials_Wt.indd 77 2/21/13 3:10 PM
■ 78
ANNUAL MEETINGThe annual meeting of shareholders will be held in the Landmark Conference Center, 927 Midland Building, 101 W. Prospect Avenue, Cleveland, Ohio on Wednesday, April 17, 2013 at 9:00 A.M., local time.
HEADQUARTERS101 W. Prospect Avenue Cleveland, Ohio 44115-1075 (216) 566-2000 www.sherwin.com
INVESTOR RELATIONSRobert J. Wells Senior Vice President - CorporateCommunications and Public Affairs The Sherwin-Williams Company 101 W. Prospect Avenue Cleveland, Ohio 44115-1075
INDEPENDENT REGISTERED PUBLIC ACCOUNTING FIRMErnst & Young LLPCleveland, Ohio
STOCK TRADINGSherwin-Williams Common Stock— Symbol, SHW—is traded on the New York Stock Exchange.
DIVIDEND REINVESTMENT PROGRAMA dividend reinvestment program is available to shareholders of common stock. For information, contact Wells Fargo Shareowner Services.
FORM 10-KThe Company’s Annual Report onForm 10-K, filed with the Securitiesand Exchange Commission, isavailable without charge. To obtaina copy, contact Investor Relations.
TRANSFER AGENT & REGISTRAROur transfer agent, Wells Fargo Shareowner Services, maintains the records for our registered shareholders and can help with a wide variety of shareholder related services, including the direct deposit of dividends and online access to your account. Contact:Wells Fargo Shareowner ServicesP.O. Box 64856St. Paul, MN 55164-0856www.shareowneronline.com1-800-468-9716 Toll-free651-450-4064 outside the United States651-450-4144 TDD
SHAREHOLDER INFORMATION
35161_Financials_Wt.indd 78 2/21/13 3:10 PM
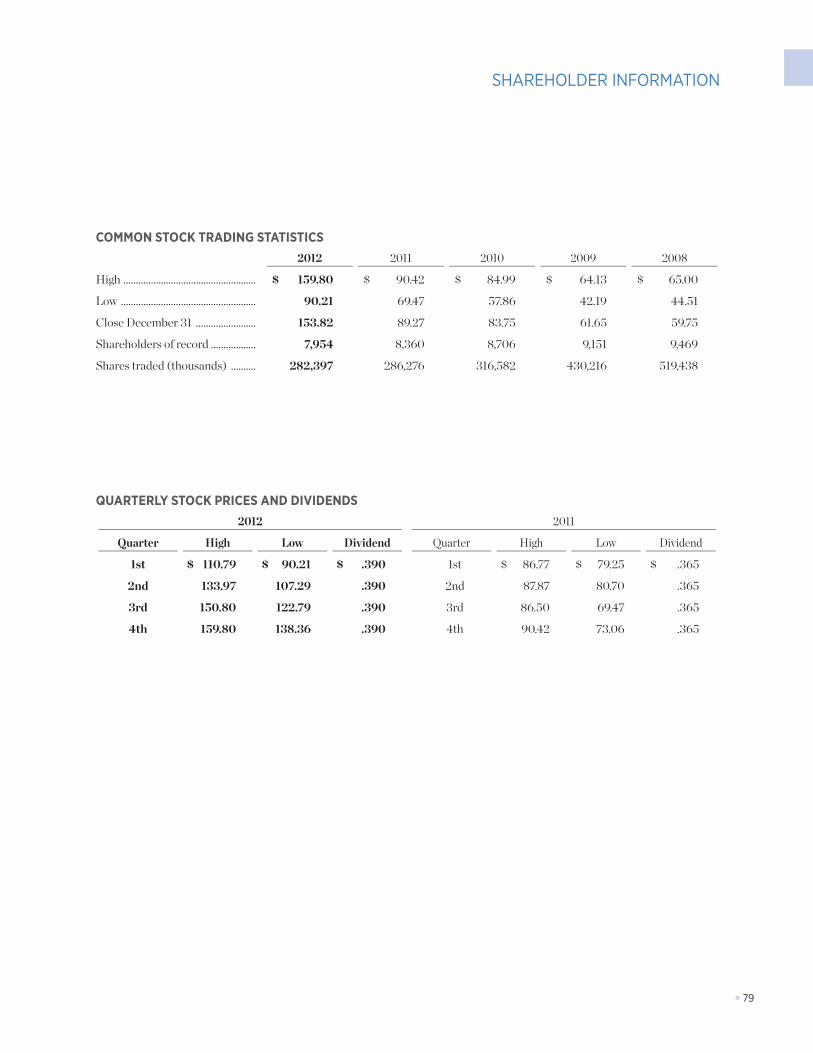
■ 79
SHAREHOLDER INFORMATION
COMMON STOCK TRADING STATISTICS2012 2011 2010 2009 2008
High ..................................................... $ 159.80 $ 90.42 $ 84.99 $ 64.13 $ 65.00
Low ...................................................... 90.21 69.47 57.86 42.19 44.51
Close December 31 ........................ 153.82 89.27 83.75 61.65 59.75
Shareholders of record .................. 7,954 8,360 8,706 9,151 9,469
Shares traded (thousands) .......... 282,397 286,276 316,582 430,216 519,438
QUARTERLY STOCK PRICES AND DIVIDENDS2012 2011
Quarter High Low Dividend Quarter High Low Dividend
1st $ 110.79 $ 90.21 $ .390 1st $ 86.77 $ 79.25 $ .365
2nd 133.97 107.29 .390 2nd 87.87 80.70 .365
3rd 150.80 122.79 .390 3rd 86.50 69.47 .365
4th 159.80 138.36 .390 4th 90.42 73.06 .365
35161_Financials1_Wt.indd 79 2/25/13 10:18 AM
■ 80
CORPORATE OFFICERS ANDOPERATING MANAGEMENT
CORPORATE OFFICERS
Christopher M. Connor, 56* Chairman and Chief Executive Officer
John G. Morikis, 49* President and Chief Operating Officer
Sean P. Hennessy, 55* Senior Vice President - Finance and Chief Financial Officer
Thomas E. Hopkins, 55* Senior Vice President - Human Resources
Catherine M. Kilbane, 49* Senior Vice President, General Counsel and Secretary
Steven J. Oberfeld, 60* Senior Vice President - Corporate Planning and Development
Robert J. Wells, 55* Senior Vice President - Corporate Communications and Public Affairs
Allen J. Mistysyn, 44* Vice President - Corporate Controller
Cynthia D. Brogan, 61 Vice President and Treasurer
Michael T. Cummins, 54 Vice President - Taxes and Assistant Secretary
Edward C. Thompson, 45 Vice President - Corporate Audit and Loss Prevention
Richard M. Weaver, 58 Vice President - Administration
OPERATING MANAGEMENT
Joel Baxter, 52 President & General Manager Global Supply Chain Division Consumer Group
Robert J. Davisson, 52* President Paint Stores Group
Timothy J. Drouilhet, 51 President & General Manager Eastern Division Paint Stores Group
Monty J. Griffin, 52 President & General Manager South Western Division Paint Stores Group
Thomas C. Hablitzel, 50 President & General Manager Automotive Division Global Finishes Group
George E. Heath, 47* President Global Finishes Group
Peter J. Ippolito, 48 President & General Manager Mid Western Division Paint Stores Group
Timothy A. Knight, 48* President Latin America Coatings Group
David B. Sewell, 44 President & General Manager Product Finishes Division Global Finishes Group
Cheri M. Phyfer, 41 President & General Manager Southeastern Division Paint Stores Group
Ronald B. Rossetto, 46 President & General Manager Protective & Marine Coatings Division Global Finishes Group
Harvey P. Sass, 55 President & General Manager Diversified Brands Division Consumer Group
Thomas W. Seitz, 64* Senior Vice President - Strategic Excellence Initiatives
* Executive Officer as defined by the Securities Exchange Act of 1934.
35161_Financials_Wt.indd 80 2/21/13 3:10 PM

UNITED STATES
CANADA
ASIA/PACIFIC
EUROPE
OUR GLOBAL FOOTPRINT
The largest coatings manufacturer in the United States and third-largest worldwideAs a global leader in the development, manufacture and sale of paint, coatings and related products, Sherwin-Williams has an extensive retail presence throughout the Americas, and growing service capabilities in Europe and Asia/Pacific. The Paint Stores Group has 3,520 company-operated specialty paint stores in the United States, Canada and the Caribbean. More than 90 percent of the U.S. population lives within a 50-mile radius of a Sherwin-Williams store. The Consumer Group sells one of the industry’s strongest portfolios of products through retailers across North America and in parts of Europe. The Global Finishes Group sells to a growing customer base in 120 countries around the world and has 302 company-operated automotive, protective, and marine and product finishes branches. The Latin America Coatings Group operates 276 stores primarily located in Mexico, Brazil, Chile, Ecuador, Uruguay and Colombia.
39 facilities
276 paint stores
26 facilities
64 paint stores
2 facilities
242 branches
18 branches
9 facilities
25 branches
16 branches 12
facilities
8 facilities
1 branch
3,357 paint stores
99 paint stores
7 facilities
CARIBBEAN
LATIN AMERICA / SOUTH AMERICAKEY
Paint Stores Group stores
Consumer Group facilities
Global Finishes Group branches & facilities
Latin America Coatings Group stores & facilities
Corporate headquarters
1facility
Becker Acroma LimitedCompania Sherwin-Williams, S.A. de C.V.Geocel LimitedJiangsu Pulanna Coating Co., Ltd.Oy Sherwin-Williams Finland AbPinturas Condor S.A.Pinturas Industriales S.A.Productos Quimicos y Pinturas, S.A. de C.V.Przedsiebiorstwo Altax Sp. z o.o.Quetzal Pinturas, S.A. de C.V.Ronseal (Ireland) LimitedRonseal LimitedSherwin-Williams Argentina I.y C.S.A.Sherwin-Williams Aruba VBA
FOREIGN SUBSIDIARIES
Contract Transportation Systems Co.Geocel, LLCOmega Specialty Products & Services LLCSherwin-Williams Realty Holdings, Inc.SWIMC, Inc.The Sherwin-Williams Acceptance
Corporation
DOMESTIC SUBSIDIARIES
Sherwin-Williams Automotive Mexico S.de R.L.de C.V.
Sherwin-Williams Balkan S.R.L.Sherwin-Williams BelSherwin-Williams (Belize) LimitedSherwin-Williams Benelux NVSherwin-Williams Canada Inc.Sherwin-Williams (Caribbean) N.V.Sherwin-Williams Cayman Islands LimitedSherwin-Williams Chile S.A.Sherwin-Williams Coatings S.a r.l.Sherwin-Williams Colombia S.A.S.Sherwin-Williams Czech Republic spol. s r.oSherwin-Williams Denmark A/S
Sherwin-Williams Deutschland GmbHSherwin-Williams do Brasil Industria e
Comercio Ltda.Sherwin-Williams France Finishes SASSherwin-Williams HK LimitedSherwin-Williams (Ireland) LimitedSherwin-Williams Italy S.r.l.Sherwin-Williams Luxembourg Investment
Management Company S.a r.l.Sherwin-Williams (Malaysia) Sdn. Bhd.Sherwin-Williams Norway ASSherwin-Williams Paints India Private LimitedSherwin-Williams Paints Limited Liability
Company
Sherwin-Williams Peru S.R.L.Sherwin-Williams Pinturas de Venezuela S.A.Sherwin-Williams Poland Sp. z o.oSherwin-Williams Protective & Marine CoatingsSherwin-Williams (S) Pte. Ltd. Sherwin-Williams Services (Malaysia) Sdn. Bhd.Sherwin-Williams (Shanghai) LimitedSherwin-Williams Spain Coatings S.L.Sherwin-Williams Sweden ABSherwin-Williams (Thailand) Co., Ltd.Sherwin-Williams UK Automotive LimitedSherwin-Williams Uruguay S.A.Sherwin-Williams (Vietnam) LimitedSherwin-Williams VI, LLC
Sherwin-Williams (West Indies) LimitedSWIPCO – Sherwin-Williams do Brasil
Propriedade Intelectual Ltda.The Sherwin-Williams Company Resources
LimitedTOB Becker Acroma UkraineUAB Sherwin-Williams LietuvaZAO Sherwin-WilliamsZhao Qing Sherwin Williams Coatings Co., Ltd.
2012 DIRECTORS
1. JOHN M. STROPKI, 62 Executive Chairman Lincoln Electric Holdings, Inc.
2. RICHARD K. SMUCKER, 64 Chief Executive Officer The J. M. Smucker Company
3. ARTHUR F. ANTON, 55* President and Chief Executive Officer Swagelok Company
4. SUSAN J. KROPF, 64 Retired, former President and Chief Operating Officer Avon Products, Inc.
5. CHRISTOPHER M. CONNOR, 56 Chairman and Chief Executive Officer The Sherwin-Williams Company
6. THOMAS G. KADIEN, 56* Senior Vice President Consumer Packaging and IP Asia International Paper Company
7. RICHARD J. KRAMER, 49* Chairman of the Board, Chief Executive Officer and President The Goodyear Tire & Rubber Company
8. A . MALACHI MIXON, III, 72 Chairman Invacare Corporation
9. DAVID F. HODNIK, 65* Retired, former President and Chief Executive Officer Ace Hardware Corporation
1 2 34
5
6
78
9
*Audit Committee Member
35161_Cover_Wt.indd 2 2/25/13 9:55 AM

The Sherwin-Williams Company was founded by Henry Sherwin and Edward Williams in 1866. Today,
we are a global leader in the manufacture, development, distribution, and sale of coatings and related products
to professional, industrial, commercial, and retail customers. The company manufactures products under well-
known brands such as Sherwin-Williams®, Dutch Boy®, Krylon®, Minwax®, Thompson’s® Water Seal®, and many
more. With global headquarters in Cleveland, Ohio, Sherwin-Williams® branded products are sold exclusively
through more than 4,000 company-operated stores and facilities, while the Company’s other brands are sold
through leading mass merchandisers, home centers, independent paint dealers, hardware stores, automotive
retailers, and industrial distributors. The Sherwin-Williams Global Finishes Group distributes a wide range of
products in 120 countries around the world. For more information, visit www.sherwin.com.
The Company is comprised of four reportable segments, which together provide our customers innovative
solutions to ensure their success, no matter where they work, or what surfaces they are coating.
TABLE OF CONTENTS
Our Global Footprint cover flapFinancial Highlights 1Letter to Shareholders 22012 At A Glance 6Paint Stores Group 8Consumer Group 10Global Finishes Group 12Latin America Coatings Group 14Shareholder Returns 16Financial Performance 17
The Sherwin-Williams Company is an equal opportunity employer that recruits, selects and hires on the basis of individual qualifications and prohibits unlawful discrimination based on race, color, religion, sex, national origin, protected veteran status, disability, age, sexual orientation or any other consideration made unlawful by federal, state or local laws.
● Sherwin-Williams Paint Stores are the exclusive outlets for
Sherwin-Williams® branded paints, stains, supplies, equipment
and floorcovering in the U.S., Canada and the Caribbean.
● Consumer Group sells one of the industry’s strongest
portfolios of branded and private label products through retailers
across North America and in parts of Europe, and also operates
a highly efficient and productive global supply chain for paint,
coatings and related products.
● Global Finishes Group manufactures and sells a wide range
of OEM product finishes, protective and marine coatings, and
automotive finishes to a growing customer base in 120 countries.
● Our Latin America Coatings Group manufactures and sells
a wide range of architectural paints, industrial coatings and related
products throughout Latin America.
ABOUT US
Annual Report
2012The Sherwin-Williams Company101 W. Prospect Avenue
Cleveland, Ohio 44115-1075
www.sherwin-williams.com
35161_Cover_Wt.indd 1 2/25/13 9:55 AM