Quarterly Credit Report - NUS RMI Credit Research Initiative · 2017-08-29 · The Quarterly Credit...
121
Quarterly Credit Report Q2/2017 Volume 7, No 1 Advancing Risk Management for Singapore and Beyond
Transcript of Quarterly Credit Report - NUS RMI Credit Research Initiative · 2017-08-29 · The Quarterly Credit...

Quarterly CreditReport
Q2/2017 Volume 7, No 1
Advancing Risk Management for Singapore and Beyond
1
NUS RMI-CRI Quarterly Credit Report, Q2/2017 1
IntroductionThe Quarterly Credit Report (QCR) is an analysis of credit outlooks across regions,economies and sectors. This analysis incorporates probabilities of default (PD) generated bythe Risk Management Institute - Credit Research Initiative’s (RMI-CRI) default forecast mod-el, a part of the RMI Credit Research Initiative at the National University of Singapore (NUS).The QCR provides insights on trends in credit outlooks to credit professionals, investors andresearchers.
QCR Volume 7, Issue 1 covers the second quarter of 2017. We discuss the general creditoutlook for a selection of economies from around the world, based on relevant indicators,and relate this discussion to forecasts provided by RMI-CRI’s PD model.
The appendices in this volume include a comprehensive overview of various outputs that areproduced by the operational PD system of RMI-CRI. While the PD system output’s defaultforecasts at horizons ranging from one month to five years, the QCR reports only 1-year PDsin order to allow the reader to make consistent comparisons. In addition to the PD producedby the RMI-CRI system, the appendices provide important macroeconomic, corporate creditand sovereign risk indicators. These summarize the credit situation, as well as make detaileddata available for reference purposes.
The commentary in the QCR is based on median PD of exchange-listed firms within e-conomies and industry sectors. Classification into economies is based on each firm’s coun-try of domicile, and classification into industry sectors is based on each firm’s Level I Bloom-berg Industry Classification. An exception is the banking and real estate sectors, where firmsare included based on the Level II Bloomberg Industry Classifications. The daily frequencyPD graphs in the written commentary are aggregates of firms that have a PD in both the firstten days and last ten days of the quarter. This prevents, for example, drops in the aggregatePD when high PD firms default and leave the sample.
The economies that are considered in each region are based on a selection of 78 economiescovered by RMI’s default forecast model.
The developed economies of Asia-Pacific include: Australia, Hong Kong, Japan, New Zealand,Singapore, South Korea and Taiwan.
The emerging economies of Asia-Pacific include: Bangladesh, China, India, Indonesia,Kazakhstan, Malaysia, Pakistan, the Philippines, Sri Lanka, Thailand and Vietnam.
Latin America includes: Argentina, Brazil, Chile, Colombia, Jamaica, Mexico, Peru andVenezuela.
North America includes: Canada and the US.
Eastern Europe includes: Bosnia and Herzegovina, Bulgaria, Croatia, the Czech Republic,Estonia, Hungary, Latvia, Lithuania, the former Yugoslav Republic of Macedonia, Montene-gro, Poland, Romania, Russia, Serbia, Slovakia, Slovenia, Tunisia, Turkey and Ukraine.
Western Europe includes: Austria, Belgium, Cyprus, Denmark, Finland, France, Germany,Greece, Iceland, Italy, Ireland, Luxembourg, Malta, the Netherlands, Norway, Portugal,Spain, Sweden, Switzerland and the UK.
Africa & the Middle East includes: Bahrain, Egypt, Israel, Kuwait, Jordan, Morocco, Oman,Nigeria, Saudi Arabia, South Africa, Tunisia and the United Arab Emirates.

NUS RMI-CRI Quarterly Credit Report, Q2/2017 2
Credit Research InitiativeThe QCR is a companion publication to the Weekly Credit Brief and Credit Brief on Sin-gapore SMEs, with all three publications produced as part of the Credit Research Initiativeundertaken by RMI.
These publications supplement RMI-CRI’s operational probability of default (PD) model. Themodel takes financial statements and market data from a database of more than 65,000listed firms and estimates a PD for each firm, effectively transforming big data into smartdata. The outputs from the RMI-CRI PD model are available free for all users at:
www.rmicri.org
As of June 2017, the PD system covers 121 economies in Africa, Asia-Pacific, Latin America,North America, the Middle East and Europe. The probabilities of default include historicaldata for firms that are now delisted from exchanges or firms that have defaulted. PDsaggregated at the region, economy and sector level are also available. The full list offirms is freely available to users who can give evidence of their professional qualifications toensure that they will not misuse the data. General users who do not request global accessare restricted to a list of 5,000 firms. The PD system operates in a transparent manner,and a detailed description of our model is provided in a Technical Report available on ourwebsite.

NUS RMI-CRI Quarterly Credit Report, Q2/2017 3
Table of Contents
Introduction 1
Acronyms 4
BRICS 6India . . . . . . . . . . . . . . . . . . . . . . . . . . . . . . . . . . . . . . . . . . . . . 7
China . . . . . . . . . . . . . . . . . . . . . . . . . . . . . . . . . . . . . . . . . . . . . 13
Asia-Pacific - Developed economies 19Australia . . . . . . . . . . . . . . . . . . . . . . . . . . . . . . . . . . . . . . . . . . . 20
Singapore . . . . . . . . . . . . . . . . . . . . . . . . . . . . . . . . . . . . . . . . . . 24
Asia-Pacific - Emerging economies 29Indonesia . . . . . . . . . . . . . . . . . . . . . . . . . . . . . . . . . . . . . . . . . . . 30
Malaysia . . . . . . . . . . . . . . . . . . . . . . . . . . . . . . . . . . . . . . . . . . . 35
Europe 40Italy . . . . . . . . . . . . . . . . . . . . . . . . . . . . . . . . . . . . . . . . . . . . . . 41
United Kingdom . . . . . . . . . . . . . . . . . . . . . . . . . . . . . . . . . . . . . . . 47
Appendices 53A PD by economies . . . . . . . . . . . . . . . . . . . . . . . . . . . . . . . . . . . . . 54
B PD by regions . . . . . . . . . . . . . . . . . . . . . . . . . . . . . . . . . . . . . . . 74
C Macroeconomic Indicators . . . . . . . . . . . . . . . . . . . . . . . . . . . . . . . . 78
D Data notes . . . . . . . . . . . . . . . . . . . . . . . . . . . . . . . . . . . . . . . . 117
About RMI and the Credit Research Initiative 120

NUS RMI-CRI Quarterly Credit Report, Q2/2017 4
AcronymsADR Average Default RatesBI Bank of IndonesiaBOE The Bank of EnglandCAD Current Account DeficitCDS Credit Default SwapCLI Composite Leading IndicatorCRI Credit Research InitiativeECB European Central BankELA Emergency Liquidity AssistanceESI Economic Sentiment IndicatorESMA European Securities and Markets AuthorityEU The European UnionFTV Financing-to-valueFDI Foreign Direct InvestmentFX Foreign ExchangeGFC 2008-2009 Global Financial CrisisINR Indian RupeeISTAT Italian National Institute of StatisticsLATDB Liquid assets to deposits and short-term borrowings ratioLHS Left-hand side of graphLTV Loan-to-valueMAS Monetary Authority of SingaporeMIDF Malaysian Industrial Development Finance BerhadMLF Medium term Lending FacilityMPC Monetary Policy CommitteeMOM Ministry of ManpowerMoM Month on Month

NUS RMI-CRI Quarterly Credit Report, Q2/2017 5
NIM Net Interest marginNODX Non-oil domestic exportsNPA Non-performing assetsNPL Non-performing loanOECD Organisation for Economic Co-operation and DevelopmentOJK Otoritas Jasa Keuangan (Financial Services Authority of Indonesia)OPR Overnight Policy RatePBOC The People’s Bank of ChinaPCA Prompt Corrective ActionPD Probability of DefaultPDiR Probability of Default Implied RatingsPMI Purchasing Managers IndexPCI Performance of Construction IndexPSI Performance of Services IndexPSL Pledged Supplementary Lending facilityQCR Quarterly Credit ReportQoQ Quarter on QuarterREITS Real Estate Investment TrustsRBA Reserve Bank of AustraliaRBI Reserve Bank of IndiaRMI Risk Management InstituteRMI-CRI Risk Management Institute Credit Research InitiativeRHS Right-hand side of graphRRR Reserve requirement ratioSebi Securities and Exchange Board of IndiaSDF Standing Deposit FacilitySLF Standing Lending FacilityWAIR Weighted average interest rateWMP Wealth Management ProductYoY Year On Year

NUS RMI-CRI Quarterly Credit Report, Q2/2017 6
BRICS
Listed companies in BRICs delivered mixed result. While China’s credit profile slightly im-proved in the second quarter, the other three countries deteriorated, as RMI-CRI aggregatePD suggested. China’s economy grew 6.9% in Q2, comfortably above the government’starget. In the medium term, however, risks from rising debt and overcapacity in the man-ufacturing sector still loom over the economy. Many also worry that the bubble of propertymarket could burst. India is expected to see a modest recovery in GDP growth in Q2, asthe effect of demonetisation and GST rollout had faded away. Brazil continued to fall inthe second quarter, with 0.3% YoY decline, mainly due to the 7.4% YoY contraction in theconstruction sector. Russia suffered the most among the three underperformers in terms ofRMI-CRI credit scores. Although it just achieved the most rapid GDP YoY growth of 2.5%in Q2 in the recent four years, several factors might slow down its economic activity in thesecond half of the year.

NUS RMI-CRI Quarterly Credit Report, Q2/2017 7
Indian CompaniesThe aggregate 1-year RMI PD for Indian companies has remained relatively stable with aslight uptrend during the second quarter of 2017. Economic conditions is slightly better withpublic administration and defence as the largest contributor to GDP growth. Inflation ratesdeclined slightly due to falling prices in the manufacturing group and weak oil prices. Currentaccount deficit started to narrow with a weaker rupee and this may have positive impacts onthe demand of Indian exports, though investment might be slightly pressurized due to a stillrelatively underperforming sovereign bond rating. Monetary wise, RBI is monitoring liquidityconditions very carefully as it maintained interest rate at relatively stable level throughout Q22017, though rumors of a decrease in benchmark repo rate by RBI later abound.
Economy• India’s real Gross Domestic Product for Q4 2017 grew at an annual rate of 7.1% against
a 7.0% expansion in the same quarter last year. Sectors that experienced strong growthYoY include manufacturing (7.9%), trade, hotels, transport and communication (7.2%),and public administration and defence (11.3%). According to IMF, growth in India isforecast to pick up further in 2017 and 2018 at 7.2% and 7.7% YoY respectively followingstrong government spending and data revisions that show stronger momentum in thefirst part of the year.1,2

NUS RMI-CRI Quarterly Credit Report, Q2/2017 8
• June saw a slowdown in growth across India’s manufacturing sector as softer risein factory new orders resulted in weaker growth of production and payroll and pur-chasing activity increased marginally. The Nikkei India Manufacturing PMI was downto a four-month low of 50.9 in June from 51.6 in May, pointing out to a slight andweaker improvement in the health of the sector. Challenging economic conditions,water shortages, softer expansion in new work and the implementation of the goods& services tax (GST) stood out as the main factors that hampered growth amid therising of output for the sixth month in a row during June. Looking ahead, manufacturersremained optimistic that output is growing in the coming 12 months, supported by newdevelopments and anticipations of higher demand stemming from lower tax rates.3
• The annual rate of inflation, based on monthly Wholesale Price Index (WPI), declinedto an annual rate of 0.90% in June from an annual rate of 2.17% for the month of May.The wholesale price index declined slightly by 0.1%. The decline is mainly due to fallingprices in manufacturing group. The MCX India Crude Oil Spot Index decreased to 2897from 3281 in Q2 2017 amid oil supply glut caused by US shale companies.4
• India’s current account deficit (CAD) narrowed to USD 3.4bn (0.6% of GDP) in Q1 2017from USD 8.0bn (1.4% of GDP) in Q4 2016. The current account deficit is higher thanUSD 0.3bn (0.1% of GDP) in Q1 2016. The widening of the CAD on a YoY basisis primarily due to a higher trade deficit of USD 29.7bn due to a larger increase inmerchandise imports relative to exports. Net services receipts reported a rise on aYoY basis due to an increase in net earnings from travel, transport, construction andother business services. Transfer receipts, mainly representing remittances by Indiansemployed overseas remained almost at the same level as in the preceding year at USD15.7bn.5
• During Q2, the Indian Rupee (INR) strengthened 0.69% against the US dollar. Theannouncement of a Fed Fund rate hike in June that triggered a weakening of the INRwas offset by a strengthening and hence a moderate currency appreciation. Sustainedforeign investments are expected to moderately increase following a suspension ofrupee-denominated offshore bonds. Foreign portfolio inflows during the quarter amountto USD 12.3bn.6
Monetary• According to the bi-monthly monetary policy statement on Jun 7th 2017, the RBI kept
the policy rate (repo rate) at 6.25%. The reverse repo rate under the liquidity adjustmentfacility remained at 6.0%. Similarly, the Bank Rate remained at 6.50%.7
• The impact of the massive spending by the Indian government served as a counterforceagainst RBI’s effort to curb surplus liquidity in the banking system post-demonetization.This raised the daily average overall surplus liquidity in the local banking system to INR4.2tn in April and INR 3.5tn in May. Following the event, RBI executed further liquidityabsorption operations in the form of treasury bills issuance worth INR 1tn with tenorsranging from 312 days to 329 days. Shifting attention to the Monetary Policy Committee,the MPC is turning out to be more conservative and hawkish than RBI as it strives toassert its independence in voicing out its views on India’s monetary condition.8,9
• The abrupt and significant retreat of inflation in April introduced uncertainty to thedirection of India’s inflation level, prompting RBI to consider factors like whether inflationwill continue to be low, the impact of a supply glut due to large output and imports,policies revolving free and open trade and the prices of gasoline and consumer goods.RBI remains committed to targeting inflation at 4.0% on a durable basis. It also decidedto adopt a neutral stance while keeping policy rate on hold to keep an eye on the effectsof demonetization and the recent output gap.10

NUS RMI-CRI Quarterly Credit Report, Q2/2017 9
• In an attempt to resolve India’s delinquent loan problem that has been choking creditand hampering growth, RBI will be empowered to order lenders to initiate insolvencyproceedings against defaulters and to create committees to advise banks on recoveringNPLs. The new rule is introduced in view of the fact that banks are reluctant to writedown assets sufficiently and company owners unwilling to negotiate repayment loans.11
Funding & Liquidity• Yields on India’s 10-year government sovereign bonds decreased to 6.511% at the end
of Q2 from 6.680% as of Mar 31, 2017, taking into account the fact that India will be ableto handle its souring loan problem and the diminishing confidence of a further interestrate hike by the US Fed amid below expected inflation level.
• In terms of liquidity, RBI decided not to cut interest rate despite growth slowdownas excess liquidity due to government spending and the recent crackdown on high-denomination notes continue to do the job. The weighted average of the call moneyrate, the overnight lending rate to other banks, stood at about 6% this year. This islower than RBI’s 6.25% benchmark repurchase rate. Amid pressures caused by theUS Fed interest rate hike, soured loans and companies’ reluctance to borrow aftera long investment binge, RBI should continue resisting the temptation to cut interestrate for now while keeping in track of external development in case inflation forecastreadjustment is needed in order to maintain and strengthen its credibility.12
Sovereign Credit Ratings• Moody’s, Fitch and S&P kept their ratings on the sovereign bonds of India at Baa3,
BBB- and BBB- respectively in Q2 2017. All big three rating agencies maintained thesame outlook on the sovereign debts as in the previous quarter at positive, stable andstable respectively.
• Moody’s has retained its sovereign rating on India, which is slightly above junk, despitethe general government debt level improvement to 67.5% of GDP in 2016 from 84.7%in 2003. The rating agency noted that India’s current debt burden remained a keycredit constraint because it ranks the highest among most of its Baa peers, includingthe Bahamas and South Africa. Moody’s positive outlook reflects the government’scommitment to reduce its state deficit and RBI’s effort to resolve India’s debt problem.13

NUS RMI-CRI Quarterly Credit Report, Q2/2017 10
Indian BanksThe aggregate 1-year RMI PD for Indian banks remained stable with a slight deteriorationfrom April to June 2017. Non-performing loans continue to plague both the private and publicbanks and is depressing the profitability of Indian banks. Continuous aids and reforms bythe RBI like the PSU bank capital injection, liquidity absorption tool and the recent one onforcing large borrowers to be admitted to bankruptcy courts may result in more bad loansbeing unveiled and decrease in banks’ earnings, but are expected to help improve banksector outlook in the longer term. RBI is expected to remain cautious in regulating interestrate so that the bad loan problem does not spread out to other parts of the economy.
Profitability• The Indian finance ministry is working on the capital infusion strategy for public sector
banks that have been marred by bad loan problems over the recent period. As much asINR 100bn has been put aside this year for the PSU bank rescue scheme, though theamount may prove to be insufficient due to high provisioning requirement for band loanresolution. PSU banks, however, would still need to raise USD 156tn to meet Basel IIIcapital requirements.14
• ICICI Bank, India’s largest private sector lender bank and third biggest lender by assets,reported an 8% YoY fall in net profit at INR 20.49bn in Q2 2017 although bad loanadditions were lowest in seven quarters, causing its share price to drop by 3% to INR298. Nomura analysts say that the bank underperformed the market’s expectationon the improving banking industry condition in India, with a lacklustre managementcommentary and weak core operating and asset quality performance.15
• Non-financial borrowings decreased 14.41% to INR 2.91tn on Jun 23 from INR 3.4tn atthe end of Q2 2017. Other liabilities such as time deposits with non-financial institutions

NUS RMI-CRI Quarterly Credit Report, Q2/2017 11
decreased to INR 4.94tn in Q2 from INR 5.22tn in Q1.16
• The Credit-Deposit ratio for the banking system increase to 72.26% on Jun 23, 2017from 71.77% on Mar 17, 2017. This was mainly due to the increase in bank credit fromINR 75.6tn to INR 76.6tn during the second quarter.17
Funding & Liquidity• The weighted-average call money rate, the interest rate on short-term finance repayable
on demand, increased from 5.97% as of Mar 31, 2017 to 6.07% as of Jun 30, 2017.The call money rates were generally lower than the repo rate during Q4, indicating astable banking system.18
• The amount of cash on the balance sheet of Indian banks increased from INR 566bnin Mar 2017 to INR 727bn on Mar 17. This reflected the excess liquidity in the Indianmarket due to government spending and the recent crackdown on high-denominationnotes. It also goes to show that RBI’s need to further step up its effort to curb liquidityin the market while at the same time not yield to the temptation to cut interest rates.19
• Deposit rates generally decreased in Q2 2017. According to the Reserve Bank of India’sdaily call money rates, interest rates decreased to 6.25% on Jun 15, 2017, from 9.50%in Q1 2017.20
• During Q2 2017, the RBI withdrew a total of INR 41.47tn from the banking system vialiquidity operations, with almost INR 20tn during the month of June. The Reserve Bankof India stepped up its liquidity operations under the liquidity management frameworkto absorb excess liquidity in the market. Surplus liquidity has been aggressively takenout of the market and liquidity has returned to normal standards as seen from the cashbalance.21,22,23
Asset Quality• Based on RBI’s June Financial Stability Report, the banking system’s gross bad loan
ratio is expected to rise to 10.2% of the total loan book in March 2018 from 9.6% inMarch 2017 amid considerable non-performing assets (NPA) accumulation. Gross badloan ratio for public sector banks could be as much as 14.2% by March 2018. RBI alsospecified six unnamed PSU banks that performed poorly in its severe macro stressscenario, pulling down the industry’s capital adequacy ratio from 13.3% in March 2017to 11.2% in March 2018.24
• Private sector banks, on the other hand, fared better than their PSU counterparts inthat some of them have either been able to contain bad assets and even improve assetquality. Those include Dhanlaxmi Bank, DCB Bank Ltd and Federal Bank Ltd. If netNPAs is viewed as a percentage of the banks’ net worth or capital and reserves, theneven the most vulnerable among the private banks with the highest level of bad assets,J&K Bank, stands in far better shape than all public sector banks, with its net NPAs at43% of its net worth compared to 76% for all PSU banks.25
1May 31, 2017, PROVISIONAL ESTIMATES OF ANNUAL NATIONAL INCOME, 2016-17 AND QUARTER-LY ESTIMATES OF GROSS DOMESTIC PRODUCT FOR THE FOURTH QUARTER (Q4) OF 2016-17,Ministry of Statistics and Programme Implementation, mospi.nic.in
2July 24, 2017, World Economic Outlook Update, July 2017: A Firming Recovery, International MonetaryFund, www.imf.org
3July 3, 2017, Nikkei India Manufacturing PMI, Markit Economics, markiteconomics.com
4July 14, 2017, Index Numbers of Wholesale Price in India, Ministry of Commerce & Industry Office of TheEconomic Advisor, eaindustry.nic.in

NUS RMI-CRI Quarterly Credit Report, Q2/2017 12
5Jun 15, 2017, Developments in Indias Balance of Payments during the Fourth Quarter (January-March) of2016-17, The Reserve Bank of India, rbi.org.in
6July 26, 2017, Foreign Portfolio Investors Investment Details (Calendar Year), National Securities Deposi-tory Limited (NSDL), fpi.nsdl.co.in
7Jun 7, 2017, Second Bi-monthly Monetary Policy Statement, 2017-18 Resolution of the Monetary PolicyCommittee (MPC), Reserve Bank of India, The Reserve Bank of India, rbi.org.in
8Jun 7, 2017, Second Bi-monthly Monetary Policy Statement, 2017-18 Resolution of the Monetary PolicyCommittee (MPC), Reserve Bank of India, The Reserve Bank of India, rbi.org.in
9May 17, 2017, MPC is turning out to be more conservative and anti-inflationary than RBI, The EconomicTimes, http://economictimes.indiatimes.com/
10Jun 7, 2017, Second Bi-monthly Monetary Policy Statement, 2017-18 Resolution of the Monetary PolicyCommittee (MPC), Reserve Bank of India, The Reserve Bank of India, rbi.org.in
11May 5, 2017, India Empowers RBI to Resolve World’s Worst Bad Debt Problem,Bloomberg, https://www.bloomberg.com/
12June 6, 2017, India’s USD 60 Billion in Surplus Liquidity Signals RBI on Hold,Bloomberg, https://www.bloomberg.com/
13Jun 1, 2017, India’s debt remains ’significantly’ high, higher than Bahamas and South Africa, says Moody’s,The Economic Times, financialexpress.com
14July 19, 2017, Finance Ministry working on capital infusion in public sector banks, The Times of India,http://timesofindia.indiatimes.com/
15July 28, 2017, ICICI Bank plunges 3% on Q1 earnings, asset quality woes, The Hindu Business Line,http://www.thehindubusinessline.com/
16Jun 23, 2017, Scheduled Commercial Banks - Business in India, Reserve Bank of India, rbi.org.in
17Jun 23, 2017, Scheduled Commercial Banks - Business in India, Reserve Bank of India, rbi.org.in
18Jul 7, 2017, Cash Reserve Ratio and Interest Rates, Reserve Bank of India, rbi.org.in
19Mar 17, 2017, Scheduled Commercial Banks - Business in India, Reserve Bank of India, rbi.org.in
20Jul 10, 2017, Reserve Bank of India Bulletin - July 2017, Reserve Bank of India, rbi.org.in
21Jun 12, 2017, Reserve Bank of India Bulletin - June 2017, Reserve Bank of India, rbi.org.in
22Jul 10, 2017, Reserve Bank of India Bulletin - July 2017, Reserve Bank of India, rbi.org.in
23Aug 10, 2017, Reserve Bank of India Bulletin - August 2017, Reserve Bank of India, rbi.org.in
24Aug 10, 2017, Reserve Bank of India Bulletin - August 2017, Reserve Bank of India, rbi.org.in
25Jul 14, 2017, Its official, Indian banks health will worsen, Livemint, http://www.livemint.com/

NUS RMI-CRI Quarterly Credit Report, Q2/2017 13
Chinese CompaniesChina managed to exceed market expectation by lodging 6.9% GDP growth YoY in thesecond quarter of 2017 as Chinese firms’ credit quality improved slightly during the sameperiod. The 1-year aggregate PD for Chinese firms decreased slightly in Q2 2017. Amidglobal economic slowdown and rising trade protectionism, China’s exports and importsgrew more than expectations in June. The central bank in China maintained its benchmarkinterest rate and reserve requirement ratio, while foreign exchange reserves increased asits currency stabilize. In order to maintain growth momentum and contain financial risks atthe same time, the central bank moved away from traditional monetary tools such as cuttingbank reserve requirements to using medium term lending program which channels low-costfunds into banks. Deleveraging in the financial system continue to be the focus of the centralbank especially in the area of off-balance-sheet investments such as wealth managementproducts. Preventing and controlling financial risk in the financial sector continue to be apriority for policymakers.
Economy• The Chinese economy advanced 6.9% YoY in the second quarter of 2017, as compared
to a 6.9% growth in the first quarter of 2017, while exceeded market expectations of a6.8% growth. The growth was supported by faster rises in industrial output, retail salesand fixed asset investment while fiscal spending also surged. Industrial production grewby 7.6% while retail sales rose by 11%. Consumption accounted for 63.4% of Chinaeconomy, while investment and net exports contributed 32.7% and 3.9% of growth ofthe economy respectively. The government expects the country economy to grow 6.5%in 2017.26
• Consumer prices in China rose 1.5% YoY in June 2017, higher than the 0.9% growth in

NUS RMI-CRI Quarterly Credit Report, Q2/2017 14
March 2017. Politically sensitive food prices declined by 1.2% while non-food cost rose2.2%. Cost of consumer goods went up by 0.6% while services went up by 3.0%.27
• China’s official unemployment rate fell to 3.97% from 4.02% three months earlier. TheMinistry of Human Resources and Social Security mentioned that the number of newjobs was 160,000 higher than in the same period a year earlier but 0.05% lower thanthe previous quarter. A total of 3.34 million new jobs were created in the first quarter.28
• The China’s Caixin manufacturing purchasing managers index (PMI) fell to 50.4 in June2017, from 51.2 in March 2017 but it still beat market expectations. Manufacturing PMIin China averaged 49.57 from 2011 until 2016, reaching an all-time high of 52.30 inJanuary of 2013 and a record low of 47.20 in September of 2015.29,30
• Investment in fixed assets, a crucial driver of the economy, went up by 8.6% YoYreaching CNY 28tn in the first six months of 2017. The growth rate was kept at the samelevel of the first five months. Real estate investment continued to deliver increasinggrowth rate as it went up by 8.8% YoY in the first six months of 2017. The investmentin residential buildings, which accounted for 68% of real estate investment, went up by10.2%.31,32
• China’s exports and imports grew more than expected in June as global demand holdsstrong. Exports rose 11.3% from the same period last year while imports surged 17.2%.Trade surplus for the month was registered at USD 42.75bn. In terms of CNY, China’simports rose by 23.1% and a 17.3% increase for exports on a YoY basis.33
Monetary• China’s central bank continued to maintain its interest rate at 4.35% for 21 months. The
central banks cut interest rates on 23 October 2015 for the sixth time in less than a year.The central bank continues to use various policy tools to maintain liquidity and ensurereasonable growth in credit financing.34
• China’s primary rates fell driven by relatively high liquidity in the banking system. Thecentral bank also halted the open market operations of reverse repos for the last week inJune citing high liquidity. The volume-weighted average rate of the benchmark seven-day repo slipped as compared to the rates from a week earlier while the overnightShanghai Interbank Offered Rate (SHIBOR) were slightly higher. The central bank willcontinue to pursue a prudent and neutral monetary policy in 2017.35
• The required reserve ratio continued to remain at 17% in Q2 2017 after cutting 0.5% inMarch 2016. In a series of reductions, the central bank has brought the reserve ratiodown from its 2011 peak of 21.5%. The central bank has been relying on market-basedpolicy tools such as the medium-term facility and reverse repos operations to adjustliquidity and market interest rates.36,37

NUS RMI-CRI Quarterly Credit Report, Q2/2017 15
• China’s foreign exchange reserves increased by USD 4bn MoM to USD 3.057tn in June2017, dropped from the USD 24bn increase to USD 3.054tn in May 2017. This was thefifth consecutive month of increase in foreign exchange reserves after declining for thesecond half of 2016 bringing the reserves to the lowest level since February 2011 as thecentral bank slow the CNY depreciation. Meanwhile, gold reserves value had fell fromUSD 75bn in May 2017 to USD 73.58bn in June 2017. Foreign Exchange Reservesin China averaged USD 919bn from 1980 until 2017, reaching an all-time high of USD3.99tn in June of 2014 and a record low of USD 2.26bn in December of 1980.38,39
Funding & Liquidity• 10-year government bond yield rose from 3.28% in March to 3.56% at the end of June
2017. 1-year government bill yield increased from 2.86% to 3.44% over the sameperiod.40
• The 3-month 5-day average SHIBOR had increased steadily from 4.41% on 31 March2017 to 4.55% on 30 June 2017.41
• The value of new yuan loans provided by the Chinese banks stood at CNY 1.54tnin June 2017 as compared to CNY 1.11tn in May 2017, beating market expectationof CNY 1.2tn. Banks Balance Sheet in China averaged CNY 614.74bn from 2004 to2017, reaching an all-time high of CNY 2.51tn in January 2016 and a record low of CNY-32.10bn in July 2005.42
Policy• China’s economy accelerated faster than expected in the second quarter at 6.9% in
Q2 2017, derived from growth in exports and production. There is a build-up of riskin the financial system due to leveraged investments and over-borrowing and officialsare targeting to undertake restructuring of huge state firm debt. Controlling risk anddeleveraging continues to be China’s top financial policy in 2017. Aggregate financinggrew CNY 1.8tn, rose more than estimated in June 2017 but lower than the figuresin March 2017. With a stable economic growth, policymakers continue to push forstructural reforms to avert financial risk. Preventing and controlling financial risk willcontinue to be a priority for policymakers to address the debt binge that has inflatedasset bubbles. This is evident by the government’s consideration to grant the centralbank regulatory power in coordinating financial oversight.43,44
Sovereign Credit Ratings• Fitch and S&P maintained its rating credit rating for China assigning rating A+ with
a stable outlook and AA- with a negative outlook respectively. Moody’s downgradedChina’s rating to A1 from Aa3 and changes its outlook to stable from negative.
NUS RMI-CRI Quarterly Credit Report, Q2/2017 16
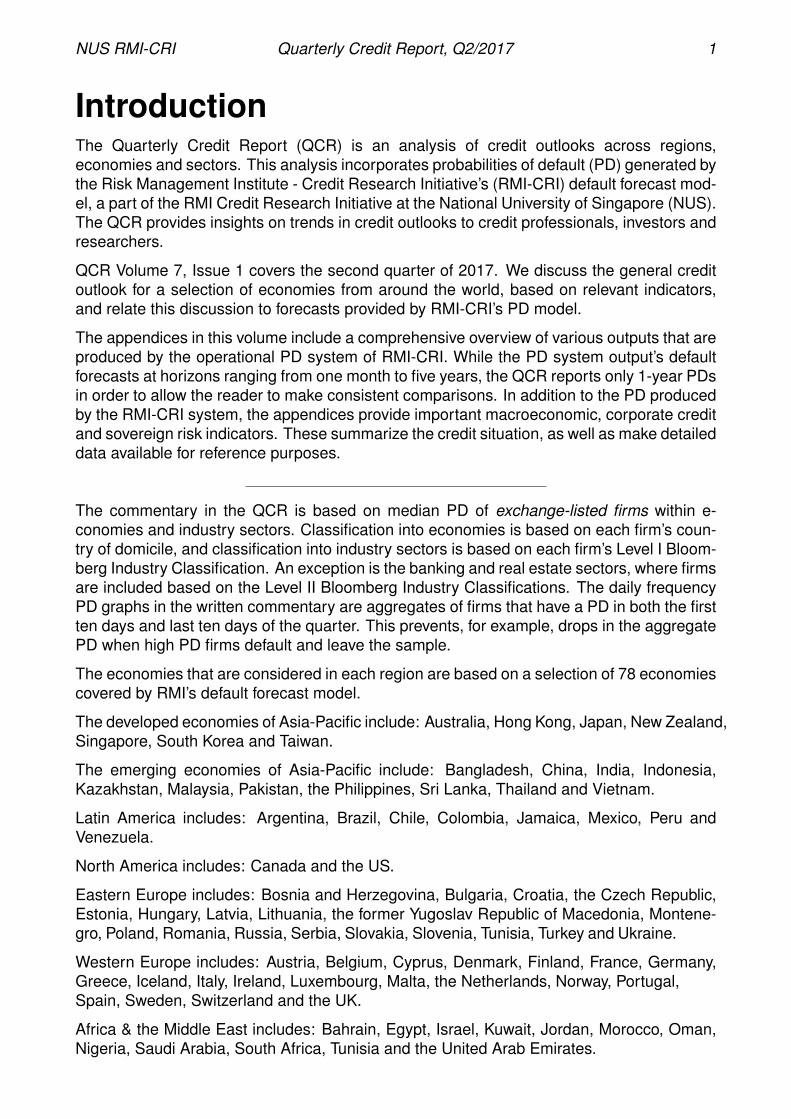
Chinese BanksThe credit quality of Chinese banks continued to weaken in the second quarter of 2017 asmore bad loans are written off. Non-performing loans of commercial lenders reached 1.81%at the end of second quarter 2017. Despite lower return on assets and equity, profitabilityat China commercial banks have improved as compared to the previous year. As part ofthe wider government campaign to restructure state-owned corporate debt and assist indeleveraging, debt-to-equity swaps between banks and companies have been expanded.Reducing risk in the Chinese financial system is still of top priority for the government as itimplement measures to limit financial risk. A new committee that is tasked with formulatingplans for the development of the financial sector and coming up with rules and regulationshas been set up under the PBOC.
Profitability• Commercial banks in China managed to lodge higher first-half profits as compared to a
year earlier and the overall non-performing loans in June stabilized as compared to theprevious quarter. Total profits for commercial lenders hit CNY 970.3bn for first half of2017 despite a drop in return on assets and return on equity compared to a year ago.Commercial lenders were pressurized by the regulator to clean up their operations andreduce risk as the increase in total lending has caused the country to pay attentionto the health and risk of the financial system. Financial security continues to be animportant aspect of China’s economy. 45

NUS RMI-CRI Quarterly Credit Report, Q2/2017 17
Funding & Liquidity• China’s central bank injected a net CNY 99.5bn into financial institutions via its short-
and medium-term lending facility (MLF) and lent CNY 498bn via its standing lendingfacility (SLF) in June. The outstanding amount of MLF and SLF were CNY 4.22tn andCNY 44.63bn respectively at the end of June. The central bank will hold off furthermonetary tightening as its push for deleveraging may threaten economic growth andjob creation in view of the upcoming leadership shuffle. 46
Regulations• The Chinese banking regulator has notified lenders to lower interest rates on wealth-
management products after the yields in the USD 4tn industry shot up in the past fewmonths. The average yields reached a 17-month high of 4.66% as banks try to plugtheir funding shortfall due to China’s government deleveraging exercise. The act tolower the interest rates is due to the regulator’s concerns that some banks may bepassing the higher funding costs to borrowers and thus threaten economic growth.Meanwhile, officials have also targeted corporate overseas acquisitions that might havebreached investments rules. Dalian Wanda, Sunac China and Anbang Insurance aresome of the companies that are targeted and they are facing the consequences bycutting their funding and denying regulatory approvals. 47
• A new Financial Stability and Development Committee will be set up under the StateCouncil and the PBOC will take on a bigger role in managing risks in the financialsystem. The new committee will be tasked with formulating plans for the developmentof the financial sector and coming up with rules and regulations to fill in regulatory gaps.Analysts have interpreted that the creation of the committee would mean stronger andlonger risk controls of the financial system. 48
• The Chinese banking regulator has extended the deadline for banks to submit their riskassessments by two months after concerns that it was putting strain on the lenders.The tougher stance on banks would put pressure on them as they need to adjust theiroperations based on the assessment and feedback from the regulator. CBRC officialshave also engaged on-site investigations to enforce rules on interbank lending andwealth management products. All these actions reflect the regulator’s stance to controlrisk in the financial system. 49
Asset Quality• The China Banking Regulatory Commission announced that the non-performing loan
ratio of commercial banks in China rose to 1.81%, highest since 2009. The banks’loan-provisioning ratio for banks stood at 161.3% while the capital adequacy ratio stoodat 13.2%. 50
26August 3, 2017, China GDP Annual Growth Rate, Trading Economics, http://www.tradingeconomics.com
27August 3, 2017, China Inflation Rate, Trading Economics, http://www.tradingeconomics.com
28August 3, 2017, China reports lowest urban unemployment rate in recent years, The State Council,http://english.gov.cn
29August 3, 2017, China Caixin Manufacturing PMI, Trading Economics, http://www.tradingeconomics.com
30July 5, 2017, Caixin China General Services PMI, IHS Markit, https://www.markiteconomics.com
31July 18, 2017, Investment in Fixed Assets for the First Six Months of 2017, National Bureau of Statistics ofChina http://www.stats.gov.cn
32July 18, 2017, National Real Estate Development and Sales in the First Six Months of 2017, NationalBureau of Statistics of China http://www.stats.gov.cn

NUS RMI-CRI Quarterly Credit Report, Q2/2017 18
33July 13, 2017, China exports end Q2 on high note, Financial Times, https://www.ft.com
34August 3, 2017, PBC base interest rate - Chinese central banks interest rate, Global rates, http://www.global-rates.com
35July 3, 2017, China’s money rates fall, but cash conditions may soon tighten, Reuters, http://www.reuters.com
36August 3, 2017, China Cash Reserve Ratio Big Banks, Trading Economics, http://www.tradingeconomics.com
37July 6, 2017, China’s central bank: We’ll boost ability to adjust interest rates, Reuters, http://www.reuters.com
38August 3, 2017, China Foreign Exchange Reserves, Trading Economics, http://www.tradingeconomics.com
39July 7, 2017, China June FX reserves rise to 8-month high as outflows ease, Reuters, http://www.reuters.com
40July 7, 2017, Yield of Government Securities, China Foreign Exchange Trade System, http://www.chinamoney.com.cn
41August 3, 2017, SHIBOR, Shanghai Interbank Offered Rate, http://www.shibor.org
42August 3, 2017, China New Yuan Loans, Trading Economics, http://www.tradingeconomics.com
43July 17, 2017, China’s strong second-quarter GDP growth paves way for deeper reforms,Reuters, http://www.reuters.com
44July 11, 2017, China May Give Central Bank Key Role in Financial Oversight, Bloomberg,http://www.bloomberg.com
45August 15, 2017, China banks report higher first-half profits, steady bad loan ratio, Business Times,http://www.businesstimes.com.sg/
46July 3, 2017, China central bank doubles June liquidity injections to avert cash crunch, Reuters,http://www.reuters.com
47July 18, 2017, Xi’s Risk-Off Push Ripples Through China as Transition Nears, Bloomberg,http://www.bloomberg.com
48July 18, 2017, China central bank to coordinate work of new financial oversight body, Reuters,http://www.reuters.com
49August 7, 2017, China’s bank regulator lets crackdown deadline slip over stability worries, Reuters,http://www.reuters.com
50July 15, 2017, China’s bad-loans ratio reaches 1.81 pct in Q2, highest since 2009, Reuters,http://www.reuters.com
NUS RMI-CRI Quarterly Credit Report, Q2/2017 19
Asia-Pacific - Developed economies
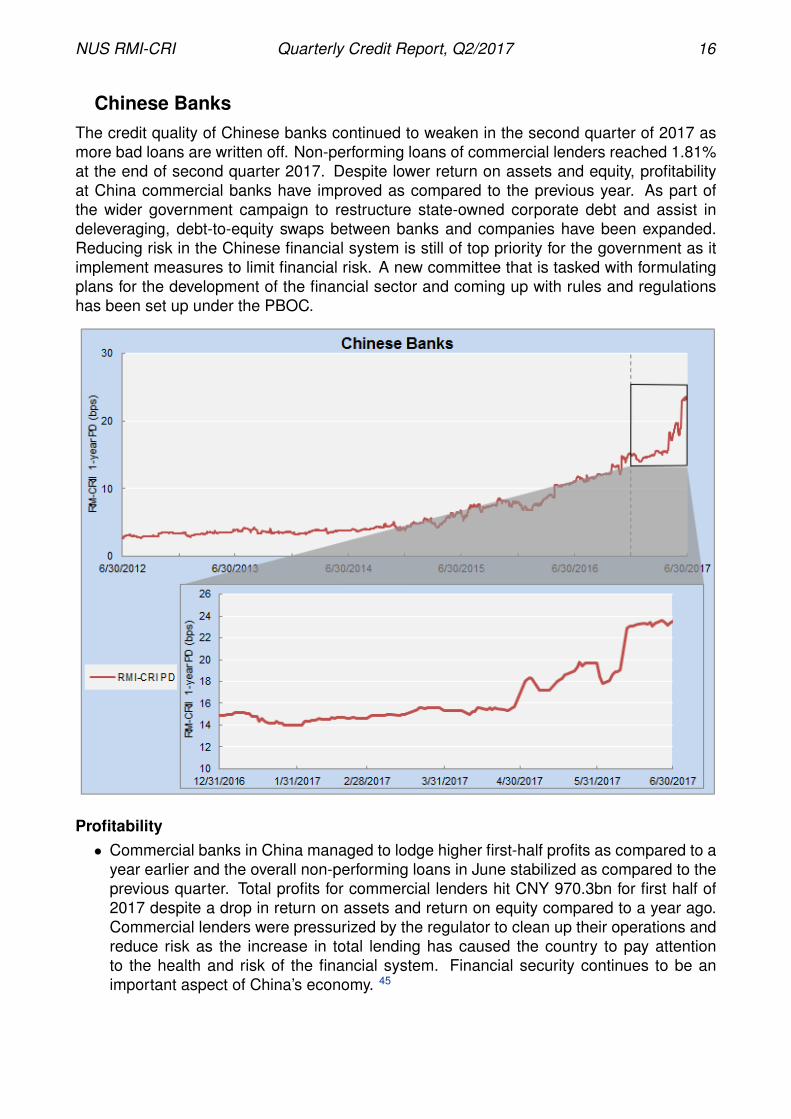
The RMI-CRI aggregate 1year PD for listed companies in the developed Asia Pacific slightlydeclined during the second quarter of 2017, suggesting stable and robust credit profile. Allmajor countries have seen GDP YoY expansion. Individually, Japan’s economy grew at thefastest pace in more than two years during Q2 with 4% GDP YoY growth. This is mainlydue to the strong domestic demand and private investment growth despite contraction inexports. Likewise, Singapore also reported a higher than expected result in Q2, with GDPYoY growth of 2.9%, up from 2.5% in Q1. While the construction sector severely contractedby 5.7% YoY, the manufacturing sector continued the strength seen in the previous quarterand delivered 8.1% YoY growth in Q2. Like Japan and Singapore, South Korea’s economyhit its target in the second quarter with 0.6% QoQ and 2.7% YoY growth. Nevertheless, itremains to be seen whether it will finally achieve the 3% GDP growth for 2017 as PresidentMoon Jae-in aims.

NUS RMI-CRI Quarterly Credit Report, Q2/2017 20
Australian CompaniesThe aggregate 1-year RMI PD for Australian companies inched up slightly during Q2 2017.Based on Q1 data, economic growth was slower due to weak exports and slow hous-ing investment. Unemployment rate remains relatively flat while manufacturing sector andservices sector expanded. Going forward, the credit outlook for Australian firms remaindependent on the rebalancing of the economy as the mining sector slows and the real estatemarket cools down. Attempts to support economic growth is also assisted by RBA’s loosemonetary policy.
Economy• Economic growth increased by 0.3% from Q4 2016 to Q1 2017, lower than the 1.1%
growth from Q3 2016 to Q4 2016. The Australian economy grew 1.7% YoY which is inline with analysts’ expectations but lower than its 2.4% growth in 2015.51
• The lower GDP growth in Q1 was driven largely by weak exports and slow housinginvestment. Weaker exports knocked 0.7% off the growth figure. Strong householdspending contributed to growth as it increased by 0.5% and business investment in-creased by 0.7% in Q1 2017.52
• The Reserve Bank of Australia’s (RBA) had left the cash rate unchanged at 1.5%, amidimprovements in the global economy although uncertainties remain. The Australianeconomy is in transition, with moderate economic growth and inflation expected toremain low, but expected to rise as the economy strengthens. Australia is expectedto grow at 3% over the next few years.53

NUS RMI-CRI Quarterly Credit Report, Q2/2017 21
• The unemployment rate stood at 5.6% in June, in line with expectations. The monthlyemployment rose by 62,000 between May and June 2017, making the unemploymentrate to be the lowest since October 2016.However, the central bank remains cautiousand will monitor the labour market.54
• The Australian Performance of Manufacturing Index (PMI), as reported by The Aus-tralian Industry Group, stood at 55 in June, a slight increase of 0.2 points from May.Expansion in the chemical and rubber products, non-metallic mineral products, metalproducts and machinery and equipment sectors contributed to the rise. The equivalentindex for services (PSI) improved by 3.3 points to stand at 54.8 points in June, a fourthconsecutive month of expansion. However, the Australian Performance of ConstructionIndex (PCI) was at 56 points in June, down by 0.7 points from May.55,56,57
• Key export prices dropped 5.5% in Q2 2017, relative to the previous quarter and 22.5%increase from the corresponding 2016 quarter. Commodities posted the highest in-crease in prices in this quarter. Booming sales from iron ore and coal to China helpedto boost Australia’s trade surplus since 2011 as exports surged by 17%.58,59
Monetary Policy• The Reserve Bank of Australia (RBA) last lowered its benchmark interest rate to a
record low of 1.5% in August 2016 to stimulate economic activity, and has since main-tained the rate. Amid concerns about the rising currency affecting economic growth andemployment, monetary policy remains accommodative in the near future.60,61
Funding & Liquidity• Yields on 10-year Australian government bonds dipped throughout the quarter. The
previous quarter reported a high of 2.81% in March 2017, while yields in June was2.41%, 91 basis points higher than the RBA lending rate.62
• The 3-year fixed lending rates to small businesses remained at 5.25% in June 2017while lending rates for owner-occupied housing loan dropped 5 basis points in the latestquarter to 5.25%.63
• Average commercial lending during the quarter increased driven mainly by lendingto business sector as total loans to financial intermediaries remain flat in Q2 2017.Meanwhile, total lending to individuals was higher by 1.6% quarter-on-quarter.64
Sovereign Credit Ratings• Standard & Poor’s and Fitch Ratings maintained their AAA ratings on Australia, while
Moody’s maintained their Aaa rating. All three rating agencies had stable outlooks onthe government’s credit, with the exception of S&P, which had a negative outlook.65

NUS RMI-CRI Quarterly Credit Report, Q2/2017 22
Australian BanksThe aggregate 1-year RMI PD inched up slightly in Q2 2017. Earnings may come underpressure from the increasing cost of regulations as the regulators attempt to cool the housingmarket and increase banks’ capital ratios. NIMs improved in the latest quarter and thereare growth in home and business lending resulting in growth in banks’ earnings. Assetperformances continue to improve as impairment charges are lower and is expected to turnfor the better. This will assist banks to report record profit in 2017.
Profitability• NAB and Commonwealth Bank posted better earnings over the latest quarter due to
growth in lending in home lending, business lending and deposits and improved netinterest margin for NAB. Analysts are forecasting the banks to report record profit for2017 financial year even though regulators has attempted to cool the housing marketboom.
Funding & Liquidity• The Australian Prudential Regulation Authority has said that each of the big four banks
will need to have common equity tier-1 capital ratio of 10.5% by January 2020 andthis means that the banks will have to hold billions of dollars in extra capital. The totalshortfall faced by the big four banks is AUD 7.9bn and CBA will have to raise the mostcapital according to analysts. By increasing more capital, banks’ return on equity maybe reduced.66

NUS RMI-CRI Quarterly Credit Report, Q2/2017 23
Asset Quality• NAB’s charge for bad and doubtful debts for the quarter fell by 12% to AUD 173mn
while CBA reported 13% lower impairment charges as there is lower provisioning ininstitutional banking and markets. This largely reflected an improving asset qualitytrend. 67,68
51August 10 2017 5206.0 - Australian National Accounts: National Income, Expenditure and Product, Mar2017, Australian Bureau of Statistics, abs.gov.au
52June 7 2017 Australia GDP growth of 0.3% slowest since 2009, FT, ft.com
53August 1 2017 Statement by Philip Lowe, Governor:, Reserve Bank of Australia, rba.gov.au
54July 20 2017 Australia unemployment holds in June as full time jobs rise, FT, ft.com
55July 10 2017 Australian PMI: Manufacturing expansion extends to June, Australian Industry Group,aigroup.com.au
56July 10 2017 Australian PSI: Services sector lift in June, Australian Industry Group, aigroup.com.au
57July 10 2017 Australian PCI: Construction maintains healthy growth in June, Australian Industry Group,aigroup.com.au
5842943 6457.0 - International Trade Price Indexes, Australia, June 2017, Australian Bureau of Statistics,abs.gov.au
59August 2 2017 Boom iron and coal exports bring first trade surplus in six years, The Australian, theaus-tralian.com.au
60August 1 2017 Statement by Philip Lowe, Governor:, Reserve Bank of Australia, rba.gov.au
61August 1 2017 RBA Holds Rate as Currency Seen Subduing Inflation, Growth, Bloomberg, bloomberg.com
62August 10 2017 Capital Market Yields - Government Bonds - Monthly, Reserve Bank of Australia,rba.gov.au
63August 10 2017 Indicator Lending Rates, Reserve Bank of Australia, rba.gov.au
64August 10 2017 Bank Lending Classified by Sector, Reserve Bank of Australia, rba.gov.au
65August 1 2016 Australian Government Credit Ratings, Office of Financial Management, Government ofAustralia, aofm.gov.au
66July 19 2017 Australias banks face tougher capital requirements, FT, ft.com
67August 11 2017 NAB lifts June quarter cash profit 5pc, The Australian, theaustralian.com.au
68August 9 2017 Commonwealth Bank beats estimates with bumper AUD 9.88bn profit, The Australian,theaustralian.com.au

NUS RMI-CRI Quarterly Credit Report, Q2/2017 24
Singapore CompaniesThe RMI-CRI 1-year aggregate PD for Singapore continued to fall in the second quarter of2017, demonstrating improving credit conditions for the country. This quarter saw highergrowth rates for the Singapore economy and economists had narrowed their GDP growthforecast for the whole of 2017 to between 2% and 3%, down from the previous band of 1%and 3%. Growth in Q2 is mainly powered by the manufacturing sector which experiencedan export rally that boosted demand. However, the expansion in manufacturing sector isexpected to slow down in the second half of 2017. The rapid appreciation of the Singaporedollar in 2017 also calls for concern. In other aspects, unemployment and inflation ratesremained stable throughout Q2. Singapore’s overall economy had steadily improved duringthe second quarter, but uncertainties ahead may adversely affected the credit conditions inthe upcoming quarters.
Economy• While the Ministry of Trade and Industry announced in May that it has narrowed the
GDP growth forecast for 2017 between 2% and 3%, the Singapore economy grew by2.9% YoY in the second quarter of 2017, picking up from 2.5% in the previous quarter.Among all business sectors, electronics and precision engineering sector had primarilysupported the growth during Q2 2017. The manufacturing sector continued to grow ata robust pace of 8.1% YoY, slower than 8.5% in Q1 2017. In addition, the constructionsector contracted by 5.7% YoY, extending the 6.3% drop last quarter. It was explainedby the fall in both private and public-sector construction output.69

NUS RMI-CRI Quarterly Credit Report, Q2/2017 25
• CPI-All Items inflation and MAS Core Inflation came in at 0.5% and 1.5% respectivelyin June 2017. Food inflation was 1.4% in June, down from 1.5% in May as rate ofincrease in prices of non-cooked food items moderated. Private road transport inflationeased significantly to 3.0% from 6.1% in the preceding month due to a decline in carprices and smaller increases in petrol price. Services inflation edged down to 1.3%from 1.4% in May, due to a fall in telecommunication services fees. As a result of thelarge decline in house maintenance and repairs inflation, CPI less imputed rentals onowner-occupied accommodation fell to 1.7% in June.70
• The overall unemployment rate including foreigners remained unchanged from Q1 2017at 2.2% in Q2 2017. The unemployment rate for residents and citizens both showed aslight improvement from the previous quarter, dropping to 3.1% and 3.3% respectively.MOM revealed total employment fell for the second straight quarter with 8,400 fewerworkers. This is predominantly due to a decrease in the number of work permit holdersin the construction and marine sectors.71
• Survey results released by the Singapore Institute of Purchasing and Materials Man-agement showed that June’s PMI experienced a slight increment of 0.1 point to 50.9from the previous month. This is the 10th straight month that Singapore’s manufacturingsector had experienced an expansion. Although stocks of finished goods recorded afaster rate of expansion, expansion for the indicators of imports, input prices, supplierdeliveries and order backlog was sluggish at a slower rate, explaining the slight incre-ment in June.72
• The seasonally adjusted retail sales in June 2017 decreased by 0.5% on a MoM basis,but rose 1.9% on a YoY basis compared to June 2016. Excluding motor vehicles,retail sales increased 0.1% MoM while rising by 4.0% YoY. The total retail sales valuein June 2017 was estimated at SGD 3.7bn, higher than SGD 3.6bn in June last year.The seasonally adjusted sales of food&beverage services in June 2017 increased 2.1%MoM and 1.0% YoY. The total sales value of food&beverage services in June 2017 wasestimated at SGD 680mn, higher than the SGD 673mn last June.73
• Singapore’s NODX grew by 8.2% MoM in June 2017, following a flat performance inthe previous two months and an expansion in Q1 2017. The growth in June is dueto increases in both electronic and non-electronic exports. The top contributors to theNODX increase were China, South Korea and Japan. The increase in NODX to thesecountries outweighed the declines to countries like US and Taiwan.74
Monetary• There are no further updates on monetary policy from MAS since its announcement
to adopt a zero-appreciation monetary policy in April 2017. However, the Singaporedollar has been one of the strongest Southeast Asian currency this year, with a 6.1%year-to-date appreciation against the US dollar. The appreciation can be attributed toa weak US dollar that had been oversold. However, the strength in Singapore dollar isnot expected to last as Singapore lacks the domestic fundamentals to sustain such astrong Singapore dollar.75
Funding & Liquidity• Yields of 10-year Singapore government bonds declined to 2.0907% on 30 June 2017
from 2.2463% on 31 March 2017.
• Lending to non-bank customers rose from SGD 628bn in Q1 2017 to SGD 635bn in Q22017. Total loans to businesses rose by approximately SGD 5bn from a quarter agowhile loans to consumers increased from SGD 251bn in March 2016 to SGD 254bn inJune 2017.76

NUS RMI-CRI Quarterly Credit Report, Q2/2017 26
• The amount of outstanding sovereign bonds decreased by SGD 2.6bn to SGD 103bnending Q2 2017.77
• The prime lending rate remained constant at 5.28% in Q2 2017.78
Sovereign Credit Ratings• All three major rating agencies kept their highest investment grade ratings for Singapore
sovereign bonds over Q2 2017.
Singapore Banks
The RMI-CRI 1-year aggregate PD for Singapore banks inched up slightly during the sec-ond quarter of 2017. All three banks posted higher earning as compared to same periodlast year, showing that banks have remained profitable amid problems with NPLs. Wealthmanagement business for all three Singapore banks continued to grow with managementfees becoming a main driver of revenue. Companies in the oil & gas sector have yet torecover from the downturn and loans to these companies still pose as a concern for theasset quality of banks. Despite so, Singapore banks are largely safe given that they arewell-capitalized and have sufficient buffer in the event of a rise in NPLs.

NUS RMI-CRI Quarterly Credit Report, Q2/2017 27
Profitability• Singapore banks reported higher earnings in the first quarter of 2017. Quarterly net
profits in DBS, OCBC, and UOB gained by 8%, 22%, and 5.5%, respectively fromthe same period last year. All three banks reported strong growth in their wealthmanagement business and saw significant growth in wealth management fees thatdrove up profits. Interest incomes across the banks were generally higher on a YoYbasis while non-interest income also witnessed growth from Q1 2016. 79,80,81
• Data from the Monetary Authority of Singapore showed that the amount of corporateloans issued to non-bank customers increased by 1.21% to SGD 635.5bn at the end ofQ2 2017 from the previous quarter. 82
Funding & Liquidity• Total deposits in Singapore banks contracted slightly by SGD 3.52bn in Q2 2017. Local
currency deposits contracted by SGD 2.74bn, a reverse from the previous quarterexpansion of SGD 12.6bn. Foreign currency deposits decreased by about SGD 771mnduring Q2 2017.83
• Singapore’s fixed deposit rates remained the same during Q2 2017 for both 3-month,6-month and 12-month deposits. Current fixed deposit rates are at 0.14%, 0.20% and0.33% respectively. The prime lending rate was also unchanged at 5.28% during thesecond quarter.84
Capital Levels & Regulations• All three Singapore banks kept their Tier 1 Common Equity ratios to be well above
the recommended Basel III guidelines, making them some of the most well-capitalizedbanks in the world. The three banks are expected to maintain this capital positionto comply with the upcoming International Accounting Standards Board IFRS9, whichbecomes effective in 2018.
Asset Quality• Loans placed under the ”special mention” category declined to 2.18% of total exposure
at the end of Q2 2017, from 2.29% in the quarter before. Loans classified as doubtfullowered to 0.33% of total exposure. Loans marked as a loss fell back to 0.18% in Q2to the same level as Q4 2016. Overall, asset quality in banks improved from both QoQand YoY perspectives. 85
• NPL ratios at DBS, UOB and OCBC remained largely unchanged during Q2 2017.OCBC said the bank’s NPL ratio remains at 1.25% at the end of June but the totalamount of NPLs had increased to SGD 2.92bn from SGD 2.49 bn a year ago. UOB’s Q2NPL ratio of 1.5% was also the same as the previous quarter. The bank revealed thatit has put in place strong buffers to cope with a normalizing credit cycle and extendingoil & gas sector woes. Although the worst is believed to be over for Singapore banks,it is believed that weakness in the oil & gas sector can still potentially deteriorate theasset quality of Singapore banks. Other than oil & gas, Singapore banks are not facingsignificant downside risks from other sectors.86,87,88
69Aug 11, 2017, MTI Narrows 2017 GDP Growth Forecast to 2.0 to 3.0 Per Cent, MTI Singapore, http-s://www.mti.gov.sg
70Jul 24, 2017, Singapore Consumer Price Index, March 2017, MAS Singapore, http://www.mas.gov.sg/
71Jul 28, 2017, Labour Market Advance Release, Second Quarter 2017, MOM Singapore,https://www.mom.gov.sg/

NUS RMI-CRI Quarterly Credit Report, Q2/2017 28
72Jul 3, 2017, March PMI recorded a faster expansion reading to 51.2 Electronics Sector Index also postedexpansion at 51.8, The Business Times, http://http://www.businesstimes.com.sg/
73Aug 2017, Retail Sales Index, Statistics Singapore, https://www.singstat.gov.sg/
74Jul 17, 2017, SINGAPORE’S EXTERNAL TRADE C June 2017, IE Singapore, http://www.iesingapore.gov.sg/
75Aug 4, 2017, Too strong, too fast: Singapore dollar strength may not last, say analysts, CNA, http-s://channelnewsasia.com/
76Jun 2017, Banks: Loans and Advances of DBUs to Non-Bank Customers by Industry, MAS,https://secure.mas.gov.sg/
77Jun 2017, Issuance data, MAS, https://secure.sgs.gov.sg/
78Jun 2017, Interest Rates of Banks and Finance Companies, MAS, https://secure.mas.gov.sg/msb/
79Aug 11, 2017, CEOs Message on UOB Group, 1H17/2Q17 Results, UOB, www.uob.com.sg
80Aug 4, 2017, DBS FIRST-HALF EARNINGS RISE 4% TO RECORD SGD 2.35 BILLION, DBS,www.dbs.com.sg
81July 27, 2017, OCBC Group Reported Second Quarter 2017 Net Profit of SGD 1.08 billion, OCBC Group,http://www.ocbc.com
82Jun 2017, Banks: Loans and Advances of DBUs to Non-Bank Customers by Industry, MAS,https://secure.mas.gov.sg/
83Jun 2017, Deposits (excluding SGD NCDs) of DBUs by types of non-bank customers, MAS,https://secure.mas.gov.sg/
84Jun 2017, Interest rates of banks and finance companies, MAS, https://secure.mas.gov.sg/
85Jun 2016, Banks: Classified Exposures, MAS, https://secure.mas.gov.sg
86Aug 11, 2017, CEOs Message on UOB Group, 1H17/2Q17 Results, UOB, www.uob.com.sg
87Aug 4, 2017, DBS FIRST-HALF EARNINGS RISE 4% TO RECORD SGD 2.35 BILLION, DBS,www.dbs.com.sg
88July 27, 2017, OCBC Group Reported Second Quarter 2017 Net Profit of SGD 1.08 billion, OCBC Group,http://www.ocbc.com

NUS RMI-CRI Quarterly Credit Report, Q2/2017 29
Asia-Pacific - Emerging economies
The RMI-CRI aggregate 1-year PD for listed corporations in Emerging Asia, excluding Indiaand China, declined slightly in Q2. US interest rates have an impact on the credit profilesof firms in the region and the Federal Reserve has promised one more rate hike in 2017and three more in 2018. Higher US interest rates are likely to pressure the creditworthinessof firms dependent on foreign financing and increase capital outflows from the region. Thecredit profiles of emerging Asian firms however appear to be holding well in the face ofthese macro economic headwinds. Malaysian firms for example have seen a drop in 1-yearaggregate PDs as the country posted higher economic growth boosted by robust investmentand government spending. Higher commodity prices and increased public spending liftedthe credit quality of Indonesian businesses as inflation grew from 3% in December to 4.4%in June. The country’s debt to GDP level of 30% is one of the lowest in the region and thegovernment is committed to fiscal rectitude. The credit risk of Filipino firms were higher in Q2as a slowdown in the manufacturing sector affected the vehicle sales growth rate. However,slower activity did not lead to a deceleration in credit expansion. The amount of commercialloans in the first half of the year exceeded the level last year which may prompt the CentralBank to raise interest rates.

NUS RMI-CRI Quarterly Credit Report, Q2/2017 30
Indonesian CompaniesThe RMI-CRI aggregate 1-year PD for Indonesian companies slightly increased to about18bps at the end of Q2 2017 from 17.3bps at the end of Q1. Indonesia’s economy expe-rienced a growth of 5.01% YoY in Q2 2017, the same with that in Q1 2017. Indonesia’sinflation increased for the second quarter of 2017, with a CPI of 4.37% from 3.61% in Q1.Trade surplus in Q1 2017 increased to USD 1.63bn, where most of which was derived fromnon-oil and gas trade.
Economy• The Indonesian economy expanded by 5.01% YoY in Q2 2017, the same pace as in
the previous period and below market expectations of 5.10%. Private consumption andfixed investment were the main drivers behind the growth of the economy in this quarter(at 3.95% and 5.35% respectively). On the other hand, exports rose at a slower pace(at 3.36% compared to 8.21% in Q1 2017) and government spending fell. The economyexpanded by 4% in Q2 2017 on a quarterly basis.89

NUS RMI-CRI Quarterly Credit Report, Q2/2017 31
• The Consumer Price Index (CPI) of Indonesia reached 4.37% in June. Respectively,the inflation of volatile food reached 2.89% (YoY), core inflation at 3.13% (YoY), inflationof administered prices at a record high of 10.64% (YoY). Going forward, inflation isprojected to stay at 4% throughout 2017. Therefore, it is important that the central andregional governments as well as Bank Indonesia strengthen their coordination to keepinflation at check.90
• Wages of Indonesian workers likely increased in Q2 2017. Nominal wage of farmers perday increased by 0.55% during Q2 2017 from IDR 49,638 in April 2017 to IDR 49,912in June 2017.91
• Indonesia’s trade balance recorded an increasing surplus in June 2017, primarily sup-ported by non-oil and gas trade surplus and the decreasing deficit in oil and gas tradebalance. Trade balance surplus in June 2017 recorded USD 1.63bn. The non-oil andgas trade surplus increased to USD 1.96bn in June 2017 while oil and gas trade balancedeficit decreased to USD 0.33bn. The decrease in non-oil and gas import is driven bythe reduction in import of machinery and mechanical devices, electric devices, plasticgoods, iron, steel and organic chemical substances. Bank Indonesia maintained apositive outlook on the national account performance.92
• According to Nikkei Indonesia Manufacturing Purchasing Managers’ Index (PMI), In-donesia’s PMI fell from 49.5 in June to a one-year low of 48.6 in July. This reflected anotable number of contractions across some key variables and a second consecutivemonthly worsening of manufacturing business conditions.93
Monetary• On July 19th and 20th 2017, the Bank Indonesia (BI) Board of Governors agreed to hold
the BI 7-day repo rate, deposit facility rate, and lending facility rate at 4.75%, 4.00% and5.50% respectively. The decision is consistent with Bank Indonesia’s efforts to maintainmacroeconomic and financial system stability, while considering the dynamics of globaland domestic economy. Looking forward, Bank Indonesia will continue to strengthencoordination with the government to control inflation within the target rate and supportthe current structural reforms towards sustainable economic growth.94
Funding & Liquidity• Yield on Indonesia’s 5-year bonds dropped to 6.67% in end June 2017 from 7.54% in
the first day of April. The drop in yield might be attributed to the continuous after-effectsof S&P sovereign credit rating upgrade and President Jokowi’s stance on accommo-dating foreign investments and boost fiscal spending on value-adding sectors suchas infrastructures. The relatively decent performance in the export and householdspending sectors as the seasonal Eid al-Fitr celebration kicked in during the secondquarter might also keep yields low.

NUS RMI-CRI Quarterly Credit Report, Q2/2017 32
• Indonesia’s official reserve assets position stood at USD 123.09bn as of end-June2017, lower than the end of May 2017 level registered at USD 124.95bn. The decreasewas primarily attributable to a seasonal rise in foreign currency demand by banks as theEid al-Fitr holiday kicked in. Bank Indonesia considered the decline in reserve assetsto be temporary as a part of precautionary measures. Favourable export outlook andoptimism upon the credit rating upgrade are expected to strengthen reserve assetsbase to maintain the resilience of the external sector.95
• Long-term external debt grew 1.0% (YoY) in June 2017. Long-term external debtremained dominant in Indonesia’s external debt and stood at USD 283.6bn or 86.4%of total external debt in June 2017. Long-term external debt consisted of public sectorexternal debt amounting to USD 164.4bn (58.0% of total long-term external debt) andprivate sector external debt amounting to USD 119.2bn (42.0% of total long-term exter-nal debt). Meanwhile, short-term external debt grew 12.0% (YoY). Short-term externaldebt amounted to USD 44.6bn (13.6% of total external debt), comprised of privatesector external debt amounting to USD 41.1bn (92.1% of total short-term externaldebt) and public sector external debt amounting to USD 3.5bn (7.9% of total short-termexternal debt).96
Politics• The former education minister, Anies Baswedan, a Muslim, has won the race for Jakarta
governor. The official results are not out until May 2017. Anies Baswedan’s opponentBasuki Tjahaja Purnama, known as Ahok, a Christian Chinese descent was sentencedto two years in prison by the North Jakarta District Court after being found guilty of com-mitting a criminal act of blasphemy and inciting violence on 9 May. Andreas Harsono,an Indonesia researcher at Human Rights Watch, said more than 100 Indonesianshad been convicted of blasphemy in the past decade, with acquittals in such casesextremely rare. After Mr. Purnama’s case prompts some Chinese-Indonesians toquestion their place in the country and stoke fears that communal tensions will addto the headwinds already facing Southeast Asia’s biggest economy. NotesMay 9, 2017,Jakarta governor Ahok sentenced to two years in prison for blasphemy, Bank Indonesia,http://www.theguardian.com
Sovereign Credit Ratings• Moody’s and Fitch kept their ratings on the local currency long term bonds of Indonesia
at Baa3 and BBB- ratings respectively in Q2, with a positive outlook. S&P continued tomaintain its outlook on Indonesia’s sovereign bond at BBB- with a stable outlook, keep-ing it at investment grade level. This reflected the Indonesian government’s consistenteffort to ramp up productive spending and attract foreign investments.

NUS RMI-CRI Quarterly Credit Report, Q2/2017 33
Indonesian BanksThe RMI-CRI aggregate 1-year PD for Indonesian banks decreased to around 42bps in theend of June form 55 bps in end March 2017. Loans extended by Indonesian banks grew7.7 percent in June from a year earlier, the slowest pace for any month since October 2016.Amid a slump in commodity prices, non-performing loans (NPL) stood at 3.1% (gross) or1.4% (net). 97
Profitability• Indonesian banks in general saw a slower increase in profitability amid weak perfor-
mance in the commodity sector. The three largest majority state-owned Indonesianbanks (Bank Mandiri, Bank Rakyat Indonesia and Bank Negara Indonesia) reported aQoQ increase in net income of 32.3%, QoQ increase in net income of 2.2% and a QoQdecrease in net income of 0.99% respectively.
Funding & Liquidity• The liquidity ratio (liquid asset/bank deposit) of Indonesian banks improved from 22.2%
at end of Q1 2017 to 22.3% in May 2017.98
• The Jakarta 3-month interbank rate increased from 6.85% at the beginning of Q2 2017to 6.97% by the end of Q2 2017. Similarly, the 1-month interbank rate increased from5.87% at the beginning of Q2 2017 to 6.51% by the end of Q2 2017.99

NUS RMI-CRI Quarterly Credit Report, Q2/2017 34
Regulation• A new draft on Indonesia’s banking bill has revealed that lawmakers will proceed with
a plan to restrict the operation of foreign banks, setting a deadline for them to becomelegal entities in the form of Perseroan Terbatas (PT) or an independent company andcapping the level of foreign ownership. Doing so would mean that banks whose parentcompanies are located overseas could not just withdraw money from Indonesia shouldthere be liquidity issues in the banks’ overseas headquarters. Though the law wouldallow local banks to be protected against banking crises overseas, it would discouragenew foreign investment in the banking sector. This is in line with Basel III bankingregulation, which stipulates that any investor performing banking acquisition withoutacting as controlling shareholder would have to deposit a significant amount to safe-guard against banking management risks.100
Asset Quality• According to Bank Indonesia, the financial system remained stable. Capital adequacy
ratio and liquidity ratio of Indonesian banks, as of May 2017, stood at 22.7% and 22.3%respectively, while non-performing loans (NPL) stood at 3.1% (gross) or 1.4% (net). Thepotential growth of deposit and credit, however, are still shadowed by risks pertainingto domestic demand recovery prospects and developments in the banking consolida-tion. The transmission of easing monetary and macroprudential policy continued, albeitrestrained by banks’ prudence in managing credit risks.101
89Aug 8, 2017, Indonesia GDP Annual Growth Rate, Trading Economics, http://www.tradingeconomics.com/
90Jul 3, 2017, Inflation in June 2017 Controlled, Bank Indonesia, http://www.bi.go.id
91Jul 21, 2017, Real and nominal wages for farmworker in Indonesia (IDR), Indonesian Statistics Bureau(BPS), http://www.bps.go.id/index.php
92Jul 17, 2017, Surplus in Indonesia’s Balance of Trade Continues, Bank Indonesia, http://www.bi.go.id
93Aug 1, 2017, Manufacturing production falls at fastest pace in 19 months, Markit Economics,https://www.markiteconomics.com
94Jul 20, 2017, BI 7-Day Reverse Repo Rate Held at 4.75% Maintaining Stability and Promoting NationalEconomic Recovery Momentum, Bank Indonesia, http://www.bi.go.id
95Jul 7, 2017, Official Reserve Assets Amounted to USD 123.09 Billion as of end-June 2017, Bank Indonesia,http://www.bi.go.id
96Jun 16, 2017, External Debt Statistics of Indonesia - June 2017, Bank Indonesia, http://www.bi.go.id
97Aug 18,2017, Indonesia loan growth falls to 7.7 pct in June, lowest in 8 months, Reuters,https://www.reuters.com
98Jul 20, 2017, BI 7-Day Reverse Repo Rate Held at 4.75% Maintaining Stability and Promoting NationalEconomic Recovery Momentum, Bank Indonesia, http://www.bi.go.id
99Aug 11, 2017, Jakarta Interbank Offered Rate (JIBOR), Bank Indonesia, http://www.bi.go.id
100May 17, 2017, Indonesia gives tax office access to accounts at financial institutions, Business Times,http://www.businesstimes.com.sg
101Jul 20, 2017, BI 7-Day Reverse Repo Rate Held at 4.75% Maintaining Stability and Promoting NationalEconomic Recovery Momentum, Bank Indonesia, http://www.bi.go.id

NUS RMI-CRI Quarterly Credit Report, Q2/2017 35
Malaysian CompaniesThe RMI-CRI aggregate 1-year PD for Malaysian companies remained low below 0.50bpsover Q2 2017. Malaysia’s economy has been improving over the second quarter of 2017 asexports continue to increase and strong domestic demand contributes to economic growth,reflected by the rising CPI on a YoY basis. The effect of the reformation in GST regulation isyet to be seen, although the economy is likely not affected that much. Unemployment rateremained at 3.4%.
Economy• GDP of Malaysia increased by 5.8% YoY to MYR 287.2bn in Q2 2017 on the back of
domestic demand and robust exports. Domestic demand increased 6.2% YoY. Privateconsumption expanded by 7.1% YoY on the back of building consumer confidence andhigher wages. Government consumption growth moderated to 3.3%.In the externalsector, exports of goods and services grew 12.2% in Q2, a slackening from Q1 (+12.6%YoY). Imports grew at a slower pace (Q2: +10.8% YoY; Q1: +18.5% YoY), causing theexternal sector’s net contribution to overall growth in Q2 to rise.102

NUS RMI-CRI Quarterly Credit Report, Q2/2017 36
• Malaysia’s CPI rose by 3.6% on a YoY basis in June 2017. Among the major group-s which recorded increases were the indices for Transport (+10.5%), Food & Non-Alcoholic Beverages (+4.3%), Recreation Services & Culture (+3.0%), Health (+2.6%),Restaurants and Hotels (+2.5%) and Housing, Water, Electricity, Gas & Other Fuels(+2.2%).103
• Malaysia’s unemployment rate remained at 3.4%. According to MIDF Research, 25,000new jobs were added in May while the number of unemployed declined to 0.508mn inMay, the lowest in eleven months.104.The labour force participation rate in Malaysia isstable between 67% to 68% during the second quarter of 2016.105
• In June 2017, Malaysia’s export expanded MYR 6.6bn, up by 10% YoY to MYR 73.1bn.Imports also recorded a increase of MYR 2.3bn (+3.7%) to MYR 63.2 bn. Exports in-creased due to the higher exports to China (+MYR 2.1bn), Singapore (+MYR 893.0mn),European Union (+MYR 657.7mn), Republic of Korea (+MYR 599.6mn) and Japan(+MYR 1.2bn). Higher imports were mainly from United States (+MYR 728.9mn),India (+MYR 700.7mn), India (+MYR 700.7mn), Taiwan (+MYR 692.3mn), Switzerland(+MYR 463.9mn) and Thailand (+MYR 349.6mn).106
Monetary• As of May 12th, Bank Negara Malaysia announced that it decided to maintain the
Overnight Policy Rate (OPR) at 3%, citing Malaysia’s strengthening growth momentum,expected inflation level and strong capital and liquidity buffers in the banking system.107
• In June 2017, broad money (or M3), which measures the money supply, decreased by0.35% YoY to MYR 1.68tn.108
• In Q2 2017, the ringgit and most major and regional currencies appreciated againstthe US dollar amid the broad weakening of the US currency. The ringgit’s performanceagainst the currencies of other major trade partners was mixed. The international re-serves of Bank Negara Malaysia amounted to USD 99.4bn (equivalent to MYR 427bn)as of 31 July 2017.
Funding & Liquidity• The market indicative yield on the 10-year Malaysia government securities decreased
to 3.93% in June 2017 from 4.15% in March 2017. The same yield measure on 5-yearMalaysia government securities decreased to 3.63% from 3.83% over the same period.
• Bank lending to finance, insurance and business activities increased to MYR 3.86bnin June 2017 from MYR 3.18bn one year ago. Meanwhile, loans disbursed to themanufacturing and the wholesale, retail trade, restaurants and hotels segments overthe last quarter increased to MYR 2.35bn and MYR 99.5mn respectively. 109
NUS RMI-CRI Quarterly Credit Report, Q2/2017 37
Regulations and Politics• The troubled Malaysian sovereign wealth fund, 1Malaysia Development Berhad, failed
to meet its obligation worth USD 1.2bn to Abu Dhabi’s sovereign fund InternationalPetroleum Investment Company (IPIC), which was originally due on July 31st, 2017.IPIC, however, agreed with request of 1MDB to clear the sum owed in two installmentsdue end of the year. Bonds linked to the fund was largely unmoved during the period.110
• Bank Negara Malaysia (BNM) Governor Datuk Muhammad Ibrahim in his keynote speechat the 21st Malaysian banking summit announced more regulatory measures to betaken over this year to strengthen the banking system. This includes a mandatoryemployment reference check for financial industry employees to remove informationasymmetries during job transitions, revisions to the outsourcing policy to improve super-vision of financial institutions and a shared security operations center for the financialindustry to support the monitoring of cyber threats.111
• The Malaysian government is seriously considering a request by the local Indian-Muslimcommunity to be recognized as bumiputera, or one of the country’s indigenous races.Being recognized as bumiputera in Malaysia means that like the Malay, the communitywill be able to receive more privileges such as enjoying discounts when buying homesand also get government help in education and business. Bumiputera terms andprivileges were originally coined for the local Malay ethics to help them raise theirgenerally lower economic status. Critics view this move as a strategy to woo votersin the lead-up to the upcoming general election held in August 2018.112
• The introduction of ringgit futures on the Singapore Exchange (SGX) and the Intercon-tinental Exchange (ICE) and their offshore trading sparked criticism by Malaysia’s BankNegara. Bank Negara asserted that the ringgit is a non-internationalized currency andthus trading it in the overseas NDF (non-deliverable forward) market is not ”recognized”,suggesting that the ringgit futures introduction violates Malaysia’s foreign exchangeadministration policy and rules.113
Sovereign Credit Ratings• The Malaysian government maintained its sovereign credit ratings at all three rating
agencies. The country was rated at A3, A- and A- respectively by Moody’s, S&P andFitch. All three agencies assigned a stable outlook for their ratings on Malaysia.

NUS RMI-CRI Quarterly Credit Report, Q2/2017 38
Malaysian BanksThe RMI-CRI aggregate 1-year PD for Malaysian banks in general declined in Q2 2017 asthe banking system remained well capitalized through an increase in loan application forfinance, insurance and business activities. Increasing total bank deposits continue ensuringliquidity in Malaysian banks and counter-cyclical capital buffer remained above the minimumrequirement. Though asset quality worsened slightly and both Tier 1 Capital and savingsdeposits declined over the quarter, the financials of Malaysian banks remained in the safetyzone.
Lending• The amount of bank loan applications has decreased to MYR 64.6bn in June 2017
from MYR 76.6bn in March 2017. Loan application for finance, insurance and businessactivities had increased to MYR 3.86bn in June 2017 from MYR 3.53bn in March 2017.114
• The base lending rate of Malaysian commercial banks decreased to 6.65% in Q2 2017on a QoQ basis. The weighted base rate also decreased to 3.61% in Q2 2017 from3.62% in Q1 2017. 115

NUS RMI-CRI Quarterly Credit Report, Q2/2017 39
Funding & Liquidity• Total bank deposits increased to MYR 1.713tn from March 2017 to June 2017. The
repurchase agreement decreased from MYR 14.6bn in March 2017 to MYR 12.2bn inJune 2017. 116
• Savings deposit in banking system decreased to MYR 151.8bn in June 2017 from MYR151.9bn in March 2017.117
Capital Levels & Regulations• The Common Equity Tier 1 Capital ratio for Malaysian banks decreased to 12.9% in
June 2017 from 13.1% in March 2017. Similarly, the Tier 1 Capital Ratio decreased to13.8% from 13.9% in the same period.
Asset Quality• The value of impaired loans at Malaysian banks had increased slightly to MYR 25.47bn
in June from MYR 24.95bn in March 2017. The ratio of net impaired loans to net totalloans remained at 1.2% on a QoQ basis.118
102Aug 18, 2017, Malaysia: Economy surges ahead in Q2, Department of Statistics Malaysia, http://www.focus-economics.com/
103Jul 19, 2017, Consumer Price Index Malaysia June 2017, Department of Statistics Malaysia,https://www.statistics.gov.my
104May 17, 2017, Unemployment rate dips as economy picks up, The Edge Markets,http://www.theedgemarkets.com
105May 15, 2017, PRESS RELEASE KEY STATISTICS OF LABOUR FORCE IN MALAYSIA, MARCH 2017,Department of Statistics Malaysia, https://www.statistics.gov.my
106Aug 4, 2017, Monthly External Trade Statistics June 2017, Department of Statistics Malaysia,https://www.statistics.gov.my
107May 12, 2017, Monetary Policy Statement , Bank Negara Malaysia, http://www.bnm.gov.my
108May 23, 2017, Economic and Financial Data for Malaysia, Bank Negara Malaysia, http://www.bnm.gov.my
109Jul 31, 2017, Monthly Statistical Bulletin?June 2017, Bank Negara Malaysia, http://www.bnm.gov.my
110Aug 1, 2017, Abu Dhabi gives new deadline as 1MDB misses USD 600 million payment, Reuters,http://www.reuters.com
111May 12, 2017, Bank Negara to introduce more rules to strengthen banking system, The Star Online,https://www.rsis.edu.sg
112Apr 28, 2017, Monetary and Financial Developments March 2017, Bank Negara Malaysia,http://www.bnm.gov.my
113May 4, 2017, Bank Negara removes reserve fund requirement for banks, The Edge Markets,http://www.theedgemarkets.com/
114Jul 31, 2017, Monthly Statistical Bulletin?June 2017, Bank Negara Malaysia, http://www.bnm.gov.my
115Jul 31, 2017, Monthly Statistical Bulletin?June 2017, Bank Negara Malaysia, http://www.bnm.gov.my
116Jul 31, 2017, Monthly Statistical Bulletin?June 2017, Bank Negara Malaysia, http://www.bnm.gov.my
117Jul 31, 2017, Monthly Statistical Bulletin?June 2017, Bank Negara Malaysia, http://www.bnm.gov.my
118Jul 31, 2017, Monthly Statistical Bulletin?June 2017, Bank Negara Malaysia, http://www.bnm.gov.my

NUS RMI-CRI Quarterly Credit Report, Q2/2017 40
Europe
The RMI-CRI aggregate 1-year PD for European firms decreased slightly during Q2 2017,alongside with reduced political risk, a positive economic backdrop and improved corporateearnings. Comments made by the European Central Bank President Mario Draghi at theend of June implied that economic stimulus measures could soon be withdrawn. Political riskwas the focus in the early part of Q2 as the French presidential elections approached buta win by pro-EU candidate Emmanuel Macron decreased the risk of a Eurozone break-up.The German Ifo business survey reached a record high in June while Eurozone inflation fellto 1.3%. Companies reporting earnings said sales and bottom lines have improved. Thetop performing credit sectors were largely in the real estate and utilities sector. The creditprofiles of energy companies however continued to have an elevated risk of default.

NUS RMI-CRI Quarterly Credit Report, Q2/2017 41
Italian CompaniesThe aggregate 1-year RMI PD for Italian companies fell further during Q2 2017 with positivesentiments from the previous quarter extending into this quarter and deleveraging effortsby the Italian government starting to show effects. Strong performance in the servicessector led to higher expectations of economic growth this year. Economists at Bank of Italyare expecting an annual growth of 1.4% in 2017, the strongest in a decade. Sectors thathad driven growth are exports and tourism, fueled by the recovering demand from Europe.However, economists have flagged out the growing interdependence between Europeannations. Italy had benefited from the improving growth in EU as a whole, but it still remainsthe most fragile in Europe. Fortunately, the possibility of a major collapse in the Italianeconomy is remote in the short to medium term and its economy looks to be stable despitethe problems that exist within it.
Economy• The GDP of Italy is estimated to increase by 0.4% moving from Q1 2017 to Q2 2017.
The economy expanded 1.5% year-over-year, and although the rate is consideredmodest in most nations, this is the strongest growth Italy has experience since 2011.Organizations such as Istat, ECB and IMF have revised their estimates for Italianeconomic growth for the rest of the year upwards. Exports had been the main driverof growth for the Italian economy, powered by strong demand from EU nations such asGermany and France. Tourism has also contributed substantially to growth. Expertsfeel that Italy should be wary of its increasing dependence on European nations forgrowth. The same holds true for other EU member states as there will be an over-sized impact on the EU economy should the third largest economy in the Eurozonefalter.119,120

NUS RMI-CRI Quarterly Credit Report, Q2/2017 42
• Italy’s unemployment rate returned to 11.1% in June 2017, the same level as in April2017, after a slight increase to 11.3% in May 2017. The country ended the quarterwith 22.96mn people employed. 2.855mn people were unemployed, a 5.5% decreasefrom the previous quarter. Youth unemployment (aged 15-24) was 35.4%, down 1.1percentage points over May.121
• Italy’s manufacturing Purchasing Managers’ Index (PMI) - an index of sentiment in themanufacturing sector - improved slightly to 55.2 in June from May. Growth rate inmanufacturing production rebounded in June, after hitting a four-month low midwaythrough the second quarter. Manufacturing output has been rising due to growth inmanufacturers’ order books. Strong demand for exports resulted in order books ofmanufacturers increasing for ten consecutive months.122
• Italy’s services PMI reported a three-month low reading of 53.6 in June 2017, down froma near ten-year high in the previous quarter. On the overall, order books continued togrow with a solid rate of expansion. Increase in activity was more broad-based in Q2,with Hotels & Restaurants being the only sub-sector to register a downturn. Demandconditions look to be supportive as businesses report sustained growth in new orders.The rate of job creation fell from its peak in Q1 2017, but remains positive as companiescontinue to hire to meet the rise in workplace activity. Cost pressures are high withaverage input prices reaching a 12-month peak in May. Despite so, services firmsshowed strong positive sentiments towards future growth prospects due to plannedinvestments, increasing market activity and growing sales efforts.123
• The European Commission Italy Economic Sentiment Indicator (ESI), which assessesthe economic outlook of EU countries as a weighted average of the industrial, services,construction, retail and consumer sectors, reported a reading of 106.1 in both Juneand May, and 107.0 in April. These figures are notably higher than the 105.6 averagereported over Q1 2017.124
• The confidence climate index increased in June 2017 from 106.4 to 106.7. The personaland current components of the index improved from 100.9 to 101.6, and 105.7 to 106.3respectively. The outlook on unemployment was brighter - the reading improved from35.5 to 37.2, while outlook on the expectations on inflation was negative, decreasingsignificantly to -13.7 from -3.7.125
• Retail sales, indexed by the Markit Retail PMI fell again in June with a reading of 47.1due to weak consumer spending power and lot footfall. Retailers had expected bettersales performance in June, but two-in-five businesses missed their targets. Confidenceof retailers towards future sales prospects is waning and sales forecasts are the leastoptimistic since January. Gross Margins have deteriorated further in June as discountswere used to attract customers.126
Funding & Liquidity• Yields on 10-year Italian bonds slide during Q2 2017, from 2.318% on 31st March 2017
to 2.203% on 31st May 2017. Yields have been falling due to strong economic growthover the quarter and economists upgraded their prediction on Italian economic growthto a 1-year high in June.
• Interest rates on loans (other than bank overdrafts) to non-financial corporations de-creased considerably throughout Q2 2017, down from 2.44% in April 2017 to 2.37%in June 2017. Bank interest rates (including revolving loans, overdrafts and extendedcredit card credit) to corporations decreased throughout Q2 2017, from 3.25% in April2017 to 3.12% in June 2017. Loans for house purchases decreased from 2.09% to2.07% in the second quarter.127,128,129

NUS RMI-CRI Quarterly Credit Report, Q2/2017 43
• Preliminary estimates for outstanding loans to non-financial institutions stood at 771,760,the lowest amount since 2017. Total outstanding loans overall decreased by 1.82% fromthe previous quarter.130
Politics• Former Italian Prime Minister Matteo Renzi regained leadership of the governing Demo-
cratic Party in May, after securing over 70% of the votes in the leadership primaries.Renzi had resigned earlier in December 2016 due to a loss in the constitutional reformreferendum. The vote is regarded as a key test before the 2018 parliamentary electionsand the overwhelming support for Renzi points to the possibility of him returning asItaly’s Prime Minister. However, it is widely believed that the next elections will result ina hung government with no majority. Italy’s current government has little political capitalto push forth supply-side reforms which are much needed to revive the Italian economy.Italy is considered the biggest political risk in Europe currently and its economy is verymuch under the threat of political instability. Any signs of political instability can derailits path to recovery.131
• Italy’s latest published public accounts were that of Q1 2017. Total expenditures andtotal revenues for Q1 increased by 0.8% and 2% respectively. The increase in totalexpenditures was attributed to increase in current expenditures by 0.9% and a fall of1.6% in total capital expenditures. Increases in total revenues were driven by growth ofcurrent taxes on income and wealth (+1.8%), taxes on production and imports (+3.1%)and social contributions (+1.0%). The Government deficit to GDP ratio was 2.3%,unchanged compared with the second quarter of 2015. Italy’s debt-to-GDP ratio isset to stand at 134.7% as of Q1 2017. 132,133
• In April, Italy announced a massive budget deficit cut of EUR 3.4bn after pressure fromthe EU to reform its fiscal status. After the announcement, the budget deficit target isrevised down from 2.3% to 2.1% of GDP. The Italian government reassured the publicthat the deficit will be reduced by reforms and growth and not simply higher taxes.Measures are introduced to fight tax evasion and improve efficiency of tax collection.These measures are accompanied by new competition laws and an overhaul of the civiljustice system. Although Italy’s budget deficit is below the upper limit of 3% of GDPset by the EU, its high debt levels has been contravening EU rules with delays in bringdown the amount to promised levels.134
Sovereign Credit Ratings• Moody’s retained its rating of Baa2 with a negative outlook amid Italy’s ongoing prob-
lems and political uncertainty. Fitch did not revise its ratings after downgrading Italy fromBBB+ to BBB on 21 April. S&P gave Italy a rating of BBB- on 5 May with a stable outlookas it expects the Italian government to continue adopting structural reform measuresand improve the effectiveness of Italy’s judiciary and public administration.135

NUS RMI-CRI Quarterly Credit Report, Q2/2017 44
Italian BanksThe aggregate 1-year RMI PD for Italian banks remained relatively constant with a slightdrop as the Italian government deciding to wind down two of its failing regional banks,namely Banca Popolare di Vicenza and Veneto Banca in Q2 2017. This is coupled witha recapitalization of Banca Monte dei Paschi di Siena to prevent a potential collapse andsafeguarding the interests of Italian depositors. Liquidation of the two banks proved to becostly for the Italian government as it commits EUR 17bn to convince Intesa Sanpaolo toacquire the good assets in the two banks so as to prevent losses from being transferred tocreditors. However, EU taxpayers were made to bear the cost of this rescue as the liquidationhappened under Italian insolvency laws. The delayed rescue of two Veneto-based banks ispositive for the stability of the Italian banking system as further bail outs will not be requiredby these ailing banks and the move eliminated a portion of non-performing loans (NPLs)from the Italian economy. Asset quality at Italian banks is slowly improving, though it remainsworse than peers in the Eurozone. Health of Italian banks is expected to continue improvingunder tighter ECB scrutiny. However, there still exists a significant amount of NPLs in theItalian economy and Morgan Stanley estimates that it may take ten years before Italy is ableto reduce its NPLs to the European average.
Profitability• FTSE Italia All-Share Banks Index, the Italian banking index, experienced a significant
climb during Q2 2017. The index stands at 11,128.46 as of 31 June 2017, up from10174.39 on 31 March 2016. The implementation of the turnaround plan by the Italiangovernment and ECB is mainly responsible for the rise of the index. After the liquidationof the two Veneto-based banks and recapitalization of Monte Paschi, profitability hasimproved for Italian banks. Major Italian lenders like UniCredit have posted higherprofits during Q2 2017 and reported net profits of financial institutions in Italy exceeded

NUS RMI-CRI Quarterly Credit Report, Q2/2017 45
analysts’ expectations by 40%. Traditionally, profitability of Italian banks has been lowrelative to their peers in the Eurozone as a huge share of their assets was devotedto lending. With mounting non-performing loans (NPLs), profitability of Italian bankssuffered in the past few quarters due to the need to write-down these NPLs. However,with the implementation of the turnaround strategy, the problem is increasingly resolvedand profitability is slowly returning to Italian banks.136,137
Funding & Liquidity• Coupons on new 5-year euro-denominated Italian bank bond issuances decreased to
0.65% during Q2 while 3-month Euribor rate was stable during the quarter.
• The 12-month percentage change in deposits of funds by Italian residents was 3.79% inJune 2017, while total deposits of non-domestic residents fell by 6.71%. Bank fundingfrom the Eurosystem grew by 46.86% compared to June 2016, while debt securitiesissued by banks fell 15.8% compared to the same period last year. Total deposits andpostal savings by residents and non-financial corporations was EUR 235.62bn, basedon latest data published in Q1 2017. 138,139
• Interest charged on business loans (other than bank overdrafts) of over EUR 1mn tonon-financial institutions was 1.146% in June 2017, up from the 1.232% reported inMarch 2017. Similar loans with collateral and/or guarantees were charged with aninterest rate of 1.592%, down from 2.039% charged during June 2016. Bank interestrate on loans to sole proprietors was 2.987% in June 2017, down from 3.174% in thesame period last year.140
• The Bank of Italy’s liabilities to Euro-area financial counterparties totaled EUR 123bnin June 2017.141
• Italian bank liabilities towards the Eurosystem increased to EUR 255bn in May 2017from EUR 200bn in February 2017. Lenders increased their funds held at the ECB by69.6% YoY in May 2017 while capital and reserves decreased to EUR 451bn during thethree months ending May 2017.142
• According to the latest bank lending survey, Italian banks reported that their creditsupply policies for households and firms had eased slightly in Q1 2017, indicatingfavorable credit supply conditions. In a separate business confidence survey, creditaccess conditions were reported to have improved slightly for manufacturing firms.However, the same conditions were tightened for services and construction firms. Sup-ply conditions improved for manufacturing firms of all sizes, but it is especially so forlarge firms.143
Asset Quality• The Bank of Italy said that the ratio of new non-performing loans to outstanding in-
creased slightly during Q1 to 2.4% from 2.3% in the preceding quarter. The non-performing ratio for loans to firms stands at 3.6% while a similar measure for loansto households stayed roughly constant at 1.6%.144
• The percentage of write-downs over non-performing loans for Q1 2017 is measured tobe 52.8%, 8 percentage points higher than the average of other main European banks.Currently, sales and securitizations are under way and significant drops in the volumeof net non-performing exposures is expected in the coming quarters.
119Aug 16, 2017, Preliminary estimate of GDP, Italian National Institute of Statistics, istat.it
120Aug 24, 2017, Italy, Europe economies more dependent than ever before, economists say, Xinhua,http://news.xinhuanet.com

NUS RMI-CRI Quarterly Credit Report, Q2/2017 46
121Jul 31, 2017, Employment and unemployment: provisional data, Italian National Institute of Statistics,istat.it
122Jul 3, 2017, Manufacturing sector sees strong finish to second quarter, Markit,https://www.markiteconomics.com/
123Jul 5, 2017, Service sector upturn eases at end of second quarter, Markit,https://www.markiteconomics.com/
124Aug 2, 2017, Economic sentiment indicator for Italy, Eurostat, ec.europa.eu/eurostat
125Jul 26, 2017, Consumer and business confidence, Italian National Institute of Statistics, istat.it
126Jul 6, 2017, Retail sales fall again in June, Markit, https://www.markiteconomics.com/
127Aug 2, 2017, Italian MFIs: Interest per annum on new loans to non-financial corporations,, ECB, sd-w.ecb.europa.eu
128Aug 2, 2017, Italian MFIs: Revolving loans & overdrafts, convenience & extended credit card credit tocorporations,, ECB, sdw.ecb.europa.eu
129Aug 2, 2017, Italian MFIs: Cost of borrowing for households for house purchase,, ECB, sdw.ecb.europa.eu
130Aug 2, 2017, Italian MFIs: Total loans to non-financial corporations,, ECB, sdw.ecb.europa.eu
131May 2, 2017, What Renzi’s ’extraordinary’ comeback means for Italian politics, CNBC, http://www.cnbc.com/
132Jun 30, 2017, Quarterly non-financial accounts for General Government, households income and savingsand non-financial corporation profits , Italian National Institute of Statistics, istat.it
133Jul 20, 2017, , Eurostat, ec.europa.eu/eurostat
134Apr 12, 2017, Italy appeases Brussels with 3.4bn in extra budget deficit cuts, FT, https://www.ft.com/
135May 5, 2017, IMF explores ways to increase profitability of Italy’s banking sector, Reuters,http://www.reuters.com/
13631 Jul, 2017, UniCredit restructuring efforts pay off with robust results, Central Banking,https://www.centralbanking.com/
137Aug 3, 2017, UniCredit restructuring efforts pay off with robust results, FT, https://www.ft.com/
138Aug 2017, , Banca Italia, https://infostat.bancaditalia.it
139Aug 2017, , Banca Italia, https://infostat.bancaditalia.it
140Aug 2017, , Banca Italia, https://infostat.bancaditalia.it
141Jul 2017, Economic bulletin - July 2017,, Banca Italia, http://www.bancaditalia.it
142Jul 2017, Economic bulletin - July 2017,, Banca Italia, http://www.bancaditalia.it
143Jul 2017, Economic bulletin - July 2017,, Banca Italia, http://www.bancaditalia.it
144Jul 2017, Economic bulletin - July 2017,, Banca Italia, http://www.bancaditalia.it

NUS RMI-CRI Quarterly Credit Report, Q2/2017 47
UK CompaniesThe aggregate RMI-CRI 1-year PD for companies in the UK maintained fairly stable witha marginal downtrend amid sluggish economy. GDP growth remained below forecasts,growing by 0.3% QoQ, while unemployment continued to dip. The manufacturing and con-struction sectors posted negative growth, the first time since Q4 2016. Rising inflationweakens consumer spending power as reforms on the British immigration law post-Brexitand a weak pound continued triggering labor shortage, which reduces domestic goodsproduction and widens UK’s trade deficit. Uncertainties caused by the post snap electionresult and Brexit process that will complete in March 2019 are set to be challenges thatBritain will face in the near term.
Economy• The UK’s Q2 2017 GDP remained below forecasts, growing by 0.3% QoQ, the same
rate as in Q1 2017. Q2 2017 growth was primarily driven by services, which grewby 0.5% compared to 0.1% growth in Q1 2017 with retail trade and film productionand distribution being the top contributors of growth. Retail trade (distribution, hotels,restaurants and F&B services sector) except of motor vehicles grew by 1.1% and con-tributed 0.15 percentage points to GDP. Film production grew by 8.2% and contributed0.07 percentage points to GDP growth. Construction and manufacturing contributed tothe largest downward pulls on quarterly GDP growth, following 2 consecutive quartersof growth. Construction output was estimated to have decreased by 0.9% during Q22017 as compared to 1.1% growth last quarter. Manufacturing decreased by 0.5% inQ2 2017, mainly due to a large fall in the manufacture of motor vehicles. Negative man-ufacturing output, however, was partially offset by a 0.3% increase in electricity, gas,steam and air conditioning supply, causing a slightly better performance in production

NUS RMI-CRI Quarterly Credit Report, Q2/2017 48
sector. Agriculture, government services and financial services grew by 0.6%, 0.2%and 0.4% respectively.145
• The unemployment rate was 4.5% for the period of March 2017 to May 2017, down from4.9% recorded during this same period one year ago, and lower than the 4.7% recordedin the preceding three months of December 2016 to February 2017. The employmentrate was 74.9%, 0.3 percentage points higher than the previous three months, andthe highest since comparable records started in 1971. Estimates indicate that averageweekly earnings for employees in real terms fell by 0.5% excluding bonuses, comparedto last year. 79.5% of men aged 16 to 64 were in work, while 70.4% of women were inwork.146
• Consumer spending continued falling in Q2 2017 based on Visa’s UK Consumer Spend-ing Index, further justifying the fact that an increase in the cost of living and a slowingwage growth are squeezing household disposable income. Rising inflation also affectedshopping habits as consumers are shifting their spending to essentials. F&B spendinggrew by nearly 2%, while spending on recreation and culture dropped for the first timeat 1.2% in nearly four years. Similarly, high street failed to turn their fortunes aroundas spending falls for the second consecutive month at 2.4%, albeit at a softer pacethan in May 2017. E-commerce spending continued to grow by 2.9%, down from 6.8%increase in May 2017.147
• In the 3 months up to May 2017, the deficit on trade in goods and services widened toGBP 8.9bn from a deficit of GBP 6.9bn for the 3 months to February 2017. The wideningdeficit is attributed to a higher rise in imports (2.1%) than the rise in exports (0.8%) ingoods and services, in particular transport equipment, oil and electrical machinery fromnon-EU countries. The value of goods exported to non-EU countries continue to behigher than those exported to EU countries. Both exports experienced a growth levelof 15.9% and 15.0% respectively. Excluding the impact of falling oil prices, import andexport prices grew by 1.0% and 0.5% respectively.148
• The Markit/CIPS Purchasing Managers’ Index (PMI) for the manufacturing sector stoodat 54.3 in June 2017, down from 56.3 in May and the lowest in three months. Aver-age PMI level over Q2 2017 registered the best performance for three years at 55.9.Output and new orders are rising at milder rates across the consumer, intermediateand investment goods sectors. Job expansion rate slowed in all small, medium andlarge-sized enterprises. This was partly due to the weaker increase in new business,which lessened the pressure on operating capacity.149
• In the construction sector, the PMI index read 54.8 for March, down from 56.0 in May.Softer growth momentum was recorded across three broad categories of constructionactivity, mainly residential building, commercial work and civil engineering. A lack ofnew work to replace completed projects partly due to heightened economic uncertaintywas believed to be the main factor that weighed down on construction growth in June.Economic uncertainty also weighed down on employment as worrying business out-look prompted companies to not replace voluntary leaving workers. UK constructioncompanies also reported another steep increase in their average cost burdens in Junefollowing solid demand for construction materials, longer materials delivery time andheightened inflation level.150

NUS RMI-CRI Quarterly Credit Report, Q2/2017 49
Monetary• In its most recent meeting on June 15th 2017, the Monetary Policy Committee (MPC)
of the Bank of England voted 5-3 to maintain the Bank Rate at 0.25% to meet its 2%inflation target. The Committee also voted unanimously to maintain the stock of sterlingnon-financial investment-grade corporate bond purchases at GBP 10bn and maintainthe stock of UK government purchases at GBP 435bn. The purchasing activities wouldbe financed by the issuance of central bank reserves. CPI inflation reached above2.9% in May 2017 on account of last year’s sterling depreciation, surpassing MPC’sexpectation. UK’s Central Bank expects inflation to rise beyond 3% by fall should theBritish pound continued to hopefully decline in the near term.151
• CPI grew by 2.6% year-on-year in June 2017, down from 2.7% in May 2017. Thismarked its first fall since April 2016 though it remained higher than the rates generallyseen since mid-2013. Falling price for motor fuels and certain recreational and culturalgoods and services were the main contributors to the fall in the rate. Rising pricesfor furniture and furnishings helped to partially offset the decrease in CPI. Althoughfood and non-alcoholic beverages, furniture and household goods and restaurants andhotels experienced their highest 12-month rate since 2013, they contribute little to theinflation rate as compared to furniture and furnishings.152
Politics• PM Theresa May’s gamble on a snap election in hopes of successfully delivering Brexit
under a ’stronger government’ backfired when it ended up weakening the governmentinstead through the 8 seat losses that prevented the government’s party, the Conser-vatives, from securing the minimum 326 seats needed to establish a majority in theparliament. Following that, May sought support from the Democratic Unionist Party(DUP) to form a small working majority in the parliament through an informal coalitionunder certain conditions. She also requested permission from Queen Elizabeth to forma government, which ended up with the MPs endorsement of the Queen’s Speech andeffectively approved her creation of a fragile government to deliver Brexit.153
• With a weaker bargaining power shortly after the disappointing snap election result,Theresa May was pressured by members of her new cabinet to embrace a ’soft’ insteadof a ’hard’ Brexit. A soft Brexit means that Britain will be able to keep unfettered accessto the European single market in the form of trading of goods and services with the EUstates on a tariff-free basis. It would also mean that exports to and from the UK will notbe subject to border checks and customs duties. 154,155
• The impact of Brexit and the recent snap election results has led the public to speculatethat Britain is expected to cut tax rates below the European average to persuadecompanies to retain their European business operations in the UK. However, Britishfinance minister Philip Hammond responded otherwise. He stated that the UK will notcut tax and regulations after Brexit to undercut EU rivals and become a tax haven. Thisis a significant change in tone after Hammond suggested in January 2017 that Britainmay have to transform its economic model into that of a corporate tax haven should theUK fail to access the EU market.156
• After days of contradictory statements from ministers on the immigration law after Brexit,a spokesman for PM Theresa May confirmed that free movement of EU citizens to andfrom the UK would end in March 2019, when the UK officially leaves the EU bloc. Thegovernment reasoned that this assertion was made to honor results from the Brexitreferendum. This has been one of the key discussions after Brexit occurred sincethe decision has implications on economic development given the fact that the Britisheconomy relies considerably on imported labor.157

NUS RMI-CRI Quarterly Credit Report, Q2/2017 50
Sovereign Credit Ratings• Moody’s long term rating on the UK remain unchanged since June 2016 at Aa1, one
notch below the highest possible Aaa. S&P’s rating was also unchanged on the coun-try’s foreign and local currency long term debt at AAu, one notch below the covetedAAA. Fitch Ratings also rated the sovereign’s long term debt at AA, one rank fromits highest rating of AAA. All three rating agencies maintained a negative outlook onthe UK, reflecting the uncertainties that emerged after British PM Theresa May losta majority in the parliament during a snap election she proposed to deliver Brexitsuccessfully.
UK BanksThe RMI-CRI aggregate 1-year PD for banks in the United Kingdom improved slightly in Q22017 - similar to the trend exhibited by the RMI-CRI aggregate 1-year PD for UK companies.In terms of fundamentals, however, profitability in terms of net income showed some signof concern as a number of banks reported falling net income, which is likely due to UK’sincreasing disengagement from the European single market. The FTSE 350 Banks Indeximproved by 4.52% over the quarter.

NUS RMI-CRI Quarterly Credit Report, Q2/2017 51
Profitability• According to the Monetary financial institutions’ quarterly income and expenditure ta-
bles released by the Bank of England, the net interest receivable increased from GBP16.51bn in Q4 2016 to GBP 16.53bn in Q1 2017. Interest receivable was GBP 31.28bn,while interest payable was GBP 14.75bn. While interest payable on deposits droppedby over 7%, interest receivable from loans and advances dropped by just slightly over3%. 158
• Banks reported a drop in net fees and commissions, down to GBP 4.84bn across Q12017 from GBP 5.23bn in Q4 2016. Dividends paid by banks almost increase fivefold,from GBP 1.19bn in Q4 2016 to GBP 5.01bn in Q1 2017.
• In terms of net income, Barclays reported a net loss of GBP 1.24bn in Q2 2017, downfrom GBP 329mn profit in Q1 2017. Lloyds also reported a decrease in net profit atGBP 727mn in Q2 2017 from GBP 871mn in Q1 2017. On the bright side, HSBC madefurther progress with a USD 4.05bn net profit in Q2 2017 from a net profit of USD 3.47bnin the first quarter of 2017. The Royal Bank of Scotland (RBS) also similarly reporteda higher net income at GBP 680mn in the second quarter of 2017 compared to GBP375mn in Q1 2017, marking yet another good quarterly performance after suffering anet loss of GBP 4.28bn in Q4 2016.
Funding & Liquidity• According to the Bank Liabilities Survey produced by the Bank of England, UK banks
and building societies reported that total funding volumes increased in the three monthsto mid-June 2017. More specifically, within the total, both retail deposit funding (whichincludes deposits from households and from private non-financial firms) and ’other’funding, which includes wholesale deposits and wholesale debt funding, had bothincreased. Lenders expected total funding volumes to increase significantly in Q32017.159
• Investor demand for wholesale debt increased slightly in Q2 2017, although demandfrom retail investors decreased by -1.3%. Lenders largely expect demand for wholesaledebt to increase further in Q3 2017.
• Wholesale debt funding from commercial paper increased by 7.3% in Q2 2017 andis expected to rise by 5.1% in the next quarter, while funding from short-term re-po/securities lending remained unchanged this quarter.
Asset Quality• The total write-offs of sterling denominated loans dropped from GBP 1.19bn in Q4 2016
to GBP 1.02bn in Q1 2017, attributed in part to credit-card write-offs to individuals,which decreased from GBP 394mn to GBP 357mn. Write-offs to private non-financialcorporations, however, increased from GBP 431mn to GBP 453mn from Q4 2016 to Q12017. Write-offs to non-residents decreased significantly to GBP 8mn from GBP 51mnin the previous quarter.160
• Write-offs on loans denominated in foreign currency decreased from GBP 325mn in Q42016 to GBP 161mn in Q1 2017, driven by a 55% drop in the write-offs on loans tonon-residents, which constitute the largest share of the total write-offs.
145July 26th, 2017 Gross domestic product, preliminary estimate: Apr to June 2017, ONS,http://www.ons.gov.uk
146July 12th, 2017 UK labour market: July 2017, ONS, http://www.ons.gov.uk
147July 10th, 2017 June rounds off worst quarter for spending since Q3 2013, Visa, http://visa.co.uk

NUS RMI-CRI Quarterly Credit Report, Q2/2017 52
148July 7th, 2017 UK trade: May 2017, ONS, http://www.ons.gov.uk
149July 3rd, 2017 UK manufacturing growth slows at end of second quarter, Markit,https://www.markiteconomics.com/
150July 4th, 2017 UK construction sector recovery loses momentum in June, Markit,https://www.markiteconomics.com/
151June 15th, 2017 Bank Rate held at 0.25%, government bond purchases at ?435bn and corporate bondpurchases at ?10bn, Bank of England, http://www.bankofengland.co.uk/
152July 18th, 2017 UK consumer price inflation: June 2017, ONS, https://www.ons.gov.uk/
153June 9th, 2017 British election results: Mays gamble backfires, Financial Times, https://www.ft.com/
154June 13th, 2017 Theresa May faces pressure in cabinet to embrace soft Brexit, Financial Times, http-s://www.ft.com/
155June 23rd, 2017 What is soft Brexit and how is it different to a hard Brexit??, The Sun,https://www.thesun.co.uk/
156July 31st, 2017 UK will not cut taxes below European average after Brexit: Hammond, Reuters,http://www.reuters.com/
157March 30th 2017 Great Repeal Bill: All you need to know, BBC, http://bbc.com
158July 31st, 2017 Bankstats (Monetary & Financial Statistics) - June 2017, Bank of England,http://www.bankofengland.co.uk/
159April 13th 2017 Bank Liabilities Survey - Survey Results 2017 Q1, Bank of England,http://www.bankofengland.co.uk/
160July 31st, 2017 Bankstats (Monetary & Financial Statistics) - June 2017, Bank of England,http://www.bankofengland.co.uk/

NUS RMI-CRI Quarterly Credit Report, Q2/2017 53
Appendices
The appendices provide readers with a comprehensive overview of various outputs thatare produced by RMI-CRI’s operational PD system. While the PD system provides defaultforecasts at horizons ranging from one month to five years, here only RMI-CRI 1-year PDsare reported. In addition to the PD produced by the RMI-CRI system, important macroeco-nomic, corporate credit and sovereign risk indicators are provided. These summarize thecredit situation at a glance, as well as provide detailed data for reference purposes.
Appendix A and Appendix B give RMI-CRI 1-year aggregate PD where the aggregationsare by region, economy and sector. In these sections, the RMI-CRI 1-year aggregate PD isbased on the median PD of active listed firms. These are given as month-end data, and arebased on RMI’s default forecast model calibrated on July 10, 2017, using data up to June 30,2017. For a detailed description of RMI-CRI’s default forecast model, the Technical Reportis available on our website.
Appendix A provides 1-year aggregate PD by economy and sector. For each economy, thegraph on the left shows the time series of 1-year aggregate PD for all exchange listed firmswithin the economy (thick blue, left axis), and the time series of the number of firms with PD(thin orange, right axis). The table on the right provides the median and standard deviationof PDs for firms within ten industry sectors at the end of Q1 2017 and Q2 2017. Note thatthe statistics are for firms that have a PD at both dates so that consistent comparisons canbe made. The median and standard deviation of the difference of individual PD is also given.The industry sectors are based on the Level I Bloomberg Industry Classification.
Appendix B gives 1-year aggregate PD by the seven regions of Asia-Pacific developed,Asia-Pacific emerging, North America, Latin America, Eastern Europe, Western Europe andAfrica & the Middle East. The top two graphs of each regions show the time series ofthe distribution of Probability of Default implied Ratings (PDiR). The PDiR methodology isdescribed in the last section of Appendix D. The different colored areas in the graph indicatedifferent PDiR classes. From the bottom, the blue area indicates the percentage of CCC/Cfirms, the bottom-most white area indicates B firms, the orange area indicates BB firms, themiddle white area indicates BBB firms, the green area indicates A firms, the top-most whitearea indicates AA firms, and the maroon area indicates AAA firms.
The bottom 12 graphs in each region show the time series of RMI-CRI 1-year aggregate PDfor all exchange listed firms in the region, all non-financial firms in the region, and firms ineach of the ten industry sectors in the region. Each graph shows the PD in thick blue on theleft axis and the count of firms with PD in thin orange on the right axis.
Appendix C provides common macroeconomic, corporate credit and sovereign risk indi-cators for each economy along with the RMI-CRI 1-year aggregate PD for financial andnon-financial firms. The graphs on the left give historical context to the values, and thetable on the right gives the data from the previous five quarters. For variables that are morefrequent than quarterly, the last value in the quarter is used. But if a variable is available ata monthly frequency and the end of March data was not available at the time this report wascompiled, the previous month’s data is given with an asterisk.
Appendix D gives a more detailed description of the data in Appendix C, along with adescription of the PDiR.

NUS RMI-CRI Quarterly Credit Report, Q2/2017 54
A PD by economies
1996 2004 20120
50
100
150
200
Argentina, All firms1Y PD (LHS, bps) and # of firms (RHS)
1996 2004 20120
20
40
60
80Argentina 2017Q1 2017Q2 Q2-Q1
# Median St.Dev. Median St.Dev. Median St.Dev.Financials 11 20.4 27.0 26.3 42.6 4.9 17.8Basic Materials 6 24.3 41.7 38.7 51.0 4.6 12.4Communications 3 2.2 1.2 1.4 0.8 -0.5 0.5Consumer Cyclical 6 11.2 44.1 14.1 40.8 1.6 7.1Consumer Non-cyclical 16 4.4 19.5 5.9 26.8 1.8 8.1Diversified 2 22.8 6.5 20.7 23.1 -2.0 16.6Energy 4 6.4 28.2 20.3 18.0 -0.4 21.9Industrial 7 4.1 4.6 5.7 4.1 0.9 4.4Technology 1 0.5 – 0.2 – -0.3 –Utilities 10 3.3 6.9 3.3 7.9 -0.2 1.6
1996 2004 20120
10
20
30
40
Australia, All firms1Y PD (LHS, bps) and # of firms (RHS)
1996 2004 20120
500
1000
1500
2000Australia 2017Q1 2017Q2 Q2-Q1
# Median St.Dev. Median St.Dev. Median St.Dev.Financials 151 1.0 12.7 1.2 32.7 0.0 25.7Basic Materials 533 5.5 28.2 5.8 38.4 0.3 20.6Communications 101 4.8 16.8 4.8 40.3 0.1 35.2Consumer Cyclical 79 2.0 41.3 1.9 36.2 0.0 9.0Consumer Non-cyclical 232 1.9 31.9 2.6 62.2 0.0 44.3Diversified 7 1.9 5.0 1.9 6.7 0.0 1.9Energy 169 9.4 41.8 9.6 64.4 0.5 37.8Industrial 107 4.1 32.7 4.7 31.0 -0.0 16.1Technology 107 5.3 26.5 6.4 34.5 0.3 28.4Utilities 13 5.0 78.7 3.4 15.8 -0.0 69.5
1996 2004 20120
50
100
Austria, All firms1Y PD (LHS, bps) and # of firms (RHS)
1996 2004 20120
100
200 Austria 2017Q1 2017Q2 Q2-Q1# Median St.Dev. Median St.Dev. Median St.Dev.
Financials 21 2.8 13.5 6.0 18.9 0.0 12.6Basic Materials 3 1.4 3.0 2.2 1.5 -0.4 1.9Communications 1 1.1 – 0.9 – -0.1 –Consumer Cyclical 10 5.6 26.6 5.1 21.1 -0.5 6.3Consumer Non-cyclical 6 11.2 8.8 7.8 8.6 -1.0 7.1Energy 4 5.2 1.7 5.2 2.9 -0.0 1.8Industrial 17 6.0 8.2 2.7 12.5 -1.0 9.5Technology 4 3.7 1.4 7.0 5.3 3.5 4.7Utilities 2 1.6 1.7 1.2 1.5 -0.3 0.2
20120
20
40
60
Bahrain, All firms1Y PD (LHS, bps) and # of firms (RHS)
20120
10
20
30
Bahrain 2017Q1 2017Q2 Q2-Q1# Median St.Dev. Median St.Dev. Median St.Dev.
Financials 10 29.0 58.0 36.9 54.0 1.1 13.4Basic Materials 1 5.8 – 5.6 – -0.2 –Communications 1 1.1 – 1.5 – 0.4 –Consumer Cyclical 2 0.5 0.7 0.4 0.5 -0.1 0.1Industrial 1 14.6 – 13.8 – -0.8 –

NUS RMI-CRI Quarterly Credit Report, Q2/2017 55
20120
5
10
15
20
25
30
Bangladesh, All firms1Y PD (LHS, bps) and # of firms (RHS)
20120
50
100
150
200
250
300Bangladesh 2017Q1 2017Q2 Q2-Q1
# Median St.Dev. Median St.Dev. Median St.Dev.Financials 97 18.6 30.8 19.5 32.3 0.1 15.7Basic Materials 15 4.5 18.1 4.4 19.6 -0.3 5.6Communications 7 1.7 11.6 1.3 6.7 -0.3 4.8Consumer Cyclical 59 11.1 50.0 9.7 36.4 -1.4 17.0Consumer Non-cyclical 40 8.8 34.5 6.1 19.8 -1.7 16.3Diversified 1 61.5 – 20.1 – -41.5 –Energy 5 9.2 5.1 8.2 6.3 -1.0 4.4Industrial 30 11.5 15.9 7.8 13.7 -0.7 11.1Technology 1 3.1 – 1.8 – -1.3 –Utilities 7 5.0 28.3 3.2 27.0 -0.0 1.9
1996 2004 20120
10
20
30
Belgium, All firms1Y PD (LHS, bps) and # of firms (RHS)
1996 2004 20120
50
100
150Belgium 2017Q1 2017Q2 Q2-Q1
# Median St.Dev. Median St.Dev. Median St.Dev.Financials 33 1.9 55.1 1.9 39.9 -0.0 17.8Basic Materials 8 3.1 13.2 2.9 14.8 -0.4 3.8Communications 6 2.6 10.5 2.1 31.6 0.2 21.7Consumer Cyclical 6 2.8 3.3 3.5 3.2 0.1 1.4Consumer Non-cyclical 26 3.8 10.2 2.8 9.2 -0.2 7.3Diversified 4 0.2 1.1 0.3 0.8 0.0 0.3Energy 2 31.8 19.3 19.9 20.3 -11.9 1.0Industrial 24 3.5 10.3 3.9 17.0 0.2 9.6Technology 4 1.4 1.8 1.4 1.4 -0.1 1.4Utilities 2 0.9 0.6 0.8 0.4 -0.1 0.2
20120
20
40
60
80
Bosnia and Herzegovina, All firms1Y PD (LHS, bps) and # of firms (RHS)
20120
20
40
60
80Bosnia and Herzegovina 2017Q1 2017Q2 Q2-Q1
# Median St.Dev. Median St.Dev. Median St.Dev.Financials 2 72.0 40.5 50.5 28.0 -21.5 12.5Basic Materials 4 23.8 2.1 20.4 9.6 -3.4 11.3Communications 2 5.0 4.2 3.2 3.7 -1.8 0.5Consumer Cyclical 1 69.2 – 75.5 – 6.2 –Consumer Non-cyclical 2 7.9 1.3 5.6 4.3 -2.3 5.5Energy 1 9.3 – 10.4 – 1.1 –Industrial 2 86.4 64.4 81.6 60.1 -4.8 4.3Utilities 4 58.6 53.8 59.5 26.9 3.5 40.2
1996 2004 20120
50
100
Brazil, All firms1Y PD (LHS, bps) and # of firms (RHS)
1996 2004 20120
200
400Brazil 2017Q1 2017Q2 Q2-Q1
# Median St.Dev. Median St.Dev. Median St.Dev.Financials 53 38.5 178.8 30.6 186.3 0.7 133.5Basic Materials 20 63.8 113.3 65.0 79.6 -1.5 68.1Communications 7 7.6 220.3 6.6 184.0 -0.3 44.1Consumer Cyclical 47 34.5 318.0 41.8 299.0 -0.0 83.7Consumer Non-cyclical 40 19.4 178.8 16.7 288.7 -1.0 153.0Diversified 7 30.6 78.0 45.4 138.3 3.2 65.7Energy 11 26.5 725.3 18.6 356.4 0.1 453.5Industrial 25 84.9 429.1 76.7 496.7 0.4 124.9Technology 5 3.5 67.0 4.9 73.0 1.4 8.7Utilities 27 21.6 63.5 23.5 72.4 1.0 24.5

NUS RMI-CRI Quarterly Credit Report, Q2/2017 56
2004 20120
50
100
150
Bulgaria, All firms1Y PD (LHS, bps) and # of firms (RHS)
2004 20120
50
100
150 Bulgaria 2017Q1 2017Q2 Q2-Q1# Median St.Dev. Median St.Dev. Median St.Dev.
Financials 10 13.4 19.4 9.0 6.0 -2.9 15.0Basic Materials 3 10.5 5.6 10.4 2.1 -0.6 4.3Communications 1 37.3 – 31.2 – -6.1 –Consumer Cyclical 1 6.8 – 5.4 – -1.4 –Consumer Non-cyclical 8 15.4 19.7 9.8 11.8 -2.1 11.4Diversified 9 15.9 12.8 13.7 9.7 -2.2 6.0Energy 2 18.2 0.6 53.7 57.2 35.5 57.8Industrial 12 3.3 16.9 3.5 8.3 -0.0 12.1Utilities 1 6.2 – 5.1 – -1.0 –
1996 2004 20120
50
100
Canada, All firms1Y PD (LHS, bps) and # of firms (RHS)
1996 2004 20120
1000
2000Canada 2017Q1 2017Q2 Q2-Q1
# Median St.Dev. Median St.Dev. Median St.Dev.Financials 141 2.4 194.4 2.3 213.5 0.0 81.7Basic Materials 246 18.2 161.7 17.3 199.6 0.0 172.8Communications 46 9.6 520.9 9.8 344.6 -0.0 448.6Consumer Cyclical 62 4.3 149.4 2.0 391.9 -0.2 257.2Consumer Non-cyclical 109 10.7 422.8 7.5 187.9 -0.0 287.2Diversified 4 52.5 86.7 88.3 116.5 22.0 36.4Energy 133 16.9 710.2 21.8 693.5 0.0 94.4Industrial 71 6.6 96.3 6.0 139.7 -0.1 92.8Technology 38 39.0 323.4 15.0 258.1 -1.1 210.3Utilities 15 5.9 26.2 1.3 51.0 0.0 42.4
1996 2004 20120
5
10
15
20
Chile, All firms1Y PD (LHS, bps) and # of firms (RHS)
1996 2004 20120
50
100
150
200Chile 2017Q1 2017Q2 Q2-Q1
# Median St.Dev. Median St.Dev. Median St.Dev.Financials 26 4.8 51.4 3.9 37.0 -0.7 17.1Basic Materials 14 2.4 36.2 2.9 28.2 -0.1 12.1Communications 3 10.4 26.6 12.5 2.3 2.1 28.9Consumer Cyclical 11 6.0 17.0 3.8 29.9 -0.4 15.1Consumer Non-cyclical 24 1.3 49.5 1.4 24.8 -0.1 25.2Diversified 5 9.0 6.2 3.1 6.2 -0.2 3.9Energy 2 33.7 16.9 19.6 15.5 -14.1 1.5Industrial 23 2.0 7.4 2.2 7.2 0.2 3.1Technology 1 1.4 – 0.9 – -0.5 –Utilities 12 2.9 42.5 1.4 31.1 -0.2 20.4
1996 2004 20120
100
200
300
400
China, All firms1Y PD (LHS, bps) and # of firms (RHS)
1996 2004 20120
1000
2000
3000
4000China 2017Q1 2017Q2 Q2-Q1
# Median St.Dev. Median St.Dev. Median St.Dev.Financials 277 36.9 73.7 31.7 91.2 -2.1 57.4Basic Materials 390 55.9 84.2 49.9 80.0 -3.1 43.1Communications 200 22.6 94.0 23.7 102.1 -0.5 40.3Consumer Cyclical 614 35.4 124.2 32.4 83.8 -1.4 81.7Consumer Non-cyclical 570 20.5 52.3 16.3 93.3 -1.0 62.7Diversified 33 76.2 64.2 57.8 91.4 -0.5 42.7Energy 113 49.2 78.6 49.0 60.9 -1.8 39.6Industrial 1022 44.5 94.0 43.6 97.1 -1.8 66.0Technology 221 24.8 56.3 23.7 49.2 -0.2 27.8Utilities 87 50.1 64.3 40.1 64.8 -5.4 26.4

NUS RMI-CRI Quarterly Credit Report, Q2/2017 57
1996 2004 20120
20
40
60
Colombia, All firms1Y PD (LHS, bps) and # of firms (RHS)
1996 2004 20120
20
40
60 Colombia 2017Q1 2017Q2 Q2-Q1# Median St.Dev. Median St.Dev. Median St.Dev.
Financials 9 33.3 32.2 23.7 23.3 -4.2 14.7Basic Materials 2 15.1 16.6 5.4 4.2 -9.7 12.4Communications 1 1.3 – 0.8 – -0.5 –Consumer Cyclical 2 82.1 66.5 81.1 68.6 -1.0 2.1Consumer Non-cyclical 1 0.2 – 0.1 – -0.2 –Diversified 2 61.0 47.7 51.2 38.4 -9.8 9.2Energy 3 18.6 8.2 12.8 2.3 -4.1 9.7Industrial 8 9.0 10.0 7.4 10.7 -0.4 4.2Utilities 3 11.7 6.3 9.6 5.5 -2.1 0.9
20120
50
100
Croatia, All firms1Y PD (LHS, bps) and # of firms (RHS)
20120
100
200Croatia 2017Q1 2017Q2 Q2-Q1
# Median St.Dev. Median St.Dev. Median St.Dev.Financials 10 20.0 57.3 26.2 65.7 3.1 23.6Basic Materials 2 67.5 32.4 73.6 38.5 6.1 6.1Communications 4 7.1 25.5 11.3 96.3 4.5 71.1Consumer Cyclical 28 10.3 40.7 7.4 51.2 -0.1 12.9Consumer Non-cyclical 23 20.5 38.8 46.9 92.3 9.3 66.7Diversified 1 42.0 – 42.0 – 0.0 –Energy 2 2.0 2.3 1.4 1.6 -0.6 0.7Industrial 15 24.3 56.8 22.1 54.7 4.1 17.2
2004 20120
50
100
150
Cyprus, All firms1Y PD (LHS, bps) and # of firms (RHS)
2004 20120
50
100
150
Cyprus 2017Q1 2017Q2 Q2-Q1# Median St.Dev. Median St.Dev. Median St.Dev.
Financials 13 38.9 55.2 30.3 93.8 0.0 97.2Basic Materials 3 26.3 5.3 28.4 5.3 4.7 8.9Consumer Cyclical 5 48.5 41.4 26.4 18.6 1.1 39.6Consumer Non-cyclical 6 30.8 148.1 23.9 26.8 -1.8 163.2Energy 3 29.7 84.4 116.4 586.2 100.7 502.9Industrial 5 9.3 79.5 7.0 100.4 -0.6 21.6Technology 2 43.3 54.5 54.9 72.3 11.6 17.8
1996 2004 20120
50
100
150
200
Czech Republic, All firms1Y PD (LHS, bps) and # of firms (RHS)
1996 2004 20120
20
40
60
80Czech Republic 2017Q1 2017Q2 Q2-Q1
# Median St.Dev. Median St.Dev. Median St.Dev.Financials 2 10.9 5.7 7.1 0.7 -3.8 4.9Communications 1 3.7 – 1.7 – -2.0 –Consumer Cyclical 2 3.6 2.6 0.9 0.2 -2.8 2.9Consumer Non-cyclical 2 2.5 0.2 1.4 0.8 -1.1 1.0Diversified 1 6.3 – 6.7 – 0.4 –Energy 2 6.3 5.3 3.8 4.3 -2.5 1.0Industrial 1 3.8 – 2.3 – -1.5 –Utilities 1 12.6 – 8.2 – -4.5 –

NUS RMI-CRI Quarterly Credit Report, Q2/2017 58
1996 2004 20120
50
100
Denmark, All firms1Y PD (LHS, bps) and # of firms (RHS)
1996 2004 20120
100
200Denmark 2017Q1 2017Q2 Q2-Q1
# Median St.Dev. Median St.Dev. Median St.Dev.Financials 41 22.1 35.4 21.6 32.6 0.0 36.1Basic Materials 1 1.7 – 1.8 – 0.1 –Communications 7 11.7 29.5 9.8 29.5 -0.2 3.1Consumer Cyclical 16 13.2 29.5 17.7 43.4 2.9 33.5Consumer Non-cyclical 32 6.6 19.1 5.2 16.1 -0.4 7.7Diversified 2 0.8 1.2 26.4 35.4 25.5 36.6Energy 2 16.5 15.6 13.3 11.0 -3.2 4.6Industrial 31 11.5 64.5 12.7 77.1 0.2 22.9Technology 10 19.0 64.7 13.4 31.5 -3.9 53.7Utilities 2 24.4 27.6 31.2 40.4 6.8 12.8
20120
20
40
60
Egypt, All firms1Y PD (LHS, bps) and # of firms (RHS)
20120
100
200
300Egypt 2017Q1 2017Q2 Q2-Q1
# Median St.Dev. Median St.Dev. Median St.Dev.Financials 68 45.0 61.2 33.3 46.1 -9.0 28.1Basic Materials 21 14.3 51.2 17.1 36.6 -0.8 20.7Communications 7 61.3 50.0 49.5 37.6 -0.1 38.8Consumer Cyclical 23 39.4 38.5 31.9 30.5 -9.9 17.5Consumer Non-cyclical 45 17.9 39.8 18.1 23.2 -3.8 20.1Diversified 1 1.6 – 1.8 – 0.2 –Energy 1 99.4 – 104.0 – 4.6 –Industrial 37 34.6 44.6 19.7 29.9 -5.3 24.1Technology 1 26.0 – 19.6 – -6.5 –Utilities 1 95.5 – 26.0 – -69.5 –
2004 20120
100
200
300
400
Estonia, All firms1Y PD (LHS, bps) and # of firms (RHS)
2004 20120
5
10
15
20
Estonia 2017Q1 2017Q2 Q2-Q1# Median St.Dev. Median St.Dev. Median St.Dev.
Financials 3 24.4 16.0 18.5 18.2 0.1 5.8Communications 1 2.2 – 2.0 – -0.2 –Consumer Cyclical 5 2.1 14.8 1.3 16.5 0.7 2.5Consumer Non-cyclical 1 4.5 – 2.6 – -1.9 –Industrial 4 1.4 3.4 1.9 4.0 0.5 0.8Utilities 1 0.2 – 0.4 – 0.2 –
1996 2004 20120
10
20
30
40
50
60
70
80
Finland, All firms1Y PD (LHS, bps) and # of firms (RHS)
1996 2004 20120
20
40
60
80
100
120
140
160 Finland 2017Q1 2017Q2 Q2-Q1# Median St.Dev. Median St.Dev. Median St.Dev.
Financials 20 5.0 6.0 5.5 6.4 -0.2 4.5Basic Materials 7 3.7 1.8 3.0 4.6 -0.3 3.4Communications 14 2.7 11.4 3.1 25.1 -0.1 15.7Consumer Cyclical 13 3.4 4.9 4.1 4.5 -0.5 3.5Consumer Non-cyclical 24 4.1 84.5 2.4 55.6 -0.4 29.0Energy 2 32.2 42.1 15.4 18.2 -16.7 23.9Industrial 36 4.7 24.5 3.7 17.2 -0.4 12.9Technology 15 3.5 17.9 3.5 6.2 -0.5 15.5Utilities 1 2.1 – 1.7 – -0.4 –
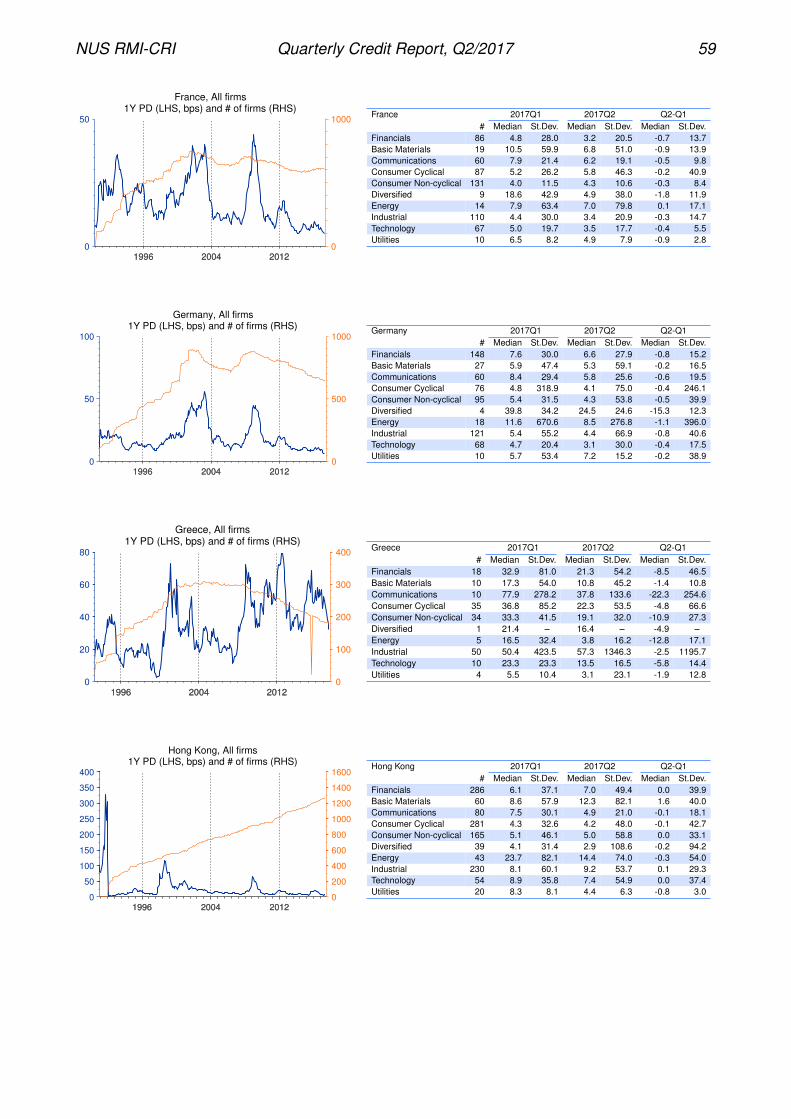
NUS RMI-CRI Quarterly Credit Report, Q2/2017 59
1996 2004 20120
50
France, All firms1Y PD (LHS, bps) and # of firms (RHS)
1996 2004 20120
1000France 2017Q1 2017Q2 Q2-Q1
# Median St.Dev. Median St.Dev. Median St.Dev.Financials 86 4.8 28.0 3.2 20.5 -0.7 13.7Basic Materials 19 10.5 59.9 6.8 51.0 -0.9 13.9Communications 60 7.9 21.4 6.2 19.1 -0.5 9.8Consumer Cyclical 87 5.2 26.2 5.8 46.3 -0.2 40.9Consumer Non-cyclical 131 4.0 11.5 4.3 10.6 -0.3 8.4Diversified 9 18.6 42.9 4.9 38.0 -1.8 11.9Energy 14 7.9 63.4 7.0 79.8 0.1 17.1Industrial 110 4.4 30.0 3.4 20.9 -0.3 14.7Technology 67 5.0 19.7 3.5 17.7 -0.4 5.5Utilities 10 6.5 8.2 4.9 7.9 -0.9 2.8
1996 2004 20120
50
100
Germany, All firms1Y PD (LHS, bps) and # of firms (RHS)
1996 2004 20120
500
1000Germany 2017Q1 2017Q2 Q2-Q1
# Median St.Dev. Median St.Dev. Median St.Dev.Financials 148 7.6 30.0 6.6 27.9 -0.8 15.2Basic Materials 27 5.9 47.4 5.3 59.1 -0.2 16.5Communications 60 8.4 29.4 5.8 25.6 -0.6 19.5Consumer Cyclical 76 4.8 318.9 4.1 75.0 -0.4 246.1Consumer Non-cyclical 95 5.4 31.5 4.3 53.8 -0.5 39.9Diversified 4 39.8 34.2 24.5 24.6 -15.3 12.3Energy 18 11.6 670.6 8.5 276.8 -1.1 396.0Industrial 121 5.4 55.2 4.4 66.9 -0.8 40.6Technology 68 4.7 20.4 3.1 30.0 -0.4 17.5Utilities 10 5.7 53.4 7.2 15.2 -0.2 38.9
1996 2004 20120
20
40
60
80
Greece, All firms1Y PD (LHS, bps) and # of firms (RHS)
1996 2004 20120
100
200
300
400Greece 2017Q1 2017Q2 Q2-Q1
# Median St.Dev. Median St.Dev. Median St.Dev.Financials 18 32.9 81.0 21.3 54.2 -8.5 46.5Basic Materials 10 17.3 54.0 10.8 45.2 -1.4 10.8Communications 10 77.9 278.2 37.8 133.6 -22.3 254.6Consumer Cyclical 35 36.8 85.2 22.3 53.5 -4.8 66.6Consumer Non-cyclical 34 33.3 41.5 19.1 32.0 -10.9 27.3Diversified 1 21.4 – 16.4 – -4.9 –Energy 5 16.5 32.4 3.8 16.2 -12.8 17.1Industrial 50 50.4 423.5 57.3 1346.3 -2.5 1195.7Technology 10 23.3 23.3 13.5 16.5 -5.8 14.4Utilities 4 5.5 10.4 3.1 23.1 -1.9 12.8
1996 2004 20120
50
100
150
200
250
300
350
400
Hong Kong, All firms1Y PD (LHS, bps) and # of firms (RHS)
1996 2004 20120
200
400
600
800
1000
1200
1400
1600Hong Kong 2017Q1 2017Q2 Q2-Q1
# Median St.Dev. Median St.Dev. Median St.Dev.Financials 286 6.1 37.1 7.0 49.4 0.0 39.9Basic Materials 60 8.6 57.9 12.3 82.1 1.6 40.0Communications 80 7.5 30.1 4.9 21.0 -0.1 18.1Consumer Cyclical 281 4.3 32.6 4.2 48.0 -0.1 42.7Consumer Non-cyclical 165 5.1 46.1 5.0 58.8 0.0 33.1Diversified 39 4.1 31.4 2.9 108.6 -0.2 94.2Energy 43 23.7 82.1 14.4 74.0 -0.3 54.0Industrial 230 8.1 60.1 9.2 53.7 0.1 29.3Technology 54 8.9 35.8 7.4 54.9 0.0 37.4Utilities 20 8.3 8.1 4.4 6.3 -0.8 3.0

NUS RMI-CRI Quarterly Credit Report, Q2/2017 60
2004 20120
50
100
150
Hungary, All firms1Y PD (LHS, bps) and # of firms (RHS)
2004 20120
20
40
60 Hungary 2017Q1 2017Q2 Q2-Q1# Median St.Dev. Median St.Dev. Median St.Dev.
Financials 8 14.7 32.5 7.1 23.3 -4.7 19.1Communications 3 76.5 142.7 45.3 208.1 -3.2 70.0Consumer Cyclical 2 27.8 31.9 14.0 16.6 -13.8 15.2Consumer Non-cyclical 7 29.3 18.9 10.2 36.5 -6.4 31.5Diversified 2 29.0 20.7 13.8 11.5 -15.2 9.2Energy 3 9.5 16.5 10.3 7.5 -2.4 9.9Industrial 1 24.0 – 10.7 – -13.3 –Technology 2 22.5 18.4 13.7 10.8 -8.8 7.6Utilities 3 1.3 4.1 0.9 5.3 -0.4 1.1
2004 20120
200
400
600
Iceland, All firms1Y PD (LHS, bps) and # of firms (RHS)
2004 20120
20
40
60
Iceland 2017Q1 2017Q2 Q2-Q1# Median St.Dev. Median St.Dev. Median St.Dev.
Financials 5 3.3 3.5 4.6 0.4 1.3 3.6Communications 2 3.1 0.7 2.1 0.6 -1.0 0.1Consumer Cyclical 2 26.6 35.6 18.4 23.0 -8.3 12.7Consumer Non-cyclical 3 6.8 2.8 3.4 1.8 -3.4 1.2Energy 1 10.6 – 11.1 – 0.5 –Industrial 2 5.9 7.0 1.6 0.8 -4.3 6.2Technology 1 3.3 – 3.6 – 0.3 –
1996 2004 20120
50
100
150
200
India, All firms1Y PD (LHS, bps) and # of firms (RHS)
1996 2004 20120
1000
2000
3000
4000India 2017Q1 2017Q2 Q2-Q1
# Median St.Dev. Median St.Dev. Median St.Dev.Financials 227 26.8 134.2 25.5 168.3 0.5 49.5Basic Materials 239 14.5 56.9 15.3 95.5 0.6 53.7Communications 78 13.7 53.7 14.1 67.2 -0.0 35.1Consumer Cyclical 377 13.0 77.2 14.0 150.5 0.1 106.3Consumer Non-cyclical 316 7.8 58.8 9.7 69.8 0.4 26.2Diversified 21 13.4 114.9 15.2 103.0 0.0 112.1Energy 38 20.8 85.3 29.9 94.4 0.7 32.0Industrial 425 14.1 84.7 14.4 208.1 0.3 142.9Technology 100 6.9 82.0 8.6 110.6 0.3 33.0Utilities 33 26.5 171.6 56.4 248.9 16.7 141.1
1996 2004 20120
200
400
600
Indonesia, All firms1Y PD (LHS, bps) and # of firms (RHS)
1996 2004 20120
200
400
600Indonesia 2017Q1 2017Q2 Q2-Q1
# Median St.Dev. Median St.Dev. Median St.Dev.Financials 131 29.7 39.7 25.7 46.7 -0.6 28.9Basic Materials 47 16.1 51.4 21.6 56.7 1.8 16.7Communications 29 21.1 75.0 19.5 60.4 -0.4 42.9Consumer Cyclical 70 13.2 31.3 15.2 33.3 0.0 15.2Consumer Non-cyclical 78 14.9 54.7 9.8 94.6 0.0 63.8Diversified 2 48.2 34.0 35.5 46.5 -12.6 12.5Energy 34 8.1 78.7 8.9 85.2 0.3 36.7Industrial 79 15.3 49.5 20.3 66.0 0.9 44.1Technology 7 2.8 27.5 3.1 53.8 0.3 26.7Utilities 3 6.6 19.9 14.7 18.3 4.8 7.1

NUS RMI-CRI Quarterly Credit Report, Q2/2017 61
1996 2004 20120
50
100
Ireland, All firms1Y PD (LHS, bps) and # of firms (RHS)
1996 2004 20120
50
100Ireland 2017Q1 2017Q2 Q2-Q1
# Median St.Dev. Median St.Dev. Median St.Dev.Financials 9 7.0 18.3 5.8 18.0 -0.3 1.0Basic Materials 11 30.5 49.5 17.4 26.5 -21.3 33.0Communications 4 38.2 72.1 26.3 333.7 -0.8 268.4Consumer Cyclical 7 6.4 5.2 4.4 32.4 -1.5 35.3Consumer Non-cyclical 26 4.8 269.6 4.3 84.6 -0.4 206.7Energy 8 52.7 33.5 39.8 52.4 4.4 33.3Industrial 6 3.0 9.5 2.9 9.4 -0.1 0.3Technology 1 0.0 – 0.0 – 0.0 –
1996 2004 20120
20
40
60
80
Israel, All firms1Y PD (LHS, bps) and # of firms (RHS)
1996 2004 20120
200
400
600
800 Israel 2017Q1 2017Q2 Q2-Q1# Median St.Dev. Median St.Dev. Median St.Dev.
Financials 119 9.7 74.6 9.5 57.9 0.5 63.0Basic Materials 14 7.0 35.4 6.7 26.0 0.4 13.7Communications 34 8.8 98.7 8.4 110.0 -0.5 13.9Consumer Cyclical 50 6.1 27.9 8.1 18.4 0.4 18.8Consumer Non-cyclical 98 7.6 43.0 7.4 58.5 0.1 39.5Diversified 9 7.1 9.3 8.3 5.8 -0.6 4.3Energy 30 5.7 27.5 5.3 27.2 -0.2 14.1Industrial 80 5.8 38.3 5.9 37.0 0.1 20.6Technology 35 3.0 36.3 4.4 42.7 0.0 29.9
1996 2004 20120
20
40
60
80
100
Italy, All firms1Y PD (LHS, bps) and # of firms (RHS)
1996 2004 201250
100
150
200
250
300Italy 2017Q1 2017Q2 Q2-Q1
# Median St.Dev. Median St.Dev. Median St.Dev.Financials 59 15.7 61.9 15.7 56.8 -2.6 19.4Basic Materials 4 7.0 5.0 3.8 4.3 -2.7 1.5Communications 36 12.6 15.2 10.9 14.5 -0.2 12.8Consumer Cyclical 48 5.8 11.6 6.0 7.6 -0.8 8.6Consumer Non-cyclical 38 5.6 22.0 4.3 12.7 -1.0 15.1Diversified 3 4.9 3.4 9.3 5.5 2.7 2.3Energy 18 8.8 22.4 8.5 18.5 0.2 8.6Industrial 50 4.9 23.8 5.6 23.9 0.0 4.6Technology 16 9.2 7.2 8.8 6.7 -0.3 6.1Utilities 12 5.2 22.5 4.0 36.5 -0.2 14.1
20125
10
15
20
25
30
Jamaica, All firms1Y PD (LHS, bps) and # of firms (RHS)
20120
10
20
30
40
50Jamaica 2017Q1 2017Q2 Q2-Q1
# Median St.Dev. Median St.Dev. Median St.Dev.Financials 14 11.0 24.8 17.3 41.6 -0.0 28.3Basic Materials 2 35.1 45.7 36.8 49.3 1.7 3.6Communications 3 120.3 86.1 114.3 68.6 -5.4 20.2Consumer Cyclical 6 5.1 7.3 4.7 19.4 0.1 14.1Consumer Non-cyclical 13 12.5 20.6 17.5 24.0 0.4 15.6Diversified 3 35.3 19.5 42.6 25.3 4.4 7.8Industrial 4 7.9 29.3 10.5 64.4 3.2 35.5Technology 1 0.3 – 0.2 – -0.1 –

NUS RMI-CRI Quarterly Credit Report, Q2/2017 62
1996 2004 20120
50
Japan, All firms1Y PD (LHS, bps) and # of firms (RHS)
1996 2004 20120
5000Japan 2017Q1 2017Q2 Q2-Q1
# Median St.Dev. Median St.Dev. Median St.Dev.Financials 346 7.7 24.2 6.4 26.6 -0.2 12.3Basic Materials 235 1.8 4.7 1.8 5.2 -0.1 2.6Communications 273 1.1 7.2 1.0 7.4 -0.0 3.0Consumer Cyclical 856 1.7 25.2 1.4 65.0 -0.1 53.3Consumer Non-cyclical 624 0.7 5.0 0.5 4.7 -0.1 2.7Diversified 2 16.2 11.9 20.1 13.7 3.9 1.8Energy 17 3.9 10.6 4.1 12.5 0.3 4.9Industrial 961 1.9 9.1 1.8 9.7 -0.0 4.4Technology 303 1.1 19.2 1.0 19.4 -0.1 3.8Utilities 21 5.0 17.3 4.0 16.6 -1.0 2.7
2004 20120
20
40
Jordan, All firms1Y PD (LHS, bps) and # of firms (RHS)
2004 20120
200
400Jordan 2017Q1 2017Q2 Q2-Q1
# Median St.Dev. Median St.Dev. Median St.Dev.Financials 91 7.0 30.3 6.8 19.9 0.1 15.7Basic Materials 16 13.0 34.9 13.5 37.2 -0.0 9.0Communications 2 40.5 27.7 41.6 19.3 1.1 8.4Consumer Cyclical 14 12.4 62.8 8.2 52.7 0.0 17.7Consumer Non-cyclical 27 6.9 33.4 9.1 61.6 0.6 31.2Diversified 2 22.9 32.1 24.3 33.9 1.4 1.8Energy 2 5.0 7.0 6.8 9.6 1.8 2.6Industrial 21 18.8 106.9 14.9 65.0 0.6 44.9Technology 1 15.1 – 144.7 – 129.6 –Utilities 2 33.5 18.8 35.3 31.2 1.8 12.4
20120
100
200
300
400
Kazakhstan, All firms1Y PD (LHS, bps) and # of firms (RHS)
20120
5
10
15
20
Kazakhstan 2017Q1 2017Q2 Q2-Q1# Median St.Dev. Median St.Dev. Median St.Dev.
Financials 3 108.9 86.6 156.5 635.9 47.7 561.0Basic Materials 1 5.7 – 1.7 – -4.0 –Communications 1 1.9 – 1.9 – 0.1 –Energy 2 1.5 1.9 1.2 1.5 -0.3 0.4Utilities 1 6.6 – 1.3 – -5.3 –
2004 20120
20
40
60
80
Kuwait, All firms1Y PD (LHS, bps) and # of firms (RHS)
2004 20120
50
100
150
200 Kuwait 2017Q1 2017Q2 Q2-Q1# Median St.Dev. Median St.Dev. Median St.Dev.
Financials 87 20.4 69.7 21.2 66.2 1.0 25.1Basic Materials 4 3.3 16.3 3.1 15.3 -0.2 1.3Communications 6 3.9 71.0 8.2 19.6 1.7 55.5Consumer Cyclical 12 18.1 28.4 18.6 45.0 0.3 23.3Consumer Non-cyclical 10 2.6 15.8 4.5 30.8 1.3 15.8Diversified 5 13.6 13.6 12.6 21.9 0.1 10.5Energy 7 43.8 93.6 55.9 70.4 2.6 38.7Industrial 21 18.6 19.8 24.7 21.9 4.2 7.7Technology 1 0.3 – 0.7 – 0.4 –

NUS RMI-CRI Quarterly Credit Report, Q2/2017 63
2004 20120
100
200
Latvia, All firms1Y PD (LHS, bps) and # of firms (RHS)
2004 201210
20
30
Latvia 2017Q1 2017Q2 Q2-Q1# Median St.Dev. Median St.Dev. Median St.Dev.
Communications 1 1.1 – 0.5 – -0.6 –Consumer Cyclical 2 64.7 58.0 62.7 19.1 -2.0 38.9Consumer Non-cyclical 3 6.6 3.5 3.7 2.3 -1.9 1.3Industrial 3 37.7 18.3 17.8 19.6 -2.1 14.0Utilities 1 6.2 – 6.1 – -0.1 –
2004 20120
50
100
150
200
Lithuania, All firms1Y PD (LHS, bps) and # of firms (RHS)
2004 20120
10
20
30
40Lithuania 2017Q1 2017Q2 Q2-Q1
# Median St.Dev. Median St.Dev. Median St.Dev.Financials 6 2.4 20.0 2.5 12.3 -0.2 8.4Basic Materials 1 2.7 – 2.1 – -0.6 –Communications 1 13.1 – 0.2 – -12.9 –Consumer Cyclical 5 12.8 27.0 9.5 23.7 -0.1 11.9Consumer Non-cyclical 8 24.2 25.3 6.2 45.7 -1.3 31.2Energy 1 2.3 – 1.5 – -0.9 –Industrial 2 46.4 2.0 43.6 3.3 -2.8 1.3Utilities 4 9.4 12.2 8.4 8.6 -0.9 4.5
1996 2004 20120
1000
Luxembourg, All firms1Y PD (LHS, bps) and # of firms (RHS)
1996 2004 20120
50 Luxembourg 2017Q1 2017Q2 Q2-Q1# Median St.Dev. Median St.Dev. Median St.Dev.
Financials 9 8.4 137.5 2.8 71.8 0.0 78.0Basic Materials 5 8.1 11.7 6.5 6.0 -0.4 12.1Communications 4 11.4 116.1 13.5 272.8 2.6 156.7Consumer Cyclical 2 16.3 18.2 30.0 37.7 13.7 19.5Consumer Non-cyclical 4 2.6 20.2 0.8 5.5 -1.7 14.7Industrial 6 13.5 44.8 13.0 50.7 0.7 10.6Technology 3 1.0 1.0 0.8 1.1 -0.1 0.1Utilities 1 22.4 – 18.7 – -3.7 –
20120
20
40
60
80
100
120
140
160
Macedonia, All firms1Y PD (LHS, bps) and # of firms (RHS)
20120
5
10
15
20
25
30
35
40
Macedonia 2017Q1 2017Q2 Q2-Q1# Median St.Dev. Median St.Dev. Median St.Dev.
Financials 6 12.6 47.7 15.3 32.5 -0.7 15.8Basic Materials 3 11.2 11.3 11.7 4.8 -4.6 11.3Communications 1 2.0 – 0.9 – -1.1 –Consumer Cyclical 2 6.6 9.3 4.4 6.2 -2.2 3.1Consumer Non-cyclical 4 1.2 2.6 0.2 1.4 -1.0 1.4Energy 1 71.5 – 23.3 – -48.2 –Industrial 2 21.5 22.7 5.0 1.4 -16.4 21.3

NUS RMI-CRI Quarterly Credit Report, Q2/2017 64
1996 2004 20120
50
100
Malaysia, All firms1Y PD (LHS, bps) and # of firms (RHS)
1996 2004 20120
1000
2000Malaysia 2017Q1 2017Q2 Q2-Q1
# Median St.Dev. Median St.Dev. Median St.Dev.Financials 128 11.3 67.2 11.3 79.8 0.0 29.4Basic Materials 67 14.8 81.0 12.9 102.2 -0.3 40.9Communications 37 8.6 39.5 7.8 60.6 0.0 32.4Consumer Cyclical 119 10.8 40.8 10.3 35.6 -0.1 17.2Consumer Non-cyclical 149 3.6 183.6 3.1 168.9 0.0 27.3Diversified 24 8.6 91.2 9.3 76.6 -0.0 30.6Energy 33 36.8 165.0 30.0 380.8 0.1 223.0Industrial 274 10.7 74.9 10.8 69.4 -0.1 35.9Technology 63 19.0 55.0 15.1 59.5 0.1 39.7Utilities 6 7.0 27.0 6.9 15.5 -0.3 15.0
2004 20120
50
100
Malta, All firms1Y PD (LHS, bps) and # of firms (RHS)
2004 20120
20
40
Malta 2017Q1 2017Q2 Q2-Q1# Median St.Dev. Median St.Dev. Median St.Dev.
1996 2004 20120
50
100
Mexico, All firms1Y PD (LHS, bps) and # of firms (RHS)
1996 2004 20120
100
200Mexico 2017Q1 2017Q2 Q2-Q1
# Median St.Dev. Median St.Dev. Median St.Dev.Financials 30 5.7 24.8 6.6 27.2 -0.1 14.0Basic Materials 11 5.4 11.5 9.5 19.0 1.2 15.0Communications 6 28.9 65.3 6.8 52.4 -6.2 39.4Consumer Cyclical 24 5.0 55.4 4.4 33.1 -0.1 25.3Consumer Non-cyclical 15 2.4 8.0 0.8 6.8 -0.1 3.6Diversified 5 5.0 8.1 7.6 7.4 0.2 2.1Industrial 18 7.0 471.9 5.9 269.5 -0.0 360.2Utilities 2 8.4 10.3 9.8 12.9 1.5 2.6
2004 20120
20
40
Morocco, All firms1Y PD (LHS, bps) and # of firms (RHS)
2004 20120
50
100Morocco 2017Q1 2017Q2 Q2-Q1
# Median St.Dev. Median St.Dev. Median St.Dev.Financials 19 15.8 17.0 25.8 53.8 3.2 53.2Basic Materials 9 17.6 21.6 13.8 25.4 -0.4 6.9Communications 1 0.2 – 0.1 – -0.1 –Consumer Cyclical 7 14.9 39.3 24.1 24.0 -0.9 17.3Consumer Non-cyclical 7 4.9 5.9 3.3 6.0 -0.2 1.5Diversified 1 31.6 – 18.8 – -12.8 –Energy 1 1.5 – 1.3 – -0.3 –Industrial 10 45.4 48.3 42.2 65.4 -0.2 20.9Technology 4 11.2 6.7 7.1 7.1 -1.9 2.1Utilities 3 4.6 16.8 4.6 18.8 -0.0 2.0

NUS RMI-CRI Quarterly Credit Report, Q2/2017 65
20120
20
40
60
80
Montenegro, All firms1Y PD (LHS, bps) and # of firms (RHS)
20120
10
20
30
40
Montenegro 2017Q1 2017Q2 Q2-Q1# Median St.Dev. Median St.Dev. Median St.Dev.
Communications 1 7.6 – 14.2 – 6.6 –Consumer Cyclical 3 11.8 15.4 16.9 17.3 1.2 20.6Consumer Non-cyclical 5 23.8 6.7 21.2 7.2 -1.9 6.7Energy 1 31.4 – 19.5 – -11.9 –Utilities 2 12.7 10.5 13.2 0.2 0.5 10.6
1996 2004 20120
50
100
Netherlands, All firms1Y PD (LHS, bps) and # of firms (RHS)
1996 2004 20120
100
200Netherlands 2017Q1 2017Q2 Q2-Q1
# Median St.Dev. Median St.Dev. Median St.Dev.Financials 21 9.9 61.7 6.8 44.1 -0.2 29.6Basic Materials 6 1.4 43.5 1.6 31.8 -0.1 11.7Communications 10 7.9 58.8 7.0 75.0 -0.6 17.0Consumer Cyclical 12 2.1 213.0 4.9 74.3 0.3 139.9Consumer Non-cyclical 33 4.8 21.4 6.3 23.6 -0.2 11.7Energy 8 9.8 17.4 7.9 19.4 0.3 3.9Industrial 20 6.6 14.4 6.5 103.9 -0.1 93.6Technology 14 2.9 13.6 3.2 13.3 -0.1 9.7
1996 2004 20120
20
40
60
New Zealand, All firms1Y PD (LHS, bps) and # of firms (RHS)
1996 2004 20120
50
100
150 New Zealand 2017Q1 2017Q2 Q2-Q1# Median St.Dev. Median St.Dev. Median St.Dev.
Financials 20 0.1 63.3 0.2 64.7 0.0 26.8Basic Materials 1 26.7 – 11.0 – -15.7 –Communications 8 8.8 12.9 5.7 56.2 -0.1 44.4Consumer Cyclical 15 1.4 13.3 1.7 30.7 0.0 18.6Consumer Non-cyclical 34 0.7 470.4 1.0 578.8 0.0 108.6Energy 4 8.0 6.2 8.9 10.2 -1.6 13.8Industrial 18 2.4 38.2 3.6 175.8 0.5 139.9Technology 12 3.8 20.7 7.4 18.1 0.7 14.8Utilities 6 0.3 0.8 0.3 0.4 -0.1 0.3
20120
20
40
60
80
Nigeria, All firms1Y PD (LHS, bps) and # of firms (RHS)
20120
50
100
150
200Nigeria 2017Q1 2017Q2 Q2-Q1
# Median St.Dev. Median St.Dev. Median St.Dev.Financials 49 26.4 74.8 27.8 62.0 1.7 34.8Basic Materials 9 23.7 30.5 32.9 36.5 2.2 16.4Communications 5 16.8 15.0 30.1 17.3 3.9 11.7Consumer Cyclical 13 38.1 70.4 46.0 73.4 0.6 32.8Consumer Non-cyclical 31 14.9 50.3 14.3 55.0 0.0 31.3Energy 9 20.4 67.1 56.3 63.3 5.9 21.0Industrial 19 36.3 141.0 27.3 101.5 1.4 96.9Technology 3 26.1 33.3 39.1 7.4 1.5 31.3

NUS RMI-CRI Quarterly Credit Report, Q2/2017 66
1996 2004 20120
50
100
150
Norway, All firms1Y PD (LHS, bps) and # of firms (RHS)
1996 2004 20120
100
200
300Norway 2017Q1 2017Q2 Q2-Q1
# Median St.Dev. Median St.Dev. Median St.Dev.Financials 40 21.0 39.0 24.8 31.7 0.3 21.8Basic Materials 5 5.3 61.4 6.6 24.3 1.3 37.5Communications 7 14.1 40.3 13.9 32.5 -0.3 10.6Consumer Cyclical 7 7.5 41.8 6.9 62.3 0.5 25.7Consumer Non-cyclical 22 13.0 39.5 11.8 35.3 -0.9 9.7Diversified 1 18.4 – 9.0 – -9.4 –Energy 28 46.4 45.5 49.9 72.5 12.3 49.5Industrial 47 24.2 46.1 28.2 64.5 -0.5 39.0Technology 9 14.6 86.2 25.5 33.4 1.3 84.2Utilities 2 5.4 4.0 8.1 8.2 2.7 4.1
20120
10
20
Oman, All firms1Y PD (LHS, bps) and # of firms (RHS)
201240
60
80 Oman 2017Q1 2017Q2 Q2-Q1# Median St.Dev. Median St.Dev. Median St.Dev.
Financials 24 19.6 19.4 17.5 23.2 -0.0 7.7Basic Materials 3 9.8 17.4 10.9 10.7 -0.1 7.5Communications 2 1.2 1.7 1.8 2.3 0.5 0.6Consumer Cyclical 1 14.0 – 20.5 – 6.5 –Consumer Non-cyclical 7 1.8 6.6 3.7 6.4 0.3 1.2Diversified 1 0.0 – 0.0 – 0.0 –Energy 5 3.3 119.1 3.4 115.5 0.0 3.7Industrial 11 0.8 24.9 0.9 23.8 -0.0 1.3Utilities 9 2.0 10.8 3.7 13.9 0.2 4.7
20120
100
200
Pakistan, All firms1Y PD (LHS, bps) and # of firms (RHS)
20120
200
400 Pakistan 2017Q1 2017Q2 Q2-Q1# Median St.Dev. Median St.Dev. Median St.Dev.
Financials 34 32.7 55.3 53.7 78.9 2.5 49.1Basic Materials 22 3.9 40.0 9.4 74.9 1.4 37.1Communications 5 37.9 83.8 58.3 69.4 0.1 42.4Consumer Cyclical 31 9.8 75.1 12.2 88.5 1.6 17.1Consumer Non-cyclical 26 1.1 13.7 1.5 17.1 0.4 5.2Energy 10 2.5 13.6 3.7 15.0 1.5 4.4Industrial 28 1.6 12.8 1.8 17.1 0.1 6.2Technology 1 3.9 – 8.4 – 4.5 –Utilities 8 13.9 15.4 16.4 10.9 1.7 7.4
1996 2004 20120
50
100
Peru, All firms1Y PD (LHS, bps) and # of firms (RHS)
1996 2004 20120
50
100 Peru 2017Q1 2017Q2 Q2-Q1# Median St.Dev. Median St.Dev. Median St.Dev.
Financials 8 9.7 5.9 9.3 6.5 -1.0 3.7Basic Materials 13 10.2 12.9 6.8 9.8 -0.3 7.1Communications 1 28.5 – 37.2 – 8.7 –Consumer Cyclical 1 2.6 – 1.0 – -1.6 –Consumer Non-cyclical 8 27.5 30.0 15.1 45.6 -2.6 30.1Diversified 1 199.6 – 165.6 – -34.0 –Energy 2 71.7 99.1 67.9 94.4 -3.8 4.7Industrial 2 20.0 8.8 13.9 5.0 -6.1 3.8Utilities 4 2.3 6.6 1.3 3.7 -1.0 2.9

NUS RMI-CRI Quarterly Credit Report, Q2/2017 67
1996 2004 20120
50
100
150
Philippines, All firms1Y PD (LHS, bps) and # of firms (RHS)
1996 2004 20120
100
200
300Philippines 2017Q1 2017Q2 Q2-Q1
# Median St.Dev. Median St.Dev. Median St.Dev.Financials 79 10.4 26.8 10.1 21.9 -0.6 12.4Basic Materials 26 8.3 46.9 5.6 30.2 -2.0 18.6Communications 16 7.3 17.4 5.6 13.0 -0.1 7.2Consumer Cyclical 29 5.7 20.2 5.5 14.2 -0.0 13.6Consumer Non-cyclical 33 4.7 33.6 4.5 21.9 -1.0 17.0Diversified 16 1.3 31.5 1.7 16.0 -0.2 19.6Energy 12 5.3 21.0 4.7 14.3 -0.7 12.9Industrial 13 5.5 27.6 3.1 16.0 -1.5 12.7Technology 3 2.7 1.5 4.6 0.5 2.1 2.1Utilities 14 2.8 8.1 3.2 6.7 -0.0 3.7
1996 2004 20120
50
100
150
200
Poland, All firms1Y PD (LHS, bps) and # of firms (RHS)
1996 2004 20120
200
400
600
800 Poland 2017Q1 2017Q2 Q2-Q1# Median St.Dev. Median St.Dev. Median St.Dev.
Financials 86 29.2 361.0 22.2 120.4 -4.5 252.0Basic Materials 26 11.6 26.8 9.8 20.4 -1.1 8.9Communications 33 33.7 255.2 16.7 227.5 -5.0 81.5Consumer Cyclical 56 17.4 48.0 13.6 157.3 -2.1 129.6Consumer Non-cyclical 61 26.7 122.0 19.0 94.8 -5.5 51.4Energy 15 50.4 271.6 43.1 267.4 -1.4 144.2Industrial 121 25.2 127.8 18.3 86.1 -3.2 60.4Technology 41 20.2 71.8 18.9 74.7 -0.5 49.1Utilities 9 27.4 20.0 16.9 16.7 -9.3 15.7
1996 2004 20120
50
100
Portugal, All firms1Y PD (LHS, bps) and # of firms (RHS)
1996 2004 20120
50
100Portugal 2017Q1 2017Q2 Q2-Q1
# Median St.Dev. Median St.Dev. Median St.Dev.Financials 3 26.1 53.7 27.0 32.8 -3.0 21.7Basic Materials 6 4.1 22.3 5.3 15.1 -0.6 7.4Communications 6 12.2 42.6 5.2 7.0 -4.9 36.6Consumer Cyclical 7 27.8 41.6 17.1 27.6 -3.8 41.6Consumer Non-cyclical 6 18.4 43.6 10.1 49.2 -3.4 12.9Diversified 2 31.4 41.0 7.0 6.1 -24.4 34.9Energy 1 1.9 – 1.9 – 0.0 –Industrial 7 30.2 48.8 27.0 34.4 -12.2 18.2Technology 3 57.7 34.1 24.1 74.1 0.1 56.4Utilities 2 5.0 4.3 6.2 4.2 1.2 0.2
2004 20120
100
200
Romania, All firms1Y PD (LHS, bps) and # of firms (RHS)
2004 20120
50
100Romania 2017Q1 2017Q2 Q2-Q1
# Median St.Dev. Median St.Dev. Median St.Dev.Financials 9 13.5 47.3 14.9 35.9 -1.5 13.0Basic Materials 9 45.1 60.9 37.3 21.6 -15.5 42.8Communications 1 14.1 – 14.3 – 0.1 –Consumer Cyclical 12 18.2 34.6 18.5 29.4 -1.5 11.4Consumer Non-cyclical 11 14.2 73.6 18.0 84.3 -1.1 24.9Energy 8 7.7 82.3 15.3 74.1 -0.1 20.9Industrial 25 34.2 50.9 26.8 50.1 -5.4 31.3Utilities 4 2.0 1.6 2.4 2.2 0.7 0.8

NUS RMI-CRI Quarterly Credit Report, Q2/2017 68
2004 20120
100
200
300
400
500
Russia, All firms1Y PD (LHS, bps) and # of firms (RHS)
2004 20120
50
100
150
200
250Russia 2017Q1 2017Q2 Q2-Q1
# Median St.Dev. Median St.Dev. Median St.Dev.Financials 21 55.8 31.2 60.3 43.1 8.3 32.1Basic Materials 32 17.3 28.5 23.8 41.9 3.1 20.2Communications 12 20.3 46.5 26.7 67.7 5.3 72.0Consumer Cyclical 17 40.1 318.6 50.4 368.9 10.4 51.9Consumer Non-cyclical 25 21.3 74.1 27.5 125.3 5.0 56.9Diversified 2 82.8 69.2 107.2 86.3 24.4 17.1Energy 20 23.9 50.3 26.7 42.6 5.7 14.5Industrial 20 32.9 391.6 42.0 605.1 9.3 216.9Technology 3 42.4 12.3 69.1 23.8 26.7 11.8Utilities 55 54.4 125.1 77.3 139.6 22.0 45.6
2004 20120
20
40
Saudi Arabia, All firms1Y PD (LHS, bps) and # of firms (RHS)
2004 20120
100
200 Saudi Arabia 2017Q1 2017Q2 Q2-Q1# Median St.Dev. Median St.Dev. Median St.Dev.
Financials 60 0.9 8.7 0.9 7.4 0.0 3.0Basic Materials 19 14.8 105.4 16.4 214.1 0.1 109.3Communications 7 33.7 59.5 38.0 48.5 -0.5 13.2Consumer Cyclical 18 2.6 15.4 2.7 18.3 0.1 5.2Consumer Non-cyclical 26 4.9 6.1 4.2 10.3 -0.1 8.1Diversified 3 19.0 10.8 19.5 26.1 0.5 15.4Energy 2 10.1 2.2 22.9 10.2 12.8 8.0Industrial 34 4.8 19.2 2.4 16.6 -0.0 10.4Utilities 1 36.8 – 44.5 – 7.8 –
20120
50
100
Serbia, All firms1Y PD (LHS, bps) and # of firms (RHS)
20120
50
100Serbia 2017Q1 2017Q2 Q2-Q1
# Median St.Dev. Median St.Dev. Median St.Dev.Financials 4 45.5 33.1 35.5 24.2 -17.4 13.4Basic Materials 3 4.7 9.1 4.6 7.3 -0.4 1.8Consumer Cyclical 3 2.9 43.1 2.6 26.6 -0.3 16.5Consumer Non-cyclical 5 68.9 44.6 72.6 51.9 0.2 10.8Diversified 2 62.4 77.2 65.4 78.7 2.9 1.5Energy 1 9.1 – 7.9 – -1.2 –Industrial 9 37.8 120.9 35.1 40.5 -1.2 120.4
1996 2004 20120
50
100
Singapore, All firms1Y PD (LHS, bps) and # of firms (RHS)
1996 2004 20120
500
1000Singapore 2017Q1 2017Q2 Q2-Q1
# Median St.Dev. Median St.Dev. Median St.Dev.Financials 119 2.5 59.7 1.9 90.6 -0.0 65.1Basic Materials 29 13.5 99.4 17.3 66.3 -0.3 59.6Communications 25 12.0 105.8 15.2 119.6 0.0 66.5Consumer Cyclical 78 10.7 62.9 11.4 145.1 -0.0 88.6Consumer Non-cyclical 78 8.8 43.3 5.8 44.6 -0.0 32.5Diversified 11 3.8 20.7 1.9 24.2 0.0 27.3Energy 26 30.9 320.8 45.5 437.8 5.3 158.2Industrial 169 21.2 71.5 13.8 68.9 -0.1 35.1Technology 25 8.9 73.6 6.9 144.2 0.2 90.1Utilities 3 28.3 44.8 28.3 98.6 -0.1 55.0

NUS RMI-CRI Quarterly Credit Report, Q2/2017 69
2004 20120
50
100
Slovakia, All firms1Y PD (LHS, bps) and # of firms (RHS)
2004 20120
10
20
Slovakia 2017Q1 2017Q2 Q2-Q1# Median St.Dev. Median St.Dev. Median St.Dev.
Financials 4 29.6 21.8 68.2 151.4 42.4 131.4Basic Materials 1 40.0 – 29.8 – -10.2 –Consumer Cyclical 1 0.1 – 0.1 – 0.0 –Consumer Non-cyclical 2 9.7 8.7 11.1 7.5 1.4 1.2Energy 1 11.0 – 8.8 – -2.2 –Industrial 1 8.6 – 10.4 – 1.8 –Technology 1 7.1 – 27.2 – 20.1 –
2004 20120
50
100
Slovenia, All firms1Y PD (LHS, bps) and # of firms (RHS)
2004 20120
50
100 Slovenia 2017Q1 2017Q2 Q2-Q1# Median St.Dev. Median St.Dev. Median St.Dev.
Financials 6 21.7 23.9 18.1 27.2 0.6 7.5Basic Materials 2 7.1 9.6 9.6 12.1 2.5 2.5Communications 1 1.8 – 3.3 – 1.5 –Consumer Cyclical 4 20.3 11.9 27.5 11.3 4.6 6.5Consumer Non-cyclical 7 6.3 31.5 20.5 51.3 0.0 24.1Diversified 1 117.1 – 100.7 – -16.5 –Energy 1 1.4 – 1.1 – -0.3 –Industrial 3 16.1 31.1 17.7 30.2 2.4 2.4Technology 1 36.0 – 22.2 – -13.8 –
1996 2004 20120
50
100
150
South Africa, All firms1Y PD (LHS, bps) and # of firms (RHS)
1996 2004 20120
200
400
600 South Africa 2017Q1 2017Q2 Q2-Q1# Median St.Dev. Median St.Dev. Median St.Dev.
Financials 79 14.7 138.2 16.9 225.0 -0.2 108.9Basic Materials 38 21.7 141.3 29.4 150.8 1.0 46.3Communications 14 7.7 287.9 11.5 284.7 -0.4 8.9Consumer Cyclical 33 5.8 557.3 5.9 1117.5 -0.0 608.9Consumer Non-cyclical 38 7.4 46.5 10.4 84.7 0.1 44.6Diversified 9 3.2 41.0 2.6 36.5 -0.4 6.2Energy 9 24.9 248.6 25.8 259.1 1.3 14.0Industrial 42 23.2 125.2 26.5 106.7 1.5 60.6Technology 11 7.0 328.3 5.6 311.3 -0.1 18.9
1996 2004 20120
500
1000
South Korea, All firms1Y PD (LHS, bps) and # of firms (RHS)
1996 2004 20120
2000
4000South Korea 2017Q1 2017Q2 Q2-Q1
# Median St.Dev. Median St.Dev. Median St.Dev.Financials 81 23.1 39.5 16.5 39.6 -1.6 25.5Basic Materials 191 5.5 44.1 4.9 28.1 -0.1 31.9Communications 200 3.7 36.4 3.2 183.2 -0.0 167.1Consumer Cyclical 311 8.1 62.8 7.5 43.1 -0.2 26.6Consumer Non-cyclical 327 3.2 29.2 3.0 42.9 -0.1 33.8Diversified 45 0.0 8.0 0.0 8.2 0.0 2.1Energy 13 5.4 43.0 6.6 24.7 -0.5 19.7Industrial 543 8.2 61.0 7.0 109.5 -0.1 109.1Technology 246 5.4 39.0 4.1 121.8 -0.2 105.0Utilities 17 11.1 11.1 10.9 38.4 -0.2 39.3

NUS RMI-CRI Quarterly Credit Report, Q2/2017 70
1996 2004 20120
50
100
Spain, All firms1Y PD (LHS, bps) and # of firms (RHS)
1996 2004 20120
100
200 Spain 2017Q1 2017Q2 Q2-Q1# Median St.Dev. Median St.Dev. Median St.Dev.
Financials 33 10.6 84.3 9.4 227.2 -0.0 144.0Basic Materials 8 3.9 4.2 2.2 4.1 -0.4 2.1Communications 18 5.9 6.5 8.1 16.9 0.2 12.0Consumer Cyclical 14 5.1 25.3 4.3 23.8 -0.9 6.1Consumer Non-cyclical 33 5.0 10.0 3.9 26.1 0.1 18.5Energy 5 4.8 0.9 4.1 5.2 -0.7 4.8Industrial 30 8.5 70.7 6.3 19.9 -0.5 63.1Technology 3 0.3 3.9 0.2 2.9 -0.1 1.0Utilities 7 2.3 6.9 2.2 5.5 0.2 1.6
2004 20120
10
20
30
40
50
60
Sri Lanka, All firms1Y PD (LHS, bps) and # of firms (RHS)
2004 20120
50
100
150
200
250
300Sri Lanka 2017Q1 2017Q2 Q2-Q1
# Median St.Dev. Median St.Dev. Median St.Dev.Financials 86 56.4 89.3 37.3 70.8 -8.6 35.4Basic Materials 14 15.9 79.2 8.8 66.9 -4.4 14.7Communications 4 1.6 9.9 1.8 7.9 -0.1 2.1Consumer Cyclical 60 13.8 53.3 12.1 33.8 -1.8 27.2Consumer Non-cyclical 55 18.7 65.9 13.6 46.7 -2.3 28.8Diversified 14 25.4 43.8 16.5 47.6 -1.9 13.8Energy 3 2.0 2.1 1.4 3.9 -0.0 2.0Industrial 23 10.1 178.7 8.1 129.5 -1.7 51.6Technology 2 33.4 37.5 15.8 10.4 -17.7 27.1Utilities 5 13.7 14.2 10.8 11.4 -0.0 8.9
1996 2004 20120
20
40
60
80
Sweden, All firms1Y PD (LHS, bps) and # of firms (RHS)
1996 2004 20120
200
400
600
800 Sweden 2017Q1 2017Q2 Q2-Q1# Median St.Dev. Median St.Dev. Median St.Dev.
Financials 87 8.9 92.1 8.0 233.3 -0.1 145.0Basic Materials 27 16.9 35.6 15.8 99.9 -1.2 79.9Communications 59 15.8 40.2 22.4 48.1 0.1 29.0Consumer Cyclical 72 8.2 44.5 8.2 42.7 0.0 22.8Consumer Non-cyclical 175 10.2 22.5 12.7 59.9 0.2 51.7Diversified 5 6.2 117.4 5.3 10.6 -0.0 118.1Energy 17 9.0 17.0 12.0 44.3 1.3 46.7Industrial 115 13.0 36.0 9.8 60.1 -0.0 50.5Technology 53 11.3 29.2 13.6 47.2 1.5 37.1Utilities 2 13.5 7.0 8.4 0.8 -5.1 6.2
1996 2004 20120
20
40
Switzerland, All firms1Y PD (LHS, bps) and # of firms (RHS)
1996 2004 20120
200
400Switzerland 2017Q1 2017Q2 Q2-Q1
# Median St.Dev. Median St.Dev. Median St.Dev.Financials 67 5.5 41.2 5.2 32.4 -0.1 20.3Basic Materials 16 3.0 46.6 1.7 11.7 -0.1 36.0Communications 10 4.3 16.4 2.2 17.8 0.0 3.2Consumer Cyclical 19 3.6 40.6 3.8 27.3 -0.3 23.1Consumer Non-cyclical 41 2.5 76.4 2.4 136.9 -0.0 61.4Diversified 3 3.8 26.8 2.9 23.5 -0.9 3.3Energy 5 49.2 71.5 116.1 85.3 32.9 69.0Industrial 62 2.2 15.2 1.8 18.4 -0.2 10.3Technology 11 6.4 15.1 7.3 45.2 -0.2 45.2Utilities 4 6.6 11.8 6.5 10.1 -0.3 1.9

NUS RMI-CRI Quarterly Credit Report, Q2/2017 71
1996 2004 20120
50
100
Taiwan, All firms1Y PD (LHS, bps) and # of firms (RHS)
1996 2004 20120
500
1000Taiwan 2017Q1 2017Q2 Q2-Q1
# Median St.Dev. Median St.Dev. Median St.Dev.Financials 80 2.1 14.3 1.4 6.9 -0.3 12.9Basic Materials 76 0.3 4.2 0.2 4.7 0.0 4.8Communications 42 0.6 10.4 0.5 7.5 -0.1 5.2Consumer Cyclical 147 0.7 5.7 0.3 4.6 -0.1 2.5Consumer Non-cyclical 60 0.1 2.9 0.0 2.5 -0.0 0.6Diversified 1 0.0 – 0.1 – 0.1 –Energy 7 4.0 3.1 3.8 2.7 0.0 1.0Industrial 310 1.0 13.1 0.8 21.9 -0.0 11.6Technology 151 0.7 8.0 0.5 8.5 -0.0 3.8Utilities 6 0.0 0.0 0.0 0.1 0.0 0.0
1996 2004 20120
200
400
Thailand, All firms1Y PD (LHS, bps) and # of firms (RHS)
1996 2004 20120
500
1000Thailand 2017Q1 2017Q2 Q2-Q1
# Median St.Dev. Median St.Dev. Median St.Dev.Financials 111 7.2 23.5 7.9 25.0 0.0 7.4Basic Materials 55 3.0 32.7 4.5 266.9 0.2 240.0Communications 46 4.1 29.4 4.4 28.2 0.0 7.1Consumer Cyclical 132 2.9 14.1 2.5 20.5 -0.0 17.4Consumer Non-cyclical 97 1.0 7.9 1.5 11.5 0.0 6.3Diversified 6 0.8 10.3 0.9 31.6 0.1 21.3Energy 19 4.4 63.8 3.1 63.1 -0.1 6.1Industrial 132 3.3 14.8 4.0 15.1 0.1 5.2Technology 13 5.1 36.8 6.4 170.7 0.0 150.2Utilities 15 1.0 4.1 1.6 4.3 -0.0 1.5
2004 20120
50
Tunisia, All firms1Y PD (LHS, bps) and # of firms (RHS)
2004 20120
100 Tunisia 2017Q1 2017Q2 Q2-Q1# Median St.Dev. Median St.Dev. Median St.Dev.
Financials 24 30.6 47.4 29.8 65.2 0.3 58.4Basic Materials 4 7.4 8.1 4.4 16.5 0.7 11.1Communications 4 13.7 20.1 16.0 15.2 -2.7 7.5Consumer Cyclical 10 1.0 38.7 0.5 44.0 -0.1 5.9Consumer Non-cyclical 10 7.7 24.1 6.5 24.2 -0.1 13.8Diversified 1 2.4 – 1.9 – -0.4 –Energy 1 0.3 – 0.1 – -0.2 –Industrial 12 11.5 35.9 15.0 44.6 2.3 9.7Technology 2 89.0 11.1 31.8 39.0 -57.2 27.9
2004 20120
100
Turkey, All firms1Y PD (LHS, bps) and # of firms (RHS)
2004 20120
500Turkey 2017Q1 2017Q2 Q2-Q1
# Median St.Dev. Median St.Dev. Median St.Dev.Financials 101 26.8 56.4 24.6 43.2 -1.6 30.0Basic Materials 37 10.9 22.5 10.7 19.6 -1.6 14.0Communications 13 23.4 33.9 15.1 14.2 -5.5 26.8Consumer Cyclical 91 25.2 106.0 23.5 77.0 -2.5 38.4Consumer Non-cyclical 52 15.3 33.9 14.0 23.3 -2.3 19.3Diversified 10 27.2 58.1 22.9 40.2 -3.5 40.1Energy 5 21.0 27.0 13.1 21.4 -1.6 7.7Industrial 70 14.4 30.4 13.7 19.8 -1.0 17.2Technology 4 20.0 30.0 17.3 21.2 -5.3 10.7Utilities 8 23.0 24.9 14.2 14.6 -2.6 12.6

NUS RMI-CRI Quarterly Credit Report, Q2/2017 72
2004 20120
200
400
Ukraine, All firms1Y PD (LHS, bps) and # of firms (RHS)
2004 20120
50
100
Ukraine 2017Q1 2017Q2 Q2-Q1# Median St.Dev. Median St.Dev. Median St.Dev.
Financials 1 162.9 – 130.8 – -32.1 –Consumer Non-cyclical 8 32.3 62.5 16.6 60.7 -5.1 12.8Diversified 1 16.0 – 8.3 – -7.7 –Energy 2 171.5 80.2 209.7 67.3 38.2 12.9Industrial 2 12.8 4.9 10.8 12.3 -2.0 7.4Utilities 1 17.9 – 18.1 – 0.1 –
2004 20120
100
200
United Arab Emirates, All firms1Y PD (LHS, bps) and # of firms (RHS)
2004 20120
50
100
United Arab Emirates 2017Q1 2017Q2 Q2-Q1# Median St.Dev. Median St.Dev. Median St.Dev.
Financials 41 20.5 23.0 16.1 24.7 -0.0 7.7Communications 3 0.7 14.2 0.4 48.4 0.0 34.2Consumer Cyclical 5 19.1 9.6 33.2 24.6 10.7 15.8Consumer Non-cyclical 10 9.3 44.5 8.5 24.3 1.4 33.9Energy 4 37.2 13.1 25.0 47.8 -7.0 39.6Industrial 16 23.9 53.0 16.1 76.0 0.1 47.3Utilities 1 234.8 – 226.0 – -8.8 –
1996 2004 20120
20
40
60
80
United Kingdom, All firms1Y PD (LHS, bps) and # of firms (RHS)
1996 2004 20120
500
1000
1500
2000United Kingdom 2017Q1 2017Q2 Q2-Q1
# Median St.Dev. Median St.Dev. Median St.Dev.Financials 230 12.6 50.6 11.3 127.3 -0.7 114.2Basic Materials 94 18.0 72.1 25.3 65.7 0.8 51.1Communications 102 15.5 105.9 15.6 151.7 -0.2 72.5Consumer Cyclical 157 13.4 41.6 12.6 61.1 -0.3 33.7Consumer Non-cyclical 245 9.4 37.8 8.1 36.6 -0.4 26.9Diversified 7 6.6 59.9 40.0 30.0 -0.2 53.6Energy 95 22.4 69.2 29.3 179.5 3.6 152.3Industrial 171 11.5 51.7 9.6 42.4 -0.2 32.8Technology 97 8.4 112.4 8.8 109.0 0.0 31.0Utilities 12 5.2 25.1 8.9 146.3 1.3 126.6
1996 2004 20120
20
40
60
80
United States, All firms1Y PD (LHS, bps) and # of firms (RHS)
1996 2004 20120
2000
4000
6000
8000United States 2017Q1 2017Q2 Q2-Q1
# Median St.Dev. Median St.Dev. Median St.Dev.Financials 882 3.6 205.5 4.3 184.7 0.2 58.4Basic Materials 132 4.8 335.9 5.9 252.6 0.0 114.8Communications 272 5.5 421.3 5.0 299.3 -0.0 156.0Consumer Cyclical 441 4.0 157.2 3.5 313.2 -0.0 203.8Consumer Non-cyclical 901 5.6 175.7 5.0 261.1 -0.0 192.2Diversified 8 6.0 103.8 10.4 525.4 2.7 422.7Energy 271 18.5 208.1 19.3 462.3 0.1 331.4Industrial 460 2.0 84.8 2.3 134.8 -0.0 103.9Technology 317 2.0 112.9 1.6 196.1 -0.0 132.7Utilities 84 0.6 34.3 0.4 28.8 -0.1 7.3

NUS RMI-CRI Quarterly Credit Report, Q2/2017 73
1996 2004 20120
50
100
150
Venezuela, All firms1Y PD (LHS, bps) and # of firms (RHS)
1996 2004 20120
10
20
30
Venezuela 2017Q1 2017Q2 Q2-Q1# Median St.Dev. Median St.Dev. Median St.Dev.
Financials 5 3.5 4.3 0.3 0.5 -2.5 4.3Basic Materials 1 101.1 – 7.0 – -94.2 –
20120
50
100
Vietnam, All firms1Y PD (LHS, bps) and # of firms (RHS)
20120
500
1000Vietnam 2017Q1 2017Q2 Q2-Q1
# Median St.Dev. Median St.Dev. Median St.Dev.Financials 87 18.2 66.4 10.9 43.6 -0.2 43.8Basic Materials 68 14.8 82.8 15.8 79.1 -0.3 40.9Communications 20 17.3 87.4 18.0 66.2 -0.2 41.1Consumer Cyclical 66 21.4 125.5 20.7 106.9 -0.0 35.8Consumer Non-cyclical 96 10.0 71.6 7.9 75.8 -0.2 40.9Diversified 15 14.0 48.3 15.1 32.2 -0.4 18.2Energy 22 68.4 72.2 57.6 71.0 0.2 23.4Industrial 256 29.8 78.3 26.9 150.2 -0.1 124.8Technology 6 5.1 27.1 2.7 12.6 -2.4 14.6Utilities 19 3.9 15.4 4.3 15.5 -0.2 8.2
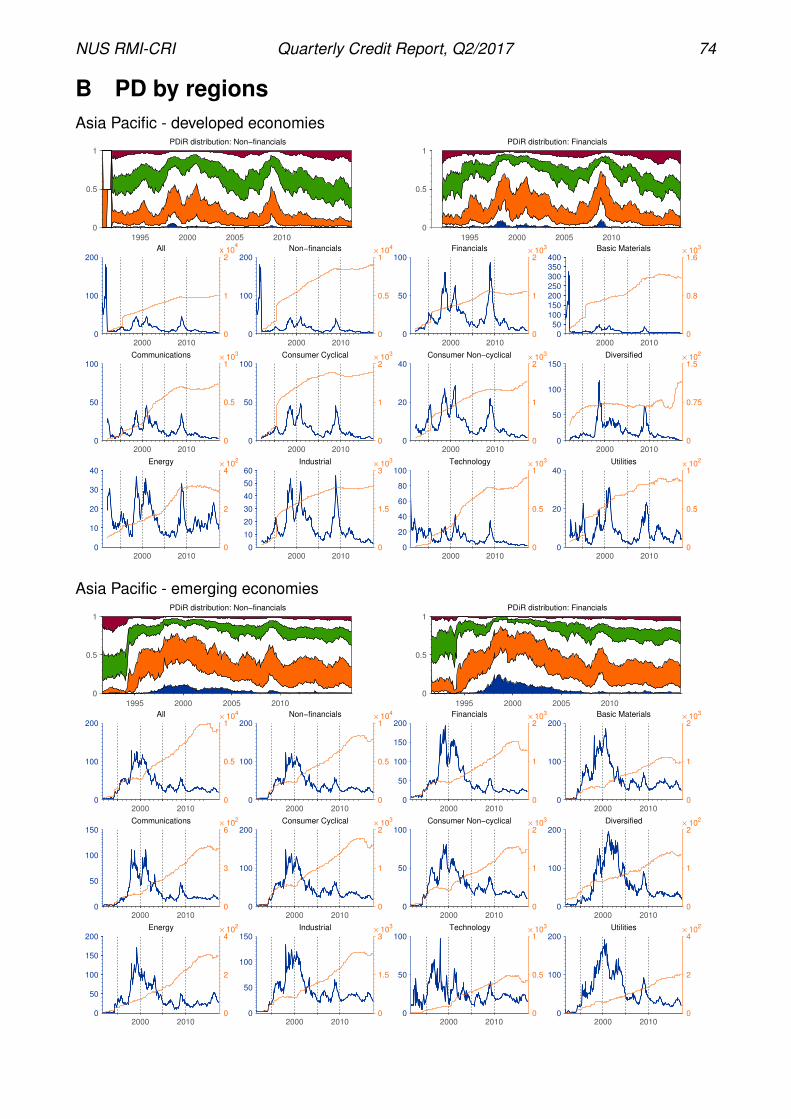
NUS RMI-CRI Quarterly Credit Report, Q2/2017 74
B PD by regionsAsia Pacific - developed economies
1995 2000 2005 2010
0
0.5
1PDiR distribution: Non−financials
1995 2000 2005 2010
0
0.5
1PDiR distribution: Financials
2000 20100
100
200All
0
1
2x 10
4
2000 20100
100
200× 10
4Non−financials
0
0.5
1
2000 20100
50
100× 10
3Financials
0
1
2
2000 20100
50100
150200250
300350400
× 103Basic Materials
0
0.8
1.6
2000 20100
50
100× 10
3Communications
0
0.5
1
2000 20100
50
100× 10
3Consumer Cyclical
0
1
2
2000 20100
20
40× 10
3Consumer Non−cyclical
0
1
2
2000 20100
50
100
150× 10
2Diversified
0
0.75
1.5
2000 20100
10
20
30
40× 10
2Energy
0
2
4
2000 20100
10
20
30
40
50
60× 10
3Industrial
0
1.5
3
2000 20100
20
40
60
80
100× 10
3Technology
0
0.5
1
2000 20100
20
40× 10
2Utilities
0
0.5
1
Asia Pacific - emerging economies
1995 2000 2005 2010
0
0.5
1PDiR distribution: Non−financials
1995 2000 2005 2010
0
0.5
1PDiR distribution: Financials
2000 20100
100
200× 10
4All
0
0.5
1
2000 20100
100
200× 10
4Non−financials
0
0.5
1
2000 20100
50
100
150
200× 10
3Financials
0
1
2
2000 20100
100
200× 10
3Basic Materials
0
1
2
2000 20100
50
100
150× 10
2Communications
0
3
6
2000 20100
100
200× 10
3Consumer Cyclical
0
1
2
2000 20100
50
100× 10
3Consumer Non−cyclical
0
1
2
2000 20100
100
200× 10
2Diversified
0
1
2
2000 20100
50
100
150
200× 10
2Energy
0
2
4
2000 20100
50
100
150× 10
3Industrial
0
1.5
3
2000 20100
50
100× 10
3Technology
0
0.5
1
2000 20100
100
200× 10
2Utilities
0
2
4

NUS RMI-CRI Quarterly Credit Report, Q2/2017 75
North America
1995 2000 2005 2010
0
0.5
1PDiR distribution: Non−financials
1995 2000 2005 2010
0
0.5
1PDiR distribution: Financials
2000 20100
50
100× 10
4All
0
0.5
1
2000 20100
50
100× 10
4Non−financials
0
0.5
1
2000 20100
100
200× 10
3Financials
0
1
1.5
2000 20100
50
100× 10
3Basic Materials
0
0.5
1
2000 20100
100
200× 10
3Communications
0
0.5
1
2000 20100
50
100× 10
3Consumer Cyclical
0
1
1.5
2000 20100
510
152025
303540
× 103Consumer Non−cyclical
1
2
2000 20100
50
100
150
200
250
300Diversified
0
30
60
2000 20100
50
100× 10
3Energy
0
0.5
1
2000 20100
10
20
30
40
50
60× 10
3Industrial
0.8
1.6
2000 20100
20
40
60
80
100× 10
3Technology
0
0.5
1
2000 20100
20
40× 10
2Utilities
0
1.5
2
Western Europe
1995 2000 2005 2010
0
0.5
1PDiR distribution: Non−financials
1995 2000 2005 2010
0
0.5
1PDiR distribution: Financials
2000 20100
10
20
30
40
50
60× 10
3All
0
3
6
2000 20100
10
20
30
40
50
60× 10
3Non−financials
0
3
6
2000 20100
50
100× 10
3Financials
0
1
2
2000 20100
50
100× 10
2Basic Materials
0
2
4
2000 20100
50
100× 10
3Communications
0
0.5
1
2000 20100
20
40
60
80
100× 10
3Consumer Cyclical
0
0.5
1
2000 20100
510
152025
303540
× 103Consumer Non−cyclical
0
0.8
1.6
2000 20100
50
100× 10
2Diversified
0
0.5
1
2000 20100
50
100× 10
2Energy
0
2
4
2000 20100
20
40
60× 10
3Industrial
0
0.75
1.5
2000 20100
50
100× 10
3Technology
0
0.5
1
2000 20100
510
152025
303540
× 102Utilities
0
0.8
1.6
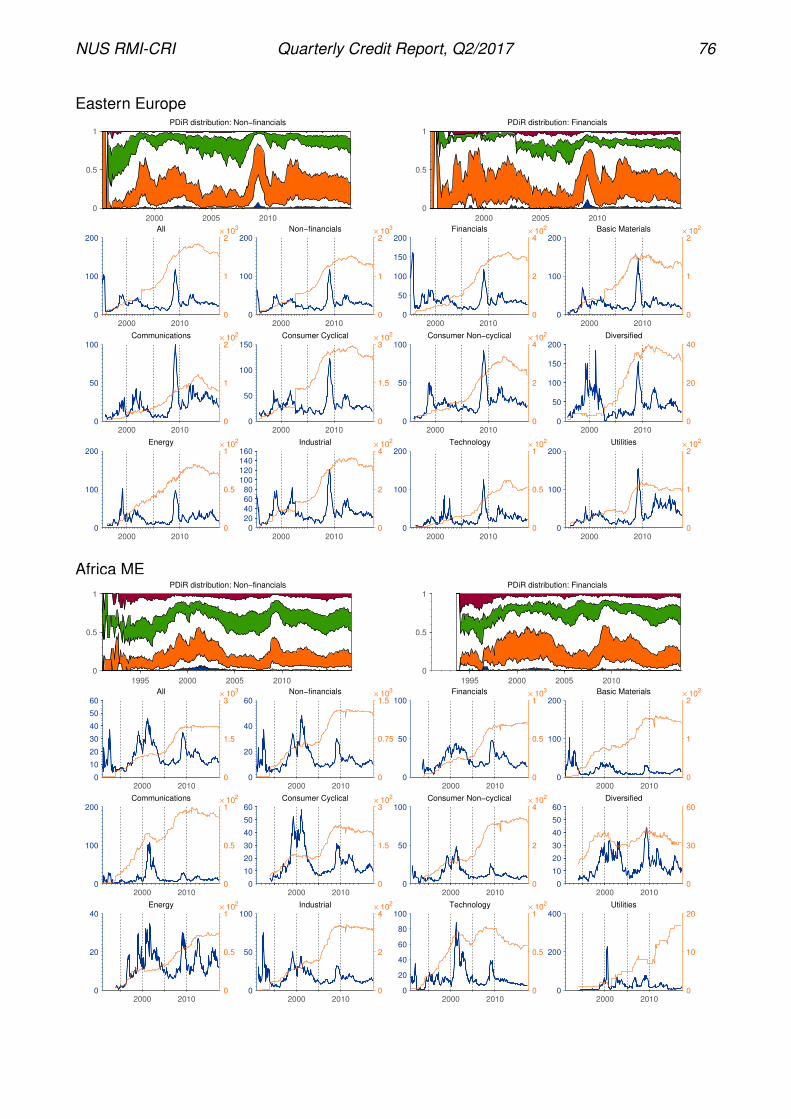
NUS RMI-CRI Quarterly Credit Report, Q2/2017 76
Eastern Europe
2000 2005 2010
0
0.5
1PDiR distribution: Non−financials
2000 2005 2010
0
0.5
1PDiR distribution: Financials
2000 20100
100
200× 10
3All
0
1
2
2000 20100
100
200× 10
3Non−financials
0
1
2
2000 20100
50
100
150
200× 10
2Financials
0
2
4
2000 20100
100
200× 10
2Basic Materials
0
1
2
2000 20100
50
100× 10
2Communications
0
1
2
2000 20100
50
100
150× 10
2Consumer Cyclical
0
1.5
3
2000 20100
50
100× 10
2Consumer Non−cyclical
0
2
4
2000 20100
50
100
150
200Diversified
0
20
40
2000 20100
100
200× 10
2Energy
0
0.5
1
2000 20100
2040
6080
100
120140160
× 102Industrial
0
2
4
2000 20100
100
200× 10
2Technology
0
0.5
1
2000 20100
100
200× 10
2Utilities
0
1
2
Africa ME
1995 2000 2005 2010
0
0.5
1PDiR distribution: Non−financials
1995 2000 2005 2010
0
0.5
1PDiR distribution: Financials
2000 20100
10
20
30
40
50
60× 10
3All
0
1.5
3
2000 20100
20
40
60× 10
3Non−financials
0
0.75
1.5
2000 20100
50
100× 10
3Financials
0
0.5
1
2000 20100
100
200× 10
2Basic Materials
0
1
2
2000 20100
100
200× 10
2Communications
0
0.5
1
2000 20100
10
20
30
40
50
60× 10
2Consumer Cyclical
0
1.5
3
2000 20100
50
100× 10
2Consumer Non−cyclical
0
2
4
2000 20100
10
20
30
40
50
60Diversified
0
30
60
2000 20100
20
40× 10
2Energy
0
0.5
1
2000 20100
50
100× 10
2Industrial
0
2
4
2000 20100
20
40
60
80
100× 10
2Technology
0
0.5
1
2000 20100
200
400Utilities
0
10
20

NUS RMI-CRI Quarterly Credit Report, Q2/2017 77
Latin America
1995 2000 2005 2010
0
0.5
1PDiR distribution: Non−financials
1995 2000 2005 2010
0
0.5
1PDiR distribution: Financials
2000 20100
50
100× 10
3All
0
0.5
1
2000 20100
50
100× 10
3Non−financials
0
0.5
1
2000 20100
50
100× 10
2Financials
0
1
2
2000 20100
50
100× 10
2Basic Materials
0
1
2
2000 20100
50
100× 10
2Communications
0
0.5
1
2000 20100
20
40
60× 10
2Consumer Cyclical
0
0.75
1.5
2000 20100
510
152025
303540
× 102Consumer Non−cyclical
0
0.8
1.6
2000 20100
2040
6080
100
120140160
Diversified
0
20
40
2000 20100
50
100Energy
0
20
40
2000 20100
20
40
60× 10
2Industrial
0
0.75
1.5
2000 20100
100
200Technology
0
5
10
2000 20100
20
40
60
80
100× 10
2Utilities
0
0.5
1

NUS RMI-CRI Quarterly Credit Report, Q2/2017 78
C Macroeconomic IndicatorsDescriptions of the data contained in this section are provided in Appendix D.
1990 2000 20100
200
400
600
8001Yr. PD
Non−Fin Fin
1990 2000 20100
0.5
1
1.5
2
2.5x 10
4 MERVAL
1990 2000 20100
5
10
15
20ARS/USD
1990 2000 20100
20
40
60
80
100
120
3m Interbank
1990 2000 2010−20
−10
0
10
20
GDP
1990 2000 2010−50
0
50
100
150
PPI Money Supply
1990 2000 2010AAA
AA
A
BBB
BB
B
CCC
CCC
0
10000Moody’s S&P 5Y CDS
1990 2000 20100
2
4
6
8
10FDI
1990 2000 2010−1.5
−1
−0.5
0
0.5
1Fiscal Budget
Argentina 2016 2017Q2 Q3 Q4 Q1 Q2
1Yr. PD, Non-Fin. (bps) 4.79 5.47 5.33 4.18 4.661Yr. PD, Fin. 17.59 16.81 21.77 20.45 26.30MERVAL 14683 16676 16918 20265 21913ARS/USD 15.05 15.31 15.88 15.39 16.63GDP (YoY%) -3.7 -3.7 -1.9 0.3 –Sov. Rating, Moody’s B3 B3 B3 B3 B3Sov. Rating, S&P B B B B B5Y CDS (bps) 419.70 381.72 419.36 364.20 323.12Fiscal Budget (%GDP) – – -1.12 – –
1990 2000 20100
20
40
60
80
1001Yr. PD
Non−Fin Fin
1990 2000 20101000
2000
3000
4000
5000
6000
7000All Ordinaries
1990 2000 20100.4
0.6
0.8
1
1.2
1.4AUD/USD
1990 2000 20100
5
10
15
3m Treas. 10Y Treas. 3m Interbank
1990 2000 2010−2
0
2
4
6
30
40
50
60
70GDP OECD CLI PMI
1990 2000 2010−10
0
10
20
30
PPI Money Supply
1990 2000 2010AAA
AA
A
BBB
BB
B
CCC
CCC
0
50
100
150
200Moody’s S&P 5Y CDS
1990 2000 2010−4
−2
0
2
4
6
8FDI
1990 2000 2010−6
−4
−2
0
2
4Fiscal Budget
Australia 2016 2017Q2 Q3 Q4 Q1 Q2
1Yr. PD, Non-Fin. (bps) 6.39 4.84 5.24 4.44 4.741Yr. PD, Fin. 1.44 1.02 1.15 1.12 1.01All Ordinaries 5310 5525 5719 5904 5764AUD/USD 0.75 0.77 0.72 0.76 0.773m Treas. Yield (%) 1.69 1.53 1.70 1.55 1.6310Y Treas. Yield (%) 1.98 1.91 2.77 2.70 2.603m Interbank (%) 1.94 1.72 1.80 1.79 1.71GDP (YoY%) 3.1 1.8 2.4 1.7 –OECD CLI 100.11 100.07 99.99 100.07 100.17*PMI 51.8 49.8 55.4 57.5 55.0PPI (YoY%) -1.6 -0.7 1.1 3.5 3.7Money Supply (YoY%) 5.8 5.6 6.7 6.7 7.8Sov. Rating, Moody’s Aaa Aaa Aaa Aaa AaaSov. Rating, S&P AAA AAA AAA AAA AAA5Y CDS (bps) 35.00 25.66 24.83 25.51 21.93FDI (%GDP) – – 3.48 – –Fiscal Budget (%GDP) – – -1.47 – –

NUS RMI-CRI Quarterly Credit Report, Q2/2017 79
1990 2000 20100
20
40
60
801Yr. PD
Non−Fin Fin
1990 2000 20100
1000
2000
3000
4000
5000ATX
1990 2000 20100.8
1
1.2
1.4
1.6EUR/USD
1990 2000 2010−2
0
2
4
6
8
3m Treas. 10Y Treas. 3m Interbank
1990 2000 2010−5
0
5
40
60
80GDP OECD CLI PMI
1990 2000 2010−5
0
5
10
15
PPI Money Supply
1990 2000 2010AAA
AA
A
BBB
BB
B
CCC
CCC
0
100
200
300Moody’s S&P 5Y CDS
1990 2000 2010−10
0
10
20
30FDI
1990 2000 2010−8
−6
−4
−2
0Fiscal Budget
Austria 2016 2017Q2 Q3 Q4 Q1 Q2
1Yr. PD, Non-Fin. (bps) 10.69 9.26 6.95 4.53 4.65*1Yr. PD, Fin. 7.74 4.72 4.16 2.75 2.50*ATX 2096 2405 2618 2829 3107EUR/USD 1.11 1.12 1.05 1.07 1.143m Treas. Yield (%) -0.61 -0.70 -0.82 -0.82 -0.6610Y Treas. Yield (%) 0.20 0.10 0.43 0.54 0.713m Interbank (%) -0.29 -0.30 -0.32 -0.33 -0.33GDP (YoY%) 1.3 1.7 2.0 2.1 2.9OECD CLI 99.60 99.99 100.58 101.18 101.48*PMI 54.5 53.5 56.3 56.8 60.7PPI (YoY%) -3.0 -2.0 0.5 2.5 1.3Money Supply (YoY%) 5.0 5.1 5.2 5.3 5.1Sov. Rating, Moody’s Aa1 Aa1 Aa1 Aa1 Aa1Sov. Rating, S&P AA+ AA+ AA+ AA+ AA+5Y CDS (bps) 31.0 25.9 28.1 22.5 20.1FDI (%GDP) – – -7.18 – –Fiscal Budget (%GDP) – – -1.60 – –
1990 2000 20100
20
40
60
801Yr. PD
Non−Fin Fin
1990 2000 20101000
1500
2000
2500
3000Bourse
1990 2000 20100.375
0.376
0.377
0.378
0.379
0.38USD/BHD
1990 2000 20101
2
3
4
5
6
3m Interbank
1990 2000 20100
2
4
6
8
10
GDP
1990 2000 2010−20
−10
0
10
20
30
40
Money Supply
1990 2000 2010AAA
AA
A
BBB
BB
B
CCC
CCC
0
500
1000Moody’s S&P 5Y CDS
1990 2000 2010−10
0
10
20
30
40FDI
1990 2000 2010−20
−10
0
10
20Fiscal Budget
Bahrain 2016 2017Q2 Q3 Q4 Q1 Q2
1Yr. PD, Non-Fin. (bps) 0.74 1.00 1.00 1.06 1.131Yr. PD, Fin. 32.08 36.92 15.50 27.45 36.93Bourse 1118 1150 1220 1356 1310USD/BHD 0.38 0.38 0.38 0.38 0.383m Interbank (%) 1.80 1.88 2.10 2.30 2.40GDP (YoY%) – – 2.92 – –Money Supply (YoY%) 2.11 2.70 1.06 1.63 –Sov. Rating, Moody’s Ba2 Ba2 Ba2 Ba2 Ba2Sov. Rating, S&P BB- BB- BB- BB- BB-Fiscal Budget (%GDP) – – -4.71 – –

NUS RMI-CRI Quarterly Credit Report, Q2/2017 80
1990 2000 20100
10
20
30
40
501Yr. PD
Non−Fin Fin
1990 2000 20100
0.5
1
1.5
2
2.5x 10
4 Dhaka
1990 2000 201030
40
50
60
70
80
90USD/BDT
1990 2000 20100
2
4
6
8
10
12
3m Treas.
1990 2000 20100
2
4
6
8
GDP
1990 2000 201010
15
20
25
30
Money Supply
1990 2000 2010AAA
AA
A
BBB
BB
B
CCC
CCC
Moody’s S&P
1990 2000 20100
0.5
1
1.5
2FDI
Bangladesh 2016 2017Q2 Q3 Q4 Q1 Q2
1Yr. PD, Non-Fin. (bps) 11.52 9.80 10.99 9.73 7.571Yr. PD, Fin. 26.57 32.00 24.14 18.64 18.98Dhaka 13803 14429 15478 17738 17517USD/BDT 78.33 78.38 78.92 80.25 80.643m Treas. Yield (%) 4.75 3.20 2.98 2.89* 4.09GDP (YoY%) – – 7.1 – –Money Supply (YoY%) 16.4 13.4 13.8 13.1 11.7*Sov. Rating, Moody’s Ba3 Ba3 Ba3 Ba3 Ba3Sov. Rating, S&P BB- BB- BB- BB- BB-
1990 2000 20100
10
20
30
401Yr. PD
Non−Fin Fin
1990 2000 20100
1
2
3
4
5x 10
4 BAS NR
1990 2000 20100.8
1
1.2
1.4
1.6EUR/USD
1990 2000 2010−2
0
2
4
6
8
10
3m Treas. 10Y Treas.
1990 2000 2010−10
0
10
45
50
55GDP OECD CLI
1990 2000 2010−10
−5
0
5
10
15
20
PPI Money Supply
1990 2000 2010AAA
AA
A
BBB
BB
B
CCC
CCC
0
500Moody’s S&P 5Y CDS
1990 2000 2010−20
0
20
40
60
80
100FDI
1990 2000 2010−10
−8
−6
−4
−2
0
2Fiscal Budget
Belgium 2016 2017Q2 Q3 Q4 Q1 Q2
1Yr. PD, Non-Fin. (bps) 5.57 5.18 4.75 2.99 2.401Yr. PD, Fin. 2.54 2.22 1.54 1.92 1.94BAS NR 41164.2 42424.0 43085.0 44607.4 43715.0EUR/USD 1.11 1.12 1.05 1.07 1.143m Treas. Yield (%) -0.65 -0.75 -0.85 -0.66 -0.6510Y Treas. Yield (%) 0.23 0.14 0.53 0.85 0.80GDP (YoY%) 1.2 1.2 1.1 1.6 –OECD CLI 100.28 100.40 100.47 100.29 100.10*PPI (YoY%) -3.4 0.8 9.3 12.6 6.1Money Supply (YoY%) 5.00 5.10 5.20 5.30 5.10Sov. Rating, Moody’s Aa3 Aa3 Aa3 Aa3 Aa3Sov. Rating, S&P AA AA AA AA AA5Y CDS (bps) 49.22* – 33.66 27.05 19.56FDI (%GDP) – – 4.17 – –Fiscal Budget (%GDP) – – -2.60 – –

NUS RMI-CRI Quarterly Credit Report, Q2/2017 81
1990 2000 20100
20
40
60
80
1001Yr. PD
Non−Fin Fin
1990 2000 2010400
600
800
1000
1200Sarajevo
1990 2000 20101
1.5
2
2.5BAM/USD
1990 2000 20100
5
10
15
GDP
1990 2000 2010AAA
AA
A
BBB
BB
B
CCC
CCC
Moody’s S&P
1990 2000 2010−5
0
5
10
15FDI
Bosnia and Herzegovina 2016 2017Q2 Q3 Q4 Q1 Q2
1Yr. PD, Non-Fin. (bps) 11.30 8.50 22.11 23.80 24.581Yr. PD, Fin. 46.53 50.92 67.47 49.28 50.52Sarajevo 652 577 583 631 597BAM/USD 1.76 1.74 1.86 1.83 1.71Sov. Rating, Moody’s B3 B3 B3 B3 B3Sov. Rating, S&P B B B B BFDI (%GDP) – – 1.57 – –
1990 2000 20100
50
100
1501Yr. PD
Non−Fin Fin
1990 2000 20100
2
4
6
8x 10
4 IBOV
1990 2000 20100
1
2
3
4
5BRL/USD
1990 2000 20106
8
10
12
14
16
18
3m Treas. 10Y Treas. 3m Interbank
1990 2000 2010−5
0
5
10
40
45
50
55GDP OECD CLI PMI
1990 2000 2010−20
0
20
40
60
PPI Money Supply
1990 2000 2010AAA
AA
A
BBB
BB
B
CCC
CCC
0
1000
2000
3000
4000Moody’s S&P 5Y CDS
1990 2000 20100
1
2
3
4
5
6FDI
1990 2000 2010−10
−8
−6
−4
−2
0Fiscal Budget
Brazil 2016 2017Q2 Q3 Q4 Q1 Q2
1Yr. PD, Non-Fin. (bps) 47.85 42.11 37.36 38.47 39.161Yr. PD, Fin. 61.30 51.57 47.33 38.10 35.97IBOV 51527 58367 60227 64984 62900BRL/USD 3.21 3.26 3.25 3.12 3.313m Treas. Yield (%) 14.14 13.72 12.94 10.90 9.3810Y Treas. Yield (%) 12.07 11.58 11.40 10.06 10.543m Interbank (%) 14.13 13.80 12.96 11.00 9.42GDP (YoY%) – – -3.6 – –OECD CLI 99.13 100.35 101.20 101.95 102.27*PMI 43.2 46.0 45.2 49.6 50.5PPI (YoY%) 14.6 12.3 7.6 4.9 -3.2Money Supply (YoY%) 5.2 5.3 3.8 3.8 5.5Sov. Rating, Moody’s Ba2 Ba2 Ba2 Ba2 Ba2Sov. Rating, S&P BB BB BB BB BB5Y CDS (bps) 316.92 272.81 280.76 226.44 242.29FDI (%GDP) – – 4.39 – –Fiscal Budget (%GDP) – – -9.67 – –

NUS RMI-CRI Quarterly Credit Report, Q2/2017 82
1990 2000 20100
50
100
1501Yr. PD
Non−Fin Fin
1990 2000 20100
500
1000
1500
2000SOFIX
1990 2000 20100
0.5
1
1.5
2
2.5USD/BGL
1990 2000 2010−2
0
2
4
6
8
3m Interbank
1990 2000 2010−10
−5
0
5
10
GDP
1990 2000 2010−200
0
200
400
600
PPI Money Supply
1990 2000 2010AAA
AA
A
BBB
BB
B
CCC
CCC
0
500
1000Moody’s S&P 5Y CDS
1990 2000 20100
10
20
30
40FDI
1990 2000 2010−6
−4
−2
0
2Fiscal Budget
Bulgaria 2016 2017Q2 Q3 Q4 Q1 Q2
1Yr. PD, Non-Fin. (bps) 19.04 17.63 15.00 13.68 8.951Yr. PD, Fin. 26.47 19.12 22.85 9.25 11.36SOFIX 455.6 504.6 586.4 634.0 703.5USD/BGL 1.76 1.74 1.86 1.84 1.713m Interbank (%) -0.04 -0.05 -0.07 -0.10 -0.08GDP (YoY%) – – 3.4 – –PPI (YoY%) -4.2 -2.4 0.6 2.1 2.7Money Supply (YoY%) 8.9 8.7 7.6 8.5 7.0Sov. Rating, Moody’s Baa2 Baa2 Baa2 Baa2 Baa2Sov. Rating, S&P BB+ BB+ BB+ BB+ BB+5Y CDS (bps) 162.71 142.88* – – –FDI (%GDP) – – 2.43 – –Fiscal Budget (%GDP) – – 0.00 – –
1990 2000 20100
500
1000
1500
20001Yr. PD
Non−Fin Fin
1990 2000 20100
0.5
1
1.5
2x 10
4 S&P/TSX Composite
1990 2000 20100.8
1
1.2
1.4
1.6
1.8USD/CAD
1990 2000 20100
2
4
6
8
10
12
3m Treas. 10Y Treas. 3m Interbank
1990 2000 2010−10
0
10
0
50
100GDP OECD CLI PMI
1990 2000 2010−10
−5
0
5
10
15
PPI Money Supply
1990 2000 2010AAA
AA
A
BBB
BB
B
CCC
CCC
Moody’s S&P
1990 2000 20100
2
4
6
8
10FDI
1990 2000 2010−6
−4
−2
0
2Fiscal Budget
Canada 2016 2017Q2 Q3 Q4 Q1 Q2
1Yr. PD, Non-Fin. (bps) 13.52 13.08 13.74 12.37 12.711Yr. PD, Fin. 5.11 3.98 3.61 2.40 2.26S&P/TSX Composite 14065 14726 15288 15548 15182USD/CAD 1.29 1.31 1.34 1.33 1.303m Treas. Yield (%) 0.49 0.53 0.46 0.55 0.7110Y Treas. Yield (%) 1.06 1.00 1.72 1.63 1.763m Interbank (%) 0.88 0.90 0.94 0.94 1.07GDP (YoY%) 1.1 1.5 2.0 2.3 –OECD CLI 99.36 99.76 100.20 100.45 100.49*PMI 54.7 68.1 49.4 67.6 63.9PPI (YoY%) -0.7 -0.3 2.3 5.2 3.3Money Supply (YoY%) 10.5 8.3 8.3 7.9 6.2Sov. Rating, Moody’s Aaa Aaa Aaa Aaa AaaSov. Rating, S&P AAA AAA AAA AAA AAAFDI (%GDP) – – 2.07 – –Fiscal Budget (%GDP) – – -0.05 – –

NUS RMI-CRI Quarterly Credit Report, Q2/2017 83
1990 2000 20100
10
20
30
401Yr. PD
Non−Fin Fin
1990 2000 20100
1000
2000
3000
4000
5000IPSA
1990 2000 2010200
300
400
500
600
700
800CLP/USD
1990 2000 20100
2
4
6
8
10
3m Treas. 10Y Treas. 3m Interbank
1990 2000 2010−5
0
5
10
40
45
50
55GDP OECD CLI
1990 2000 2010−10
0
10
20
30
40
50
Money Supply
1990 2000 2010AAA
AA
A
BBB
BB
B
CCC
CCC
0
100
200
300
400Moody’s S&P 5Y CDS
1990 2000 20100
2
4
6
8
10
12FDI
1990 2000 2010−1
0
1
2
3
4
5Fiscal Budget
Chile 2016 2017Q2 Q3 Q4 Q1 Q2
1Yr. PD, Non-Fin. (bps) 5.89 5.46 4.24 3.06 2.251Yr. PD, Fin. 7.95 7.29 4.82 4.84 3.90IPSA 3996 4015 4151 4783 4747CLP/USD 663.26 657.32 670.68 660.25 663.803m Treas. Yield (%) 3.73 3.61 3.35 3.09 3.0910Y Treas. Yield (%) 4.55 4.22 4.37 4.20 4.013m Interbank (%) 4.12 4.04 4.09 3.43 2.97GDP (YoY%) – – 1.6 – –OECD CLI 99.93 100.12 100.00 99.67 100.05*Money Supply (YoY%) 9.2 8.0 6.3 2.8 6.3Sov. Rating, Moody’s Aa3 Aa3 Aa3 Aa3 Aa3Sov. Rating, S&P A+ A+ A+ A+ A+5Y CDS (bps) 94.50 86.43 83.25 72.16 65.85FDI (%GDP) – – 4.95 – –
1990 2000 20100
100
200
300
400
500
6001Yr. PD
Non−Fin Fin
1990 2000 20100
1000
2000
3000
4000
5000
6000SSE Composite
1990 2000 20104
5
6
7
8
9USD/CNY
1990 2000 20100
2
4
6
8
3m Treas. 10Y Treas. 3m Interbank
1990 2000 20100
10
20
20
40
60GDP OECD CLI PMI
1990 2000 2010−10
0
10
20
30
PPI Money Supply
1990 2000 2010AAA
AA
A
BBB
BB
B
CCC
CCC
0
100
200
300Moody’s S&P 5Y CDS
1990 2000 20100
2
4
6
8FDI
1990 2000 2010−4
−3
−2
−1
0
1Fiscal Budget
China 2016 2017Q2 Q3 Q4 Q1 Q2
1Yr. PD, Non-Fin. (bps) 61.10 53.89 46.05 36.54 32.511Yr. PD, Fin. 61.28 50.06 45.42 36.88 31.40SSE Composite 2929.6 3004.7 3103.6 3222.5 3192.4USD/CNY 6.6 6.7 6.9 6.9 6.83m Treas. Yield (%) 2.63 2.63* – – –10Y Treas. Yield (%) 2.86 2.74 3.06 3.29 3.573m Interbank (%) 2.97 2.80 3.27 4.39 4.50GDP (YoY%) 6.7 6.7 6.8 6.9 6.9OECD CLI 99.11 99.05 99.00 99.10 99.38*PMI 50.0 50.4 51.4 51.8 51.7PPI (YoY%) -2.60 0.10 5.50 7.60 5.50Money Supply (YoY%) 11.80 11.50 11.30 10.60 9.40Sov. Rating, Moody’s A1 A1 A1 A1 A1Sov. Rating, S&P AA- AA- AA- AA- AA-5Y CDS (bps) 122.23 106.50 113.67 81.99 69.43FDI (%GDP) – – 1.52 – –

NUS RMI-CRI Quarterly Credit Report, Q2/2017 84
1990 2000 20100
50
100
150
200
250
3001Yr. PD
Non−Fin Fin
1990 2000 20100
1000
2000
3000
4000
5000
6000IGBC
1990 2000 2010500
1000
1500
2000
2500
3000
3500COP/USD
1990 2000 20100
10
20
30
40
10Y Treas. 3m Interbank
1990 2000 2010−5
0
5
10
GDP
1990 2000 2010−20
0
20
40
60
PPI Money Supply
1990 2000 2010AAA
AA
A
BBB
BB
B
CCC
CCC
0
200
400
600
800
1000Moody’s S&P 5Y CDS
1990 2000 20100
2
4
6
8FDI
1990 2000 2010−5
−4
−3
−2
−1
0Fiscal Budget
Colombia 2016 2017Q2 Q3 Q4 Q1 Q2
1Yr. PD, Non-Fin. (bps) 19.47 17.29 13.79 11.66 9.921Yr. PD, Fin. 30.10 25.55 27.43 33.34 23.72IGBC 3925 3939 3995 4097 4363COP/USD 2920.46 2881.30 3000.71 2873.98 3043.1110Y Treas. Yield (%) 7.59 7.00 7.11 6.65 6.423m Interbank (%) 6.95 6.97 5.46 6.22 5.85GDP (YoY%) – – 2.0 – –PPI (YoY%) 9.64 3.38 1.62 0.55 -0.84Sov. Rating, Moody’s Baa2 Baa2 Baa2 Baa2 Baa2Sov. Rating, S&P BBB BBB BBB BBB BBB5Y CDS (bps) 205.42 169.93 164.22 133.99 136.10FDI (%GDP) – – 4.81 – –Fiscal Budget (%GDP) – – -3.82 – –
1990 2000 20100
20
40
60
80
100
1201Yr. PD
Non−Fin Fin
1990 2000 20101000
2000
3000
4000
5000
6000CROBEX
1990 2000 20104
5
6
7
8
9USD/HRK
1990 2000 20100
2
4
6
8
10
12
3m Interbank
1990 2000 2010−10
−5
0
5
10
GDP
1990 2000 2010−20
0
20
40
60
80
PPI Money Supply
1990 2000 2010AAA
AA
A
BBB
BB
B
CCC
CCC
0
200
400
600Moody’s S&P 5Y CDS
1990 2000 20100
2
4
6
8FDI
1990 2000 2010−6
−4
−2
0
2Fiscal Budget
Croatia 2016 2017Q2 Q3 Q4 Q1 Q2
1Yr. PD, Non-Fin. (bps) 20.98 19.86 15.97 13.92 15.411Yr. PD, Fin. 19.79 16.34 17.43 19.99 26.18CROBEX 1676 1941 1995 1989 1866USD/HRK 7 7 7 7 63m Interbank (%) 0.55 0.61 0.57 0.33 0.36GDP (YoY%) – – 3.0 – –PPI (YoY%) -5.50 -3.20 0.00 1.20 0.30Money Supply (YoY%) 4.60 4.29 4.71 3.74 2.88Sov. Rating, Moody’s Ba2 Ba2 Ba2 Ba2 Ba2Sov. Rating, S&P BB BB BB BB BB5Y CDS (bps) 253.3 225.9 – – –Fiscal Budget (%GDP) – – 0.36 – –

NUS RMI-CRI Quarterly Credit Report, Q2/2017 85
1990 2000 20100
50
100
1501Yr. PD
Non−Fin Fin
1990 2000 20100
1000
2000
3000
4000
5000
6000CYSMMAPA
1990 2000 20100
1
2
3
4EUR/USD
1990 2000 2010−2
0
2
4
6
3m Interbank
1990 2000 2010−10
0
10
50
100
150GDP PMI
1990 2000 2010−5
0
5
10
15
PPI
1990 2000 2010AAA
AA
A
BBB
BB
B
CCC
CCC
0
1000
2000Moody’s S&P 5Y CDS
1990 2000 2010−50
0
50
100
150
200FDI
1990 2000 2010−10
−5
0
5Fiscal Budget
Cyprus 2016 2017Q2 Q3 Q4 Q1 Q2
1Yr. PD, Non-Fin. (bps) 36.22 30.57 31.33 26.29 27.061Yr. PD, Fin. 30.41 24.09 32.06 37.09 30.33CYSMMAPA 66 66 66 68 77EUR/USD 2.88 3.00 3.52 3.64 3.523m Interbank (%) -0.29 -0.30 -0.32 -0.33 -0.33GDP (YoY%) 2.8 2.9 2.9 3.3 –PMI 80.7 75.9 78.7 75.1 –PPI (YoY%) -0.8 0.1 0.2 0.0 1.0Sov. Rating, Moody’s Ba3 Ba3 Ba3 Ba3 Ba3Sov. Rating, S&P BB+ BB+ BB+ BB+ BB+FDI (%GDP) – – 25.15 – –Fiscal Budget (%GDP) – – 0.40 – –
1990 2000 20100
50
100
150
2001Yr. PD
Non−Fin Fin
1990 2000 20100
500
1000
1500
2000PX INDEX
1990 2000 201015
20
25
30
35
40
45USD/CZK
1990 2000 2010−10
0
10
20
30
40
3m Treas. 10Y Treas. 3m Interbank
1990 2000 2010−5
0
5
10
40
45
50
55GDP OECD CLI
1990 2000 20100
5
10
15
20
25
Money Supply
1990 2000 2010AAA
AA
A
BBB
BB
B
CCC
CCC
0
100
200
300
400Moody’s S&P 5Y CDS
1990 2000 20100
2
4
6
8
10
12FDI
1990 2000 2010−15
−10
−5
0
5Fiscal Budget
Czech Republic 2016 2017Q2 Q3 Q4 Q1 Q2
1Yr. PD, Non-Fin. (bps) 7.92 6.54 5.34 3.75 1.851Yr. PD, Fin. 17.58 13.32 10.42 10.89 7.13PX INDEX 816.9 863.6 921.6 981.1 980.4USD/CZK 24.39 24.04 25.70 25.38 22.863m Treas. Yield (%) -0.07 -0.72 -0.97 -0.89 -0.4110Y Treas. Yield (%) 0.46 0.29 0.55 1.00 0.963m Interbank (%) 0.29 0.29 0.28 0.28 0.30GDP (YoY%) – – 2.63 – –OECD CLI 99.96 99.63 99.64 99.54 99.46*Sov. Rating, Moody’s A1 A1 A1 A1 A1Sov. Rating, S&P AA- AA- AA- AA- AA-5Y CDS (bps) 43.34 – – – –FDI (%GDP) – – 3.37 – –Fiscal Budget (%GDP) – – 0.60 – –

NUS RMI-CRI Quarterly Credit Report, Q2/2017 86
1990 2000 20100
50
100
1501Yr. PD
Non−Fin Fin
1990 2000 20100
200
400
600
800
1000
1200OMX Copenhagen 20
1990 2000 20104
5
6
7
8
9USD/DKK
1990 2000 2010−5
0
5
10
15
20
3m Treas. 10Y Treas. 3m Interbank
1990 2000 2010−10
−8
−6
−4
−2
0
2
4
6
46
47
48
49
50
51
52
53
54GDP OECD CLI
1990 2000 2010−20
−10
0
10
20
30
PPI Money Supply
1990 2000 2010AAA
AA
A
BBB
BB
B
CCC
CCC
0
100
200Moody’s S&P 5Y CDS
1990 2000 2010−5
0
5
10
15
20
25FDI
1990 2000 2010−4
−2
0
2
4
6Fiscal Budget
Denmark 2016 2017Q2 Q3 Q4 Q1 Q2
1Yr. PD, Non-Fin. (bps) 18.42 15.10 14.25 9.31 10.381Yr. PD, Fin. 46.86 38.13 27.94 22.86 21.63OMX Copenhagen 20 958 897 884 916 988USD/DKK 6.70 6.63 7.07 6.98 6.513m Treas. Yield (%) -0.50* -0.66 -0.79 -0.69 -0.6810Y Treas. Yield (%) 0.09 0.01 0.33 0.60 0.673m Interbank (%) -0.21 -0.19 -0.23 -0.26 -0.24GDP (YoY%) 0.9 2.0 2.9 2.6 –OECD CLI 99.47 99.75 100.16 100.42 100.50*Sov. Rating, Moody’s Aaa Aaa Aaa Aaa AaaSov. Rating, S&P AAA AAA AAA AAA AAA5Y CDS (bps) 23.16 23.69 22.69 17.04 18.35FDI (%GDP) – – 0.15 – –Fiscal Budget (%GDP) – – -0.90 – –
1990 2000 20100
20
40
60
801Yr. PD
Non−Fin Fin
1990 2000 2010500
1000
1500
2000EGX 100
1990 2000 20100
5
10
15
20USD/EGP
1990 2000 20105
10
15
20
25
3m Treas. 10Y Treas.
1990 2000 20100
1
2
3
4
5
6
7
8
40
42
44
46
48
50
52
54
56GDP PMI
1990 2000 20100
50
100
150
200
250
300
PPI Money Supply
1990 2000 2010AAA
AA
A
BBB
BB
B
CCC
CCC
0
200
400
600
800Moody’s S&P 5Y CDS
1990 2000 2010−2
0
2
4
6
8
10FDI
Egypt 2016 2017Q2 Q3 Q4 Q1 Q2
1Yr. PD, Non-Fin. (bps) 19.59 17.06 44.41 28.55 20.511Yr. PD, Fin. 47.12 33.10 66.26 45.00 33.33EGX 100 743.7 790.3 1096.0 1327.7 1509.2USD/EGP 8.88 8.88 18.13 18.17 18.133m Treas. Yield (%) 13.96 14.78 19.04 19.38 20.3810Y Treas. Yield (%) 17.30 17.40* 17.40 17.40 17.40GDP (YoY%) – – 4.3 – –PMI 47.5 46.3 42.8 45.9 47.2PPI (YoY%) 216.0 225.5 257.9 – –Money Supply (YoY%) 18.6 18.0 39.0 38.0 39.4Sov. Rating, Moody’s B3 B3 B3 B3 B3Sov. Rating, S&P B- B- B- B- B-

NUS RMI-CRI Quarterly Credit Report, Q2/2017 87
1990 2000 20100
100
200
300
4001Yr. PD
Non−Fin Fin
1990 2000 20100
200
400
600
800
1000
1200OMX Tallinn Index
1990 2000 20100.8
1
1.2
1.4
1.6EUR/USD
1990 2000 20100
5
10
15
20
3m Interbank
1990 2000 2010−20
−10
0
10
20
46
48
50
52
54GDP OECD CLI
1990 2000 2010−5
0
5
10
PPI
1990 2000 2010AAA
AA
A
BBB
BB
B
CCC
CCC
0
500
1000Moody’s S&P 5Y CDS
1990 2000 2010−5
0
5
10
15
20
25FDI
1990 2000 2010−4
−2
0
2
4Fiscal Budget
Estonia 2016 2017Q2 Q3 Q4 Q1 Q2
1Yr. PD, Non-Fin. (bps) 1.98 2.91 1.76 1.79 1.641Yr. PD, Fin. 13.88 20.91 16.59 24.42 10.04OMX Tallinn Index 985.6 1001.3 1075.5 1122.2 1137.1EUR/USD 1.11 1.12 1.05 1.07 1.14GDP (YoY%) 0.8 1.8 2.8 4.0 –OECD CLI 100.37 100.61 100.63 100.58 100.47*PPI (YoY%) -1.4 -0.9 2.5 3.1 3.3Sov. Rating, Moody’s A1 A1 A1 A1 A1Sov. Rating, S&P AA- AA- AA- AA- AA-5Y CDS (bps) 64.12 65.66* – – –FDI (%GDP) – – 3.09 – –Fiscal Budget (%GDP) – – 0.30 – –
1990 2000 20100
100
200
300
4001Yr. PD
Non−Fin Fin
1990 2000 20100
0.5
1
1.5
2x 10
4 OMX Helsinki
1990 2000 20100.8
1
1.2
1.4
1.6
1.8EUR/USD
1990 2000 20100
2
4
6
8
10Y Treas.
1990 2000 2010−10
−5
0
5
10
40
45
50
55
60GDP OECD CLI
1990 2000 2010−10
−5
0
5
10
PPI
1990 2000 2010AAA
AA
A
BBB
BB
B
CCC
CCC
0
50
100Moody’s S&P 5Y CDS
1990 2000 2010−5
0
5
10
15FDI
1990 2000 2010−10
−5
0
5
10Fiscal Budget
Finland 2016 2017Q2 Q3 Q4 Q1 Q2
1Yr. PD, Non-Fin. (bps) 7.26 5.67 4.86 3.81 3.121Yr. PD, Fin. 9.73 7.32 8.18 4.96 5.54OMX Helsinki 7904 8626 8902 9165 9568EUR/USD 1.11 1.12 1.05 1.07 1.1410Y Treas. Yield (%) 0.15 0.03 0.35 0.45 0.50GDP (YoY%) 1.1 2.3 2.3 2.8 –OECD CLI 100.17 100.69 101.20 101.38 101.42*PPI (YoY%) -3.4 -1.4 2.4 4.7 3.2Sov. Rating, Moody’s Aa1 Aa1 Aa1 Aa1 Aa1Sov. Rating, S&P AA+ AA+ AA+ AA+ AA+5Y CDS (bps) – – 24.1 – –FDI (%GDP) – – -4.03 – –Fiscal Budget (%GDP) – – -1.90 – –

NUS RMI-CRI Quarterly Credit Report, Q2/2017 88
1990 2000 20100
50
100
1501Yr. PD
Non−Fin Fin
1990 2000 20101000
2000
3000
4000
5000
6000
7000CAC−40
1990 2000 20100.8
1
1.2
1.4
1.6EUR/USD
1990 2000 2010−5
0
5
10
15
3m Treas. 10Y Treas.
1990 2000 2010−4
−2
0
2
4
6
46
48
50
52
54
56GDP OECD CLI PMI
1990 2000 2010−10
−5
0
5
10
15
PPI Money Supply
1990 2000 2010AAA
AA
A
BBB
BB
B
CCC
CCC
0
50
100
150
200
250Moody’s S&P 5Y CDS
1990 2000 2010−1
0
1
2
3
4FDI
1990 2000 2010−8
−6
−4
−2
0Fiscal Budget
France 2016 2017Q2 Q3 Q4 Q1 Q2
1Yr. PD, Non-Fin. (bps) 8.52 7.02 6.70 5.23 4.781Yr. PD, Fin. 6.29 4.93 5.66 4.79 2.74CAC-40 4237 4448 4862 5123 5121EUR/USD 1.11 1.12 1.05 1.07 1.143m Treas. Yield (%) -0.57 -0.69 -0.90 -0.57 -0.6010Y Treas. Yield (%) 0.18 0.19 0.69 0.97 0.81GDP (YoY%) 1.2 0.9 1.2 1.1 1.8OECD CLI 99.96 99.95 100.19 100.45 100.72*PMI 48.3 49.7 53.5 53.3 54.8PPI (YoY%) -3.1 -1.5 1.6 2.9 1.4Money Supply (YoY%) 5.0 5.1 5.2 5.3 5.1Sov. Rating, Moody’s Aa2 Aa2 Aa2 Aa2 Aa2Sov. Rating, S&P AA AA AA AA AA5Y CDS (bps) 50.5 29.2 37.0 50.4 21.8FDI (%GDP) – – 1.72 – –Fiscal Budget (%GDP) – – -3.40 – –
1990 2000 20100
20
40
60
80
1001Yr. PD
Non−Fin Fin
1990 2000 20100
200
400
600
800
1000
1200CDAX Performance
1990 2000 20100.8
1
1.2
1.4
1.6EUR/USD
1990 2000 2010−2
0
2
4
6
8
10
3m Treas. 10Y Treas.
1990 2000 2010−10
−5
0
5
10
40
45
50
55
60GDP OECD CLI PMI
1990 2000 2010−10
−5
0
5
10
15
PPI Money Supply
1990 2000 2010AAA
AA
A
BBB
BB
B
CCC
CCC
0
100
200Moody’s S&P 5Y CDS
1990 2000 2010−5
0
5
10
15FDI
1990 2000 2010−10
−8
−6
−4
−2
0
2Fiscal Budget
Germany 2016 2017Q2 Q3 Q4 Q1 Q2
1Yr. PD, Non-Fin. (bps) 10.11 8.38 7.96 5.89 4.731Yr. PD, Fin. 12.38 10.33 10.25 7.95 6.83CDAX Performance 893 971 1043 1121 1132EUR/USD 1.11 1.12 1.05 1.07 1.143m Treas. Yield (%) -0.66 -0.76 -0.85 -0.82 -0.8210Y Treas. Yield (%) -0.13 -0.12 0.21 0.33 0.47GDP (YoY%) 1.8 1.7 1.8 1.7 –OECD CLI 99.42 99.75 100.18 100.55 100.79*PMI 54.5 54.3 55.6 58.3 59.6PPI (YoY%) -2.2 -1.4 1.0 3.1 2.4Money Supply (YoY%) 5.0 5.1 5.2 5.3 5.1Sov. Rating, Moody’s Aaa Aaa Aaa Aaa AaaSov. Rating, S&P AAA AAA AAA AAA AAA5Y CDS (bps) 22.27 19.18 21.78 17.15 15.49FDI (%GDP) – – 1.51 – –Fiscal Budget (%GDP) – – 0.80 – –

NUS RMI-CRI Quarterly Credit Report, Q2/2017 89
1990 2000 20100
50
100
150
2001Yr. PD
Non−Fin Fin
1990 2000 20100
1000
2000
3000
4000
5000
6000Athex Composite
1990 2000 20100.5
1
1.5
2
2.5EUR/USD
1990 2000 20100
10
20
30
40
3m Treas. 10Y Treas.
1990 2000 2010−15
−10
−5
0
5
10
30
35
40
45
50
55GDP OECD CLI PMI
1990 2000 2010−20
−10
0
10
20
30
PPI
1990 2000 2010AAA
AA
A
BBB
BB
B
CCC
CCC
0
5000
10000Moody’s S&P 5Y CDS
1990 2000 2010−0.5
0
0.5
1
1.5
2FDI
1990 2000 2010−20
−15
−10
−5
0
5Fiscal Budget
Greece 2016 2017Q2 Q3 Q4 Q1 Q2
1Yr. PD, Non-Fin. (bps) 56.45 50.70 47.02 36.02 23.841Yr. PD, Fin. 35.56 38.83 32.12 32.93 19.59Athex Composite 542 566 644 666 824EUR/USD 1 1 1 1 13m Treas. Yield (%) 3.38 3.34 2.59 2.43* –10Y Treas. Yield (%) 8.29 8.28 7.11 6.99 5.42GDP (YoY%) -0.4 2.1 -1.0 0.4 –OECD CLI 101.65 100.85 99.87 99.69 99.91*PMI 50.4 49.2 49.3 46.7 50.5PPI (YoY%) -7.3 -3.2 3.0 6.0 1.2Sov. Rating, Moody’s Caa2 Caa2 Caa2 Caa2 Caa2Sov. Rating, S&P B- B- B- B- B-FDI (%GDP) – – 1.58 – –Fiscal Budget (%GDP) – – 0.70 – –
1990 2000 20100
100
200
300
4001Yr. PD
Non−Fin Fin
1990 2000 20100
1
2
3
4x 10
4 Hang Seng
1990 2000 20107.7
7.75
7.8
7.85USD/HKD
1990 2000 20100
5
10
15
20
3m Treas. 10Y Treas. 3m Interbank
1990 2000 2010−10
0
10
20
40
45
50
55GDP PMI
1990 2000 2010−20
−10
0
10
20
30
40
PPI Money Supply
1990 2000 2010AAA
AA
A
BBB
BB
B
CCC
CCC
0
50
100
150Moody’s S&P 5Y CDS
1990 2000 20100
10
20
30
40
50
60FDI
1990 2000 2010−10
−5
0
5
10Fiscal Budget
Hong Kong 2016 2017Q2 Q3 Q4 Q1 Q2
1Yr. PD, Non-Fin. (bps) 16.75 8.99 8.65 6.54 5.961Yr. PD, Fin. 20.28 10.89 8.65 6.17 6.83Hang Seng 20794 23297 22001 24112 25765USD/HKD 7.76 7.76 7.76 7.77 7.813m Treas. Yield (%) 0.10* – 0.33* – –10Y Treas. Yield (%) 1.02 1.06 1.97 1.67 1.493m Interbank (%) 0.57 0.59 1.02 0.94 0.78GDP (YoY%) 1.8 2.0 3.2 4.3 –PMI 45.4 49.3 50.3 49.9 51.1Money Supply (YoY%) 2.1 7.8 8.9 13.7 15.9Sov. Rating, Moody’s Aa2 Aa2 Aa2 Aa2 Aa2Sov. Rating, S&P AAA AAA AAA AAA AAAFDI (%GDP) – – 36.49 – –Fiscal Budget (%GDP) – – 3.26 – –

NUS RMI-CRI Quarterly Credit Report, Q2/2017 90
1990 2000 20100
50
100
150
2001Yr. PD
Non−Fin Fin
1990 2000 20100
1
2
3
4x 10
4 BUX
1990 2000 201050
100
150
200
250
300
350USD/HUF
1990 2000 20100
5
10
15
10Y Treas. 3m Interbank
1990 2000 2010−10
−5
0
5
10
30
40
50
60
70GDP OECD CLI PMI
1990 2000 2010−10
0
10
20
30
40
PPI Money Supply
1990 2000 2010AAA
AA
A
BBB
BB
B
CCC
CCC
0
500
1000Moody’s S&P 5Y CDS
1990 2000 2010−20
0
20
40
60FDI
1990 2000 2010−10
−8
−6
−4
−2
0Fiscal Budget
Hungary 2016 2017Q2 Q3 Q4 Q1 Q2
1Yr. PD, Non-Fin. (bps) 32.83 26.21 31.25 19.16 10.191Yr. PD, Fin. 25.68 18.98 16.64 14.73 7.53BUX 26325.6 27664.3 32003.0 31634.3 35205.4USD/HUF 284.23 274.35 294.36 289.83 270.2910Y Treas. Yield (%) 3.03 2.88 3.16 3.25 3.083m Interbank (%) 0.76 0.59 0.21 0.05 0.01GDP (YoY%) 2.8 2.2 1.6 4.2 –OECD CLI 99.48 99.34 99.93 100.88 101.40*PMI 50.9 57.2 52.8 55.9 56.9PPI (YoY%) -2.6 -2.6 0.5 4.2 1.5Money Supply (YoY%) 5.36 4.20 6.81 7.67 10.11Sov. Rating, Moody’s Ba1 Ba1 Ba1 Ba1 Ba1Sov. Rating, S&P BBB- BBB- BBB- BBB- BBB-5Y CDS (bps) 158.69 115.11 – – –FDI (%GDP) – – -7.27 – –Fiscal Budget (%GDP) – – -1.80 – –
1990 2000 20100
500
1000
15001Yr. PD
Non−Fin Fin
1990 2000 20100
2000
4000
6000
8000OMX Iceland All Share
1990 2000 201050
100
150USD/ISK
1990 2000 20100
5
10
15
20
3m Interbank
1990 2000 2010−10
−5
0
5
10
15
GDP
1990 2000 2010−20
0
20
40
60
80
PPI Money Supply
1990 2000 2010AAA
AA
A
BBB
BB
B
CCC
CCC
140
150
160
170Moody’s S&P 5Y CDS
1990 2000 2010−10
−5
0
5
10
15
20FDI
1990 2000 2010−15
−10
−5
0
5
10Fiscal Budget
Iceland 2016 2017Q2 Q3 Q4 Q1 Q2
1Yr. PD, Non-Fin. (bps) 4.70 5.30 6.92 4.47 3.211Yr. PD, Fin. 9.65 6.62 4.49 3.31 4.42OMX Iceland All Share 1245 1209 1232 1291 1347USD/ISK 123.18 113.82 113.34 113.49 101.813m Interbank (%) 6.55 5.95 5.60 5.50 4.90GDP (YoY%) 3.5 9.6 11.3 5.0 –PPI (YoY%) -9.3 -5.5 -6.1 -7.1 -10.2Money Supply (YoY%) -6.98 -8.41 -4.64 7.55 5.32Sov. Rating, Moody’s A3 A3 A3 A3 A3Sov. Rating, S&P A A A A AFDI (%GDP) – – -5.88 – –Fiscal Budget (%GDP) – – 0.29 – –

NUS RMI-CRI Quarterly Credit Report, Q2/2017 91
1990 2000 20100
50
100
150
200
250
3001Yr. PD
Non−Fin Fin
1990 2000 20100
1
2
3
4x 10
4 SENSEX
1990 2000 201010
20
30
40
50
60
70USD/INR
1990 2000 20100
5
10
15
3m Treas. 10Y Treas. 3m Interbank
1990 2000 20100
5
10
15
45
50
55
60GDP OECD CLI PMI
1990 2000 2010−10
0
10
20
30
PPI Money Supply
1990 2000 2010AAA
AA
A
BBB
BB
B
CCC
CCC
Moody’s S&P
1990 2000 20100
1
2
3
4FDI
1990 2000 2010−10
−8
−6
−4
−2
0Fiscal Budget
India 2016 2017Q2 Q3 Q4 Q1 Q2
1Yr. PD, Non-Fin. (bps) 21.77 19.00 13.03 12.21 13.411Yr. PD, Fin. 25.96 22.83 23.29 25.64 24.56SENSEX 27000 27866 26626 29621 30922USD/INR 67.53 66.61 67.92 64.85 64.583m Treas. Yield (%) 6.65 6.42 6.20 5.78 6.2910Y Treas. Yield (%) 7.45 6.82 6.51 6.68 6.513m Interbank (%) 6.75 7.04 5.36 6.14 6.47OECD CLI 100.05 99.86 99.62 99.53 99.56*PMI 51.7 52.1 49.6 52.5 50.9PPI (YoY%) -0.1 1.4 2.1 5.1 0.9Money Supply (YoY%) 10.30 12.10 6.50 7.30 7.40Sov. Rating, Moody’s Baa3 Baa3 Baa3 Baa3 Baa3Sov. Rating, S&P BBB- BBB- BBB- BBB- BBB-Fiscal Budget (%GDP) – – -3.70 – –
1990 2000 20100
200
400
600
800
1000
12001Yr. PD
Non−Fin Fin
1990 2000 20100
1000
2000
3000
4000
5000
6000Jakarta Composite
1990 2000 20100
5000
10000
15000USD/IDR
1990 2000 20100
10
20
30
40
50
60
10Y Treas. 3m Interbank
1990 2000 2010−20
0
20
20
40
60GDP OECD CLI PMI
1990 2000 20100
20
40
60
80
100
PPI Money Supply
1990 2000 2010AAA
AA
A
BBB
BB
B
CCC
CCC
0
500
1000
1500Moody’s S&P 5Y CDS
1990 2000 2010−3
−2
−1
0
1
2
3FDI
1990 2000 2010−4
−2
0
2
4Fiscal Budget
Indonesia 2016 2017Q2 Q3 Q4 Q1 Q2
1Yr. PD, Non-Fin. (bps) 18.86 16.69 16.85 14.36 16.181Yr. PD, Fin. 24.39 22.06 25.11 29.09 25.73Jakarta Composite 5017 5365 5297 5568 5830USD/IDR 13210.00 13042.00 13473.00 13322.00 13348.0010Y Treas. Yield (%) 7.45 7.06 7.97 7.04 6.833m Interbank (%) 7.23 7.10 7.46 6.87 7.01GDP (YoY%) 5.1 5.0 5.0 5.0 –OECD CLI 99.24 99.61 99.97 100.55 100.86*PMI 51.9 50.9 49.0 50.5 49.5PPI (YoY%) 11.54 10.96 8.65 6.77 2.47Money Supply (YoY%) 8.69 5.08 10.03 9.99 11.43Sov. Rating, Moody’s Baa3 Baa3 Baa3 Baa3 Baa3Sov. Rating, S&P BBB- BBB- BBB- BBB- BBB-5Y CDS (bps) 185.2 152.1 157.9 127.5 117.4FDI (%GDP) – – 0.40 – –

NUS RMI-CRI Quarterly Credit Report, Q2/2017 92
1990 2000 20100
100
200
300
400
5001Yr. PD
Non−Fin Fin
1990 2000 20100
2000
4000
6000
8000
10000ISEQ
1990 2000 20100.8
1
1.2
1.4
1.6EUR/USD
1990 2000 20100
2
4
6
8
10
12
10Y Treas.
1990 2000 2010−10
0
10
20
30
40
45
50
55
60GDP OECD CLI PMI
1990 2000 2010−5
0
5
10
15
PPI Money Supply
1990 2000 2010AAA
AA
A
BBB
BB
B
CCC
CCC
0
500
1000
1500Moody’s S&P 5Y CDS
1990 2000 2010−20
0
20
40
60
80FDI
1990 2000 2010−40
−30
−20
−10
0
10Fiscal Budget
Ireland 2016 2017Q2 Q3 Q4 Q1 Q2
1Yr. PD, Non-Fin. (bps) 9.24 7.86 8.73 7.68 6.241Yr. PD, Fin. 19.37 10.20 10.78 7.03 5.80ISEQ 5642 6035 6517 6659 6828EUR/USD 1.11 1.12 1.05 1.07 1.1410Y Treas. Yield (%) 0.52 0.33 0.75 1.00 0.90GDP (YoY%) 5.5 3.2 8.9 6.6 –OECD CLI 99.07 99.57 100.56 100.74 100.37*PMI 53.0 51.3 55.7 53.6 56.0PPI (YoY%) -0.4 -0.7 0.2 1.8 2.0Money Supply (YoY%) 5.0 5.1 5.2 5.3 5.1Sov. Rating, Moody’s A3 A3 A3 A3 A3Sov. Rating, S&P A+ A+ A+ A+ A+5Y CDS (bps) 64.71* – 63.75 50.86 39.71*FDI (%GDP) – – 26.92 – –Fiscal Budget (%GDP) – – -0.60 – –
1990 2000 20100
50
100
1501Yr. PD
Non−Fin Fin
1990 2000 20100
500
1000
1500Tel Aviv 100
1990 2000 20101
2
3
4
5USD/ILS
1990 2000 20100
2
4
6
8
10
10Y Treas. 3m Interbank
1990 2000 2010−5
0
5
10
15
20
20
30
40
50
60
70GDP OECD CLI PMI
1990 2000 2010−20
0
20
40
60
Money Supply
1990 2000 2010AAA
AA
A
BBB
BB
B
CCC
CCC
0
100
200
300Moody’s S&P 5Y CDS
1990 2000 20100
2
4
6
8
10FDI
Israel 2016 2017Q2 Q3 Q4 Q1 Q2
1Yr. PD, Non-Fin. (bps) 10.44 8.18 7.97 6.29 6.621Yr. PD, Fin. 12.58 9.55 9.41 9.70 9.49Tel Aviv 100 1211 1262 1282 1252 1289USD/ILS 3.86 3.76 3.84 3.62 3.5010Y Treas. Yield (%) 1.63 1.73 2.06 2.36 2.13*3m Interbank (%) 0.08 0.10 0.10 0.10 0.10GDP (YoY%) 4.1 4.6 4.7 3.9 –OECD CLI 99.65 99.73 100.02 100.39 100.52*PMI 48.8 52.1 67.2 54.8 50.3Sov. Rating, Moody’s A1 A1 A1 A1 A1Sov. Rating, S&P A+ A+ A+ A+ A+5Y CDS (bps) 75.72* – – – –FDI (%GDP) – – 3.87 – –

NUS RMI-CRI Quarterly Credit Report, Q2/2017 93
1990 2000 20100
50
100
1501Yr. PD
Non−Fin Fin
1990 2000 20100
500
1000
1500
2000
2500Comit Globale
1990 2000 20100.8
1
1.2
1.4
1.6
1.8
2EUR/USD
1990 2000 2010−5
0
5
10
15
3m Treas. 10Y Treas.
1990 2000 2010−10
−5
0
5
45
50
55
60GDP OECD CLI PMI
1990 2000 2010−10
−5
0
5
10
15
PPI Money Supply
1990 2000 2010AAA
AA
A
BBB
BB
B
CCC
CCC
0
200
400
600Moody’s S&P 5Y CDS
1990 2000 2010−1
0
1
2
3FDI
1990 2000 2010−8
−6
−4
−2
0Fiscal Budget
Italy 2016 2017Q2 Q3 Q4 Q1 Q2
1Yr. PD, Non-Fin. (bps) 15.08 14.06 12.48 6.79 6.211Yr. PD, Fin. 40.78 37.40 26.91 15.45 15.71Comit Globale 949 965 1124 1208 1219EUR/USD 1.11 1.12 1.05 1.07 1.143m Treas. Yield (%) -0.28 -0.39 -0.46 -0.33 -0.3810Y Treas. Yield (%) 1.26 1.19 1.81 2.32 2.16GDP (YoY%) 0.8 1.0 1.1 1.2 –OECD CLI 100.45 100.25 100.25 100.12 99.96*PMI 53.5 51.0 53.2 55.7 55.2PPI (YoY%) -3.4 -0.8 0.9 3.3 3.1Money Supply (YoY%) 5.00 5.10 5.20 5.30 5.10Sov. Rating, Moody’s Baa2 Baa2 Baa2 Baa2 Baa2Sov. Rating, S&P BBB- BBB- BBB- BBB- BBB-5Y CDS (bps) 152.05 150.82 157.22 170.09 145.62FDI (%GDP) – – 1.50 – –Fiscal Budget (%GDP) – – -2.40 – –
1990 2000 20100
20
40
60
801Yr. PD
Non−Fin Fin
1990 2000 20100
0.5
1
1.5
2
2.5x 10
5 Jamaica
1990 2000 20100
50
100
150JMD/USD
1990 2000 20105
10
15
20
25
30
3m Treas. 10Y Treas.
1990 2000 2010−4
−2
0
2
4
GDP
1990 2000 2010AAA
AA
A
BBB
BB
B
CCC
CCC
Moody’s S&P
1990 2000 20100
2
4
6
8
10
12FDI
Jamaica 2016 2017Q2 Q3 Q4 Q1 Q2
1Yr. PD, Non-Fin. (bps) 11.36 10.55 13.32 13.58 10.751Yr. PD, Fin. 30.31 23.77 19.40 11.43 14.55Jamaica 159717 164474 192274 223834 235043JMD/USD 126.55 127.58 128.85 128.13 128.343m Treas. Yield (%) 5.86 5.86 5.68 6.13 5.7710Y Treas. Yield (%) 6.35 5.45 5.84 5.38 5.00GDP (YoY%) – – 1.5 – –Sov. Rating, Moody’s B3 B3 B3 B3 B3Sov. Rating, S&P B B B B BFDI (%GDP) – – 5.64 – –

NUS RMI-CRI Quarterly Credit Report, Q2/2017 94
1990 2000 20100
50
100
1501Yr. PD
Non−Fin Fin
1990 2000 2010500
1000
1500
2000
2500NIKKEI 500
1990 2000 201060
80
100
120
140
160USD/JPY
1990 2000 2010−2
0
2
4
6
8
10
3m Treas. 10Y Treas. 3m Interbank
1990 2000 2010−10
−5
0
5
10
46
48
50
52
54GDP OECD CLI PMI
1990 2000 2010−1
0
1
2
3
4
5
Money Supply
1990 2000 2010AAA
AA
A
BBB
BB
B
CCC
CCC
0
50
100
150
200Moody’s S&P 5Y CDS
1990 2000 2010−0.2
0
0.2
0.4
0.6
0.8FDI
1990 2000 2010−15
−10
−5
0
5Fiscal Budget
Japan 2016 2017Q2 Q3 Q4 Q1 Q2
1Yr. PD, Non-Fin. (bps) 3.40 2.10 1.74 1.43 1.231Yr. PD, Fin. 11.33 8.81 7.31 7.74 6.32NIKKEI 500 1513 1572 1744 1760 1910USD/JPY 103.20 101.35 116.96 111.39 112.393m Treas. Yield (%) -0.27 -0.40 -0.39 -0.20 -0.1010Y Treas. Yield (%) -0.22 -0.09 0.05 0.07 0.093m Interbank (%) 0.06 0.06 0.06 0.06 0.06GDP (YoY%) 0.9 1.0 1.6 1.3 –OECD CLI 99.58 99.70 99.95 100.08 100.15*PMI 48.1 50.4 52.4 52.4 52.4Money Supply (YoY%) 2.90 3.00 3.40 3.50 3.30Sov. Rating, Moody’s A1 A1 A1 A1 A1Sov. Rating, S&P A+ A+ A+ A+ A+FDI (%GDP) – – 0.71 – –Fiscal Budget (%GDP) – – -5.67 – –
1990 2000 20100
10
20
30
401Yr. PD
Non−Fin Fin
1990 2000 20100
200
400
600
800MSCI Jordan
1990 2000 20100.64
0.66
0.68
0.7
0.72USD/JOD
1990 2000 20103
4
5
6
7
8
3m Interbank
1990 2000 2010−2
0
2
4
6
8
10
GDP
1990 2000 2010−5
0
5
10
15
20
25
Money Supply
1990 2000 2010AAA
AA
A
BBB
BB
B
CCC
CCC
Moody’s S&P
1990 2000 2010−5
0
5
10
15
20
25FDI
Jordan 2016 2017Q2 Q3 Q4 Q1 Q2
1Yr. PD, Non-Fin. (bps) 12.41 12.69 12.09 13.94 13.601Yr. PD, Fin. 8.85 8.71 8.22 6.95 6.76MSCI Jordan 166 163 172 182 172USD/JOD 0.71 0.71 0.71 0.71 0.713m Interbank (%) 4.36 4.36 4.57 5.32 5.59GDP (YoY%) 2.1 2.0 2.1 2.3 –Money Supply (YoY%) 4.58 4.94 4.02 -0.16 0.82*Sov. Rating, Moody’s B1 B1 B1 B1 B1Sov. Rating, S&P BB- BB- BB- BB- BB-

NUS RMI-CRI Quarterly Credit Report, Q2/2017 95
1990 2000 20100
200
400
600
8001Yr. PD
Non−Fin Fin
1990 2000 20100
500
1000
1500
2000
2500
3000KASE
1990 2000 20100
100
200
300
400USD/KZT
1990 2000 20100
5
10
15
20
25
10Y Treas. 3m Interbank
1990 2000 2010−15
−10
−5
0
5
10
15
GDP
1990 2000 2010−50
0
50
100
150
PPI Money Supply
1990 2000 2010AAA
AA
A
BBB
BB
B
CCC
CCC
0
500
1000
1500
2000Moody’s S&P 5Y CDS
1990 2000 20100
5
10
15FDI
Kazakhstan 2016 2017Q2 Q3 Q4 Q1 Q2
1Yr. PD, Non-Fin. (bps) 7.60 7.02 3.75 2.83 1.841Yr. PD, Fin. 78.44 68.42 91.52 108.87 83.92KASE 985 1191 1358 1554 1660USD/KZT 339.18 335.84 333.69 313.65 322.1810Y Treas. Yield (%) – – – 9.40 –3m Interbank (%) 15.92 14.00 13.00 12.00 11.50GDP (YoY%) – – 1.1 – –PPI (YoY%) 18.7 26.1 15.5 26.7 9.6Money Supply (YoY%) 25.17 32.54 46.39 30.68 27.50Sov. Rating, S&P BBB- BBB- BBB- BBB- BBB-
1990 2000 20100
50
100
1501Yr. PD
Non−Fin Fin
1990 2000 20100
0.5
1
1.5
2x 10
4Kuwait Stock Exchange
1990 2000 20100.26
0.27
0.28
0.29
0.3
0.31USD/KWD
1990 2000 20100
2
4
6
8
3m Treas. 3m Interbank
1990 2000 2010−60
−40
−20
0
20
40
60
GDP
1990 2000 2010−10
0
10
20
30
Money Supply
1990 2000 2010AAA
AA
A
BBB
BB
B
CCC
CCC
Moody’s S&P
1990 2000 2010−0.5
0
0.5
1
1.5
2
2.5FDI
Kuwait 2016 2017Q2 Q3 Q4 Q1 Q2
1Yr. PD, Non-Fin. (bps) 11.64 14.50 15.76 11.65 13.891Yr. PD, Fin. 29.07 27.71 23.53 21.54 21.17Kuwait Stock Exchange 5365 5398 5748 7029 6763USD/KWD 0.30 0.30 0.31 0.30 0.303m Treas. Yield (%) 1.50 1.56 1.44 1.56 1.75Money Supply (YoY%) 1.67 2.56 3.50 0.66 0.33*Sov. Rating, Moody’s Aa2 Aa2 Aa2 Aa2 Aa2Sov. Rating, S&P AA AA AA AA AA

NUS RMI-CRI Quarterly Credit Report, Q2/2017 96
1990 2000 20100
500
1000
15001Yr. PD
Non−Fin Fin
1990 2000 20100
200
400
600
800
1000OMX Riga
1990 2000 20100.4
0.5
0.6
0.7
0.8USD/LVL
1990 2000 20100
5
10
15
10Y Treas. 3m Interbank
1990 2000 2010−20
−10
0
10
20
GDP
1990 2000 2010−50
0
50
100
150
Money Supply
1990 2000 2010AAA
AA
A
BBB
BB
B
CCC
CCC
0
500
1000
1500Moody’s S&P 5Y CDS
1990 2000 2010−2
0
2
4
6
8
10FDI
1990 2000 2010−4
−3
−2
−1
0
1Fiscal Budget
Latvia 2016 2017Q2 Q3 Q4 Q1 Q2
1Yr. PD, Non-Fin. (bps) 8.39 6.76 9.78 6.74 5.42OMX Riga 621 709 734 770 970USD/LVL 0.63 0.63 0.67 0.66 0.62GDP (YoY%) 2.3 0.5 2.6 4.0 4.1Sov. Rating, Moody’s A3 A3 A3 A3 A3Sov. Rating, S&P A- A- A- A- A-5Y CDS (bps) 81.82 – – – –FDI (%GDP) – – 0.64 – –
1990 2000 20100
200
400
600
800
1000
12001Yr. PD
Non−Fin Fin
1990 2000 20100
100
200
300
400
500
600OMX Vilnius
1990 2000 20102
2.5
3
3.5
4
4.5USD/LTL
1990 2000 20100
5
10
15
20
25
10Y Treas. 3m Interbank
1990 2000 2010−20
−10
0
10
20
GDP
1990 2000 2010−100
−50
0
50
100
150
PPI Money Supply
1990 2000 2010AAA
AA
A
BBB
BB
B
CCC
CCC
0
200
400
600
800
1000Moody’s S&P 5Y CDS
1990 2000 20100
2
4
6
8
10FDI
Lithuania 2016 2017Q2 Q3 Q4 Q1 Q2
1Yr. PD, Non-Fin. (bps) 10.41 13.98 18.87 12.84 4.681Yr. PD, Fin. 5.94 4.75 3.64 2.36 2.54OMX Vilnius 511 544 558 565 597USD/LTL 3.11 3.07 3.28 3.24 3.0210Y Treas. Yield (%) 0.79 – – – 1.15GDP (YoY%) 1.8 1.6 3.4 4.1 3.9PPI (YoY%) -6.9 -0.6 5.5 8.2 1.2Money Supply (YoY%) 5.10 6.60 7.30 8.00 –Sov. Rating, Moody’s A3 A3 A3 A3 A3Sov. Rating, S&P A- A- A- A- A-5Y CDS (bps) 83.52 – – – –FDI (%GDP) – – 0.88 – –

NUS RMI-CRI Quarterly Credit Report, Q2/2017 97
1990 2000 20100
200
400
600
8001Yr. PD
Non−Fin Fin
1990 2000 2010500
1000
1500
2000
2500
3000LuxX Index
1990 2000 20100.8
1
1.2
1.4
1.6EUR/USD
1990 2000 2010−2
0
2
4
6
3m Interbank
1990 2000 2010−10
0
10
20
30
40
50
60GDP OECD CLI
1990 2000 2010−20
−10
0
10
20
30
PPI Money Supply
1990 2000 2010AAA
AA
A
BBB
BB
B
CCC
CCC
Moody’s S&P
1990 2000 2010−200
0
200
400
600FDI
1990 2000 2010−2
0
2
4
6
8Fiscal Budget
Luxembourg 2016 2017Q2 Q3 Q4 Q1 Q2
1Yr. PD, Non-Fin. (bps) 11.31 8.41 8.61 8.47 7.131Yr. PD, Fin. 10.19 7.84 7.15 8.43 2.82LuxX Index 1399 1578 1669 1795 1711EUR/USD 1.11 1.12 1.05 1.07 1.143m Interbank (%) -0.29 -0.30 -0.32 -0.33 -0.33GDP (YoY%) 4.4 5.2 3.9 3.3 –PPI (YoY%) -4.7 -7.4 -6.2 -3.3 -3.2Money Supply (YoY%) 5.00 5.10 5.20 5.30 5.10Sov. Rating, Moody’s Aaa Aaa Aaa Aaa AaaSov. Rating, S&P AAA AAA AAA AAA AAAFiscal Budget (%GDP) – – 1.60 – –
1990 2000 2010
0
50
100
150
1Yr. PD
Non−Fin Fin
1990 2000 2010
0
2000
4000
6000
8000
10000
12000
MBI 10
1990 2000 2010
30
40
50
60
70
80
USD/MKD
1990 2000 2010
0
20
40
60
80
100
120
3m Treas. 10Y Treas.
1990 2000 2010
−10
−5
0
5
10
GDP
1990 2000 2010
AAA
AA
A
BBB
BB
B
CCC
CCC
S&P
1990 2000 2010
0
5
10
15
FDI
Macedonia 2016 2017Q2 Q3 Q4 Q1 Q2
1Yr. PD, Non-Fin. (bps) 6.51 4.33 4.45 10.64 3.461Yr. PD, Fin. 25.70 20.80 9.44 10.41 15.34MBI 10 1707 1954 2135 2251 2282USD/MKD 55.48 54.69 58.46 57.78 53.843m Treas. Yield (%) 1.60 1.60* – – –GDP (YoY%) – – 2.4 – –Sov. Rating, S&P BB- BB- BB- BB- BB-FDI (%GDP) – – 5.26 – –

NUS RMI-CRI Quarterly Credit Report, Q2/2017 98
1990 2000 20100
50
100
1501Yr. PD
Non−Fin Fin
1990 2000 20100
500
1000
1500
2000KLSE Composite
1990 2000 20102
2.5
3
3.5
4
4.5USD/MYR
1990 2000 20100
2
4
6
8
10
12
3m Treas. 10Y Treas. 3m Interbank
1990 2000 2010−10
−5
0
5
10
15
GDP
1990 2000 2010−20
0
20
40
60
PPI Money Supply
1990 2000 2010AAA
AA
A
BBB
BB
B
CCC
CCC
0
100
200
300
400
500Moody’s S&P 5Y CDS
1990 2000 20100
2
4
6
8
10FDI
1990 2000 2010−8
−6
−4
−2
0
2
4Fiscal Budget
Malaysia 2016 2017Q2 Q3 Q4 Q1 Q2
1Yr. PD, Non-Fin. (bps) 18.48 15.22 14.46 9.87 9.041Yr. PD, Fin. 15.03 12.31 13.84 11.31 11.34KLSE Composite 1654 1653 1642 1740 1764USD/MYR 4.03 4.14 4.49 4.43 4.293m Treas. Yield (%) 2.69 2.58 3.06 3.15 3.0710Y Treas. Yield (%) 3.74 3.55 4.23 4.15 3.933m Interbank (%) 3.65 3.40 3.41 3.43 3.43GDP (YoY%) 4.0 4.3 4.5 5.6 –Money Supply (YoY%) 1.90 2.30 3.10 4.50 4.30Sov. Rating, Moody’s A3 A3 A3 A3 A3Sov. Rating, S&P A- A- A- A- A-5Y CDS (bps) 154.51 120.84 138.38 105.21 85.45Fiscal Budget (%GDP) – – -3.10 – –
1990 2000 20100
20
40
60
801Yr. PD
Non−Fin Fin
1990 2000 20100
2000
4000
6000
8000Malta Stock Exchange
1990 2000 20100.8
1
1.2
1.4
1.6EUR/USD
1990 2000 2010−2
0
2
4
6
3m Treas. 3m Interbank
1990 2000 2010−5
0
5
10
15
20
25
GDP
1990 2000 2010−10
0
10
20
30
40
PPI Money Supply
1990 2000 2010AAA
AA
A
BBB
BB
B
CCC
CCC
50
100
150
200
250Moody’s S&P 5Y CDS
1990 2000 2010−2.5
−2
−1.5
−1
−0.5
0
0.5x 10
4 FDI
1990 2000 2010−10
−8
−6
−4
−2
0
2Fiscal Budget
Malta 2016 2017Q2 Q3 Q4 Q1 Q2
1Yr. PD, Non-Fin. (bps) 3.65 4.80 5.64 5.68 4.801Yr. PD, Fin. 6.20 11.75 4.13 5.37 5.09Malta Stock Exchange 4561 4467 4631 4718 4697EUR/USD 1.11 1.12 1.05 1.07 1.143m Treas. Yield (%) -0.28 -0.39 -0.39 -0.35 -0.343m Interbank (%) -0.29 -0.30 -0.32 -0.33 -0.33GDP (YoY%) 6.1 5.9 6.5 6.2 –PPI (YoY%) 0.9 0.4 0.3 0.8 0.8Money Supply (YoY%) 5.00 5.10 5.20 5.30 5.10Sov. Rating, Moody’s A3 A3 A3 A3 A3Sov. Rating, S&P BBB+ BBB+ BBB+ BBB+ BBB+Fiscal Budget (%GDP) – – 1.00 – –

NUS RMI-CRI Quarterly Credit Report, Q2/2017 99
1990 2000 20100
50
100
1501Yr. PD
Non−Fin Fin
1990 2000 20100
1
2
3
4
5x 10
4 BOLSA
1990 2000 20100
5
10
15
20
25MXN/USD
1990 2000 20100
20
40
60
80
10Y Treas. 3m Interbank
1990 2000 2010−10
0
10
20
40
60GDP OECD CLI PMI
1990 2000 2010−20
0
20
40
60
PPI Money Supply
1990 2000 2010AAA
AA
A
BBB
BB
B
CCC
CCC
0
500
1000Moody’s S&P 5Y CDS
1990 2000 20100
1
2
3
4
5FDI
1990 2000 2010−4
−3
−2
−1
0
1Fiscal Budget
Mexico 2016 2017Q2 Q3 Q4 Q1 Q2
1Yr. PD, Non-Fin. (bps) 3.05 2.83 3.94 5.00 5.061Yr. PD, Fin. 4.45 2.26 3.86 5.53 6.55BOLSA 45966 47246 45643 48542 49857MXN/USD 18.28 19.39 20.73 18.72 18.1210Y Treas. Yield (%) 6.08 5.99 7.25 7.40 7.32*3m Interbank (%) 4.23 5.15 6.19 6.93 7.40GDP (YoY%) 2.6 2.0 2.3 2.8 1.8OECD CLI 101.09 100.72 99.69 98.48 98.21*PMI 51.1 51.9 50.2 51.5 52.3PPI (YoY%) 4.9 6.6 10.3 10.7 6.5Money Supply (YoY%) 8.40 10.10 10.60 9.10 7.80Sov. Rating, Moody’s Baa1 Baa1 Baa1 Baa1 Baa1Sov. Rating, S&P BBB+ BBB+ BBB+ BBB+ BBB+5Y CDS (bps) 159.12 166.81 155.91 130.28 112.63FDI (%GDP) – – 2.56 – –Fiscal Budget (%GDP) – – -2.58 – –
1990 2000 20100
50
100
1501Yr. PD
Non−Fin Fin
1990 2000 20100
1
2
3
4x 10
4 CFG 25
1990 2000 20107
8
9
10
11
12USD/MAD
1990 2000 20103.5
4
4.5
5
5.5
10Y Treas.
1990 2000 2010−2
0
2
4
6
8
GDP
1990 2000 20100
5
10
15
20
25
Money Supply
1990 2000 2010AAA
AA
A
BBB
BB
B
CCC
CCC
Moody’s S&P
1990 2000 20100
1
2
3
4
5FDI
Morocco 2016 2017Q2 Q3 Q4 Q1 Q2
1Yr. PD, Non-Fin. (bps) 11.90 14.91 13.31 12.40 8.621Yr. PD, Fin. 19.87 19.51 17.03 15.84 25.84CFG 25 20098 21282 24464 23883 25205USD/MAD 9.79 9.73 10.13 10.06 9.64GDP (YoY%) -0.5 0.8 0.9 3.8 –Money Supply (YoY%) 4.90 5.90 4.70 5.60 4.95Sov. Rating, Moody’s Ba1 Ba1 Ba1 Ba1 Ba1Sov. Rating, S&P BBB- BBB- BBB- BBB- BBB-FDI (%GDP) – – 2.29 – –

NUS RMI-CRI Quarterly Credit Report, Q2/2017 100
1990 2000 20100
20
40
60
80
1001Yr. PD
Non−Fin Fin
1990 2000 20100
500
1000
1500
2000
2500Montenegro Stock Exchange
1990 2000 2010
0.7
0.8
0.9
1
1.1
1.2
1.3
EUR/USD
1990 2000 2010−10
−5
0
5
10
15
GDP
1990 2000 2010AAA
AA
A
BBB
BB
B
CCC
CCC
Moody’s S&P
1990 2000 20100
10
20
30
40FDI
Montenegro 2016 2017Q2 Q3 Q4 Q1 Q2
1Yr. PD, Non-Fin. (bps) 25.43 24.48 24.59 21.44 18.891Yr. PD, Fin. 17.41 17.40* – – –EUR/USD 0.90 0.89 0.95 0.94 0.88Sov. Rating, Moody’s B1 B1 B1 B1 B1Sov. Rating, S&P B+ B+ B+ B+ B+FDI (%GDP) – – 5.43 – –
1990 2000 20100
50
100
1501Yr. PD
Non−Fin Fin
1990 2000 2010100
200
300
400
500
600
700AEX
1990 2000 20100.8
1
1.2
1.4
1.6EUR/USD
1990 2000 2010−2
0
2
4
6
8
10
3m Treas. 10Y Treas. 3m Interbank
1990 2000 2010−10
0
10
40
50
60GDP OECD CLI PMI
1990 2000 2010−20
−10
0
10
20
PPI Money Supply
1990 2000 2010AAA
AA
A
BBB
BB
B
CCC
CCC
0
50
100
150Moody’s S&P 5Y CDS
1990 2000 20100
20
40
60
80
100FDI
1990 2000 2010−10
−8
−6
−4
−2
0
2Fiscal Budget
Netherlands 2016 2017Q2 Q3 Q4 Q1 Q2
1Yr. PD, Non-Fin. (bps) 8.16 6.16 6.05 4.66 4.611Yr. PD, Fin. 26.72 20.18 13.87 10.09 6.91AEX 436 452 483 517 507EUR/USD 1.11 1.12 1.05 1.07 1.143m Treas. Yield (%) -0.66 -0.78 -1.11 -0.78 -0.6410Y Treas. Yield (%) 0.09 0.00 0.36 0.58 0.663m Interbank (%) -0.29 -0.30 -0.32 -0.33 -0.33GDP (YoY%) 2.0 2.4 2.7 2.5 –OECD CLI 99.70 99.69 99.91 100.19 100.32*PMI 52.0 53.4 57.3 57.8 58.6PPI (YoY%) -6.4 -4.0 4.9 8.7 2.3Money Supply (YoY%) 5.00 5.10 5.20 5.30 5.10Sov. Rating, Moody’s Aaa Aaa Aaa Aaa AaaSov. Rating, S&P AAA AAA AAA AAA AAA5Y CDS (bps) 26.67 25.11 27.65 21.31 19.54FDI (%GDP) – – 10.48 – –Fiscal Budget (%GDP) – – 0.40 – –

NUS RMI-CRI Quarterly Credit Report, Q2/2017 101
1990 2000 20100
10
20
30
40
50
601Yr. PD
Non−Fin Fin
1990 2000 2010400
600
800
1000
1200
1400NZSE
1990 2000 20101
1.5
2
2.5
3NZD/USD
1990 2000 20100
5
10
15
3m Treas. 10Y Treas. 3m Interbank
1990 2000 2010−4
−2
0
2
4
6
8
35
40
45
50
55
60
65GDP OECD CLI PMI
1990 2000 2010−10
0
10
20
30
PPI Money Supply
1990 2000 2010AAA
AA
A
BBB
BB
B
CCC
CCC
0
100
200Moody’s S&P 5Y CDS
1990 2000 2010−5000
0
5000FDI
1990 2000 2010−10
−5
0
5
10Fiscal Budget
New Zealand 2016 2017Q2 Q3 Q4 Q1 Q2
1Yr. PD, Non-Fin. (bps) 1.46 1.28 1.48 1.63 1.651Yr. PD, Fin. 0.92 0.47 0.20 0.14 0.20NZSE 1305 1375 1281 1322 1392NZD/USD 1.40 1.37 1.44 1.43 1.363m Treas. Yield (%) 2.09 1.91 1.75 1.77 1.8410Y Treas. Yield (%) 2.35 2.27 3.33 3.19 2.983m Interbank (%) 2.42 2.20 2.00 2.00 1.99GDP (YoY%) – – 3.6 – –PMI 57.8 57.4 54.5 58.1 56.2PPI (YoY%) 0.5 0.1 2.5 4.1 –Money Supply (YoY%) 5.90 4.80 6.40 6.40* –Sov. Rating, Moody’s Aaa Aaa Aaa Aaa AaaSov. Rating, S&P AA AA AA AA AAFiscal Budget (%GDP) – – 1.51 – –
1990 2000 20100
20
40
60
80
1001Yr. PD
Non−Fin Fin
1990 2000 20100
2
4
6
8x 10
4 NSE ALL Share Index
1990 2000 20100
100
200
300
400USD/NGN
1990 2000 20105
10
15
20
25
10Y Treas. 3m Interbank
1990 2000 2010−5
0
5
10
15
GDP
1990 2000 2010−50
0
50
100
150
Money Supply
1990 2000 2010AAA
AA
A
BBB
BB
B
CCC
CCC
S&P
1990 2000 20100
2
4
6
8
10
12FDI
Nigeria 2016 2017Q2 Q3 Q4 Q1 Q2
1Yr. PD, Non-Fin. (bps) 53.16 57.57 52.99 26.28 25.451Yr. PD, Fin. 97.39 99.34 76.43 28.79 26.73NSE ALL Share Index 29598 28335 26875 25516 33117USD/NGN 280.50 315.00 315.33 314.29 322.2510Y Treas. Yield (%) 14.40 15.54 16.24 16.29 16.193m Interbank (%) 10.45* – – 20.93 21.61GDP (YoY%) – – -1.6 – –Money Supply (YoY%) 17.36 17.61 16.77 7.59 -1.83Sov. Rating, S&P B+ B+ B+ B+ B+

NUS RMI-CRI Quarterly Credit Report, Q2/2017 102
1990 2000 20100
50
100
150
200
2501Yr. PD
Non−Fin Fin
1990 2000 20100
100
200
300
400
500OBX Price
1990 2000 20105
6
7
8
9
10USD/NOK
1990 2000 20100
5
10
15
20
3m Treas. 10Y Treas. 3m Interbank
1990 2000 2010−5
0
5
10
20
40
60
80GDP OECD CLI PMI
1990 2000 2010−20
−10
0
10
20
30
40
PPI Money Supply
1990 2000 2010AAA
AA
A
BBB
BB
B
CCC
CCC
0
100Moody’s S&P 5Y CDS
1990 2000 2010−5
0
5
10FDI
1990 2000 2010−5
0
5
10
15
20Fiscal Budget
Norway 2016 2017Q2 Q3 Q4 Q1 Q2
1Yr. PD, Non-Fin. (bps) 33.13 28.22 23.83 18.90 23.321Yr. PD, Fin. 52.09 35.65 30.34 21.30 24.82OBX Price 353 358 397 396 390USD/NOK 8.36 7.98 8.64 8.60 8.353m Treas. Yield (%) 0.54 0.48 0.51 0.41 0.3510Y Treas. Yield (%) 1.01 1.21 1.65 1.64 1.653m Interbank (%) 1.01 1.15 1.17 0.97 0.83GDP (YoY%) 1.1 -0.9 2.0 0.9 –OECD CLI 99.29 99.61 100.31 100.85 100.95*PMI 53.1 52.4 52.2 55.1 55.6PPI (YoY%) -9.7 -6.1 7.2 16.1 3.2Sov. Rating, Moody’s Aaa Aaa Aaa Aaa AaaSov. Rating, S&P AAA AAA AAA AAA AAAFDI (%GDP) – – -4.10 – –Fiscal Budget (%GDP) – – 5.48 – –
1990 2000 20100
5
10
15
20
25
301Yr. PD
Non−Fin Fin
1990 2000 20101000
2000
3000
4000
5000
6000Oman Stock Exchange
1990 2000 20100.38
0.39
0.4
0.41
0.42USD/OMR
1990 2000 20100
1
2
3
4
5
6
3m Treas. 3m Interbank
1990 2000 2010−5
0
5
10
GDP
1990 2000 2010−40
−20
0
20
40
60
PPI Money Supply
1990 2000 2010AAA
AA
A
BBB
BB
B
CCC
CCC
Moody’s S&P
1990 2000 2010−4
−2
0
2
4
6
8FDI
Oman 2016 2017Q2 Q3 Q4 Q1 Q2
1Yr. PD, Non-Fin. (bps) 2.37 2.06 3.17 1.82 3.081Yr. PD, Fin. 24.64 24.56 23.29 19.62 17.48USD/OMR 0.38 0.39 0.39 0.39 0.393m Treas. Yield (%) 1.00 1.00 0.95 0.95 0.953m Interbank (%) 0.39 – – – –GDP (YoY%) – – 3.1 – –PPI (YoY%) -12.9 -10.8 -7.8 – –Money Supply (YoY%) 5.35 5.57 1.83 3.06 4.12*Sov. Rating, Moody’s Baa2 Baa2 Baa2 Baa2 Baa2Sov. Rating, S&P BB+ BB+ BB+ BB+ BB+

NUS RMI-CRI Quarterly Credit Report, Q2/2017 103
1990 2000 20100
50
100
1501Yr. PD
Non−Fin Fin
1990 2000 20100
1
2
3
4x 10
4 KSE ALL
1990 2000 201020
40
60
80
100
120USD/PKR
1990 2000 20100
5
10
15
20
3m Treas. 3m Interbank
1990 2000 20100
5
10
15
20
25
GDP
1990 2000 20105
10
15
20
25
Money Supply
1990 2000 2010AAA
AA
A
BBB
BB
B
CCC
CCC
100
200
300
400
500Moody’s S&P 5Y CDS
1990 2000 20100
1
2
3
4FDI
1990 2000 20100
2
4
6
8
10Fiscal Budget
Pakistan 2016 2017Q2 Q3 Q4 Q1 Q2
1Yr. PD, Non-Fin. (bps) 9.31 6.66 5.43 4.20 7.901Yr. PD, Fin. 72.75 55.99 31.39 32.35 53.69KSE ALL 25313 27682 32842 32985 32494USD/PKR 104.73 104.66 104.83 104.85 104.913m Interbank (%) 5.80 5.79 5.87 5.87 5.89GDP (YoY%) – – 9.0 – –Money Supply (YoY%) 13.70 12.70 14.50 13.60 13.70Sov. Rating, Moody’s B3 B3 B3 B3 B3Sov. Rating, S&P A- A- A- A- A-Fiscal Budget (%GDP) – – 3.50 – –
1990 2000 20100
20
40
60
80
100
1201Yr. PD
Non−Fin Fin
1990 2000 20100
0.5
1
1.5
2
2.5x 10
4 IGBVL
1990 2000 20101
1.5
2
2.5
3
3.5
4PEN/USD
1990 2000 20100
2
4
6
8
10
10Y Treas. 3m Interbank
1990 2000 2010−5
0
5
10
15
GDP
1990 2000 2010−50
0
50
100
150
200
PPI Money Supply
1990 2000 2010AAA
AA
A
BBB
BB
B
CCC
CCC
0
500
1000Moody’s S&P 5Y CDS
1990 2000 2010−2
0
2
4
6
8FDI
1990 2000 2010−10
−5
0
5Fiscal Budget
Peru 2016 2017Q2 Q3 Q4 Q1 Q2
1Yr. PD, Non-Fin. (bps) 30.18 18.59 18.98 13.82 10.081Yr. PD, Fin. 14.98 12.84 11.03 9.68 9.31PEN/USD 3.29 3.38 3.36 3.25 3.2510Y Treas. Yield (%) 6.08 5.77 6.38 5.77 5.543m Interbank (%) 5.76 5.24 5.27 5.20 5.05GDP (YoY%) – – 3.9 – –PPI (YoY%) 1.0 1.5 1.9 1.8 1.4Money Supply (YoY%) 8.60 18.00 11.50 14.50 12.40Sov. Rating, Moody’s A3 A3 A3 A3 A3Sov. Rating, S&P BBB+ BBB+ BBB+ BBB+ BBB+5Y CDS (bps) 138.66 102.69 108.02 102.15 85.54
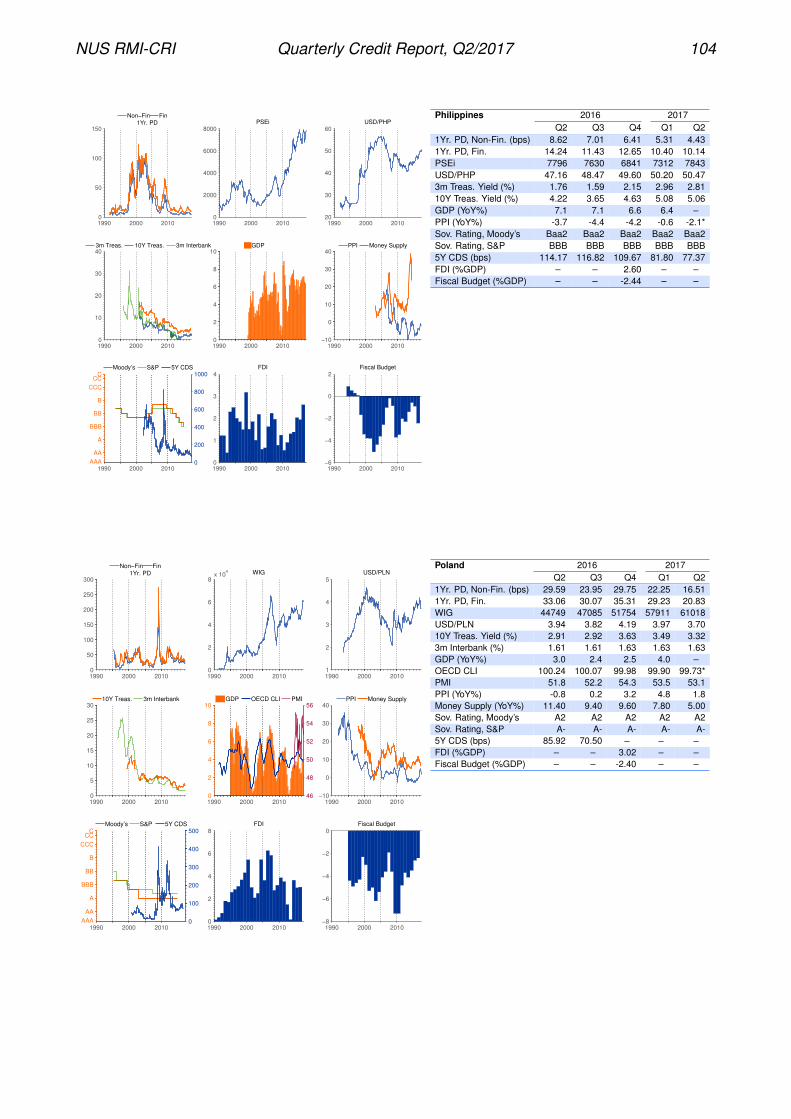
NUS RMI-CRI Quarterly Credit Report, Q2/2017 104
1990 2000 20100
50
100
1501Yr. PD
Non−Fin Fin
1990 2000 20100
2000
4000
6000
8000PSEi
1990 2000 201020
30
40
50
60USD/PHP
1990 2000 20100
10
20
30
40
3m Treas. 10Y Treas. 3m Interbank
1990 2000 20100
2
4
6
8
10
GDP
1990 2000 2010−10
0
10
20
30
40
PPI Money Supply
1990 2000 2010AAA
AA
A
BBB
BB
B
CCC
CCC
0
200
400
600
800
1000Moody’s S&P 5Y CDS
1990 2000 20100
1
2
3
4FDI
1990 2000 2010−6
−4
−2
0
2Fiscal Budget
Philippines 2016 2017Q2 Q3 Q4 Q1 Q2
1Yr. PD, Non-Fin. (bps) 8.62 7.01 6.41 5.31 4.431Yr. PD, Fin. 14.24 11.43 12.65 10.40 10.14PSEi 7796 7630 6841 7312 7843USD/PHP 47.16 48.47 49.60 50.20 50.473m Treas. Yield (%) 1.76 1.59 2.15 2.96 2.8110Y Treas. Yield (%) 4.22 3.65 4.63 5.08 5.06GDP (YoY%) 7.1 7.1 6.6 6.4 –PPI (YoY%) -3.7 -4.4 -4.2 -0.6 -2.1*Sov. Rating, Moody’s Baa2 Baa2 Baa2 Baa2 Baa2Sov. Rating, S&P BBB BBB BBB BBB BBB5Y CDS (bps) 114.17 116.82 109.67 81.80 77.37FDI (%GDP) – – 2.60 – –Fiscal Budget (%GDP) – – -2.44 – –
1990 2000 20100
50
100
150
200
250
3001Yr. PD
Non−Fin Fin
1990 2000 20100
2
4
6
8x 10
4 WIG
1990 2000 20101
2
3
4
5USD/PLN
1990 2000 20100
5
10
15
20
25
30
10Y Treas. 3m Interbank
1990 2000 20100
2
4
6
8
10
46
48
50
52
54
56GDP OECD CLI PMI
1990 2000 2010−10
0
10
20
30
40
PPI Money Supply
1990 2000 2010AAA
AA
A
BBB
BB
B
CCC
CCC
0
100
200
300
400
500Moody’s S&P 5Y CDS
1990 2000 20100
2
4
6
8FDI
1990 2000 2010−8
−6
−4
−2
0Fiscal Budget
Poland 2016 2017Q2 Q3 Q4 Q1 Q2
1Yr. PD, Non-Fin. (bps) 29.59 23.95 29.75 22.25 16.511Yr. PD, Fin. 33.06 30.07 35.31 29.23 20.83WIG 44749 47085 51754 57911 61018USD/PLN 3.94 3.82 4.19 3.97 3.7010Y Treas. Yield (%) 2.91 2.92 3.63 3.49 3.323m Interbank (%) 1.61 1.61 1.63 1.63 1.63GDP (YoY%) 3.0 2.4 2.5 4.0 –OECD CLI 100.24 100.07 99.98 99.90 99.73*PMI 51.8 52.2 54.3 53.5 53.1PPI (YoY%) -0.8 0.2 3.2 4.8 1.8Money Supply (YoY%) 11.40 9.40 9.60 7.80 5.00Sov. Rating, Moody’s A2 A2 A2 A2 A2Sov. Rating, S&P A- A- A- A- A-5Y CDS (bps) 85.92 70.50 – – –FDI (%GDP) – – 3.02 – –Fiscal Budget (%GDP) – – -2.40 – –

NUS RMI-CRI Quarterly Credit Report, Q2/2017 105
1990 2000 20100
50
100
150
2001Yr. PD
Non−Fin Fin
1990 2000 20100
1000
2000
3000
4000
5000PSI General
1990 2000 20100.8
1
1.2
1.4
1.6
1.8EUR/USD
1990 2000 2010−5
0
5
10
15
20
10Y Treas. 3m Interbank
1990 2000 2010−5
−4
−3
−2
−1
0
1
2
3
4
5
44
45
46
47
48
49
50
51
52
53
54GDP OECD CLI
1990 2000 2010−10
−5
0
5
10
15
PPI Money Supply
1990 2000 2010AAA
AA
A
BBB
BB
B
CCC
CCC
0
200
400
600
800
1000
1200
1400
1600
1800
2000Moody’s S&P 5Y CDS
1990 2000 20100
2
4
6
8
10
12FDI
1990 2000 2010−12
−10
−8
−6
−4
−2
0Fiscal Budget
Portugal 2016 2017Q2 Q3 Q4 Q1 Q2
1Yr. PD, Non-Fin. (bps) 34.52 23.63 23.65 20.08 9.131Yr. PD, Fin. 79.85 82.34 122.47 26.10 27.02PSI General 2370 2481 2520 2725 2826EUR/USD 1.11 1.12 1.05 1.07 1.1410Y Treas. Yield (%) 3.01 3.33 3.76 3.98 3.033m Interbank (%) -0.29 -0.30 -0.32 -0.33 -0.33GDP (YoY%) 0.9 1.7 2.0 2.8 –OECD CLI 100.39 100.44 100.08 99.88 99.97*PPI (YoY%) -4.2 -1.9 1.5 4.9 2.7Money Supply (YoY%) 5.00 5.10 5.20 5.30 5.10Sov. Rating, Moody’s Ba1 Ba1 Ba1 Ba1 Ba1Sov. Rating, S&P BB+ BB+ BB+ BB+ BB+5Y CDS (bps) 310.71 302.70 274.01 238.70 196.40FDI (%GDP) – – 4.11 – –Fiscal Budget (%GDP) – – -2.00 – –
1990 2000 20100
50
100
150
200
2501Yr. PD
Non−Fin Fin
1990 2000 20100
2000
4000
6000
8000
10000
12000BET
1990 2000 20100
1
2
3
4
5x 10
4 USD/ROL
1990 2000 20100
50
100
150
3m Treas. 10Y Treas. 3m Interbank
1990 2000 2010−10
−5
0
5
10
15
GDP
1990 2000 2010−10
0
10
20
30
40
PPI Money Supply
1990 2000 2010AAA
AA
A
BBB
BB
B
CCC
CCC
0
200
400
600
800Moody’s S&P 5Y CDS
1990 2000 20100
2
4
6
8
10FDI
1990 2000 2010−10
−8
−6
−4
−2
0Fiscal Budget
Romania 2016 2017Q2 Q3 Q4 Q1 Q2
1Yr. PD, Non-Fin. (bps) 46.17 40.52 31.71 20.90 21.741Yr. PD, Fin. 33.64 31.07 27.11 13.46 16.79BET 6473 6937 7085 8069 7855USD/ROL 40746.75 39525.00 43130.51 42751.51 39947.2010Y Treas. Yield (%) 3.40 2.84 3.47 3.86 3.923m Interbank (%) 0.60 0.50 0.68 0.66 0.65GDP (YoY%) 6.0 4.3 4.8 5.7 –PPI (YoY%) -2.3 -1.5 0.9 3.9 2.5Money Supply (YoY%) 13.08 12.24 9.75 12.25 9.04Sov. Rating, Moody’s Baa3 Baa3 Baa3 Baa3 Baa3Sov. Rating, S&P BBB- BBB- BBB- BBB- BBB-5Y CDS (bps) 150.07 111.85* – – –FDI (%GDP) – – 2.88 – –Fiscal Budget (%GDP) – – -3.00 – –

NUS RMI-CRI Quarterly Credit Report, Q2/2017 106
1990 2000 20100
100
200
300
400
500
6001Yr. PD
Non−Fin Fin
1990 2000 20100
500
1000
1500
2000
2500MICEX
1990 2000 20100
20
40
60
80USD/RUB
1990 2000 20100
5
10
15
20
3m Treas. 10Y Treas.
1990 2000 2010−20
0
20
40
50
60GDP OECD CLI PMI
1990 2000 2010−20
0
20
40
60
80
PPI Money Supply
1990 2000 2010AAA
AA
A
BBB
BB
B
CCC
CCC
0
1000
2000Moody’s S&P 5Y CDS
1990 2000 20100
1
2
3
4
5FDI
1990 2000 2010−10
−5
0
5
10Fiscal Budget
Russia 2016 2017Q2 Q3 Q4 Q1 Q2
1Yr. PD, Non-Fin. (bps) 42.62 42.11 36.03 32.83 43.841Yr. PD, Fin. 77.14 59.36 53.32 55.81 58.13MICEX 1891 1978 2233 1996 1880USD/RUB 63.97 62.85 61.27 56.26 58.943m Treas. Yield (%) 10.99 9.80 8.78 9.50 8.4610Y Treas. Yield (%) – 3.79 4.46 4.17 4.28GDP (YoY%) -0.5 -0.4 0.3 0.5 –OECD CLI 99.21 100.06 100.81 101.07 100.92*PMI 51.5 51.1 53.7 52.4 50.3PPI (YoY%) 5.6 5.1 7.4 11.3 2.9Money Supply (YoY%) 12.20 12.70 9.20 11.10 0.00Sov. Rating, Moody’s Ba1 Ba1 Ba1 Ba1 Ba1Sov. Rating, S&P BB+ BB+ BB+ BB+ BB+5Y CDS (bps) 232.87 219.66 231.35* 166.70 169.23FDI (%GDP) – – 2.57 – –Fiscal Budget (%GDP) – – -3.93 – –
1990 2000 20100
10
20
30
40
501Yr. PD
Non−Fin Fin
1990 2000 20100
0.5
1
1.5
2x 10
4 TASI
1990 2000 20103.7
3.72
3.74
3.76
3.78
3.8USD/SAR
1990 2000 20100
1
2
3
4
5
6
3m Interbank
1990 2000 2010−5
0
5
10
50
55
60
65GDP PMI
1990 2000 2010−10
0
10
20
30
PPI Money Supply
1990 2000 2010AAA
AA
A
BBB
BB
B
CCC
CCC
50
100
150
200
250Moody’s S&P 5Y CDS
1990 2000 2010−2
0
2
4
6
8
10FDI
Saudi Arabia 2016 2017Q2 Q3 Q4 Q1 Q2
1Yr. PD, Non-Fin. (bps) 8.41 11.19 8.20 6.20 6.421Yr. PD, Fin. 2.65 3.63 1.55 0.94 0.95TASI 6500 5623 7210 7002 7426USD/SAR 3.75 3.75 3.75 3.75 3.753m Interbank (%) 2.22 2.36 2.04 1.74 1.78PMI 54.4 55.3 55.5 56.4 54.3PPI (YoY%) 4.0 3.7 2.0 – –Money Supply (YoY%) -2.60 -4.00 0.70 0.00 1.50Sov. Rating, Moody’s A1 A1 A1 A1 A1Sov. Rating, S&P A- A- A- A- A-5Y CDS (bps) – – – – 118.18FDI (%GDP) – – 1.15 – –

NUS RMI-CRI Quarterly Credit Report, Q2/2017 107
1990 2000 20100
50
100
150
2001Yr. PD
Non−Fin Fin
1990 2000 20100
200
400
600
800
1000Belgrade Stock Exchange
1990 2000 20100
20
40
60
80
100
120USD/RSD
1990 2000 2010−30
−20
−10
0
10
20
30
GDP
1990 2000 2010−5
0
5
10
15
20
PPI
1990 2000 2010AAA
AA
A
BBB
BB
B
CCC
CCC
0
500
1000Moody’s S&P 5Y CDS
1990 2000 20100
5
10
15FDI
Serbia 2016 2017Q2 Q3 Q4 Q1 Q2
1Yr. PD, Non-Fin. (bps) 35.84 35.60 37.74 38.67 28.501Yr. PD, Fin. 70.53 43.08 43.26 45.50 35.48Belgrade Stock Exchange 288 294 352 368 344USD/RSD 111.02 109.49 117.29 115.97 105.39GDP (YoY%) 1.9 2.6 – 1.2 –PPI (YoY%) -1.6 0.2 2.2 2.9 4.5*Sov. Rating, Moody’s Ba3 Ba3 Ba3 Ba3 Ba3Sov. Rating, S&P BB- BB- BB- BB- BB-
1990 2000 20100
50
100
1501Yr. PD
Non−Fin Fin
1990 2000 20101000
1500
2000
2500
3000
3500
4000STI
1990 2000 2010
1.3
1.4
1.5
1.6
1.7
1.8
1.9
USD/SGD
1990 2000 20100
1
2
3
4
5
6
3m Treas. 10Y Treas. 3m Interbank
1990 2000 2010−10
−5
0
5
10
15
20
40
45
50
55
60
65
70GDP PMI
1990 2000 2010−10
0
10
20
30
Money Supply
1990 2000 2010AAA
AA
A
BBB
BB
B
CCC
CCC
Moody’s S&P
1990 2000 20100
5
10
15
20
25
30FDI
1990 2000 2010−2
0
2
4
6
8Fiscal Budget
Singapore 2016 2017Q2 Q3 Q4 Q1 Q2
1Yr. PD, Non-Fin. (bps) 21.84 20.31 17.48 13.46 11.511Yr. PD, Fin. 4.50 3.36 2.88 2.54 1.98STI 2841 2869 2881 3175 3226USD/SGD 1.35 1.36 1.45 1.40 1.383m Treas. Yield (%) 0.66 0.71 1.06 0.93 0.9810Y Treas. Yield (%) 1.91 1.78 2.47 2.25 2.093m Interbank (%) 0.93 0.87 0.97 0.95 1.00GDP (YoY%) 1.9 1.2 2.9 2.5 2.5PMI 49.6 50.1 50.6 51.2 50.9Money Supply (YoY%) 4.20 5.00 7.70 7.20 7.00Sov. Rating, Moody’s Aaa Aaa Aaa Aaa AaaSov. Rating, S&P AAA AAA AAA AAA AAAFDI (%GDP) – – 20.74 – –Fiscal Budget (%GDP) – – -1.21 – –

NUS RMI-CRI Quarterly Credit Report, Q2/2017 108
1990 2000 20100
50
100
1501Yr. PD
Non−Fin Fin
1990 2000 20100
100
200
300
400
500Slovak Share Index
1990 2000 20100
0.5
1
1.5
2EUR/USD
1990 2000 2010−10
0
10
20
30
3m Treas. 10Y Treas. 3m Interbank
1990 2000 2010−10
−5
0
5
10
15
44
46
48
50
52
54GDP OECD CLI
1990 2000 2010−10
−5
0
5
10
15
PPI Money Supply
1990 2000 2010AAA
AA
A
BBB
BB
B
CCC
CCC
0
200
400Moody’s S&P 5Y CDS
1990 2000 2010−5
0
5
10
15FDI
1990 2000 2010−12
−10
−8
−6
−4
−2
0Fiscal Budget
Slovakia 2016 2017Q2 Q3 Q4 Q1 Q2
1Yr. PD, Non-Fin. (bps) 11.37 14.65 8.65 8.58 10.371Yr. PD, Fin. 22.01 22.80 21.34 29.61 68.23Slovak Share Index 313 309 319 305 329EUR/USD 1.11 1.12 1.05 1.07 1.143m Treas. Yield (%) -0.20 -0.29 -0.34 -0.59 -0.5210Y Treas. Yield (%) 0.59 0.27 0.90 1.09 1.02GDP (YoY%) 3.5 3.1 2.9 3.1 –PPI (YoY%) -4.5 -3.2 -1.8 3.0 1.4Money Supply (YoY%) 4.90 5.10 5.00 5.10 5.40Sov. Rating, Moody’s A2 A2 A2 A2 A2Sov. Rating, S&P A+ A+ A+ A+ A+5Y CDS (bps) 43.91 44.21 – – 43.46FDI (%GDP) – – 3.96 – –Fiscal Budget (%GDP) – – -1.70 – –
1990 2000 20100
100
200
300
4001Yr. PD
Non−Fin Fin
1990 2000 20100
200
400
600
800
1000Slovene Stock Exchange Index
1990 2000 20100.5
1
1.5
2
2.5EUR/USD
1990 2000 20100
2
4
6
8
10
10Y Treas. 3m Interbank
1990 2000 2010−10
−8
−6
−4
−2
0
2
4
6
8
10
44
45
46
47
48
49
50
51
52
53
54GDP OECD CLI
1990 2000 2010−5
0
5
10
15
PPI
1990 2000 2010AAA
AA
A
BBB
BB
B
CCC
CCC
0
200
400
600Moody’s S&P 5Y CDS
1990 2000 2010−2
0
2
4
6
8FDI
1990 2000 2010−20
−15
−10
−5
0Fiscal Budget
Slovenia 2016 2017Q2 Q3 Q4 Q1 Q2
1Yr. PD, Non-Fin. (bps) 14.62 11.78 16.61 13.90 19.331Yr. PD, Fin. 18.42 15.14 26.59 21.70 18.06Slovene Stock Exchange Index 210 227 192 196 218EUR/USD 1.11 1.12 1.05 1.07 1.1410Y Treas. Yield (%) 1.36 0.75 0.96 0.99 0.86GDP (YoY%) 2.0 3.0 3.8 5.0 –OECD CLI 99.72 99.57 99.84 100.17 100.21PPI (YoY%) -2.0 -0.9 0.5 1.9 2.2Sov. Rating, Moody’s Baa3 Baa3 Baa3 Baa3 Baa3Sov. Rating, S&P A+ A+ A+ A+ A+5Y CDS (bps) 115.14 102.37* – – –FDI (%GDP) – – 2.45 – –Fiscal Budget (%GDP) – – -1.80 – –

NUS RMI-CRI Quarterly Credit Report, Q2/2017 109
1990 2000 20100
20
40
60
80
100
1201Yr. PD
Non−Fin Fin
1990 2000 20100
500
1000
1500MSCI South Africa
1990 2000 20100
5
10
15
20USD/ZAR
1990 2000 20100
5
10
15
20
3m Treas. 10Y Treas. 3m Interbank
1990 2000 2010−4
−2
0
2
4
6
8
35
40
45
50
55
60
65GDP OECD CLI PMI
1990 2000 2010−10
0
10
20
30
PPI Money Supply
1990 2000 2010AAA
AA
A
BBB
BB
B
CCC
CCC
0
500
1000Moody’s S&P 5Y CDS
1990 2000 2010−2
0
2
4
6FDI
1990 2000 2010−10
−8
−6
−4
−2
0
2Fiscal Budget
South Africa 2016 2017Q2 Q3 Q4 Q1 Q2
1Yr. PD, Non-Fin. (bps) 17.29 16.85 13.46 14.74 12.971Yr. PD, Fin. 24.65 20.48 18.77 14.91 15.84MSCI South Africa 1355 1343 1276 1295 1305USD/ZAR 14.73 13.72 13.74 13.41 13.073m Treas. Yield (%) 7.35 7.36 7.79 7.42 7.5810Y Treas. Yield (%) 8.90 8.73 9.02 8.89 8.933m Interbank (%) 7.36 7.36 7.36 7.36 7.34GDP (YoY%) 0.3 0.7 0.7 1.0 –OECD CLI 99.60 99.65 99.73 99.37 99.03*PMI 52.9 48.5 46.7 52.2 46.7Money Supply (YoY%) 5.58 5.64 6.07 5.64 5.96Sov. Rating, Moody’s Baa3 Baa3 Baa3 Baa3 Baa3Sov. Rating, S&P BB+ BB+ BB+ BB+ BB+5Y CDS (bps) 281.04 256.33 255.67* – –FDI (%GDP) – – 0.76 – –Fiscal Budget (%GDP) – – -4.13 – –
1990 2000 20100
500
1000
1500
20001Yr. PD
Non−Fin Fin
1990 2000 20100
500
1000
1500
2000
2500KOSPI
1990 2000 2010600
800
1000
1200
1400
1600
1800USD/KRW
1990 2000 20100
2
4
6
8
3m Treas. 10Y Treas. 3m Interbank
1990 2000 2010−10
0
10
20
0
50
100
150GDP OECD CLI PMI
1990 2000 2010−10
0
10
20
30
40
PPI Money Supply
1990 2000 2010AAA
AA
A
BBB
BB
B
CCC
CCC
0
200
400
600
800Moody’s S&P 5Y CDS
1990 2000 20100
0.5
1
1.5
2
2.5FDI
1990 2000 2010−2
0
2
4
6Fiscal Budget
South Korea 2016 2017Q2 Q3 Q4 Q1 Q2
1Yr. PD, Non-Fin. (bps) 8.05 6.10 6.36 5.72 4.971Yr. PD, Fin. 24.18 20.33 24.08 22.22 15.99KOSPI 1970 2044 2026 2160 2392USD/KRW 1151.80 1101.13 1205.83 1118.45 1144.143m Treas. Yield (%) 1.27 1.26 1.32 1.30 1.3010Y Treas. Yield (%) 1.47 1.42 2.09 2.19 2.213m Interbank (%) 1.30 1.32 1.47 1.42 1.38GDP (YoY%) 3.4 2.6 2.4 2.9 2.7OECD CLI 100.40 100.55 100.64 100.68 100.54*PMI 74.0 74.0 72.0 81.0 84.0PPI (YoY%) -2.7 -1.1 1.8 4.3 2.8Money Supply (YoY%) 7.90 7.80 8.10 7.30 7.10*Sov. Rating, Moody’s Aa2 Aa2 Aa2 Aa2 Aa2Sov. Rating, S&P AA AA AA AA AA5Y CDS (bps) 56.13 41.84 44.00 50.77 52.68FDI (%GDP) – – 0.77 – –Fiscal Budget (%GDP) – – 0.47 – –

NUS RMI-CRI Quarterly Credit Report, Q2/2017 110
1990 2000 20100
20
40
60
80
1001Yr. PD
Non−Fin Fin
1990 2000 20100
500
1000
1500
2000IGBM
1990 2000 20100.8
1
1.2
1.4
1.6
1.8
2EUR/USD
1990 2000 2010−5
0
5
10
15
3m Treas. 10Y Treas. 3m Interbank
1990 2000 2010−10
0
10
40
50
60GDP OECD CLI PMI
1990 2000 2010−10
−5
0
5
10
15
PPI Money Supply
1990 2000 2010AAA
AA
A
BBB
BB
B
CCC
CCC
0
1000Moody’s S&P 5Y CDS
1990 2000 20100
2
4
6
8FDI
1990 2000 2010−15
−10
−5
0
5Fiscal Budget
Spain 2016 2017Q2 Q3 Q4 Q1 Q2
1Yr. PD, Non-Fin. (bps) 9.95 7.61 7.54 5.30 4.681Yr. PD, Fin. 24.87 21.89 16.34 10.56 9.42IGBM 821 884 944 1055 1052EUR/USD 1.11 1.12 1.05 1.07 1.1410Y Treas. Yield (%) 1.16 0.88 1.38 1.67 1.543m Interbank (%) -0.29 -0.30 -0.32 -0.33 -0.33GDP (YoY%) 3.4 3.2 3.0 3.0 –OECD CLI 100.36 100.13 100.07 99.95 99.83*PMI 52.2 52.3 55.3 53.9 54.7PPI (YoY%) -4.5 -2.0 2.9 5.8 3.2Money Supply (YoY%) 5.00 5.10 5.20 5.30 5.10Sov. Rating, Moody’s Baa2 Baa2 Baa2 Baa2 Baa2Sov. Rating, S&P BBB+ BBB+ BBB+ BBB+ BBB+5Y CDS (bps) 111.30 83.61 75.62 77.96 64.99FDI (%GDP) – – 2.52 – –Fiscal Budget (%GDP) – – -4.50 – –
1990 2000 20100
20
40
60
80
1001Yr. PD
Non−Fin Fin
1990 2000 20100
2000
4000
6000
8000ASPI
1990 2000 20100
50
100
150
200USD/LKR
1990 2000 20105
10
15
20
3m Treas. 3m Interbank
1990 2000 20100
5
10
15
20
GDP
1990 2000 2010−200
0
200
400
600
Money Supply
1990 2000 2010AAA
AA
A
BBB
BB
B
CCC
CCC
Moody’s S&P
1990 2000 20100
0.5
1
1.5
2
2.5
3FDI
Sri Lanka 2016 2017Q2 Q3 Q4 Q1 Q2
1Yr. PD, Non-Fin. (bps) 12.21 13.07 13.65 14.41 11.411Yr. PD, Fin. 47.35 45.17 55.56 55.96 37.28ASPI 6283 6535 6228 6062 6747USD/LKR 145.70 146.67 149.71 152.13 153.363m Interbank (%) 9.88 11.00 11.01 11.26 11.30GDP (YoY%) 2.4 4.6 5.3 3.8 –Money Supply (YoY%) 17.20 19.10 18.90 21.20 21.30*Sov. Rating, Moody’s B1 B1 B1 B1 B1Sov. Rating, S&P B+ B+ B+ B+ B+
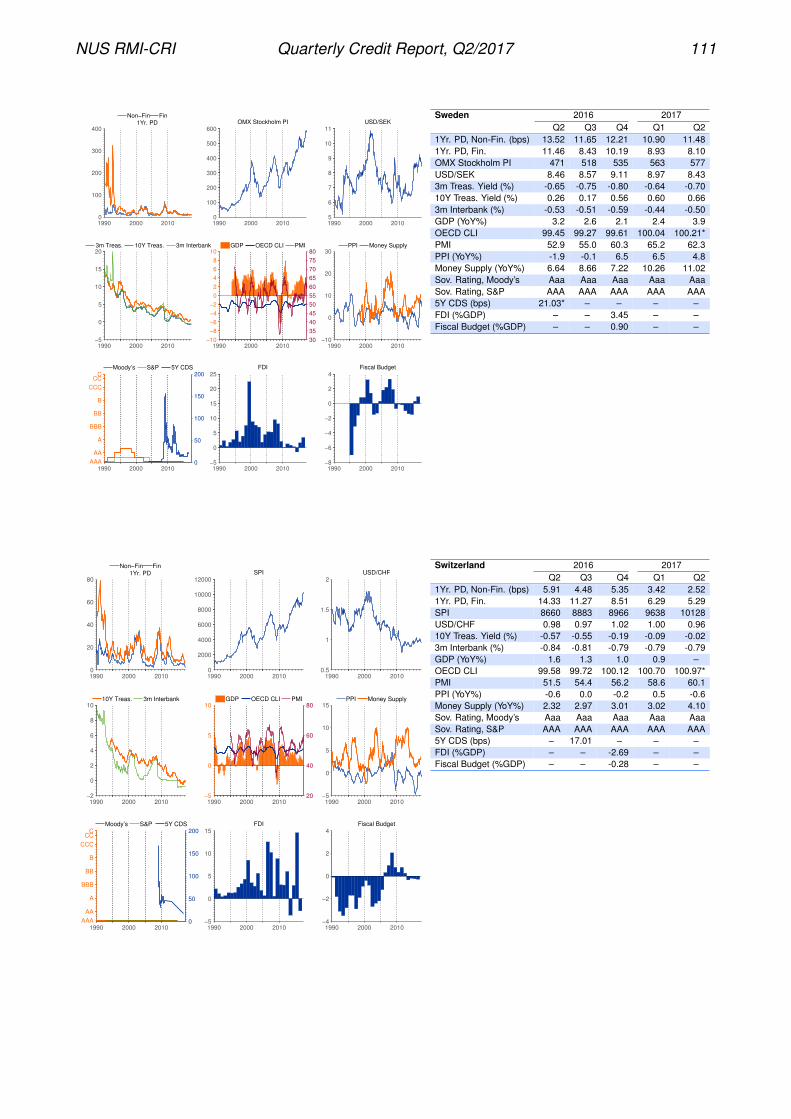
NUS RMI-CRI Quarterly Credit Report, Q2/2017 111
1990 2000 20100
100
200
300
4001Yr. PD
Non−Fin Fin
1990 2000 20100
100
200
300
400
500
600OMX Stockholm PI
1990 2000 20105
6
7
8
9
10
11USD/SEK
1990 2000 2010−5
0
5
10
15
20
3m Treas. 10Y Treas. 3m Interbank
1990 2000 2010−10
−8
−6
−4
−2
0
2
4
6
8
10
30
35
40
45
50
55
60
65
70
75
80GDP OECD CLI PMI
1990 2000 2010−10
0
10
20
30
PPI Money Supply
1990 2000 2010AAA
AA
A
BBB
BB
B
CCC
CCC
0
50
100
150
200Moody’s S&P 5Y CDS
1990 2000 2010−5
0
5
10
15
20
25FDI
1990 2000 2010−8
−6
−4
−2
0
2
4Fiscal Budget
Sweden 2016 2017Q2 Q3 Q4 Q1 Q2
1Yr. PD, Non-Fin. (bps) 13.52 11.65 12.21 10.90 11.481Yr. PD, Fin. 11.46 8.43 10.19 8.93 8.10OMX Stockholm PI 471 518 535 563 577USD/SEK 8.46 8.57 9.11 8.97 8.433m Treas. Yield (%) -0.65 -0.75 -0.80 -0.64 -0.7010Y Treas. Yield (%) 0.26 0.17 0.56 0.60 0.663m Interbank (%) -0.53 -0.51 -0.59 -0.44 -0.50GDP (YoY%) 3.2 2.6 2.1 2.4 3.9OECD CLI 99.45 99.27 99.61 100.04 100.21*PMI 52.9 55.0 60.3 65.2 62.3PPI (YoY%) -1.9 -0.1 6.5 6.5 4.8Money Supply (YoY%) 6.64 8.66 7.22 10.26 11.02Sov. Rating, Moody’s Aaa Aaa Aaa Aaa AaaSov. Rating, S&P AAA AAA AAA AAA AAA5Y CDS (bps) 21.03* – – – –FDI (%GDP) – – 3.45 – –Fiscal Budget (%GDP) – – 0.90 – –
1990 2000 20100
20
40
60
801Yr. PD
Non−Fin Fin
1990 2000 20100
2000
4000
6000
8000
10000
12000SPI
1990 2000 20100.5
1
1.5
2USD/CHF
1990 2000 2010−2
0
2
4
6
8
10
10Y Treas. 3m Interbank
1990 2000 2010−5
0
5
10
20
40
60
80GDP OECD CLI PMI
1990 2000 2010−5
0
5
10
15
PPI Money Supply
1990 2000 2010AAA
AA
A
BBB
BB
B
CCC
CCC
0
50
100
150
200Moody’s S&P 5Y CDS
1990 2000 2010−5
0
5
10
15FDI
1990 2000 2010−4
−2
0
2
4Fiscal Budget
Switzerland 2016 2017Q2 Q3 Q4 Q1 Q2
1Yr. PD, Non-Fin. (bps) 5.91 4.48 5.35 3.42 2.521Yr. PD, Fin. 14.33 11.27 8.51 6.29 5.29SPI 8660 8883 8966 9638 10128USD/CHF 0.98 0.97 1.02 1.00 0.9610Y Treas. Yield (%) -0.57 -0.55 -0.19 -0.09 -0.023m Interbank (%) -0.84 -0.81 -0.79 -0.79 -0.79GDP (YoY%) 1.6 1.3 1.0 0.9 –OECD CLI 99.58 99.72 100.12 100.70 100.97*PMI 51.5 54.4 56.2 58.6 60.1PPI (YoY%) -0.6 0.0 -0.2 0.5 -0.6Money Supply (YoY%) 2.32 2.97 3.01 3.02 4.10Sov. Rating, Moody’s Aaa Aaa Aaa Aaa AaaSov. Rating, S&P AAA AAA AAA AAA AAA5Y CDS (bps) – 17.01 – – –FDI (%GDP) – – -2.69 – –Fiscal Budget (%GDP) – – -0.28 – –

NUS RMI-CRI Quarterly Credit Report, Q2/2017 112
1990 2000 20100
50
100
150
200
2501Yr. PD
Non−Fin Fin
1990 2000 20102000
4000
6000
8000
10000
12000
14000TAIEX
1990 2000 201024
26
28
30
32
34
36USD/TWD
1990 2000 20100
1
2
3
4
5
6
10Y Treas. 3m Interbank
1990 2000 2010−10
0
10
20
45
50
55
60GDP PMI
1990 2000 20100
5
10
15
20
25
Money Supply
1990 2000 2010AAA
AA
A
BBB
BB
B
CCC
CCC
Moody’s S&P
1990 2000 2010−15
−10
−5
0
5Fiscal Budget
Taiwan 2016 2017Q2 Q3 Q4 Q1 Q2
1Yr. PD, Non-Fin. (bps) 1.50 1.10 0.87 0.65 0.451Yr. PD, Fin. 5.13 4.03 2.72 2.14 1.40TAIEX 8667 9167 9254 9812 10395USD/TWD 32.26 31.36 32.33 30.35 30.4310Y Treas. Yield (%) 0.77 0.69* 1.22 1.12 1.103m Interbank (%) 0.69 0.66 0.66 0.66 0.66GDP (YoY%) 1.1 2.1 2.8 2.6 2.1PMI 50.5 52.2 56.2 56.2 53.3Money Supply (YoY%) 4.65 3.98 3.55 3.59 3.57Sov. Rating, Moody’s Aa3 Aa3 Aa3 Aa3 Aa3Sov. Rating, S&P AA- AA- AA- AA- AA-Fiscal Budget (%GDP) – – -0.34 – –
1990 2000 20100
200
400
600
800
10001Yr. PD
Non−Fin Fin
1990 2000 20100
500
1000
1500
2000SET
1990 2000 201020
30
40
50
60USD/THB
1990 2000 20101
2
3
4
5
6
7
3m Treas. 10Y Treas. 3m Interbank
1990 2000 2010−20
0
20
20
40
60GDP PMI
1990 2000 2010−20
−10
0
10
20
30
PPI Money Supply
1990 2000 2010AAA
AA
A
BBB
BB
B
CCC
CCC
0
100
200
300
400
500Moody’s S&P 5Y CDS
1990 2000 20100
2
4
6
8FDI
1990 2000 2010−5
−4
−3
−2
−1
0
1Fiscal Budget
Thailand 2016 2017Q2 Q3 Q4 Q1 Q2
1Yr. PD, Non-Fin. (bps) 3.76 3.67 2.78 2.77 2.981Yr. PD, Fin. 9.41 8.99 8.33 7.34 7.50SET 1445 1483 1543 1575 1575USD/THB 35.12 34.59 35.84 34.35 33.933m Treas. Yield (%) 1.36 1.45 1.50 1.48 1.4010Y Treas. Yield (%) 1.95 2.10 2.65 2.69 2.483m Interbank (%) 1.59 1.59 1.59 1.59 1.59GDP (YoY%) 3.6 3.2 3.0 3.3 –PMI 50.4 50.3 50.3 52.6 50.7PPI (YoY%) -1.4 -0.7 1.1 2.6 -1.2Money Supply (YoY%) 4.29 3.93 4.20 3.25 4.07Sov. Rating, Moody’s Baa1 Baa1 Baa1 Baa1 Baa1Sov. Rating, S&P BBB+ BBB+ BBB+ BBB+ BBB+5Y CDS (bps) 114.50 86.68 81.59 54.24 61.88

NUS RMI-CRI Quarterly Credit Report, Q2/2017 113
1990 2000 20100
20
40
60
80
1001Yr. PD
Non−Fin Fin
1990 2000 20101000
2000
3000
4000
5000
6000
7000TUSISE
1990 2000 20100.5
1
1.5
2
2.5USD/TND
1990 2000 20103
4
5
6
7
3m Treas.
1990 2000 20100
5
10
15
GDP
1990 2000 20100
5
10
15
20
25
Money Supply
1990 2000 2010AAA
AA
A
BBB
BB
B
CCC
CCC
Moody’s S&P
1990 2000 20100
2
4
6
8
10FDI
Tunisia 2016 2017Q2 Q3 Q4 Q1 Q2
1Yr. PD, Non-Fin. (bps) 11.33 7.64 5.39 5.24 5.241Yr. PD, Fin. 38.79 19.64 26.87 30.65 29.80TUSISE 5290 5342 5489 5543 6023USD/TND 2.20 2.20 2.32 2.29 2.45Money Supply (YoY%) 7.24 7.58 8.05 5.61 8.43Sov. Rating, Moody’s Ba3 Ba3 Ba3 Ba3 Ba3
1990 2000 20100
20
40
60
801Yr. PD
Non−Fin Fin
1990 2000 20100
2
4
6
8
10
12x 10
4 National 100
1990 2000 20100
1
2
3
4USD/TRY
1990 2000 20100
10
20
30
40
50
60
10Y Treas. 3m Interbank
1990 2000 2010−20
−10
0
10
20
−100
−50
0
50
100GDP OECD CLI PMI
1990 2000 2010−5
0
5
10
15
20
PPI Money Supply
1990 2000 2010AAA
AA
A
BBB
BB
B
CCC
CCC
0
1000
2000Moody’s S&P 5Y CDS
1990 2000 20100
1
2
3
4FDI
1990 2000 2010−15
−10
−5
0Fiscal Budget
Turkey 2016 2017Q2 Q3 Q4 Q1 Q2
1Yr. PD, Non-Fin. (bps) 28.72 28.01 23.35 19.56 15.771Yr. PD, Fin. 35.59 32.47 28.45 26.77 24.55National 100 76817 76488 78139 88947 100440USD/TRY 2.88 3.00 3.52 3.64 3.5210Y Treas. Yield (%) 9.03 9.52 11.08 10.65 10.273m Interbank (%) 9.50 8.91 9.90 12.12 12.71GDP (YoY%) 5.3 -1.3 3.5 5.0 –OECD CLI 6.05 6.86 7.27 7.45 –PMI 47.4 48.3 47.7 52.3 54.7Sov. Rating, Moody’s Ba1 Ba1 Ba1 Ba1 Ba1Sov. Rating, S&P BB BB BB BB BB5Y CDS (bps) 242.87 261.62 273.17 239.28 194.72FDI (%GDP) – – 1.43 – –Fiscal Budget (%GDP) – – -3.12 – –

NUS RMI-CRI Quarterly Credit Report, Q2/2017 114
1990 2000 20100
500
1000
1500
20001Yr. PD
Non−Fin Fin
1990 2000 20100
200
400
600
800
1000
1200PFTS
1990 2000 20100
5
10
15
20
25
30USD/UAH
1990 2000 20100
10
20
30
40
3m Treas. 10Y Treas. 3m Interbank
1990 2000 2010−20
−15
−10
−5
0
5
10
GDP
1990 2000 2010−20
0
20
40
60
80
PPI Money Supply
1990 2000 2010AAA
AA
A
BBB
BB
B
CCC
CCC
0
2000
4000
6000Moody’s S&P 5Y CDS
1990 2000 20100
2
4
6
8
10FDI
1990 2000 2010−6
−4
−2
0
2Fiscal Budget
Ukraine 2016 2017Q2 Q3 Q4 Q1 Q2
1Yr. PD, Non-Fin. (bps) 120.65 98.89 25.64 17.95 17.521Yr. PD, Fin. 125.23 33.53 95.71 162.87 130.76PFTS 223 240 265 272 286USD/UAH 24.83 25.93 27.30 27.06 26.083m Treas. Yield (%) 16.20 – 15.00 – –10Y Treas. Yield (%) 8.50 8.56 8.76 9.07 8.203m Interbank (%) 19.58 18.33 18.00 18.00 –GDP (YoY%) 1.5 2.3 4.8 2.5 –PPI (YoY%) 15.7 19.6 35.7 38.3 26.3Money Supply (YoY%) 6.20 12.60 10.90 6.70 6.50Sov. Rating, Moody’s Caa3 Caa3 Caa3 Caa3 Caa3Sov. Rating, S&P B- B- B- B- B-5Y CDS (bps) 761.68 757.10* – – –
1990 2000 20100
50
100
1501Yr. PD
Non−Fin Fin
1990 2000 20100
0.5
1
1.5
2x 10
4 NBAD
1990 2000 20103.665
3.67
3.675
3.68
3.685
3.69USD/AED
1990 2000 20100
1
2
3
4
5
6
3m Interbank
1990 2000 2010−20
0
20
40
50
55
60
65GDP PMI
1990 2000 2010−5
0
5
10
15
20
Money Supply
1990 2000 2010AAA
AA
A
BBB
BB
B
CCC
CCC
0
500
1000Moody’s 5Y CDS
United Arab Emirates 2016 2017Q2 Q3 Q4 Q1 Q2
1Yr. PD, Non-Fin. (bps) 16.11 19.26 13.27 17.86 18.131Yr. PD, Fin. 25.64 24.77 19.68 20.54 16.29USD/AED 3.67 3.67 3.67 3.67 3.673m Interbank (%) 1.13 1.27 1.48 1.47 1.51GDP (YoY%) – – 2.7 – –PMI 53.4 54.1 55.0 56.2 55.8Money Supply (YoY%) 2.03 3.52 5.11 6.70 7.20Sov. Rating, Moody’s Aa2 Aa2 Aa2 Aa2 Aa2

NUS RMI-CRI Quarterly Credit Report, Q2/2017 115
1990 2000 20100
20
40
60
80
1001Yr. PD
Non−Fin Fin
1990 2000 20100
2000
4000
6000
8000FTSE 100
1990 2000 2010
1.4
1.6
1.8
2
2.2GBP/USD
1990 2000 20100
5
10
15
20
3m Treas. 10Y Treas. 3m Interbank
1990 2000 2010−10
0
10
40
50
60GDP OECD CLI PMI
1990 2000 2010−10
−5
0
5
10
15
20
PPI Money Supply
1990 2000 2010AAA
AA
A
BBB
BB
B
CCC
CCC
0
100
200Moody’s S&P 5Y CDS
1990 2000 20100
2
4
6
8
10
12FDI
1990 2000 2010−15
−10
−5
0
5Fiscal Budget
United Kingdom 2016 2017Q2 Q3 Q4 Q1 Q2
1Yr. PD, Non-Fin. (bps) 19.73 15.71 15.28 12.31 12.161Yr. PD, Fin. 17.93 17.96 16.63 12.47 11.37FTSE 100 6504 6899 7143 7323 7313GBP/USD 1.33 1.30 1.23 1.25 1.303m Treas. Yield (%) 0.46 0.32 0.16 0.27 0.1710Y Treas. Yield (%) 0.87 0.75 1.24 1.14 1.263m Interbank (%) 0.56 0.38 0.37 0.34 0.31GDP (YoY%) 1.7 2.0 1.9 2.0 1.7OECD CLI 99.03 99.28 99.68 99.75 99.64*PMI 53.0 55.4 55.9 54.3 54.2PPI (YoY%) -0.2 1.2 2.9 3.7 3.3Money Supply (YoY%) 3.60 6.20 6.30 6.70 5.30Sov. Rating, Moody’s Aa1 Aa1 Aa1 Aa1 Aa1Sov. Rating, S&P AA AA AA AA AA5Y CDS (bps) 43.25 32.45 30.73 – 19.94FDI (%GDP) – – 11.44 – –Fiscal Budget (%GDP) – – -3.00 – –
1990 2000 20100
50
100
150
2001Yr. PD
Non−Fin Fin
1990 2000 20100
500
1000
1500
2000
2500S&P 500
1990 2000 2010−2
0
2
4
6
8
10
3m Treas. 10Y Treas. 3m Interbank
1990 2000 2010−10
−5
0
5
10
30
40
50
60
70GDP OECD CLI PMI
1990 2000 2010−10
−5
0
5
10
15
PPI Money Supply
1990 2000 2010AAA
AA
A
BBB
BB
B
CCC
CCC
0
100Moody’s S&P 5Y CDS
1990 2000 20100
1
2
3
4FDI
1990 2000 2010−15
−10
−5
0
5Fiscal Budget
United States 2016 2017Q2 Q3 Q4 Q1 Q2
1Yr. PD, Non-Fin. (bps) 7.84 6.56 5.37 4.30 3.951Yr. PD, Fin. 7.67 6.63 3.62 3.64 4.38S&P 500 2099 2168 2239 2363 24233m Treas. Yield (%) 0.26 0.27 0.50 0.75 1.0110Y Treas. Yield (%) 1.47 1.59 2.44 2.39 2.303m Interbank (%) 0.55 0.78 0.78 1.05 1.10GDP (YoY%) 1.2 1.5 1.8 2.0 2.1OECD CLI 99.10 99.21 99.58 99.72 99.60*PMI 52.8 51.7 54.5 57.2 57.8PPI (YoY%) -2.0 -0.1 1.9 3.7 2.2Money Supply (YoY%) 7.00 7.30 7.10 6.40 5.50Sov. Rating, Moody’s Aaa Aaa Aaa Aaa AaaSov. Rating, S&P AA+ AA+ AA+ AA+ AA+5Y CDS (bps) 19.89* – – – –FDI (%GDP) – – 2.29 – –Fiscal Budget (%GDP) – – -3.10 – –

NUS RMI-CRI Quarterly Credit Report, Q2/2017 116
1990 2000 20100
50
100
150
2001Yr. PD
Non−Fin Fin
1990 2000 20100
5
10
15x 10
4 IBVC
1990 2000 20100
2000
4000
6000
8000
10000
12000VEF/USD
1990 2000 20100
20
40
60
80
100
10Y Treas.
1990 2000 2010−20
−10
0
10
20
30
GDP
1990 2000 2010−100
0
100
200
300
400
PPI Money Supply
1990 2000 2010AAA
AA
A
BBB
BB
B
CCC
CCC
0
2000
4000
6000
8000
10000Moody’s S&P 5Y CDS
1990 2000 2010−2
0
2
4
6
8FDI
1990 2000 2010−6
−4
−2
0
2
4Fiscal Budget
Venezuela 2016 2017Q2 Q3 Q4 Q1 Q2
1Yr. PD, Non-Fin. (bps) 25.09 10.78 3.58 101.14 0.081Yr. PD, Fin. 14.82 22.51 6.20 3.53 0.26IBVC 12851 12961 31705 43877 123355VEF/USD 9987.50 9987.50 9987.50 9990.05 9985.0510Y Treas. Yield (%) 14.77 14.62 14.24 – –Money Supply (YoY%) 96.40 113.30 158.80 206.90 326.50Sov. Rating, Moody’s Caa3 Caa3 Caa3 Caa3 Caa3Sov. Rating, S&P CCC- CCC- CCC- CCC- CCC-5Y CDS (bps) 3892.00 2946.27 3749.67 3571.02 3562.06
1990 2000 20100
10
20
30
40
50
601Yr. PD
Non−Fin Fin
1990 2000 20100
200
400
600
800
1000
1200VNINDEX
1990 2000 20101
1.5
2
2.5x 10
4 VND/USD
1990 2000 20100
5
10
15
20
10Y Treas. 3m Interbank
1990 2000 20100
5
10
45
50
55GDP PMI
1990 2000 2010AAA
AA
A
BBB
BB
B
CCC
CCC
0
200
400
600
800Moody’s S&P 5Y CDS
1990 2000 2010−15000
−10000
−5000
0
5000FDI
Vietnam 2016 2017Q2 Q3 Q4 Q1 Q2
1Yr. PD, Non-Fin. (bps) 22.76 26.61 24.21 19.77 18.561Yr. PD, Fin. 20.57 20.20 21.08 18.24 10.88VNINDEX 632 686 665 722 776VND/USD 22304.00 22296.00 22761.00 22755.00 22731.0010Y Treas. Yield (%) 6.94 6.50 6.20 6.07 5.803m Interbank (%) 3.95 3.25 5.10 4.90 4.00GDP (YoY%) – – 6.2 – –PMI 52.6 52.9 52.4 54.6 52.5Sov. Rating, Moody’s B1 B1 B1 B1 B1Sov. Rating, S&P BB- BB- BB- BB- BB-5Y CDS (bps) – – – 197.34* –

NUS RMI-CRI Quarterly Credit Report, Q2/2017 117
D Data notes
This Appendix provides a comprehensive list of the macroeconomic and capital market dataprovided in Appendix C as well as their sources. Most of the data was obtained fromBloomberg. In some cases, the data was not available in Bloomberg and was obtaineddirectly from primary sources. In either case, the primary sources for the data are listed inthe tables below. The data was retrieved during July 2017 and every effort has been madeto verify its accuracy.
The last section of this Appendix describes the Probability of Default implied Rating (PDiR).The PDiR has been introduced to aid intuition about PD values for individual companies.
Stock index (top-center graph) The one-year return on an economy’s stock index is oneinput variable for RMI’s default forecast model. The stock indices used in the model are theones that are displayed in Appendix C. A list of the stock indices included in Appendix C canbe found here.
FX rate (top-right graph) Foreign exchange (FX) rates are quoted by market conventionagainst the US dollar. For Eurozone countries, a fixed official rate is used to convert thedomestic currency to the Euro prior to the introduction of the common currency. In thegraphs, the FX rate for the domestic currency before the economy adopted the Euro is inorange, and the FX rate for the Euro after the Euro was adopted is in blue. The table belowshows the conversion dates and rates. The exchange rate for the Cypriot Pound is excludeddue to scaling reasons.
Conversion to Euro
Economy ConversionDate
ConversionRate (perEuro)
Austria 31/12/1998 13.7603Belgium 31/12/1998 40.3399Estonia 31/12/2010 15.6466Finland 31/12/1998 5.94573France 31/12/1998 6.55957Germany 31/12/1998 1.95583Greece 31/12/2000 340.75Ireland 31/12/1998 0.787564
Economy ConversionDate
ConversionRate (PerEuro)
Italy 31/12/1998 1936.27Luxembourg 31/12/1998 40.3399Malta 31/12/2007 0.4293Netherlands 31/12/1998 2.20371Portugal 31/12/1998 200.482Slovakia 31/12/2008 30.126Slovenia 31/12/2006 239.64Spain 31/12/1998 166.386
10-year treasury bond yield (middle-left graph) All 10-year treasury bond yields are basedon Bloomberg indices except for the following list: Bank Negara Malaysia for Malaysia, KoreaFinancial Investment Association for South Korea and Philippine Dealing & Exchange Corpfor Philippines.
3-month government bond yield (middle-left graph) The primary sources of the 3-monthgovernment bond yields are listed in here.†
3-month interbank rate (middle-left graph) The primary sources of the 3-month interbankrates can be found here.
†The RMI CRI model uses Germany’s three-month Bubill rate for all eurozone countries after their adoptionof the euro. For the period before joining the eurozone, their own interest rates are used where available.

NUS RMI-CRI Quarterly Credit Report, Q2/2017 118
GDP (middle-center graph, left axis) Real GDP YoY changes are seasonally-adjustedexcept for China, Hong Kong, Iceland, India, Malaysia, Philippines, Singapore, South Korea,Taiwan and Thailand. A list of primary sources of the GDP data can be found here.
OECD CLI (middle-center graph, right axis) The OECD Composite Leading Indicator foreach economy is intended to provide early signals of turning points between different trendsin the economic cycle. For forecasting purposes, peaks in CLI are candidate early signalsof downturns in the economic cycle, and troughs in the CLI are candidate early signals ofupturns in the economic cycle. More information can be obtained at www.oecd.org/std/clits.The OECD CLI shown in Appendix C is amplitude adjusted with a deduction of 50 for thepurpose of presentation along with the PMI.
PMI (middle-center graph, right axis) The Purchasing Manager’s Index or similar indicesare used to reflect an economy’s manufacturing activities. An index reading above 50indicates an expansion of manufacturing activity while a reading below 50 indicates a con-traction. An exception is the Business Survey Index used in South Korea, which has 100as its benchmark. A list of primary sources of the Purchasing Managers Index data can befound here.
PPI (middle-right graph) The Producers’ Price Index or similar indices are presented asYoY changes. A list of primary sources of the Producers’ Price Index data can be foundhere.
Money Supply (middle-right graph) YoY growth of money supply uses M3 when it is avail-able for an economy. The exceptions are: Brazil, Chile, China, Cyprus, the Czech Republic,Indonesia, Jordan, Kazakhstan, Latvia, Lithuania, Mexico, Nigeria, Norway, Pakistan, Peru,Romania, Russia, Sri Lanka, Taiwan, Thailand and the US where M2 is used; and Croatiaand the UK where M4 is used. For Eurozone countries, data after the adoption of the Eurorepresents total money supply growth of the Euro. A list of primary sources of the MoneySupply data can be found here.
Sovereign credit ratings (bottom-left graph, left axis) For most of the economies, theStandard & Poor’s and Moody’s sovereign ratings are for foreign currency long term debt.Moody’s ratings for France, Germany, India, Japan, Netherlands, Singapore, Switzerland,Taiwan, United Kingdom and the United States are foreign currency long term issuer ratingsinstead. Among the above mentioned economies, France, Germany, Switzerland, UnitedKingdom and the United States ratings are cited from Moody’s website directly, with theremainder of the data from Moody’s and S&P retrieved from Bloomberg. For graphicalpurposes, selective or restricted defaults are reflected as C grades in the graphs. Forexample, according to S&P data, Indonesia had selective default events on March 29, 1999;April 17, 2000 and April 23, 2002, seen as C grades in the graphs above.
5Y CDS spread (bottom-left graph, right axis) 5-year Credit Default Swap spreads are foreach economy’s long term sovereign debt. All of the CDS data is sourced from Bloomberg.
FDI (bottom-center graph) FDI into each economy is presented as a percentage of GDP.The World Bank is the primary source of all FDI data.
Fiscal budget (bottom-right graph) Fiscal budget is presented as a percentage of GDP. Alist of primary sources of the Fiscal Budget data can be found here.

NUS RMI-CRI Quarterly Credit Report, Q2/2017 119
PDiR
The PDiR has been introduced to aid intuition about what different values of 1-year PD fromRMI-CRI’s default forecast model imply about a firm’s credit quality. In short, the 1-year PDfor a firm is used to imply a credit rating based on historically observed default rates for creditrating agency ratings.
Upperbound
PDiR (bps)AAA 0.16AA 2.39A 9.28BBB 35.95BB 139B 539CCC/C –
The table at right classifies firms into S&P-equivalent PDiR based ontheir 1-year PD. For example, if a firm has a 1-year PD of 50bps,then it will be assigned an S&P-equivalent rating of BB. The upperbounds for each PDiR are derived using default and rating transitiondata provided by credit rating agencies to the European Securities andMarkets Authority (ESMA) Central Ratings Repository.† RMI-CRI usesthis data to compute issuer-weighted 1-year average default rates (ADR)for each rating’s cohort, using ratings data from 2006-2015.
Computing the boundaries between different PDiR classes: Theblue circles in the graph below indicate the logarithm of the observedADR for firms rated by S&P with ratings from AA down to CCC/C.
Given the linear relationship between the observed log default rates andthe ratings, we interpolate the log default rate for each rating notch from this result by plottinga line of best fit through the observed points. We then take the boundary between PDiRclasses as the mid-point of the interpolated log default rates.
For example, the upper bound for BBB is computed as:
UB (BBB) = exp
(log (ADR (BBB)) + log (ADR (BB))
2
).
For the upper boundary for AAA firms, a mid-point of observed log ADR cannot be takenas the ADR is zero for S&P rated AAA firms. Instead, a line of best fit can be plottedthrough the six observed points for the other rating classes in order to extrapolate the orangesquares. However, taking the default rate based on the first extrapolated orange squareresults in a boundary that leads to a far larger fraction of PDiR-rated AAA firms as comparedto actual rated AAA firms. Thus, the boundary between AA and AAA is taken as the mid-pointbetween the first and second orange square.
1 (CCC/C) 2 (B) 3 (BB) 4 (BBB) 5 (A) 6 (AA) 8 (AAA)
−12
−10
−8
−6
−4
−2Log default rates of S&P Ratings
†Central Ratings Repository, European Securities and Markets Authority (ESMA).

NUS RMI-CRI Quarterly Credit Report, Q2/2017 120
About RMI and the Credit ResearchInitiative
The NUS RMI was established in August 2006 as a research institute at NUS dedicatedto the area of financial risk management. The establishment of RMI was supported bythe MAS under its program on Risk Management and Financial Innovation. RMI seeks tocomplement, support and develop Singapore’s financial sector’s knowledge and expertisein risk management, and thereby help to take on the challenges arising from globalization,structural change and volatile financial markets.
CRI is a non-profit project undertaken by NUS-RMI in response to the 2008-2009 GFC.The CRI takes a ”public good” approach to credit ratings by providing the outputs from ourdefault forecast system in a transparent, non-profit basis. In the current phase, the CRImodel generates PDs on a daily basis for corporate entities in 121 economies in Africa,Asia-Pacific, Europe, Latin America, the Middle East and North America. Our PD can serveas a benchmark against traditional rating agencies’ systems or internal credit analyses forindustry analysts and business professionals. For more information about RMI and the CRIproject, please visit our main site at http://rmicri.org
Usage, redistribution and publication of data
For more information please contact us:
Telephone: +65 6516 3380
Email: [email protected]
QCR Editors:
Dexter TanLiu Weiy-HsiaoLiu HanleiLisa Xu
Contributors to this issue:
Budi Andoro HartantoLu Chang