
Quantitative T2′-Mapping in Acute Ischemic Stroke
11
3280 T he aim of advanced stroke imaging is to detect the sever- ity of ischemic changes with regard to irreversibly dam- aged and potentially salvageable tissue reliably. Multimodal MRI, especially diffusion- and perfusion-weighted imaging (DWI, PWI) is a valuable tool in common-day stroke care with DWI allowing an estimate of the infarct core and PWI assessing the extent and severity of perfusion disturbances. Recently, the prognostic value of thresholded PWI on tissue fate has been proven in patients undergoing endovascular stroke treatment. 1 However, PWI depicts areas with impaired perfusion within the brain tissue without respect to poten- tial metabolic disturbances. In fact, the effect of perfusion impairment on brain metabolism may show substantial inter- individual variations. 2,3 Positron emission tomographic (PET) studies defined the penumbra as tissue with reduced cerebral blood flow (<20 mL/100 g per minute), relatively preserved oxygen consumption (cerebral metabolic rate of oxygen) and sig- nificantly increased oxygen extraction fraction (OEF). 4–6 The relaxation time T2′ can be expected to be an MRI-based surrogate parameter for detecting OEF changes because it is influenced by the blood oxygen saturation due to the blood-oxygen-level–dependent effect. 7 Although oxygen- ated haemoglobine is diamagnetic, deoxygenated haemo- globine is paramagnetic, leading to microscopic distortions of the static magnetic field and thus a faster signal decay in T2*-weighted images. For T2′ mapping, T2* values are corrected for T2 differences according to 1/T2′=1/T2*−1/ T2. It has been shown that T2′ maps provide robust informa- tion on the extent of blood oxygenation irrespective of sig- nal alterations caused by gliosis or edema. 8,9 Recently, our group has reported significant T2′ decreases in perfusion- impaired areas in patients with chronic high-grade intra- or extracranial stenosis of the anterior circulation, most likely Background and Purpose—Quantitative T2′-mapping detects regional changes in the relation of oxygenated and deoxygenated haemoglobine and might reflect areas with increased oxygen extraction. T2′-mapping in conjunction with an elaborate algorithm for motion correction was performed in patients with acute large-vessel stroke, and quantitative T2′-values were determined within the diffusion-weighted imaging lesion and perfusion-restricted tissue. Methods—Eleven patients (median age, 71 years) with acute middle cerebral or internal carotid artery occlusion underwent MRI before scheduled endovascular treatment. MR-examination included diffusion- and perfusion-weighted imaging and quantitative, motion-corrected mapping of T2′. Time-to-peak maps were thresholded for different degrees of perfusion delays (eg, ≥0 s, ≥ 2s) when compared with a reference time-to-peak value from healthy contralateral tissue. Mean T2′- values in areas with reduced apparent diffusion coefficient and in areas with impaired perfusion were compared with T2′-values in corresponding contralateral areas. Results—Median time between symptom onset and MRI was 238 minutes. T2′-values were significantly reduced within the apparent diffusion coefficient -lesion when compared with contralateral healthy tissue (83 ms [67, 97] versus 97 ms [91, 111]; P<0.003). In perfusion-restricted tissue, T2′-values were also significantly lower when compared with contralateral healthy tissue (ie, for time to peak, ≥0 s 93 ms [86, 102] versus 104 [90, 110]; P=0.008) but were significantly higher than within the apparent diffusion coefficient lesion. The severity of the perfusion impairment had no influence on median T2′-values. Conclusions—Motion-corrected T2′-mapping reveals significant and gradually declining values from healthy to perfusion-disturbed to apparent diffusion coefficient-restricted tissue. Current T2′-mapping can differentiate between the ischemic core and the perfusion-impaired areas but not on its own between penumbral and oligemic tissue. (Stroke. 2014;45:3280-3286.) Key Words: magnetic resonance imaging ◼ positron-emission tomography ◼ stroke Quantitative T2′-Mapping in Acute Ischemic Stroke Sonja Bauer; Marlies Wagner, MD; Alexander Seiler; Elke Hattingen, MD; Ralf Deichmann, PhD; Ulrike Nöth, PhD; Oliver C. Singer, MD Received June 23, 2014; final revision received August 22, 2014; accepted August 25, 2014. From the Department of Neurology (S.B., A.S., O.C.S.), Institute for Neuroradiology (M.W., E.H.); and Brain Imaging Center (R.D., U.N.), University Hospital Frankfurt, Goethe University, Frankfurt, Germany. The online-only Data Supplement is available with this article at http://stroke.ahajournals.org/lookup/suppl/doi:10.1161/STROKEAHA. 114.006530/-/DC1. Correspondence to Oliver C. Singer, MD, Department of Neurology, Goethe University, Schleusenweg 2–16, D-60528 Frankfurt/Main, Germany. E-mail [email protected] © 2014 American Heart Association, Inc. Stroke is available at http://stroke.ahajournals.org DOI: 10.1161/STROKEAHA.114.006530 by guest on March 23, 2018 http://stroke.ahajournals.org/ Downloaded from by guest on March 23, 2018 http://stroke.ahajournals.org/ Downloaded from by guest on March 23, 2018 http://stroke.ahajournals.org/ Downloaded from by guest on March 23, 2018 http://stroke.ahajournals.org/ Downloaded from by guest on March 23, 2018 http://stroke.ahajournals.org/ Downloaded from
Transcript of Quantitative T2′-Mapping in Acute Ischemic Stroke
3280
The aim of advanced stroke imaging is to detect the sever-ity of ischemic changes with regard to irreversibly dam-
aged and potentially salvageable tissue reliably. Multimodal MRI, especially diffusion- and perfusion-weighted imaging (DWI, PWI) is a valuable tool in common-day stroke care with DWI allowing an estimate of the infarct core and PWI assessing the extent and severity of perfusion disturbances. Recently, the prognostic value of thresholded PWI on tissue fate has been proven in patients undergoing endovascular stroke treatment.1 However, PWI depicts areas with impaired perfusion within the brain tissue without respect to poten-tial metabolic disturbances. In fact, the effect of perfusion impairment on brain metabolism may show substantial inter-individual variations.2,3
Positron emission tomographic (PET) studies defined the penumbra as tissue with reduced cerebral blood flow (<20 mL/100 g per minute), relatively preserved oxygen
consumption (cerebral metabolic rate of oxygen) and sig-nificantly increased oxygen extraction fraction (OEF).4–6 The relaxation time T2′ can be expected to be an MRI-based surrogate parameter for detecting OEF changes because it is influenced by the blood oxygen saturation due to the blood-oxygen-level–dependent effect.7 Although oxygen-ated haemoglobine is diamagnetic, deoxygenated haemo-globine is paramagnetic, leading to microscopic distortions of the static magnetic field and thus a faster signal decay in T2*-weighted images. For T2′ mapping, T2* values are corrected for T2 differences according to 1/T2′=1/T2*−1/T2. It has been shown that T2′ maps provide robust informa-tion on the extent of blood oxygenation irrespective of sig-nal alterations caused by gliosis or edema.8,9 Recently, our group has reported significant T2′ decreases in perfusion-impaired areas in patients with chronic high-grade intra- or extracranial stenosis of the anterior circulation, most likely
Background and Purpose—Quantitative T2′-mapping detects regional changes in the relation of oxygenated and deoxygenated haemoglobine and might reflect areas with increased oxygen extraction. T2′-mapping in conjunction with an elaborate algorithm for motion correction was performed in patients with acute large-vessel stroke, and quantitative T2′-values were determined within the diffusion-weighted imaging lesion and perfusion-restricted tissue.
Methods—Eleven patients (median age, 71 years) with acute middle cerebral or internal carotid artery occlusion underwent MRI before scheduled endovascular treatment. MR-examination included diffusion- and perfusion-weighted imaging and quantitative, motion-corrected mapping of T2′. Time-to-peak maps were thresholded for different degrees of perfusion delays (eg, ≥0 s, ≥ 2s) when compared with a reference time-to-peak value from healthy contralateral tissue. Mean T2′-values in areas with reduced apparent diffusion coefficient and in areas with impaired perfusion were compared with T2′-values in corresponding contralateral areas.
Results—Median time between symptom onset and MRI was 238 minutes. T2′-values were significantly reduced within the apparent diffusion coefficient -lesion when compared with contralateral healthy tissue (83 ms [67, 97] versus 97 ms [91, 111]; P<0.003). In perfusion-restricted tissue, T2′-values were also significantly lower when compared with contralateral healthy tissue (ie, for time to peak, ≥0 s 93 ms [86, 102] versus 104 [90, 110]; P=0.008) but were significantly higher than within the apparent diffusion coefficient lesion. The severity of the perfusion impairment had no influence on median T2′-values.
Conclusions—Motion-corrected T2′-mapping reveals significant and gradually declining values from healthy to perfusion-disturbed to apparent diffusion coefficient-restricted tissue. Current T2′-mapping can differentiate between the ischemic core and the perfusion-impaired areas but not on its own between penumbral and oligemic tissue. (Stroke. 2014;45:3280-3286.)
Key Words: magnetic resonance imaging ◼ positron-emission tomography ◼ stroke
Quantitative T2′-Mapping in Acute Ischemic StrokeSonja Bauer; Marlies Wagner, MD; Alexander Seiler; Elke Hattingen, MD;
Ralf Deichmann, PhD; Ulrike Nöth, PhD; Oliver C. Singer, MD
Received June 23, 2014; final revision received August 22, 2014; accepted August 25, 2014.From the Department of Neurology (S.B., A.S., O.C.S.), Institute for Neuroradiology (M.W., E.H.); and Brain Imaging Center (R.D., U.N.), University
Hospital Frankfurt, Goethe University, Frankfurt, Germany.The online-only Data Supplement is available with this article at http://stroke.ahajournals.org/lookup/suppl/doi:10.1161/STROKEAHA.
114.006530/-/DC1.Correspondence to Oliver C. Singer, MD, Department of Neurology, Goethe University, Schleusenweg 2–16, D-60528 Frankfurt/Main, Germany. E-mail
[email protected]© 2014 American Heart Association, Inc.
Stroke is available at http://stroke.ahajournals.org DOI: 10.1161/STROKEAHA.114.006530
by guest on March 23, 2018
http://stroke.ahajournals.org/D
ownloaded from
by guest on M
arch 23, 2018http://stroke.ahajournals.org/
Dow
nloaded from
by guest on March 23, 2018
http://stroke.ahajournals.org/D
ownloaded from
by guest on M
arch 23, 2018http://stroke.ahajournals.org/
Dow
nloaded from
by guest on March 23, 2018
http://stroke.ahajournals.org/D
ownloaded from

Bauer et al Oxygen-Sensitive MRI in Large-Vessel Stroke 3281
because of an increased OEF within severely perfusion-impaired regions.10
Being prone to motion artifacts, T2′-imaging is challenging in patients with acute stroke often being agitated and restless. This encouraged us to implement a new, in-house developed method for motion correction that was previously successfully evaluated for T2* mapping in patients with brain tumors or subarachnoid hemorrhage.11
In the present proof-of-concept study, we now assessed the feasibility of quantitative motion-corrected T2′ mapping in acute stroke focusing on T2′ values within the diffusion lesion and perfusion-impaired regions.
Materials and MethodsPatientsPatients were eligible to participate if the following inclusion criteria were met: age ≥18 years, acute ischemic stroke because of proxi-mal anterior circulation vessel occlusion confirmed by CT angiogra-phy, no contraindications for MRI, patient considered eligible for endovascular therapy by the attending stroke physician, and written informed consent by the patient or their legal representative for par-ticipation in the study. The study was approved by the Institutional Review Board of the medical faculty of the Goethe University. All pa-tients underwent a standardized stroke MRI protocol for the evalua-tion of potential eligibility for endovascular therapy. Within the study period (February 2013 to September 2013), we recruited 14 patients but had to exclude 3 patients because of poor image quality (motion artifacts, insufficient bolus arrival on PWI), leaving 11 patients for further analysis. Ten of the 11 patients received intravenous tissue-type plasminogen activator before or during stroke MRI. Five of the 11 patients underwent MRI examination under mechanical ventila-tion and sedation for medical reasons. T2′ mapping was performed for scientific purposes only; the results were not part of the treatment decision for or against endovascular therapy.
MRI ProtocolMRI was performed using a 3 Tesla whole-body scanner (Magnetom Verio 3T; Siemens Healthcare, Erlangen, Germany) with a body transmit and an 8-channel phased array head receive coil. The stan-dard stroke MRI protocol included DWI, apparent diffusion coeffi-cient (ADC) mapping, FLAIR imaging, time-of-flight-angiography, and PWI. For study purposes, quantitative T2 and T2* mapping was performed to obtain T2′ maps. PWI sequences were performed after quantitative T2 and T2* mapping. The total measurement time was 20:51 minutes.
DWI was measured with a single-shot echo-planar imaging spin-echo sequence using the following parameters: echo time (TE) 88 ms, repetition time 4900 ms, field-of-view 220×220 mm2, matrix size 130×130, 25 axial slices, slice thickness 5 mm, gap 0.5 mm, band-width 1425 Hz/Px, and b=1000 s/mm2. The commercially available scanner software package was used to calculate ADC maps for fur-ther analysis.
PWI were acquired with a gradient echo echo-planar imaging se-quence. Imaging parameters were TE 30 ms, repetition time 1500 ms, flip angle 90°, field-of-view 230×230 mm2, matrix size 128×128, 19 axial slices, slice thickness 4 mm, 1.2 mm gap, bandwidth 1447 Hz/Px. The intravenous contrast agent gadobutrol (0.1 mmol/kg, gado-linium; Gadovist; Bayer) was automatically applied by a power injec-tor at a flow rate of 5 mL/s followed by a 20-mL bolus of 0.9% saline. The scanner software package was used to calculate time-to-peak (TTP) maps.
For quantitative T2* mapping, a multislice, multigradient echo se-quence was used sampling a total of 8 gradient echoes as described earlier.11–13 Echo formation was achieved by successively inverting the readout gradient and acquiring all echoes under the same readout gradient polarity to avoid artifacts. Imaging parameters were linear
TE increase from 10 to 52 ms with a constant increment of 6 ms, repetition time 1500 ms, flip angle 30°, field-of-view 240×180 mm2, matrix size 192×144 (readout×phase encoding), 25 axial slices, slice thickness 2 mm, no interslice gap, bandwidth=299 Hz/Px, measure-ment time 3:36 minutes. For movement correction of T2* maps, this acquisition was repeated twice with reduced coverage in phase en-coding direction acquiring only 50% and 25% of k-space lines cover-ing central k-space. This added an additional measurement time of 1:57 and 1:03 minutes, respectively. Magnitude and phase data were exported for further analysis.
For quantitative T2 mapping a turbo spin-echo sequence was used with 4 different TEs: 16, 64, 96, and 128 ms. Sequence parameters were repetition time 4670 ms, field-of-view 240×180 mm2, matrix size 192×144 (readout x phase encoding), 25 axial slices, slice thick-ness 2 mm, no interslice gap, bandwidth 100 Hz/Px, 180° refocusing pulse, and an acceleration factor of 11.
Postprocessing of MRI DataMotion correction of T2*-weighted data and calculation of T2 and T2* maps were performed with custom built programs written in MATLAB (MATLAB; The Mathworks Inc, Natick, MA). Tissue segmentation, brain extraction, and coregistration of data were per-formed using the FMRIB Software Library (FSL, http://www.fmrib.ox.ac.uk/fsl).
The calculation of T2′ requires simultaneous mapping of T2 and T2*. It has been shown that T2* mapping is extremely sensitive to subject motion, requiring suitable correction.13 Therefore, we imple-mented an in-house 3-step motion correction algorithm described in detail recently.11 Its clinical suitability for reducing motion artifacts in T2*-maps was shown in patients with brain tumors and subarachnoid hemorrhages.11 Because it can be expected that subject motion will have a similar effect on T2′ maps that are based on T2* quantifica-tion, the same correction algorithm was used for this study. Figure 1 shows 2 examples of the effect of motion-correction on the quality of T2′ maps.
In short, movement is detected via the correlation coefficient of the pixel-wise exponential T2* fit. For each of the 3 input data sets (100%, 50%, and 25% resolution in phase encoding direction), ex-ponential T2* fitting is performed. Subsequently, a target data set with reduced movement artifacts is constructed in image space by choosing for each pixel the input data yielding the best exponential fit; then, fitting of the target k-space data by weighted combination of
Figure 1. Illustration of the effect of motion correction on T2′ maps. Top, Patient no 9; bottom, patient no 4. Left to right, T2 map, T2′ map with motion correction, T2′ map without motion correction. For visualization purposes, T2 and T2′ maps were masked, showing only voxels with T2<300 ms to reduce cerebro-spinal fluid signal. Note the motion artifacts in the uncorrected T2′ maps (hyper- and hypointense areas) and the reduction of artifacts after motion correction.
by guest on March 23, 2018
http://stroke.ahajournals.org/D
ownloaded from

3282 Stroke November 2014
the original k-space data yields a final T2* map with strongly reduced motion artifacts.
T2 maps were obtained by exponential fitting of the linearly coreg-istered T2-weighted data sets; T2 maps were then coregistered onto the respective motion-corrected T2* maps for further analysis. T2′ maps were calculated using the equation: 1/T2′=1/T2*−1/T2. To ex-clude zero-voxels and voxels with cerebrospinal fluid, only T2′ values between 1 and 300 ms were included for further analysis.
In a next step, ADC and TTP maps were coregistered with the T2′ maps. Because a direct coregistration is not possible due to a lack of white and gray matter contrast in the ADC and TTP maps, the following procedure was used: The first PWI and the reference im-age (b=0) of the diffusion measurement were coregistered with the motion-corrected T2*-weighted data using nonlinear coregistration. The resulting coregistration matrices were then applied to the TTP and ADC maps, respectively. The coregistered TTP and ADC maps served for further lesion delineation.
Regions of Interest Placement and Data AnalysisTwo major analyses were performed: first, T2′ values were assessed within the ischemic core, operationally defined by the area with reduced ADC values after setting a threshold of <550×10–6 mm2/s. Second, T2′ values were assessed within perfusion-disturbed regions on TTP maps using different TTP thresholds from the TTP reference value.
Regions of interest (ROI) placement and assessment were per-formed with the software ImageJ version 1.46r (http://imagej.nih.gov/ij). Ischemic lesions were defined as areas with visible hypoin-tensities within the thresholded ADC maps. These lesions were man-ually outlined by a rater blinded to clinical and other imaging data, and then the size and the extent of ADC reduction were assessed. The infarct volume was calculated by summing up the lesion areas on the affected slices, multiplied by the slice thickness including the gap between slices. The coregistered ADC-ROIs were applied to the T2′ maps to obtain mean T2′ values within the ADC-reduced regions. Both the affected and the corresponding contralateral unaffected side were evaluated by flipping each ROI.
To assess T2′ values in areas with different grades of perfusion impairment, a series of masks highlighting areas with different TTP delays was generated. It should be noted that the TTP delays reported in this study are not the absolute values obtained from the TTP maps but rather represent the difference between the absolute local TTP values and a TTP reference obtained in healthy tissue. In detail, the reference value was defined as the mean TTP value of 3 consecutive slices of the normally perfused contralateral hemisphere measured inside a standardized circular ROI (1177 mm2) placed within the terri-tory of the middle cerebral artery. Accordingly, perfusion impairment was assessed in regions with TTP delays of ≥0, ≥2, ≥4, and ≥6 s for the affected side. Furthermore, ROIs of different ranges of TTP delay were created (ie, TTP delays of 0–2, 2–4, and 4–6 s). The rationale for this procedure was to distinguish between different degrees of perfusion impairment better. The TTP delay masks were then placed onto the coregistered T2′ maps to assess mean T2′ values within per-fusion-restricted lesions, as well as within corresponding areas of the contralateral unaffected hemisphere (Figure 2).
Because TTP-ROIs occasionally overlapped with ADC-ROIs, the ADC-ROI was excluded from the TTP-ROI to obtain ROIs only cov-ering perfusion-restricted but not ADC-reduced areas (Figure 2). This was done for better separation between different tissue compartments.
Statistical AnalysisTo account for physiological intersubject variations in T2′ values, ratios of T2′ values (T2′ affected side/T2′ unaffected side) were obtained as well. Because several parameters were not normally distributed, only nonparametric tests were used (ie, the Wilcoxon signed-rank test, Kruskal–Wallis test, or the Spearman rank test). A value of P<0.05 was considered significant. For statistical analysis SPSS 20 (IBM SPSS Statistics; SPSS Inc, Armonk, NY) was used. Throughout the subsequent Results section, data are given as median (25th, 75th percentile), unless indicated otherwise.
ResultsClinical DataBasic clinical data are summarized in Table 1. Median age of the 11 patients (5 men) was 71 (60, 77) years, median National Institutes of Stroke Scale score at admission was 15 (12, 18). Six patients had proximal middle cerebral artery occlusion, 1 had middle cerebral artery branch occlusion and 4 had combined internal carotid artery and middle cerebral artery occlusion. Median time between symptom onset and MRI was 238 (198, 297) minutes, but symptom onset was not exactly assessable in 2 patients. Five patients underwent MRI examination under sedation and mechanical ventilation
Figure 2. Regions of interest (ROI)-placement on coregistered maps. The area with visibly decreased apparent diffusion coef-ficient (ADC) was outlined manually on ADC maps (A). On time-to-peak (TTP)- perfusion-weighted imaging maps, areas with restricted perfusion were outlined manually using different thresholds to account for differences in the severity of perfu-sion disturbances (B). The ADC- and the TTP-ROIs were then transferred to the coregistered T2′ map (C) for the assessment of T2´ values. T2′ values in 2 different regions were obtained: ADC lesion (areas 1+3), perfusion-restricted lesion (area 2). If the perfusion-restricted lesion overlapped with the ADC lesion, the ADC lesion was subtracted from the perfusion lesion (overlap marked with 3).
Table 1. Basic Clinical Data
Patient No.Age, y/Sex
Affected Hemisphere
Site of Occlusion FiO
2*
Initial NIHSS
Onset-to-MRI Time, min†
1 76/F Left MCA M1 0.6 18 ...
2 44/F Left ICA and MCA
0.6 30 238
4 69/M Right MCA M1 0.5 15 204
5 77/M Right MCA M1 ... 14 300
7 72/F Left ICA and MCA
0.6 20 400
8 69/F Left MCA M1 ... 17 272
9 84/F Right MCA M1 ... 6 223
10 50/M Right ICA and MCA
... 12 256
12 80/F Right ICA and MCA
1.0 18 191
13 58/M Left MCA M1 ... 12 233
14 60/F Left MCA M2 ... 8 ...
ICA indicates internal carotid artery; MCA, middle cerebral artery; and NIHSS, National Institutes of Stroke Scale.
*Inspiratory oxygen content in patients under mechanical ventilation during MRI.
†Exact symptom onset not assessable for 2 patients.
by guest on March 23, 2018
http://stroke.ahajournals.org/D
ownloaded from

Bauer et al Oxygen-Sensitive MRI in Large-Vessel Stroke 3283
(FiO2 content, 0.5–1.0). We did not detect statistically sig-
nificant differences in T2′ values neither in the healthy hemisphere nor in the ADC- or perfusion-disturbed regions between mechanically ventilated and nonintubated patients (data not shown in detail).
T2′ Values Within the ADC LesionMedian ADC lesion size was 31 (10, 135) mL, ranging from 1 to 163 mL. The median ADC value within the lesion was 455×10−6 (435, 485) mm2/s and 771×10−6 (741, 826) mm2/s in the corresponding contralateral area (P<0.003; Table 2).
T2′ values within the ADC lesion were compared with the corresponding contralateral T2′ values. T2′ values were significantly lower (83 [67, 97] ms) within the ADC lesion when compared with the corresponding tissue of the contra-lateral healthy hemisphere (97 [91, 111] ms; P<0.003). On a single subject level, T2′ values were lower in each individual within the ADC lesion when compared with the correspond-ing healthy region. The median T2′ ratio was 0.86 (0.82, 0.94; Table 2). No significant correlations were detected between
T2´ values and the ADC lesion size or the extent of the ADC reduction (data not shown in detail).
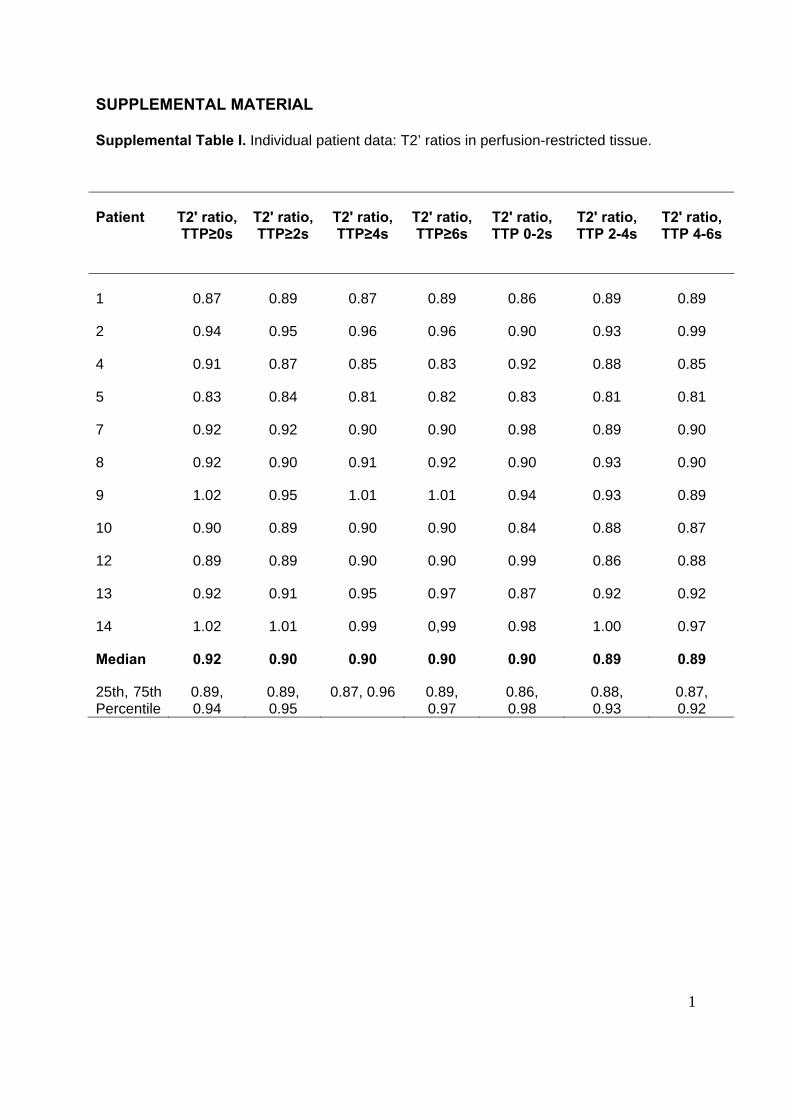
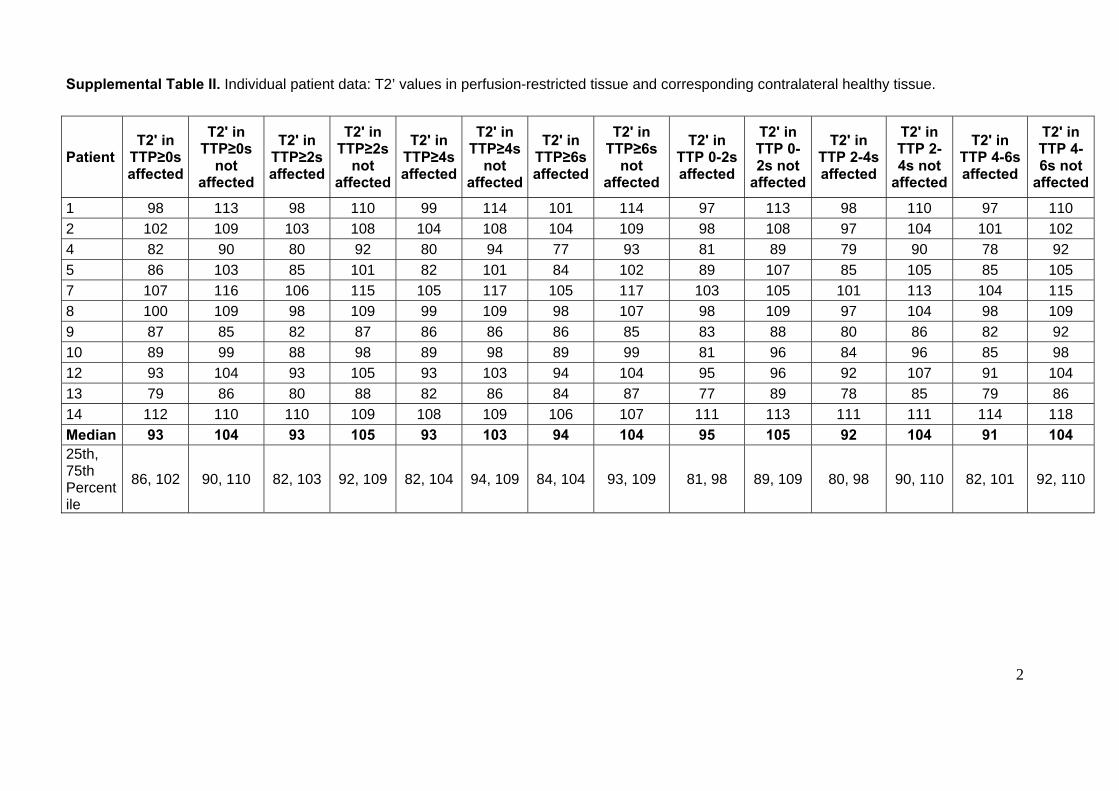
T2′ Values Within Perfusion-Restricted TissueThe size of the perfusion lesions outlined using incremental TTP thresholds decreased with increasing TTP delay ranging from 223 (162, 245) mL in TTP≥0 s maps to 102 (61, 146) mL in TTP≥6 s maps. T2′ values were significantly reduced in all perfusion-restricted areas when compared with healthy contralateral tissue. Median T2′ values ranged between 91 and 95 ms in perfusion-disturbed and 103 to 105 ms in contralat-eral healthy tissue (Table 3). The T2′ ratio ranged between 0.89 and 0.92. Results were similar using different ranges of perfusion-disturbed tissue (TTP delay, 0–2, 2–4, 4–6 s). There was a numeric but nonsignificant trend toward lower T2′ val-ues with increasing TTP ranges from 95 (81, 98) ms (TTP, 0–2 s) over 92 (80, 98) ms (TTP, 2–4 s) to 91 (82, 101) ms (TTP 4–6 s; Table 3). On a single subject level, 2 patients had slightly elevated T2′ values within perfusion-restricted areas (T2′ ratios of 1.01 and 1.02, respectively; Tables I and II in the online-only Data Supplement). No significant correlations
Table 2. ADC Lesions and T2′ Values Within ADC-Restricted Tissue
PatientADC Lesion
Size, mLADC Value Affected Side, ×10–6 mm2/s
ADC Value Unaffected Side, ×10–6 mm2/s
T2′ in ADC Lesion, Affected Side, ms
T2′ in Corresponding Unaffected Side, ms T2′ Ratio*
1 50 331 751 97 111 0.87
2 31 440 671 83 88 0.94
4 66 471 826 78 95 0.82
5 10 469 759 58 97 0.60
7 5 493 887 115 122 0.94
8 163 435 771 93 108 0.86
9 1 512 780 67 72 0.93
10 157 455 741 80 97 0.82
12 135 454 810 90 107 0.84
13 17 387 713 59 91 0.65
14 27 485 864 105 111 0.95
Median 31 455 771 83 97 0.86
25th, 75th percentile
10, 135 435, 485 741, 826 67, 97 91, 111 0.82, 0.94
ADC indicates apparent diffusion coefficient.*T2′ ratio was calculated dividing the T2′ value within the ADC lesion by the T2′ value of the corresponding contralateral healthy area.
Table 3. T2′ Values Within Perfusion-Restricted Tissue
Region Lesion Volume, mL T2′ Hypoperfused, ms T2′ Control, ms T2′ Ratio P Value*
Perfusion thresholds
TTP≥0 s 223 (162, 245) 93 (86, 102) 104 (90, 110) 0.92 (0.89, 0.94) 0.008
TTP≥2 s 183 (120, 233) 93 (82, 103) 105 (92, 109) 0.90 (0.89, 0.95) 0.004
TTP≥4 s 148 (83, 202) 93 (82, 104) 103 (94, 109) 0.90 (0.87, 0.96) 0.004
TTP≥6 s 102 (61, 146) 94 (84, 104) 104 (93, 109) 0.90 (0.89, 0.97) 0.004
Perfusion ranges
TTP 0–2 s 81 (72, 106) 95 (81, 98) 105 (89, 105) 0.90 (0.86, 0.98) 0.003
TTP 2–4 s 86 (70, 108) 92 (80, 98) 104 (90, 110) 0.89 (0.88, 0.93) 0.005
TTP 4–6 s 78 (53, 95) 91 (82, 101) 104 (92, 110) 0.89 (0.87, 0.92) 0.003
TTP indicates time to peak.*Wilcoxon signed-rank test between T2′ hypoperfused and T2′ control.
by guest on March 23, 2018
http://stroke.ahajournals.org/D
ownloaded from

3284 Stroke November 2014
were found between the size of the perfusion lesion and T2′ values (data not shown in detail).
Differences of T2′ Values Within ADC Lesions and Perfusion-Restricted TissueT2′ values within the ADC lesion (median T2′ value, 83 ms) were significantly lower than within perfusion-restricted areas (Figure 3). Differences were statistically significant for all TTP delays and perfusion ranges: TTP delay ≥0 s: (T2′=93 ms) P=0.016; TTP delay ≥2 s: (T2′=93 ms), P=0.021; TTP delay ≥4 s: (T2′=93 ms) P=0.021; TTP delay ≥6 s: (T2′=94 ms), P=0.029; TTP range 0 to 2 s: (T2′=95 ms), P=0.028; TTP range 2 to 4 s: (T2′=92 ms), P=0.029; TTP range 4 to 6 s: (T2′=91 ms), P=0.038. Accordingly, the T2′ ratio within the ADC lesion (0.86) was significantly lower than the T2′ ratio of perfusion-impaired tissue (ie, TTP delay ≥0 s: 0.92; P=0.011).
DiscussionThe major finding of this study on motion-corrected quantita-tive T2′ mapping is that T2′ values were significantly lower in ADC lesions when compared with perfusion-disturbed tissue and both significantly lower than in healthy tissue. This find-ing may open the door for more elaborate metabolic imaging in acute stroke leading to optimized tissue characterization.
Sedation and mechanical ventilation is frequently neces-sary in patients with acute large-vessel stroke scheduled for MRI or endovascular procedures, raising the concern of pos-sible interference between mechanical ventilation and T2′ signal changes because T2′ values are linked to blood oxy-genation. However, comparison of T2′ values within vari-ous compartments (unaffected hemisphere, ADC lesion, all perfusion-disturbed regions) in ventilated and nonventilated patients did not reveal any statistically significant differences. This finding is in accordance with previously published data from our group, showing that T2′ values remained unchanged
when hyperoxic inhalation was compared with normoxia in healthy volunteers.14
T2′ Values Within the ADC LesionT2′ values were significantly lower within the ADC lesion than in respective areas on the contralateral healthy hemi-sphere and significantly lower than in perfusion-restricted tissue. A previous study using T2′ mapping in acute stroke also found a more pronounced shortening of T2′ in DWI-positive areas than in surrounding penumbral tissue.15 Nevertheless, this finding seems contraintuitive given the fact that DWI-positive tissue is commonly regarded as the ischemic core, characterized by a reduced cerebral metabolic rate of oxygen, which in turn should lead to reduced oxygen demands, a lowered OEF and therefore increased T2′ val-ues.16 But tissue viability within DWI lesions is more het-erogeneous than previously thought, containing penumbral and infarcted tissue, both exhibiting substantially different metabolic demands.17 In addition, PET studies in baboons and humans clearly demonstrated that OEF may be initially increased in the ischemic core.6,18 Heterogeneous findings of OEF changes within the DWI lesion in comparative PET-MRI studies are best explained by the time point of MRI/PET imaging (higher OEF rates in patients examined at ear-lier time points) and reperfusion status (higher OEF rates within the DWI lesion in patients with reduced cerebral blood flow).17,19 Finally, impaired perfusion within the DWI lesion does lead not only to a reduced blood and oxygen supply but also to a slowed removal of previously produced deoxygenated haemoglobine, also contributing to reduced T2′ values within the DWI lesion.
T2′ Values in Perfusion-Restricted TissueWe found a significant T2′ reduction in perfusion-impaired when compared with non–perfusion-restricted tissue, a find-ing being in line with data from a previous study using a different imaging sequence for T2′ assessment.15 Again, the T2′ reduction is best explained by an increase of deoxygen-ated haemoglobine because of an OEF increase within the area of impaired perfusion. A study correlating MRI-derived TTP abnormalities with PET-based OEF measurement dem-onstrated elevated OEF values, indicating a metabolic com-pensation in hypoperfused tissue.16 In the present study, a restriction of T2′ analysis to severely perfusion-disturbed tis-sue using incremental thresholds or ranges for the perfusion lesion (ie, TTP ≥0, ≥2, 0–2, and 2–4 s) did not lead to sub-stantial changes in median T2′ values. Even in regions with only slight impairment of perfusion (TTP ≥0 s but ≤2 s), T2′ values were significantly lower than in contralateral healthy areas and did not differ significantly from median T2′ values within more severely perfusion-restricted tissue. This finding is in line with PET studies in patients with acute stroke, dem-onstrating that OEF is increased not only in the ischemic core and penumbral regions but also in oligemic tissue.6,16 However, it has to be kept in mind that the T2′ changes in perfusion-impaired tissue may also be influenced by other factors than an increase in OEF alone. Lower perfusion itself may also lead to lower deoxygenated haemoglobine concentrations per
Figure 3. Box-plot of T2′ values within different tissue compart-ments: gray bars show reference values within contralateral healthy tissue within the mirrored time-to-peak (TTP) lesion and within the mirrored apparent diffusion coefficient (ADC) lesion. White bars show T2′ values within the perfusion-impaired tissue (TTP delay ≥0 s) and within the ADC lesion. Note the stepwise and significant reduction of T2′ values among healthy tissue, perfusion-impaired regions, and the ADC lesion.
by guest on March 23, 2018
http://stroke.ahajournals.org/D
ownloaded from

Bauer et al Oxygen-Sensitive MRI in Large-Vessel Stroke 3285
voxel probably increasing T2′ values and, therefore, attenuat-ing the T2′ reduction caused by increased oxygen extraction.
Differences of T2′ Values Within ADC Lesions and Perfusion-Restricted Tissue/Technical ConsiderationsIn contrast to previous studies,15 we were able to detect sig-nificantly lower T2′ values within ADC lesions when com-pared with surrounding perfusion-restricted tissue (Figure 3), with an approximate decrease of 6%. Although this difference was numerically small, the finding was robust, attaining sta-tistical significance for all TTP delays and TTP ranges under investigation. This result is of special interest because it may open the door for a better tissue characterization in acute stroke beyond the shortcomings of an MRI-based DWI and PWI with its limited ability to differentiate between ischemic core, penumbral tissue, and oligemia precisely. However, a validation of T2′ imaging against PET is paramount to clarify the pathophysiologic changes in cerebral perfusion and brain metabolism leading to T2′ changes.
It should be noted that improved imaging sequences and postprocessing algorithms were applied in this study. For example, fitting of T2* and T2 was based on the acquisition of 8 and 4 data points, respectively, with different TE. In com-parison, a previous study in the same field used 3-point fitting both for T2 and T2*.15 Furthermore, the imaging sequences used a spatial resolution of 1.25×1.25×2 mm3, which is con-siderably higher than in previously published studies on T2′ imaging.15,20 The higher spatial resolution allows for a better delineation between the different tissue compartments (ie, ADC lesion and perfusion lesion) and reduces partial-volume effects, the latter presumably being the main reason why the setup presented here allowed to detect these significant differences.
T2*-weighted images are susceptible to motion arti-facts, which may lead to erroneous T2* and thus T2′ values. Motion artifacts are a substantial issue in patients with acute stroke who are often agitated because of aphasia or neglect. Therefore, corrections for motion artifacts were applied, in particular, a recently developed algorithm that performs cor-rections in k-space.11 In short, this method is based on the repetition of the T2* mapping sequence with reduced spatial resolution followed by averaging of the data sets in k-space, using a different weighting factor for each k-space line, which is chosen individually to reduce the influence of motion. Furthermore, T2′ maps were thresholded, excluding unphysi-ologically high (>300 ms) and low (<1 ms) values.
The present study has several limitations. From a patho-physiological point of view, the assumption that decreased T2′ values reflect increased OEF is plausible; however, a vali-dation with PET will be necessary. Meanwhile, it cannot be excluded that additional factors (apart from OEF changes) contribute to changes in T2′ values (eg, variations in cerebral blood volume).7 The exact relationship between T2′ values and other parameters indicating a perfusion disturbance (cerebral blood volume, cerebral blood flow, and mean transit time) still needs to be clarified. Furthermore, we did not systematically perform follow-up MRI, precluding analyses on the long-term
fate of T2′ reduced tissue (ie, an exact analysis of T2′ in the regions undergoing definite infarction or of T2′ within the surviving tissue). However, given the variable courses after endovascular treatment (recanalization status, infarct growth, and hemorrhagic transformation) in often severely affected patients, studies with larger patient samples will be necessary to account for this variability and to outline the clinical value of T2′ mapping in acute stroke. Finally, although we were able to improve signal quality of T2′ mapping substantially when compared with previous studies, visual depiction of T2′ changes often remains challenging limiting its current clinical suitability (Figure I in the online-only Data Supplement).
In conclusion, this pilot study on quantitative motion-corrected T2′ mapping in acute large-vessel stroke proved its technical feasibility in the clinical setting, revealing signifi-cant T2′ decreases in perfusion-disturbed and ADC-restricted tissue. T2′ mapping has the potential to differentiate between the ischemic core and the perfusion-impaired areas but is not able to distinguish between penumbral and oligemic tissue on its own.
DisclosuresNone.
References 1. Lansberg MG, Straka M, Kemp S, Mlynash M, Wechsler LR, Jovin
TG, et al; DEFUSE 2 Study Investigators. MRI profile and response to endovascular reperfusion after stroke (DEFUSE 2): a prospective cohort study. Lancet Neurol. 2012;11:860–867.
2. Cvoro V, Marshall I, Armitage PA, Bastin ME, Carpenter T, Rivers CS, et al. MR diffusion and perfusion parameters: relationship to metabolites in acute ischaemic stroke. J Neurol Neurosurg Psychiatry. 2010;81:185–191.
3. Cvoro V, Wardlaw JM, Marshall I, Armitage PA, Rivers CS, Bastin ME, et al. Associations between diffusion and perfusion parameters, N-acetyl aspartate, and lactate in acute ischemic stroke. Stroke. 2009;40:767–772.
4. Heiss WD, Graf R. The ischemic penumbra. Curr Opin Neurol. 1994;7:11–19.
5. Heiss WD, Grond M, Thiel A, von Stockhausen HM, Rudolf J, Ghaemi M, et al. Tissue at risk of infarction rescued by early reperfusion: a posi-tron emission tomography study in systemic recombinant tissue plasmin-ogen activator thrombolysis of acute stroke. J Cereb Blood Flow Metab. 1998;18:1298–1307.
6. Furlan M, Marchal G, Viader F, Derlon JM, Baron JC. Spontaneous neu-rological recovery after stroke and the fate of the ischemic penumbra. Ann Neurol. 1996;40:216–226.
7. Jensen-Kondering U, Baron JC. Oxygen imaging by MRI: can blood oxygen level-dependent imaging depict the ischemic penumbra? Stroke. 2012;43:2264–2269.
8. Siemonsen S, Finsterbusch J, Matschke J, Lorenzen A, Ding XQ, Fiehler J. Age-dependent normal values of T2* and T2’ in brain parenchyma. AJNR Am J Neuroradiol. 2008;29:950–955.
9. An H, Lin W. Quantitative measurements of cerebral blood oxygen satu-ration using magnetic resonance imaging. J Cereb Blood Flow Metab. 2000;20:1225–1236.
10. Seiler A, Jurcoane A, Magerkurth J, Wagner M, Hattingen E, Deichmann R, et al. T2’ imaging within perfusion-restricted tissue in high-grade occlusive carotid disease. Stroke. 2012;43:1831–1836.
11. Nöth U, Volz S, Hattingen E, Deichmann R. An improved method for ret-rospective motion correction in quantitative T2* mapping. Neuroimage. 2014;92:106–119.
12. Baudrexel S, Nürnberger L, Rüb U, Seifried C, Klein JC, Deller T, et al. Quantitative mapping of T1 and T2* discloses nigral and brainstem pathology in early Parkinson’s disease. Neuroimage. 2010;51:512–520.
13. Magerkurth J, Volz S, Wagner M, Jurcoane A, Anti S, Seiler A, et al. Quantitative T2*-mapping based on multi-slice multiple gradient echo
by guest on March 23, 2018
http://stroke.ahajournals.org/D
ownloaded from

3286 Stroke November 2014
flash imaging: retrospective correction for subject motion effects. Magn Reson Med. 2011;66:989–997.
14. Wagner M, Magerkurth J, Volz S, Jurcoane A, Singer OC, Neumann-Haefelin T, et al. T2’- and PASL-based perfusion mapping at 3 Tesla: influence of oxygen-ventilation on cerebral autoregulation. J Magn Reson Imaging. 2012;36:1347–1352.
15. Geisler BS, Brandhoff F, Fiehler J, Saager C, Speck O, Röther J, et al. Blood-oxygen-level-dependent MRI allows metabolic description of tis-sue at risk in acute stroke patients. Stroke. 2006;37:1778–1784.
16. Sobesky J, Zaro Weber O, Lehnhardt FG, Hesselmann V, Neveling M, Jacobs A, et al. Does the mismatch match the penumbra? Magnetic resonance imaging and positron emission tomography in early ischemic stroke. Stroke. 2005;36:980–985.
17. Guadagno JV, Warburton EA, Jones PS, Day DJ, Aigbirhio FI, Fryer TD, et al. How affected is oxygen metabolism in DWI lesions? A combined acute stroke PET-MR study. Neurology. 2006;67:824–829.
18. Giffard C, Young AR, Kerrouche N, Derlon JM, Baron JC. Outcome of acutely ischemic brain tissue in prolonged middle cerebral artery occlu-sion: a serial positron emission tomography investigation in the baboon. J Cereb Blood Flow Metab. 2004;24:495–508.
19. Shimosegawa E, Hatazawa J, Ibaraki M, Toyoshima H, Suzuki A. Metabolic penumbra of acute brain infarction: a correlation with infarct growth. Ann Neurol. 2005;57:495–504.
20. Siemonsen S, Fitting T, Thomalla G, Horn P, Finsterbusch J, Summers P, et al. T2’ imaging predicts infarct growth beyond the acute diffusion-weighted imaging lesion in acute stroke. Radiology. 2008;248:979–986.
by guest on March 23, 2018
http://stroke.ahajournals.org/D
ownloaded from

and Oliver C. SingerSonja Bauer, Marlies Wagner, Alexander Seiler, Elke Hattingen, Ralf Deichmann, Ulrike Nöth
-Mapping in Acute Ischemic Stroke′Quantitative T2
Print ISSN: 0039-2499. Online ISSN: 1524-4628 Copyright © 2014 American Heart Association, Inc. All rights reserved.
is published by the American Heart Association, 7272 Greenville Avenue, Dallas, TX 75231Stroke doi: 10.1161/STROKEAHA.114.006530
2014;45:3280-3286; originally published online October 2, 2014;Stroke.
http://stroke.ahajournals.org/content/45/11/3280World Wide Web at:
The online version of this article, along with updated information and services, is located on the
http://stroke.ahajournals.org/content/suppl/2014/10/02/STROKEAHA.114.006530.DC1Data Supplement (unedited) at:
http://stroke.ahajournals.org//subscriptions/
is online at: Stroke Information about subscribing to Subscriptions:
http://www.lww.com/reprints Information about reprints can be found online at: Reprints:
document. Permissions and Rights Question and Answer process is available in the
Request Permissions in the middle column of the Web page under Services. Further information about thisOnce the online version of the published article for which permission is being requested is located, click
can be obtained via RightsLink, a service of the Copyright Clearance Center, not the Editorial Office.Strokein Requests for permissions to reproduce figures, tables, or portions of articles originally publishedPermissions:
by guest on March 23, 2018
http://stroke.ahajournals.org/D
ownloaded from
1
SUPPLEMENTAL MATERIAL Supplemental Table I. Individual patient data: T2’ ratios in perfusion-restricted tissue.
Patient T2' ratio, TTP≥0s
T2' ratio, TTP≥2s
T2' ratio, TTP≥4s
T2' ratio, TTP≥6s
T2' ratio, TTP 0-2s
T2' ratio, TTP 2-4s
T2' ratio, TTP 4-6s
1 0.87 0.89 0.87 0.89 0.86 0.89 0.89
2 0.94 0.95 0.96 0.96 0.90 0.93 0.99
4 0.91 0.87 0.85 0.83 0.92 0.88 0.85
5 0.83 0.84 0.81 0.82 0.83 0.81 0.81
7 0.92 0.92 0.90 0.90 0.98 0.89 0.90
8 0.92 0.90 0.91 0.92 0.90 0.93 0.90
9 1.02 0.95 1.01 1.01 0.94 0.93 0.89
10 0.90 0.89 0.90 0.90 0.84 0.88 0.87
12 0.89 0.89 0.90 0.90 0.99 0.86 0.88
13 0.92 0.91 0.95 0.97 0.87 0.92 0.92
14 1.02 1.01 0.99 0,99 0.98 1.00 0.97
Median 0.92 0.90 0.90 0.90 0.90 0.89 0.89
25th, 75th Percentile
0.89, 0.94
0.89, 0.95
0.87, 0.96 0.89, 0.97
0.86, 0.98
0.88, 0.93
0.87, 0.92
2
Supplemental Table II. Individual patient data: T2’ values in perfusion-restricted tissue and corresponding contralateral healthy tissue.
Patient T2' in
TTP≥0s affected
T2' in TTP≥0s
not affected
T2' in TTP≥2s affected
T2' in TTP≥2s
not affected
T2' in TTP≥4s affected
T2' in TTP≥4s
not affected
T2' in TTP≥6s affected
T2' in TTP≥6s
not affected
T2' in TTP 0-2s affected
T2' in TTP 0-2s not
affected
T2' in TTP 2-4s affected
T2' in TTP 2-4s not
affected
T2' in TTP 4-6s affected
T2' in TTP 4-6s not
affected
1 98 113 98 110 99 114 101 114 97 113 98 110 97 110 2 102 109 103 108 104 108 104 109 98 108 97 104 101 102 4 82 90 80 92 80 94 77 93 81 89 79 90 78 92 5 86 103 85 101 82 101 84 102 89 107 85 105 85 105 7 107 116 106 115 105 117 105 117 103 105 101 113 104 115 8 100 109 98 109 99 109 98 107 98 109 97 104 98 109 9 87 85 82 87 86 86 86 85 83 88 80 86 82 92 10 89 99 88 98 89 98 89 99 81 96 84 96 85 98 12 93 104 93 105 93 103 94 104 95 96 92 107 91 104 13 79 86 80 88 82 86 84 87 77 89 78 85 79 86 14 112 110 110 109 108 109 106 107 111 113 111 111 114 118 Median 93 104 93 105 93 103 94 104 95 105 92 104 91 104 25th, 75th Percentile
86, 102 90, 110 82, 103 92, 109 82, 104 94, 109 84, 104 93, 109 81, 98 89, 109 80, 98 90, 110 82, 101 92, 110

3
Supplemental Figure.
Supplemental Figure: Representative slices of each patient showing the ADC lesion and the corresponding motion corrected T2’ map. Numbers refer to the patient number.