Quantitative Risk Analysis Detailed Study of Thermal and ...
9
RECENT J. (2018), 56:128-136 https://doi.org/10.31926/RECENT.2018.56.128 128 Quantitative Risk Analysis Detailed Study of Thermal and Overpressure Risks Case Study Mohamed Seddik HELLAS University Frères Mentouri, Constantine 1, Algeria, [email protected] Rachid CHAIB University Frères Mentouri, Constantine 1, Algeria, [email protected] Ion VERZEA "Gheorghe Asachi" Technical University of Iaşi Romania, [email protected] Abstract Oil and gas companies generate high levels of risks because they process and store large quantities of flammable, explosive and toxic liquids and gaseous products. Actually, no country is immune to disasters related to the industrial installations of oil and gas complexes where several tragic experiences have caused significant human, material and environmental losses. Therefore, the importance of the rigorous monitoring of management procedures and the strict observance of industrial safety measures are required to ensure not only the reliability of the facilities themselves but also to protect the human resources. Locally, the catastrophic explosion of the liquefaction complex of Skikda in January 2004 caused 27 fatalities and 73 injuries and revealed many weaknesses in the risk prevention within Sonatrach. In order to master these phenomena several techniques and mathematical models of risk prediction have been developed. Among these methods, we find the Quantitative Risk Analysis (QRA), which is the objective of our work, whose objective is to evaluate the probability of damage caused by a potential accident. This method, initially developed in the field of transport and nuclear power, has been progressively adapted to the process industry, particularly in northern European countries for Seveso type installations. In this work, we are interested in the application of the QRA method to the LPG industrial zone located in Constantine, Algeria. The objective is the study of undesired events, their frequencies and their effects, including the probability of fatality or injury by thermal effect (1 st degree burn, 2 nd degree burn, deaths) and by overpressure (lung damage, eardrum rupture, head impact, whole-body displacement impact, building collapse, major structural damage, minor damages, breakage of window panes). The purpose is to estimate the individual risks and the societal risk, and to apply the measures that suitably deal with these estimates. Keywords QRA, probability of injury or death, thermal effect, overpressure effect, individual and societal risk 1. Introduction The terms QRA (Quantitative Risk Analysis), PSA (Probabilistic Safety Assessment) and PRA (Probabilistic Risk Analysis) are used synonymously in different industries to describe various techniques for evaluating risk. Whilst quantification of risk for specific issues has been around for a long time, the grandfather of modern probabilistic assessment of the overall risk for an entire major hazard facility is generally accepted to be WASH-1400, commissioned by the US Nuclear Regulatory Commission in 1975. This quantified the safety risks associated with the operation of all electricity generating nuclear power plants in the US. The nuclear industry led the way, motivated by a desire to demonstrate that the actual risk was less than other industrial facilities and counter the public's perception that nuclear stations are very risky because the worst-case consequences are potentially so catastrophic. It is not surprising that the petrochemical industry followed suit shortly after, since the toxic effects of large chemical releases can disperse many miles and affect large numbers of people in local towns and cities. Explosion effects can also be devastating. For example, an explosion of the liquefaction
Transcript of Quantitative Risk Analysis Detailed Study of Thermal and ...

RECENT J. (2018), 56:128-136
https://doi.org/10.31926/RECENT.2018.56.128
128
Quantitative Risk Analysis Detailed Study of Thermal and Overpressure Risks Case Study
Mohamed Seddik HELLAS
University Frères Mentouri, Constantine 1, Algeria, [email protected] Rachid CHAIB
University Frères Mentouri, Constantine 1, Algeria, [email protected] Ion VERZEA
"Gheorghe Asachi" Technical University of Iaşi Romania, [email protected]
Abstract
Oil and gas companies generate high levels of risks because they process and store large quantities of flammable, explosive and toxic liquids and gaseous products. Actually, no country is immune to disasters related to the industrial installations of oil and gas complexes where several tragic experiences have caused significant human, material and environmental losses. Therefore, the importance of the rigorous monitoring of management procedures and the strict observance of industrial safety measures are required to ensure not only the reliability of the facilities themselves but also to protect the human resources. Locally, the catastrophic explosion of the liquefaction complex of Skikda in January 2004 caused 27 fatalities and 73 injuries and revealed many weaknesses in the risk prevention within Sonatrach. In order to master these phenomena several techniques and mathematical models of risk prediction have been developed. Among these methods, we find the Quantitative Risk Analysis (QRA), which is the objective of our work, whose objective is to evaluate the probability of damage caused by a potential accident. This method, initially developed in the field of transport and nuclear power, has been progressively adapted to the process industry, particularly in northern European countries for Seveso type installations. In this work, we are interested in the application of the QRA method to the LPG industrial zone located in Constantine, Algeria. The objective is the study of undesired events, their frequencies and their effects, including the probability of fatality or injury by thermal effect (1st degree burn, 2nd degree burn, deaths) and by overpressure (lung damage, eardrum rupture, head impact, whole-body displacement impact, building collapse, major structural damage, minor damages, breakage of window panes). The purpose is to estimate the individual risks and the societal risk, and to apply the measures that suitably deal with these estimates. Keywords QRA, probability of injury or death, thermal effect, overpressure effect, individual and societal risk
1. Introduction The terms QRA (Quantitative Risk Analysis), PSA (Probabilistic Safety Assessment) and PRA
(Probabilistic Risk Analysis) are used synonymously in different industries to describe various techniques for evaluating risk. Whilst quantification of risk for specific issues has been around for a long time, the grandfather of modern probabilistic assessment of the overall risk for an entire major hazard facility is generally accepted to be WASH-1400, commissioned by the US Nuclear Regulatory Commission in 1975. This quantified the safety risks associated with the operation of all electricity generating nuclear power plants in the US. The nuclear industry led the way, motivated by a desire to demonstrate that the actual risk was less than other industrial facilities and counter the public's perception that nuclear stations are very risky because the worst-case consequences are potentially so catastrophic.
It is not surprising that the petrochemical industry followed suit shortly after, since the toxic effects of large chemical releases can disperse many miles and affect large numbers of people in local towns and cities. Explosion effects can also be devastating. For example, an explosion of the liquefaction

RECENT, Vol. 19, no. 3(56), December, 2018
129
complex of Skikda in January 2004 caused 27 fatalities and 73 injuries and revealed many weaknesses in the risk prevention within Sonatrach. In this work, we are interested in the application of the QRA method to the LPG industrial zone located in Constantine, Algeria [1]. The objective is the study of undesired events, their frequencies and their effects, including the probability of fatality or injury by thermal effect and by overpressure. The purpose is to estimate the individual risks and the societal risk (FN curve) and to apply the measures that suitably deal with these estimates.
2. Methodology
The methodology are based on the QRA approach, Figure 1, this approach consists mainly in identifying potential accident scenarios, estimating their frequency and analysing their effects, in order to estimate individual and societal risks and thus apply the measures to be taken.
Fig 1. Steps in a quantitative risk analysis [2]
2.1. Collection of relevant information
2.1.1. Site Data
Constantine is located in eastern Algeria, about 245 km from the Algerian-Tunisian border, 431 km from Algiers to the west, 89 km from Skikda in the north and 235 km from Biskra in the south. The project consists of the construction of a bulk LPG storage tank, aerial type (butane and propane) and the installation of LPG Centre Khroub tanker lorry.
2.1.2. Technical data on the process or system analysed
El Khroub has five storage spheres (Figure 2): - Two Butane Spheres with a unit capacity of 2,845 m3 (Bu1 and Bu2); - Two Propane Spheres with a capacity of 2,000 m3 (Pro1 and Pro2); - One sphere propane with a capacity of 1100 tons (Pro3).
Fig 2. LPG storage spheres

RECENT, Vol. 19, no. 3(56), December, 2018
130
2.1.3. Meteorological data Additional meteorological and environmental parameters that have been used in the analyses are
presented in Table 1.
Table 1. Constantine Weather Data Factors Conditions
Average Site Temperature 25 ℃ Average Site Humidity 60%
Wind speed 5 m/s Prevailing Wind North-West
3. Identification of the Hazard Scenario The qualitative analysis carried out previously by the preliminary hazard analysis technique, allowed
the identification of the major hazards or potential risks associated with the installations, their exploitations and their environments.
Adverse events are catastrophic ruptures can give rise to various final accidental scenarios, depending on various factors and circumstances, including the type and physical state of matter emitted, the presence of ignition sources, the intervention security equipment, etc. 4. Frequency Estimation of Initiating Events and Development of Event Trees
The frequencies of the initiating events are extracted from the company's data. On the contrary, the probabilities of inflammation are drawn from the literature [3, 4], Table2. The QRA accident scenarios are shown in Figures 3, 4 and 5.
Table 2. Probability of ignition / Frequency of initiating events
Initiator event Frequency [1/year]≡[Y–1]
Catastrophic rupture Bu 1.2 5.00 E–04
Catastrophic rupture Pro 1.2 6.27 E–04 Catastrophic rupture Pro 3 3.30 E–04
Ignition Probability [%] Immediate ignition 7.00 E–01
Delayed ignition 9.00 E–01
Fig 3. Tree of events related to the spheres (Bu 1, 2)
Fig 4. Tree of events related to the spheres (Pro 1, 2)
Fig 5. Event tree related to the sphere (Pro 3)
RECENT, Vol. 19, no. 3(56), December, 2018
131
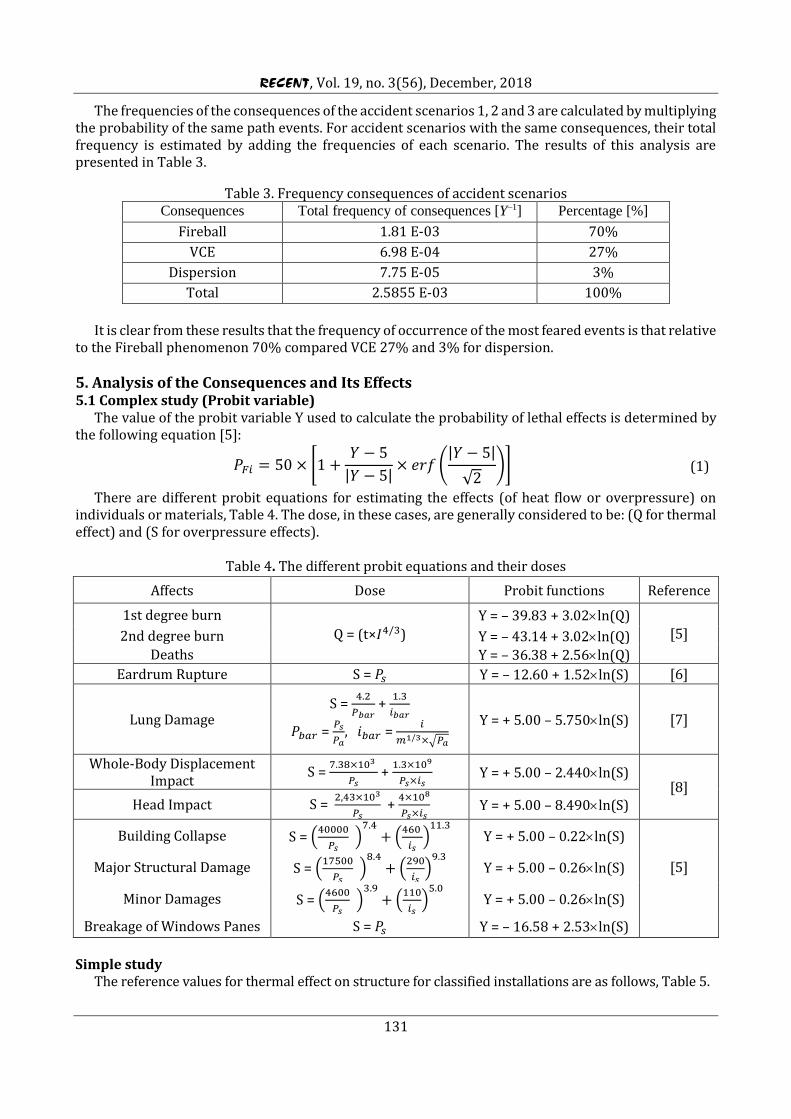
The frequencies of the consequences of the accident scenarios 1, 2 and 3 are calculated by multiplying the probability of the same path events. For accident scenarios with the same consequences, their total frequency is estimated by adding the frequencies of each scenario. The results of this analysis are presented in Table 3.
Table 3. Frequency consequences of accident scenarios Consequences Total frequency of consequences [Y–1] Percentage [%]
Fireball 1.81 E-03 70%
VCE 6.98 E-04 27%
Dispersion 7.75 E-05 3%
Total 2.5855 E-03 100%
It is clear from these results that the frequency of occurrence of the most feared events is that relative
to the Fireball phenomenon 70% compared VCE 27% and 3% for dispersion.
5. Analysis of the Consequences and Its Effects 5.1 Complex study (Probit variable)
The value of the probit variable Y used to calculate the probability of lethal effects is determined by the following equation [5]:
𝑃𝐹𝑖 = 50 × [1 +𝑌 − 5
|𝑌 − 5|× 𝑒𝑟𝑓(
|𝑌 − 5|
√2)] (1)
There are different probit equations for estimating the effects (of heat flow or overpressure) on individuals or materials, Table 4. The dose, in these cases, are generally considered to be: (Q for thermal effect) and (S for overpressure effects).
Table 4. The different probit equations and their doses
Simple study
The reference values for thermal effect on structure for classified installations are as follows, Table 5.
Affects Dose Probit functions Reference
1st degree burn
Q = (t×𝐼4/3)
Y = – 39.83 + 3.02ln(Q) [5] 2nd degree burn Y = – 43.14 + 3.02ln(Q)
Deaths Y = – 36.38 + 2.56ln(Q)
Eardrum Rupture S =𝑃𝑠 Y = – 12.60 + 1.52ln(S) [6]
Lung Damage S =
4.2
𝑃𝑏𝑎𝑟+
1.3
𝑖𝑏𝑎𝑟
𝑃𝑏𝑎𝑟=𝑃𝑠
𝑃𝑎,𝑖𝑏𝑎𝑟=
𝑖
𝑚1/3×√𝑃𝑎
Y = + 5.00 – 5.750ln(S) [7]
Whole-Body Displacement Impact
S =7.38×10³
𝑃𝑠+
1.3×10⁹
𝑃𝑠×𝑖𝑠 Y = + 5.00 – 2.440ln(S)
[8] Head Impact S =
2,43×10³
𝑃𝑠+
4×10⁸
𝑃𝑠×𝑖𝑠 Y = + 5.00 – 8.490ln(S)
Building Collapse S =(40000
𝑃𝑠)
7.4+ (
460
𝑖𝑠)11.3
Y = + 5.00 – 0.22ln(S)
Major Structural Damage S =(17500
𝑃𝑠)
8.4+ (
290
𝑖𝑠)9.3
Y = + 5.00 – 0.26ln(S) [5]
Minor Damages S =(4600
𝑃𝑠)
3.9+ (
110
𝑖𝑠)5.0
Y = + 5.00 – 0.26ln(S)
Breakage of Windows Panes S =𝑃𝑠 Y = – 16.58 + 2.53ln(S)

RECENT, Vol. 19, no. 3(56), December, 2018
132
Table 5. Threshold of thermal effect
6. Modelling Effects 6.1. Fireball
Several Fireball modelling methods can be found in the literature [9], including those proposed in Table 6 for determining the heat radiation received by the person. Using the equations of Tables 4 and 6, Equation (1) and with the help of the Matlab program, we determine the thermal effects of Fireball that can occur at the spheres. The results of the calculations are shown in Figure 6.
Table 6. The thermal intensity received by the person
Model 𝑯𝒎 [m]
𝒕𝒃 [s]
𝒓𝒎 [m]
𝑭𝟐𝟏 [dimensionless]
𝝉𝒂 (dimensionless)
E [kW/m2]
𝑰 [kW/m2]
PHAST (TNO model)
2× 𝒓𝒎 0.85×𝑴𝟎.𝟐𝟔
3.24×𝑴𝟎.𝟑𝟐𝟓 (𝒓𝒎/𝐗)
𝟐
X=√(𝒙𝟐 + 𝒓𝒎𝟐)
1.389-0.135× log10(𝑷𝒘 × 𝒍)
𝐏𝐰=𝟗𝟗. 𝟖𝟗 ×𝑹𝑯
𝟏𝟎𝟎× 𝐞𝐱𝐩(𝟐𝟏. 𝟔𝟔 −
𝟓𝟒𝟑𝟏.𝟑𝟖
𝐓𝐚)
𝑭𝒓𝑴× 𝜟𝑯𝒄
𝟒𝝅 × 𝒓𝒎𝟐 × 𝒕𝒃
𝑭𝒓=0.27×
(𝐏𝐬𝐚𝐭
𝟏𝟎𝟔)𝟎.𝟑𝟐
𝝉𝒂 × 𝑭𝟐𝟏 ×E
Figure 6 show the different areas of lethality or injuries due to the thermal effects of Fireball (100% burn probability: 3rd degree, 2nd degree and 1st degree), for the road link between region A to H.
Probability of Burn 100%: 1st degree; 2nd degree; 3rd degree
Fig 6. Contour and probability curve of lethality or injury due to thermal effects of the fireball
Using the Table 5, the Figure 7 show the different areas of damage to the fireball by thermal effects, for the road link between regions A to H.
Thresholds of thermal effects: 05𝑘𝑊/𝑚2 08𝑘𝑊/𝑚2 16𝑘𝑊/𝑚2 20𝑘𝑊/𝑚2
Fig 7. Contour and curve of the different areas of damage to the fireball by the thermal effects
Thresholds of thermal effects Thermal
Threshold of significant window destruction 5 kW/m2
Threshold domino effects and corresponding to the threshold of serious damage
on structures 8 kW/m2
Threshold for very serious damage to structures, excluding concrete structures 16 kW/m2
Threshold for very serious damage on concrete structures 20 kW/m2

RECENT, Vol. 19, no. 3(56), December, 2018
133
The Table 7 below shows the thermal effect on good or people and their radius of each sphere.
Table 7. Thermal effect on goods or people and their radius of each sphere The spheres Sphere Bu 1, 2 Sphere Pro 1, 2 Sphere Pro 5
Probability of burn 100% their radius [m]
1st degree 1654 m 1397 m 1461 m 2nd degree 997 m 828 m 872 m 3rd degree 822 m 680 m 722 m
Thresholds of thermal effects and their radius [m]
05𝑘𝑊/𝑚2 2119 m 1794 m 1991 m 08𝑘𝑊/𝑚2 1644 m 1401 m 1549 m
16𝑘𝑊/𝑚2 1103 m 944 m 1038 m
20𝑘𝑊/𝑚2 947 m 796 m 902 m
6.2. VCE (Vapor Cloud Explosion) The suppression effects were modelled by the multi-energy method proposed by TNO [10], the index
of the chosen violence is the order of 10. However, this index allows taking into account a phenomenon of detonation and propagation of shock waves. The Abacus of the overpressure and the duration of the positive phase are provided as a function of the Sachs scaled distance [11] as well as Table 4 and Equation (1); we determine the effects of overpressure on goods and people that may occur at the spheres. The results of the calculations are shown in Figures 8 and 9.
Probability of Death 100%: Lung Damage;
Eardrum Rupture; Head Impact; Whole-Body
Fig 8. Fatality probability Contour 100% by
overpressure effect
Probability of Damage 100%: Building Collapse;
Major Damage; Minor Damages Breakage of Windows
Fig 9. Damage probability Contour 100% by
overpressure effect
The Figure 8 clearly show the effects of overpressure at 100% probability of fatality, on the most sensitive organs, namely the head, Whole-Body Displacement, eardrum and lung. It is indicated that the PHAST Risk program does not calculate the probability of mortality by overpressure effect.
The Table 8 shows the overpressure effect on goods or people and their radius of each sphere.
7. Individual Risk Estimation The individual risk is defined as a function of spatial coordinates representing the probability that a
person per year on permanent danger was killed [12], the individual risk at a given location is mathematically defined by the following equation (2):
𝑅𝑥,𝑦 =∑ 𝑅𝑥,𝑦,𝑖𝑛
𝑖=1 (2)
𝑅𝑥,𝑦,𝑖is expressed as a function of frequency and probability by:
𝑅𝑥,𝑦,𝑖 = 𝑓𝑐𝑖 × 𝑃𝐹𝑖 (3) Using equations (2) and (3), we estimate the individual risk in the storage spheres; Individual risk is
represented graphically, Figure 10. Based on the UK HSE Individual Risk Criteria [13], Figure 10 clearly show that the individual risk to
which operators are exposed to: IR < 10–6 acceptable risk that corresponds to the region under the green line;

RECENT, Vol. 19, no. 3(56), December, 2018
134
10–6 < IR < 10–4 tolerable risk corresponding to the area between the green and red lines; IR > 10–4 unacceptable risk corresponds to the area above the red line.
Table 8. Overpressure effect on goods or people and their radius of each sphere
The spheres Sphere Bu 1, 2 Sphere Pro 1, 2 Sphere Pro3 Probability of
death 100% and their radius [m]
Lung Damage 123 m 107 m 111 m Eardrum Rupture 140 m 123 m 127 m
Whole-Body Displacement 185 m 160 m 167 m Head Impact 311 m 262 m 274 m
Probability of damage 100%
on the goods and their radius [m]
Building Collapse 217 m 189 m 197 m Major Structural Damage 357 m 312 m 323 m
Minor Damages 386 m 337 m 350 m Breakage of Windows Panes 860 m 752 m 780 m
Fig. 10. Curve and contour individual risk
7. Societal Risk Estimation Societal risk can be represented by the FN curves, it is important that the frequencies and the number
of dead be properly combined the N number of deaths each accident scenario is calculated by [14]
𝑁𝑖 =∑𝑃𝑥𝑦𝑥𝑦
𝑃𝐹𝑖 (4)
The number of deaths and its associated frequency must be estimated for each accident scenario and therefore, the cumulative frequency is expressed [14]:
𝐹𝑁 = ∑ 𝐹𝑖𝑖 for all incident outcome case I for which 𝑁𝑖 ≥N. (5)
From equations (4) and (5), it is possible to calculate the societal risk for each consequence of VCE and fireball that occur at night and during the day, or the total damage on population. Figures 11 and 12 based on societal risk criteriaHealth and Safety Executive (HSE) [13], United Kingdom. The lines separate three categories of risk, “acceptable”, “ALARP”, and “unacceptable”. ALARP region of the curve indicates an area where further risk reduction measures should be considered (if reasonably practical).
Through the two Figures 11 and 12, we deduce the following: - Therefore, the fireball scenario should be considered the most serious compared to VCE; - SR VCE (day and night) is between the green and red lines, which means that social risks are
tolerable; - SR fireball are between two zones: Tolerable if the number of fatalities: N < 55 and N > 325 days,
N < 55 and N > 165 night, and unacceptable if: 55 ≤ N ≤ 325 days and 55 ≤ N ≤ 165 night.
8. Conclusion Modern QRA has been around for over 30 years, led by the nuclear and onshore petrochemical
industries, shortly followed by the offshore and rail industries. The differences in the focus and level of detail of QRA in each industry arise from the need to understand the critical risk issues unique to the industry. However, all industries agree that while QRA is not a panacea, it does help to make better risk-

RECENT, Vol. 19, no. 3(56), December, 2018
135
informed decisions, thus saving lives, protecting the environment, reducing economic loss and preserving the reputation of the associated organization, in this work, we deduce the following:
- Adverse events are catastrophic ruptures can give rise to various final accidental scenarios; - The frequency of occurrence of the most feared events is that relative to the Fireball phenomenon
70% compared VCE 27% and 3% for Dispersion; - Determine the thermal and overpressure effect on goods or persons, for the road connection
between region A to H, and classify the most sensitive organs of the effect of overpressure; - Estimate the individual risk, in our case; we suggest moving the road to be in the accepted area
Figure 13; - Estimate the risk societal risks, for each consequence of VCE and fireball that occur at night and
during the day, therefore, the fireball scenario should be considered the most serious compared to VCE. In order to more safety on site, we recommend the installation of Flame Detectors with an automatic deluge system (preventive action), and minimized the numbers populations (residents of the area next to the factory) (protective action), Figure 14.
Fig. 11. Societal risk occur at day
Fig. 12. Societal risk occur at night
Societal risk that correspond: total; fireball; VCE
Fig. 13. The suggested route to be accepted
in the area
Fig. 14. Preventive and protective action to
reduce societal risk
We can improve the PHAST Risk program in terms of calculating the probability of fatality by the effect of overpressure and classifying the most sensitive organs, as well as the probability of injury (1st and 2nd degree burn). Given the importance of this study, it can be generalized for similar sites of Sonatrach.
Nomenclature ALARP As low As Reasonably Possible Psat Burst pressure [N/m²]
Dm Lift-off height of the fireball [m] Pw Atmospheric water vapor E Surface emissive power [kW/m2] rm Radius of the fireball [m]
FN Frequency of all incident outcome cases affecting N
RH Relative humidity [%]
Fi Frequency of incident outcome cases “I” Rx,y Total individual risk of death [Y⁻¹]

RECENT, Vol. 19, no. 3(56), December, 2018
136
I Thermal radiation received by people [kW/m2]
SR Societal risk
m Mass of the human body [kg] Ta Ambient temperature [°K] M Masse hydrocarbure en [kg] Y Probit function n Total number of accident scenarios τa Atmospheric transmissivity
Ni Number of fatalities resulting from incident “I”
ΔHc Heat of combustion [kJ/kg]
Pxy Number of people at location (x y) References 1. Hellas M.S., Chaib R., Mourad C. (2018): Approche QRA pour modéliser des conséquences des scénarios d'accidents
fireball et VCE cas Bac de stockage: cas bac de stockage GPL In aminas Algerien (QRA approach to model consequences of fireball accident scenarios and VCE case LPG storage tank In Aminas Algerien). Fourth International Conference on Energy, Materials, Applied Energetics and Pollution (ICEMAEP 2018), Université Frères Mentouri, Constantine, Algeria, Vol. 3, ISBN: 978-9931-9229-6-4, p. 1737-1744. https://www.researchgate.net/profile/Chaib_Rachid/publication/325825809_Approche_QRA_pour_modeliser_des_consequences_des_scenarios_d%27accidents_fireball_et_VCE_cas_Bac_de_stockage_GPL_In_Aminas_Algerien/links/5b2cf987a6fdcc8506bdd8dd/Approche-QRA-pour-modeliser-des-consequences-des-scenarios-daccidents-fireball-et-VCE-cas-Bac-de-stockage-GPL-In-Aminas-Algerien.pdf (in French)
2. Ronza A. (2007): Contribution to the risk assessment of major accidents in port areas. PhD thesis, Universitat Politècnica de Catalunya, Barcelona, Spain, https://www.tdx.cat/bitstream/handle/10803/37919/TAA1 de1.pdf?sequence=2
3. Center for Chemical Process Safety (2001): Layer of Protection Analysis: Simplified Process Risk Assessment. American Institute of Chemical Engineers, ISBN: 978-0-8169-0811-0
4. BS IEC 61511−1:2003 Functional safety - Safety instrumented systems for the process industry sector. International Electrotechnical Commission, http://www.cechina.cn/eletter/standard/safety/iec61511-1.pdf
5. *** (1992): Methods for the determination of possible damage to people and objects resulting from releases of hazardous materials. CPR 16E, Green book, ISBN 90-5307-052-4, Report, Research performed by TNO, https://www.scribd.com/doc/61170131/Green-Book-Methods-for-the-Determination-of-Possible-Damage-CPR-16E
6. Hirsch F.G. (1966): Effects of Overpressure on the Ear - A Review. Technical Progress Report on Contract No. DA-49-146-XZ-372, http://www.dtic.mil/dtic/tr/fulltext/u2/653129.pdf
7. Bowen I.G, Fletcher E.R., Richmond D.R. (1968): Estimate of Man's Tolerance to the Direct Effects of Air Blast. Lovelace Foundation for Medical Education and Research, Albuquerque, New Mexico, Report DASA-2113, http://www.dtic.mil/dtic/tr/fulltext/u2/693105.pdf
8. Baker W.E., Cox P.A., Kulesz J.J., Strehlow R.A., Westine P.S. (1983): Explosion Hazards and Evaluation. Vol. 5, 1st Edition, Elsevier Science, eBook ISBN: 9780444599889
9. van den Bosch C.J.H., Weterings R.A.P.M. (Eds.) (1997): Methods for the calculation of physical effects: due to releases of hazardous materials (liquids and gases). Yellow book, CPR 14E, 3rd edition, The Hague: Sdu Uitgevers, ISBN: 9789012084970
10. van den Berg A.C. (1985): The Multi-Energy Method. A Framework for Vapour Cloud Explosion Blast Prediction. Journal of Hazardous Materials, Vol. 12, Is. 1, p. 1-10, https://doi.org/10.1016/0304-3894(85)80022-4
11. *** (2010): Guidelines for Evaluating the Characteristics of Vapor Cloud Explosions, Flash Fires, and BLEVEs.
AIChE/CCPS (American Institute of Chemical Engineers / Center for Chemical Process Safety), ISBN: 978-0-470-93814-0
12. Casal J. (2008): Evaluation of the Effects and Consequences of Major Accidents in Industrial Plants. Elsevier Science, Industrial Safety Series, Vol. 8, 1st Edition, ISBN: 9780444530813
13. Health and Safety Executive (HSE) (1992): The Tolerability of Risk from Nuclear Power Stations. http://www.onr.org.uk/documents/tolerability.pdf
14. *** (1999): Guidelines for Chemical Process Quantitative Risk Analysis. 2nd Edition, American Institute of Chemical Engineers, ISBN: 978-0-8169-0720-5
Received: 22 October 2018; Accepted: 22 November 2018