Quantitative proteomics reveals the kinetics of trypsin ... of trypsin... · Quantitative...
10
RESEARCH PAPER Quantitative proteomics reveals the kinetics of trypsin-catalyzed protein digestion Yanbo Pan & Kai Cheng & Jiawei Mao & Fangjie Liu & Jing Liu & Mingliang Ye & Hanfa Zou Received: 9 June 2014 /Revised: 14 July 2014 /Accepted: 25 July 2014 /Published online: 19 August 2014 # Springer-Verlag Berlin Heidelberg 2014 Abstract Trypsin is the popular protease to digest proteins into peptides in shotgun proteomics, but few studies have attempted to systematically investigate the kinetics of trypsin-catalyzed protein digestion in proteome samples. In this study, we applied quantitative proteomics via triplex stable isotope dimethyl labeling to investigate the kinetics of trypsin-catalyzed cleavage. It was found that trypsin cleaves the C-terminal to lysine (K) and arginine (R) residues with higher rates for R. And the cleavage sites surrounded by neutral residues could be quickly cut, while those with neigh- boring charged residues (D/E/K/R) or proline residue (P) could be slowly cut. In a proteome sample, a huge number of proteins with different physical chemical properties coex- ists. If any type of protein could be preferably digested, then limited digestion could be applied to reduce the sample com- plexity. However, we found that protein abundance and other physicochemical properties, such as molecular weight (Mw), grand average of hydropathicity (GRAVY), aliphatic index, and isoelectric point (pI) have no notable correlation with digestion priority of proteins. Keywords Trypsin . Protein digestion . Kinetics . Stable isotope dimethyl labeling . Mass spectrometry Introduction Shotgun proteomics, i.e., bottom-up proteomics, is a powerful strategy for identifying proteins from complex protein mixture [1]. It relies on enzymatic digestion of proteins into peptides prior to liquid chromatography-coupled tandem mass spec- trometry (LC-MS/MS) analysis [2]. A variety of proteases including trypsin, Lys-C, Glu-C, etc. are applied to digest proteins in proteome research. Among these proteases, trypsin is the most commonly used enzyme. This is mainly attributed to the facts that tryptic peptides have highly basic residues at the C-termini of peptides, and they are in the preferred mass range for effective fragmentation by MS/MS. Thus, the frag- mentation of tryptic peptides generally leads to a series of y- ion series and makes tandem mass spectra more easily inter- pretable [3]. Trypsin catalyzes the hydrolysis of peptide bonds immediately after lysine/arginine (K/R) residues in proteins. There are many potential trypsin cleavage sites in proteins, while not all these sites could be cut during a trypsin digestion. These sites are called missed cleavage sites [4–6]. Clearly, the missed cleavage sites have very slow kinetics to be hydro- lyzed by trypsin. Though the trypsin digestion plays an im- portant role in proteome analysis, systematic studying on the kinetics of trypsin-catalyzed reactions in proteome samples was not reported. In a proteome sample, huge number of proteins with different physical chemical properties coexists. If any type of proteins could be preferably digested, then limited digestion could be applied to reduce the sample com- plexity. However, no one has attempted to investigate the digestion priority of different proteins in a typical proteome study. To better understand the trypsin-catalyzed digestion pro- cess, kinetics study of this important process is required. There are numerous studies on kinetics analysis of trypsin-catalyzed hydrolysis of lysine or arginine derivatives [7, 8]. In these studies, a single substrate with only one cleavage site was Electronic supplementary material The online version of this article (doi:10.1007/s00216-014-8071-6) contains supplementary material, which is available to authorized users. Y. Pan : K. Cheng : J. Mao : F. Liu : J. Liu : M. Ye (*) : H. Zou (*) Key Lab of Separation Sciences for Analytical Chemistry, National Chromatographic Research and Analysis Center, Dalian Institute of Chemical Physics, Chinese Academy of Sciences, Dalian 116023, China e-mail: [email protected] e-mail: [email protected] Y. Pan : K. Cheng : J. Mao : F. Liu : J. Liu University of Chinese Academy of Sciences, Beijing 100049, China Anal Bioanal Chem (2014) 406:6247–6256 DOI 10.1007/s00216-014-8071-6
Transcript of Quantitative proteomics reveals the kinetics of trypsin ... of trypsin... · Quantitative...

RESEARCH PAPER
Quantitative proteomics reveals the kinetics of trypsin-catalyzedprotein digestion
Yanbo Pan & Kai Cheng & Jiawei Mao & Fangjie Liu &
Jing Liu & Mingliang Ye & Hanfa Zou
Received: 9 June 2014 /Revised: 14 July 2014 /Accepted: 25 July 2014 /Published online: 19 August 2014# Springer-Verlag Berlin Heidelberg 2014
Abstract Trypsin is the popular protease to digest proteinsinto peptides in shotgun proteomics, but few studies haveattempted to systematically investigate the kinetics oftrypsin-catalyzed protein digestion in proteome samples. Inthis study, we applied quantitative proteomics via triplexstable isotope dimethyl labeling to investigate the kinetics oftrypsin-catalyzed cleavage. It was found that trypsin cleavesthe C-terminal to lysine (K) and arginine (R) residues withhigher rates for R. And the cleavage sites surrounded byneutral residues could be quickly cut, while those with neigh-boring charged residues (D/E/K/R) or proline residue (P)could be slowly cut. In a proteome sample, a huge numberof proteins with different physical chemical properties coex-ists. If any type of protein could be preferably digested, thenlimited digestion could be applied to reduce the sample com-plexity. However, we found that protein abundance and otherphysicochemical properties, such as molecular weight (Mw),grand average of hydropathicity (GRAVY), aliphatic index,and isoelectric point (pI) have no notable correlation withdigestion priority of proteins.
Keywords Trypsin . Protein digestion . Kinetics . Stableisotope dimethyl labeling .Mass spectrometry
Introduction
Shotgun proteomics, i.e., bottom-up proteomics, is a powerfulstrategy for identifying proteins from complex protein mixture[1]. It relies on enzymatic digestion of proteins into peptidesprior to liquid chromatography-coupled tandem mass spec-trometry (LC-MS/MS) analysis [2]. A variety of proteasesincluding trypsin, Lys-C, Glu-C, etc. are applied to digestproteins in proteome research. Among these proteases, trypsinis the most commonly used enzyme. This is mainly attributedto the facts that tryptic peptides have highly basic residues atthe C-termini of peptides, and they are in the preferred massrange for effective fragmentation by MS/MS. Thus, the frag-mentation of tryptic peptides generally leads to a series of y-ion series and makes tandem mass spectra more easily inter-pretable [3]. Trypsin catalyzes the hydrolysis of peptide bondsimmediately after lysine/arginine (K/R) residues in proteins.There are many potential trypsin cleavage sites in proteins,while not all these sites could be cut during a trypsin digestion.These sites are called missed cleavage sites [4–6]. Clearly, themissed cleavage sites have very slow kinetics to be hydro-lyzed by trypsin. Though the trypsin digestion plays an im-portant role in proteome analysis, systematic studying on thekinetics of trypsin-catalyzed reactions in proteome sampleswas not reported. In a proteome sample, huge number ofproteins with different physical chemical properties coexists.If any type of proteins could be preferably digested, thenlimited digestion could be applied to reduce the sample com-plexity. However, no one has attempted to investigate thedigestion priority of different proteins in a typical proteomestudy.
To better understand the trypsin-catalyzed digestion pro-cess, kinetics study of this important process is required. Thereare numerous studies on kinetics analysis of trypsin-catalyzedhydrolysis of lysine or arginine derivatives [7, 8]. In thesestudies, a single substrate with only one cleavage site was
Electronic supplementary material The online version of this article(doi:10.1007/s00216-014-8071-6) contains supplementary material,which is available to authorized users.
Y. Pan :K. Cheng : J. Mao : F. Liu : J. Liu :M. Ye (*) :H. Zou (*)Key Lab of Separation Sciences for Analytical Chemistry, NationalChromatographic Research and Analysis Center, Dalian Institute ofChemical Physics, Chinese Academy of Sciences, Dalian 116023,Chinae-mail: [email protected]: [email protected]
Y. Pan :K. Cheng : J. Mao : F. Liu : J. LiuUniversity of Chinese Academy of Sciences, Beijing 100049, China
Anal Bioanal Chem (2014) 406:6247–6256DOI 10.1007/s00216-014-8071-6

incubated with trypsin for determination of kinetics constants.The kinetics constants for peptides can also be determined inthe sameway whenmass spectrometry was applied to monitorthe reactions [9]. For these studies, one enzymatic reaction canonly determine the kinetics constants for one substrate. Intheory, the cleavage priority of cleavage sites in all proteinsin proteome samples could be determined by synthesizingpeptides centered with these sites. However, this approach isexpensive and time-consuming. Though a single protein wasalso reported to study trypsin digestion kinetics, these studiescannot reflect the kinetics of the cleavage sites [10, 11].Walmsley et al. [12] compared peptide abundances in 2- and18-h human serum albumin (HSA) digests using label-freequantification and principal components analysis (PCA) andfound that many cleavage sites showed variable digestionkinetics patterns. However, systematic investigation of thekinetics of the cleavage sites on proteins in complex proteomesamples is still needed.
Quantitative proteomics, especially stable isotope labeling,is a powerful tool for determining the different peptide amountbetween different proteome samples in high throughput.Recently, we have demonstrated in a preliminary study thatquantitative proteomics could be a powerful tool to study thekinetics and digestion priority of trypsin digestion [13].Triplex stable isotope dimethyl-labeling approach enable thesimultaneous analysis of three samples in one time, and it is areliable, a cost-effective, and an undemanding procedure thatcan be easily automated and applied in high-throughput pro-teomics experiments [14]. So, we employed the triplex stableisotope dimethyl-labeling approach to investigate the kineticsbehavior of trypsin digestion in detail in this study. Proteomesamples were digested with three different times, and then theresultant digests were labeled with stable isotope dimethyllabels, respectively. After quantitative proteomics analysis,10,483 unique peptides from 2,270 proteins were quantified.Based on the abundance changes of the generated pep-tides during this time course study, four types of cleav-age sites, i.e., very fast, fast, slow, and very slow, weredetermined. This enabled the investigation of cut prior-ity of cleavage sites surrounded with different residues.It was found that the cleavage sites surrounded byneutral residues could be quickly cut, while those withneighboring charged residues (D/E/K/R) or proline res-idue (P) could be slowly cut. Because the quantifiedpeptides could be classified into early and later gener-ated peptides, the digestion priority of proteins withdifferent physicochemical properties can also be inves-tigated. In general, the results show that protein abun-dance and other physicochemical properties, such asmolecular weight (Mw), grand average of hydropathicity(GRAVY), aliphatic index, and isoelectric point (pI) hasno notable influence on the digestion priority ofproteins.
Experimental section
Reagents and chemicals
All the water used in this experiment was prepared using aMilli-Q system (Millipore, Bedford, MA). Formic acid (FA)was provided by Fluka (Buchs, Germany). Acetonitrile(ACN, HPLC grade) was purchased from Merck(Darmstadt, Germany). All the other chemicals and reagentswere purchased from Sigma (St. Louis, MO). Fused silicacapillaries with 75 μm i.d. were obtained from PolymicroTechnologies (Phoenix, AZ).
Cell growth and lysis
The HeLa cells were grown according to Bian et al. [15]. Thecell pellets were softly homogenized in a cold lysis buffercontaining 8 M urea, 50 mM triethyl ammonium bicarbonate(TEAB; pH=8.0), 2 % protease cocktail (v/v), 1 % TritonX-100 (v/v), 65 mM dithiothreitol (DTT), 1 mM EDTA,1 mM EDGA, 1 mM PMSF, 1 mM NaF, and 1 mMNa3VO4, sonicated for 400 W×120 s, and centrifuged at23,000g for 1 h. The supernatant containing the total cellproteins was precipitated with five volumes of cold acetone/ethanol/acetic acid (v/v/v=50/50/0.1) at −20 °C. Protein pre-cipitant was centrifuged at 15,000g for 30 min. The pellet waswashed separately with acetone and 75 % ethanol, then ly-ophilized to dryness, and stored at −80 °C.
Protein digestion and stable isotope dimethyl labeling
Proteins (1 mg, the protein concentration was determined byBradford assay) were denatured and reduced in 1 mL of 8 Murea, 100 mM TEAB, pH 8.0, and 10 mM DTT at 56 °C for40 min and then alkylated by 20 mM IAA in the darkness atroom temperature for 30 min. The sample was diluted to 8 mL(1M urea) with 100 mM TEAB, pH 8.0. Trypsin (Sigma) wasadded at a 40:1 protein/protease mass ratio along with CaCl2to 1 mM for digestion at 37 °C; after digested for 1, 4, and18 h, three same aliquots (100 μg) of samples were removedfrom the tube. To prevent further digestion, the trypsin wasinhibited by addition of aprotinin (final concentration, 2.0 μg/mL). Then, the three aliquots above were desalted by solid-phase extraction (SPE) column, lyophilized, and labeled withlight, intermediate, and heavy dimethyl, respectively.
For the triplex stable isotope dimethyl labeling [14, 16],50 μL of CH2O (4%, v/v) CD2O (4 %, v/v) and 13CD2O (4 %,v/v) were added into the sample solutions, respectively, andthen 50μL of freshly preparedNaBH3CN (0.6M), NaBH3CN(0.6 M), and NaBD3CN (0.6 M) were added subsequently.The resultant mixture was incubated for 1 h at room temper-ature. Then, 10 μL of ammonia (25 %) and 25 μL of FAwereadded to consume the excess labeling reagents and to acidify
6248 Y. Pan et al.
the sample. After mixing in a ratio of 1:1:1 on the basis of thetotal peptide amount, the labeled peptide mixture was desaltedby the SPE column. Dry the samples by vacuum centrifuga-tion and stored at −80 °C until used.
Nano LC-MS/MS analysis
For 2D strong cation exchange (SCX)-RP LC-MS/MS analy-sis with the LTQ-Orbitrap mass spectrometer (Velos, ThermoFisher Scientific), a capillary monolithic column (5 cm×200 μm ID) with phosphate functional groups was appliedas an SCX trap column in the first dimension. The sampleloading and analysis procedures were as follows: the peptidesamples were first dissolved in 0.1 % (v/v) formic acid inwater, and then loaded onto the monolith SCX trap column;the trap column was equilibrated with 0.1 % (v/v) formic acidin water for 10 min [17]. After that, it was directly connectedto an RP analytical column in tandem by a union. Then, sixgradient elution steps were applied to gradually elute peptidesfrom the SCX trap column to the RP analytical column withammonium acetate solution concentrations of 50, 150, 250,350, 500, and 1,000 mM, respectively. After each elution step,a subsequent RP LC-MS/MS was executed in 150-min gradi-ent time with 0.1 % (v/v) formic acid in acetonitrile from 5 to35 % (v/v); a capillary column was first manually pulled to afine point as spray tip, and then packed with C18 AQ beads(3 μm, 120 Å, Michrom Bio Resources). All MS and MS/MSspectra were acquired in the data-dependent mode with the 20most intense ions fragmented by CID.
Data analysis
Protein quantification was performed using MaxQuant (ver-sion 1.3.0.5, http://www.maxquant.org) [18]. The raw fileswere searched against UniProt database of humandownloaded from http://www.uniprot.org (released on 12/11/2013); carbamidomethylation on cysteine was set as a fixedmodification, and oxidation on methionine was set as variablemodifications. Peptides were searched using fully trypticcleavage constraints and up to four missed cleavage siteswere allowed; the mass tolerances for the precursor ions andfragment ions were set to 6 ppm and 0.5 Da, respectively. Forquantification, stable isotope dimethyl labeling, differentquantification modes integrated into MaxQuant wereselected, respectively. The other settings were the same tothe conventional search. Sequence logos were automaticallygenerated by the WebLogo (http://weblogo.berkeley.edu/logo.cgi) [19]. The raw sequences for WebLogo analysiswere centered at the cleavage site and extended 13 residues(±6 residues). The N- or C-terminal sequences that could notbe extended were excluded. In order to eliminate the influenceof the relative occurrence of different amino acids in theproteome, the raw sequences for WebLogo analysis were
multiplied by 1,000 and divided by its amino acid frequencyof occurrence in the database to form the normalized peptidesequences [20]. The pI, GRAVY, and aliphatic index of pro-teins and peptides were calculated according to ExPASy(http://web.expasy.org/protparam/protparam-doc.html).
Results and discussion
Time course study of trypsin digestion of proteome sample
Time course investigation of trypsin digestion of proteomesamples was performed with quantitative proteomics at threetime points. As shown in Fig. 1, the lysate of HeLa cells(1 mg) was firstly subjected to trypsin digestion, and the samealiquots (100μg) of the digestion were removed at time pointsof 0.5, 2, and 18 h, respectively. The trypsin inhibitor aprotininwere added to the three-time course digestion immediately toavoid further digestion. Then, quantitative proteomics usingtriplex stable isotope dimethyl labeling was applied to monitorthe abundance variation of generated peptides at different timepoints. The digests from the three time points were labeledwith light (0.5-h digestion), intermediate (2-h digestion), andheavy dimethyl (18-h digestion), respectively. The labeled
Fig. 1 Experimental scheme for investigating the kinetics of trypsin-catalyzed protein digestion by quantitative proteomics
Quantitative proteomics reveals the kinetics of protein digestion 6249
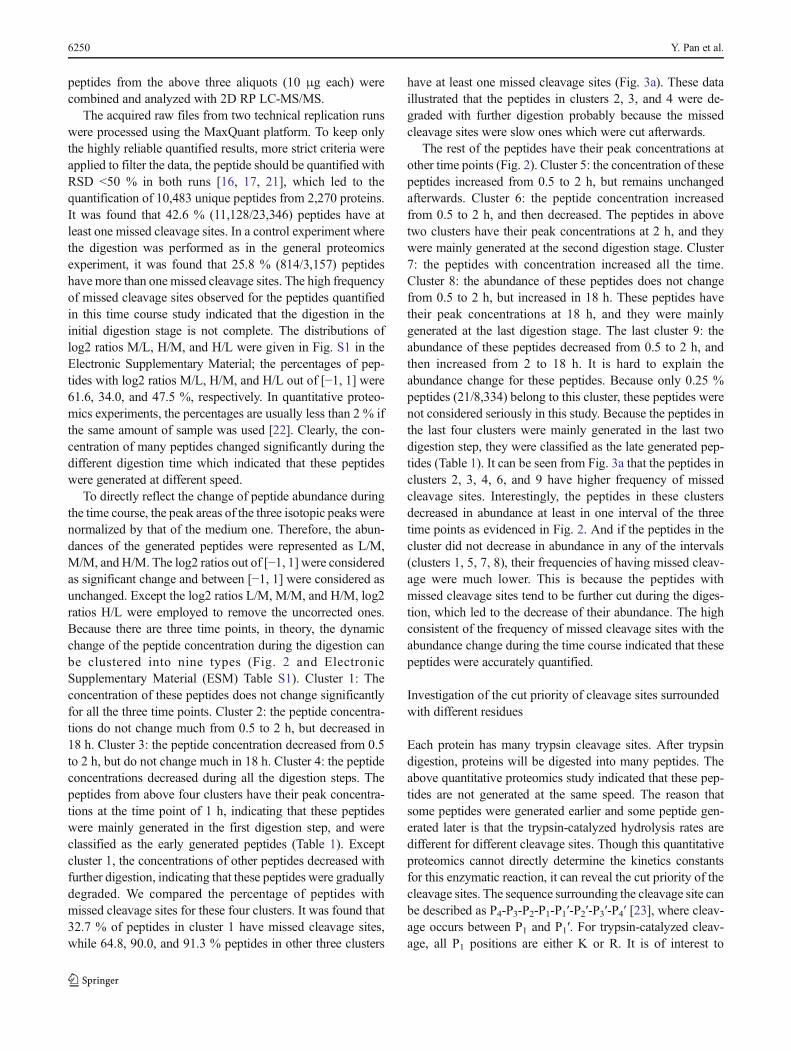
peptides from the above three aliquots (10 μg each) werecombined and analyzed with 2D RP LC-MS/MS.
The acquired raw files from two technical replication runswere processed using the MaxQuant platform. To keep onlythe highly reliable quantified results, more strict criteria wereapplied to filter the data, the peptide should be quantified withRSD <50 % in both runs [16, 17, 21], which led to thequantification of 10,483 unique peptides from 2,270 proteins.It was found that 42.6 % (11,128/23,346) peptides have atleast one missed cleavage sites. In a control experiment wherethe digestion was performed as in the general proteomicsexperiment, it was found that 25.8 % (814/3,157) peptideshave more than one missed cleavage sites. The high frequencyof missed cleavage sites observed for the peptides quantifiedin this time course study indicated that the digestion in theinitial digestion stage is not complete. The distributions oflog2 ratios M/L, H/M, and H/L were given in Fig. S1 in theElectronic Supplementary Material; the percentages of pep-tides with log2 ratios M/L, H/M, and H/L out of [−1, 1] were61.6, 34.0, and 47.5 %, respectively. In quantitative proteo-mics experiments, the percentages are usually less than 2 % ifthe same amount of sample was used [22]. Clearly, the con-centration of many peptides changed significantly during thedifferent digestion time which indicated that these peptideswere generated at different speed.
To directly reflect the change of peptide abundance duringthe time course, the peak areas of the three isotopic peaks werenormalized by that of the medium one. Therefore, the abun-dances of the generated peptides were represented as L/M,M/M, and H/M. The log2 ratios out of [−1, 1] were consideredas significant change and between [−1, 1] were considered asunchanged. Except the log2 ratios L/M, M/M, and H/M, log2ratios H/L were employed to remove the uncorrected ones.Because there are three time points, in theory, the dynamicchange of the peptide concentration during the digestion canbe clustered into nine types (Fig. 2 and ElectronicSupplementary Material (ESM) Table S1). Cluster 1: Theconcentration of these peptides does not change significantlyfor all the three time points. Cluster 2: the peptide concentra-tions do not change much from 0.5 to 2 h, but decreased in18 h. Cluster 3: the peptide concentration decreased from 0.5to 2 h, but do not change much in 18 h. Cluster 4: the peptideconcentrations decreased during all the digestion steps. Thepeptides from above four clusters have their peak concentra-tions at the time point of 1 h, indicating that these peptideswere mainly generated in the first digestion step, and wereclassified as the early generated peptides (Table 1). Exceptcluster 1, the concentrations of other peptides decreased withfurther digestion, indicating that these peptides were graduallydegraded. We compared the percentage of peptides withmissed cleavage sites for these four clusters. It was found that32.7 % of peptides in cluster 1 have missed cleavage sites,while 64.8, 90.0, and 91.3 % peptides in other three clusters
have at least one missed cleavage sites (Fig. 3a). These dataillustrated that the peptides in clusters 2, 3, and 4 were de-graded with further digestion probably because the missedcleavage sites were slow ones which were cut afterwards.
The rest of the peptides have their peak concentrations atother time points (Fig. 2). Cluster 5: the concentration of thesepeptides increased from 0.5 to 2 h, but remains unchangedafterwards. Cluster 6: the peptide concentration increasedfrom 0.5 to 2 h, and then decreased. The peptides in abovetwo clusters have their peak concentrations at 2 h, and theywere mainly generated at the second digestion stage. Cluster7: the peptides with concentration increased all the time.Cluster 8: the abundance of these peptides does not changefrom 0.5 to 2 h, but increased in 18 h. These peptides havetheir peak concentrations at 18 h, and they were mainlygenerated at the last digestion stage. The last cluster 9: theabundance of these peptides decreased from 0.5 to 2 h, andthen increased from 2 to 18 h. It is hard to explain theabundance change for these peptides. Because only 0.25 %peptides (21/8,334) belong to this cluster, these peptides werenot considered seriously in this study. Because the peptides inthe last four clusters were mainly generated in the last twodigestion step, they were classified as the late generated pep-tides (Table 1). It can be seen from Fig. 3a that the peptides inclusters 2, 3, 4, 6, and 9 have higher frequency of missedcleavage sites. Interestingly, the peptides in these clustersdecreased in abundance at least in one interval of the threetime points as evidenced in Fig. 2. And if the peptides in thecluster did not decrease in abundance in any of the intervals(clusters 1, 5, 7, 8), their frequencies of having missed cleav-age were much lower. This is because the peptides withmissed cleavage sites tend to be further cut during the diges-tion, which led to the decrease of their abundance. The highconsistent of the frequency of missed cleavage sites with theabundance change during the time course indicated that thesepeptides were accurately quantified.
Investigation of the cut priority of cleavage sites surroundedwith different residues
Each protein has many trypsin cleavage sites. After trypsindigestion, proteins will be digested into many peptides. Theabove quantitative proteomics study indicated that these pep-tides are not generated at the same speed. The reason thatsome peptides were generated earlier and some peptide gen-erated later is that the trypsin-catalyzed hydrolysis rates aredifferent for different cleavage sites. Though this quantitativeproteomics cannot directly determine the kinetics constantsfor this enzymatic reaction, it can reveal the cut priority of thecleavage sites. The sequence surrounding the cleavage site canbe described as P4-P3-P2-P1-P1′-P2′-P3′-P4′ [23], where cleav-age occurs between P1 and P1′. For trypsin-catalyzed cleav-age, all P1 positions are either K or R. It is of interest to
6250 Y. Pan et al.

investigate which types of residues surrounding the cleavagesites affect their digestion kinetics.
Except for the peptides generated from protein N-/C-termini,the majority of peptides are generated by two trypsin cleavages.Thus, for each identified peptide, it typically has two terminalcleavage sites. Take a quantified peptide, FIDTTSKFGHGR, asthe example. TheN-terminal residue (F) on this peptide is the P1′residue for the N-terminal cleavage site, while the C-terminalresidue (R) is the P1 residue. To extract the residues surroundingthe cleavage sites, the identified peptides should be mapped totheir parent proteins. For above the peptide, the sequencessurrounding the two cleavage sites were determined to beDLK.FID and HGR.FQT after mapping to their parent protein
sequence, respectively. In this way, the residues around thepeptide terminal cleavage sites could be determined. It is wellknown that K/R with a neighboring P residue on the C-terminalside (P1′ position) and K/R with an aspartic acid (D) or glutamicacid (E) residue on either the N- or C-terminal side (P2 or P1′position) were difficult to cut [3–6, 24]. We first investigate ifthere were notable differences in distribution of P on P1′ positionand D/E on (P2 and P1′ position) for the terminal cleavage siteson above nine clusters of peptides. As shown in Fig. 3b, thepercentages of P residue on this position were all <0.15 %,which is far less than the nature P residue frequency of thehuman proteome (about 6.3 % as shown in ESM Fig. S2) [25,26] and the frequency of P followed by K/R in database (5.7%).It indicated that K/R followed with P was not likely cut bytrypsin. This is consistent to “Keil rules” [27], the commonlyaccepted rule for a trypsin cut site is K/R.P. The percentages ofnegative charged amino acid residues D/E (P2 or P1′ position)were less than the native frequency of the human proteome(∼13 %) for clusters 1–4, while the percentages for clusters 5–8 were higher than the native frequency of the human proteome.Based on the quantified ratios, the peptides in clusters 1–4 weregenerated earlier than those in clusters 5–8 during the digestion.
Table 1 The numbers of the early and late generated peptides
Early generated peptides Late generated peptides
Cluster 1 (2,156) Cluster 5 (2,932)
Cluster 2 (1,179) Cluster 6 (1,692)
Cluster 3 (189) Cluster 7 (6)
Cluster 4 (126) Cluster 8 (12)
Fig. 2 Clusters of the peptides according to their abundance change during the time course
Quantitative proteomics reveals the kinetics of protein digestion 6251
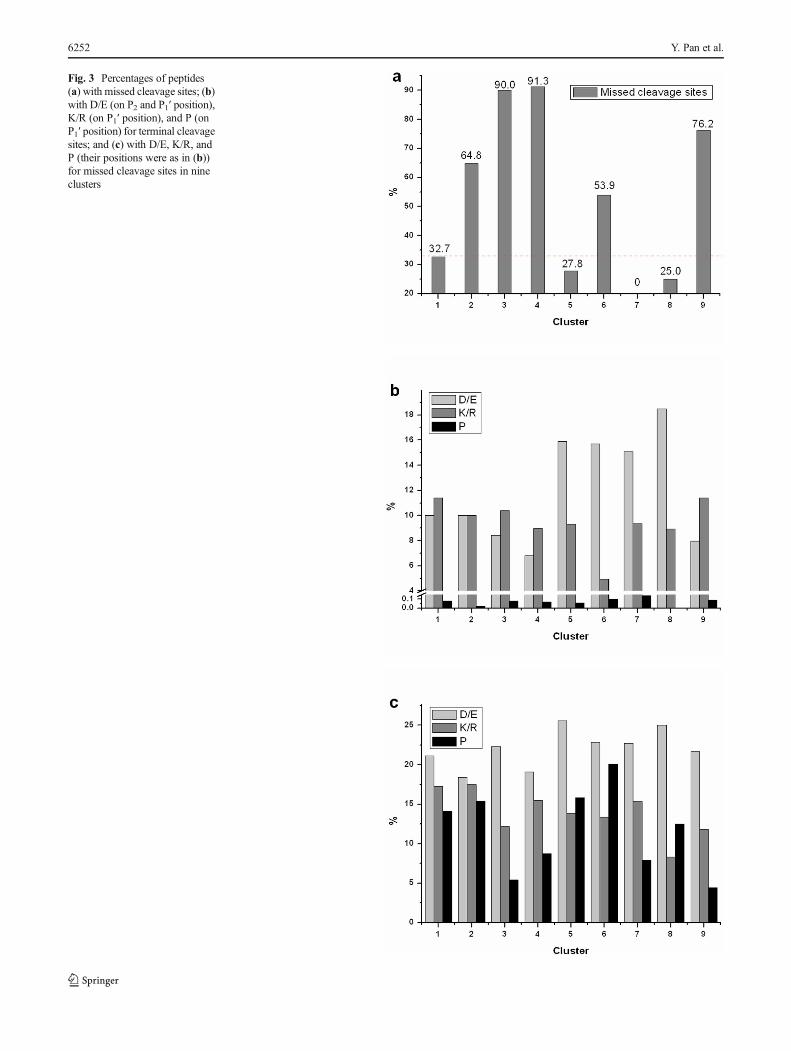
Fig. 3 Percentages of peptides(a) with missed cleavage sites; (b)with D/E (on P2 and P1′ position),K/R (on P1′ position), and P (onP1′ position) for terminal cleavagesites; and (c) with D/E, K/R, andP (their positions were as in (b))for missed cleavage sites in nineclusters
6252 Y. Pan et al.
The high frequency of acidic residues in late generated peptidesmeans that the trypsin-catalyzed reaction is slowwhenK/Rwithneighboring D/E. This is also consistent with the fact that K/Rwith neighboring D/E is likely to be missed cleavage.
In addition to the cleavage sites revealed from the peptidetermini, there were missed cleavage sites on some of theidentified peptides. Still, take the identified peptideFIDTTSKFGHGR as an example. It has one missed cleavagesite. The sequence centered with the cleavage site wasTSK.FGH. We then compared the distributions of P on P1′position and D/E on P2 or P1′ position for the missed cleavagesites on above nine clusters of peptides. As shown in Fig. 3c, thepercentages for P were far higher than the N- and C-terminalcleavage sites, and similar with or slightly higher than the natureP amino acid composition of the human proteome. This con-firmed that K/R followed by Pwas not likely cut by trypsin. Thepercentages of negative charged amino acids D/E (>18.4 %)were all higher than the native composition of the humanproteome (D/E about 12 %) for all clusters. These percentagesare higher than those of cleavage sites revealed by the terminalsites of the early generated peptides (clusters 1–4 in Fig. 3b)while are quite similar with those of the terminal sites for the lategenerated peptides (clusters 5–8 in Fig. 3b). This is not surpris-ing since the missed cleavage sites were relatively slow.
As shown above, the cleavage sites could be revealed by thequantified peptides with either terminal sites or missed cleavagesites. To investigate the cut priority of cleavage sites, they mustbe sorted in the order of their kinetics. Depending on when thesites got cut, the cleavage sites are classified into four types, i.e.,very fast, fast, slow, and very slow sites (for details, see theSupplementary Note and Table S2 in the ESM). The fast cleav-age sites (5,942) were the sites got cut in the first digestion step.Both C- and N-terminal sites for the early generated peptides(clusters 1–4) are fast cleavage sites because they were generat-ed in the first digestion step. The slow cleavage sites (105) werethe sites got cut in the second digestion step. The missedcleavage sites in peptides of cluster 3 containing one missedcleavage site belongs to this class because the concentrations ofpeptides in this cluster do not change much from 0.5 to 2 h, butdecreased in 18 h, indicating that these peptides got cut in thesecond digestion step. The slower cleavage sites (1,161) werethe sites got cut in the third digestion step. Based on the changeof peptide concentration, the missed cleavage sites on peptidesof cluster 2 and cluster 6 with onemissed cleavage site belong tothis type. The slowest cleavage sites (1,682) were the sitescannot be cut at any digestion steps. They are the missedcleavage sites on peptides from cluster 1, cluster 5, and cluster 8.
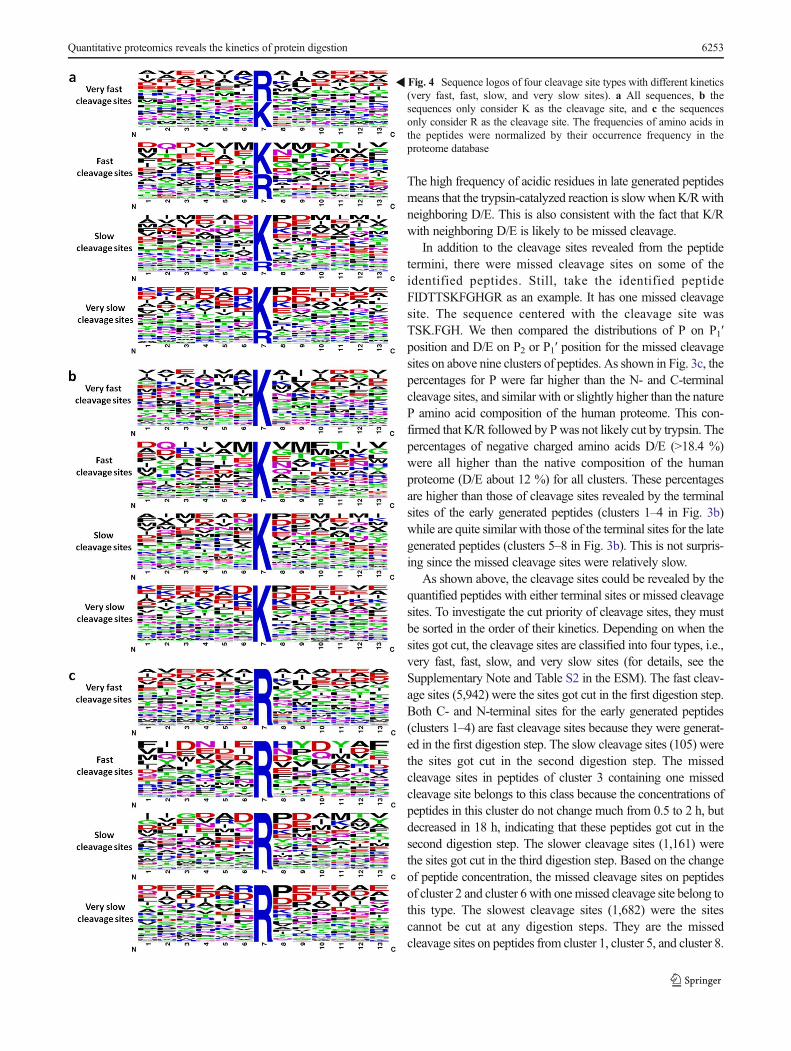
�Fig. 4 Sequence logos of four cleavage site types with different kinetics(very fast, fast, slow, and very slow sites). a All sequences, b thesequences only consider K as the cleavage site, and c the sequencesonly consider R as the cleavage site. The frequencies of amino acids inthe peptides were normalized by their occurrence frequency in theproteome database
Quantitative proteomics reveals the kinetics of protein digestion 6253

The sequence logos for the normalized peptide sequencescentered with above four types of cleavage sites were gener-ated by the WebLogo and are shown in Fig. 4. It is obviousthat the cleavage sites K/R surrounded by neutral residuescould be quickly cut, while those with neighboring chargedresidues (D/E/K/R) or P could be slowly cut (Fig. 4a). For thetwo types of fast cleavage sites, i.e., very fast and fast sites, Rresidues on P1 position account for 55.3 and 44.2 % of allsites, respectively. While for the two types of slow cleavagesites, the R sites account for less than 25 % (ESM Fig. S3).This indicated that trypsin cleaves the C-terminal to K and Rresidues with higher rates for R. We are curious if there is anydifference in the effects of surrounding residues on the kinet-ics of cleavage sites K and R. For this purpose, we generatedthe sequence logos for cleavage sites K and R separately(Fig. 4b, c). In general, they are quite similar but there aresome differences. To examine the effects of surrounding res-idues on the kinetics of cleavage sites in detail, we comparedthe distribution of the neighboring residues (ESM Fig. S4). Aninteresting phenomenon is that the K/R following P (P2 posi-tion) tends to be very fast cleavage sites, the special configu-ration of proline and the small side chain probably allowtrypsin access more easily the cleavage sites. The presenceof D/E on P2, P1′, and P2′ positions of cleavage sites K makethe kinetics slow, and the P2′ position is more sensitive to D/E;the similar situation was observed in cleavage sites R.Cleavage sites R with alkaline amino acid R on P2 positionwere more difficult to be cut than acidic amino acids, theopposite situation occurred at the cleavage sites K.
Investigation of the digestion priority of proteinswith different physicochemical properties
It is of interest to investigate if the peptides generated atdifferent time points have correlation with different types ofproteins. The quantified peptides were classified into twotypes: (1) the early generated peptides, these peptides aremainly generated at the first digestion stage (clusters 1–4)and (2) the late generated peptides, these peptides are mainlygenerated at the second and third digestion stages (clusters 5–
8). There were 3,650 and 4,642 unique peptides that corre-spond to 1,397 and 1,346 proteins for the above two types ofpeptides, respectively. If a specific type of proteins is digestedearlier during a digestion, then more peptides should presentin the pool of the early generated peptides. Therefore, theprotein digestion priority could be judged according to thedistribution of early and late generated peptides across differ-ent physicochemical properties of their parent proteins.
We have investigated the digestion priority of proteins rela-tive to their abundances with a much smaller dataset [13]. In thisstudy, we further investigated this correlation with much biggerdataset. The quantified proteins were classified into 16 binsaccording to their spectra counts, which approximately repre-sented their abundances. Then, the distributions of early and lategenerated peptides across the spectra counts were investigated(Fig. 5). The overall distributions between the two types ofpeptides are quite similar, suggesting that the digestion priorityof individual proteins is almost independent of their abun-dances. However, there is a subtle difference between thesetwo distributions. The percentages for early generated peptidesare slightly higher than those for late generated peptides in thelow spectra count range, while the difference is opposite in thehigh spectra count range but the difference can be ignored whenthe spectra counts were larger than 32. If the protein spectracount accurately reflects the protein abundance [28–30], thenthe low abundance proteins are digested slightly earlier than thehigh abundance ones in general.
We then investigated if the early/late generated peptidespreferably derived from proteins with some types of physico-chemical properties. We first investigated the digestion prior-ity for proteins with different sizes. The Mw for the majorityof the identified proteins were in the range of 30,000 to100,000 Da. If the proteins are not denatured, then trypsinmay have difficulty to access the cleavage sites buried insidebig proteins, and so, the more late generated peptides shouldbe derived from the big proteins. However, it was found thatthe distributions of the two types of peptides across the Mw ofproteins are also very similar (ESM Fig. S5), indicating thedigestion priority of proteins does not depend on their sizes.This is not surprising since the proteins are denatured, and so,
Fig. 5 The distribution of the early generated peptides and the late generated peptides across the protein spectra counts. The percentages on the Y-axis arethe percentages of the early or late generated peptides within each bin of log2 (spectra counts) of the proteins they derived from
6254 Y. Pan et al.
the accessibility of trypsin to the cleavage sites on the proteinswith different sizes is similar. As trypsin cut the sitessurrounded with neutral residues with high rate, it is of interestto investigate if the digestion priority depends on their hydro-phobicity. The GRAVYvalue for a protein is calculated as thesum of hydropathicity values of all the amino acid residuesdivided by the number of residues in the sequence [31]. Thealiphatic index of a protein is defined as the relative volumeoccupied by aliphatic side chains (alanine, valine, isoleucine,and leucine). An increase in the aliphatic index increases thethermostability of globular proteins [32]. Both GRAVY andaliphatic index reflect the hydrophobicity of proteins. It can befound that the distributions of early and late generated pep-tides across either GRAVY value or aliphatic index have nonotable differences (ESM Fig. S6 and S7), indicating thatthere are no much differences in the digestion priority ofproteins with different hydrophobicity. The GRAVY valuesof most proteins were <0, showing that the digested proteinswere relatively hydrophilic because of the lysis buffer solutionused here. Finally, we investigated the dependence of diges-tion priority on protein’s pI values and no dependence wasobserved either (ESM Fig. S8). Above data indicated thatdigestion priority does not depend on the physicochemicalproperties of proteins investigated in general.
Conclusions
To study the kinetics of trypsin-catalyzed protein digestion,quantitative proteomics was applied to monitor the dynamicsof the generated peptides from trypsin digestion of a proteomesample in a time course study. According to the dynamicchange of peptide abundance, the peptides were divided intotwo types: the early generated peptides and the late generatedpeptides. In general, the trypsin-catalyzed digestion priority ofindividual proteins in a proteome sample is independent oftheir abundances and other physicochemical properties, suchas Mw, GRAVY, aliphatic index, and pI. Thus, selectiveenrichment or depletion of specific type of proteins via limiteddigestion is likely impossible. The data also indicate that thepriority order of cleavage depends largely on the kineticsproperties of the cleavage sites, i.e., the residues surroundingthe cleavage sites in proteins. The high consistency of the slowcleavage sites with the reported missed cleavage sites indicat-ed that the quantitative proteomics approach is a good ap-proach to compare the kinetics of trypsin-catalyzed cleavage.
Acknowledgments This work was supported by the China State KeyBasic Research Program Grant (2013CB911202, 2012CB910101, and2012CB910604), the Creative Research Group Project of NSFC(21321064), the National Natural Science Foundation of China(21275142, 21235006, 81161120540, and 81361128015), National KeySpecial Program on Infection diseases (2012ZX10002009-011), andAnalytical Method Innovation Program of MOST (2012IM030900).
References
1. Hunt DF, Yates JR, Shabanowitz J, Winston S, Hauer CR (1986)Protein sequencing by tandemmass spectrometry. Proc Natl Acad SciU S A 83(17):6233–6237
2. Wu C, Tran JC, Zamdborg L, Durbin KR, Li M, Ahlf DR, Early BP,Thomas PM, Sweedler JV, Kelleher NL (2012) A protease for ‘mid-dle-down’ proteomics. Nat Methods 9(8):822–824
3. Olsen JV, Ong S-E, Mann M (2004) Trypsin cleaves exclusively C-terminal to arginine and lysine residues. Mol Cell Proteomics 3(6):608–614
4. Siepen JA, Keevil E-J, Knight D, Hubbard SJ (2007) Prediction ofmissed cleavage sites in tryptic peptides aids protein identification inproteomics. J Proteome Res 6(1):399–408
5. Lawless C, Hubbard SJ (2012) Prediction of missed proteolyticcleavages for the selection of surrogate peptides for quantitativeproteomics. Omics 16(9):449–456
6. Gershon PD (2013) Cleaved and missed sites for trypsin, Lys-C andLys-N can be predicted with high confidence on the basis of sequencecontext. J Proteome Res 13(2):702–709
7. Wang S-S, Carpenter FH (1968) Kinetic studies at high pH of thetrypsin-catalyzed hydrolysis of Nα-benzoyl derivatives of L-arginamide, L-lysinamide, and S-2-aminoethyl-L-cysteinamide andrelated compounds. J Biol Chem 243(13):3702–3710
8. Simpson B, Haard N (1984) Purification and characterization oftrypsin from the Greenland cod (Gadus ogac). 1. Kinetic and ther-modynamic characteristics. Can J Biochem Cell Biol 62(9):894–900
9. Caprioli RM, Smith L (1986) Determination of Km and Vmax fortryptic peptide hydrolysis using fast atom bombardment mass spec-trometry. Anal Chem 58(6):1080–1083
10. Fraser D, Powell RE (1950) The kinetics of trypsin digestion. J BiolChem 187:803–820
11. Halsey JF, Harrington WF (1973) Substructure of paramyosin.Correlation of helix stability, trypsin digestion kinetics, and aminoacid composition. Biochemistry 12(4):693–701
12. Walmsley SJ, Rudnick PA, Liang Y, Dong Q, Stein SE, NesvizhskiiAI (2013) Comprehensive analysis of protein digestion using sixtrypsins reveals the origin of trypsin as a significant source of vari-ability in proteomics. J Proteome Res 12(12):5666–5680
13. Ye M, Pan Y, Cheng K, Zou H (2014) Protein digestion priority isindependent of protein abundances. Nat Methods 11(3):220–222
14. Boersema PJ, Raijmakers R, Lemeer S, Mohammed S, Heck AJR(2009) Multiplex peptide stable isotope dimethyl labeling for quan-titative proteomics. Nat Protoc 4(4):484–494
15. Bian Y, Ye M, Song C, Cheng K, Wang C, Wei X, Zhu J, Chen R,Wang F, Zou H (2012) Improve the coverage for the analysis ofphosphoproteome of HeLa cells by a tandem digestion approach. JProteome Res 11(5):2828–2837
16. Song C, Wang F, Ye M, Cheng K, Chen R, Zhu J, Tan Y, Wang H,Figeys D, Zou H (2011) Improvement of the quantification accuracyand throughput for phosphoproteome analysis by a pseudo triplexstable isotope dimethyl labeling approach. Anal Chem 83(20):7755–7762
17. Wang F, Chen R, Zhu J, SunD, Song C,WuY, YeM,Wang L, Zou H(2010) A fully automated system with online sample loading, isotopedimethyl labeling and multidimensional separation for high-throughput quantitative proteome analysis. Anal Chem 82(7):3007–3015
18. Cox J,MannM (2008)MaxQuant enables high peptide identificationrates, individualized ppb-range mass accuracies and proteome-wideprotein quantification. Nat Biotechnol 26(12):1367–1372
19. Crooks GE, Hon G, Chandonia J-M, Brenner SE (2004)WebLogo: asequence logo generator. Genome Res 14(6):1188–1190
20. Rodriguez J, Gupta N, Smith RD, Pevzner PA (2007) Does trypsincut before proline? J Proteome Res 7(1):300–305
Quantitative proteomics reveals the kinetics of protein digestion 6255

21. Yang S, Nie A, Zhang L, YanG, Yao J, Xie L, LuH, Yang P (2012) Anovel quantitative proteomics workflow by isobaric terminal label-ing. J Proteome 75(18):5797–5806
22. Li Z, Adams RM, Chourey K, Hurst GB, Hettich RL, Pan C (2012)Systematic comparison of label-free, metabolic labeling, and isobaricchemical labeling for quantitative proteomics on LTQOrbitrap velos.J Proteome Res 11(3):1582–1590
23. Schechter I, Berger A (1967) On the size of the active site inproteases. I Papain. Biochem Biophys Res Commun 27(2):157–162
24. Thiede B, Lamer S, Mattow J, Siejak F, Dimmler C, Rudel T,Jungblut PR (2000) Analysis of missed cleavage sites, tryptophanoxidation and N-terminal pyroglutamylation after in-gel tryptic di-gestion. Rapid Commun Mass Spectrom 14(6):496–502
25. Switzar L, Giera M, Niessen WM (2013) Protein digestion: anoverview of the available techniques and recent developments. JProteome Res 12(3):1067–1077
26. Apweiler R, BiswasM, FleischmannW, Kanapin A, KaravidopoulouY, Kersey P, Kriventseva EV, Mittard V, Mulder N, Phan I (2001)Proteome analysis database: online application of InterPro and
CluSTr for the functional classification of proteins in whole genomes.Nucleic Acids Res 29(1):44–48
27. Keil B (1992) Specificity of proteolysis. Springer, Berlin28. Liu H, Sadygov RG, Yates JR (2004) A model for random sampling
and estimation of relative protein abundance in shotgun proteomics.Anal Chem 76(14):4193–4201
29. OldWM,Meyer-Arendt K, Aveline-Wolf L, Pierce KG,Mendoza A,Sevinsky JR, Resing KA, Ahn NG (2005) Comparison of label-freemethods for quantifying human proteins by shotgun proteomics. MolCell Proteomics 4(10):1487–1502
30. Ning K, Fermin D, Nesvizhskii AI (2012) Comparative analysis ofdifferent label-free mass spectrometry based protein abundance esti-mates and their correlation with RNA-Seq gene expression data. JProteome Res 11(4):2261–2271
31. Kyte J, Doolittle RF (1982) A simple method for displayingthe hydropathic character of a protein. J Mol Biol 157(1):105–132
32. Atsushi I (1980) Thermostability and aliphatic index of globularproteins. J Biochem 88(6):1895–1898
6256 Y. Pan et al.