Formulating a strategy through quantitative strategic planning matrix (QSPM) based on SWOT framework
Upload
warren-mayCategory
view
239download
0
chapter 2Quantitative
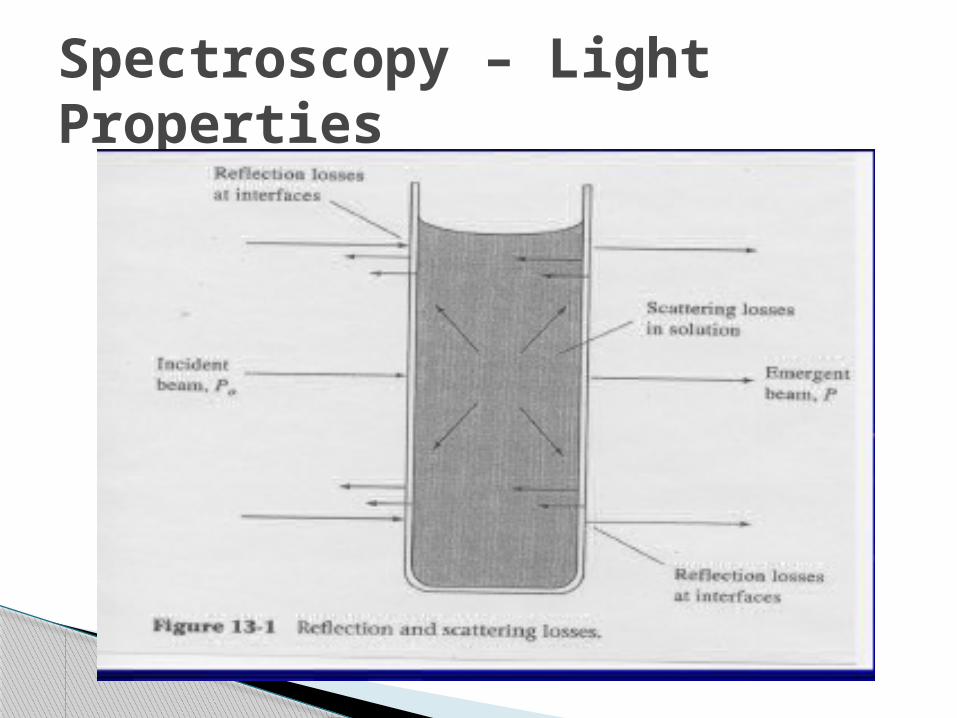
Spectroscopy – Light Properties
Model of light interaction with matrix and how spectrophotometer works
Spectrophotometer
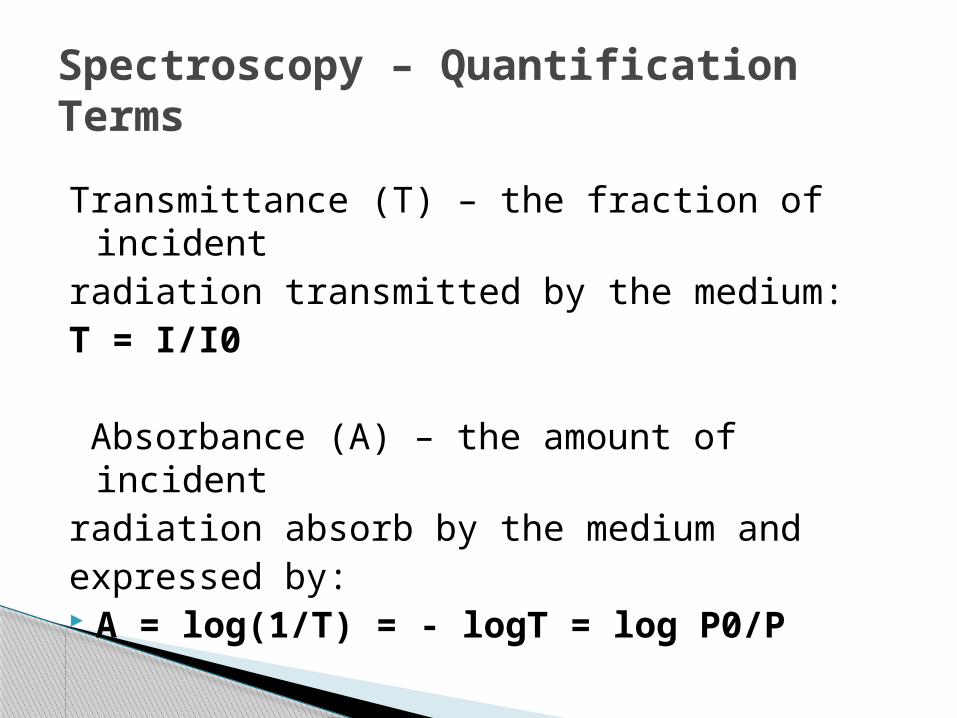
Transmittance (T) – the fraction of incidentradiation transmitted by the medium:T = I/I0
Absorbance (A) – the amount of incidentradiation absorb by the medium andexpressed by: A = log(1/T) = - logT = log P0/P
Spectroscopy – Quantification Terms
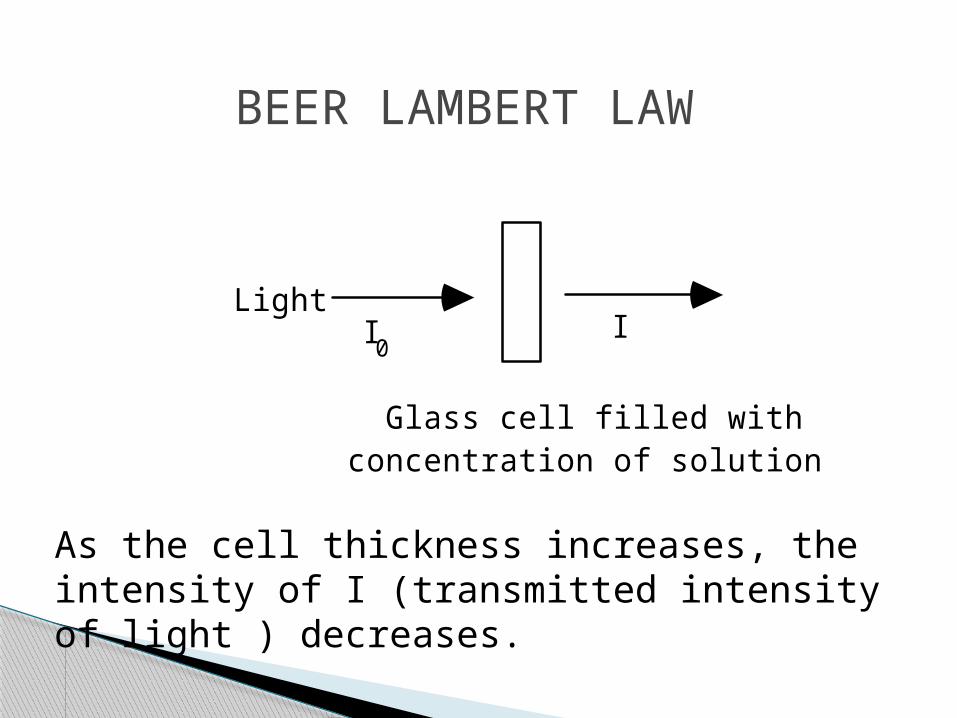
BEER LAMBERT LAW
Glass cell filled with concentration of solution (C)
IILight
0
As the cell thickness increases, the intensity of I (transmitted intensity of light ) decreases.
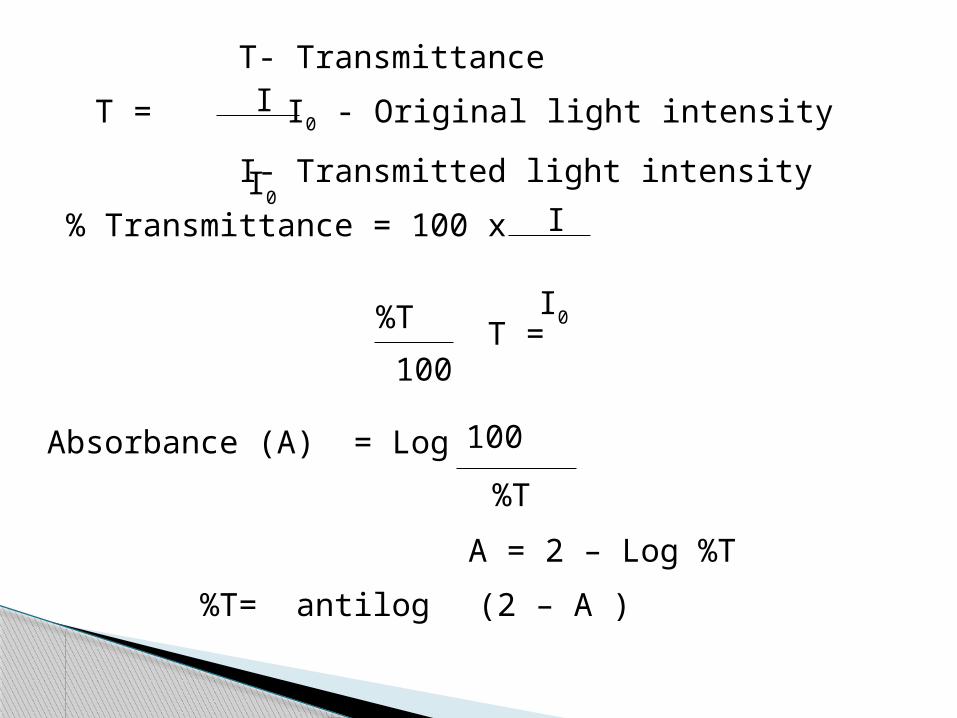
T- Transmittance
T = I0 - Original light intensity
I- Transmitted light intensity
% Transmittance = 100 x
T =
Absorbance (A) = Log
A = 2 – Log %T
%T= antilog (2 – A )
I I0
100
%T
%T
100
I I0
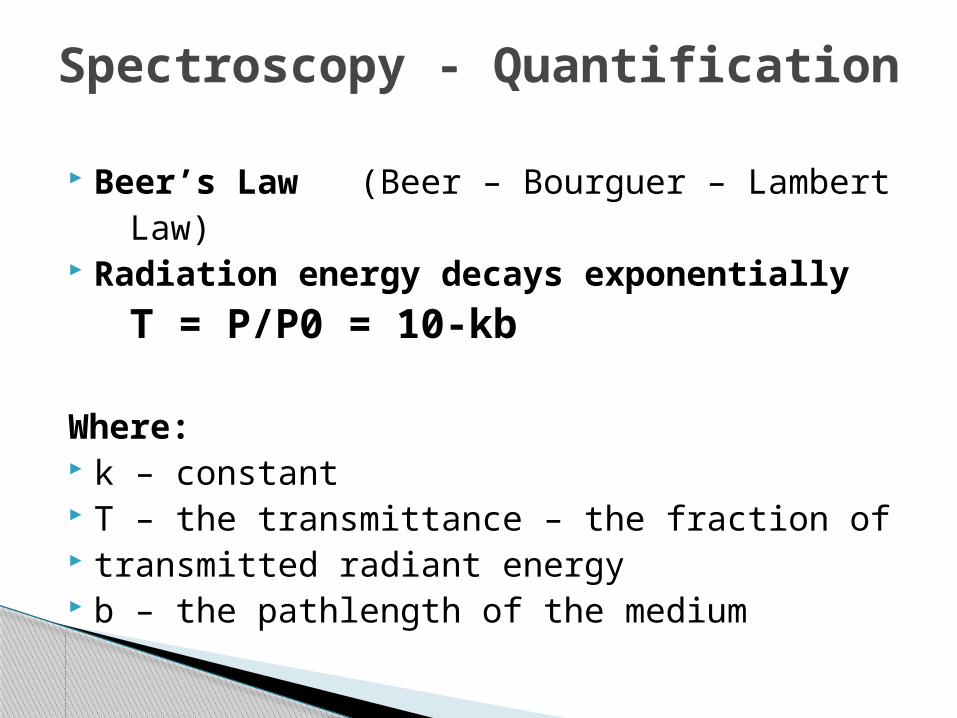
Spectroscopy - Quantification
Beer’s Law (Beer – Bourguer – Lambert Law) Radiation energy decays exponentially
T = P/P0 = 10-kb
Where: k – constant T – the transmittance – the fraction of transmitted radiant energy b – the pathlength of the medium
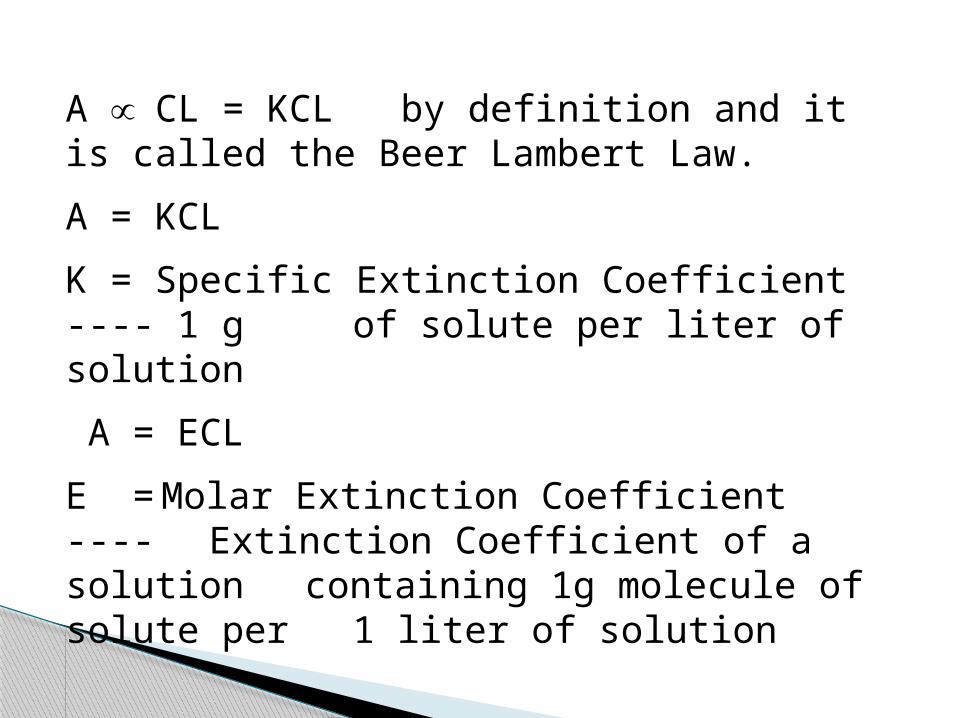
A CL = KCL by definition and it is called the Beer Lambert Law.
A = KCL
K = Specific Extinction Coefficient ---- 1 g of solute per liter of solution
A = ECL
E = Molar Extinction Coefficient ---- Extinction Coefficient of a solution containing 1g molecule of solute per 1 liter of solution
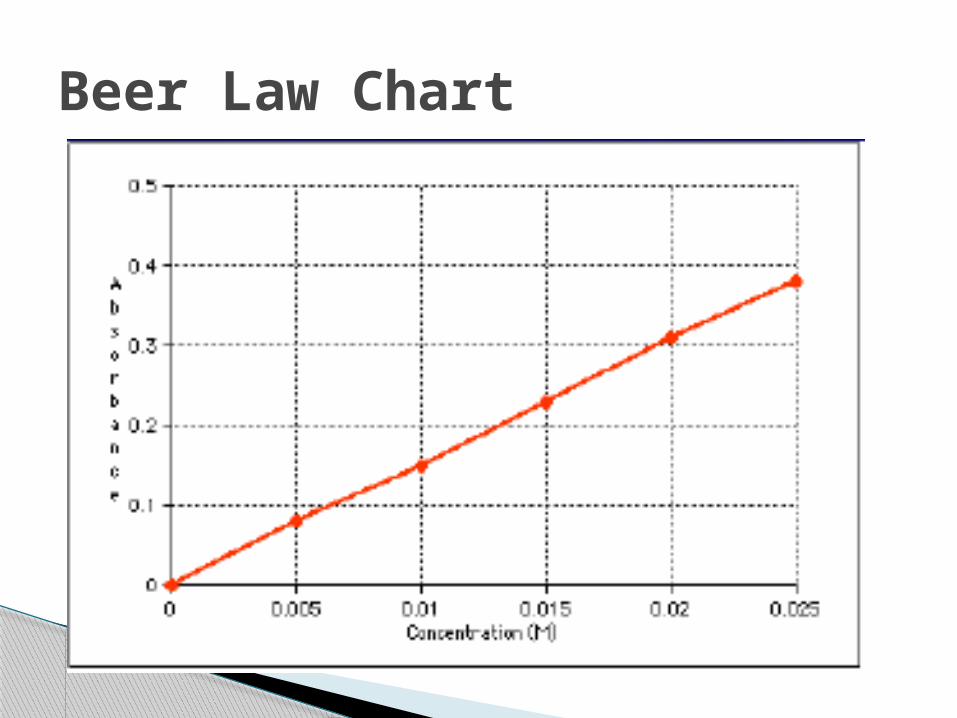
Beer Law Chart
E =Absorbance x Liter
Moles x cm
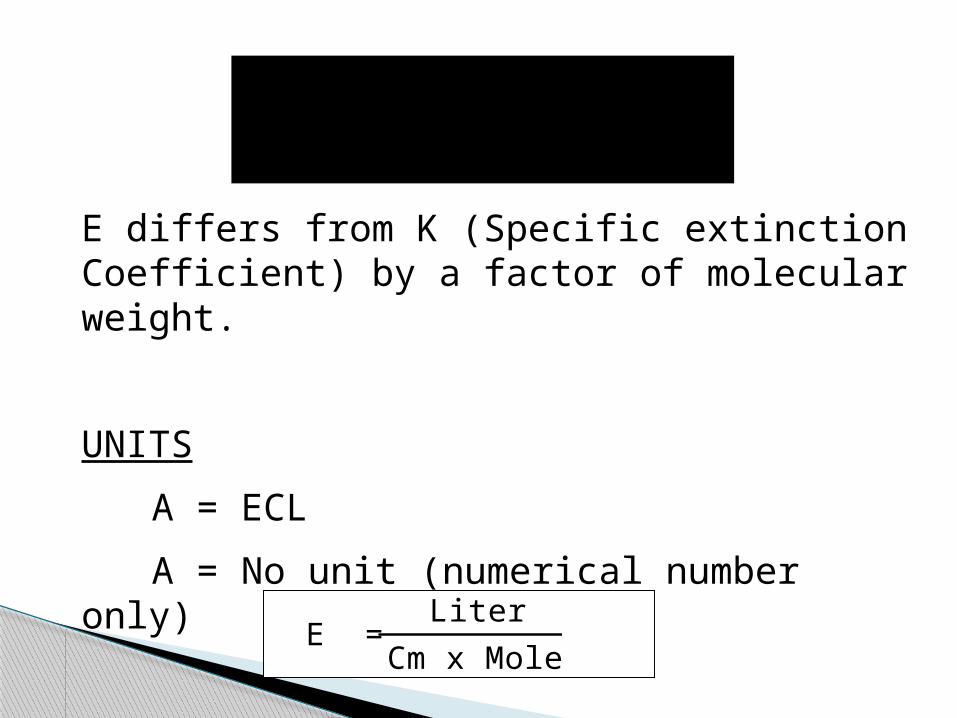
E differs from K (Specific extinction Coefficient) by a factor of molecular weight.
UNITS
A = ECL
A = No unit (numerical number only)
E =
Liter
Cm x Mole
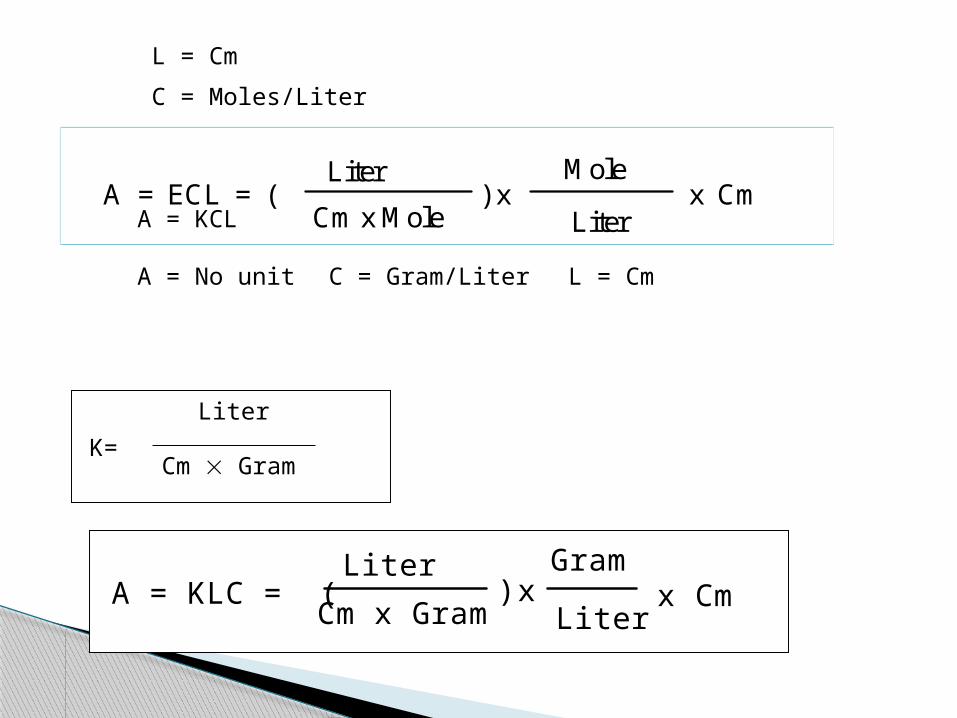
L = Cm
C = Moles/Liter
A = KCL
A = No unit C = Gram/Liter L = Cm
A = ECL = (Liter
Cm x Mole) x
Mole
Literx Cm
K=
Liter
Cm Gram
A = KLC = (Liter
Cm x Gram
Gram
Literx Cm) x
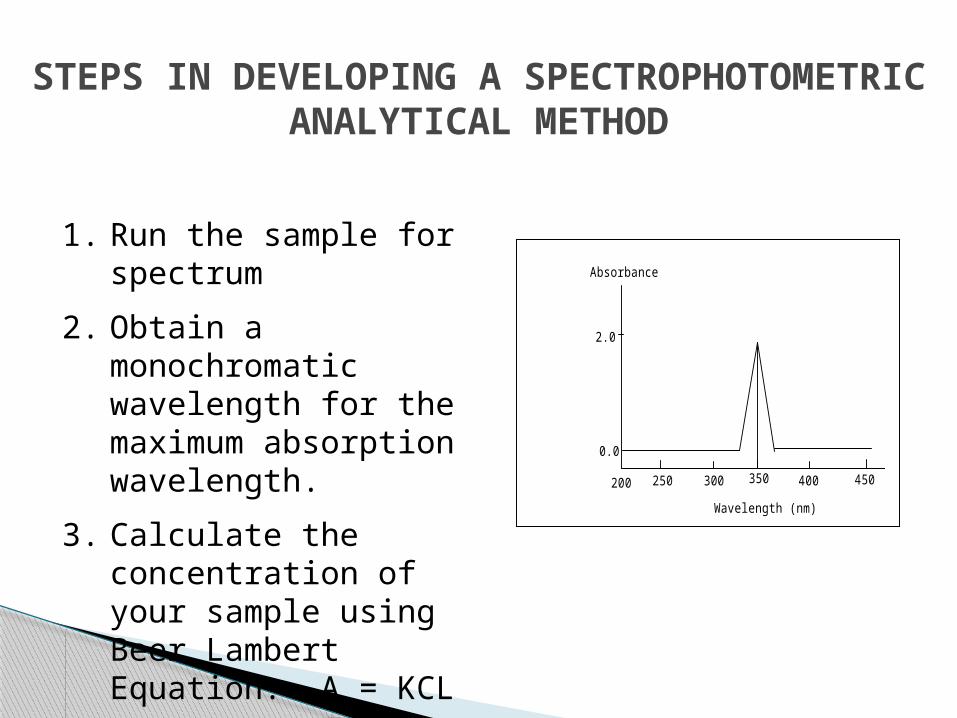
STEPS IN DEVELOPING A SPECTROPHOTOMETRIC ANALYTICAL
METHOD
1. Run the sample for spectrum
2. Obtain a monochromatic wavelength for the maximum absorption wavelength.
3. Calculate the concentration of your sample using Beer Lambert Equation: A = KCL
Wavelength (nm)
Absorbance
0.0
2.0
200 250 300 350 400 450
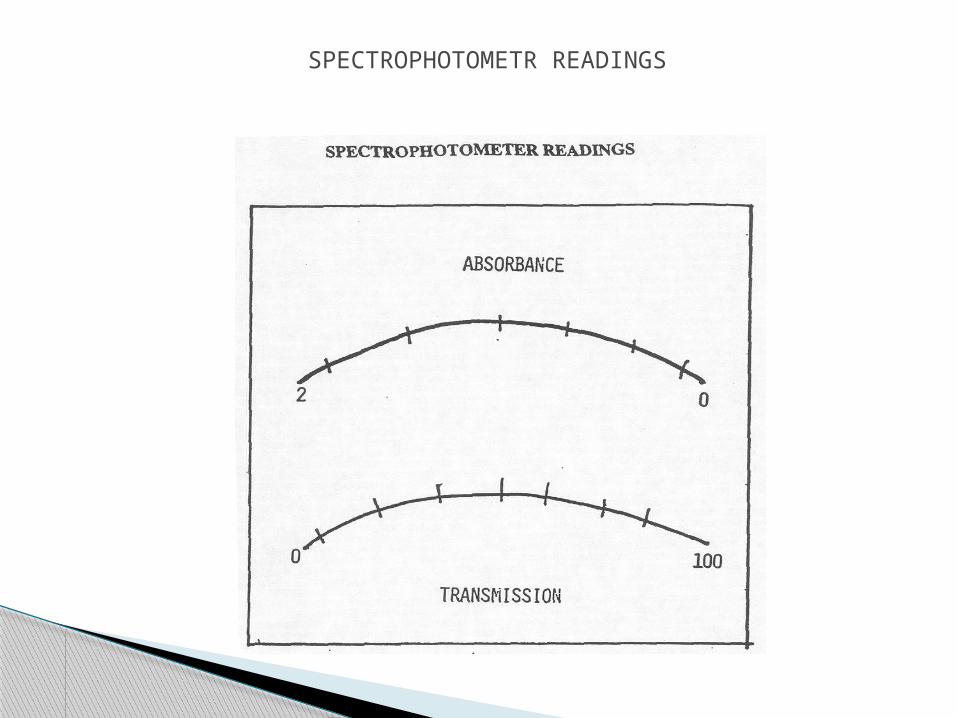
SPECTROPHOTOMETR READINGS
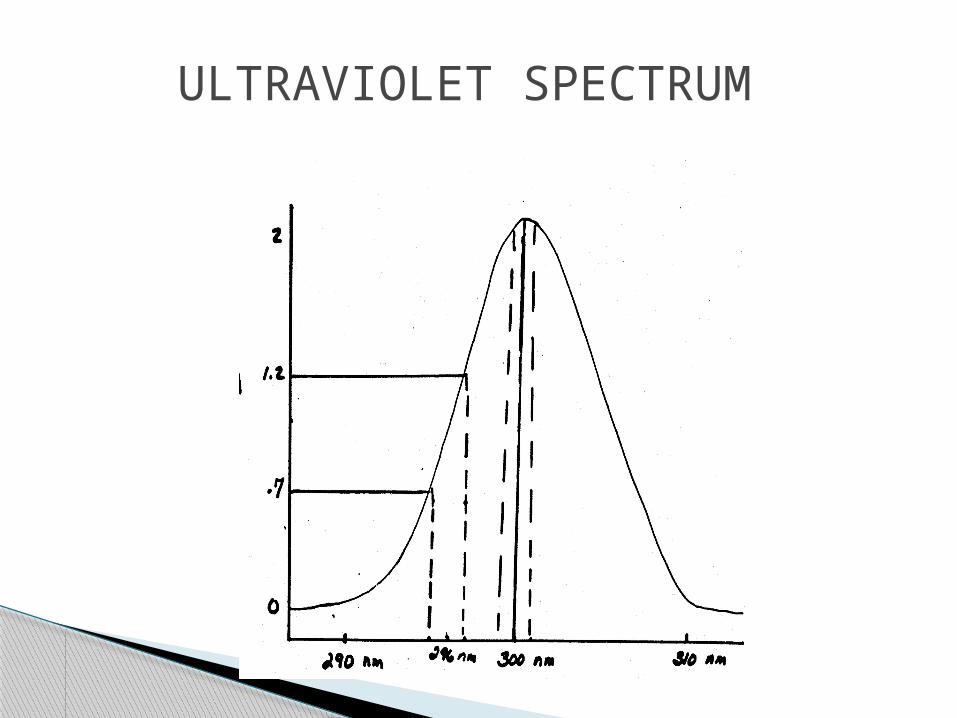
ULTRAVIOLET SPECTRUM
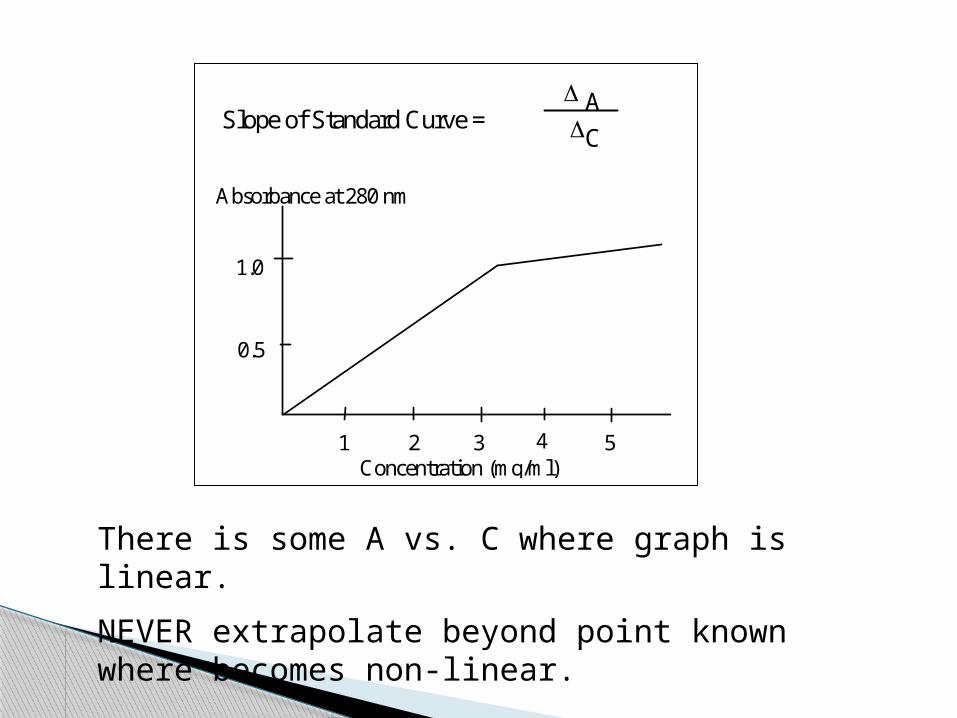
Slope of Standard Curve = AC
1 2 3 4 5
1.0
0.5
Concentration (mg/ml)
Absorbance at 280 nm
There is some A vs. C where graph is linear.
NEVER extrapolate beyond point known where becomes non-linear.
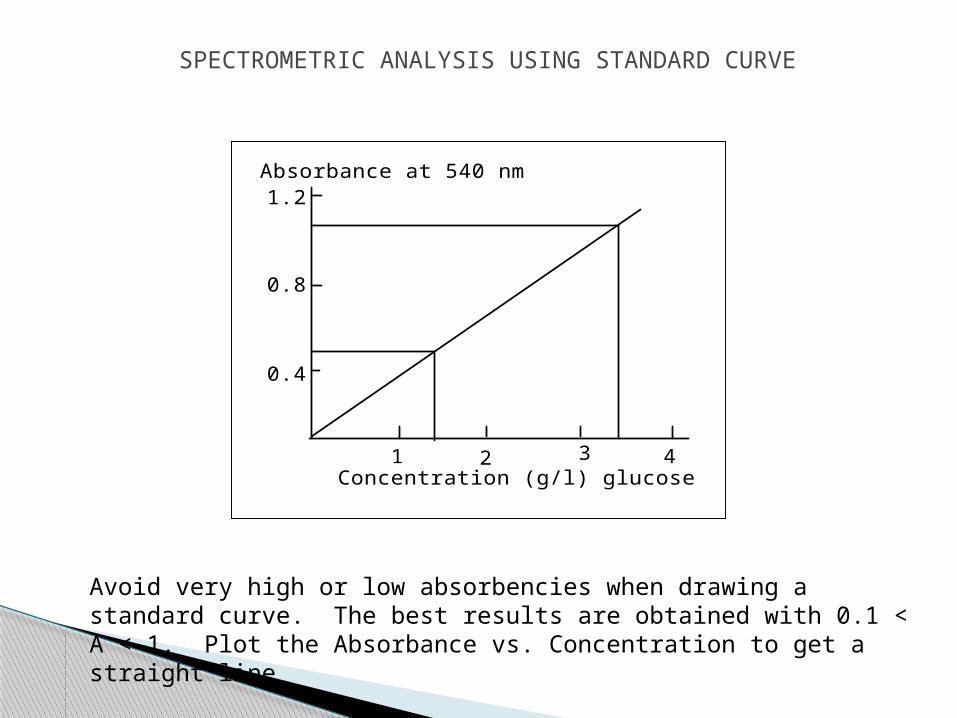
SPECTROMETRIC ANALYSIS USING STANDARD CURVE
1 2 3 4
0.4
0.8
1.2Absorbance at 540 nm
Concentration (g/l) glucose
Avoid very high or low absorbencies when drawing a standard curve. The best results are obtained with 0.1 < A < 1. Plot the Absorbance vs. Concentration to get a straight line
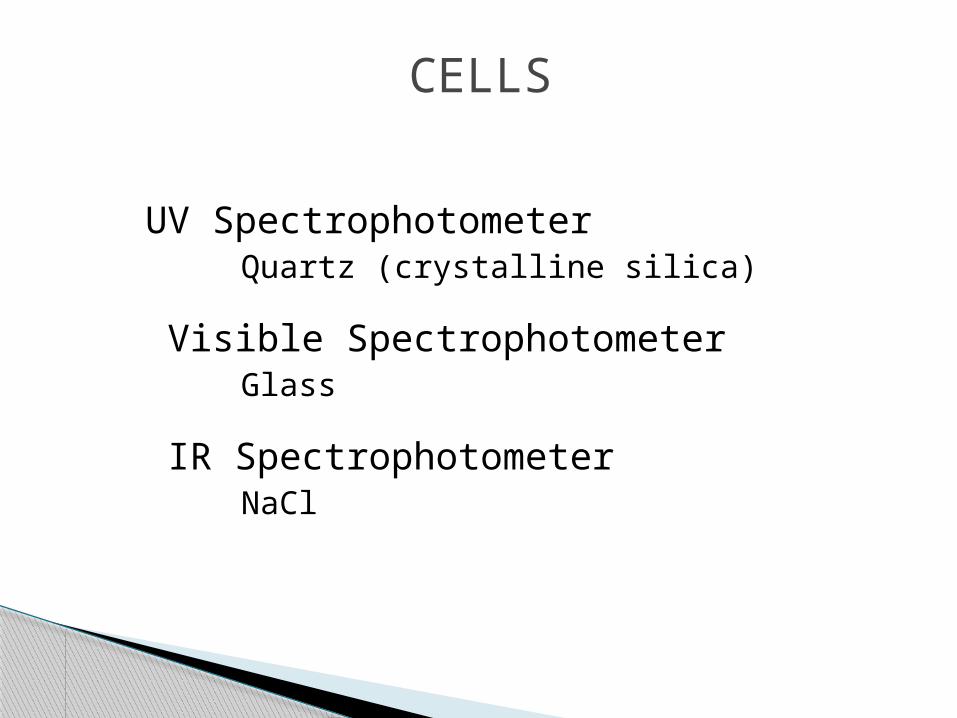
CELLS
UV SpectrophotometerQuartz (crystalline silica)
Visible SpectrophotometerGlass
IR SpectrophotometerNaCl
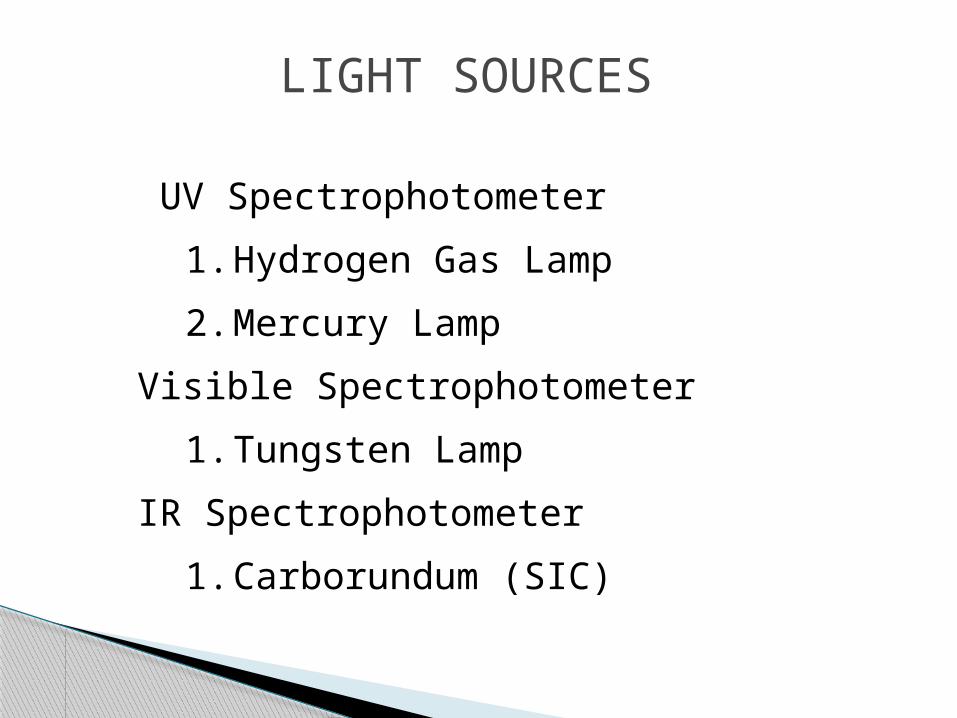
LIGHT SOURCES
UV Spectrophotometer
1. Hydrogen Gas Lamp
2. Mercury Lamp
Visible Spectrophotometer
1. Tungsten Lamp
IR Spectrophotometer
1. Carborundum (SIC)

UV SPECTROMETER APPLICATION
Protein
Amino Acids (aromatic)
Pantothenic Acid
Glucose Determination
Enzyme Activity (Hexokinase)
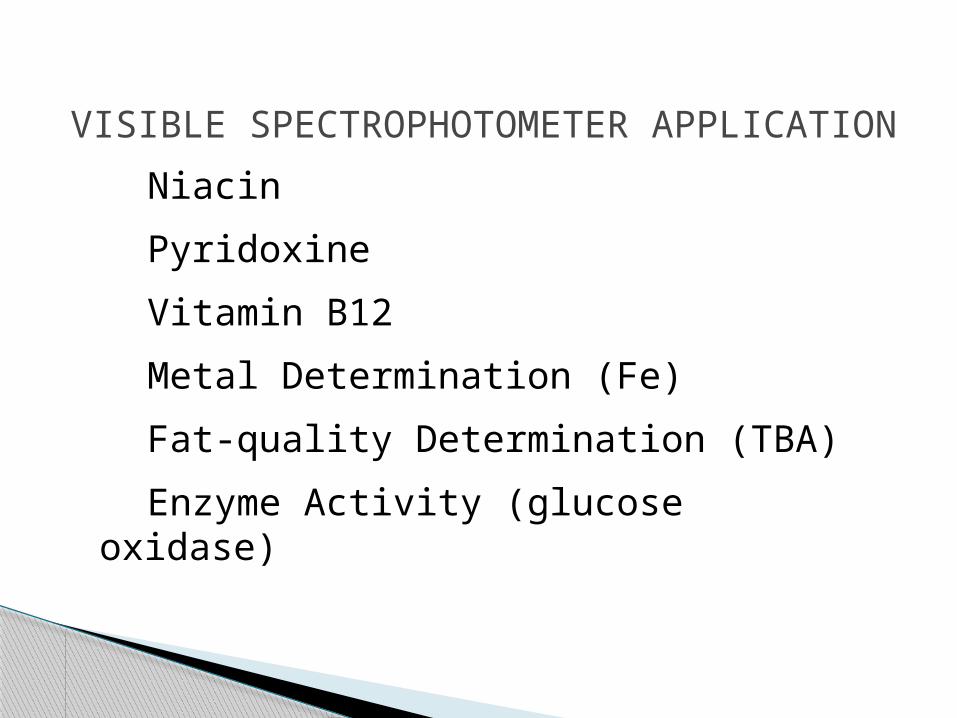
VISIBLE SPECTROPHOTOMETER APPLICATION
Niacin
Pyridoxine
Vitamin B12
Metal Determination (Fe)
Fat-quality Determination (TBA)
Enzyme Activity (glucose oxidase)
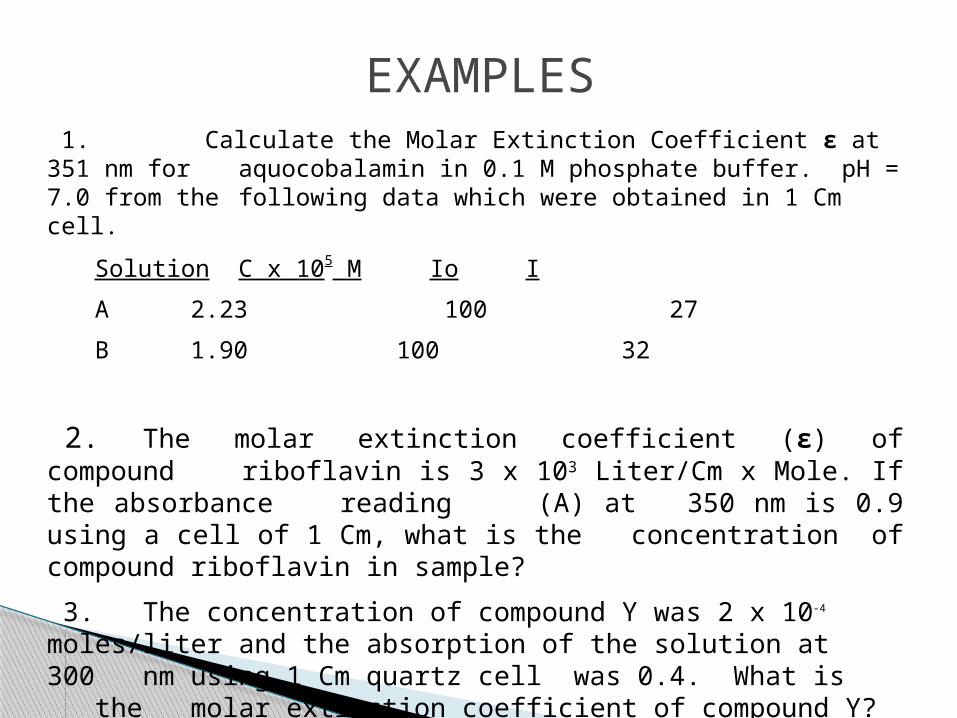
EXAMPLES 1. Calculate the Molar Extinction Coefficient ε at 351 nm for
aquocobalamin in 0.1 M phosphate buffer. pH = 7.0 from the following data which were obtained in 1 Cm cell.
Solution C x 105 M Io I
A 2.23 100 27
B 1.90 100 32
2. The molar extinction coefficient (ε) of compound riboflavin is 3 x 10³ Liter/Cm x Mole. If the absorbance reading
(A) at 350 nm is 0.9 using a cell of 1 Cm, what is the concentration of compound riboflavin in sample?
3. The concentration of compound Y was 2 x 10⁻⁴ moles/liter and the absorption of the solution at 300 nm using 1 Cm quartz cell was 0.4. What is the molar extinction coefficient of compound Y?
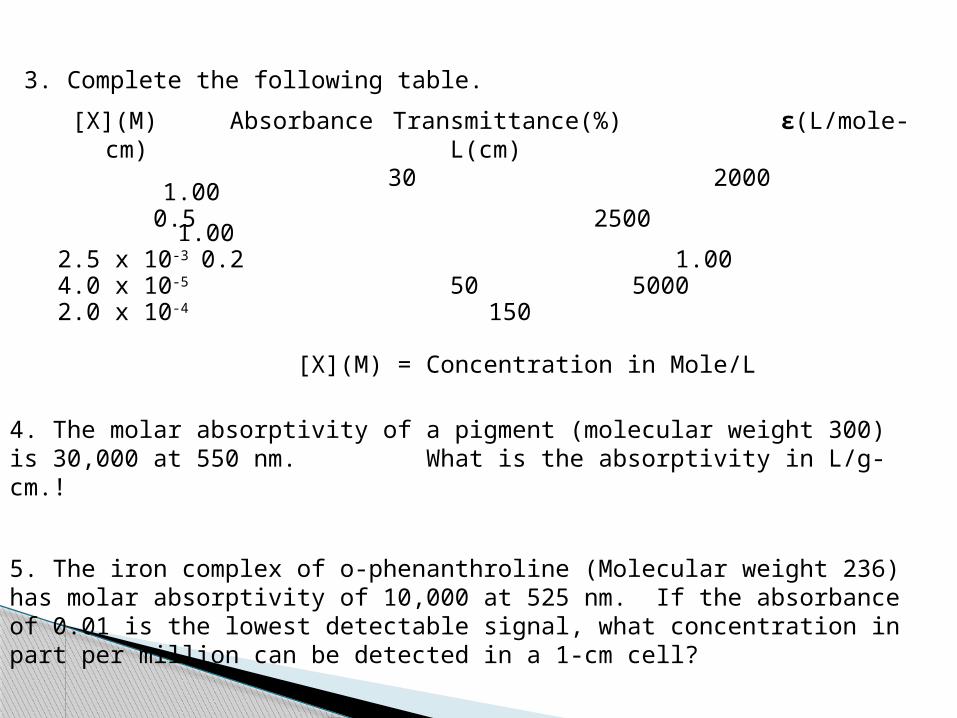
3. Complete the following table.
[X](M) Absorbance Transmittance(%) ε(L/mole-cm) L(cm) 30 2000 1.00
0.5 2500 1.002.5 x 10-3 0.2 1.004.0 x 10-5 50 50002.0 x 10-4 150
[X](M) = Concentration in Mole/L
4. The molar absorptivity of a pigment (molecular weight 300) is 30,000 at 550 nm. What is the absorptivity in L/g-cm.!
5. The iron complex of o-phenanthroline (Molecular weight 236) has molar absorptivity of 10,000 at 525 nm. If the absorbance of 0.01 is the lowest detectable signal, what concentration in part per million can be detected in a 1-cm cell?
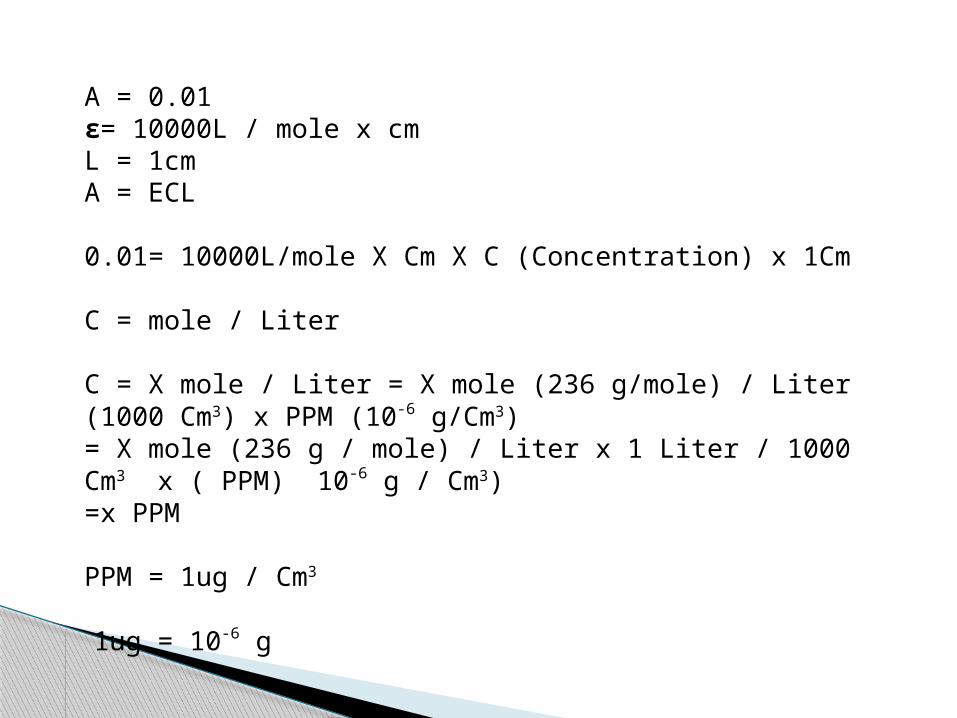
A = 0.01ε= 10000L / mole x cmL = 1cmA = ECL
0.01= 10000L/mole X Cm X C (Concentration) x 1Cm
C = mole / Liter
C = X mole / Liter = X mole (236 g/mole) / Liter (1000 Cm3) x PPM (10-6 g/Cm3)= X mole (236 g / mole) / Liter x 1 Liter / 1000 Cm3 x ( PPM) 10-6 g / Cm3)=x PPM
PPM = 1ug / Cm3
1ug = 10-6 g
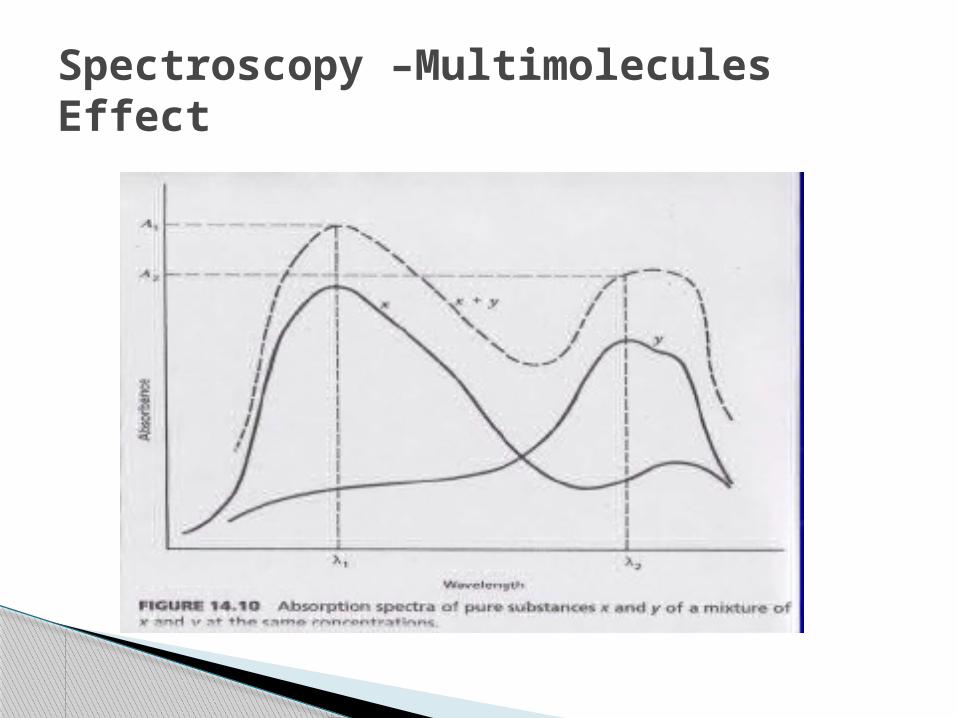
Spectroscopy –Multimolecules Effect
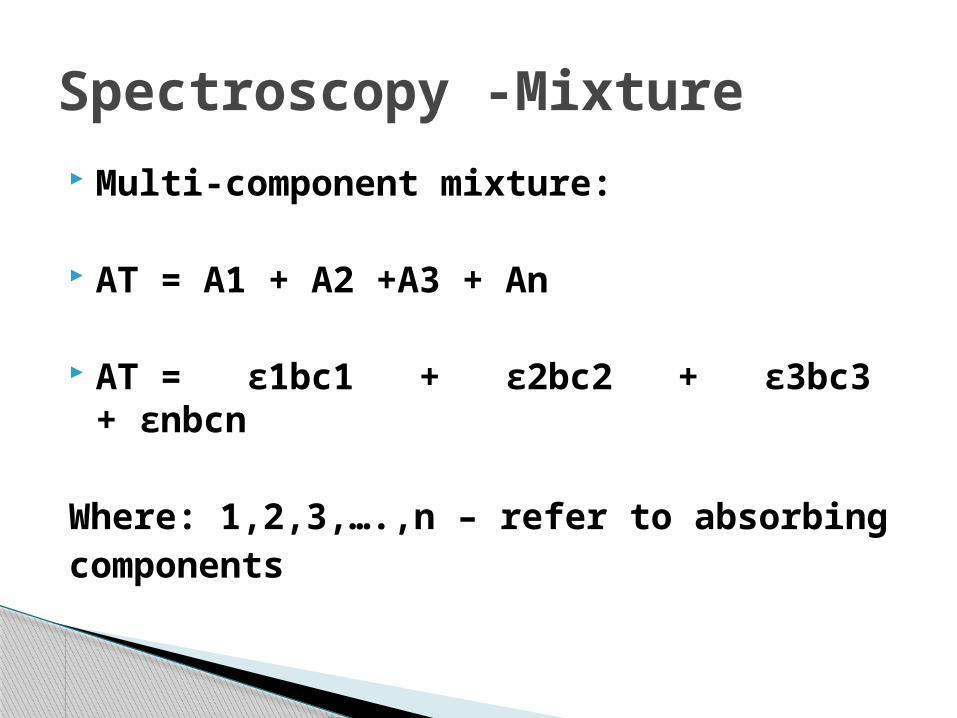
Multi-component mixture:
AT = A1 + A2 +A3 + An
AT = ε1bc1 + ε2bc2 + ε3bc3 + εnbcn
Where: 1,2,3,….,n – refer to absorbingcomponents
Spectroscopy -Mixture
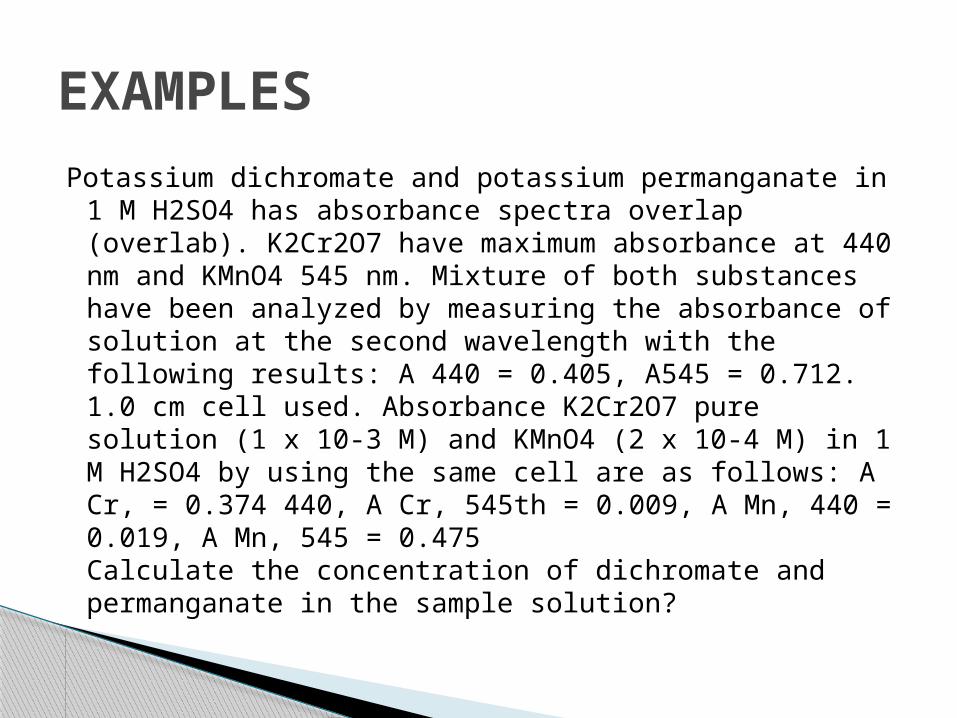
Potassium dichromate and potassium permanganate in 1 M H2SO4 has absorbance spectra overlap (overlab). K2Cr2O7 have maximum absorbance at 440 nm and KMnO4 545 nm. Mixture of both substances have been analyzed by measuring the absorbance of solution at the second wavelength with the following results: A 440 = 0.405, A545 = 0.712. 1.0 cm cell used. Absorbance K2Cr2O7 pure solution (1 x 10⁻³ M) and KMnO4 (2 x 10⁻⁴ M) in 1 M H2SO4 by using the same cell are as follows: A Cr, = 0.374 440, A Cr, 545th = 0.009, A Mn, 440 = 0.019, A Mn, 545 = 0.475Calculate the concentration of dichromate and permanganate in the sample solution?
EXAMPLES
Deviations from the directproportionality (b=const)Instrumental DeviationsChemical Deviations
Spectroscopy – Beer’s Law Limitations
Deviations from the direct proportionality (b = const)
Valid at concentration usually below 0.01M
Molecules interference – distance between molecules affects charge distribution of molecules (ions)
Effect of refractive index –concentration affects refractive index ε is affected (low, less important)
Beer’s Law Limitations
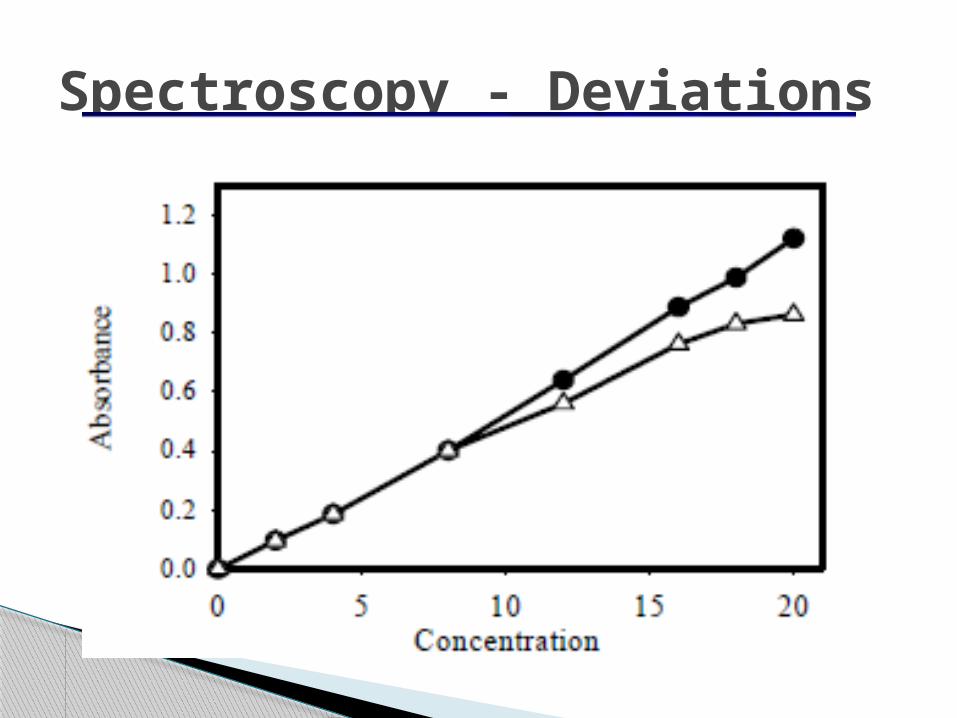
Spectroscopy - Deviations
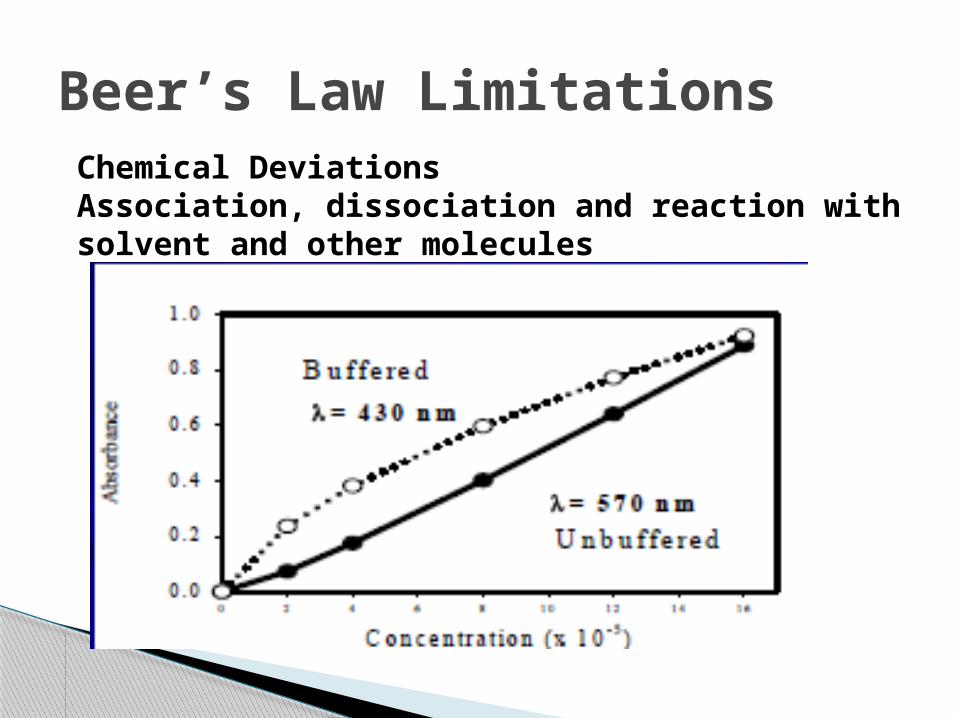
Beer’s Law LimitationsChemical DeviationsAssociation, dissociation and reaction with solvent and other molecules
Instrumental Deviations monochromatic radiation – quality of
monochromator and control of bandwidth and slit
Instrumental noise – accuracy of measurement of transmittance – quality of detector
Beer’s Law Limitations