Quantitative magnetic resonance imaging of …...total knee arthroplasty, whole-organ assessment The...
17
10.2217/17460816.1.6.699 © 2006 Future Medicine Ltd ISSN 1746-0816 Future Rheumatol. (2006) 1(6), 699–715 699 PERSPECTIVE Quantitative magnetic resonance imaging of osteoarthritis Felix Eckstein Institute of Anatomy & Musculoskeletal Research, Paracelsus Medical University (PMU), Strubergasse 21, A5020 Salzburg Austria, and, Chondrometrics GmbH, Ulrichshöglerstr. 23, 83404 Ainring, Germany Tel.: +43 662 442 002 ext. 1240; Fax: + 43 662 442 002 ext. 1249; [email protected] Keywords: cartilage, cartilage composition, cartilage morphology, clinical outcome, diarthrodial joint, magnetic resonance imaging, osteoarthritis, software quality systems, total knee arthroplasty, whole-organ assessment The advent of magnetic resonance imaging has revolutionized the field of musculoskeletal research. In osteoarthritis (OA), articular cartilage can be visualized directly, its dimensions can be accurately quantified in 3D and its composition can be interrogated. The high demand for (quantitative) imaging in OA originates from two sources. First, OA pathobiology is poorly understood; although it is known that structural/compositional changes occur in almost all tissues that make up diarthrodial joints, it is currently unclear which of these changes are clinically important. Second, there is currently a lack of effective therapy, with traditional symptomatic therapies being unable to stop or slow down the structural progression of OA that may eventually lead to joint replacement. Quantitative imaging of osteoarthritis represents a highly promising tool for studying OA epidemiology and disease-modifying OA drug development. A substantial proportion of people above 65 years of age and, thus, millions of people worldwide, are affected by osteoarthritis (OA) [1–3]. With the number of people of advanced age rising steadily, the demand for effective clin- ical management is enormous. Symptomatic treatment of OA is available, but cannot stop the structural progression of the disease. No struc- ture- or disease-modifying drug for OA (S/DMOAD) has been approved by regulatory agencies to date [4,5]. Symptomatic treatment can be directly monitored by clinical outcomes such as pain and function, but it is currently difficult to evaluate the clinical benefits that result from structure modification (rather than sympto- matic treatment) within similar timeframes. It has been demonstrated that OA is a slowly pro- gressing disease, with cartilage loss of 0–7% per year having been reported in various studies [6–16]. These studies have examined patients who are likely to progress, and, therefore, the true pro- gression in the general patient population can be assumed to be slower. Since there is little hope that the structural progression of disease can be completely stopped by medication, it is likely that the potential structure-modifying effect of a putative drug translates into a clinical benefit only after several years, if not decades. For initial proof-of-concept studies of S/DMOADs, surro- gate end points are therefore required that can measure the potential (long-term) beneficial effect much earlier than the desired clinical ben- efit occurs. Since novel therapies cannot initially be administered over years and decades before the safety and effectiveness of a drug has been evaluated, the ability to demonstrate structural benefits using surrogate markers is of great importance [17–20]. Amongst those surrogate measures, imaging is particularly promising because it can visualize joint structure directly. Magnetic resonance imaging (MRI) has great promise in this regard because all tissues that compose diarthrodial joints can be delineated in 3D, and many structural pathological processes associated with OA can be visualized, including morphological and compositional changes of articular cartilage [17,18,20–24]. Limitations of current techniques for OA imaging An important question is which imaging tech- nique is optimal for measuring OA status and pro- gression? Although many advances have been made with x-ray over the last few years [25–30], and although it is the technique currently accepted by regulatory agencies, it has well-known limitations: it is projectional and therefore prone to measure- ment error if the position of the joint relative to the x-ray film is not controlled very carefully [22,31]. These positioning errors make it difficult and challenging to maintain a high standard of imag- ing quality, particularly in larger multicenter, multinational clinical trials [32]. In addition, there is a current lack of consensus on the appropriate positioning and acquisition protocol. Protocols that employ fluoroscopy to position the joint appropriately in between the x-ray source and the film involve substantial radiation exposure and are, in addition, burdensome for the patient, the technician and the reader performing quality con- trol. Since cartilage is not visualized directly with x-rays, information on cartilage status must be For reprint orders, please contact: [email protected]
Transcript of Quantitative magnetic resonance imaging of …...total knee arthroplasty, whole-organ assessment The...

10.2217/17460816.1.6.699 © 2006 Future Medicine Ltd ISSN 1746-0816 Future Rheumatol. (2006) 1(6), 699–715 699
PERSPECTIVE
Quantitative magnetic resonance imaging of osteoarthritisFelix EcksteinInstitute of Anatomy & Musculoskeletal Research, Paracelsus Medical University (PMU), Strubergasse 21, A5020 Salzburg Austria, and,Chondrometrics GmbH, Ulrichshöglerstr. 23, 83404 Ainring, GermanyTel.: +43 662 442 002 ext. 1240;Fax: + 43 662 442 002 ext. 1249;[email protected]
Keywords: cartilage, cartilage composition, cartilage morphology, clinical outcome, diarthrodial joint, magnetic resonance imaging, osteoarthritis, software quality systems, total knee arthroplasty, whole-organ assessment
The advent of magnetic resonance imaging has revolutionized the field of musculoskeletal research. In osteoarthritis (OA), articular cartilage can be visualized directly, its dimensions can be accurately quantified in 3D and its composition can be interrogated. The high demand for (quantitative) imaging in OA originates from two sources. First, OA pathobiology is poorly understood; although it is known that structural/compositional changes occur in almost all tissues that make up diarthrodial joints, it is currently unclear which of these changes are clinically important. Second, there is currently a lack of effective therapy, with traditional symptomatic therapies being unable to stop or slow down the structural progression of OA that may eventually lead to joint replacement. Quantitative imaging of osteoarthritis represents a highly promising tool for studying OA epidemiology and disease-modifying OA drug development.
A substantial proportion of people above65 years of age and, thus, millions of peopleworldwide, are affected by osteoarthritis (OA)[1–3]. With the number of people of advancedage rising steadily, the demand for effective clin-ical management is enormous. Symptomatictreatment of OA is available, but cannot stop thestructural progression of the disease. No struc-ture- or disease-modifying drug for OA(S/DMOAD) has been approved by regulatoryagencies to date [4,5]. Symptomatic treatment canbe directly monitored by clinical outcomes suchas pain and function, but it is currently difficultto evaluate the clinical benefits that result fromstructure modification (rather than sympto-matic treatment) within similar timeframes. Ithas been demonstrated that OA is a slowly pro-gressing disease, with cartilage loss of 0–7% peryear having been reported in various studies [6–16].These studies have examined patients who arelikely to progress, and, therefore, the true pro-gression in the general patient population can beassumed to be slower. Since there is little hopethat the structural progression of disease can becompletely stopped by medication, it is likelythat the potential structure-modifying effect of aputative drug translates into a clinical benefitonly after several years, if not decades. For initialproof-of-concept studies of S/DMOADs, surro-gate end points are therefore required that canmeasure the potential (long-term) beneficialeffect much earlier than the desired clinical ben-efit occurs. Since novel therapies cannot initiallybe administered over years and decades beforethe safety and effectiveness of a drug has beenevaluated, the ability to demonstrate structural
benefits using surrogate markers is of greatimportance [17–20]. Amongst those surrogatemeasures, imaging is particularly promisingbecause it can visualize joint structure directly.Magnetic resonance imaging (MRI) has greatpromise in this regard because all tissues thatcompose diarthrodial joints can be delineated in3D, and many structural pathological processesassociated with OA can be visualized, includingmorphological and compositional changes ofarticular cartilage [17,18,20–24].
Limitations of current techniques for OA imagingAn important question is which imaging tech-nique is optimal for measuring OA status and pro-gression? Although many advances have beenmade with x-ray over the last few years [25–30], andalthough it is the technique currently accepted byregulatory agencies, it has well-known limitations:it is projectional and therefore prone to measure-ment error if the position of the joint relative to thex-ray film is not controlled very carefully [22,31].These positioning errors make it difficult andchallenging to maintain a high standard of imag-ing quality, particularly in larger multicenter,multinational clinical trials [32]. In addition, thereis a current lack of consensus on the appropriatepositioning and acquisition protocol. Protocolsthat employ fluoroscopy to position the jointappropriately in between the x-ray source and thefilm involve substantial radiation exposure andare, in addition, burdensome for the patient, thetechnician and the reader performing quality con-trol. Since cartilage is not visualized directly withx-rays, information on cartilage status must be
For reprint orders, please contact:[email protected]

PERSPECTIVE – Eckstein
700 Future Rheumatol. (2006) 1(6)
estimated from indirect measures, such a thewidth of the joint space between the femoral andtibial subchondral bone in femorotibial OA [33].This 1D measure, which is usually taken in acentral location of the compartment, cannotdifferentiate between the specific loss occurringin the femoral or tibial cartilage [33], and hasalso been shown to be affected by meniscal sta-tus (extrusion) [34,35] and joint laxity [36], inde-pendent of cartilage status. Therefore, joint-space narrowing provides a composite measureof structural change in the joint that is not spe-cific to a single tissue and may be confoundedby artifacts.
Further important issues with this technologyare the floor and ceiling effects. That is, the meas-ure is insensitive to early changes in the diseaseprocess that may occur early in parts of the jointsthat are not in a central location (where the meas-urement is taken). In addition, the measure haslittle dynamic range with a ceiling effect, becauseonce the joint space width is obliterated centrally,further progression of cartilage loss (e.g., anincrease in the denuded cartilage area) cannot bedocumented. Given these technical limitations,it is not surprising that x-rays have been unableto measure structural progression in largecohorts over periods of less than approximately1 year [31,37]. Despite large efforts, these limita-tions have not yet been overcome, and thus radio-graphy is presumably already at the limit of itstechnical capability. However, MRI is at its infancywhere substantial further technical developmentscan be expected over the coming decades.
Whole-organ assessment of joints with MRIMany features of joint structural progression canbe reliably visualized and graded with MRI, suchas cartilage status, osteophytes, bone marrowabnormalities, synovitis, meniscal and ligamentabnormalities, and effusion [14,24,38–45]. Thisapproach provides a more holistic view of jointstatus. Describing (and eventually discriminat-ing) different patterns of involvement of particu-lar tissues in knee OA could potentially elucidatedifferent causes of the disease and make it possi-ble to adjust specific therapeutic strategies to theindividual pattern of joint pathology. Moreover,whole-organ assessment of joints may enableearly (preclinical) detection of the disease proc-ess, in which treatment may be most promising.Several scoring systems for whole-organ MRIhave recently been presented [39,43,44]. However,in a recent clinical trial, no change has been
documented over a period of 6 months [46] and,generally, few data on the sensitivity to changeof these scores (and the underlying imaging fea-tures) are currently available [16,46]. However,over the next few years, these scoring systemswill provide a wealth of information regardingthe extent to which various tissues and structuresof the joint are affected by the OA process invarious subpopulations of patients, and to whatextent these changes will progress along varioustimescales. These studies should also elucidatehow these structural changes are related tofuture symptoms of the patient.
The literature appears contradictory withrespect to current symptoms. Some studies haveshown that bone marrow lesions are associatedwith the extent of pain in OA [47], other studiesfound this relationship to apply only for largerlesions [48], and other studies failed to demon-strate these relationships [38,45]. Conaghan andcolleagues found synovitis and effusion to berelated to pain [42]. In a small study on50 subjects, Link and colleagues reported thatcartilage lesions were better predictors of jointpain than other structural changes in MRI(including bone marrow lesions and osteo-phytes), despite cartilage being aneural [38].However, Kornaat and colleagues only foundsynovial effusion and patellofemoral osteo-phytes to be related to pain, but not cartilageabnormalities, bone marrow lesions or otherchanges in a relatively large cohort of 368 par-ticipants [45]. This inconsistency may be partlydue to the fact that different imaging and scor-ing methods have been used. Further work inlarger samples with standardized and validmeasures should help to clarify which of thesestructural abnormalities are actually associatedwith symptoms.
Quantitative MRI of cartilageSince MRI is a 3D, multiplanar technique thatprovides serial, contiguous images, all structuresthat are visualized by this technology with ade-quate resolution are amendable to quantitative3D analysis [23,24,49]. Although there are theoret-ical advantages to fully quantify structuralchanges by continuous variables, it should bekept in mind that grading is often faster and dis-plays adequate agreement with fully dimensionalmeasurements [50]. This is important becausequantitative analysis on thin slices with highresolution often requires substantially moreresources in terms of image processing and, as aresult, personnel, time and financial costs.

www.futuremedicine.com 701
Quantitative MRI of osteoarthritis – PERSPECTIVE
To date, articular cartilage has created thegreatest interest in terms of quantitative meas-urement of its morphology (geometric dimen-sions) and composition (biochemistry andinternal structure) in OA [21,23,51,52]. It is gener-ally thought (although not stringently proven)that articular cartilage is the most critical tissuein maintaining joint function. In a recent work-shop on consensus on osteoarthritis imaging,held in Bethesda (MD, USA) in 2002, a surveyof 64 workshop participants revealed that mostexperts ranked articular cartilage to be the mostimportant MRI feature for evaluating OA sever-ity and progression, followed by osteophytes,
bone marrow lesions, synovitis, meniscal abnor-mality and synovial effusion [53]. Therefore, theremainder of this review will focus on past andcurrent work on quantification of cartilagemorphology (geometric extension) and composi-tion (biochemistry and structural composition) asassessed by MRI. It must be noted that mostadvances described in this review are relevant tothe knee, with some, but much less, work havingbeen performed in other joints to date. In the textbelow, the following topics will be discussed:
• Cartilage imaging sequences
• Cartilage segmentation
• Computation of quantitative outcome measures
• Accuracy and precision of these measures
• Longitudinal change of these measures
• Software quality systems for quantitativeimaging of OA
Cartilage imaging sequences One of the requirements for reliable assessmentof cartilage pathology is the use of MRI systemswith 1.0-T or greater [54]. Conventional 1.5-Tmagnets [23,55,56], peripheral (extremity only) sys-tems with 1.0-T [57,58] and, recently, 3.0-Twhole-body magnets [59–64] have been success-fully applied to quantitative cartilage imaging.MR sequences currently used for whole-organassessment and semiquantitative scoring of carti-lage lesions include fat-suppressed T2- or inter-mediate-weighted fast-spin echo [23,55,56] and, forthe latter purpose, also T1-weighted spoiled gra-dient-recalled acquisition at steady state (SPGR)with fat suppression or water excitation [23,55,56].These sequences are readily available on virtuallyall clinical scanners and, therefore, do not haveparticular hardware requirements.
For quantitative analysis of cartilage morpho-logy, the aforementioned fat-suppressed orwater-excitation T1-weighted SPGR sequencesrepresent the current gold standard (Figure 1) [23].Although there is no current consensus on theoptimal resolution for imaging knees in OA, a1.5-mm slice thickness and an isotropic 0.3-mmin-plane resolution have been commonly used at1.5 T for morphological analysis of cartilage(volume and thickness measurement), and ena-ble total coverage of the knee with a 10–12 minacquisition time [23,56]. Given the increased sig-nal- and contrast-to-noise ratio, 1-mm thickslices are preferable at 3.0 T [63].
With regard to cartilage composition, currentmethodology has focused on measuring thearchitecture and concentration of collagen, and
Figure 1. Cartilage magnetic resonance imaging in a patient with osteoarthritis.
(Top row) axial, (middle row) coronal and (bottom row) sagittal images in a patient with knee osteoarthritis, without segmentation (left) and with segmentation of the cartilage (right). Note that the total subchondral bone area (tAB) is also segmented in areas were the cartilage has been lost (green line). In this way, not only cartilage volume and thickness (ThC), but also denuded area (dAB) can be computed. Cartilage thickness should be computed both by including (ThCtAB) and by excluding denuded areas (ThCcAB) as 0 mm cartilage thickness.

PERSPECTIVE – Eckstein
702 Future Rheumatol. (2006) 1(6)
the concentration of proteoglycans (PGs) andglycosaminoglycans (GAGs), which, togetherwith the interstitial fluid, support the sophisti-cated properties and function of articular carti-lage. Unlike the aforementioned sequences,compositional imaging requires substantialexpertise at the site where the images areacquired. Collagen architecture has been studiedby using transverse relaxation times (T2) [65],diffusion or diffusion-tensor imaging [66].These techniques are sensitive to the molecularstructure and concentration of collagen andGAG [67–72], but T2 is also sensitive to cartilagehydration [68,73]. The sensitivity of T2 to sev-eral tissue components makes its interpretationdifficult, since competing effects may occur atthe same time (partly or fully compensatingeach other). Owing to the magic angle effect(dependency of cartilage T2 on its orientationversus B0), the position of the joint in thescanner must be controlled very carefully,which is difficult to achieve under clinicalimaging conditions.
T1rho has been attributed to the PG/GAGconcentration in cartilage [74–77], but has also beendemonstrated to be sensitive to collagen [68].Therefore, changes in T1rho might be due tochanges in either component. In the absence of acontrast agent, T1 is relatively insensitive to car-tilage composition [78]. However, T1 canbecome specific to molecular content if meas-ured after penetration of a charged agent.delayed Gadolinium-Enhanced MRI of Carti-lage (dGEMRIC) exploits these relationshipsand is based on the biophysical theory thatGdDTPA2- (a clinically approved MRI contrastagent) distributes in a charged matrix. AT1 map, calculated from several images with dif-ferent T1-weightings, which are acquiredapproximately 90 min after intravenous injec-tion of GdDTPA2- (T1Gd, dGEMRIC Index),has therefore been reported to be inverselyrelated to the GAG content. The technique relieson the assumption that T1 is constant through-out the cartilage in the absence of GdDTPA2,which has been shown to apply for natural, butnot for tissue-engineered cartilage [79].
Segmentation of cartilage The first step in the quantitative assessment ofcartilage morphology and, to some extent, alsoof cartilage composition, is segmentation of thetissue (Figure 1). The segmentation process aimsto distinguish all image elements (voxels) repre-senting cartilage (of various cartilage plates in the
joint) from its surrounding tissue. Given the rel-atively low contrast between cartilage and othertissues (e.g., synovial fluid, meniscus and bone)or the opposite cartilage layer (in the contactzone), and the various sources of artifacts thatcan occur with MRI, attempts to fully automatethe segmentation process have failed [23]. Varioussemiautomated methods have been developed,but all of these require user interaction and veri-fication by an expert on a section-by-sectionbasis [23,80–84]. The time required for image pre-processing using various filters, algorithm verifi-cation and editing is often longer than that formanual segmentation, especially if performed bytrained users who segment cartilage images on aregular basis. It is frequently assumed that auto-mated or semiautomated segmentation algo-rithms provide more consistent and reproducibleresults than those obtained by manual segmenta-tion; however, this is debatable because theactual interface of the cartilage with the sur-rounding tissues or the opposite cartilage is notalways where the steepest gradient in signalintensity is located in the images. For this reason,considerable knowledge is required to identifythe contour that represents the actual interfacebetween the cartilage and other tissues, particu-larly in OA. More importantly, slight shifts insignal intensity that occur with repeat scans (par-ticularly if the observation period is long in lon-gitudinal studies) can lead to large differences insegmentation results with an automated or semi-automated algorithm, as with the contrast hav-ing shifted slightly, the algorithm may choose adifferent contour than in the partner data sets.Owing to the instability of the image contrastwith MRI, most accurate results can be expectedfrom either manual segmentation or carefullyedited semi-automated segmentation, preferablyby processing baseline and follow-up images oflongitudinal studies in parallel.
A recent review from the OMERACT/OARSIworkshop on imaging technologies in Bethesdasummarizes the segmentation algorithms pre-sented to date in the literature, and the extent towhich they have been validated versus inde-pendent measures [23]. Other aspects that ensurethe quality of segmentations have been dis-cussed to a much lesser extent in the literature.These include formal training and continuousmonitoring of expert personnel who performcartilage segmentation [64,85,86]. This is of par-ticular importance in large-scale cross-sectionalor longitudinal studies, in which several usersare required to perform the segmentation in a
www.futuremedicine.com 703
Quantitative MRI of osteoarthritis – PERSPECTIVE
time-efficient manner. Under these circum-stances, quality control of all segmentations bya single expert is recommended in order tominimize differences in segmentation strate-gies between different users, and to excludeperformance drifts by the users throughout thestudy. The quality-control process of cartilagesegmentation must ensure that slices thatimage the edges of the cartilage plate and showrelevant partial volume effects are treated simi-larly (included or excluded) by the users; thatcartilage contours are placed accurately (partic-ularly in the contact zone of cartilage and inthose slices that cut the cartilage layerobliquely and therefore display partial volumeeffects); that osteophyte cartilage is appropri-ately excluded from the segmentation of OA
cartilage [49]; that areas of denuded and carti-lage-covered subchondral bone are identifiedappropriately (Figure 1) and that all other criteriaof the particular rule-based approach are met.One component to insure this is the structuredtraining of all users, preferably using a standard-ized software program that guides them throughthe segmentation process and compares theirsegmentation with that of more experiencedusers. However, in addition, segmentation mustbe monitored continuously in ongoing studies,to exclude drifts in the performance or in theinterpretation of the rule-based approach.
Segmentation of the cartilage (as previouslydescribed) can also be used to extract cartilagecomposition. Since the contrast in the relaxa-tion-weighted images do not always producegood definition between cartilage and surround-ing tissue, a secondary image set (e.g., SPGR)may be used to aid the segmentation, or to trans-form the coordinates of the segmentation (mask)into relaxation-weighted or other images thatcarry compositional information on the cartilage[87,88]. This can be achieved by spatially register-ing anatomical structures that can be clearlyidentified in both image data sets (e.g., thebone), or by transforming the coordinates of thesegmentation masks relative to the MRI scannercoordinate system into another data set.
Computation of quantitative outcome measures To date, most studies that look at cartilage mor-phology have focused on cartilage volume alone,since it is the most straightforward and the easi-est parameter to measure. Cartilage volume canbe computed simply by numerical integration ofall segmented voxels and multiplication withtheir spatial resolution (Figure 2). Although dif-ferences in cartilage volume over time provide adirect measure of cartilage loss, the amount ofinformation that can be drawn from it is lim-ited. For instance, in cross-sectional studies,subjects with larger bones will have larger carti-lage volume, and, in order to exclude this bias,either the cartilage thickness must be computedor the cartilage volume must be normalized tothe size of the total area of subchondral bone.This has been demonstrated to substantiallyimprove the discrimination of OA and non-OApatients by measurements of cartilage morpho-logy [89,90]. In longitudinal studies, where thearea of subchondral bone can be assumed to berelatively constant, the process of cartilage vol-ume loss can be differentiated into loss of
Figure 2. 3D visualization of knee-joint cartilages.
3D visualization of the segmented weight-bearing femorotibial cartilage plates (Blue: medial tibia; green: lateral tibia; yellow: medial central femur; red: lateral central femur with (top) and without (bottom) surrounding tissues.
PERSPECTIVE – Eckstein
704 Future Rheumatol. (2006) 1(6)
cartilage thickness or increase in the denudedarea (the area of subchondral bone no longercovered by cartilage).
In animal models of OA, cartilage volume canprove to be an insufficient outcome variable,because surgical challenge not only stimulatescartilage loss but also affects bone modeling in(growing) animals. For instance, in a meniscaltear rat model of OA, it was demonstrated thatcartilage volume remained constant in compari-son to nonoperated contralateral joint over time,whereas computation of more sophisticatedparameters of cartilage morphology revealedthat cartilage thickness decreased in the operatedjoint, this effect being masked by an increase in
the total area of subchondral bone [91]. We there-fore recommend exploiting the full capacity ofquantitative MRI and determining the total areaof subchondral bone (tAB), the part of the tABthat is covered by cartilage (cAB), the part of thetAB that is denuded. In addition we recommendthat cartilage thickness be computed both in theregions that are covered with cartilage (ThC-cAB) and over the total area of bone, includingdenuded areas of bone as 0 mm cartilage thick-ness (ThCtAB), but excluding osteophyte carti-lage (Figure 1) [49]. However, this requires morethan one contour label to be used during thesegmentation process (AC for articular surface,and tAB for total area of subcondral bone;Figure 1), and it demands greater expertise fromthe user because the subchondral bone also mustbe segmented where it is denuded and, therefore,where contrast is relatively low (Figure 1). Addi-tionally, the maximal cartilage thickness and thethickness variation throughout the joint platemay be reported.
Since relaxation times are extracted from aseries of MR images with varying repetitiontime (TR) and echo time (TE) values, thesemust be computed by integrating informationfrom several data sets. To extract T1, an equa-tion must be fitted through the data pointsobtained from these acquisitions. This caneither be done by averaging signal intensities fora given region of interest and fitting one curvethrough all data points (voxels) or, preferably, byfitting each voxel to the relevant equation andproducing a relaxation time map [49]. If motionhas occurred between acquisitions, registrationalgorithms must be used to spatially register thedata before the fitting; for example, by using thebone contours [81], so that T1 values are com-puted from voxels that represent the identicalanatomical location in the cartilage. This is rela-tively straightforward for 2D acquisitions, butwhen T1 maps are obtained in 3D, registrationbecomes more involved [87,88]. In addition, theaccuracy of the registration is limited by the rela-tively coarse section thickness of these acquisitions(often >3 mm).
dGEMRIC displays relatively little hetero-geneity across the cartilage and may thus beexpressed as one composite value for one carti-lage plate or region of interest. However, T2demonstrates substantial heterogeneity acrossthe zones of healthy cartilage and, therefore,should be analyzed in a depth-dependent man-ner [88,92–95]. In addition, the T2 of the cartilage(and in particular its zonal variation) depends on
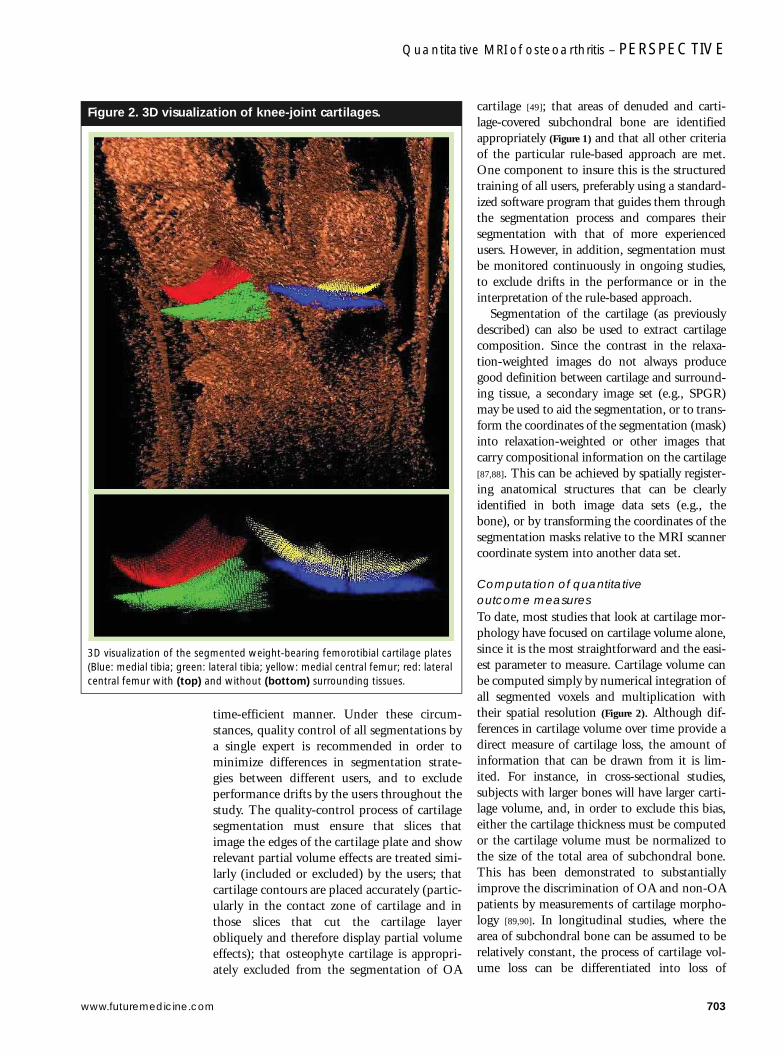
Figure 3. Regional analysis of femorotibial cartilage.
Regional analysis of cartilage morphology in the tibia (dark blue: internal; green: external subregion; light blue: posterior; red: central; yellow: anterior) and weight-bearing part of the femur (blue: internal; green: central; red: external subregion). (A&B) Anterior–posterior view of the knee with femur on top and tibia at bottom. (C) View from proximally onto the tibial cartilage surface.
Lateral femur (cLF) Medial femur (cMF)A
Lateral tibia (LT) Medial tibia (MT)B
0.0 < Th < 0.6 mm
0.6 < Th < 1.2 mm
1.2 < Th < 1.8 mm
1.8 < Th < 2.4 mm
2.4 < Th < 3.0 mm
3.0 < Th < 3.6 mm
3.6 < Th < 4.2 mm
4.2 < Th
C

www.futuremedicine.com 705
Quantitative MRI of osteoarthritis – PERSPECTIVE
the angle of the cartilage layer to the main mag-netic field B0 (magic angle effect at 55°); there-fore, this angle must be controlled very carefully.Segmentation masks derived from morphologi-cal sequences (described previously) may help todetermine relevant regions throughout the depthof the tissue, but this is challenging in osteo-arthritic cartilage, where the zonal distributionmay be less evident.
Recently, a proposal by an international groupof experts has been published outlining howmorphological and composition parameters ofcartilage should be named and defined, in orderto provide a uniform, clear and commonnomenclature and to ease communicationbetween researchers [49]. In addition, it would bebeneficial to achieve consensus on processingand analytical methods as well as on the clinicalvalidity of these measures once further work ontheir responsiveness becomes available.
Recent efforts have been directed at identify-ing reproducible subregions within the joint sur-face (e.g., central, anterior, posterior, internaland external) and to determine morphologicalparameters (thickness) within these subregion(Figure 3). This effort is driven by the observationthat changes of cartilage morphology preferen-tially occur in certain areas of the joint surfaces(e.g., where weight-bearing predominates), butdo not affect the entire cartilage plate homo-geneously [96]. Regional approaches might sub-stantially enhance the ability to measure changelongitudinally during short time intervals(Figure 3), but larger longitudinal studies will berequired to identify which subregions are bestsuited for this purpose, and whether theseregions vary between different populations withdifferent risk factors for OA.
Accuracy & precision of quantitative cartilage parametersMany studies have now verified the accuracy ofmorphological assessment of cartilage, somehaving been performed in vivo on total kneearthroplasty patients [23,97,98]. Precision errorshave been shown to range from 1% (patella andaxial orientation) to approximately 3–5% inother surfaces of the knee [23]. Precision errorsare critically dependent on the section orienta-tion chosen (axial vs coronal vs sagittal), thespatial resolution selected and the cartilage plateexamined [23]. In the patella, for instance, axialprotocols have been demonstrated to yield onlyhalf the precision error (1%) [86,99,100] of thatobserved with sagittal imaging [23,99,101]. With a
sagittal imaging protocol of 1.5-mm sectionthickness and 0.3-mm in-plane resolution, pre-cision errors are high in the femoral condyles,even in healthy subjects [101]. Sagittal imageprotocols have the advantage that they cover allcartilage plates of the knee in only one acquisi-tion, but that is at the expense of larger partialvolume effects and larger precision errors in thepatella (compared with an axial protocol) and inthe weight-bearing femorotibial joint (com-pared with a coronal imaging protocol) [97,102].Therefore, if information on the femoral troch-lea and the posterior femoral condyles is notdesperately required, we recommend combinedacquisition of an axial and coronal data set,rather than a sagittal acquisition.
Using 3.0-T MRI, it has recently been possi-ble to reduce precision errors in the femorotibialjoint (coronal protocol) when choosing 1-mmrather than a 1.5-mm slices [63]. Double-echosteady state sequence (DESS) at 3.0-T with sag-ittal orientation and 0.7-mm slice thickness havebeen demonstrated to provide adequate preci-sion in the femoral condyles [64], but this comesat the expense of having to segment 50–100%more slices than usually acquired, which hasimplications for the time and cost required toprocess a study. By contrast, results for the fem-oro-patellar joint have been less promising withthe sagittal DESS, due to the relatively high pre-cision errors [64] compared with previous studiesusing SPGR sequences [23,101]. These examplesdemonstrate that the image acquisition protocolselected needs to be tailored specifically to thepurpose of the study. A delicate compromisebetween anatomical coverage of various knee-joint surfaces, the spatial resolution required,precision errors, time for turn around of theanalysis and financial cost must be achieved inorder to guarantee the successful completion ofthe study.
With regard to the accuracy of relaxationtime measurements, these have been mostlyassessed in vitro [51,52,78,92]. In vivo validation isdifficult, as no gold standard is readily availa-ble. Surprisingly, the in vivo reproducibility ofcompositional cartilage imaging in clinicalstudies on OA populations has not beenreported to date.
Longitudinal change in OA Several studies have shown that MRI has theability to measure longitudinal changes in carti-lage morphology (volume or thickness) [6–16,23].However, the rate of these longitudinal changes

PERSPECTIVE – Eckstein
706 Future Rheumatol. (2006) 1(6)
varies substantially (0–7% annually) betweenstudies, and the standard deviations of thesechanges have also been found to be relativelyhigh. Therefore, substantial sample sizes and/orrelatively long durations of clinical trials will berequired to demonstrate drug effects on thesechanges. To date, few studies have comparedMRI with x-ray changes, and these found eitherno or only a weak correlation between the twomodalities [6,13,16,103].
Data are emerging on the factors associatedwith cartilage loss, such as meniscal status [14,41],body mass index [13], malalignment [104,105] andothers. Since many large epidomiological trials,including the OA Initiative [201], are now under-way, a wealth of data on longitudinal change ofknee-joint structure will become available in thenext few years. The OA Initiative has recentlyreleased the first data, and these are now availableto researchers for investigation [202].
There have been contradictory results regard-ing how cartilage loss is related to symptoms[13,106–108]. However, one study reported that therate of volumetric cartilage loss is associated withthe likelihood of having knee arthroplasty 2 yearslater [109]. This has been the first study to clearlydemonstrate the correlation between a surrogate(imaging) end point and a clinical end point (ameasure of how a patient feels and functions).
With regards to the changes of T2 in OA,some studies have shown very discrete differencesbetween control and OA populations (but no dif-ferentiation of the severity of OA [110]), whereasothers have found no difference between controland OA populations [111]. This may be becausethe mean T2 (rather than its spatial variationthroughout the depth of the cartilage) wasassessed, or because clinical OA involves compet-ing factors on T2 changes. While the disruptionin collagen architecture and the increased hydra-tion might lead to increases in T2, the cleavage ofcollagen molecules and the resulting increasedwater interaction sites might lead to decreases inT2, with the effects potentially off-setting eachother. The OA initiative, which also includesassessment of T2, may shed further light on theserelationships in the near future.
Regarding T1rho, two trials have demon-strated differences between healthy and OA sub-jects, but neither study reported T1rho relativeto OA grade [111,112]. To date, dGEMRIC repre-sents the technology that has been most thor-oughly assessed for compositional cartilageimaging, and this technique has been demon-strated to correlate with cartilage softening
assessed by arthroscopy [113], the level of physicalactivity [114], malalignment [115] and cruciate lig-ament status [116,117]. It is currently being intro-duced to larger clinical and epidemiologicaltrials and, thus, more data are expected toemerge in the near future. However, one limita-tion of dGEMRIC is the need for an intrave-nous injection of GdDTPA2- and the sequential90-min lag time, until acquisition of the T1maps can be acquired.
Software quality systems for quantitative imaging of OAAll aspects of a research or a clinical trial must becontinuously controlled and monitored for qual-ity. An important aspect of this is to ensure qual-ity of the acquisition, since high quality data arerequired to guarantee satisfactory analysis. There-fore, measures must be implemented to ensurestandardization of the image acquisition. Centralreview of the image data is necessary to warrantthat all requirements are met at all imaging sitesthroughout the trial and to reduce measurementvariability. This review should take place rapidly,so that a participant can be rescanned if therequirements (e.g., appropriate orientation of theimages and complete anatomical coverage) arenot met. The emphasis of this chapter will be onthe analysis software quality system, with theunderstanding that standardization and a highquality of the image acquisition has been met.
Developing cutting edge imaging analysistechniques and applying them to small explora-tory studies at a single site is one thing; applyingthem to large, multicenter (potentially multicon-tinental) trials in a time- and cost-effective man-ner is another. Data management, data integrity,data flow and quality assurance (QA) or control(QC) are an important challenge in large clinicaltrials. With the number and size of clinical trialsin OA increasing, these aspects of successfulimplementation of quantitative imaging tech-nology will become more and more important inthe future [118]. As these aspects have rarely beenaddressed in the literature, a particular focus ofthis review will be on the application of softwarequality systems in the assessment of cartilage.
Development of an effective quality systemrequires planning (documentation), implementa-tion and then verification. The image analysistools must be resistant to human interaction errorand easy to use, in order to provide quantitativedata from large trials in real time (at the same paceat which patients are enrolled) and without error.This perspective provides some examples of

www.futuremedicine.com 707
Quantitative MRI of osteoarthritis – PERSPECTIVE
important components of such a quality systemand will demonstrate some measures of how qual-ity can be assured. The key components encom-pass quality QA at data entry and dataconversion, standardized segmentation and testcomputations by expert users, QC of the segmen-tations by an expert and final computation at thebatch level status (Figure 4).
Quality assurance at data entry & data conversionAppropriate coverage of all anatomical structuresthat must be segmented, appropriate orientationof the images, adequacy of the signal-to-noiseand contrast-to-noise ratio, and the absence ofrelevant artifacts must be verified by an expertbefore the segmentation process can start. Thisshould preferably be performed by using an elec-tronic checklist of a dedicated software module,and the step-wise verification should create anelectronic signature as to when the QA was per-formed by whom at data entry. Only personswith the appropriate level of authorizationshould be able to complete these steps, and dataconversion should depend on completion of thisprocess. Consistency of the MR acquisitionparameters (TR, TE, flip angle and resolution)need not be checked manually, but should pref-erably be automatically compared versus adefined study protocol, in order to rule-outinconsistencies of acquisition conditions. Whennaming individual data sets during the conver-sion process, all manual entries should beavoided or, at least, minimized at the image ana-lysis center. An electronic protocol in the conver-sion software module can be used to composethe name automatically from various DICOMfields. In cross-sectional studies, this is straight-forward, since an (anonymized) entry in thepatient name or patient identification field ofthe MRI scanner can be used for naming thedata set, and no other information is usuallyneeded. However, if several data sets are acquiredin each patient (test–retest acquisition with thesame sequence, acquisition of the samesequence, but with different MRI parameters orresolutions, acquisition with different sequencesor the same acquisition protocol at different timepoints [baseline and follow-up]), additionalinformation must be used from the DICOMfields to create a unique name for each data set.Often, data from longitudinal studies are proc-essed in parallel at one time point. Under thesecircumstances, care should be taken so thatembedded strings, such as date of acquisition, donot unblind the users. Alternatively, the ‘daytime’of acquisition (hour, minute, second), repre-sented by another DICOM field, can be used toprovide a unique identifier, without unblindingusers as to the time point of acquisition.
Errors in which particular structures (e.g.,cartilage plates) should be segmented in a partic-ular study can be avoided, by either includingthe study standard operating procedure (SOP)
Figure 4. Example of a software quality system requiring multiple defined QC steps for the data to achieve QC_fin status, combining automized and expert QC steps.
Note that only QC_fin data are ready for batch level computation. In a first step (1) DICOM image data sets are either converted for segmentation (XXX.conv), are rejected because the image quality is insufficient (iqi) or because the quality of the partner data set is insufficient (PD iqi), or are transformed into a training data set by an expert. In a next step, the segmentation is started (2a) and eventually completed (2b). When a test computation (with auto QC) is performed after all activated labels have been segmented (3), the data are advanced to XXX.calc status (no error detected during test computation) or to XXX.QC_check status (error detected that must be checked). During expert QC of the segmentation (4), the data may then either be classified as QC-iqi to support the segmentation, or may be advanced to QC_rep level (expert QC to be repeated; 4b, QC_corr level (corrections to be made, no second expert QC required) or QC_fin level. With a QC_corr status, another test computation (with auto QC) must be made, to rule-out that segmentation errors have been introduced during the correction. The test computation (5) advances the data set to either QC_fin or QC_corr_check status (error that must be checked by an expert; 6).
DICOM image data
XXX.iqiXXX.PDiqi• e.g., Motion (.iqi_MOT))• PDmotion (.PDiqi_MOT)
XXX. segm
XXX. QC_check XXX. calc
EXPERT QC
EXPERT QC
[EXPERT QC]
AUTO QC
AUTO QC
XXX. QC_rep XXX. QC_corr
XXX.conv
XXX.p_segm
XXX.train(training DS)
XXX. QC_fin
XXX. QC_corr_check
XXX. QC_iqi• e.g., Motion
4a
2a
2b
4b
5
6
3
1

PERSPECTIVE – Eckstein
708 Future Rheumatol. (2006) 1(6)
electronically with each data set, or, better still,by activating only the structural labels relevant tothat particular study. These labels can be embed-ded in the electronic study protocol and auto-matically activated during data conversion,without manual intervention being required.
Standardized segmentation & test computations by expert users As alluded to previously, segmentation is nottrivial and users must therefore be trained, pref-erably using standardized software. When theactual process of segmentation starts, the softwareshould be enabled to store electronic signatures(of the users) and to create audit trails that enablethe process of segmentation to be reconstructedat any time point, in order to meet regulatorycompliance. For time-efficient segmentation,the ‘mouse’ should preferably be used for seg-mentation only, whereas other commands (suchas opening and closing data sets) may be sup-ported by hotkeys. Additionally, it should beeasy for the user to navigate through the dataset, to zoom in and out, to change contour orplate labels, to display and hide previously seg-mented structures, to display and hide the cur-rent segmentation, to overlap segmentationsfrom adjacent sections to check consistency, toopen displays such as multiplanar reconstruc-tions, 3D views or a previously segmented part-ner data set and others, since this can improvethe quality of the segmentation. It is also usefulif the software provides an image library of ana-tomical or histological sections of various jointsand orientations. This is particularly importantin the context of animal studies, where theanatomy of the cartilage plates may be some-what different from what the users areacquainted with.
An important first step in the process is thatthe correct anatomical label is used for theappropriate structure and that, for instance, themedial tibia label is not accidently used for thelateral tibia and vice versa. Appropriate trainingof expert users and segmentation SOPs can behelpful in this context, but intrinsic checks thatavoid mislabeling are superior. For instance,the software system may request the user tolabel the fibula in each data set, before any seg-mentation entries can be made. At later stagesof the segmentation, when test computationsare made, a distance vector from each anatomi-cal structure can then be computed relative tothe fibular marking, and the length of the vec-tors can be compared with a given matrix to
ensure correct labeling (Figure 4). In this exam-ple, the vector of the medial tibia to the fibulamust always be longer than that of the lateraltibia, and that of the medial femur longer thanthat of the medial tibia and so on. The sameprocess can be used to ensure the tAB label isused to mark the subchondral bone, and the AClabel for the area of the cartilage surface, but notvice versa. A series of other intrinsic checks canbe made during these test computations, suchas that the number of slices in paired data sets isequal and not different, that segmentations arenot performed outside a defined region ofinterest (e.g., on the femoral condyles), thatsegmentations are completed within all slices inthe region of interest and that AC contours donot penetrate tAB contours and do not overlapthem. These measures can minimize theamount of error that occurs prior to expert QC,and it can facilitate but cannot replace the QC.To ensure that the test computation has beenperformed, a label attached to the data set namemay verify whether test computations havebeen completed without errors, and only datasets with this particular label may be amendableto QC.
Quality control of the segmentations by an expert Since cartilage segmentation in OA requires ahigh level of expertise and consistency, it ishighly recommendable that one expert reviewsall segmentations performed within one study(Figure 4). Even after appropriate training, usersmay undergo certain performance drifts, in thatthey tend to interpret certain image features orrule-based approaches differently than beforeover the course of a study. In order to rule-outthese drifts, continuous monitoring of the con-sistency of the segmentation process within astudy by a single expert is required. The softwaremay help in this process, to support the QCreader by automatically loading the baseline andfollow-up data set in parallel and by automati-cally displaying the slices that the user has identi-fied as matching best in both data setssimultaneously for specific cartilage plates. Thesoftware system may allow the user to entergraphical or verbal comments (as chosen from ageneric list or typed) into the data set. Addition-ally, the software should automatically alert theexpert reader if she/he attempts to finish the QCprocess before all images with segmentationshave been activated (looked at) by the QCreader, with the software specifying the

www.futuremedicine.com 709
Quantitative MRI of osteoarthritis – PERSPECTIVE
plates/slice numbers that have not yet beenchecked. QC entries made by the expert shouldbe specific to slice number and to anatomicalfeatures (e.g., specific cartilage plate) and may besynthesized into a comprehensive ‘to-do list’ thatthe technician will have to complete after theQC. To facilitate this process, all slices with QCentries may be marked with a specific color in anoverview display to permit efficient navigation ofthe data set.
If the QC entries are relatively minor and thedata set does not need to be re-QCd by theexpert, measures need to be taken to ensure thatall corrections are made before the data set isentered into the database (Figure 4). For example,the data set may be blocked to convert into itsfinal status (which is required to run a final batchcomputation) if single QC entries remain with‘to-do’ rather than with ‘done’ status. Althoughthe software cannot automatically check whetherthe corrections are made accurately, the softwarecan prohibit accidental en bloc transformationsof ‘to-do’ to ‘done’ entries, and it can verifywhether or not changes have been made withinthat slice, using the relevant plate label. The soft-ware may refute converting an entry to ‘done’status if no such change has been made. Thesoftware should also require that another testcomputation be made after the corrections havebeen completed, in which the intrinsic auto-mated quantitative checks (mentioned previ-ously) are repeated, to ensure that no errors areintroduced during the corrections. If major editsare made, a label may be chosen that does notenable the user to advance the data set into a sta-tus that can be entered into the database, butmust be re-evaluated by the expert (Figure 4).
These examples are not comprehensive, andrepresent relatively simple but effective measureswhich enhance the quality of the segmentationprocess, in particular in the context of processingmultiple larger studies at the same time at animage analysis center.
Computation at batch-level statusAt this level, all or several data sets of a study maybe computed to export the relevant quantitativeparameters. The procedures aforementionedensure that no data set is entered into the batchwhich has not been QCd by an expert, and forwhich the required edits have not been com-pleted (Figure 4). It is important that the computa-tion of quantitative measures relies on theresolution specified (for each individual data set)in the DICOM header (slice thickness and
in-plane resolution), and does not need to beentered manually by the user. However, if multi-planar reconstructions are processed, one musttake into account that the DICOM header speci-fies the original resolution, but not that of theMPR. In this case, the resolution specified by theDICOM header must be over-ruled manually.
When running the batch, the quantitativedata should be exported in conjunction with thedata set name and all DICOM header informa-tion into text files or other files that can be easilyimported into database systems, without theneed to manually integrate the data and assignthe outcome variables to either names or otherDICOM header information.
ConclusionsMRI and, in particular, morphological and com-positional imaging of articular cartilage, holdconsiderable promise to become invaluable toolsin epidemiological studies of OA and in thedevelopment of structure-modifying therapy.MRI sequences for whole-organ assessment ofstructural changes in joints and for quantitativeassessment of cartilage morphology are readilyavailable on state-of-the-art 1.5-T and 3.0-Tclinical scanners and have been extensively vali-dated. Sagittal imaging protocols have theadvantage that they cover all cartilage plates ofthe knee in only one acquisition, but at theexpense of larger partial volume effects and largerprecision errors in the patella (compared with anaxial protocol) and in the weight-bearing fem-oro–tibial joint (compared with a coronal imag-ing protocol). To date, segmentation has notbeen successfully automized and, for the timebeing, requires specific expertise, appropriatetraining of technical personnel and continuousmonitoring using automated and expert QCreadings. In this context, software quality sys-tems are key to the successful application of thistechnology to larger clinical trials. Outcomemeasures of quantitative MRI are not limited tocartilage volume, but may include the area ofdenuded subchondral bone and regional carti-lage thickness. However, whether regional ana-lysis will enhance the sensitivity of MRI tolongitudinal change in OA, and the relationshipof imaging biomarkers with clinical end points,remains to be established.
Future perspectiveThe advent of quantitative MRI technology toOA epidemiology will provide a wealth ofinformation on the risk factors for the onset

PERSPECTIVE – Eckstein
710 Future Rheumatol. (2006) 1(6)
and progression of OA over the next 5–10 years(Figure 5). One example of such a study is the OAInitiative. In this study, 5000 patients are moni-tored using 3-T MRI, radiography and bio-chemical biomarkers over a period of 5 years[201]. Given that MRI not only delineates carti-lage, but also all other tissues that constitute thejoint and undergo structural changes in osteoar-thritis [24,39,43], these studies will also providevaluable insight into the pathobiology of theOA process.
The use of quantitative or semiquantitativeend points in proof-of-concept studies forDMOADs may be less straightforward than itappears at first sight. Although the prevention ofstructural changes in OA is widely believed to bean important goal in drug development, it willhave to be proven that structural changes predictclinical outcome (a measure of how a patientfeels or functions or survives) and that theadministration of the DMOAD has a clinicalbenefit (Figure 5). Since people do not die fromOA, pain and function are the primary clinicaloutcomes, but these are subjective to some extentand not always easy to measure. However, themajor obstacle is that clinical benefits ofDMOADs cannot be expected to become appar-ent in the short term, but maybe only after a dec-ade or longer (Figure 5). A more objective measureof clinical outcome may be total arthroplasty, but
it is known that this outcome is influenced byother factors, such as patient comorbidity, socialcontext, culture and the financial situation of thespecific medical system (e.g., waiting lists).However, a concept of virtual knee arthroplastythat is currently being explored defines the needto undergo knee arthroplasty as a compositemeasure of pain, function and structure, inde-pendent of age, comorbidity and socioeco-nomic factors [119–121]. This clinical end pointmay potentially be used to measure the benefitof a DMOAD in the same way as fracture hasbeen used to demonstrate the clinical benefitsof antiosteoporotic drugs (Figure 5).
However, the time that elapses between theindication for treatment and the indication fortotal knee arthroplasty is long, especially if aDMOAD is targeted to treat the early stages ofthe disease. Therefore, surrogate imagingmarkers will have to be used in short-termstudies to demonstrate the effectiveness of aDMOAD (Figure 5). Quantitative MRI will playan important role in this context but, as hasbeen described, the image analysis processshould be governed by a thorough and stringentQC control process.
Current research must focus on the questionof whether cartilage loss, or other structuralmeasurements in joints, represent valid surro-gate markers of clinical outcomes several yearslater, in particular whether or not a patient willrequire total knee arthroplasty (Figure 5). Oncethis relationship is more clearly established,investigators will be able to test DMOADs over1- or 2-year periods (depending on cohort sizeand recruitment), to demonstrate a benefitbased on the reduction of cartilage loss(Figure 5). However, even 1- or 2-year studies arerelatively long if various drug candidates withunclear levels of safety and effectiveness are tobe tested. Therefore, it will have to be investi-gated whether regional cartilage morphology(e.g., analysis of only a defined central part of acartilage plate) is more sensitive to change thanentire cartilage plates and can potentiallyreduce the period in which significant changescan be demonstrated.
Another focus of future research should be onaddressing whether compositional markers ofcartilage, bone marrow lesions or structuralchange in other joint tissues can reliably predictwho will experience high or low rates of carti-lage loss, respectively, or whether these markersare even better predictors of clinical outcomethan cartilage loss (Figure 5). If clear relationships
Figure 5. Perspective on future research work required in order to be able to test the efficacy of disease modifying osteoarthritis drugs in shorter timescales.
First, it should be confirmed whether cartilage loss as measured by magnetic resonance imaging predicts clinical end points (pain, function and TKA) several years later. In a second step, it must be elucidated whether changes in cartilage composition or changes in other articular tissues predict cartilage loss or clinical end points directly. DMOADS: Disease-modifying osteoarthritic drugs; TKA: Total knee athroplasty.
DMOADS
Time/how long?
Cartilagecomposition
Cartilageloss
Other tissue statusand/or changes
Pain andfunction
Virtual TKA
Real TKA

www.futuremedicine.com 711
Quantitative MRI of osteoarthritis – PERSPECTIVE
can be established between these factors, thismay enable the observation periods forDMOAD development to be reduced to severalmonths (Figure 5).
Given the high number of studies underway,major progress should be made over the com-ing 5 or 10 years in determining how structuralchanges in various articular tissues and variousanatomical compartments are related to eachother, and how these are related to clinical out-comes such as pain, function or requirementfor total knee arthroplasty. These observationsshould substantially improve our ability toevaluate and assess therapeutic interventionsaimed at modifying the structural progressionof this disease. Once DMOADs become
available, there will be increasing demands for amore widespread application of quantitativeMRI in the clinic, in order to monitor drugeffect in individual patients. At this stage, ahigher degree of automization of the aboveimage analysis technologies will be critical, inorder to serve the increasing demands for thesediagnostic procedures.
Conflict of interest
Felix Eckstein is Chief Executive Officer of ChondrometricsGmbH (Ainring, Germany) a company providing consultingand centralized imaging services for research studies and clinicaltrials to other research groups and pharmaceutical companies.He currently provides consulting services to Virtualscopics,Pfizer and GlaxoSmithKline.
Executive summaryWhy is quantitative imaging of osteoarthritis needed?
• A large proportion of people over the age of 65 years suffer from osteoarthritis (OA), with millions of people being affected worldwide.
• OA pathobiology is poorly understood: although it is known that structural changes occur in articular tissues, it is unclear which of these changes are clinically most important.
• Currently, there is a lack of effective therapy to combat the structural progression of OA.
Limitations of current techniques for osteoarthritis imaging
• Radiography, the currently accepted technique by regulatory agencies, is projectional and, thus, prone to measurement error. To keep these errors limited, fluoroscopic positioning is required, involving substantial radiation exposure.
• Information on cartilage status from radiography must be estimated from indirect measures, such as the width of the joint space, which is known to be influenced by other factors, such as meniscal extrusion and joint laxity.
• Radiography has a small dynamic range (floor and ceiling effects); that is, the measure is insensitive to early changes in noncentral locations of the joint, and is unable to monitor further progression once the joint-space width is obliterated.
Whole-organ assessment of joints with magnetic resonance imaging
• Magnetic resonance imaging (MRI) can delineate multiple features of joint structural progression directly, such as cartilage, osteophytes, bone marrow abnormalities, synovitis, meniscal and ligament abnormalities, effusion, and others.
• Several semiquantitative scoring systems for whole-organ MRI have recently been developed, based on fat-suppressed T2- or intermediate-weighted fast spin-echo sequences
• The sensitivity to change of these scoring systems (and the underlying structures that are being imaged), as well as their relationship with symptoms (pain) remains unclear.
Quantitative MRI of cartilage
• Imaging sequences for whole-organ assessment and for quantitative analysis of cartilage morphology (volume and thickness) are widely available on clinical scanners. By contrast, techniques for measuring cartilage composition, require longer imaging time, participant burden and considerable expertise at the imaging site
• Currently, cartilage segmentation cannot be automated and is a time-intensive procedure, that requires dedicated software and expert personnel. However, imaging analysis centers can provide centralized image analysis services.
• A nomenclature for quantitative outcome measures of cartilage morphology and composition has recently been proposed by an international group of experts.
• The accuracy and precision of morphological measurements of cartilage has been demonstrated under clinical conditions in vivo, but measures of cartilage composition have been less rigorously validated in a clinical setting.
• Morphological measurement of cartilage has demonstrated longitudinal change, with rates of change (volume loss) of 0–6% per annum reported in various studies.
• Amongst compositional techniques, good evidence exists that indicates changes in OA are measurable with proteoglycan-sensitive delayed gadolinium-enhanced MRI of cartilage imaging (T1Gd), but further work is required to establish this for other techniques assessing collagen and hydration (e.g., T2 and T1rho)
• To warrant data integrity and efficient image analysis in clinical trials, software quality systems are required. The design of such a quality system and some of its key features are described in this article.

PERSPECTIVE – Eckstein
712 Future Rheumatol. (2006) 1(6)
Conclusions & future perspective
• Although the prevention of structural changes in OA is widely believed to be an important goal in drug development, it must be proven that structural changes predict clinical outcome (a measure of how a patient feels, functions or can avoid joint replacement).
• In a next step, it must be demonstrated that the administration of disease-modifying drugs (DMOADs) has not only a structural, but also a clinical benefit. However, owing to the slow progression of OA, the clinical benefits of DMOADs may not become apparent immediately, but potentially, only after a decade or longer.
• Clinical outcomes are difficult to define in OA, and the field currently lacks a generally accepted clinical end point, such as fractures in osteoporosis.
• Current research should focus on establishing whether cartilage loss (or other structural measurements) as measured by MRI represent valid surrogate markers and have high predictive ability with regard to clinical outcomes several years later.
• In addition, it must be addressed whether compositional markers of cartilage, bone marrow lesions or structural change in other joint tissues (synovium, bone, meniscus and others) can reliably predict which patients will experience high or low rates of cartilage loss, respectively.
• If clear relationships can be firmly established between these factors, observation periods for DMOAD development trials may be substantially reduced. However, to demonstrate this it will require large and long-term observational studies, such as the OA Initiative.
Executive summary
Bibliography1. Peyron JG: Osteoarthritis. The
epidemiologic viewpoint. Clin. Orthop. Relat. Res. 215, 13–19 (1986).
2. Felson DT, Zhang Y, Hannan MT et al.: The incidence and natural history of knee osteoarthritis in the elderly. The Framingham Osteoarthritis Study. Arthritis Rheum. 38, 1500–1505 (1995).
3. Felson DT, Lawrence RC, Dieppe PA et al.: Osteoarthritis: new insights. Part 1: the disease and its risk factors. Ann. Intern. Med. 133, 635–646 (2000).
4. Beary JF III: Joint structure modification in osteoarthritis: development of SMOAD drugs. Curr. Rheumatol. Rep. 3, 506–512 (2001).
5. Altman RD: Measurement of structure (disease) modification in osteoarthritis. Osteoarthritis Cartilage 12(Suppl. A), S69–S76 (2004).
6. Gandy SJ, Dieppe PA, Keen MC, Maciewicz RA, Watt I, Waterton JC: No loss of cartilage volume over three years in patients with knee osteoarthritis as assessed by magnetic resonance imaging. Osteoarthritis Cartilage 10, 929–937 (2002).
7. Glaser C, Draeger M, Englmeier KH, Eckstein F, Reiser M: Cartilage loss over two years in femorotibial osteoarthritis. Radiology 225 (Suppl.), S330 (2002) (Abstract).
8. Peterfy C, White D, Zhao J, VanDijke CF, Genant HK: Longitudinal measurement of knee articular cartilage volume in osteoarthritis. Arthritis Rheum. 41(Suppl. 9), S361 (1998) (Abstract).
9. Cicuttini F, Wluka A, Wang Y, Stuckey S: The determinants of change in patella cartilage volume in osteoarthritic knees. J Rheumatol. 29, 2615–2619 (2002).
10. Cicuttini FM, Wluka AE, Wang Y, Stuckey SL: Longitudinal study of changes in tibial and femoral cartilage in knee osteoarthritis. Arthritis Rheum. 50, 94–97 (2004).
11. Wluka AE, Stuckey S, Snaddon J, Cicuttini FM: The determinants of change in tibial cartilage volume in osteoarthritic knees. Arthritis Rheum. 46, 2065–2072 (2002).
12. Wluka AE, Forbes A, Wang Y, Hanna F, Jones G, Cicuttini FM: Knee cartilage loss in symptomatic knee osteoarthritis over 4.5 years. Arthritis Res. Ther. 8, R90 (2006).
13. Raynauld JP, Martel-Pelletier J, Berthiaume MJ et al.: Quantitative magnetic resonance imaging evaluation of knee osteoarthritis progression over two years and correlation with clinical symptoms and radiologic changes. Arthritis Rheum. 50, 476–487 (2004).
14. Berthiaume MJ, Raynauld JP, Martel-Pelletier J et al.: Meniscal tear and extrusion are strongly associated with progression of symptomatic knee osteoarthritis as assessed by quantitative magnetic resonance imaging. Ann. Rheum. Dis. 64, 556–563 (2005).
15. Raynauld JP, Martel-Pelletier J, Berthiaume MJ et al.: Long term evaluation of disease progression through the quantitative magnetic resonance imaging of symptomatic knee osteoarthritis patients: correlation with clinical symptoms and radiographic changes. Arthritis Res. Ther. 8, R21 (2006).
16. Bruyere O, Collette J, Kothari M et al.: Osteoarthritis, magnetic resonance imaging and biochemical markers: a one-year prospective study. Ann. Rheum. Dis. 65(8), 1050–1054 (2006).
17. Peterfy CG: Scratching the surface: articular cartilage disorders in the knee. Magn. Reson. Imaging Clin. N. Am. 8, 409–430 (2000).
18. Peterfy CG: Imaging of the disease process. Curr. Opin. Rheumatol. 14, 590–596 (2002).
19. Peterfy CG: Role of MR imaging in clinical research studies. Semin. Musculoskelet. Radiol. 5, 365–378 (2001).
20. Abadie E, Ethgen D, Avouac B et al.: Recommendations for the use of new methods to assess the efficacy of disease-modifying drugs in the treatment of osteoarthritis. Osteoarthritis Cartilage 12, 263–268 (2004).
21. Gray ML, Eckstein F, Peterfy C, Dahlberg L, Kim YJ, Sorensen AG: Toward imaging biomarkers for osteoarthritis. Clin. Orthop. 427(Suppl.) S175–S181 (2004).
22. Peterfy C, Kothari M: Imaging osteoarthritis: magnetic resonance imaging versus x-ray. Curr. Rheumatol. Rep. 8, 16–21 (2006).
23. Eckstein F, Cicuttini F, Raynauld JP, Waterton JC, Peterfy C: Magnetic resonance imaging (MRI) of articular cartilage in knee osteoarthritis (OA): morphological assessment. Osteoarthritis Cartilage 14(Suppl. 1), S46–S75 (2006).
24. Conaghan PG, Felson D, Gold G, Lohmander S, Totterman S, Altman R: MRI and non-cartilaginous structures in knee osteoarthritis. Osteoarthritis Cartilage 14(Suppl. 1), S87–S94 (2006).
25. Brandt KD, Mazzuca SA, Conrozier T et al.: Which is the best radiographic protocol for a clinical trial of a structure modifying drug in patients with knee osteoarthritis? J. Rheumatol. 29, 1308–1320 (2002).

www.futuremedicine.com 713
Quantitative MRI of osteoarthritis – PERSPECTIVE
26. Peterfy C, Li J, Zaim S et al.: Comparison of fixed-flexion positioning with fluoroscopic semi-flexed positioning for quantifying radiographic joint-space width in the knee: test-retest reproducibility. Skeletal Radiol. 32, 128–132 (2003).
27. Buckland-Wright C: Protocols for precise radio-anatomical positioning of the tibiofemoral and patellofemoral compartments of the knee. Osteoarthritis Cartilage 3(Suppl. A), 71–80 (1995).
28. Buckland-Wright JC, Wolfe F, Ward RJ, Flowers N, Hayne C: Substantial superiority of semiflexed (MTP) views in knee osteoarthritis: a comparative radiographic study, without fluoroscopy, of standing extended, semiflexed (MTP), schuss views. J. Rheumatol. 26, 2664–2674 (1999).
29. Mazzuca SA, Brandt KD, Buckland-Wright JC et al.: Field test of the reproducibility of automated measurements of medial tibiofemoral joint space width derived from standardized knee radiographs. J. Rheumatol. 26, 1359–1365 (1999).
30. Vignon E, Conrozier T, Piperno M, Richard S, Carrillon Y, Fantino O: Radiographic assessment of hip and knee osteoarthritis. Recommendations: recommended guidelines. Osteoarthritis Cartilage 7, 434–436 (1999).
31. Le Graverand MP, Mazzuca S, Lassere M et al.: Assessment of the radioanatomic positioning of the osteoarthritic knee in serial radiographs: comparison of three acquisition techniques. Osteoarthritis Cartilage 14(Suppl. A), A37–A43 (2006).
32. Buckland-Wright JC, Bird CF, Ritter-Hrncirik CA et al.: X-ray technologists’ reproducibility from automated measurements of the medial tibiofemoral joint space width in knee osteoarthritis for a multicenter, multinational clinical trial. J. Rheumatol. 30, 329–338 (2003).
33. Buckland-Wright JC, Macfarlane DG, Lynch JA, Jasani MK, Bradshaw CR: Joint space width measures cartilage thickness in osteoarthritis of the knee: high resolution plain film and double contrast macroradiographic investigation. Ann. Rheum. Dis. 54, 263–268 (1995).
34. Adams JG, McAlindon T, Dimasi M, Carey J, Eustace S: Contribution of meniscal extrusion and cartilage loss to joint space narrowing in osteoarthritis. Clin. Radiol. 54, 502–506 (1999).
35. Gale DR, Chaisson CE, Totterman SM, Schwartz RK, Gale ME, Felson D: Meniscal subluxation: association with osteoarthritis and joint space narrowing. Osteoarthritis Cartilage 7, 526–532 (1999).
36. Nevitt MC and Sharma L: OMERACT workshop radiography session 1. Osteoarthritis Cartilage 14(Suppl. A), A4–A9 (2006).
37. Cline GA, Meyer JM, Stevens R, Buckland-Wright C, Peterfy C, Beary JF: Comparison of fixed flexion, fluoroscopic semi-flexed and MTP radiographic methods for obtaining the minimum medial joint space width of the knee in longitudinal osteoarthritis trials. Osteoarthritis Cartilage 14(Suppl. A) A32–A36 (2006).
38. Link TM, Steinbach LS, Ghosh S et al.: Osteoarthritis: MR imaging findings in different stages of disease and correlation with clinical findings. Radiology 226, 373–381 (2003).
39. Peterfy CG, Guermazi A, Zaim S et al.: Whole-Organ Magnetic Resonance Imaging Score (WORMS) of the knee in osteoarthritis. Osteoarthritis Cartilage 12, 177–190 (2004).
40. Hunter DJ, Zhang Y, Niu J et al.: Increase in bone marrow lesions associated with cartilage loss: a longitudinal magnetic resonance imaging study of knee osteoarthritis. Arthritis Rheum. 54, 1529–1535 (2006).
41. Hunter DJ, Zhang YQ, Niu JB et al.: The association of meniscal pathologic changes with cartilage loss in symptomatic knee osteoarthritis. Arthritis Rheum. 54, 795–801 (2006).
42. Conaghan PG, Felson DT: Structural associations of osteoarthritis pain: lessons from magnetic resonance imaging. Novartis Found Symp. 260, 191–205 (2004).
43. Conaghan PG, Tennant A, Peterfy CG et al.: Examining a whole-organ magnetic resonance imaging scoring system for osteoarthritis of the knee using Rasch analysis. Osteoarthritis Cartilage 14(Suppl. 1), S116–S121 (2006).
44. Kornaat PR, Ceulemans RY, Kroon HM et al.: MRI assessment of knee osteoarthritis: Knee Osteoarthritis Scoring System (KOSS) – inter-observer and intra-observer reproducibility of a compartment-based scoring system. Skeletal Radiol. 34, 95–102 (2005).
45. Kornaat PR, Bloem JL, Ceulemans RY et al.: Osteoarthritis of the knee: association between clinical features and MR imaging findings. Radiology 239, 811–817 (2006).
46. Hunter DJ, Conaghan PG, Peterfy CG et al.: Responsiveness, effect size, smallest detectable difference of magnetic resonance imaging in knee osteoarthritis. Osteoarthritis Cartilage 14(Suppl. 1), S112–S115 (2006).
47. Felson DT, Chaisson CE, Hill CL et al.: The association of bone marrow lesions with pain in knee osteoarthritis. Ann. Intern. Med. 134, 541–549 (2001).
48. Sowers MF, Hayes C, Jamadar D et al.: Magnetic resonance-detected subchondral bone marrow and cartilage defect characteristics associated with pain and x-ray-defined knee osteoarthritis. Osteoarthritis Cartilage 11, 387–393 (2003).
49. Eckstein F, Ateshian G, Burgkart R et al.: Proposal for a nomenclature for magnetic resonance imaging based measures of articular cartilage in osteoarthritis. Osteoarthritis Cartilage 14(10), 974–983 (2006).
50. Lassere MN: A users guide to measurement in medicine. Osteoarthritis Cartilage 14(Suppl. A), A10–A13 (2006).
51. Burstein D, Gray M: New MRI techniques for imaging cartilage. J. Bone Joint Surg. Am. 85A(Suppl. 2), S70–S77 (2003).
52. Gold GE, Burstein D, Dardzinski B, Lang P, Boada F, Mosher T: MRI of articular cartilage in OA: novel pulse sequences and compositional/functional markers. Osteoarthritis Cartilage 14(Suppl. 1), S76–S86 (2006).
53. Peterfy C, Woodworth T, Altman R: Workshop for consensus on osteoarthritis imaging. Osteoarthritis Cartilage 14(Suppl. 1), S1 (2006).
54. Woertler K, Strothmann M, Tombach B, Reimer P: Detection of articular cartilage lesions: experimental evaluation of low- and high-field-strength MR imaging at 0.18 and 1.0 T. J. Mag. Reson. Imaging 11, 678–685 (2000).
55. Gold GE, Burstein D, Dardzinski B, Lang P, Boada F, Mosher T: MRI of articular cartilage in OA: novel pulse sequences and compositional/functional markers. Osteoarthritis Cartilage 14(Suppl. 1), S76–S86 (2006).
56. Peterfy CG, Gold G, Eckstein F, Cicuttini F, Dardzinski B, Stevens R: MRI protocols for whole-organ assessment of the knee in osteoarthritis. Osteoarthritis Cartilage 14(Suppl. 1), S95–S111 (2006).
57. Roemer FW, Guermazi A, Lynch JA et al.: Short tau inversion recovery and proton density-weighted fat suppressed sequences for the evaluation of osteoarthritis of the knee with a 1.0 T dedicated extremity MRI: development of a time-efficient sequence protocol. Eur. Radiol. 15, 978–987 (2005).

PERSPECTIVE – Eckstein
714 Future Rheumatol. (2006) 1(6)
58. Inglis D, Ionnidis G, Eckstein F et al.: Validation of quantitative cartilage measurements on a 1 T extremity MRI system. Osteoarthritis Cartilage 12(Suppl. B), S62 (2004) (Abstract).
59. Gold GE, Suh B, Sawyer-Glover A, Beaulieu C: Musculoskeletal MRI at 3.0 T: initial clinical experience. AJR Am. J. Roentgenol. 183, 1479–1486 (2004).
60. Gold GE, Han E, Stainsby J, Wright G, Brittain J, Beaulieu C: Musculoskeletal MRI at 3.0 T: relaxation times and image contrast. AJR Am. J. Roentgenol. 183, 343–351 (2004).
61. Masi JN, Sell CA, Phan C et al.: Cartilage MR imaging at 3.0 versus that at 1.5 T: preliminary results in a porcine model. Radiology 236, 140–150 (2005).
62. Link TM, Sell CA, Masi JN et al.: 3.0 vs 1.5T MRI in the detection of focal cartilage pathology – ROC analysis in an experimental model. Osteoarthritis Cartilage 14, 63–70 (2006).
63. Eckstein F, Charles HC, Buck RJ et al.: Accuracy and precision of quantitative assessment of cartilage morphology by magnetic resonance imaging at 3.0T. Arthritis Rheum. 52, 3132–3136 (2005).
64. Eckstein F, Hudelmaier M, Wirth W et al.: Double echo steady state magnetic resonance imaging of knee articular cartilage at 3 Tesla: a pilot study for the Osteoarthritis Initiative. Ann. Rheum. Dis. 65, 433–441 (2006).
65. Xia Y, Moody JB, Alhadlaq H: Orientational dependence of T2 relaxation in articular cartilage: a microscopic MRI (microMRI) study. Mag. Reson. Med. 48, 460–469 (2002).
66. Filidoro L, Dietrich O, Weber J et al.: High-resolution diffusion tensor imaging of human patellar cartilage: feasibility and preliminary findings. Mag. Reson. Med. 53, 993–998 (2005).
67. Burstein D, Gray ML, Hartman AL, Gipe R, Foy BD: Diffusion of small solutes in cartilage as measured by nuclear magnetic resonance (NMR) spectroscopy and imaging. J. Orthop. Res. 11, 465–478 (1993).
68. Menezes NM, Gray ML, Hartke JR, Burstein D: T2 and T1rho MRI in articular cartilage systems. Mag. Reson. Med. 51, 503–509 (2004).
69. Gray ML, Burstein D, Lesperance LM, Gehrke L: Magnetization transfer in cartilage and its constituent macromolecules. Mag. Reson. Med. 34, 319–25 (1995).
70. Knauss R, Schiller J, Fleischer G, Karger J, Arnold K: Self-diffusion of water in cartilage and cartilage components as studied by pulsed field gradient NMR. Mag. Reson. Med. 41, 285–292 (1999).
71. Schiller J, Naji L, Trampel R, Ngwa W, Knauss R, Arnold K: Pulsed-field gradient-nuclear magnetic resonance (PFG NMR) to measure the diffusion of ions and polymers in cartilage: applications in joint diseases. Methods Mol. Med. 101, 287–302 (2004).
72. Mlynarik V, Sulzbacher I, Bittsansky M, Fuiko R, Trattnig S: Investigation of apparent diffusion constant as an indicator of early degenerative disease in articular cartilage. J. Mag. Reson. Imaging 17, 440–444 (2003).
73. Liess C, Lüsse S, Karger N, Heller M, Glüer CC: Detection of changes in cartilage water content using MRI T2-mapping in vivo. Osteoarthritis Cartilage 10, 907–913 (2002).
74. Duvvuri U, Reddy R, Patel SD, Kaufman JH, Kneeland JB, Leigh JS: T1rho-relaxation in articular cartilage: effects of enzymatic degradation. Mag. Reson. Med. 38, 863–867 (1997).
75. Akella SV, Regatte RR, Gougoutas AJ et al.: Proteoglycan-induced changes in T1rho-relaxation of articular cartilage at 4T. Mag. Reson. Med. 46, 419–423 (2001).
76. Regatte RR, Akella SV, Borthakur A, Kneeland JB, Reddy R: Proteoglycan depletion-induced changes in transverse relaxation maps of cartilage: comparison of T2 and T1rho. Acad. Radiol. 9, 1388–1394 (2002).
77. Wheaton AJ, Casey FL, Gougoutas AJ et al.: Correlation of T1rho with fixed charge density in cartilage. J. Mag. Reson. Imaging 20, 519–525 (2004).
78. Bashir A, Gray ML, Hartke J, Burstein D: Nondestructive imaging of human cartilage glycosaminoglycan concentration by MRI. Mag. Reson. Med. 41, 857–865 (1999).
79. Watanabe A, Wada Y, Obata T et al.: Delayed gadolinium-enhanced MR to determine glycosaminoglycan concentration in reparative cartilage after autologous chondrocyte implantation: preliminary results. Radiology 239, 201–208 (2006).
80. Lynch JA, Zaim S, Zhao J, Stork A, Peterfy CG, Genant HK: Cartilage segmentation of 3D MRI scans of the osteoarthritic knee combining juser knowledge and active contours. Proceedings of the SPIE (International Society for Optical Engineering) 3979, 925–935 (2000).
81. Stammberger T, Eckstein F, Michaelis M, Englmeier KH, Reiser M: Interobserver reproducibility of quantitative cartilage measurements: comparison of B-spline snakes and manual segmentation. Mag. Res. Imaging 17, 1033–1042 (1999).
82. Gougoutas AJ, Wheaton AJ, Borthakur A et al.: Cartilage volume quantification via Live Wire segmentation. Acad. Radiol. 11, 1389–1395 (2004).
83. McWalter EJ, Wirth W, Siebert M et al.: Use of novel interactive input devices for segmentation of articular cartilage from magnetic resonance images. Osteoarthritis Cartilage 13, 48–53 (2005).
84. Kauffmann C, Gravel P, Godbout B et al.: Computer-aided method for quantification of cartilage thickness and volume changes using MRI: validation study using a synthetic model. IEEE Trans. Biomed. Eng. 50, 978–988 (2003).
85. Koo S, Gold GE, Andriacchi TP: Considerations in measuring cartilage thickness using MRI: factors influencing reproducibility and accuracy. Osteoarthritis Cartilage 13, 782–789 (2005).
86. Eckstein F, Lemberger B, Gratzke C et al.: In vivo cartilage deformation after different types of activity and its dependence on physical training status. Ann. Rheum. Dis. 64, 291–295 (2005).
87. Hohe J, Faber S, Stammberger T, Reiser M, Englmeier KH, Eckstein F: A technique for 3D in vivo quantification of proton density and magnetization transfer coefficients of knee joint cartilage. Osteoarthritis Cartilage 8, 426–433 (2000).
88. Hohe J, Faber S, Muehlbauer R, Reiser M, Englmeier KH, Eckstein F: Three-dimensional analysis and visualization of regional MR signal intensity distribution of articular cartilage. Med. Eng. Phys. 24, 219–227 (2002).
89. Burgkart R, Glaser C, Hinterwimmer S et al.: Feasibility of T and Z scores from magnetic resonance imaging data for quantification of cartilage loss in osteoarthritis. Arthritis Rheum. 48, 2829–2835 (2003).
90. Hunter D, Niu J, Zhang Q et al.: Cartilage volume must be normalized to bone surface area in order to provide staisfactory construct validity: The Framingham Study. Osteoarthritis Cartilage 12(Suppl. B), S2 (2004).
91. Quirk J, Baldwin SJ, Harms MP et al.: Validation of MRI cartilage biomarkers in rat knee osteoarthritis. Osteoarthritis Cart. 12(Suppl. B), P75 (2004) (Abstract).
92. Mosher TJ, Dardzinski BJ: Cartilage MRI T2 relaxation time mapping: overview and applications. Semin. Musculoskelet. Radiol. 8, 355–368 (2004).

www.futuremedicine.com 715
Quantitative MRI of osteoarthritis – PERSPECTIVE
93. Dardzinski BJ, Mosher TJ, Li S, Van Slyke MA, Smith MB: Spatial variation of T2 in human articular cartilage. Radiology 205, 546–550 (1997).
94. Mosher TJ, Liu Y, Yang QX et al.: Age dependency of cartilage magnetic resonance imaging T2 relaxation times in asymptomatic women. Arthritis Rheum. 50, 2820–2828 (2004).
95. Mosher TJ, Smith HE, Collins C et al.: Change in knee cartilage T2 at MR imaging after running: a feasibility study. Radiology 234, 245–249 (2005).
96. Biswal S, Hastie T, Andriacchi TP, Bergman GA, Dillingham MF, Lang P: Risk factors for progressive cartilage loss in the knee: a longitudinal magnetic resonance imaging study in forty-three patients. Arthritis Rheum. 46, 2884–2892 (2002).
97. Burgkart R, Glaser C, Hyhlik-Durr A, Englmeier KH, Reiser M, Eckstein F: Magnetic resonance imaging-based assessment of cartilage loss in severe osteoarthritis: accuracy, precision, diagnostic value. Arthritis Rheum. 44, 2072–2077 (2001).
98. Graichen H, Eisenhart-Rothe R, Vogl T, Englmeier KH, Eckstein F: Quantitative assessment of cartilage status in osteoarthritis by quantitative magnetic resonance imaging: technical validation for use in analysis of cartilage volume and further morphologic parameters. Arthritis Rheum. 50, 811–816 (2004).
99. Stammberger T, Eckstein F, Englmeier KH, Reiser M: Determination of 3D cartilage thickness data from MR imaging: computational method and reproducibility in the living. Mag. Reson. Med. 41, 529–536 (1999).
100. Eckstein F, Lemberger B, Stammberger T, Englmeier KH, Reiser M: Patellar cartilage deformation in vivo after static versus dynamic loading. J. Biomech. 33, 819–825 (2000).
101. Eckstein F, Heudorfer L, Faber SC, Burgkart R, Englmeier KH, Reiser M: Long-term and resegmentation precision of quantitative cartilage MR imaging (qMRI). Osteoarthritis Cartilage 10, 922–928 (2002).
102. Glaser C, Burgkart R, Kutschera A, Englmeier KH, Reiser M, Eckstein F: Femoro-tibial cartilage metrics from coronal MR image data: Technique, test-retest reproducibility, findings in osteoarthritis. Mag. Reson. Med. 50, 1229–1236 (2003).
103. Cicuttini F, Hankin J, Jones G, Wluka A: Comparison of conventional standing knee radiographs and magnetic resonance imaging in assessing progression of tibiofemoral joint osteoarthritis. Osteoarthritis Cartilage 13, 722–727 (2005).
104. Cicuttini F, Wluka A, Hankin J, Wang Y: Longitudinal study of the relationship between knee angle and tibiofemoral cartilage volume in subjects with knee osteoarthritis. Rheumatology (Oxford) 43, 321–34 (2004).
105. Eisenhart-Rothe R, Graichen H, Hudelmaier M, Vogl T, Sharma L, Eckstein F: Femorotibial and patellar cartilage loss in patients prior to total knee arthroplasty, heterogeneity, correlation with alignment of the knee. Ann. Rheum. Dis. 65, 69–73 (2006).
106. Phan CM, Link TM, Blumenkrantz G et al.: MR imaging findings in the follow-up of patients with different stages of knee osteoarthritis and the correlation with clinical symptoms. Eur. Radiol 16(3) 608–618 (2005).
107. Hunter DJ, March L, Sambrook PN: The association of cartilage volume with knee pain. Osteoarthritis Cartilage 11, 725–729 (2003).
108. Wluka AE, Wolfe R, Stuckey S, Cicuttini FM: How does tibial cartilage volume relate to symptoms in subjects with knee osteoarthritis? Ann. Rheum. Dis. 63, 264–268 (2004).
109. Cicuttini FM, Jones G, Forbes A, Wluka AE: Rate of cartilage loss at two years predicts subsequent total knee arthroplasty: a prospective study. Ann. Rheum. Dis. 63, 1124–1127 (2004).
110. Dunn TC, Lu Y, Jin H, Ries MD, Majumdar S: T2 relaxation time of cartilage at MR imaging: comparison with severity of knee osteoarthritis. Radiology 232, 592–598 (2004).
111. Li X, Han ET, Ma CB, Link TM, Newitt DC, Majumdar S: In vivo 3T spiral imaging based multi-slice T(1rho) mapping of knee cartilage in osteoarthritis. Mag. Reson. Med. 54, 929–936 (2005).
112. Regatte RR, Akella SV, Wheaton AJ et al.: 3D-T1rho-relaxation mapping of articular cartilage: in vivo assessment of early degenerative changes in symptomatic osteoarthritic subjects. Acad. Radiol. 11, 741–749 (2004).
113. Tiderius CJ, Olsson LE, Leander P, Ekberg O, Dahlberg L: Delayed gadolinium-enhanced MRI of cartilage (dGEMRIC) in early knee osteoarthritis. Mag. Reson. Med. 49, 488–492 (2003).
114. Tiderius CJ, Svensson J, Leander P, Ola T, Dahlberg L: dGEMRIC (delayed gadolinium-enhanced MRI of cartilage) indicates adaptive capacity of human knee cartilage. Mag. Reson. Med. 51, 286–290 (2004).
115. Williams A, Sharma L, McKenzie CA, Prasad PV, Burstein D: Delayed gadolinium-enhanced magnetic resonance imaging of cartilage in knee osteoarthritis: Findings at different radiographic stages of disease and relationship to malalignment. Arthritis Rheum. 52, 3528–3535 (2005).
116. Tiderius CJ, Olsson LE, Nyquist F, Dahlberg L: Cartilage glycosaminoglycan loss in the acute phase after an anterior cruciate ligament injury: delayed gadolinium-enhanced magnetic resonance imaging of cartilage and synovial fluid analysis. Arthritis Rheum. 52, 120–127 (2005).
117. Young AA, Stanwell P, Williams A et al.: Glycosaminoglycan content of knee cartilage following posterior cruciate ligament rupture demonstrated by delayed gadolinium-enhanced magnetic resonance imaging of cartilage (dGEMRIC). A case report. J. Bone Joint Surg. Am. 87, 2763–2767 (2005).
118. Pathak SD, Ng L, Wyman B et al.: Quantitative image analysis: software systems in drug development trials. Drug Discov. Today 8, 451–458 (2003).
119. Dougados M: Monitoring osteoarthritis progression and therapy. Osteoarthritis Cartilage 12(Suppl. A), S55–S60 (2004).
120. Maillefert JF, Hawker GA, Gossec L et al.: Concomitant therapy: an outcome variable for musculoskeletal disorders? Part 2: total joint replacement in osteoarthritis trials. J. Rheumatol. 32, 2449–2451 (2005).
121. Maillefert JF, Dougados M: Is time to joint replacement a valid outcome measure in clinical trials of drugs for osteoarthritis? Rheum. Dis. Clin. North Am. 29, 831–845 (2003).
Websites201. National Institute of Arthritis and
Musculoskeletal and Skin diseases www.niams.nih.gov/ne/oi
202. Osteoarthritis Initiative www.oai.ucsf.edu./datarelease
Affiliation• Felix Eckstein, MD
Paracelsus Medical University (PMU), Institute of Anatomy & Musculoskeletal Research, Strubergasse 21, A5020 Salzburg Austria,and,Chondrometrics GmbH, Ulrichshölgerstr. 23, 83404 Ainring, GermanyTel.: +43 662 442 002 1249;Fax: + 43 662 442 002 1240;[email protected]