Quantitative Estimation of Vegetation
24
Quantitative Estimation of Vegetation Armin S. Coronado, MSc. Department of Biology College of Science Polytechnic University of the Philippines
-
Upload
gerson-kim-penetrante -
Category
Documents
-
view
149 -
download
5
Transcript of Quantitative Estimation of Vegetation

Quantitative
Estimation of
Vegetation
Armin S. Coronado, MSc.
Department of Biology
College of Science
Polytechnic University of the Philippines

10 m
10 m 4 m
4 m 1 m
1 m
Trees
< 3m in height
Herbs and Grasses
• May assume different shapes (Circle or Rectangle) • Size and Quantity depends on vegetation type and objectives
• Lower Size = Higher Errors
• More Quadrats = Higher Precision
Quadrat Method

Line Intercept
can be used in crown cover assessment of a large area

Belt Transect
Center Line 1 m
1 m
N m
• Useful in Zonation of Vegetation
• Continuous sampling (N meters) within a specified
strip width
(Santos R. N. et al, 2000)

Direct Estimation of Top Cover
Visually estimate the top cover of the
whole quadrat
Record each species to the nearest
percent
The total for all species and bare ground
will equal 100%

Line intercept +
quadrat method
100 meters transect line
1m X 1m quadrat
10 meters distance between
sampling points

Transect/Quadrant Method

Braun-Blanquet 5 Point Scale
+ very rare less than 1%
1 rare 1% - 5%
2 occasional 6% - 25%
3 frequent 26% - 50%
4 common 51% - 75%
5 abundant 76% - 100%

Domin Scale + a single individual
1 scarce; 1-2 individuals
2 very scattered; cover small and < 1%
3 scattered, cover small, 1-4%
4 abundant, cover 5-10%
5 abundant, cover 11-25%
6 abundant, cover 26-33% 7 abundant, cover 34-50%
8 abundant, cover 51-75%
9 abundant, cover >75% but not complete 10 Cover practically complete

Abundance – Number of individuals per species
Density – individuals per unit area
Dominance – which species are dominant in
terms of height or area;
(Density x Height or Basal Area)
Frequency – Number of species appearing per
Plot
Importance Value – which species has more
influence on ecosystem;
(Rel Den + Rel Dom + Rel freq)
Parameters

Density Estimation
Density of a species
Relative density of a species
Dominance of a species
Relative dominance of a species
Frequency of a species
Relative frequency of a species
Importance value
Importance percentage

Diversity Measurements
Shannon-Weiner Index (H‟)
Pielou‟s Eveness Index (J‟)

Diversity and Distribution Indices
Shannon-Weiner Index (H’). It is a measure of the average degree of “uncertainty” in predicting to what species an individual chosen at random from a collection of S species and N individuals will belong (Magurran 1988).
s
H‟ = - [(ni / N) ln (ni / N)]
i = 1
Pielou’s Evenness Index (J’) - expresses H‟ relative to the maximum value that H‟ can obtain when all of the species in the sample are perfectly even with one individual per species (Magurran 1988).
J‟ = _ H„_
ln (S)

Fernando Biodiversity Scale
Parameters
Relative Values Shannon (H’) Index Pielou (J’) Evenness Index
Very High 3.5 and above 0.75-1.00
High 3.0-3.49 0.50-0.74
Moderate 2.5-2.99 0.25-0.49
Low 2.0-2.49 0.15-0.24
Very Low 1.9 & below 0.05-0.14

Point-Center Quarter Method
plotless method
sampling without a 2-dimensional area
based on distance measurement between the marked station to the trees or between trees
used to determine the parameters of a community
involves equally spaced points along a transect line
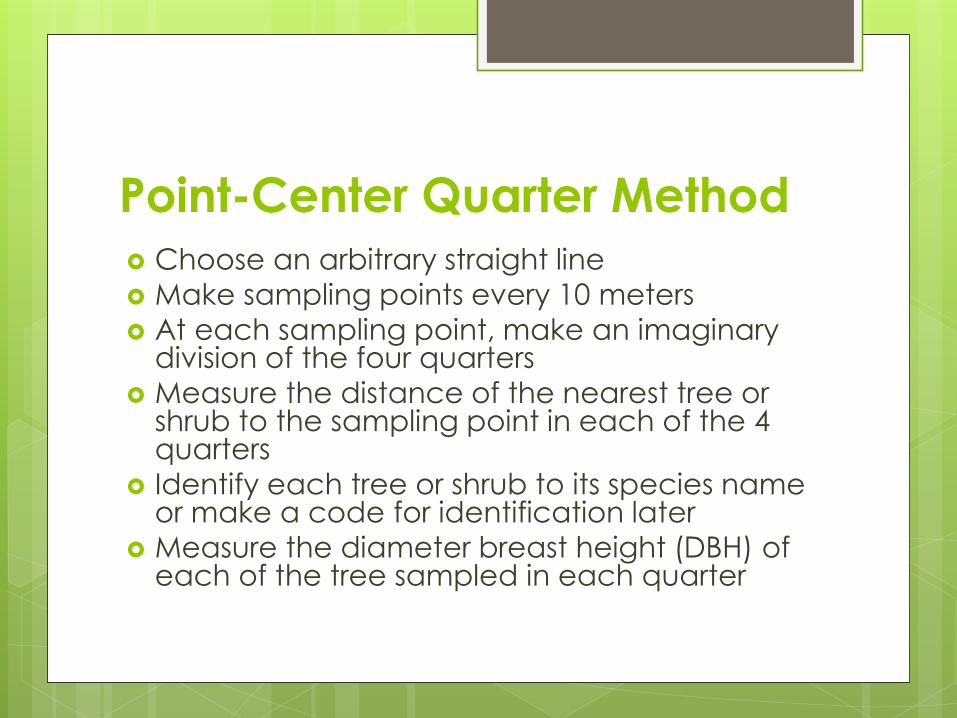
Point-Center Quarter Method
Choose an arbitrary straight line
Make sampling points every 10 meters
At each sampling point, make an imaginary division of the four quarters
Measure the distance of the nearest tree or shrub to the sampling point in each of the 4 quarters
Identify each tree or shrub to its species name or make a code for identification later
Measure the diameter breast height (DBH) of each of the tree sampled in each quarter

First Line (Compass Line)
2nd Line
Measured
Distance
10 meters
Point 1 Point 2
transect line
PCQM

Total Height
Merchantable Height – Part
of tree which is Usable
Diameter at Breast Height –
Outside Bark Diameter; 4.5
ft/ 1.3m from Ground
Basal Area = area outline of
a plant (Stem or Crown);
Total
Height
Merchantable
Height
DBH

Parameters (PCQM)
Mean distance
= total distance (d) / no. of distances (n)
Mean area per tree
= (d/n)2
Sampled area (in hectares)
= (100 m X mean distance) / 10,000
Absolute density of all species
= number of trees (n) samples / hectare

Parameters (PCQM)
Relative density of each species
= (density of each species / density of all species)
X 100
Absolute dominance of all species
= basal area of all trees sampled / hectare
Basal area
= r2
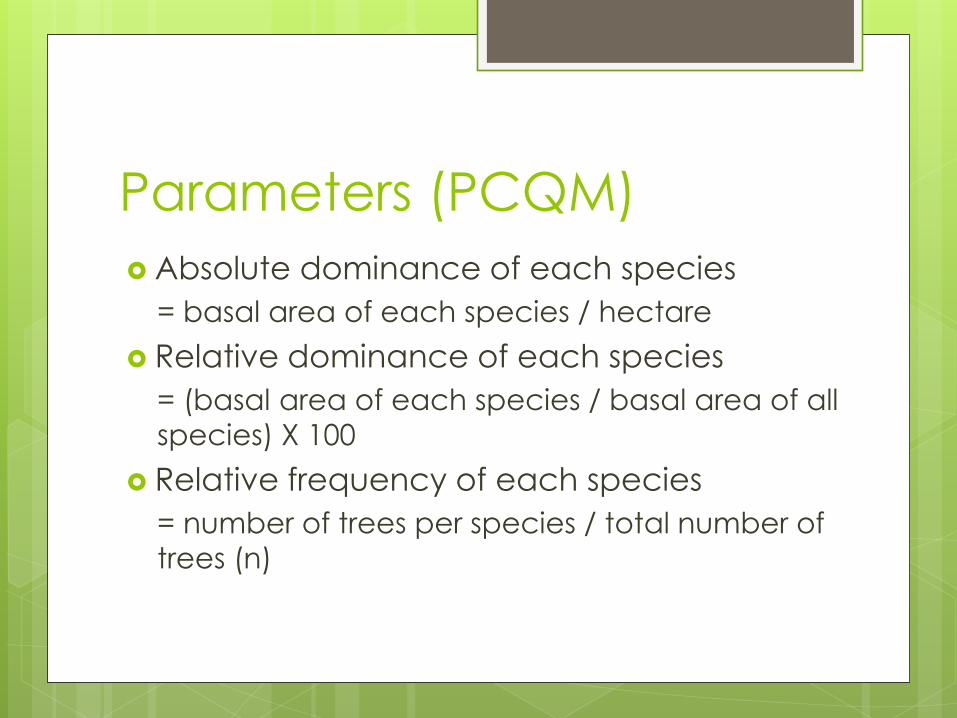
Parameters (PCQM)
Absolute dominance of each species
= basal area of each species / hectare
Relative dominance of each species
= (basal area of each species / basal area of all
species) X 100
Relative frequency of each species
= number of trees per species / total number of
trees (n)
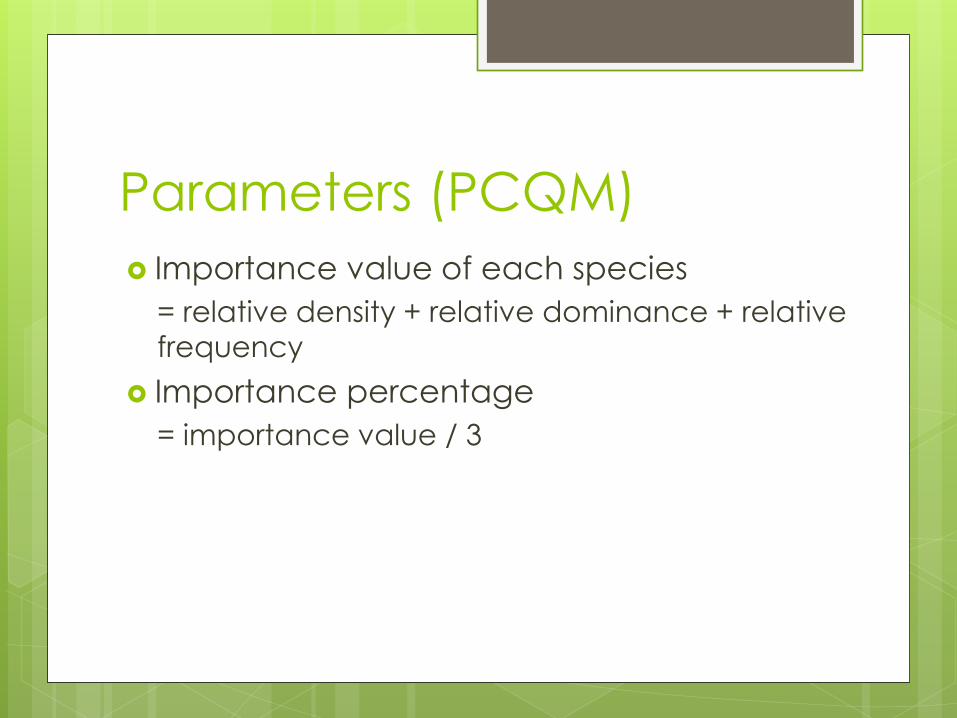
Parameters (PCQM)
Importance value of each species
= relative density + relative dominance + relative
frequency
Importance percentage
= importance value / 3

Based from the analysis of the
collated data, which species is
most numerous In the community
most frequent in the community
most dominant in the community
most important in the community