QUANTITATIVE ESTIMATION OF SUSPENDED PARTICULATE …
6
1 QUANTITATIVE ESTIMATION OF SUSPENDED PARTICULATE MATTER FROM CHRIS IMAGES Suhyb Salama and J. Monbaliu Hydraulics lab KULeuven,Kasteelpark Arenber 40,3001 Heverlee, Belgium ABSTRACT This paper highlights the utility of standard hyper- spectral techniques and algorithms to retrieve use- ful information from CHRIS imagery. The end- objective being the demonstration of CHRIS capa- bility in retrieving marine bio-geophysical quanti- ties. The major conclusion of this present study is that CHRIS-imagery, in its present status, can be used for operational retrieval of marine bio geo- physical quantities within reasonable accuracy. Though improvements are still needed to enhance the quality of the retrieved products. Key words: SPM. 1. INTRODUCTION Suspended particulate matter (SPM) is an impor- tant environmental indicator for geomorphologi- cal change, pollution, primary production and cli- mate change. The knowledge on SPM loads, spa- tial distributions and physical properties is essen- tial to maintain navigational routes and to moni- tor coastal morphology. Sediments in suspension are capable of transporting loads of adsorbed nu- trients, pesticides, heavy metals, and other toxins and decreasing the light penetration into the water. This affects fish feeding, photosynthesis and water temperature. The last two phenomena have a di- rect link to the climate change. Data acquired by the Compact High Resolution Imaging Spectrom- eter (CHRIS) mounted on PROBA satellite pro- vide wealth of information on the spatial, tempo- ral and angular distribution of SPM in the Belgian coastal waters. The processing of CHRIS images was subdivided into three phases namely, pre-processing, retrieval and validation. The objective of the preprocess- ing was to retrieve accurate values of the water leaving reflectance. This was realized through noise removal, georeferencing, atmospheric cor- rection and vicarious calibration. Marine bio- geophysical quantities were then retrieved in the second processing-phase of CHRIS images. The results were validated with in-situ measurements. The post-processing phase will encompass im- proving the quality of retrieved parameters us- ing hyperspectral and multi-viewing capabilities of CHRIS sensor. 1.1. Site description The study area is the Belgian coastal water. This water-region is extremely shallow with a depth ranging from 2 to less than 30 meters. The area is under strong meteorological forcing and tidal cur- rent. The combined effects of strong motion and shallow water result in a vertically homogeneous water column. The Belgian coastal water, there- fore, exhibits a permanent high load of suspended matter reaching 40 g.m -3 off the coast and may increase (especially in the winter off Oostende) to more than 100 g.m -3 Eisma & Kalf (1979). This high load of suspended sediment arises from transport and re-suspension of sediment materials through hydrodynamic processes, from river dis- charge and from the nearly continuous dredging activities in the area. 1.2. Characteristics of the Sensors The operational mode of CHRIS was set to 1 (ta- ble 1), i.e. 62 spectral bands distributed on the ____________________________________________________ Proc. of the 2nd CHRIS/Proba Workshop, ESA/ESRIN, Frascati, Italy 28-30 April (ESA SP-578, July 2004)
Transcript of QUANTITATIVE ESTIMATION OF SUSPENDED PARTICULATE …

1
QUANTITATIVE ESTIMATION OF SUSPENDED PARTICULATE MATTER FROM CHRISIMAGES
Suhyb Salama and J. Monbaliu
Hydraulics lab KULeuven,Kasteelpark Arenber 40,3001 Heverlee, Belgium
ABSTRACT
This paper highlights the utility of standard hyper-spectral techniques and algorithms to retrieve use-ful information from CHRIS imagery. The end-objective being the demonstration of CHRIS capa-bility in retrieving marine bio-geophysical quanti-ties. The major conclusion of this present study isthat CHRIS-imagery, in its present status, can beused for operational retrieval of marine bio geo-physical quantities within reasonable accuracy.Though improvements are still needed to enhancethe quality of the retrieved products.
Key words: SPM.
1. INTRODUCTION
Suspended particulate matter (SPM) is an impor-tant environmental indicator for geomorphologi-cal change, pollution, primary production and cli-mate change. The knowledge on SPM loads, spa-tial distributions and physical properties is essen-tial to maintain navigational routes and to moni-tor coastal morphology. Sediments in suspensionare capable of transporting loads of adsorbed nu-trients, pesticides, heavy metals, and other toxinsand decreasing the light penetration into the water.This affects fish feeding, photosynthesis and watertemperature. The last two phenomena have a di-rect link to the climate change. Data acquired bythe Compact High Resolution Imaging Spectrom-eter (CHRIS) mounted on PROBA satellite pro-vide wealth of information on the spatial, tempo-ral and angular distribution of SPM in the Belgiancoastal waters.
The processing of CHRIS images was subdivided
into three phases namely, pre-processing, retrievaland validation. The objective of the preprocess-ing was to retrieve accurate values of the waterleaving reflectance. This was realized throughnoise removal, georeferencing, atmospheric cor-rection and vicarious calibration. Marine bio-geophysical quantities were then retrieved in thesecond processing-phase of CHRIS images. Theresults were validated with in-situ measurements.The post-processing phase will encompass im-proving the quality of retrieved parameters us-ing hyperspectral and multi-viewing capabilitiesof CHRIS sensor.
1.1. Site description
The study area is the Belgian coastal water. Thiswater-region is extremely shallow with a depthranging from 2 to less than 30 meters. The area isunder strong meteorological forcing and tidal cur-rent. The combined effects of strong motion andshallow water result in a vertically homogeneouswater column. The Belgian coastal water, there-fore, exhibits a permanent high load of suspendedmatter reaching 40 g.m−3 off the coast and mayincrease (especially in the winter off Oostende)to more than 100 g.m−3 Eisma & Kalf (1979).This high load of suspended sediment arises fromtransport and re-suspension of sediment materialsthrough hydrodynamic processes, from river dis-charge and from the nearly continuous dredgingactivities in the area.
1.2. Characteristics of the Sensors
The operational mode of CHRIS was set to 1 (ta-ble 1), i.e. 62 spectral bands distributed on the
____________________________________________________ Proc. of the 2nd CHRIS/Proba Workshop, ESA/ESRIN, Frascati, Italy 28-30 April (ESA SP-578, July 2004)
2
range between 0.4µm and 1.05µm with 30meterspatial resolution.
Table 1. The operational mode of CHRIS sensor.
Parameter CHRISDynamic range [bit] 12FOV [◦] ±1.3spectral range [µm] 0.4-1.05Number of bands 62Spatial resolution [m] 30flight altitude [km] 645SNR 200: 0.2
2. PRE-PROCESSING
2.1. De-striping and noise removal
Prominent vertical striping was evident in allCHRIS images. This might be due to the differ-ence in noise level (and thus calibration) betweenadjacent detectors. This differnce in calibrationarises because each vertical column represents thesequential output of a single detector. The min-imum noise fraction (MNF) transforms was em-ployed to remove noise including vertical stripesfrom data Green et al. (1988). This was by per-forming a forward transform, determining whichbands contain the coherent images, and runningan inverse MNF transform using a spectral subsetto include the noise free bands only. An exam-ple is shown for a CHRIS image acquired on the05th of August with FZA=+36. This image wasde striped using the first three components of theforward MNF (figure 1).
From figure (1) we can observe that the MNFtransform has retained the spatial distribution ofthe blue band while removing the stripe and othernoise including some spikes (e.g. ship inducedwaves). One can argue that using the first threeeigne modes, only, to perform inverse MNF trans-form will lead to losses in the data which havehigh frequency in a similar manner to a low-passfilter. In other words, some of the informationwill be lost in the inverse procedure of the MNFtransform. However a high frequency signal, sur-rounded by low water-signals, arises from eitheran object floating on the water surface (e.g boat,buoy etc..), sun glint or whitecaps. It is of im-portance for water studies to remove these signals
Figure 1. above: Horizontal profile in the origi-nal image at the blue band 0.41µm. below: thesame transection as the above panel after de strip-ing using the first three eigen-modes.
to get reliable results. Still to what degree (i.e.number of the eigen-modes used in the inverse)the MNF will contributes in whiting the data, thiswill be left to future investigations.
2.2. Geo-referencing CHRIS image usingground control points
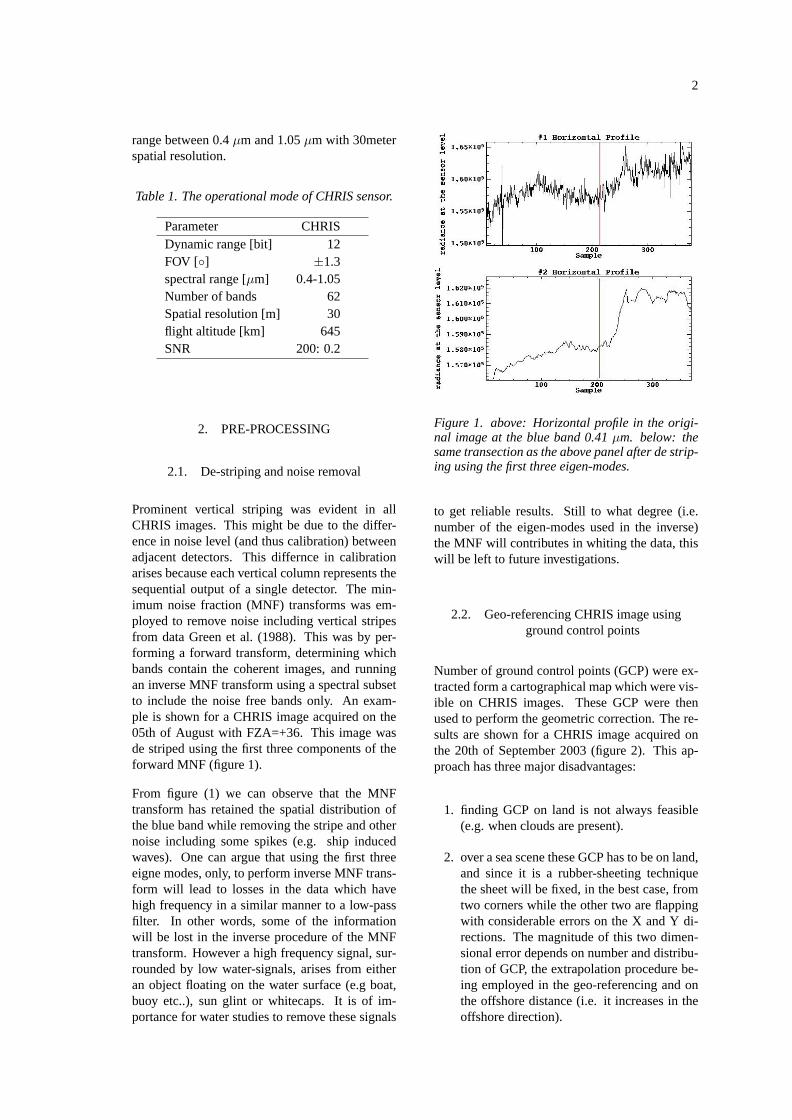
Number of ground control points (GCP) were ex-tracted form a cartographical map which were vis-ible on CHRIS images. These GCP were thenused to perform the geometric correction. The re-sults are shown for a CHRIS image acquired onthe 20th of September 2003 (figure 2). This ap-proach has three major disadvantages:
1. finding GCP on land is not always feasible(e.g. when clouds are present).
2. over a sea scene these GCP has to be on land,and since it is a rubber-sheeting techniquethe sheet will be fixed, in the best case, fromtwo corners while the other two are flappingwith considerable errors on the X and Y di-rections. The magnitude of this two dimen-sional error depends on number and distribu-tion of GCP, the extrapolation procedure be-ing employed in the geo-referencing and onthe offshore distance (i.e. it increases in theoffshore direction).
3
3. subject to operator error due to the scale dif-ference between a real point on a cartograph-ical map and a grid point of CHRIS imagewith a minimum size of 900 m2.
A better approach would be by using the teleme-try data of the PROBA satellite and the geograph-ical coordinates of the observed location to per-form geometric correction of the acquired sceneby CHRIS on board on PROBA.
Figure 2. The ground truth cartographical mapoverlayed on top of the georeferenced CHRIS im-age.
2.3. Atmospheric correction of CHRIS images
The fly-by-zenith and the minimum-zenith anglesof each acquisition were used with satellite alti-tude and time of overpass to compute the viewingzenith and azimuth angles for a geographical loca-tion on the ground.
The data from the sunphotometer fixed at Ostendstation were used to estimate the contribution ofaerosol scattering to the total recorded radiance atthe sensor level.
The water vapor transmittance at 0.94µm was es-timated from the band ratio technique Gao et al.(2000) assuming small variations in the surface re-flectance as follows:
T (940)w =5× ρ
(0.94)t
3× ρ(0.87)t
(1)
whereρ(λ)t is the apparent optical quantity at the
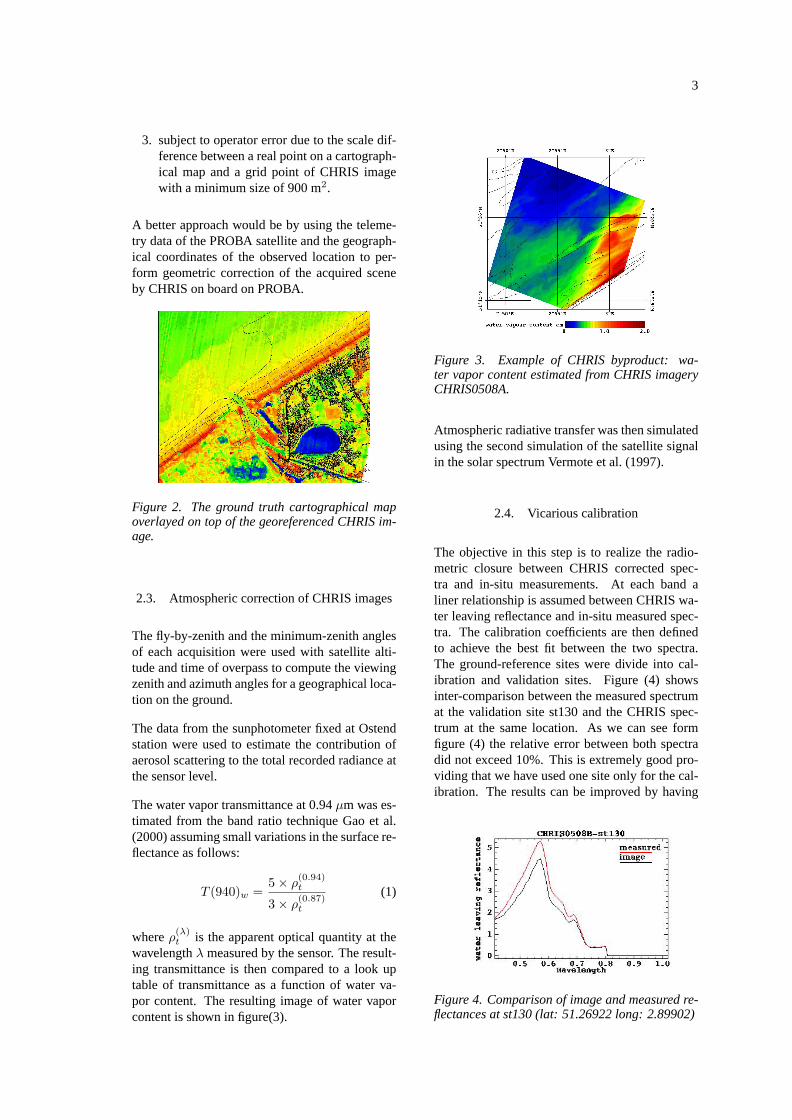
wavelengthλ measured by the sensor. The result-ing transmittance is then compared to a look uptable of transmittance as a function of water va-por content. The resulting image of water vaporcontent is shown in figure(3).
Figure 3. Example of CHRIS byproduct: wa-ter vapor content estimated from CHRIS imageryCHRIS0508A.
Atmospheric radiative transfer was then simulatedusing the second simulation of the satellite signalin the solar spectrum Vermote et al. (1997).
2.4. Vicarious calibration
The objective in this step is to realize the radio-metric closure between CHRIS corrected spec-tra and in-situ measurements. At each band aliner relationship is assumed between CHRIS wa-ter leaving reflectance and in-situ measured spec-tra. The calibration coefficients are then definedto achieve the best fit between the two spectra.The ground-reference sites were divide into cal-ibration and validation sites. Figure (4) showsinter-comparison between the measured spectrumat the validation site st130 and the CHRIS spec-trum at the same location. As we can see formfigure (4) the relative error between both spectradid not exceed 10%. This is extremely good pro-viding that we have used one site only for the cal-ibration. The results can be improved by having
Figure 4. Comparison of image and measured re-flectances at st130 (lat: 51.26922 long: 2.89902)

4
two sites that represent two different water bod-ies, eventually case1 and case 2 water. Let us note,however, that the two spectra have the same valuesof reflectance at the NIR. Therefore SPM can beretrieved form the NIR band (0.8µm) of CHRISimage with high accuracy. Moreover the blue /redratios have close values in both spectra. In conse-quence using the band ratio approach to estimatethe concentrations of chlorophyll-a form CHRISimage will give close estimates to measured con-centration. Upon that the goodness of fit betweenthe measured and CHRIS spectra in the visiblerange is at its maximum at the blue bands. Thisfeature will increase the accuracy of the retrievedDOM absorption coefficient form the blue bandsof CHRIS.
3. HYDRO OPTICAL MODELLING
The water leaving reflectanceρ(λ)w of a uniform
radiance field can be related to the inherent opticalproperties (IOP) as Gordon et al. (1988):
ρ(λ)w
T(λ)0
= 0.54πl1bb(λ)
bb(λ) + a(λ)(2)
Where l1 = 0.0949 is the subsurface expan-sion coefficients due to internal refraction, reflec-tion and sun zenith.T (λ)
0 is the solar transmit-tance from sun-to-target. The absorptiona(λ) andbackscatteringbb(λ) coefficients are expressed as:
a(λ) = aw(λ) + adom(λ) + achla (3)
bb(λ) = bb(w)(λ) + bb(spm)(λ) (4)
The subscriptsw, dom, chla and spm representwater, dissolved organic matter, chlorophyll-a andsuspended particulate matter respectively. Mea-sured values of specific inherent optical propertiesin the North Sea IVM (1999-2000) will be usedto compute the concentration of chlorophyll-a andSPM from retrieved absorption and backscatteringcoefficients.
For the SPM retrieval we used the NIR band cen-tered at 0.8µm and direct inversion of equation(2), (see figures 5,8 and 11). In this inversionprocess, other constituents than SPM and watermolecules were ignored. The concentrations ofchlorophyll-a were retrieved form the single bandratio model of Lee et al. (1996) (see figures 6 ,9and 12). Equation (2) was then inverted for DOMhaving the values of the Chl-a and SPM (see fig-ures 7, 10 and 13).
3.1. maps of marine bio-geophysical quantitiesin the Belgian coastal waters
Figure 5. The concentrations of SPM retrievedfrom CHRIS image acquired on 05/08/2003,FZA=0.
Figure 6. The concentrations of chlorophyll-a retrieved from CHRIS image acquired on05/08/2003, FZA=0.
Figure 7. DOM absorption coefficient at 0.44µm retrieved from CHRIS image acquired on05/08/2003, FZA=0.
The retrieved concentration of SPM (figures 5,8 and 11) have realistic spatial distribution andranges of values. The first SPM map (figure 5)

5
Figure 8. The concentrations of SPM retrievedfrom CHRIS image acquired on 20/09/2003,FZA=0.
Figure 9. The concentrations of chlorophyll-a retrieved from CHRIS image acquired on20/09/2003, FZA=0.
Figure 10. DOM absorption coefficient at 0.44µm retrieved from CHRIS image acquired on20/09/2003, FZA=0.
was computed one hour after the ebb-condition.Therefore the concentration of SPM rises from lo-
Figure 11. The concentrations of SPM retrievedfrom CHRIS image acquired on 21/09/2003,FZA=0.
Figure 12. The concentrations of chlorophyll-a retrieved from CHRIS image acquired on21/09/2003, FZA=0.
Figure 13. DOM absorption coefficient at 0.44µm retrieved from CHRIS image acquired on21/09/2003, FZA=0.
cal stirring in shallow areas due to the rises ofthe water level and the interaction of different hy-

6
drodynamical forces. This is clearly visible alongthe Wenduinebank sandbank. The other two SPMmaps (figures 8 and 11) were computed one andtwo hours before the ebb-condition, respectively.In this case the tide residual current is still an ef-fective factor in determining the concentration andspatial distribution of SPM. This especially for theSPM map computed two hours before the ebb (fig-ure 11). Here we can see how the interaction ofthe different hydrodynamical forces is contribut-ing to the magnitude and spatial distribution ofSPM along the Belgian coast. In a similar mannerthe spatial distribution of chlorophyll-a and DOMmaps can be explained in the view of the hydro-dynamical conditions at the time of image acqui-sition.
4. CONCLUSION
This paper demonstrated the potential use ofCHRIS imagery over water target. It was shownthat CHRIS operational processing chain followsthose of standard algorithms designed for hyper-spectral imagery. In other word CHRIS-imageryin its present status can be used for operational re-trieval of marine bio geophysical quantities. Theretrieved marine quantities from CHRIS imagesshowed realistic ranges of values. Moreover theirspatial distribution were in accordance to what isexpected from hydrodynamics simulation at thetime of image acquisition. Though improvementsare still needed to enhance the quality of the re-trieved products. Especially the multi-angularityfeature of CHRIS sensor, employing this capa-bility will improve our understanding on the be-directional effects of the water signal, besides itmight provide a better way to correct for the inter-ference of non desirable signals.
5. ACKNOWLEDGEMENT
The authors would like to thank: the EuropeanSpace Agency (ESA) for providing the opportu-nity to exploit CHRIS imageries, SIRA for therescientific and technical assistance, ManagementUnit of Mathematical Models of the North Seafor providing in-situ measurements, Institute forEnvironmental Studies-Free University of Ams-terdam for providing the specific inherent opti-cal properties. The financial support of ESA-PRODEX Experiment Arrangement No. 90018 isgratefully acknowledged.
PUBLISHED WORK IN THE CONTEXT OFCHRIS/PROBA MISSION
1. Salama S. Monbaliu J. and Coppin P., 2004,The atmospheric correction of AVHRR im-ages. International Journal of Remote Sens-ing Vol. 25, No 7-8, 1349-1355
2. Salama S. and Monbaliu J., 2003. Quan-tification of suspended particulate mattersfrom DAIS/ROSIS images: case-II waters”.Third EARSeL workshop on Imaging Spec-troscopy, ISBN 2-908885-26-3, pp 423-438.3
3. Salama S., 2003, Optical remote sensingfor the estimation of marine bio-geophysicalquantities. Ph.D. thesis, ISBN90-5682-437-6
4. Salama S. and Monbaliu J., 2002. Atmo-spheric correction algorithm for CHRIS im-ages: Application to CASI. Imaging Spec-trometry VIII, Proc. of SPIE, Vol. 4816, pp120-131
REFERENCES
Eisma D., Kalf J., 1979, Netherlands Journal ofSea Research, 13, 289
Gao B., Montes M., Ahmed Z., Davis C., 2000,Applied Optics, 39, 887
Gordon H., Brown O., Evans R., et al., 1988, Jour-nal of Geophysical Research, 10909–10924
Green A.A., Berman M., Switzer P., Craig M.D.,1988, IEE Transactions on Geoscience and Re-mote Sensing, 26, 65
IVM, 1999-2000, Measurements of the SIOPin the North Sea, institute for Environmen-tal Studies-Free University of Amsterdam, per-sonal communication
Lee Z., Carder K., Marra J., Steward R., Perry M.,1996, Applied Optics, 35, 463
Vermote E., Tanre D., Deuze J., Herman M.,Morcrette J., 1997, IEEE Transactions on Geo-science and Remote Sensing, 35, 675