Quantification of N-(3-chloro-2-hydroxypropyl)valine in human haemoglobin as a biomarker of...
14
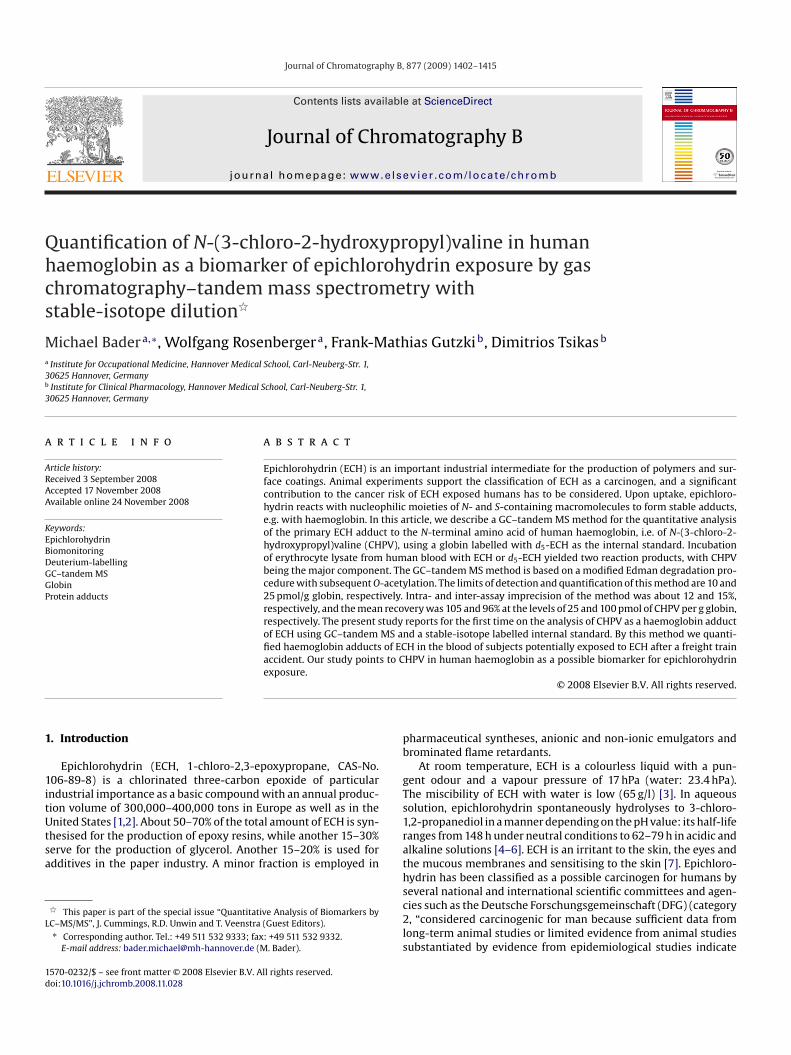
Journal of Chromatography B, 877 (2009) 1402–1415 Contents lists available at ScienceDirect Journal of Chromatography B journal homepage: www.elsevier.com/locate/chromb Quantification of N-(3-chloro-2-hydroxypropyl)valine in human haemoglobin as a biomarker of epichlorohydrin exposure by gas chromatography–tandem mass spectrometry with stable-isotope dilution Michael Bader a,∗ , Wolfgang Rosenberger a , Frank-Mathias Gutzki b , Dimitrios Tsikas b a Institute for Occupational Medicine, Hannover Medical School, Carl-Neuberg-Str. 1, 30625 Hannover, Germany b Institute for Clinical Pharmacology, Hannover Medical School, Carl-Neuberg-Str. 1, 30625 Hannover, Germany article info Article history: Received 3 September 2008 Accepted 17 November 2008 Available online 24 November 2008 Keywords: Epichlorohydrin Biomonitoring Deuterium-labelling GC–tandem MS Globin Protein adducts abstract Epichlorohydrin (ECH) is an important industrial intermediate for the production of polymers and sur- face coatings. Animal experiments support the classification of ECH as a carcinogen, and a significant contribution to the cancer risk of ECH exposed humans has to be considered. Upon uptake, epichloro- hydrin reacts with nucleophilic moieties of N- and S-containing macromolecules to form stable adducts, e.g. with haemoglobin. In this article, we describe a GC–tandem MS method for the quantitative analysis of the primary ECH adduct to the N-terminal amino acid of human haemoglobin, i.e. of N-(3-chloro-2- hydroxypropyl)valine (CHPV), using a globin labelled with d 5 -ECH as the internal standard. Incubation of erythrocyte lysate from human blood with ECH or d 5 -ECH yielded two reaction products, with CHPV being the major component. The GC–tandem MS method is based on a modified Edman degradation pro- cedure with subsequent O-acetylation. The limits of detection and quantification of this method are 10 and 25pmol/g globin, respectively. Intra- and inter-assay imprecision of the method was about 12 and 15%, respectively, and the mean recovery was 105 and 96% at the levels of 25 and 100 pmol of CHPV per g globin, respectively. The present study reports for the first time on the analysis of CHPV as a haemoglobin adduct of ECH using GC–tandem MS and a stable-isotope labelled internal standard. By this method we quanti- fied haemoglobin adducts of ECH in the blood of subjects potentially exposed to ECH after a freight train accident. Our study points to CHPV in human haemoglobin as a possible biomarker for epichlorohydrin exposure. © 2008 Elsevier B.V. All rights reserved. 1. Introduction Epichlorohydrin (ECH, 1-chloro-2,3-epoxypropane, CAS-No. 106-89-8) is a chlorinated three-carbon epoxide of particular industrial importance as a basic compound with an annual produc- tion volume of 300,000–400,000 tons in Europe as well as in the United States [1,2]. About 50–70% of the total amount of ECH is syn- thesised for the production of epoxy resins, while another 15–30% serve for the production of glycerol. Another 15–20% is used for additives in the paper industry. A minor fraction is employed in This paper is part of the special issue “Quantitative Analysis of Biomarkers by LC–MS/MS”, J. Cummings, R.D. Unwin and T. Veenstra (Guest Editors). ∗ Corresponding author. Tel.: +49 511 532 9333; fax: +49 511 532 9332. E-mail address: [email protected] (M. Bader). pharmaceutical syntheses, anionic and non-ionic emulgators and brominated flame retardants. At room temperature, ECH is a colourless liquid with a pun- gent odour and a vapour pressure of 17 hPa (water: 23.4 hPa). The miscibility of ECH with water is low (65 g/l) [3]. In aqueous solution, epichlorohydrin spontaneously hydrolyses to 3-chloro- 1,2-propanediol in a manner depending on the pH value: its half-life ranges from 148 h under neutral conditions to 62–79 h in acidic and alkaline solutions [4–6]. ECH is an irritant to the skin, the eyes and the mucous membranes and sensitising to the skin [7]. Epichloro- hydrin has been classified as a possible carcinogen for humans by several national and international scientific committees and agen- cies such as the Deutsche Forschungsgemeinschaft (DFG) (category 2, “considered carcinogenic for man because sufficient data from long-term animal studies or limited evidence from animal studies substantiated by evidence from epidemiological studies indicate 1570-0232/$ – see front matter © 2008 Elsevier B.V. All rights reserved. doi:10.1016/j.jchromb.2008.11.028
-
Upload
michael-bader -
Category
Documents
-
view
215 -
download
0
Transcript of Quantification of N-(3-chloro-2-hydroxypropyl)valine in human haemoglobin as a biomarker of...
Qhcs
Ma
3b
3
a
ARAA
KEBDGGP
1
1itUtsa
L
1d
Journal of Chromatography B, 877 (2009) 1402–1415
Contents lists available at ScienceDirect
Journal of Chromatography B
journa l homepage: www.e lsev ier .com/ locate /chromb
uantification of N-(3-chloro-2-hydroxypropyl)valine in humanaemoglobin as a biomarker of epichlorohydrin exposure by gashromatography–tandem mass spectrometry withtable-isotope dilution�
ichael Badera,∗, Wolfgang Rosenbergera, Frank-Mathias Gutzkib, Dimitrios Tsikasb
Institute for Occupational Medicine, Hannover Medical School, Carl-Neuberg-Str. 1,0625 Hannover, GermanyInstitute for Clinical Pharmacology, Hannover Medical School, Carl-Neuberg-Str. 1,0625 Hannover, Germany
r t i c l e i n f o
rticle history:eceived 3 September 2008ccepted 17 November 2008vailable online 24 November 2008
eywords:pichlorohydriniomonitoringeuterium-labellingC–tandem MSlobin
a b s t r a c t
Epichlorohydrin (ECH) is an important industrial intermediate for the production of polymers and sur-face coatings. Animal experiments support the classification of ECH as a carcinogen, and a significantcontribution to the cancer risk of ECH exposed humans has to be considered. Upon uptake, epichloro-hydrin reacts with nucleophilic moieties of N- and S-containing macromolecules to form stable adducts,e.g. with haemoglobin. In this article, we describe a GC–tandem MS method for the quantitative analysisof the primary ECH adduct to the N-terminal amino acid of human haemoglobin, i.e. of N-(3-chloro-2-hydroxypropyl)valine (CHPV), using a globin labelled with d5-ECH as the internal standard. Incubationof erythrocyte lysate from human blood with ECH or d5-ECH yielded two reaction products, with CHPVbeing the major component. The GC–tandem MS method is based on a modified Edman degradation pro-cedure with subsequent O-acetylation. The limits of detection and quantification of this method are 10 and
rotein adducts 25 pmol/g globin, respectively. Intra- and inter-assay imprecision of the method was about 12 and 15%,respectively, and the mean recovery was 105 and 96% at the levels of 25 and 100 pmol of CHPV per g globin,respectively. The present study reports for the first time on the analysis of CHPV as a haemoglobin adductof ECH using GC–tandem MS and a stable-isotope labelled internal standard. By this method we quanti-fied haemoglobin adducts of ECH in the blood of subjects potentially exposed to ECH after a freight trainaccident. Our study points to CHPV in human haemoglobin as a possible biomarker for epichlorohydrin
pb
gTs
exposure.
. Introduction
Epichlorohydrin (ECH, 1-chloro-2,3-epoxypropane, CAS-No.06-89-8) is a chlorinated three-carbon epoxide of particularndustrial importance as a basic compound with an annual produc-ion volume of 300,000–400,000 tons in Europe as well as in the
nited States [1,2]. About 50–70% of the total amount of ECH is syn-hesised for the production of epoxy resins, while another 15–30%erve for the production of glycerol. Another 15–20% is used fordditives in the paper industry. A minor fraction is employed in
� This paper is part of the special issue “Quantitative Analysis of Biomarkers byC–MS/MS”, J. Cummings, R.D. Unwin and T. Veenstra (Guest Editors).∗ Corresponding author. Tel.: +49 511 532 9333; fax: +49 511 532 9332.
E-mail address: [email protected] (M. Bader).
1rathsc2ls
570-0232/$ – see front matter © 2008 Elsevier B.V. All rights reserved.oi:10.1016/j.jchromb.2008.11.028
© 2008 Elsevier B.V. All rights reserved.
harmaceutical syntheses, anionic and non-ionic emulgators androminated flame retardants.
At room temperature, ECH is a colourless liquid with a pun-ent odour and a vapour pressure of 17 hPa (water: 23.4 hPa).he miscibility of ECH with water is low (65 g/l) [3]. In aqueousolution, epichlorohydrin spontaneously hydrolyses to 3-chloro-,2-propanediol in a manner depending on the pH value: its half-lifeanges from 148 h under neutral conditions to 62–79 h in acidic andlkaline solutions [4–6]. ECH is an irritant to the skin, the eyes andhe mucous membranes and sensitising to the skin [7]. Epichloro-ydrin has been classified as a possible carcinogen for humans by
everal national and international scientific committees and agen-ies such as the Deutsche Forschungsgemeinschaft (DFG) (category, “considered carcinogenic for man because sufficient data fromong-term animal studies or limited evidence from animal studiesubstantiated by evidence from epidemiological studies indicate
M. Bader et al. / J. Chromatogr. B 877 (2009) 1402–1415 1403
F ihydrp
tttEcC
r
Fhi
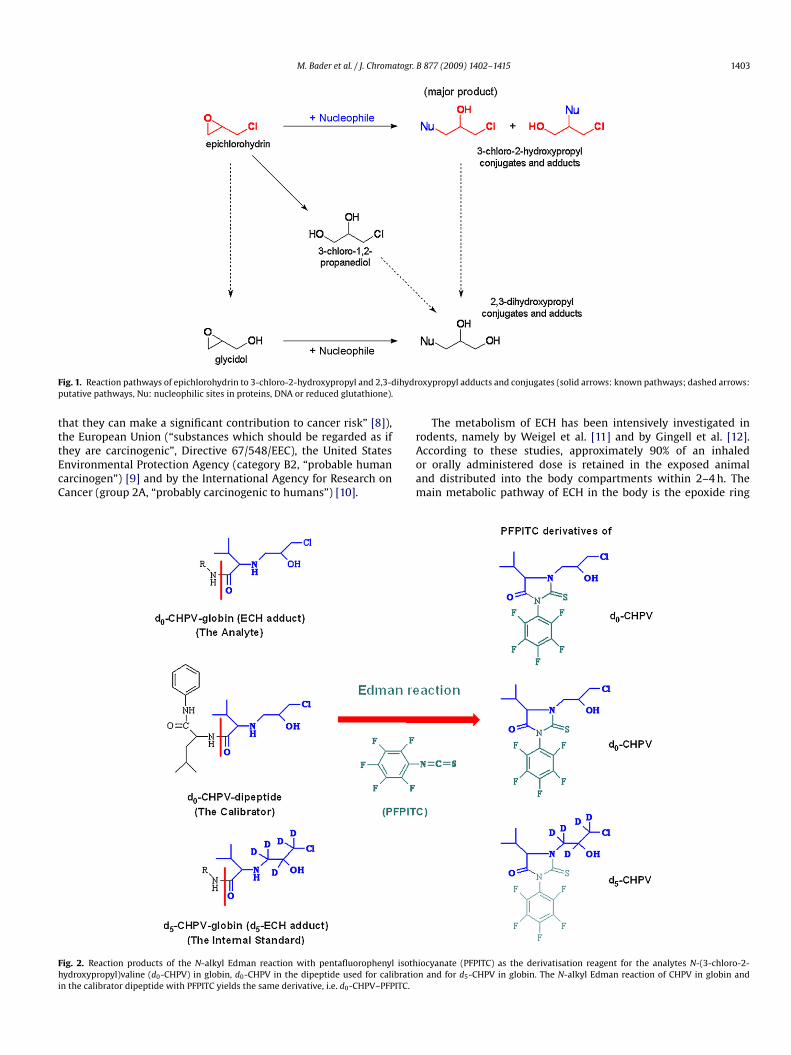
ig. 1. Reaction pathways of epichlorohydrin to 3-chloro-2-hydroxypropyl and 2,3-dutative pathways, Nu: nucleophilic sites in proteins, DNA or reduced glutathione).
hat they can make a significant contribution to cancer risk” [8]),he European Union (“substances which should be regarded as if
hey are carcinogenic”, Directive 67/548/EEC), the United Statesnvironmental Protection Agency (category B2, “probable humanarcinogen”) [9] and by the International Agency for Research onancer (group 2A, “probably carcinogenic to humans”) [10].Aoam
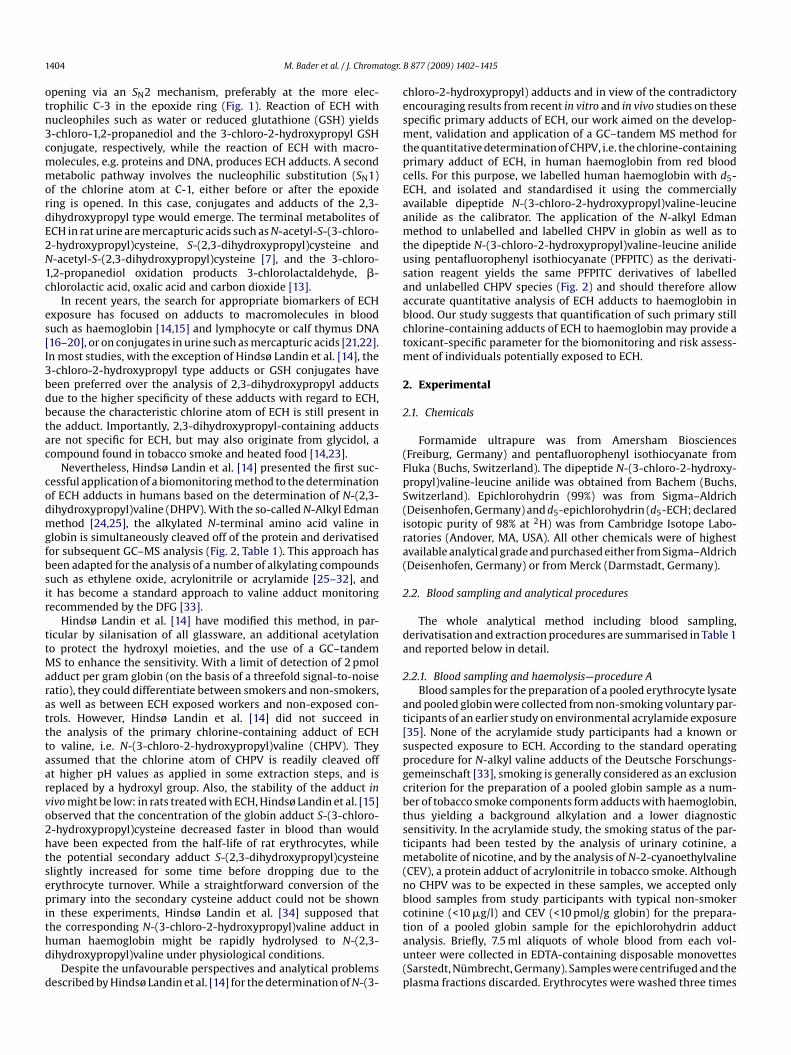
ig. 2. Reaction products of the N-alkyl Edman reaction with pentafluorophenyl isothydroxypropyl)valine (d0-CHPV) in globin, d0-CHPV in the dipeptide used for calibratio
n the calibrator dipeptide with PFPITC yields the same derivative, i.e. d0-CHPV–PFPITC.
oxypropyl adducts and conjugates (solid arrows: known pathways; dashed arrows:
The metabolism of ECH has been intensively investigated inodents, namely by Weigel et al. [11] and by Gingell et al. [12].
ccording to these studies, approximately 90% of an inhaledr orally administered dose is retained in the exposed animalnd distributed into the body compartments within 2–4 h. Theain metabolic pathway of ECH in the body is the epoxide ringiocyanate (PFPITC) as the derivatisation reagent for the analytes N-(3-chloro-2-n and for d5-CHPV in globin. The N-alkyl Edman reaction of CHPV in globin and
1 atogr.
otn3cmmordE2N1c
es[I3bdbtac
codmgfbsir
ttMaratttaarvo2htsepithd
d
cesmtpcEaamtusaabctm
2
2
(FpS(ira(
2
da
2
at[spgcbtstm(nbc
404 M. Bader et al. / J. Chrom
pening via an SN2 mechanism, preferably at the more elec-rophilic C-3 in the epoxide ring (Fig. 1). Reaction of ECH withucleophiles such as water or reduced glutathione (GSH) yields-chloro-1,2-propanediol and the 3-chloro-2-hydroxypropyl GSHonjugate, respectively, while the reaction of ECH with macro-olecules, e.g. proteins and DNA, produces ECH adducts. A secondetabolic pathway involves the nucleophilic substitution (SN1)
f the chlorine atom at C-1, either before or after the epoxideing is opened. In this case, conjugates and adducts of the 2,3-ihydroxypropyl type would emerge. The terminal metabolites ofCH in rat urine are mercapturic acids such as N-acetyl-S-(3-chloro--hydroxypropyl)cysteine, S-(2,3-dihydroxypropyl)cysteine and-acetyl-S-(2,3-dihydroxypropyl)cysteine [7], and the 3-chloro-,2-propanediol oxidation products 3-chlorolactaldehyde, �-hlorolactic acid, oxalic acid and carbon dioxide [13].
In recent years, the search for appropriate biomarkers of ECHxposure has focused on adducts to macromolecules in blooduch as haemoglobin [14,15] and lymphocyte or calf thymus DNA16–20], or on conjugates in urine such as mercapturic acids [21,22].n most studies, with the exception of Hindsø Landin et al. [14], the-chloro-2-hydroxypropyl type adducts or GSH conjugates haveeen preferred over the analysis of 2,3-dihydroxypropyl adductsue to the higher specificity of these adducts with regard to ECH,ecause the characteristic chlorine atom of ECH is still present inhe adduct. Importantly, 2,3-dihydroxypropyl-containing adductsre not specific for ECH, but may also originate from glycidol, aompound found in tobacco smoke and heated food [14,23].
Nevertheless, Hindsø Landin et al. [14] presented the first suc-essful application of a biomonitoring method to the determinationf ECH adducts in humans based on the determination of N-(2,3-ihydroxypropyl)valine (DHPV). With the so-called N-Alkyl Edmanethod [24,25], the alkylated N-terminal amino acid valine in
lobin is simultaneously cleaved off of the protein and derivatisedor subsequent GC–MS analysis (Fig. 2, Table 1). This approach haseen adapted for the analysis of a number of alkylating compoundsuch as ethylene oxide, acrylonitrile or acrylamide [25–32], andt has become a standard approach to valine adduct monitoringecommended by the DFG [33].
Hindsø Landin et al. [14] have modified this method, in par-icular by silanisation of all glassware, an additional acetylationo protect the hydroxyl moieties, and the use of a GC–tandem
S to enhance the sensitivity. With a limit of detection of 2 pmoldduct per gram globin (on the basis of a threefold signal-to-noiseatio), they could differentiate between smokers and non-smokers,s well as between ECH exposed workers and non-exposed con-rols. However, Hindsø Landin et al. [14] did not succeed inhe analysis of the primary chlorine-containing adduct of ECHo valine, i.e. N-(3-chloro-2-hydroxypropyl)valine (CHPV). Theyssumed that the chlorine atom of CHPV is readily cleaved offt higher pH values as applied in some extraction steps, and iseplaced by a hydroxyl group. Also, the stability of the adduct inivo might be low: in rats treated with ECH, Hindsø Landin et al. [15]bserved that the concentration of the globin adduct S-(3-chloro--hydroxypropyl)cysteine decreased faster in blood than wouldave been expected from the half-life of rat erythrocytes, whilehe potential secondary adduct S-(2,3-dihydroxypropyl)cysteinelightly increased for some time before dropping due to therythrocyte turnover. While a straightforward conversion of therimary into the secondary cysteine adduct could not be shown
n these experiments, Hindsø Landin et al. [34] supposed that
he corresponding N-(3-chloro-2-hydroxypropyl)valine adduct inuman haemoglobin might be rapidly hydrolysed to N-(2,3-ihydroxypropyl)valine under physiological conditions.Despite the unfavourable perspectives and analytical problemsescribed by Hindsø Landin et al. [14] for the determination of N-(3-
tau(p
B 877 (2009) 1402–1415
hloro-2-hydroxypropyl) adducts and in view of the contradictoryncouraging results from recent in vitro and in vivo studies on thesepecific primary adducts of ECH, our work aimed on the develop-ent, validation and application of a GC–tandem MS method for
he quantitative determination of CHPV, i.e. the chlorine-containingrimary adduct of ECH, in human haemoglobin from red bloodells. For this purpose, we labelled human haemoglobin with d5-CH, and isolated and standardised it using the commerciallyvailable dipeptide N-(3-chloro-2-hydroxypropyl)valine-leucinenilide as the calibrator. The application of the N-alkyl Edmanethod to unlabelled and labelled CHPV in globin as well as to
he dipeptide N-(3-chloro-2-hydroxypropyl)valine-leucine anilidesing pentafluorophenyl isothiocyanate (PFPITC) as the derivati-ation reagent yields the same PFPITC derivatives of labellednd unlabelled CHPV species (Fig. 2) and should therefore allowccurate quantitative analysis of ECH adducts to haemoglobin inlood. Our study suggests that quantification of such primary stillhlorine-containing adducts of ECH to haemoglobin may provide aoxicant-specific parameter for the biomonitoring and risk assess-
ent of individuals potentially exposed to ECH.
. Experimental
.1. Chemicals
Formamide ultrapure was from Amersham BiosciencesFreiburg, Germany) and pentafluorophenyl isothiocyanate fromluka (Buchs, Switzerland). The dipeptide N-(3-chloro-2-hydroxy-ropyl)valine-leucine anilide was obtained from Bachem (Buchs,witzerland). Epichlorohydrin (99%) was from Sigma–AldrichDeisenhofen, Germany) and d5-epichlorohydrin (d5-ECH; declaredsotopic purity of 98% at 2H) was from Cambridge Isotope Labo-atories (Andover, MA, USA). All other chemicals were of highestvailable analytical grade and purchased either from Sigma–AldrichDeisenhofen, Germany) or from Merck (Darmstadt, Germany).
.2. Blood sampling and analytical procedures
The whole analytical method including blood sampling,erivatisation and extraction procedures are summarised in Table 1nd reported below in detail.
.2.1. Blood sampling and haemolysis—procedure ABlood samples for the preparation of a pooled erythrocyte lysate
nd pooled globin were collected from non-smoking voluntary par-icipants of an earlier study on environmental acrylamide exposure35]. None of the acrylamide study participants had a known oruspected exposure to ECH. According to the standard operatingrocedure for N-alkyl valine adducts of the Deutsche Forschungs-emeinschaft [33], smoking is generally considered as an exclusionriterion for the preparation of a pooled globin sample as a num-er of tobacco smoke components form adducts with haemoglobin,hus yielding a background alkylation and a lower diagnosticensitivity. In the acrylamide study, the smoking status of the par-icipants had been tested by the analysis of urinary cotinine, a
etabolite of nicotine, and by the analysis of N-2-cyanoethylvalineCEV), a protein adduct of acrylonitrile in tobacco smoke. Althougho CHPV was to be expected in these samples, we accepted onlylood samples from study participants with typical non-smokerotinine (<10 �g/l) and CEV (<10 pmol/g globin) for the prepara-
ion of a pooled globin sample for the epichlorohydrin adductnalysis. Briefly, 7.5 ml aliquots of whole blood from each vol-nteer were collected in EDTA-containing disposable monovettesSarstedt, Nümbrecht, Germany). Samples were centrifuged and thelasma fractions discarded. Erythrocytes were washed three times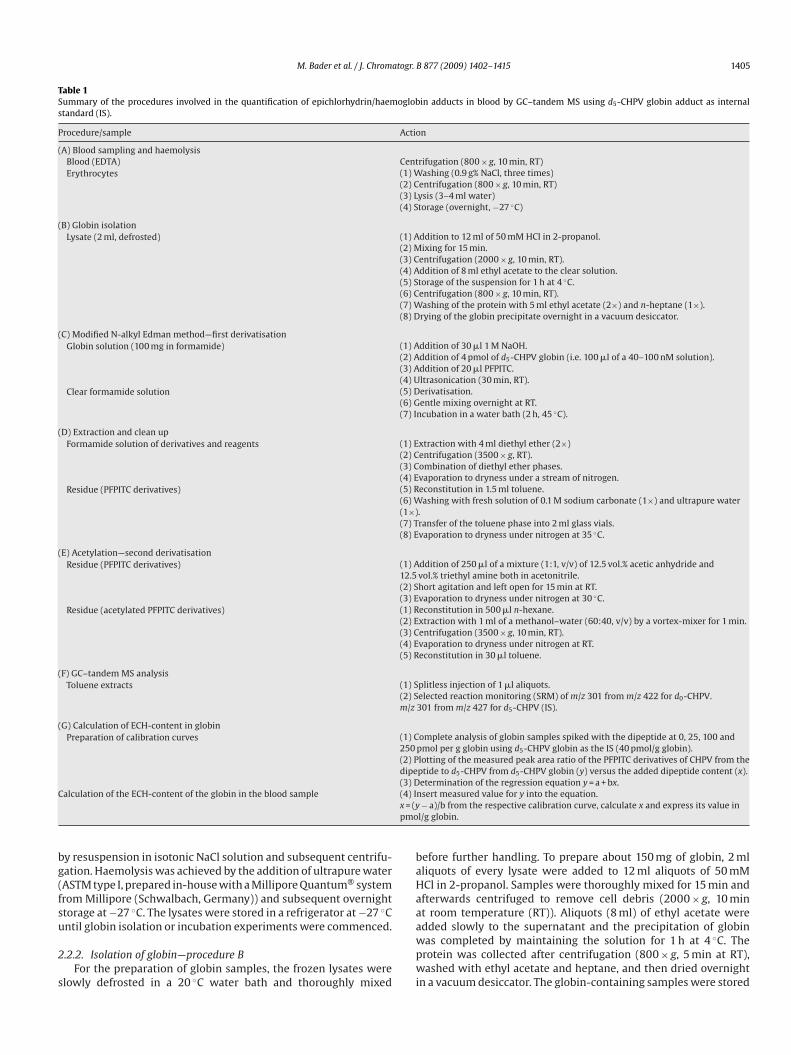
M. Bader et al. / J. Chromatogr. B 877 (2009) 1402–1415 1405
Table 1Summary of the procedures involved in the quantification of epichlorhydrin/haemoglobin adducts in blood by GC–tandem MS using d5-CHPV globin adduct as internalstandard (IS).
Procedure/sample Action
(A) Blood sampling and haemolysisBlood (EDTA) Centrifugation (800 × g, 10 min, RT)Erythrocytes (1) Washing (0.9 g% NaCl, three times)
(2) Centrifugation (800 × g, 10 min, RT)(3) Lysis (3–4 ml water)(4) Storage (overnight, −27 ◦C)
(B) Globin isolationLysate (2 ml, defrosted) (1) Addition to 12 ml of 50 mM HCl in 2-propanol.
(2) Mixing for 15 min.(3) Centrifugation (2000 × g, 10 min, RT).(4) Addition of 8 ml ethyl acetate to the clear solution.(5) Storage of the suspension for 1 h at 4 ◦C.(6) Centrifugation (800 × g, 10 min, RT).(7) Washing of the protein with 5 ml ethyl acetate (2×) and n-heptane (1×).(8) Drying of the globin precipitate overnight in a vacuum desiccator.
(C) Modified N-alkyl Edman method—first derivatisationGlobin solution (100 mg in formamide) (1) Addition of 30 �l 1 M NaOH.
(2) Addition of 4 pmol of d5-CHPV globin (i.e. 100 �l of a 40–100 nM solution).(3) Addition of 20 �l PFPITC.(4) Ultrasonication (30 min, RT).
Clear formamide solution (5) Derivatisation.(6) Gentle mixing overnight at RT.(7) Incubation in a water bath (2 h, 45 ◦C).
(D) Extraction and clean upFormamide solution of derivatives and reagents (1) Extraction with 4 ml diethyl ether (2×)
(2) Centrifugation (3500 × g, RT).(3) Combination of diethyl ether phases.(4) Evaporation to dryness under a stream of nitrogen.
Residue (PFPITC derivatives) (5) Reconstitution in 1.5 ml toluene.(6) Washing with fresh solution of 0.1 M sodium carbonate (1×) and ultrapure water(1×).(7) Transfer of the toluene phase into 2 ml glass vials.(8) Evaporation to dryness under nitrogen at 35 ◦C.
(E) Acetylation—second derivatisationResidue (PFPITC derivatives) (1) Addition of 250 �l of a mixture (1:1, v/v) of 12.5 vol.% acetic anhydride and
12.5 vol.% triethyl amine both in acetonitrile.(2) Short agitation and left open for 15 min at RT.(3) Evaporation to dryness under nitrogen at 30 ◦C.
Residue (acetylated PFPITC derivatives) (1) Reconstitution in 500 �l n-hexane.(2) Extraction with 1 ml of a methanol–water (60:40, v/v) by a vortex-mixer for 1 min.(3) Centrifugation (3500 × g, 10 min, RT).(4) Evaporation to dryness under nitrogen at RT.(5) Reconstitution in 30 �l toluene.
(F) GC–tandem MS analysisToluene extracts (1) Splitless injection of 1 �l aliquots.
(2) Selected reaction monitoring (SRM) of m/z 301 from m/z 422 for d0-CHPV.m/z 301 from m/z 427 for d5-CHPV (IS).
(G) Calculation of ECH-content in globinPreparation of calibration curves (1) Complete analysis of globin samples spiked with the dipeptide at 0, 25, 100 and
250 pmol per g globin using d5-CHPV globin as the IS (40 pmol/g globin).(2) Plotting of the measured peak area ratio of the PFPITC derivatives of CHPV from thedipeptide to d5-CHPV from d5-CHPV globin (y) versus the added dipeptide content (x).(3) Determination of the regression equation y = a + bx.
C (4) Ix = (ypmo
bg(fsu
2
s
baHaa
alculation of the ECH-content of the globin in the blood sample
y resuspension in isotonic NaCl solution and subsequent centrifu-ation. Haemolysis was achieved by the addition of ultrapure waterASTM type I, prepared in-house with a Millipore Quantum® systemrom Millipore (Schwalbach, Germany)) and subsequent overnighttorage at −27 ◦C. The lysates were stored in a refrigerator at −27 ◦C
ntil globin isolation or incubation experiments were commenced..2.2. Isolation of globin—procedure BFor the preparation of globin samples, the frozen lysates were
lowly defrosted in a 20 ◦C water bath and thoroughly mixed
awpwi
nsert measured value for y into the equation.− a)/b from the respective calibration curve, calculate x and express its value in
l/g globin.
efore further handling. To prepare about 150 mg of globin, 2 mlliquots of every lysate were added to 12 ml aliquots of 50 mMCl in 2-propanol. Samples were thoroughly mixed for 15 min andfterwards centrifuged to remove cell debris (2000 × g, 10 mint room temperature (RT)). Aliquots (8 ml) of ethyl acetate were
dded slowly to the supernatant and the precipitation of globinas completed by maintaining the solution for 1 h at 4 ◦C. Therotein was collected after centrifugation (800 × g, 5 min at RT),ashed with ethyl acetate and heptane, and then dried overnightn a vacuum desiccator. The globin-containing samples were stored
1 atogr.
iogaa
2
aimaaa
2
(
rfl1itDe2itdt3
FD
406 M. Bader et al. / J. Chrom
n a refrigerator at −27 ◦C until further analysis. For the preparationf a standard globin sample free of ECH adducts, the total proteinain of twenty 7.5 ml blood samples was pooled finally yieldingbout 20 g of globin and was used in validation experiments ands a biological matrix in quantitative analyses.
.2.3. Preparation of d5-ECH-labelled globinAn aliquot (200 �l) of d5-ECH was added to a 20-ml aliquot of
pooled erythrocyte lysate (each 1 ml erythrocyte lysate from 20ndividual samples) and the resulting mixtures were thoroughly
ixed by vortexing. The lysate was modestly agitated (180 per min)nd maintained for 4 h at RT. Subsequently, the globin was isolatedccording to the procedure (B) described before, typically yielding
total protein amount of about 3 g..2.4. Preparation of dipeptide calibration standardsAn accurately weighed amount of 39.8 mg (0.1 mmol) of the N-
3-chloro-2-hydroxypropyl)valine-leucine anilide (in the following
a5ftb
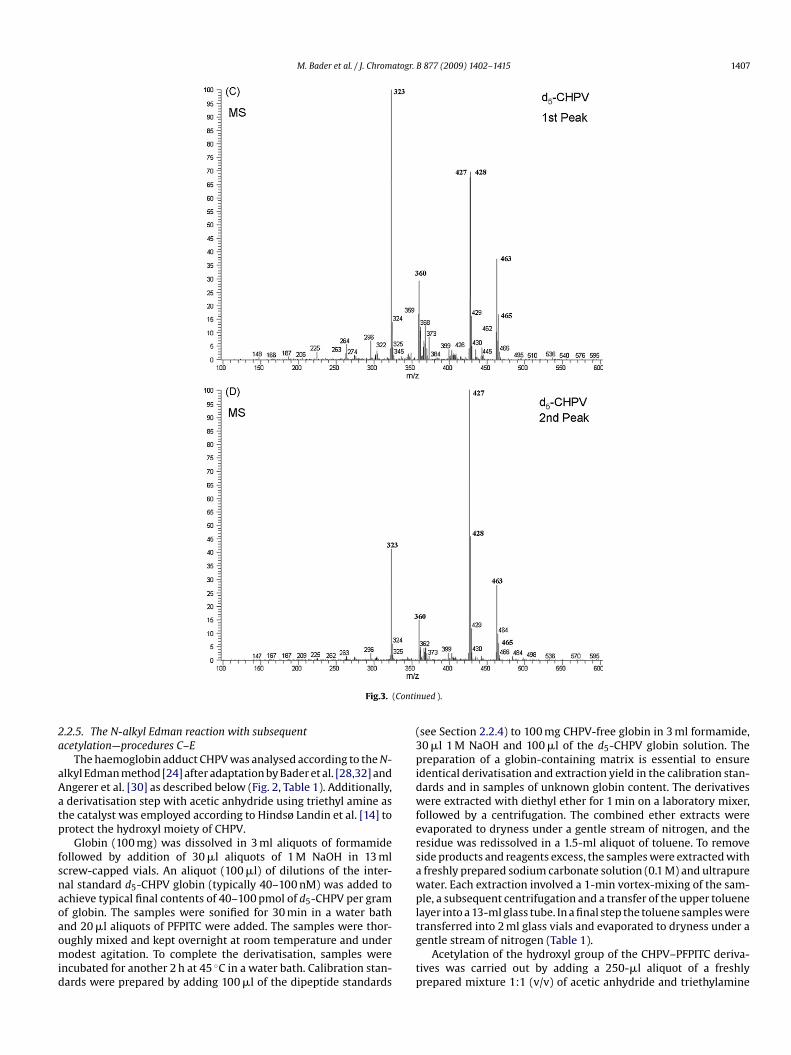
ig. 3. Electron-capture negative-ion chemical ionisation mass spectra (MS) obtained fro). The mass spectra were generated from two GC peaks with a retention time of 21.5 min
B 877 (2009) 1402–1415
eferred to as the dipeptide) was placed in a 100-ml volumetricask and dissolved in ethanol to reach a final concentration ofmM. Aliquots (100 �l) of this stock solution were transferred
nto a 100-ml volumetric flask and further diluted in ethanolo achieve a final concentration of 1 �M (the working solution).ilutions of the calibrator working solution were prepared inthanol to reach final concentrations of 0, 10, 25, 50, 75, 100, 175,50 nM; these solutions were used for the calibration of d0-CHPV
n globin samples and for the standardisation of the newly syn-hesised d5-ECH-labelled globin (in the following referred to as5-CHPV globin). A typical range for the labelled globin prepara-ion was 10–25 �mol of d5-CHPV per gram of globin (see Section). Stock solutions were prepared by adding an accurately weighed
mount of d5-CHPV globin (e.g. 10 mg) to pure formamide (e.g.0 ml) and sonication for 30 min. Stock solutions (e.g. 5 �M) wereurther diluted in formamide to achieve a nominal final concen-ration in the range 40–100 pmol d5-CHPV globin per g globin (seeelow).m the GC–MS analysis of the PFPITC derivatives of d0-CHPV (A, B) and d5-CHPV (C,(1st peak) and 21.6 min (2nd peak).
M. Bader et al. / J. Chromatogr. B 877 (2009) 1402–1415 1407
Contin
2a
aAatp
fsnaoaomid
(3pidwfersawpl
Fig.3. (
.2.5. The N-alkyl Edman reaction with subsequentcetylation—procedures C–E
The haemoglobin adduct CHPV was analysed according to the N-lkyl Edman method [24] after adaptation by Bader et al. [28,32] andngerer et al. [30] as described below (Fig. 2, Table 1). Additionally,derivatisation step with acetic anhydride using triethyl amine as
he catalyst was employed according to Hindsø Landin et al. [14] torotect the hydroxyl moiety of CHPV.
Globin (100 mg) was dissolved in 3 ml aliquots of formamideollowed by addition of 30 �l aliquots of 1 M NaOH in 13 mlcrew-capped vials. An aliquot (100 �l) of dilutions of the inter-al standard d5-CHPV globin (typically 40–100 nM) was added tochieve typical final contents of 40–100 pmol of d5-CHPV per gramf globin. The samples were sonified for 30 min in a water bath
nd 20 �l aliquots of PFPITC were added. The samples were thor-ughly mixed and kept overnight at room temperature and underodest agitation. To complete the derivatisation, samples werencubated for another 2 h at 45 ◦C in a water bath. Calibration stan-ards were prepared by adding 100 �l of the dipeptide standards
tg
tp
ued ).
see Section 2.2.4) to 100 mg CHPV-free globin in 3 ml formamide,0 �l 1 M NaOH and 100 �l of the d5-CHPV globin solution. Thereparation of a globin-containing matrix is essential to ensure
dentical derivatisation and extraction yield in the calibration stan-ards and in samples of unknown globin content. The derivativesere extracted with diethyl ether for 1 min on a laboratory mixer,
ollowed by a centrifugation. The combined ether extracts werevaporated to dryness under a gentle stream of nitrogen, and theesidue was redissolved in a 1.5-ml aliquot of toluene. To removeide products and reagents excess, the samples were extracted withfreshly prepared sodium carbonate solution (0.1 M) and ultrapureater. Each extraction involved a 1-min vortex-mixing of the sam-le, a subsequent centrifugation and a transfer of the upper toluene
ayer into a 13-ml glass tube. In a final step the toluene samples were
ransferred into 2 ml glass vials and evaporated to dryness under aentle stream of nitrogen (Table 1).Acetylation of the hydroxyl group of the CHPV–PFPITC deriva-ives was carried out by adding a 250-�l aliquot of a freshlyrepared mixture 1:1 (v/v) of acetic anhydride and triethylamine
1 atogr.
iwSgamsigas
2
am7Au0wTww8mwcu
Erf1tpmeo
2
sTt3atoydtt(
F
408 M. Bader et al. / J. Chrom
n acetonitrile (12.5 vol% for each compound). The sample vialsere not sealed but left open for 15 min at room temperature.
ubsequently, the samples were evaporated to dryness under aentle stream of nitrogen. The residue was redissolved in a 500-�lliquot of hexane and extracted with a 1-ml aliquot of a mixture ofethanol–water (60:40, v/v), involving a 1-min vortex-mixing with
ubsequent centrifugation. The hexane layer was then transferrednto a 2-ml sample vial and evaporated therein to dryness under aentle stream of nitrogen. The residue was reconstituted in a 30-�lliquot of toluene and transferred into a 200-�l micro-insert forubsequent GC–tandem MS analysis.
.2.6. GC–tandem MS conditions—procedure FAliquots (1 �l) of the toluene extracts were injected splitless into
GC–tandem MS instrument from ThermoElectron (Bremen, Ger-any) consisting of a Trace 2000 gas chromatograph and a TSQ
000 triple stage quadrupole mass spectrometer equipped with anS 2000 autosampler and a BEST PTV injector. The capillary col-mn used was an Optima-1-MS (30 m × 0.25 mm, film thickness.25 �m) from Macherey-Nagel (Düren, Germany). The carrier gasas helium (5.0) and used under a constant flow rate of 1.0 ml/min.
he injector was programmed from an initial temperature of 120 ◦Cith a rate of 10 ◦C/min to a final temperature of 320 ◦C whichas kept for 4 min. The oven temperature program was: 1 min at
0 ◦C, then increased with a rate of 8 ◦C/min to 340 ◦C which wasaintained for 2 min. Transfer line and ion source temperatureere kept constant at 300 ◦C and 180 ◦C, respectively. Electron-apture negative-ion chemical ionisation (ECNICI) was employedsing methane (5.0) as the reagent gas at a pressure of 530 Pa.
nstCo
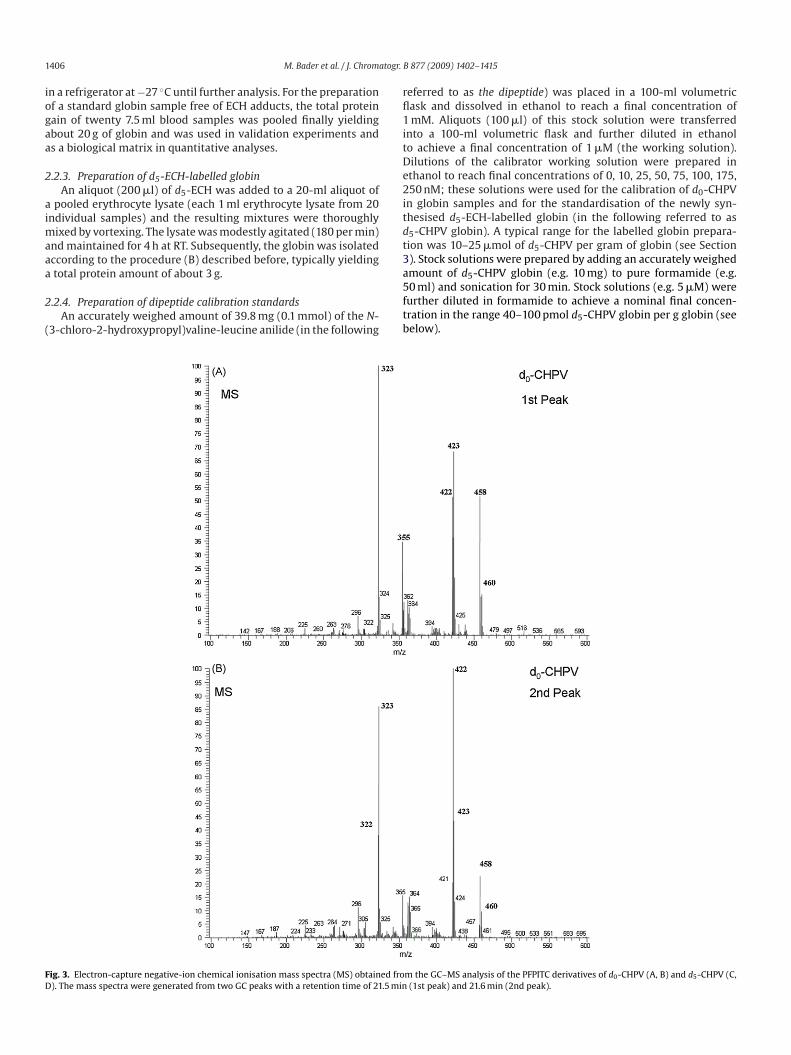
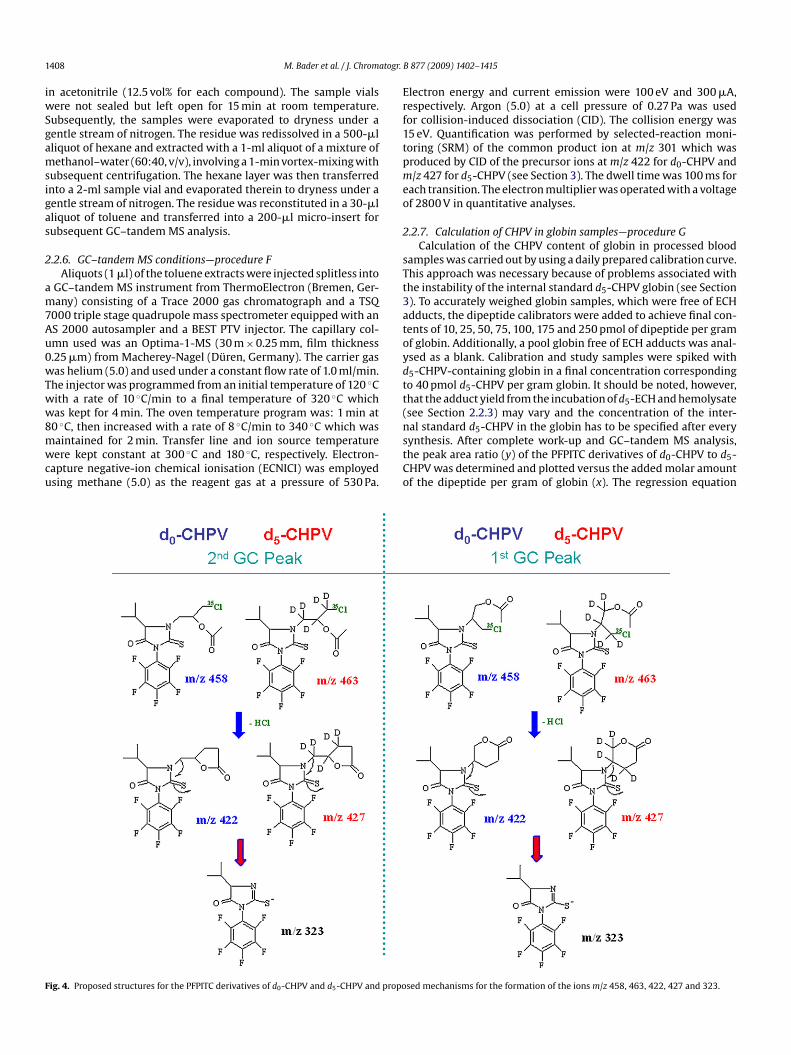
ig. 4. Proposed structures for the PFPITC derivatives of d0-CHPV and d5-CHPV and propo
B 877 (2009) 1402–1415
lectron energy and current emission were 100 eV and 300 �A,espectively. Argon (5.0) at a cell pressure of 0.27 Pa was usedor collision-induced dissociation (CID). The collision energy was5 eV. Quantification was performed by selected-reaction moni-oring (SRM) of the common product ion at m/z 301 which wasroduced by CID of the precursor ions at m/z 422 for d0-CHPV and/z 427 for d5-CHPV (see Section 3). The dwell time was 100 ms for
ach transition. The electron multiplier was operated with a voltagef 2800 V in quantitative analyses.
.2.7. Calculation of CHPV in globin samples—procedure GCalculation of the CHPV content of globin in processed blood
amples was carried out by using a daily prepared calibration curve.his approach was necessary because of problems associated withhe instability of the internal standard d5-CHPV globin (see Section). To accurately weighed globin samples, which were free of ECHdducts, the dipeptide calibrators were added to achieve final con-ents of 10, 25, 50, 75, 100, 175 and 250 pmol of dipeptide per gramf globin. Additionally, a pool globin free of ECH adducts was anal-sed as a blank. Calibration and study samples were spiked with5-CHPV-containing globin in a final concentration correspondingo 40 pmol d5-CHPV per gram globin. It should be noted, however,hat the adduct yield from the incubation of d5-ECH and hemolysatesee Section 2.2.3) may vary and the concentration of the inter-
al standard d5-CHPV in the globin has to be specified after everyynthesis. After complete work-up and GC–tandem MS analysis,he peak area ratio (y) of the PFPITC derivatives of d0-CHPV to d5-HPV was determined and plotted versus the added molar amountf the dipeptide per gram of globin (x). The regression equationsed mechanisms for the formation of the ions m/z 458, 463, 422, 427 and 323.

togr.
(utT
2
oiabtatloa
(3
3
3d
asp
F4
M. Bader et al. / J. Chroma
y = a + bx) obtained and the peak area ratio measured (y) weresed to calculate the CHPV-content of the globin (x) in the respec-ive co-processed study samples by the formula: x = (y − a)/b (seeable 1).
.2.8. Validation experimentsThe method performance was tested with respect to the limit
f detection (LOD) and the limit of quantification (LOQ) follow-ng the German guideline DIN 32 645 [36]. In this case, the LODnd LOQ values are calculated from the confidence interval at thelank in the calibration curve. The LOD is equivalent to a concen-ration that gives a signal distinct from the background noise with
probability for an �-error (wrong positive) of 1%, and of 50% forhe �-error (wrong negative). Further, the LOQ is defined as theowest concentration that can be analysed with a maximum errorf 33%. Further performance parameters tested were the intra-ssay (n = 10) and inter-assay (n = 10 different days) imprecision
lCdaa
ig. 5. Product ion mass spectra (MS/MS) from the GC–tandem MS analysis of the PFPITC27 of the second GC peak (21.6 min) were subjected to CID at a collision energy of 15 eV.
B 877 (2009) 1402–1415 1409
R.S.D., %) and accuracy (recovery, %). For more details see Section.
. Results
.1. GC–MS and GC–tandem MS characterisation of CHPV–PFPITCerivatives
GC–MS analysis of the PFPITC derivatives of synthetic d0-CHPVnd d5-CHPV in the ECNICI mode revealed each two baseline-eparated peaks with retention times of 21.5 min (i.e. the smallereak, here referred to as the first GC peak) and 21.6 min (i.e. the
arger peak, here referred to as the second GC peak), with the d5-HPV–PFPITC derivatives eluting a few seconds in front of the0-CHPV–PFPITC derivative. The mass spectra of the first (Fig. 3And C) and the second (Fig. 3B and D) GC peak of the d0-CHPVnd d5-CHPV derivatives were almost identical (Fig. 3), respectively.
derivatives of d0-CHPV (A) and d5-CHPV (B). The precursor ions at m/z 422 and m/z
1410 M. Bader et al. / J. Chromatogr. B 877 (2009) 1402–1415
F 01 (viam
Tdrisc6mmboi
woipii
Ihab
aws1mad1p
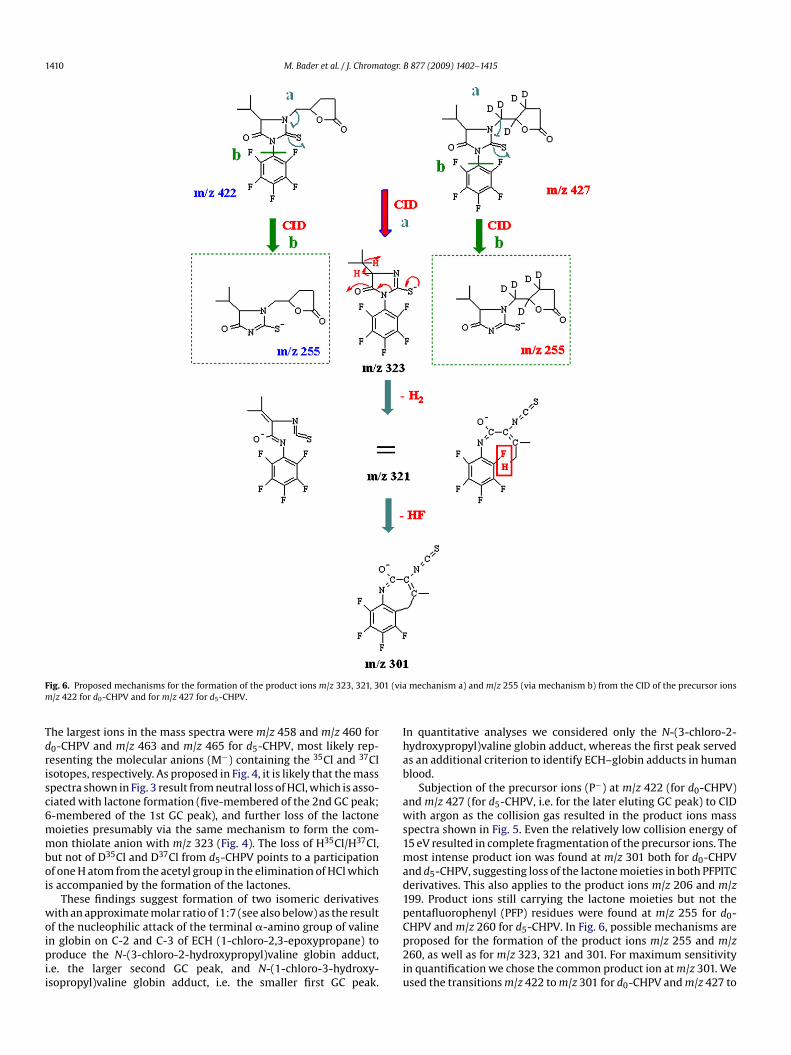
ig. 6. Proposed mechanisms for the formation of the product ions m/z 323, 321, 3/z 422 for d0-CHPV and for m/z 427 for d5-CHPV.
he largest ions in the mass spectra were m/z 458 and m/z 460 for0-CHPV and m/z 463 and m/z 465 for d5-CHPV, most likely rep-esenting the molecular anions (M−) containing the 35Cl and 37Clsotopes, respectively. As proposed in Fig. 4, it is likely that the masspectra shown in Fig. 3 result from neutral loss of HCl, which is asso-iated with lactone formation (five-membered of the 2nd GC peak;-membered of the 1st GC peak), and further loss of the lactoneoieties presumably via the same mechanism to form the com-on thiolate anion with m/z 323 (Fig. 4). The loss of H35Cl/H37Cl,
ut not of D35Cl and D37Cl from d5-CHPV points to a participationf one H atom from the acetyl group in the elimination of HCl whichs accompanied by the formation of the lactones.
These findings suggest formation of two isomeric derivativesith an approximate molar ratio of 1:7 (see also below) as the result
f the nucleophilic attack of the terminal �-amino group of valinen globin on C-2 and C-3 of ECH (1-chloro-2,3-epoxypropane) toroduce the N-(3-chloro-2-hydroxypropyl)valine globin adduct,
.e. the larger second GC peak, and N-(1-chloro-3-hydroxy-sopropyl)valine globin adduct, i.e. the smaller first GC peak.
Cp2iu
mechanism a) and m/z 255 (via mechanism b) from the CID of the precursor ions
n quantitative analyses we considered only the N-(3-chloro-2-ydroxypropyl)valine globin adduct, whereas the first peak serveds an additional criterion to identify ECH–globin adducts in humanlood.
Subjection of the precursor ions (P−) at m/z 422 (for d0-CHPV)nd m/z 427 (for d5-CHPV, i.e. for the later eluting GC peak) to CIDith argon as the collision gas resulted in the product ions mass
pectra shown in Fig. 5. Even the relatively low collision energy of5 eV resulted in complete fragmentation of the precursor ions. Theost intense product ion was found at m/z 301 both for d0-CHPV
nd d5-CHPV, suggesting loss of the lactone moieties in both PFPITCerivatives. This also applies to the product ions m/z 206 and m/z99. Product ions still carrying the lactone moieties but not theentafluorophenyl (PFP) residues were found at m/z 255 for d0-
HPV and m/z 260 for d5-CHPV. In Fig. 6, possible mechanisms areroposed for the formation of the product ions m/z 255 and m/z60, as well as for m/z 323, 321 and 301. For maximum sensitivityn quantification we chose the common product ion at m/z 301. Wesed the transitions m/z 422 to m/z 301 for d0-CHPV and m/z 427 to
M. Bader et al. / J. Chromatogr. B 877 (2009) 1402–1415 1411
F healths
mapo
3
3
t7uatdswC
gctdim
moTnbs
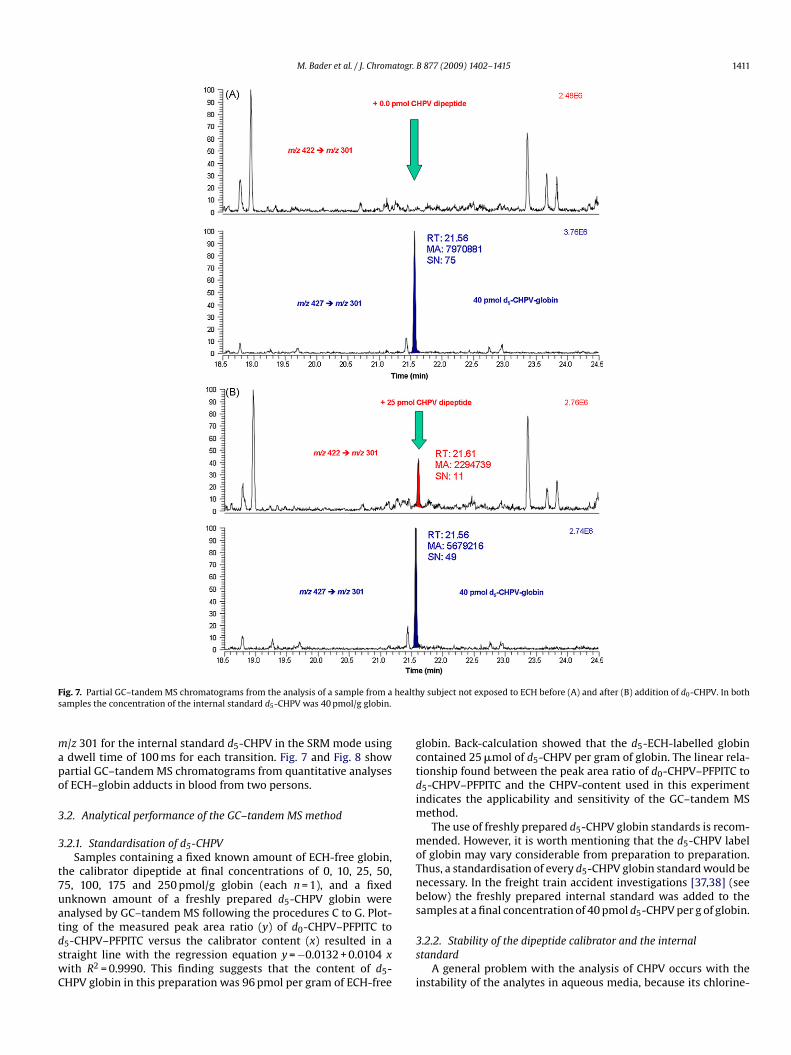
ig. 7. Partial GC–tandem MS chromatograms from the analysis of a sample from aamples the concentration of the internal standard d5-CHPV was 40 pmol/g globin.
/z 301 for the internal standard d5-CHPV in the SRM mode usingdwell time of 100 ms for each transition. Fig. 7 and Fig. 8 showartial GC–tandem MS chromatograms from quantitative analysesf ECH–globin adducts in blood from two persons.
.2. Analytical performance of the GC–tandem MS method
.2.1. Standardisation of d5-CHPVSamples containing a fixed known amount of ECH-free globin,
he calibrator dipeptide at final concentrations of 0, 10, 25, 50,5, 100, 175 and 250 pmol/g globin (each n = 1), and a fixednknown amount of a freshly prepared d5-CHPV globin werenalysed by GC–tandem MS following the procedures C to G. Plot-
ing of the measured peak area ratio (y) of d0-CHPV–PFPITC to5-CHPV–PFPITC versus the calibrator content (x) resulted in atraight line with the regression equation y = −0.0132 + 0.0104 xith R2 = 0.9990. This finding suggests that the content of d5-HPV globin in this preparation was 96 pmol per gram of ECH-free3s
i
y subject not exposed to ECH before (A) and after (B) addition of d0-CHPV. In both
lobin. Back-calculation showed that the d5-ECH-labelled globinontained 25 �mol of d5-CHPV per gram of globin. The linear rela-ionship found between the peak area ratio of d0-CHPV–PFPITC to5-CHPV–PFPITC and the CHPV-content used in this experimentndicates the applicability and sensitivity of the GC–tandem MS
ethod.The use of freshly prepared d5-CHPV globin standards is recom-
ended. However, it is worth mentioning that the d5-CHPV labelf globin may vary considerable from preparation to preparation.hus, a standardisation of every d5-CHPV globin standard would beecessary. In the freight train accident investigations [37,38] (seeelow) the freshly prepared internal standard was added to theamples at a final concentration of 40 pmol d5-CHPV per g of globin.
.2.2. Stability of the dipeptide calibrator and the internaltandard
A general problem with the analysis of CHPV occurs with thenstability of the analytes in aqueous media, because its chlorine-

1412 M. Bader et al. / J. Chromatogr. B 877 (2009) 1402–1415
F two suT t in ths
ctw[tssddcoo
(ttC
3d
ig. 8. Partial GC–tandem MS chromatograms from the analysis of blood samples ofhe CHPV adduct was detected in the blood of subject #2 (80 pmol/g globin), but notandard d5-CHPV was 40 pmol/g globin.
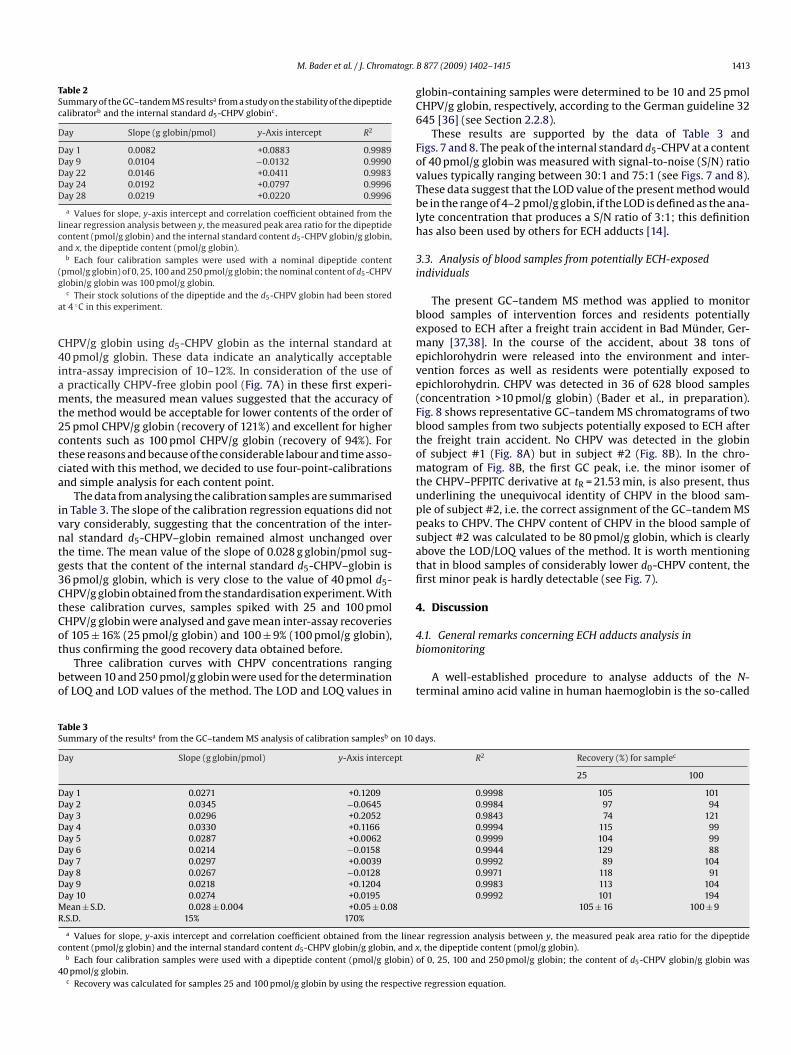
arrying methylene group is susceptible to hydrolysis. We observedhat the dipeptide both in water and in alcohol slowly degradesith time. The chlorine atom in CHPV is susceptible to hydrolysis
14] and the isotope-labelled internal standard may exchange deu-erium with hydrogen. Table 2 shows a significant increase in thelopes of calibration curves (peak area ratio d0-CHPV/d5-CHPV ver-us d0-CHPV dipeptide concentration) during a period of 4 weeks
ue to continuing losses in the concentration of the internal stan-ard stored at 4 ◦C. Therefore, in the frame of the present studyalibration standards were freshly prepared from the stock solutionf d5-CHPV globin in formamide for every single work-up. Obvi-usly, under these conditions, no considerable degradation occurs1wgd
bjects who were potentially exposed to ECH during a freight train accident [33,34].at of subject #1 (non-detectable). In both samples the concentration of the internal
Table 3). The repeated preparation of stock solutions and calibra-ion standards over a period of about 6 months did not indicatehat CHPV is degraded when the calibrator dipeptide and the d5-HPV–globin used kept dry and frozen at −27 ◦C.
.2.3. Precision, accuracy and limits of quantification andetection
The precision of the whole method was tested by analysing each0 CHPV-free globin samples from healthy unexposed subjects,hich had been spiked with 25 and 100 pmol of the dipeptide per
ram of globin. In these samples the ECH adduct concentration wasetermined to 31.8 ± 3.9 pmol CHPV/g globin and 93.7 ± 9.2 pmol
M. Bader et al. / J. Chromatogr.
Table 2Summary of the GC–tandem MS resultsa from a study on the stability of the dipeptidecalibratorb and the internal standard d5-CHPV globinc.
Day Slope (g globin/pmol) y-Axis intercept R2
Day 1 0.0082 +0.0883 0.9989Day 9 0.0104 −0.0132 0.9990Day 22 0.0146 +0.0411 0.9983Day 24 0.0192 +0.0797 0.9996Day 28 0.0219 +0.0220 0.9996
a Values for slope, y-axis intercept and correlation coefficient obtained from thelinear regression analysis between y, the measured peak area ratio for the dipeptidecontent (pmol/g globin) and the internal standard content d5-CHPV globin/g globin,and x, the dipeptide content (pmol/g globin).
b Each four calibration samples were used with a nominal dipeptide content(pmol/g globin) of 0, 25, 100 and 250 pmol/g globin; the nominal content of d -CHPVg
a
C4iamt2ctca
ivntg3CtCot
bo
gC6
FovTblh
3i
bemeve(Fbtomtuppsatfi
4
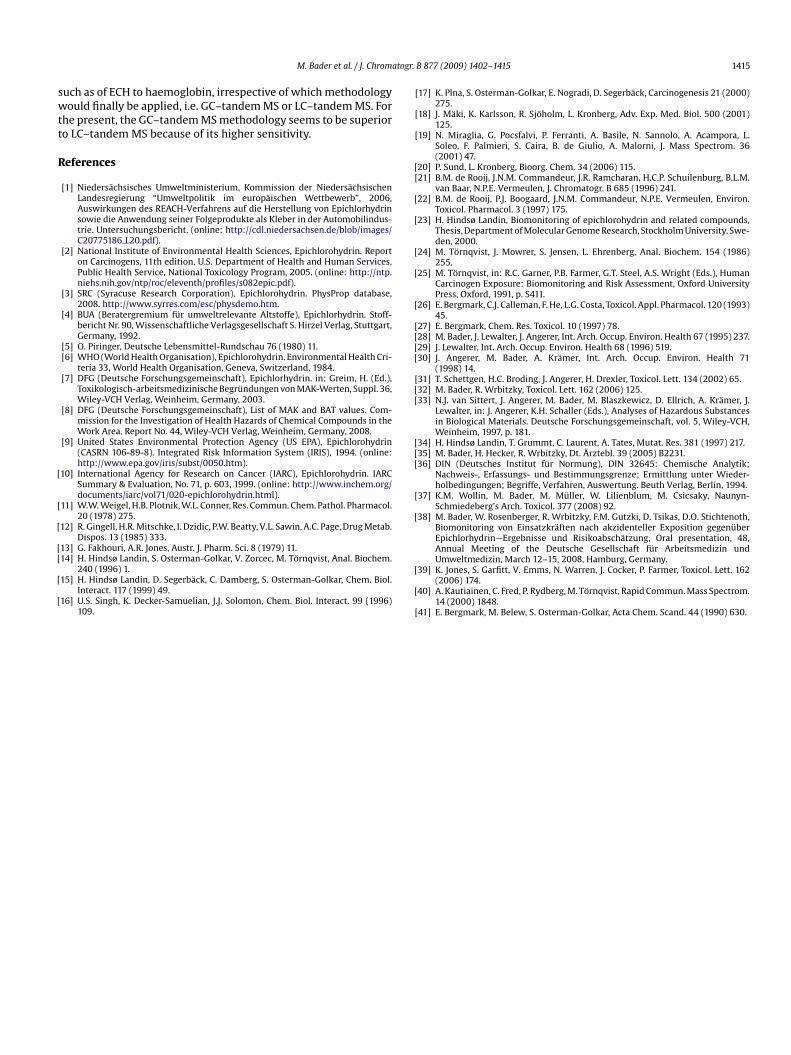
TS
D
DDDDDDDDDDMR
c
4
5
lobin/g globin was 100 pmol/g globin.c Their stock solutions of the dipeptide and the d5-CHPV globin had been stored
t 4 ◦C in this experiment.
HPV/g globin using d5-CHPV globin as the internal standard at0 pmol/g globin. These data indicate an analytically acceptable
ntra-assay imprecision of 10–12%. In consideration of the use ofpractically CHPV-free globin pool (Fig. 7A) in these first experi-ents, the measured mean values suggested that the accuracy of
he method would be acceptable for lower contents of the order of5 pmol CHPV/g globin (recovery of 121%) and excellent for higherontents such as 100 pmol CHPV/g globin (recovery of 94%). Forhese reasons and because of the considerable labour and time asso-iated with this method, we decided to use four-point-calibrationsnd simple analysis for each content point.
The data from analysing the calibration samples are summarisedn Table 3. The slope of the calibration regression equations did notary considerably, suggesting that the concentration of the inter-al standard d5-CHPV–globin remained almost unchanged overhe time. The mean value of the slope of 0.028 g globin/pmol sug-ests that the content of the internal standard d5-CHPV–globin is6 pmol/g globin, which is very close to the value of 40 pmol d5-HPV/g globin obtained from the standardisation experiment. Withhese calibration curves, samples spiked with 25 and 100 pmolHPV/g globin were analysed and gave mean inter-assay recoveries
f 105 ± 16% (25 pmol/g globin) and 100 ± 9% (100 pmol/g globin),hus confirming the good recovery data obtained before.Three calibration curves with CHPV concentrations rangingetween 10 and 250 pmol/g globin were used for the determinationf LOQ and LOD values of the method. The LOD and LOQ values in
4b
t
able 3ummary of the resultsa from the GC–tandem MS analysis of calibration samplesb on 10 d
ay Slope (g globin/pmol) y-Axis intercept
ay 1 0.0271 +0.1209ay 2 0.0345 −0.0645ay 3 0.0296 +0.2052ay 4 0.0330 +0.1166ay 5 0.0287 +0.0062ay 6 0.0214 −0.0158ay 7 0.0297 +0.0039ay 8 0.0267 −0.0128ay 9 0.0218 +0.1204ay 10 0.0274 +0.0195ean ± S.D. 0.028 ± 0.004 +0.05 ± 0.08
.S.D. 15% 170%
a Values for slope, y-axis intercept and correlation coefficient obtained from the lineontent (pmol/g globin) and the internal standard content d5-CHPV globin/g globin, and x
b Each four calibration samples were used with a dipeptide content (pmol/g globin) o0 pmol/g globin.c Recovery was calculated for samples 25 and 100 pmol/g globin by using the respectiv
B 877 (2009) 1402–1415 1413
lobin-containing samples were determined to be 10 and 25 pmolHPV/g globin, respectively, according to the German guideline 3245 [36] (see Section 2.2.8).
These results are supported by the data of Table 3 andigs. 7 and 8. The peak of the internal standard d5-CHPV at a contentf 40 pmol/g globin was measured with signal-to-noise (S/N) ratioalues typically ranging between 30:1 and 75:1 (see Figs. 7 and 8).hese data suggest that the LOD value of the present method woulde in the range of 4–2 pmol/g globin, if the LOD is defined as the ana-
yte concentration that produces a S/N ratio of 3:1; this definitionas also been used by others for ECH adducts [14].
.3. Analysis of blood samples from potentially ECH-exposedndividuals
The present GC–tandem MS method was applied to monitorlood samples of intervention forces and residents potentiallyxposed to ECH after a freight train accident in Bad Münder, Ger-any [37,38]. In the course of the accident, about 38 tons of
pichlorohydrin were released into the environment and inter-ention forces as well as residents were potentially exposed topichlorohydrin. CHPV was detected in 36 of 628 blood samplesconcentration >10 pmol/g globin) (Bader et al., in preparation).ig. 8 shows representative GC–tandem MS chromatograms of twolood samples from two subjects potentially exposed to ECH afterhe freight train accident. No CHPV was detected in the globinf subject #1 (Fig. 8A) but in subject #2 (Fig. 8B). In the chro-atogram of Fig. 8B, the first GC peak, i.e. the minor isomer of
he CHPV–PFPITC derivative at tR = 21.53 min, is also present, thusnderlining the unequivocal identity of CHPV in the blood sam-le of subject #2, i.e. the correct assignment of the GC–tandem MSeaks to CHPV. The CHPV content of CHPV in the blood sample ofubject #2 was calculated to be 80 pmol/g globin, which is clearlybove the LOD/LOQ values of the method. It is worth mentioninghat in blood samples of considerably lower d0-CHPV content, therst minor peak is hardly detectable (see Fig. 7).
. Discussion
.1. General remarks concerning ECH adducts analysis iniomonitoring
A well-established procedure to analyse adducts of the N-erminal amino acid valine in human haemoglobin is the so-called
ays.
R2 Recovery (%) for samplec
25 100
0.9998 105 1010.9984 97 940.9843 74 1210.9994 115 990.9999 104 990.9944 129 880.9992 89 1040.9971 118 910.9983 113 1040.9992 101 194
105 ± 16 100 ± 9
ar regression analysis between y, the measured peak area ratio for the dipeptide, the dipeptide content (pmol/g globin).f 0, 25, 100 and 250 pmol/g globin; the content of d5-CHPV globin/g globin was
e regression equation.

1 atogr.
“anEyCCmblo
EeEpadHboc
mocatrctHoisaata
t(ietlrgttMo
Gisintcnpfhv
ttTtamw2HroTaaad
4
tactaawihda(Gi[hb
idrMfiesiofrGLiiatpgni“
414 M. Bader et al. / J. Chrom
N-alkyl Edman degradation” (see Fig. 2), first described andpplied by Törnqvist et al. [24] as a modification of a method origi-ally invented for protein sequencing. In recent years, the modifieddman method has become a standard approach for adduct anal-sis in occupational–medical surveillance. In Germany, the Senateommission for the Investigation of Health Hazards of Chemicalompounds in the Work Area of the Deutsche Forschungsge-einschaft has evaluated altogether five exposure equivalents or
iological guidance values for N-terminal protein adducts: acry-amide, acrylonitrile, dimethyl sulphate, ethylene and ethylenexide [8].
As yet, only one attempt has been made to apply the N-alkyldman method to the analysis of ECH adducts by Hindsø Landint al. [14]. While these authors showed the presence of DHPV inCH-exposed rats, they could not detect CHPV in rat haemoglobinresumably due to analytical problems. Hindsø Landin et al. [14]ssumed that CHPV hydrolysed into DHPV under physiological con-itions but could not demonstrate this first-hand. Nevertheless,indsø Landin et al. [14] concluded that CHPV is not suitable foriomonitoring purposes, because CHPV is either unstable in vivor CHPV hydrolyses during the sample treatment under alkalineonditions.
The analysis of CHPV in human haemoglobin required someodifications of the basic Edman method for the determination
f valine adducts as first described by Törnqvist et al. [24] or ofommon applications such as the determination of acrylonitrile,crylamide and methylating chemicals [26,30–32]. In particular,he hydroxyl group in the C-2 position of the adduct moietyequires a derivatisation to avoid low extraction yields and poorhromatography. The acetylation by acetic acid anhydride andriethyl amine as applied in our approach was first suggested byindsø Landin et al. [14] for the analysis of the secondary adductf epichlorohydrin, N-(2,3-dihydroxypropyl)valine. A secondmportant difference to the original method was the use of aelf-synthesised deuterated CHPV as an internal standard. Thispproach avoids the use of radiolabelled internal standards [14,24]nd of synthetic valine adducts with a different chemical structurehan the compound of interest, which may react in a different waynd are thus not appropriate for accurate quantification.
To detect CHPV, we introduced tandem mass spectrometry, i.e.riple stage quadrupole (TSQ), instead of the single step quadrupoleSSQ) technique with electron impact or negative ion chemical ion-sation to overcome sensitivity and specificity problems. To ourxperience with the Edman method, both the complex constitu-ion of the injection samples after two derivatisation steps and theoss of analyte during the multiple extraction and washing stepsesult in a relatively low yield of CHPV and an insufficient chromato-raphic separation from co-eluting substances. Thus, we observedhat single step quadrupole MS has a relatively high limit of detec-ion for CHPV of about 100 pmol/g globin. The use of GC–tandem
S improved the sensitivity of the SSQ–CHPV method by a factorf about 10.
During the development, validation and testing of the presentC–tandem MS method we experienced that the stability of CHPV
n aqueous media is limited, as was observed from the increasinglopes of calibration curves with time. In this respect, our find-ngs are in line with those of Hindsø Landin et al. [14]. However,o degradation was observed when the calibrator dipeptide andhe d5-CHPV globin were kept dry and frozen at −80 ◦C. Also, inontrast to the observations of Hindsø Landin et al. [14], we did
ot experience loss of CHPV during the work-up of globin sam-les or degradation of CHPV–PFPITC derivatives from samples readyor injection. It has to be noted, however, that we avoided anyarsh work-up conditions and sample treatment with respect to pHalue and temperature, in particular during the multiple evapora-ibcim
B 877 (2009) 1402–1415
ion steps. We therefore think that careful sample handling duringhe whole work-up procedure is a crucial aspect of the method.his view is supported by many recent reports on the determina-ion of 3-chloro-2-hydroxypropyl adducts of ECH to DNA bases andmino acids [16–22]. Thus, the hydrolysis of the chlorine-carryingethylene group at C-3 does not seem to be an immanent, but aork-up dependent problem. The in vivo stability of the 3-chloro--hydroxypropyl adducts is largely unknown, but the results ofindsø Landin et al. [34] with S-(3-chloro-2-hydroxy)cysteine in
at haemoglobin could support the assumption that the life-timef CHPV in the body may be shorter than adducts of other toxins.his aspect should be considered in sampling strategies for CHPVnd other relatives. Also, the general recommendations for globindduct analysis of the DFG, notably the globin isolation as soons possible after sampling and the storage of the dry protein in aeep-freezer, should be observed.
.2. Quantification of CHPV in human blood by GC–tandem MS
The GC–tandem MS method described in this paper reports forhe first time the quantitative determination of ECH–haemoglobindducts of the 3-chloro-2-hydroxypropyl type in human blood. Thealibration was based on the use of a commercially available dipep-ide standard N-(3-chloro-2-hydroxypropyl)valine-leucine anilides the calibrator, and an newly synthesised stable-isotope labellednalogue, i.e. d5-CHPV, as the internal standard. The presentork demonstrates that this approach in combination with the
nherent accuracy of the tandem mass spectrometry as employedere, notably the use of the strongly electron-capturing PFPITCerivative of CHPV alongside ECNICI, allows for a highly accuratend sensitive quantification of the ECH–haemoglobin adduct N-3-chloro-2-hydroxypropyl)valine in human blood. By using thisC–tandem MS method, we were successful in determining CHPV
n potentially ECH-exposed individuals during a train accident37,38]. On the basis of our results, we propose N-(3-chloro-2-ydroxypropyl)valine in human blood as a suitable and specificiomarker to monitor the exposure of individuals to ECH.
It is worth mentioning that the GC–MS methodology, whichs by nature less specific than the GC–tandem MS methodology,id not allow for accurate quantification of CHPV, as observed byepeated consecutive analysis of the real samples by GC–tandemS and GC–MS (data not shown). The drastically increased speci-
city and sensitivity resulting from CID in the GC–tandem MSfficiently compensates the analytical background. At present, iteems that the GC–tandem MS methodology as used in our studys the single method that can be used for accurate quantificationf ECH adducts in human blood. In general, the Edman methodor CHPV is considerably laborious and time-consuming due to theequired extraction and washing steps, an aspect that makes theC–tandem MS method unfavourable for routine analysis [39]. TheC–tandem MS is increasingly used for the quantitative analysisn biological samples of endogenous and exogenous compoundsncluding drugs and their metabolites. Thus, it might provide anlternative for the GC–tandem MS methodology in the quantifica-ion of adducts of toxicants such as ECH to biomolecules includingroteins [40]. However, this remains to be demonstrated for CHPVlobin. Nevertheless, in consideration of the high molar excess ofative “non-adducted” proteins over the “adducted” proteins, for
nstance 50 pmol/g globin which corresponds to about only oneadducted” molecule per one million “non-adducted” molecules,
t is highly questionable that authentic “adducted” proteins coulde measured in the presence of their precursors without pre-eding sample preparation, e.g. by affinity chromatography oron-exchange chromatography [41]. In our opinion, the Edmanethod will be indispensable in the quantitative analysis of adducts
togr.
swtt
R
[
[
[
[[
[
[
[
[
[
[[
[
[
[
[
[
[[[[
[[[
[[[
[
[
M. Bader et al. / J. Chroma
uch as of ECH to haemoglobin, irrespective of which methodologyould finally be applied, i.e. GC–tandem MS or LC–tandem MS. For
he present, the GC–tandem MS methodology seems to be superioro LC–tandem MS because of its higher sensitivity.
eferences
[1] Niedersächsisches Umweltministerium, Kommission der NiedersächsischenLandesregierung “Umweltpolitik im europäischen Wettbewerb”, 2006,Auswirkungen des REACH-Verfahrens auf die Herstellung von Epichlorhydrinsowie die Anwendung seiner Folgeprodukte als Kleber in der Automobilindus-trie. Untersuchungsbericht. (online: http://cdl.niedersachsen.de/blob/images/C20775186 L20.pdf).
[2] National Institute of Environmental Health Sciences, Epichlorohydrin. Reporton Carcinogens, 11th edition, U.S. Department of Health and Human Services,Public Health Service, National Toxicology Program, 2005. (online: http://ntp.niehs.nih.gov/ntp/roc/eleventh/profiles/s082epic.pdf).
[3] SRC (Syracuse Research Corporation), Epichlorohydrin. PhysProp database,2008. http://www.syrres.com/esc/physdemo.htm.
[4] BUA (Beratergremium für umweltrelevante Altstoffe), Epichlorhydrin. Stoff-bericht Nr. 90, Wissenschaftliche Verlagsgesellschaft S. Hirzel Verlag, Stuttgart,Germany, 1992.
[5] O. Piringer, Deutsche Lebensmittel-Rundschau 76 (1980) 11.[6] WHO (World Health Organisation), Epichlorohydrin. Environmental Health Cri-
teria 33, World Health Organisation, Geneva, Switzerland, 1984.[7] DFG (Deutsche Forschungsgemeinschaft), Epichlorhydrin. in: Greim, H. (Ed.),
Toxikologisch-arbeitsmedizinische Begründungen von MAK-Werten, Suppl. 36,Wiley-VCH Verlag, Weinheim, Germany, 2003.
[8] DFG (Deutsche Forschungsgemeinschaft), List of MAK and BAT values. Com-mission for the Investigation of Health Hazards of Chemical Compounds in theWork Area. Report No. 44, Wiley-VCH Verlag, Weinheim, Germany, 2008.
[9] United States Environmental Protection Agency (US EPA), Epichlorohydrin(CASRN 106-89-8). Integrated Risk Information System (IRIS), 1994. (online:http://www.epa.gov/iris/subst/0050.htm).
10] International Agency for Research on Cancer (IARC), Epichlorohydrin. IARCSummary & Evaluation, No. 71, p. 603, 1999. (online: http://www.inchem.org/documents/iarc/vol71/020-epichlorohydrin.html).
11] W.W. Weigel, H.B. Plotnik, W.L. Conner, Res. Commun. Chem. Pathol. Pharmacol.20 (1978) 275.
12] R. Gingell, H.R. Mitschke, I. Dzidic, P.W. Beatty, V.L. Sawin, A.C. Page, Drug Metab.Dispos. 13 (1985) 333.
13] G. Fakhouri, A.R. Jones, Austr. J. Pharm. Sci. 8 (1979) 11.
14] H. Hindsø Landin, S. Osterman-Golkar, V. Zorcec, M. Törnqvist, Anal. Biochem.240 (1996) 1.15] H. Hindsø Landin, D. Segerbäck, C. Damberg, S. Osterman-Golkar, Chem. Biol.
Interact. 117 (1999) 49.16] U.S. Singh, K. Decker-Samuelian, J.J. Solomon, Chem. Biol. Interact. 99 (1996)
109.
[
[
[
B 877 (2009) 1402–1415 1415
17] K. Plna, S. Osterman-Golkar, E. Nogradi, D. Segerbäck, Carcinogenesis 21 (2000)275.
18] J. Mäki, K. Karlsson, R. Sjöholm, L. Kronberg, Adv. Exp. Med. Biol. 500 (2001)125.
19] N. Miraglia, G. Pocsfalvi, P. Ferranti, A. Basile, N. Sannolo, A. Acampora, L.Soleo, F. Palmieri, S. Caira, B. de Giulio, A. Malorni, J. Mass Spectrom. 36(2001) 47.
20] P. Sund, L. Kronberg, Bioorg. Chem. 34 (2006) 115.21] B.M. de Rooij, J.N.M. Commandeur, J.R. Ramcharan, H.C.P. Schuilenburg, B.L.M.
van Baar, N.P.E. Vermeulen, J. Chromatogr. B 685 (1996) 241.22] B.M. de Rooij, P.J. Boogaard, J.N.M. Commandeur, N.P.E. Vermeulen, Environ.
Toxicol. Pharmacol. 3 (1997) 175.23] H. Hindsø Landin, Biomonitoring of epichlorohydrin and related compounds,
Thesis, Department of Molecular Genome Research, Stockholm University, Swe-den, 2000.
24] M. Törnqvist, J. Mowrer, S. Jensen, L. Ehrenberg, Anal. Biochem. 154 (1986)255.
25] M. Törnqvist, in: R.C. Garner, P.B. Farmer, G.T. Steel, A.S. Wright (Eds.), HumanCarcinogen Exposure: Biomonitoring and Risk Assessment, Oxford UniversityPress, Oxford, 1991, p. S411.
26] E. Bergmark, C.J. Calleman, F. He, L.G. Costa, Toxicol. Appl. Pharmacol. 120 (1993)45.
27] E. Bergmark, Chem. Res. Toxicol. 10 (1997) 78.28] M. Bader, J. Lewalter, J. Angerer, Int. Arch. Occup. Environ. Health 67 (1995) 237.29] J. Lewalter, Int. Arch. Occup. Environ. Health 68 (1996) 519.30] J. Angerer, M. Bader, A. Krämer, Int. Arch. Occup. Environ. Health 71
(1998) 14.31] T. Schettgen, H.C. Broding, J. Angerer, H. Drexler, Toxicol. Lett. 134 (2002) 65.32] M. Bader, R. Wrbitzky, Toxicol. Lett. 162 (2006) 125.33] N.J. van Sittert, J. Angerer, M. Bader, M. Blaszkewicz, D. Ellrich, A. Krämer, J.
Lewalter, in: J. Angerer, K.H. Schaller (Eds.), Analyses of Hazardous Substancesin Biological Materials. Deutsche Forschungsgemeinschaft, vol. 5, Wiley-VCH,Weinheim, 1997, p. 181.
34] H. Hindsø Landin, T. Grummt, C. Laurent, A. Tates, Mutat. Res. 381 (1997) 217.35] M. Bader, H. Hecker, R. Wrbitzky, Dt. Ärztebl. 39 (2005) B2231.36] DIN (Deutsches Institut für Normung), DIN 32645: Chemische Analytik;
Nachweis-, Erfassungs- und Bestimmungsgrenze; Ermittlung unter Wieder-holbedingungen; Begriffe, Verfahren, Auswertung. Beuth Verlag, Berlin, 1994.
37] K.M. Wollin, M. Bader, M. Müller, W. Lilienblum, M. Csicsaky, Naunyn-Schmiedeberg’s Arch. Toxicol. 377 (2008) 92.
38] M. Bader, W. Rosenberger, R. Wrbitzky, F.M. Gutzki, D. Tsikas, D.O. Stichtenoth,Biomonitoring von Einsatzkräften nach akzidenteller Exposition gegenüberEpichlorhydrin—Ergebnisse und Risikoabschätzung, Oral presentation, 48,Annual Meeting of the Deutsche Gesellschaft für Arbeitsmedizin und
Umweltmedizin, March 12–15, 2008, Hamburg, Germany.39] K. Jones, S. Garfitt, V. Emms, N. Warren, J. Cocker, P. Farmer, Toxicol. Lett. 162(2006) 174.
40] A. Kautiainen, C. Fred, P. Rydberg, M. Törnqvist, Rapid Commun. Mass Spectrom.14 (2000) 1848.
41] E. Bergmark, M. Belew, S. Osterman-Golkar, Acta Chem. Scand. 44 (1990) 630.