Quantification and visualization of periglacial surface ... · 10th ICA Mountain Cartography...
28
10th ICA Mountain Cartography Workshop Viktor Kaufmann 1/28 Quantification and visualization of periglacial surface deformation in the Inneres Hochebenkar cirque, Ötztal Alps, Austria Viktor Kaufmann Institute of Geodesy Graz University of Technology Steyrergasse 30 A-8010 Graz, Austria E-mail: [email protected] http://www.geoimaging.tugraz.at/viktor.kaufmann/ Panorama: Obergurgl, Rotmoos valley, Äußeres Hochebenkar cirque, Gurgler Ferner V. Kaufmann, 10.8.2008
Transcript of Quantification and visualization of periglacial surface ... · 10th ICA Mountain Cartography...

10th ICA Mountain Cartography Workshop Viktor Kaufmann1/28
Quantification and visualization of periglacial surface deformation in the Inneres Hochebenkar cirque,Ötztal Alps, Austria
Viktor KaufmannInstitute of GeodesyGraz University of TechnologySteyrergasse 30A-8010 Graz, Austria
E-mail: [email protected] http://www.geoimaging.tugraz.at/viktor.kaufmann/
Panorama: Obergurgl, Rotmoos valley, Äußeres Hochebenkar cirque, Gurgler FernerV. Kaufmann, 10.8.2008

10th ICA Mountain Cartography Workshop Viktor Kaufmann2/28
Contents
1. Introduction2. Study area3. Previous work4. Data acquisition5. Methods6. Results7. Discussion
Quantification and visualization of periglacial surface deformationin the Inneres Hochebenkar cirque, Ötztal Alps, Austria

10th ICA Mountain Cartography Workshop Viktor Kaufmann3/28
Quantification and visualization of periglacial surface deformationin the Inneres Hochebenkar cirque, Ötztal Alps, Austria1. Introduction
Climate change has significant influence on the Earth’s cryosphere.
Atmospheric warming during the last 150 years has caused strong glacier recession and also permafrost degradation.
Mountain/alpine permafrost
Ötztal Alps, Austria
Äußeres Hochebenkar cirque (rock glacier)
Austria’s prime rock glacier
It is well-known for its long record of continuous photogrammetric and geodetic measurements.
Inneres Hochebenkar cirque (rock glacier & glacier)
Haeberli and Patzelt (1982), Krainer et al. (2015)
The main focus of the present paper is to document the past and the more recent surface change of the periglacial (= non-glaciated) environment of the Inneres Hochebenkar cirque.

10th ICA Mountain Cartography Workshop Viktor Kaufmann4/28
Quantification and visualization of periglacial surface deformationin the Inneres Hochebenkar cirque, Ötztal Alps, Austria2. Study area
Inneres Hochebenkar cirque
Orthophoto, 11.9.2010© Land Tirol

10th ICA Mountain Cartography Workshop Viktor Kaufmann5/28
Quantification and visualization of periglacial surface deformationin the Inneres Hochebenkar cirque, Ötztal Alps, Austria2. Study area
Inneres Hochebenkar cirque Inneres Hochebenkar rock glacier
Photo taken on31.8.2015by A. Kleb.

10th ICA Mountain Cartography Workshop Viktor Kaufmann6/28
Virtual overflight
Inneres Hochebenkarcirque/rock glacier
Quantification and visualization of periglacial surface deformationin the Inneres Hochebenkar cirque, Ötztal Alps, Austria2. Study area
Aerial photograph© BEV, Vienna
Source:Kaufmann & Plösch (1999, 2001)http://www.geoimaging.tugraz.at/viktor.kaufmann/animations.html

10th ICA Mountain Cartography Workshop Viktor Kaufmann7/28
Permafrost studies
Quantification and visualization of periglacial surface deformationin the Inneres Hochebenkar cirque, Ötztal Alps, Austria3. Previous work
Haeberli and Patzelt (1982)
Source: Haeberli & Patzelt (1982)
10th ICA Mountain Cartography Workshop Viktor Kaufmann8/28
Permafrost studies
Quantification and visualization of periglacial surface deformationin the Inneres Hochebenkar cirque, Ötztal Alps, Austria3. Previous work
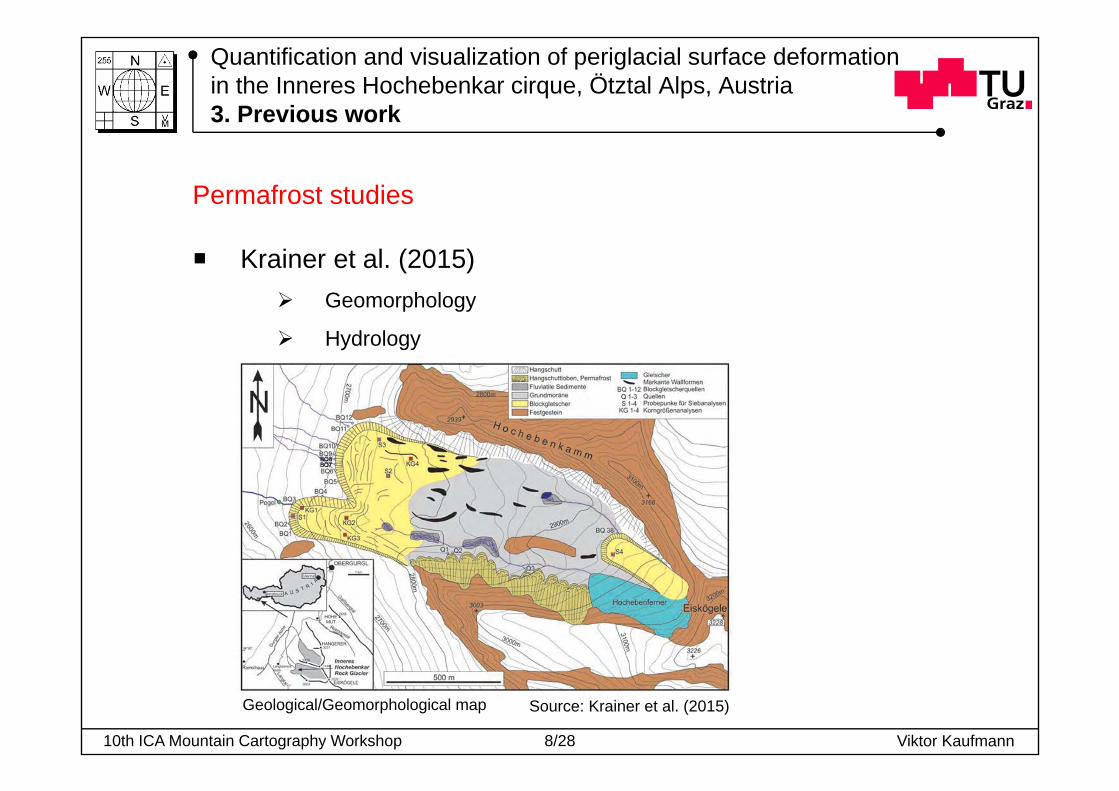
Krainer et al. (2015) Geomorphology
Hydrology
Geological/Geomorphological map Source: Krainer et al. (2015)

10th ICA Mountain Cartography Workshop Viktor Kaufmann9/28
Supporting maps
Quantification and visualization of periglacial surface deformationin the Inneres Hochebenkar cirque, Ötztal Alps, Austria3. Previous work
'Dritte Landesaufnahme' 1864-1887 (survey 1870-1873)

10th ICA Mountain Cartography Workshop Viktor Kaufmann10/28
Supporting maps
Quantification and visualization of periglacial surface deformationin the Inneres Hochebenkar cirque, Ötztal Alps, Austria3. Previous work
Map 'Ötztaler Alpen, Blatt Gurgl' 1:25,000 (photogrammetric survey 1936),published in 1949 by the Austrian Alpine Club.

10th ICA Mountain Cartography Workshop Viktor Kaufmann11/28
Supporting maps
Quantification and visualization of periglacial surface deformationin the Inneres Hochebenkar cirque, Ötztal Alps, Austria3. Previous work
Map ‘Gurgler Ferner 1981’ 1:10,000 (published in 1986) Source: Patzelt (1986)

10th ICA Mountain Cartography Workshop Viktor Kaufmann12/28
Measurement of flow velocity
Quantification and visualization of periglacial surface deformationin the Inneres Hochebenkar cirque, Ötztal Alps, Austria3. Previous work
Terrestrial photogrammetry (Pillewizer, 1957; Vietories, 1972) Surveys 1953/1955 by W. Pillewizer
- frontal slope of the southern unit- mean annual flow velocity of 1.10 m a-1
Surveys 1959/1966 by E. Dorrer- stable rock outcrop at 2800 m- no movements were detected
Satellite radar interferometry (Rott & Siegl, 1999) ERS-1/2 SAR images (two interferometric pairs in July/August 1995)
two separate moving units were detected; calculated displacements rates were several centimeters within the 35 days repeat cycle
Aerial photogrammetry (Kaufmann & Ladstädter, 2002) stringent photogrammetric approach
time period 1953-1997 (max. flow velocity of 55/49 cm a-1)

10th ICA Mountain Cartography Workshop Viktor Kaufmann13/28
Aerial surveys 1953-2010
Quantification and visualization of periglacial surface deformationin the Inneres Hochebenkar cirque, Ötztal Alps, Austria4. Data acquisition
DateFlying height above ground
(m)
Camera type Scale/ GSD* Remark
31.8.1953 3250 analog 1 : 15,450 B&W7.10.1969 4430 analog 1 : 29,150 B&W7.9.1981 2930 analog 1 : 19,150 B&W
10.10.1990 5240 analog 1 : 34,300 B&W, snow cover
11.9.1997 5580 analog 1 : 36,550 B&W
5.9.2003 5360 analog 1 : 17,650 color-positive
11.9.2010 2810 digital 17* cm R,G,B, NIR* GSD … ground sampling distance

10th ICA Mountain Cartography Workshop Viktor Kaufmann14/28
Aerial surveys 1953/2003
Quantification and visualization of periglacial surface deformationin the Inneres Hochebenkar cirque, Ötztal Alps, Austria4. Data acquisition
Computer animation: Orthophotos 1953/2003 Data 1953: © BEV, ViennaData 2003: © Land Tirol
10th ICA Mountain Cartography Workshop Viktor Kaufmann15/28
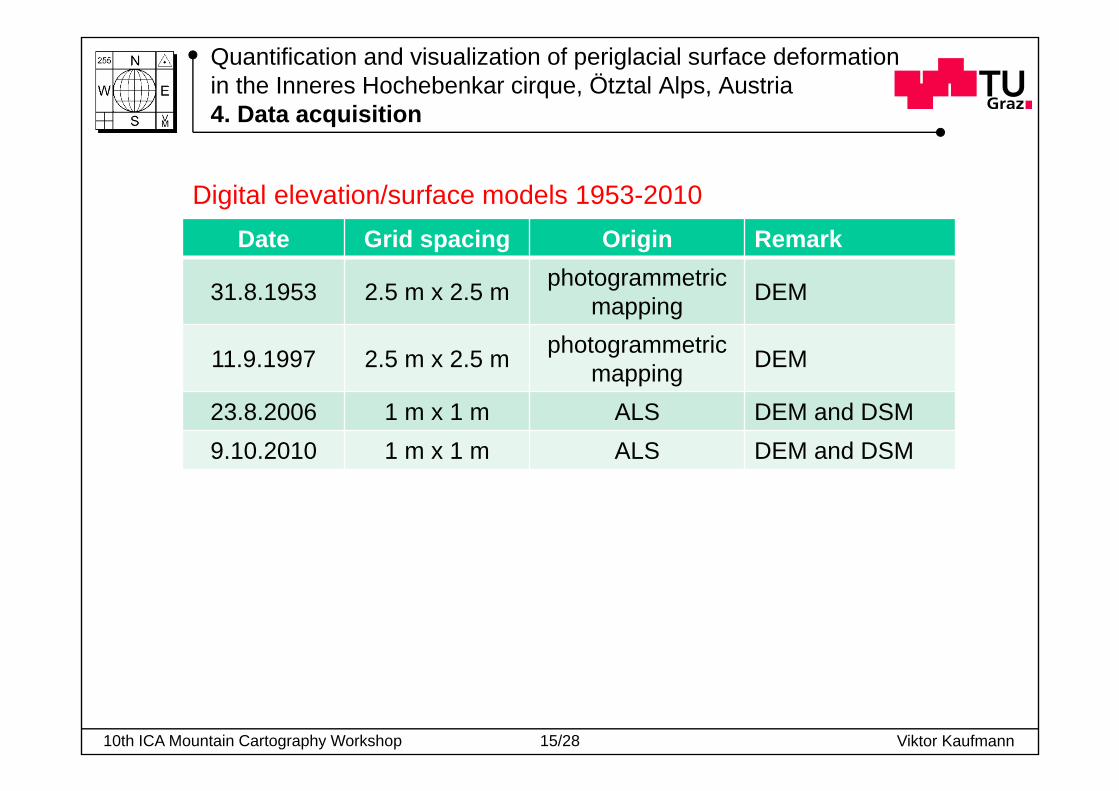
Digital elevation/surface models 1953-2010
Quantification and visualization of periglacial surface deformationin the Inneres Hochebenkar cirque, Ötztal Alps, Austria4. Data acquisition
Date Grid spacing Origin Remark
31.8.1953 2.5 m x 2.5 m photogrammetric mapping DEM
11.9.1997 2.5 m x 2.5 m photogrammetric mapping DEM
23.8.2006 1 m x 1 m ALS DEM and DSM9.10.2010 1 m x 1 m ALS DEM and DSM
10th ICA Mountain Cartography Workshop Viktor Kaufmann16/28
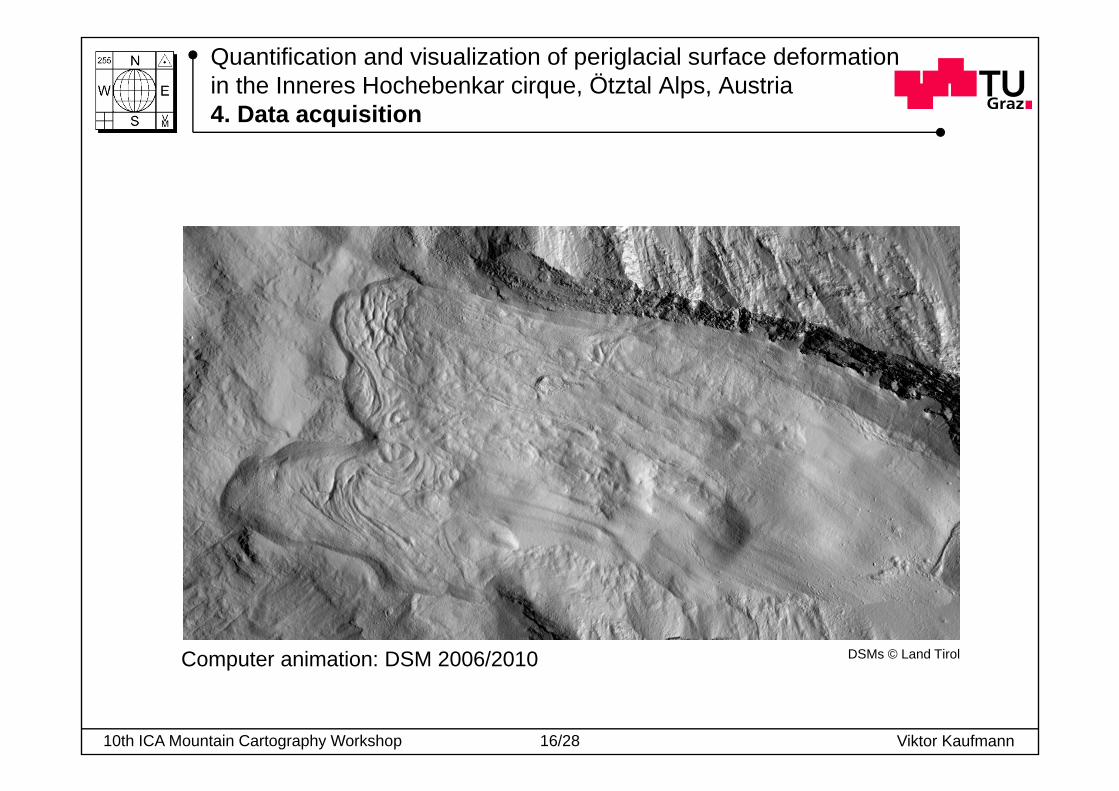
Quantification and visualization of periglacial surface deformationin the Inneres Hochebenkar cirque, Ötztal Alps, Austria4. Data acquisition
Computer animation: DSM 2006/2010 DSMs © Land Tirol

10th ICA Mountain Cartography Workshop Viktor Kaufmann17/28
Measurement of flow velocity
Quantification and visualization of periglacial surface deformationin the Inneres Hochebenkar cirque, Ötztal Alps, Austria5. Methods
Image-based change detection ImageStation of Intergraph (Orthophotos, DEMs)
Image matching (normalized cross-correlation coefficient)
Matlab-based toolbox
DEM/DSM-based change detection Height field matching (normalized cross-correlation coefficient)

10th ICA Mountain Cartography Workshop Viktor Kaufmann18/28
Quantification and visualization of periglacial surface deformationin the Inneres Hochebenkar cirque, Ötztal Alps, Austria5. Methods
Image data© BEV, Vienna
1953 1969
mappingarea
Orthophoto, 1953
InneresHochebenkar
cirque
Orthophoto, 1969
DEM1953
10th ICA Mountain Cartography Workshop Viktor Kaufmann19/28
Quantification and visualization of periglacial surface deformationin the Inneres Hochebenkar cirque, Ötztal Alps, Austria5. Methods
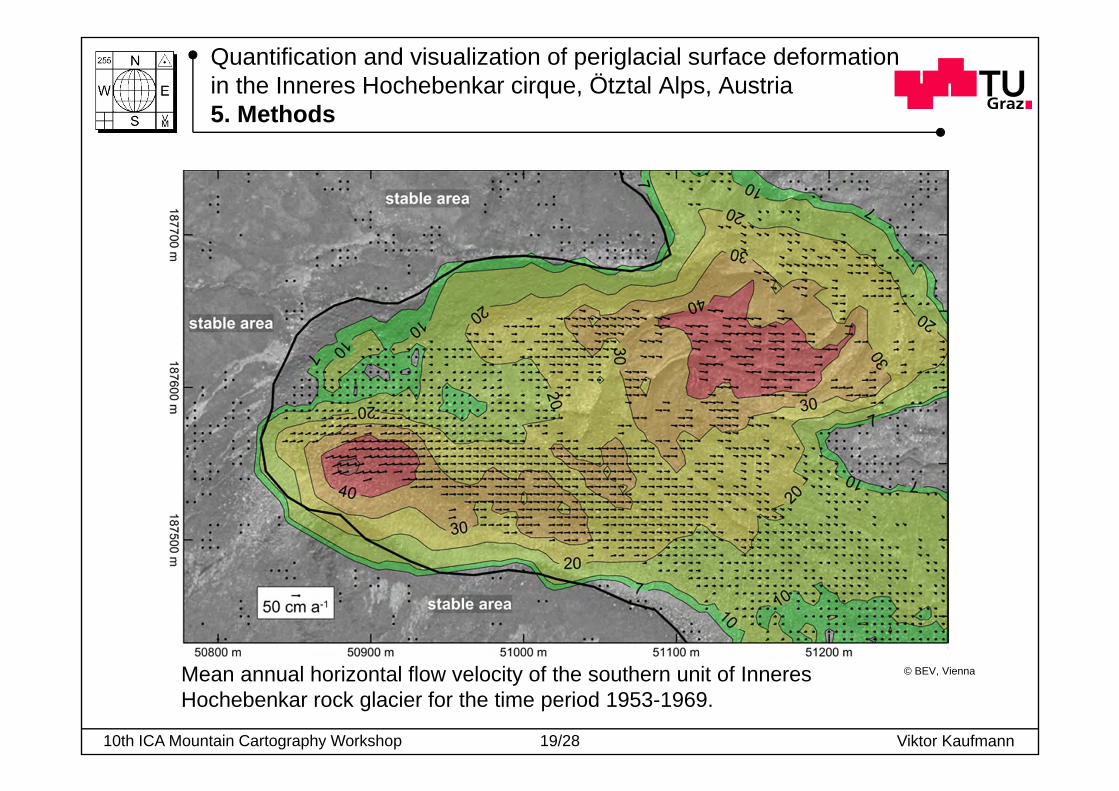
© BEV, ViennaMean annual horizontal flow velocity of the southern unit of InneresHochebenkar rock glacier for the time period 1953-1969.

10th ICA Mountain Cartography Workshop Viktor Kaufmann20/28
Horizontal flow velocity
Quantification and visualization of periglacial surface deformationin the Inneres Hochebenkar cirque, Ötztal Alps, Austria5. Results
Timeinterval
No. of validmeasurements
Significance level+ of flow velocity (cm a-1)
Max. flowvelocity (cm a-1) –
northern unit
Max. flowvelocity (cm a-1) –
southern unit
1953-2010 12009 ±2.5 36.4 36.7
1953-1969 10625 ±7.0 56.5 52.7
1969-1981 10390 ±10.0 34.0 37.8
1981-1997 19456 ±6.5 31.8 39.8
1981-1990 9921 ±8.5 26.2 39.5
1990-1997 too few points --- --- ---
1997-2010 24293 ±7.0 33.1 40.1
2003-2010 29279 ±10.0 32.9 46.7
2006-2010* 10556 ±8.5 24.6 57.2+ … 3 … snow cover* … evaluation of DSMs

10th ICA Mountain Cartography Workshop Viktor Kaufmann21/28
Horizontal flow velocity
Quantification and visualization of periglacial surface deformationin the Inneres Hochebenkar cirque, Ötztal Alps, Austria5. Results
Mean annual horizontal flow velocity for the time period 1953-2010,isotachs (cm a-1), significance level at 2.5 cm a-1 (3).
© BEV, Vienna

10th ICA Mountain Cartography Workshop Viktor Kaufmann22/28
Horizontal flow velocity
Quantification and visualization of periglacial surface deformationin the Inneres Hochebenkar cirque, Ötztal Alps, Austria5. Results
Mean annual horizontal flow velocity for the time period 1953-1969,isotachs (cm a-1), significance level at 7 cm a-1 (3).
© BEV, Vienna

10th ICA Mountain Cartography Workshop Viktor Kaufmann23/28
Horizontal flow velocity
Quantification and visualization of periglacial surface deformationin the Inneres Hochebenkar cirque, Ötztal Alps, Austria5. Results
Mean annual horizontal flow velocity for the time period 1997-2010,isotachs (cm a-1), significance level at 7 cm a-1 (3).
© BEV, Vienna

10th ICA Mountain Cartography Workshop Viktor Kaufmann24/28
Horizontal flow velocity
Quantification and visualization of periglacial surface deformationin the Inneres Hochebenkar cirque, Ötztal Alps, Austria5. Results
Mean annual horizontal flow velocity for the time period 2003-2010,isotachs (cm a-1), significance level at 10 cm a-1 (3).
© Land Tirol

10th ICA Mountain Cartography Workshop Viktor Kaufmann25/28
Horizontal flow velocity (DSM-based change detection)
Quantification and visualization of periglacial surface deformationin the Inneres Hochebenkar cirque, Ötztal Alps, Austria5. Results
Mean annual horizontal flow velocity for the time period 2006-2010,isotachs (cm a-1), significance level at 8.5 cm a-1 (3).
© Land Tirol

10th ICA Mountain Cartography Workshop Viktor Kaufmann26/28
Surface elevation change
Quantification and visualization of periglacial surface deformationin the Inneres Hochebenkar cirque, Ötztal Alps, Austria5. Results
Surface elevation change for the time period 1953-2006,significance level at ±1.3 m (3).

10th ICA Mountain Cartography Workshop Viktor Kaufmann27/28
Quantification and visualization of periglacial surface deformationin the Inneres Hochebenkar cirque, Ötztal Alps, Austria6. Discussion
The lower part of Inneres Hochebenkar cirque holds two independently moving parts, i.e.,the northern and southern unit of Inneres Hochebenkar rock glacier.
Highest flow velocities (1.10 m a-1) of Inneres Hochebenkar rock glacier were measured byPillewizer at the southern unit in the time period 1953-1955. In the overlapping observationperiod 1953-1969 the flow velocity has already decreased significantly. Maximum flow velocities hardly surpassed 50 cm a-1. In the course of time the northern unit has reduced itsspeed more than the southern unit. A recent speed-up of the movement of the southern unit is speculative.
Permafrost degradation/melt at Inneres Hochebenkar rock glacier is ratherdifficult to quantify.
However, we found some strong indication that the lower (non-moving) end part connecting both moving units has undergone substantial surface lowering (2.0-4.7 m in 1953-1997).
Dense image matching will allow the automatic generation of high-resolution DEMs. Thus, true orthophotos can be obtained more easily.
The potential of the available multi-temporal ALS data could not be fully exploited because of obvious geometric problems in fusing both data sets.

10th ICA Mountain Cartography Workshop Viktor Kaufmann28/28
Quantification and visualization of periglacial surface deformationin the Inneres Hochebenkar cirque, Ötztal Alps, Austria
Thank you for your attention!
V. Kaufmann, 10.8.2008