Visualization and Quantification of Blood Flow in the ...
31
Visualization and Quantification of Blood Flow in the Human Aorta. From in vivo 4D Phase Contrast MRI to Subject-Specific Computational Hemodynamics Umberto Morbiducci Industrial Bioengineering Group Department of Mechanics, Politecnico di Torino, Italy
Transcript of Visualization and Quantification of Blood Flow in the ...

Visualization and Quantification of Blood Flow
in the Human Aorta.
From in vivo 4D Phase Contrast MRI
to Subject-Specific Computational Hemodynamics
Umberto Morbiducci
Industrial Bioengineering Group
Department of Mechanics, Politecnico di Torino, Italy

Umberto Morbiducci
Outline
In vivo 4D PC MRI measurements of healthy human aortic flows
- In vivo quantitative analysis of aortic helical blood flow
- Subject-specific models of aortic hemodynamics using
individual not invasively measured flow conditions at
boundaries:
- PC MRI measured flow rate waveforms as BCs
- 3D PC MRI measured velocity profiles as BCs (preliminary results)

Umberto Morbiducci
R Ponzini, G Rizzo, M Cadioli, A Esposito, FM Montevecchi, A Redaelli
Politecnico di Torino, Italy
CILEA, Italy
Institute H S. Raffaele, Italy
Politecnico di Milano, Italy
IBFM CNR, Italy
Philips Medical Systems, Italy
SECTION I
Insight into the Physiological Relevance
of Helical Blood Flow in the Human Aorta.
An in vivo study

Umberto Morbiducci
Blood flow in the aorta is highly complex
In the past massive observations demonstrated
Background
• that helical flows predominate
in areas from the ascending
aorta to the aortic arch(Segadal & Matre, 1987; Kilner et al., 1993;
Chandran 1993)
• that this form of blood flow is
a basic pattern for almost all the
subjects no matter age and
gender
(Bogren & Buonocore, 1999; Houston et al., 2003)
Kilner et al. Circulation 1993
Reference Framework
It has been proposed that energetic constraint is but one consequence
of the process of physiological evolution of helical blood flow in aorta,
and that others remain to be discovered.
Qualitative Observations
NOT QUANTITATIVE
However, there is a relative paucity of quantitative data regarding helical
blood flow dynamics in the human aorta.
Umberto Morbiducci

Umberto Morbiducci
Rationale, Aim, How
Rationale
Study of mechanistic relationship between physiological complexity and energy of
aortic flow
Aim
Identify common features in physiological aortic
bulk flow
HowIn vivo aortic helical flow quantification in healthy humans
by applying 4D PC MRI
By using a Lagrangian representation of the aortic flow, we apply an index for
helical flow quantification
Umberto Morbiducci
Theoretical Remarks on Helicity
A better understanding of the role of pitch and torsion in blood flow development
can be obtained through helicity, a scalar eligible to study relationships between complexity and energy.
Like energy, helicity influences evolution and stability of both turbulent and
laminar flows (Moffatt and Tsinober, 1992).
Helicity related to the reduction of non-linear processes responsible for transfer
and redistribution of energy through various scales, and hence energy dissipation
Roughly speaking, helicity gives measure of alignment of velocity and vorticity

Umberto Morbiducci
Helical Flow Index - HFI
Hv(s; t) = V � (∇ x V) = V(s; t) � ω(s; t)
( ) ( ) ( )( ) ( )t;t;
t;t;t;
sωsV
sωsVsLNH
•= -1≤ LNH ≤1
ends up with:
Morbiducci et al. J Biomech 2007Morbiducci et al. Ann Biomed Eng 2009Morbiducci et al. Ann Biomed Eng 2010Morbiducci et al. Biomech Mod Mechanobiol 2011
begins with:
0 ≤ HFI ≤ 1
ends up with:
∑∫∑==
=−
=p
endk
startk
p N
k
k
p
t
t
k
N
kstart
k
end
kp
hfiN
dttN 11
1)(LNH
)(
11HFI ςς
LAGRANGIAN
ANALYSIS

Results – Acquired PC MRI Data
Umberto Morbiducci
3C velocity map frames (phase I, II, and III) on a plane aligned with the aortic arch, viewed from the left. Brightness is proportional to signal intensity
Morbiducci et al. Biomech Mod Mechanobiol 2011
Umberto Morbiducci
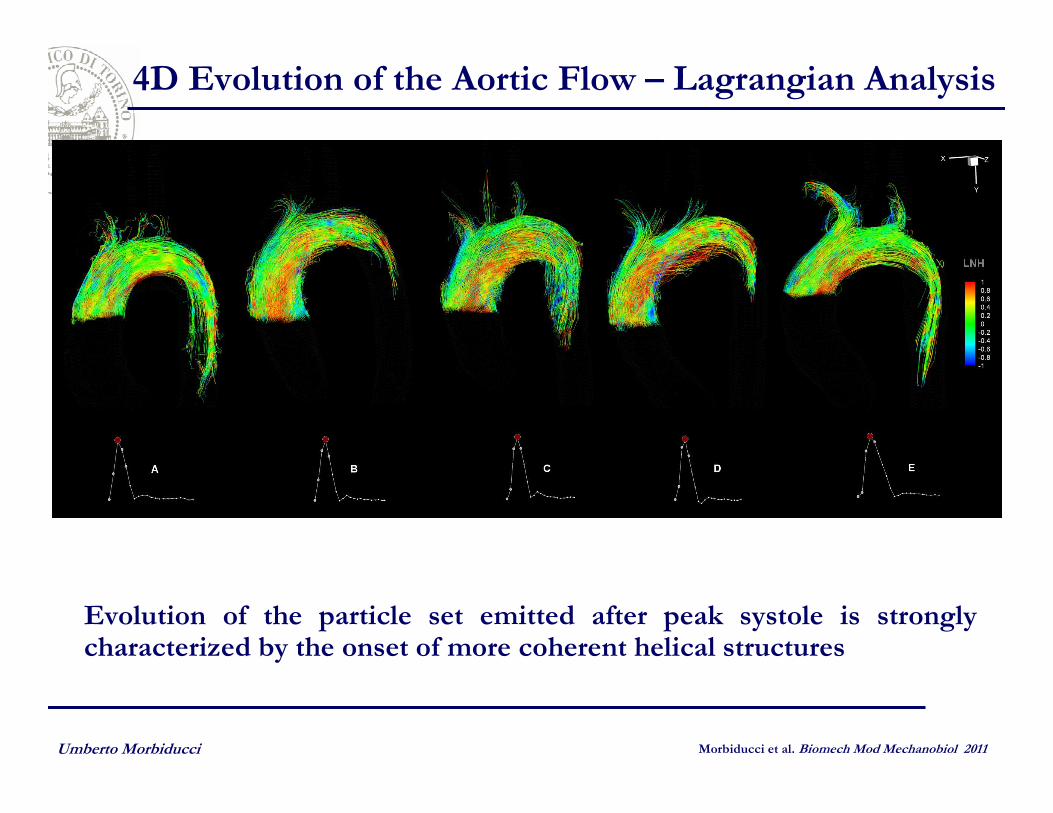
4D Evolution of the Aortic Flow – Lagrangian Analysis
Evolution of the particle set emitted after peak systole is strongly characterized by the onset of more coherent helical structures
Morbiducci et al. Biomech Mod Mechanobiol 2011

Umberto Morbiducci
4D Evolution of the Aortic Flow – SUBJECT C
Morbiducci et al. Biomech Mod Mechanobiol 2011

4D Evolution of the Aortic Flow – Lagrangian Analysis
Umberto Morbiducci
The flow deceleration phase is
dominated by the fluid rotational
momentum, resulting in coherent
helical and bihelical patterns
appearing in the ascending aorta.

Helical Flow – Quantitative Analysis I
Umberto Morbiducci
features common to all:-particle sets emitted after peak-systole, highest helical content
- particle sets emitted during acceleration phase characterized by similar trends in HFI values
bulk flow helical content depends upon the evolution of the flow
through the aorta
INTRAINDIVIDUAL ANALYSIS
Morbiducci et al. Biomech Mod Mechanobiol 2011

Conclusion
Umberto Morbiducci
There were two key findings of our study:
(i) intra-individual analysis revealed a statistically significant difference in the
helical content at different phases of systole
(ii) group analysis suggested that aortic helical blood flow dynamics is an
emerging behavior that is common to normal individuals.
Our results enforce the hypothesis that
helicity contribute to optimize the naturally occurring fluid transport
processes in the cardiovascular system, aiming at obtaining an efficient
perfusion, avoiding excessive energy dissipation in the process of
conveying blood flow in aorta
Morbiducci et al. Biomech Mod Mechanobiol 2011
Umberto MorbiducciUmberto Morbiducci
D Gallo, G De Santis, F Negri, D Tresoldi, R Ponzini, D Massai, MA Deriu,
P Segers, B Verhegghe, G Rizzo
Politecnico di Torino, Italy CILEA, Italy
IBiTech-bioMMeda,
Ghent University, BelgiumIBFM CNR, Italy
SECTION II
On the Use of In Vivo Measured Flow Rates
as Boundary Conditions for
Subject-Specific Hemodynamic Models
of the Human Aorta.
Implications for Indicators of Abnormal Flow

Umberto Morbiducci
Aims
Aims
(1) to identify the individual, not invasively measured PC MRI-based BCs
scheme that better replicates the measured flow rate waveforms;
(2) to describe the impact that different strategies of combining PC MRI-
based BCs have on WSS distribution. The identification of a proper set of
individual not-invasively measured BCs can eliminate potential sources of
error and uncertainties in blood flow simulations in the human aorta.

Umberto Morbiducci
A1
Measured Flow Rate Waveforms
AAo – ascending aorta
DAo – descending aorta
BCA – brachiocephalic artery
LCCA – left common carotid artery
LSA – left subclavian artery
MODEL A2MODEL A1

Outlet Treatment Scheme
DAo BCA LCCA LSA
I P COR COR COR
II MFR P P P
III P P P P
IV MFR COR COR P
V MFR MFR P P
VI P MFR MFR MFR
MFR: Measured Flow Rate Waveform
P: Stress free condition
COR: Constant Outflow Ratio (% of AAo inlet flow rate, measured)
(*) flow rate at AAo inlet
section prescribed in terms
of flat velocity profile
Umberto Morbiducci
Boundary Conditions

Umberto Morbiducci
WSS-based Descriptors of Abnormal Flow
TAWSS (Time Averaged WSS)
OSI (Oscillating Shear Index)
∫=T
dttsT
0
|),(|1
TAWSS WSS
19
RRT (Relative Residence Time)
∫=
−=
T
dtts
T
0
),(TAWSS)OSI21(
1RRT
WSS
−=
∫
∫T
T
dtts
dtts
0
0
),(
|),(|
15.0OSI
WSS
WSS

Umberto Morbiducci
DAo – in-vivo vs in-silico Flow Rate
scheme VI (light blu, P at Dao, measured at BCA,LSA, LCCA)
- excellent agreement
superimposed
superimposed
Results – Computed vs Measured Flow Rates
Model A2Model A1

Umberto Morbiducci
In silico vs measured mean flow rates differences at DAo outlet section are
maximized when BCs treatment scheme III (P at all outlets) is applied
51% model A1 --- 34% model A2
In silico vs measured diastolic flow rates differences at DAo outlet section
are maximized when BCs treatment scheme I (measured COR) is applied
49% model A1 --- 37% model A2
Results – Computed vs Measured Flow Rates

(1) Proximal outer arch curvature
(2) Focal regions on DAo
TAWSS VI - MODEL A2
Results – WSS-based Hemodynamic Indicators
TAWSS
BC on DAo – PV
III
I
VI
IV
II

Umberto Morbiducci
On regions exposed to low and oscillating WSS, the absolute
percentage differences with respect to BCs scheme VI (P at Dao,
measured at BCA, LSA, LCCA) are up to
Results – WSS-based Hemodynamic Indicators
TAWSS 49% 138%
OSI 18% 32%
RRT 30% 44%
MODEL A1 MODEL A2

Umberto Morbiducci
- Subject-specific hemodynamic simulation of aortic flow is
feasible by using not invasively measured flow rate waveforms as
BCs;
- Different schemes of BCs can influence WSS-based descriptors
of disturbed flow:
- they mainly affect descriptors value than their distribution;
It is recommended to prescribe time-varying outflow BCs based
on in-vivo accurate measurements (for example VI).
Conclusions
Umberto Morbiducci
R. Ponzini, G. Rizzo, D. Gallo
Politecnico di Torino, Italy CILEA, Italy IBFM CNR, Italy
SECTION III
On the Use of In Vivo 4D Velocity
Profiles as Boundary Conditions for
Image-Based Hemodynamic Models of
the Human Aorta. Preliminary Study

Umberto Morbiducci
Methods
4D measured PC MRI Velocity profiles

Umberto Morbiducci
Methods – Inlet Boundary Conditions
|V| [m/s]
3D PC MRI Measured Inlet
Velocity ProfileFlat Inlet
Velocity Profile
T1
Prescribed BCsAAoInlet Section
Steady state analysis
T1
T1
Inlet AAo section – Mean VelocityTHROUGH-PLANEIN-PLANE
Inlet AAo section – Mean Helicity(absolute)

Umberto Morbiducci
Results – Streamlines at T1
|V| [m/s]
3D PC MRI Measured Inlet
Velocity Profile
Flat Inlet
Velocity Profile
T1

Umberto Morbiducci
Results – WSS at T13D PC MRI Measured Inlet
Velocity Profile
Flat Inlet
Velocity Profile
T1
|WSS|
[Pa]

Umberto Morbiducci
Conclusions [WORK IN PROGRESS]
From preliminary analysis
-Streamlines visualization highlights differences in bulk flow
features
-Inlet velocity profiles influence WSS distribution at estrados,
intrados and at osti
Future steps
-Pulsatile simulations: flat velocity profile vs 3D measured PC
MRI profile as inlet BC
-Influence WSS & bulk flow
-Influence suvraortic vessels perfusion
-

Thank You for Your Kind Attention
Umberto
Morbiducci
Diego
Gallo
Francesco
Pennella
Franco Maria
Montevecchi
Diana
Massai
Turin BioFluid Mechanics Ramblers


![What is Visualization? - TTI/Vanguard · Tarde’s Idea of Quantification, The. Social After Gabriel Tarde: Debates and Assessments, ed. Mattei Candea [2009]. “Information visualization](https://static.fdocuments.in/doc/165x107/5bd5cb9009d3f26c3e8c67df/what-is-visualization-tti-tardes-idea-of-quantification-the-social.jpg)