
Quality Manual of Spectral Irradiance Measurementsmetrology.tkk.fi/quality/Qmspirr.pdfAalto...
46
Aalto University School of Electrical Engineering Metrology Research Institute Version 2.4 07/12/2015 Petri Kärhä Jari Hovila Maksim Shpak Tuomas Poikonen Hans Baumgartner Quality Manual of Spectral Irradiance Measurements
Transcript of Quality Manual of Spectral Irradiance Measurementsmetrology.tkk.fi/quality/Qmspirr.pdfAalto...
Aalto University
School of Electrical Engineering
Metrology Research Institute
Version 2.4
07/12/2015
Petri Kärhä
Jari Hovila
Maksim Shpak
Tuomas Poikonen
Hans Baumgartner
Quality Manual of Spectral Irradiance Measurements

Quality Manual of SpectralIrradiance Measurements
Page 2 (46)
Version: 2.4 Date: December 7, 2015 Last edited by: PK
1. Table of contents
Quality Manual of Spectral Irradiance Measurements ............................................ 11. Table of contents ............................................................................................. 22. Definition ........................................................................................................ 4
2.1. Scope .......................................................................................................... 42.2. Object and field of application .................................................................... 42.3. Features ...................................................................................................... 42.4. Principle of realisation................................................................................. 5
3. Equipment ....................................................................................................... 83.1. Description of setups .................................................................................. 83.2. Calibration requirements ............................................................................ 13
3.2.1. Filter radiometer .................................................................................... 133.2.2. Spectroradiometers ................................................................................ 14
4. Measurement traceability ............................................................................... 155. Calibration and measurement procedures including validation methods ......... 16
5.1. Measurement ranges .................................................................................. 165.1.1. Measurement range using the filter radiometer ..................................... 165.1.2. Measurement range using the DM150 spectroradiometer ..................... 17
5.2. Measuring a primary standard lamp ............................................................ 185.3. Analysing the results ................................................................................... 185.4. Calculating colour co-ordinates and colour temperature ............................. 195.5. Adjusting colour temperature ..................................................................... 195.6. Using the DM150 spectroradiometer .......................................................... 20
5.6.1. Installing the setup ................................................................................. 205.6.2. Preparations ........................................................................................... 205.6.3. Filter wheel and wavelength indicator .................................................... 215.6.4. Measurement ......................................................................................... 225.6.5. Saving the files ....................................................................................... 245.6.6. Temperature correction ......................................................................... 245.6.7. Calibration of the wavelength scale ........................................................ 245.6.8. Calibration of the spectral irradiance responsivity .................................. 25
5.7. Using the DTMc300 spectroradiometer ....................................................... 285.7.1. Preparations ........................................................................................... 285.7.2. Measurement ......................................................................................... 305.7.3. Instrument settings ................................................................................ 32
6. Handling of calibration items ........................................................................... 357. Uncertainty budgets ........................................................................................ 36
7.1. Uncertainty of the filter radiometer ............................................................ 367.2. Uncertainty of the DM150 spectroradiometer measurements .................... 367.3. Uncertainty of colorimetric quantities ......................................................... 39
8. Accommodation and environmental conditions .............................................. 41
Quality Manual of SpectralIrradiance Measurements
Page 3 (46)
Version: 2.4 Date: December 7, 2015 Last edited by: PK
9. Field calibrations ............................................................................................. 4210. Control data .................................................................................................... 4311. Certificates ...................................................................................................... 4412. Intercomparisons ............................................................................................ 4513. Publications ..................................................................................................... 46
Quality Manual of SpectralIrradiance Measurements
Page 4 (46)
Version: 2.4 Date: December 7, 2015 Last edited by: PK
2. Definition
2.1. Scope
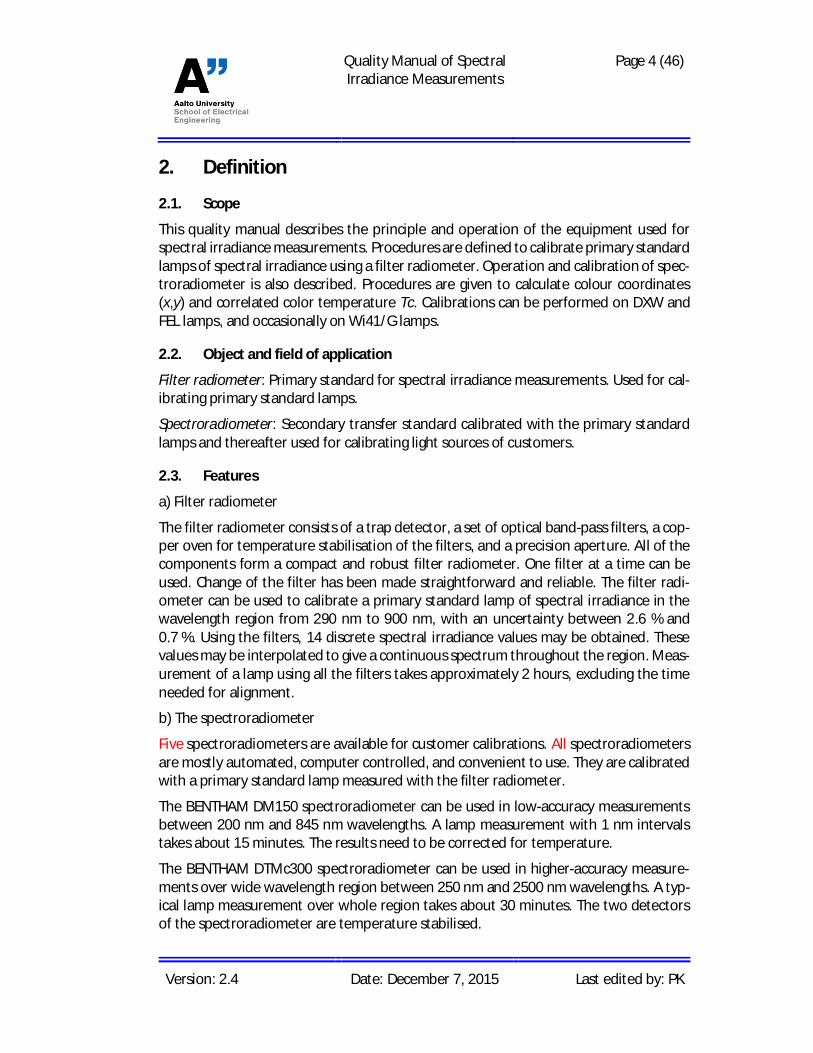
This quality manual describes the principle and operation of the equipment used forspectral irradiance measurements. Procedures are defined to calibrate primary standardlamps of spectral irradiance using a filter radiometer. Operation and calibration of spec-troradiometer is also described. Procedures are given to calculate colour coordinates(x,y) and correlated color temperature Tc. Calibrations can be performed on DXW andFEL lamps, and occasionally on Wi41/G lamps.
2.2. Object and field of application
Filter radiometer: Primary standard for spectral irradiance measurements. Used for cal-ibrating primary standard lamps.
Spectroradiometer: Secondary transfer standard calibrated with the primary standardlamps and thereafter used for calibrating light sources of customers.
2.3. Features
a) Filter radiometer
The filter radiometer consists of a trap detector, a set of optical band-pass filters, a cop-per oven for temperature stabilisation of the filters, and a precision aperture. All of thecomponents form a compact and robust filter radiometer. One filter at a time can beused. Change of the filter has been made straightforward and reliable. The filter radi-ometer can be used to calibrate a primary standard lamp of spectral irradiance in thewavelength region from 290 nm to 900 nm, with an uncertainty between 2.6 % and0.7 %. Using the filters, 14 discrete spectral irradiance values may be obtained. Thesevalues may be interpolated to give a continuous spectrum throughout the region. Meas-urement of a lamp using all the filters takes approximately 2 hours, excluding the timeneeded for alignment.
b) The spectroradiometer
Five spectroradiometers are available for customer calibrations. All spectroradiometersare mostly automated, computer controlled, and convenient to use. They are calibratedwith a primary standard lamp measured with the filter radiometer.
The BENTHAM DM150 spectroradiometer can be used in low-accuracy measurementsbetween 200 nm and 845 nm wavelengths. A lamp measurement with 1 nm intervalstakes about 15 minutes. The results need to be corrected for temperature.
The BENTHAM DTMc300 spectroradiometer can be used in higher-accuracy measure-ments over wide wavelength region between 250 nm and 2500 nm wavelengths. A typ-ical lamp measurement over whole region takes about 30 minutes. The two detectorsof the spectroradiometer are temperature stabilised.

Quality Manual of SpectralIrradiance Measurements
Page 5 (46)
Version: 2.4 Date: December 7, 2015 Last edited by: PK
Konica Minolta CS1000 and CS2000 are imaging spectroradiometers capable of measur-ing luminance and spectral radiance. They can be equipped with a diffuser to facilitatespectral irradiance measurement.
Ocean Optics QE65 Pro is an array spectrograph capable for fast spectral irradiancemeasurements.
2.4. Principle of realisation
The principle of the realisation of the spectral irradiance scale has been explained thor-oughly in Refs. [1, 2, 3]. Therefore only a brief description is given here.
The realisation is based on a known detector instead of the traditional method of usinga known source. A simplified measurement setup is shown in Figure 1. A detector withknown spectral responsivity is equipped with a narrow band optical filter with measuredspectral transmittance. The field of view is limited using a precision aperture with accu-rately known area at a measured distance d from the lamp. By using several inter-changeable filters, the spectral irradiance of the lamp may be derived at several discretewavelengths. These discrete values may be interpolated using suitable physical models.
Figure 1. Principle of detector-based realisation of spectral irradiance.
In practice, the aperture, the detector and the interchangeable filters have been com-bined as a practical filter radiometer. The mechanical construction of the filter radiom-eter is presented in Figure 2. The temperature of the filters is stabilised using a copper
[1] P. Kärhä, P. Toivanen, F. Manoochehri, and E. Ikonen, “Development of a detector-based absolutespectral irradiance scale in the 380-900-nm spectral range,” Appl. Opt. 36, 8909-8918 (1997).
[2] P. Kärhä, Trap detectors and their applications in the realisation of spectral responsivity, luminousintensity and spectral irradiance scales, Doctors thesis, Helsinki University of Technology, 1997, 92p.
[3] T. Kübarsepp, P. Kärhä, F. Manoocheri, S. Nevas, L. Ylianttila, and E. Ikonen, “Spectral irradiancemeasurements of tungsten lamps with filter radiometers in the spectral range 290 nm to 900 nm,”Metrologia 37, 305 – 312 (2000).
Lamp Detector
Aperture
Optional filter
d

Quality Manual of SpectralIrradiance Measurements
Page 6 (46)
Version: 2.4 Date: December 7, 2015 Last edited by: PK
oven whose temperature is measured by a temperature sensor and adjusted by a circu-lar see-through Peltier element. Details about the construction and its’ performancemay be found in [4].
When exposed to optical radiation, the filter radiometer will produce a photocurrent
( ) ( ) ( ) llltll
dREAi ò= , (1)
where A is the area of the aperture, is the wavelength, E( ) is the spectral irradianceto be determined at the aperture plane, t(l) is the known spectral transmittance of thefilter and R(l) is the known spectral responsivity of the trap detector. The photocurrentis measured with a HP3458A digital voltmeter equipped with a sensitive VINCULUM cur-rent-to-voltage converter.
Figure 2. Construction of the filter radiometer.
The spectral irradiance of the tungsten filament lamps used can be modelled as
( ) ( )( )[ ]1exp 2
5 -¢
=Tc
BElllel , (2)
where B is an auxiliary multiplication factor, e’(l) represents the effective spectral emis-sivity of the lamp, c2=1.4388×10⁻² m×K is the second radiation constant, and T is the tem-perature of the lamp filament in kelvins. The effective emissivity e’(l) is modelled withan Nth degree polynomial as
[4] P. Kärhä, A. Haapalinna, P. Toivanen, F. Manoochehri, and E. Ikonen, “Filter radiometry based ondirect utilisation of trap detectors,” Metrologia 35, 255-259 (1999).
Black Anodised Aluminum
Copper / Brass Plastic
Filters
Aperture
AnnularThermoelectricElement
To ControlElectronics
Temperature Sensor
Temperature-ControlledCopper Oven
Heat SinkTrap detector
Threephotodiodes

Quality Manual of SpectralIrradiance Measurements
Page 7 (46)
Version: 2.4 Date: December 7, 2015 Last edited by: PK
( ) å=
=¢N
i
iib
0
lle , (3)
where bi’s are free parameters, and maximum N is 7.
Equations (1) and (2) are solved with a recursive iteration method so, that the spectralirradiance values at the effective wavelengths
( ) ( ) ( )
( ) ( ) ( ) llltl
llltlll
l
l
dRE
dRE
c
c
eff
ò
ò= (5)
of the filters match.
As the result, we obtain the discrete spectral irradiance values at the effective wave-lengths and a function in the form of Eqs. (2) and (3) giving a continuous spectral irradi-ance curve.
Selecting the values for N and for the integration limits depend on the number of filtersin use. N has to be approximately 2-3 lower than the number of filters in use, in order toprevent unexpected behaviour of the interpolation function between the fixed values.The obtained interpolation function is valid only between the effective wave-lengths ofthe lowest and highest filters. In some cases it may be advantageous to model the spec-tral irradiance separately in UV and visible/NIR.
The calibration is stored in the filter radiometer. For short periods, the calibration of thelamps may be used. The calibrated lamp is used to calibrate the spectroradiometer,which may then be used in customer calibrations.

Quality Manual of SpectralIrradiance Measurements
Page 8 (46)
Version: 2.4 Date: December 7, 2015 Last edited by: PK
3. Equipment
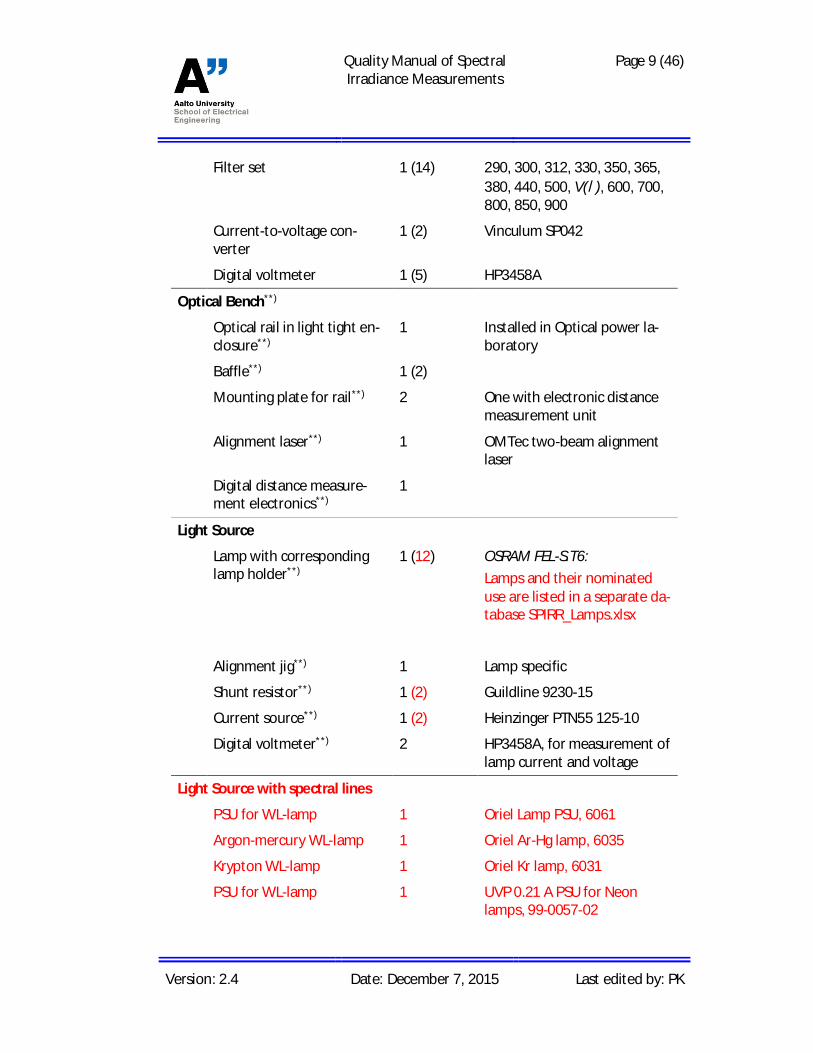
3.1. Description of setupsTable 1. Equipment needed when calibrating a primary standard lamp.
Description Quantity*) Remarks/Id
Filter radiometer 1997
Trap detector 1(~10) None, used in transmittance
Temperature controlled fil-ter holder
1 (black with brass ring)
Temperature controllerelectronics
1 (self-made)
Precision aperture 1(2) (A10, 3 mm)
Briefcase containing theitems mentioned above
1
Filter radiometer 2001
Trap detector 1(~10) UVFR-8
Temperature controlled fil-ter holder
1 (black with aluminium ring)
Temperature controllerelectronics
1 Thorlabs
Precision aperture 1(1) NFRA1 (3 mm)
Optical stand for trap detec-tor
1
Filter radiometer 2007
Trap detector 1(~10) MRI-9807 (blue with blackfront)
Temperature controlled fil-ter holder
1 (blue with aluminium ring)
Temperature controllerelectronics
1 Thorlabs
Precision aperture 1 (1) NFRA2 (3 mm)
Optical stand for trap detec-tor
1
Filter radiometer accessories
Quality Manual of SpectralIrradiance Measurements
Page 9 (46)
Version: 2.4 Date: December 7, 2015 Last edited by: PK
Filter set 1 (14) 290, 300, 312, 330, 350, 365,380, 440, 500, V(l), 600, 700,800, 850, 900
Current-to-voltage con-verter
1 (2) Vinculum SP042
Digital voltmeter 1 (5) HP3458A
Optical Bench**)
Optical rail in light tight en-closure**)
1 Installed in Optical power la-boratory
Baffle**) 1 (2)
Mounting plate for rail**) 2 One with electronic distancemeasurement unit
Alignment laser**) 1 OMTec two-beam alignmentlaser
Digital distance measure-ment electronics**)
1
Light Source
Lamp with correspondinglamp holder**)
1 (12) OSRAM FEL-S.T6:Lamps and their nominateduse are listed in a separate da-tabase SPIRR_Lamps.xlsx
Alignment jig**) 1 Lamp specific
Shunt resistor**) 1 (2) Guildline 9230-15
Current source**) 1 (2) Heinzinger PTN55 125-10
Digital voltmeter**) 2 HP3458A, for measurement oflamp current and voltage
Light Source with spectral lines
PSU for WL-lamp 1 Oriel Lamp PSU, 6061
Argon-mercury WL-lamp 1 Oriel Ar-Hg lamp, 6035
Krypton WL-lamp 1 Oriel Kr lamp, 6031
PSU for WL-lamp 1 UVP 0.21 A PSU for Neonlamps, 99-0057-02
Quality Manual of SpectralIrradiance Measurements
Page 10 (46)
Version: 2.4 Date: December 7, 2015 Last edited by: PK
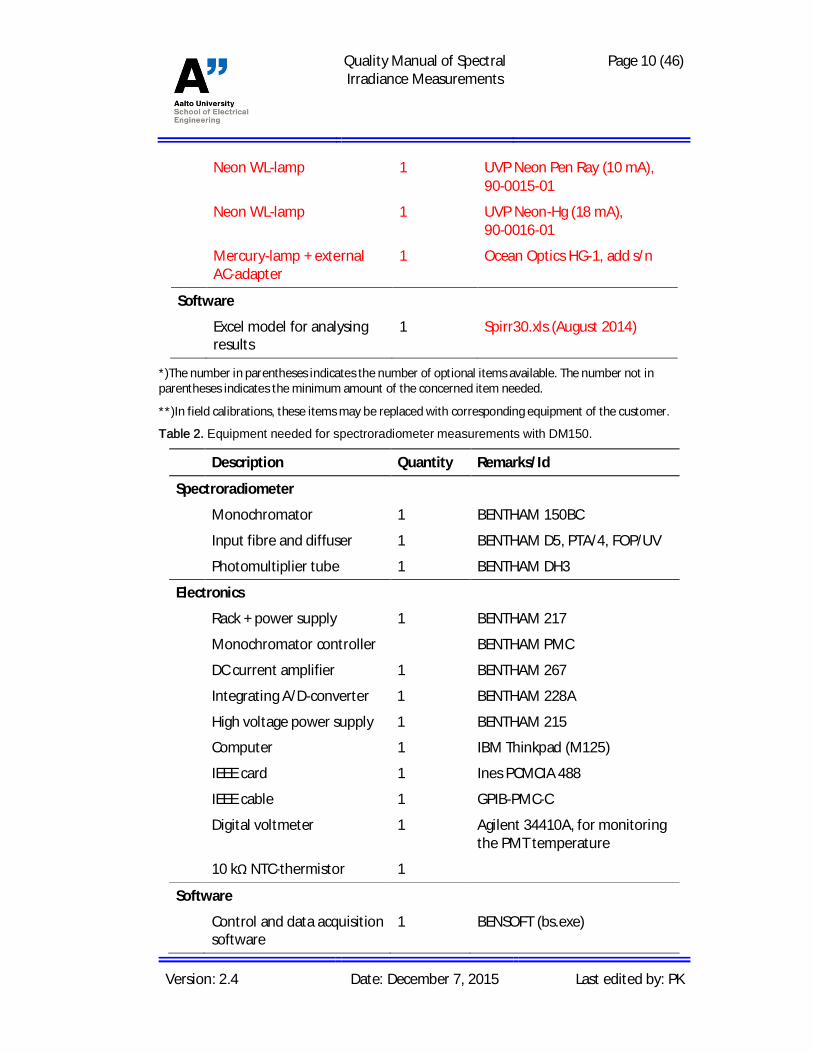
Neon WL-lamp 1 UVP Neon Pen Ray (10 mA),90-0015-01
Neon WL-lamp 1 UVP Neon-Hg (18 mA),90-0016-01
Mercury-lamp + externalAC-adapter
1 Ocean Optics HG-1, add s/n
Software
Excel model for analysingresults
1 Spirr30.xls (August 2014)
*)The number in parentheses indicates the number of optional items available. The number not inparentheses indicates the minimum amount of the concerned item needed.
**)In field calibrations, these items may be replaced with corresponding equipment of the customer.
Table 2. Equipment needed for spectroradiometer measurements with DM150.
Description Quantity Remarks/Id
Spectroradiometer
Monochromator 1 BENTHAM 150BC
Input fibre and diffuser 1 BENTHAM D5, PTA/4, FOP/UV
Photomultiplier tube 1 BENTHAM DH3
Electronics
Rack + power supply 1 BENTHAM 217
Monochromator controller BENTHAM PMC
DC current amplifier 1 BENTHAM 267
Integrating A/D-converter 1 BENTHAM 228A
High voltage power supply 1 BENTHAM 215
Computer 1 IBM Thinkpad (M125)
IEEE card 1 Ines PCMCIA 488
IEEE cable 1 GPIB-PMC-C
Digital voltmeter 1 Agilent 34410A, for monitoringthe PMT temperature
10 k NTC-thermistor 1
Software
Control and data acquisitionsoftware
1 BENSOFT (bs.exe)

Quality Manual of SpectralIrradiance Measurements
Page 11 (46)
Version: 2.4 Date: December 7, 2015 Last edited by: PK
Optical Bench
(as above)
Light source
(as above)

Quality Manual of SpectralIrradiance Measurements
Page 12 (46)
Version: 2.4 Date: December 7, 2015 Last edited by: PK
Table 3. Equipment needed for spectroradiometer measurements with DTMc300.Description Quantity Remarks/Id S/N
Spectroradiometer
Monochromator 1 Bentham DTMc300 7247
Input fiber and diffuser 1 Bentham D7/D3, 1-m or 2-m fiber
8176/1
Photomultiplier tube 1 Bentham DH-50-Te SA5573
Lead sulfide detector 1 Bentham DH-PbS-Te 7223
Electronics
Rack + power supply 1 Bentham 217 71482
DC current pre-amplifier 1 Bentham 277
Lock-in amplifier 1 Bentham 225
Integrating A/D-converter 1 Bentham 228A
High voltage power supply 1 Bentham 215
PMT cooler power supply 1 Bentham CPS50 8178
Detector cooler power sup-ply
1 Bentham CPS1M
Optical chopper 1 Bentham 218H 69654
Chopper controller 1 Bentham 218 69644
Computer 1 Fujitsu Siemens Amilo 3818980159
IEEE GPIB USB adapter 1 National InstrumentsGPIB-USB-HS
IEEE cable 1 IEEE488 GPIB cable
Software
Control and data acquisitionsoftware
1 BenWin+ (BenWin+.exe)
Optical Bench
(as above)
Light Source
(as above)

Quality Manual of SpectralIrradiance Measurements
Page 13 (46)
Version: 2.4 Date: December 7, 2015 Last edited by: PK
3.2. Calibration requirements
3.2.1. Filter radiometer
· The multimeters used are auto-calibrated every day before the start of the calibra-tion measurements. Before autocalibration, the temperature of the DVM has to beallowed to stabilise for at least 1 h (longer time recommended). Calibration of themultimeters is done according to the MRI calibration schedule.
· The Vinculum current to voltage converter is calibrated according to the MRI calibra-tion schedule.
· The trap detector is calibrated once every two years against the cryogenic absoluteradiometer. The reflectance is measured, and the spectral responsivity is extrapo-lated. The methods used are described in [5].
· Filter transmittances are calibrated twice a year using methods described in [6]. Ifstability measurements of certain filters indicate that shorter calibration intervalsare needed, then be so. The calibration intervals are re-estimated with each meas-urement. Before filter radiometer measurements, the filters are inspected visuallyfor dust or degradation. The filters that degrade appear “foggy” and need to be re-placed.
· Filter transmittances are calibrated in the wavelength region 0±50 nm, where 0 isthe peak wavelength of the filter. Out-of-band leakage’s are studied in the wave-length region [ 0+50 nm…1 100 nm] once for each new filter.
· If Deuterium lamps are to be measured, also possible leakage’s below 0 need to beconsidered.
· Reflectances of the filters have to be measured once for each filter when taking intouse. These reflectances are needed to take into account the interreflections be-tween the filter and the trap detector. If reflectances are not measured, a value(10±10) % is used. The uncertainty is taken into account in calculations.
· The trap detectors are stored with the protective cap closed whenever they are notin use. This is to keep dust away from the surfaces of the photodiodes. Before meas-urements, it is visually checked that there is no dust inside the detector. If there isvisible dust, it may be carefully cleaned from the first photodiode with Kodak lenscleaning tissue. If other tissues are used, make sure that there is no silicon in thetissue. The two inner diodes cannot be cleaned without disassembling.
[5] Quality manual of optical power laboratory.
[6] Quality manual of reference spectrometer laboratory.
Quality Manual of SpectralIrradiance Measurements
Page 14 (46)
Version: 2.4 Date: December 7, 2015 Last edited by: PK
· The areas of the precision apertures are measured once every four years by VTT-MIKES length section. Alternately, they may also be calibrated using the direct opti-cal method, DOM [7,8].
· The shunt resistor is calibrated according to the MRI calibration schedule.
3.2.2. Spectroradiometers
· The spectroradiometers are calibrated for spectral irradiance responsivity beforecalibration measurements if the previous calibration is more than six months old.
· The wavelength scales of the spectroradiometers are checked once a year.
· Incandescent lamps may be used for storing the spectral irradiance calibrations forshort periods. Calibration interval for OSRAM FEL T6 lamps is 2 years or 15 hours ofburning time, whichever exceeds first. Change in lamp voltage (by more than 0.3 V)indicates need for recalibration.
[7] A. Lassila, P. Toivanen, and E. Ikonen, “An optical method for direct determination of the radiometricaperture area at high accuracy, Meas. Sci. Technol. 8, 973-977 (1997).
[8] E. Ikonen, P. Toivanen, and A. Lassila, “A new optical method for high-accuracy determination ofaperture area,” Metrologia 35, 369-372 (1999).

Quality Manual of SpectralIrradiance Measurements
Page 15 (46)
Version: 2.4 Date: December 7, 2015 Last edited by: PK
4. Measurement traceability
Figure 3. Traceability scheme of the spectral irradiance measurements.
Quality Manual of SpectralIrradiance Measurements
Page 16 (46)
Version: 2.4 Date: December 7, 2015 Last edited by: PK
5. Calibration and measurement procedures including valida-tion methods
5.1. Measurement ranges
5.1.1. Measurement range using the filter radiometer
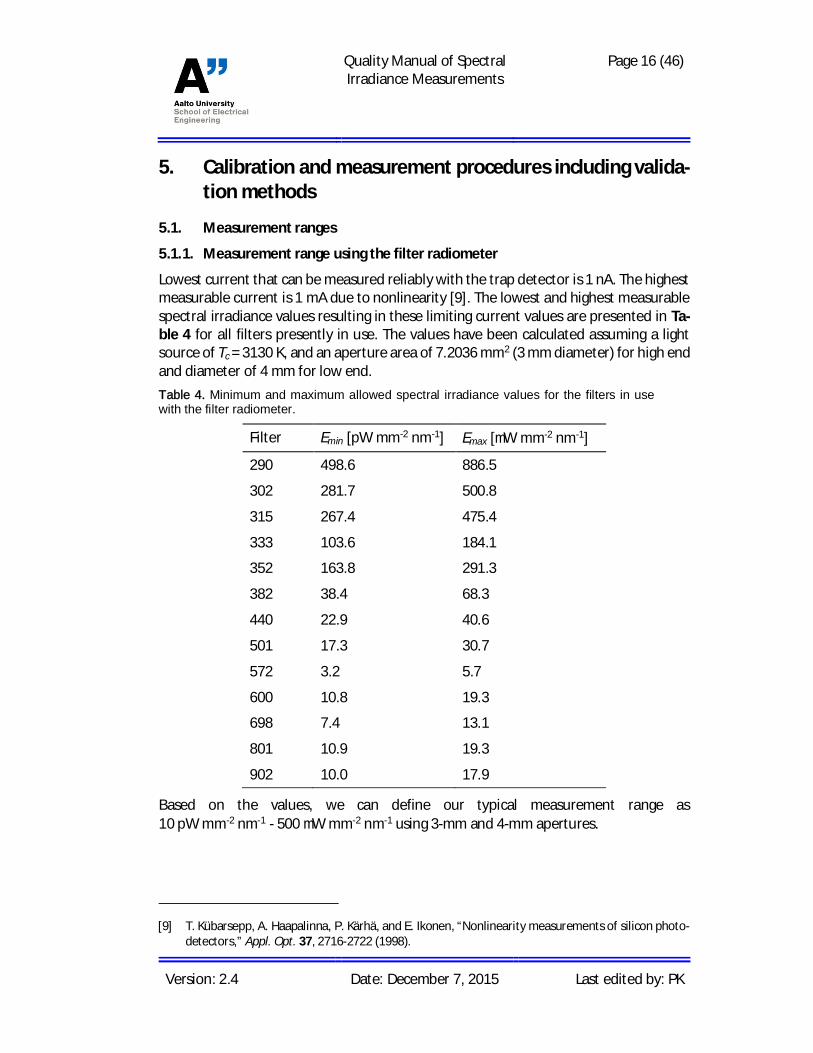
Lowest current that can be measured reliably with the trap detector is 1 nA. The highestmeasurable current is 1 mA due to nonlinearity [9]. The lowest and highest measurablespectral irradiance values resulting in these limiting current values are presented in Ta-ble 4 for all filters presently in use. The values have been calculated assuming a lightsource of Tc = 3130 K, and an aperture area of 7.2036 mm2 (3 mm diameter) for high endand diameter of 4 mm for low end.Table 4. Minimum and maximum allowed spectral irradiance values for the filters in usewith the filter radiometer.
Filter Emin [pW mm-2 nm-1] Emax [mW mm-2 nm-1]
290 498.6 886.5
302 281.7 500.8
315 267.4 475.4
333 103.6 184.1
352 163.8 291.3
382 38.4 68.3
440 22.9 40.6
501 17.3 30.7
572 3.2 5.7
600 10.8 19.3
698 7.4 13.1
801 10.9 19.3
902 10.0 17.9
Based on the values, we can define our typical measurement range as10 pW mm-2 nm-1 - 500 mW mm-2 nm-1 using 3-mm and 4-mm apertures.
[9] T. Kübarsepp, A. Haapalinna, P. Kärhä, and E. Ikonen, “Nonlinearity measurements of silicon photo-detectors,” Appl. Opt. 37, 2716-2722 (1998).
Quality Manual of SpectralIrradiance Measurements
Page 17 (46)
Version: 2.4 Date: December 7, 2015 Last edited by: PK
5.1.2. Measurement range using the DM150 spectroradiometer
The lowest measurable spectral irradiance of the DM150 spectroradiometer was studiedby measuring the dark current of the photomultiplier tube. A measurement was madewith the spectroradiometer, with its’ diffuser completely blocked and no calibration setfor the spectroradiometer. The standard deviation of the measured signal was 2.9 pA. Itappears that the dark current cancellation does not completely cancel the dark current.In this measurement, the recorded signal was on the average 8.3 pA above the zerolevel. Assuming this value as maximum, we may conclude that the standard uncertaintyof the photocurrent measurement is
pA5,5pA)3/8(3 22 =+=cu .
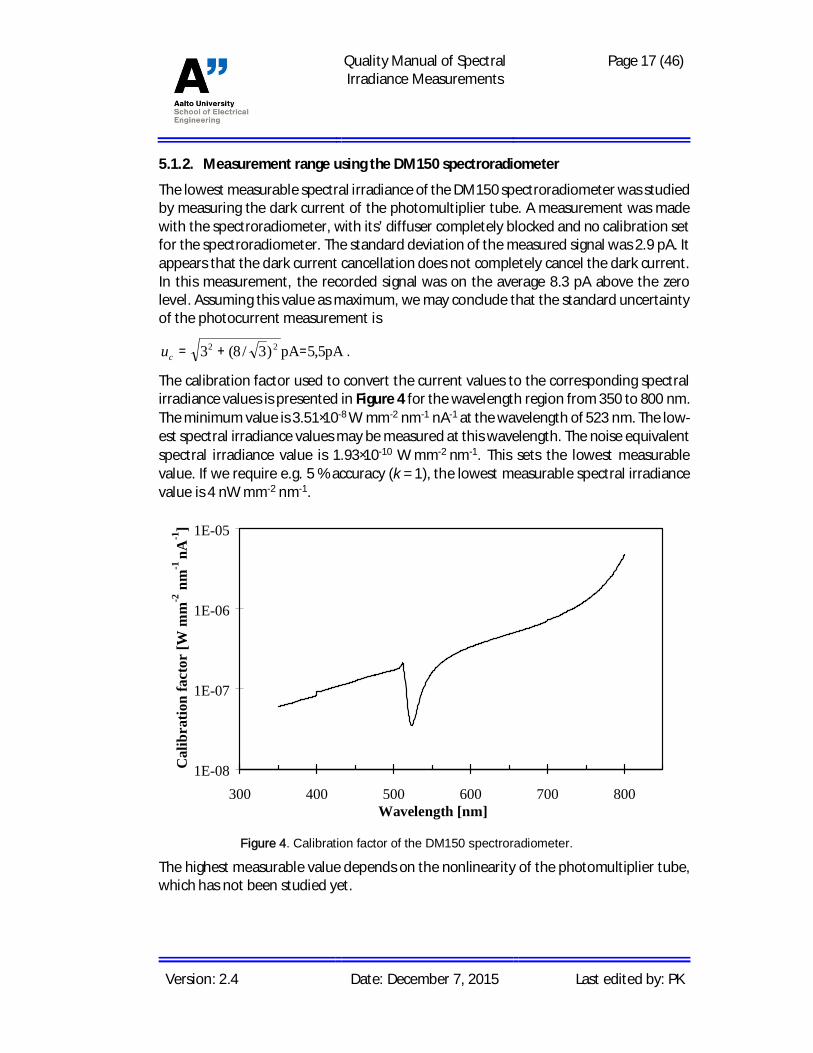
The calibration factor used to convert the current values to the corresponding spectralirradiance values is presented in Figure 4 for the wavelength region from 350 to 800 nm.The minimum value is 3.51×10⁻⁸ W mm-2 nm-1 nA-1 at the wavelength of 523 nm. The low-est spectral irradiance values may be measured at this wavelength. The noise equivalentspectral irradiance value is 1.93×10⁻¹⁰ W mm-2 nm-1. This sets the lowest measurablevalue. If we require e.g. 5 % accuracy (k = 1), the lowest measurable spectral irradiancevalue is 4 nW mm-2 nm-1.
Figure 4. Calibration factor of the DM150 spectroradiometer.
The highest measurable value depends on the nonlinearity of the photomultiplier tube,which has not been studied yet.
1E-08
1E-07
1E-06
1E-05
300 400 500 600 700 800Wavelength [nm]
Cal
ibra
tion
fact
or[W
mm
-2nm
-1nA
-1]

Quality Manual of SpectralIrradiance Measurements
Page 18 (46)
Version: 2.4 Date: December 7, 2015 Last edited by: PK
5.2. Measuring a primary standard lamp
· Build the setup as described in [10]. The reference also gives instructions on operat-ing the lamps. The lamps to be used as spectral irradiance standards include 1 kW FELand DXW type lamps.
· With HUT FEL lamps: 1) Measurement distance is 500 mm measured from the outer-most surface of the lamp base 2) Operating current is 8.1000 A 3) Lamp is alignedusing the targets in the briefcase of the lamps. The grooved surface of the alignmentjig must be pointed away from the lamp (towards the filter radiometer). Lamp num-bers have been written in the jigs.
· With DXW lamps typically: 1) Measurement distance is 500 mm or 700 mm measuredfrom the outermost surface of the alignment jig. 2) Operating current is 8.0000 A 3)Lamp is aligned using the target provided by the customer.
· Operating procedures of customer lamps must be agreed with the customer becausethe alignment procedures vary.
· Alignment with all lamps is done using the 900c filter in the filter radiometer.
· OMTec alignment laser between the lamp and the filter radiometer is to be used inthe alignment unless there is special need for other methods.
· If calibrating customer lamps in the field, measure the distances to the appropriatereference planes using the equipment of customers.
· Measure the lamp using each filter. Before measurement, record the dark current,and subtract it from the measured signal. With each measurement, check/adjust thelamp current, and record the lamp voltage. Start with 900 nm filter and measure it inthe beginning and at the end of the measurement sequence.
· When changing the filters, allow the temperature of the new filter to stabilise for5 minutes before measuring. During this time, light must be blocked. The time maybe shortened if the temperature of the laboratory is close to 25 °C.
· Record the temperature and humidity of the laboratory to be later added to the cal-ibration certificate.
5.3. Analysing the results
· Analyse the results using the excel model, as described in [1, 3].
[10] Instruction manual for operating standard lamps.
Quality Manual of SpectralIrradiance Measurements
Page 19 (46)
Version: 2.4 Date: December 7, 2015 Last edited by: PK
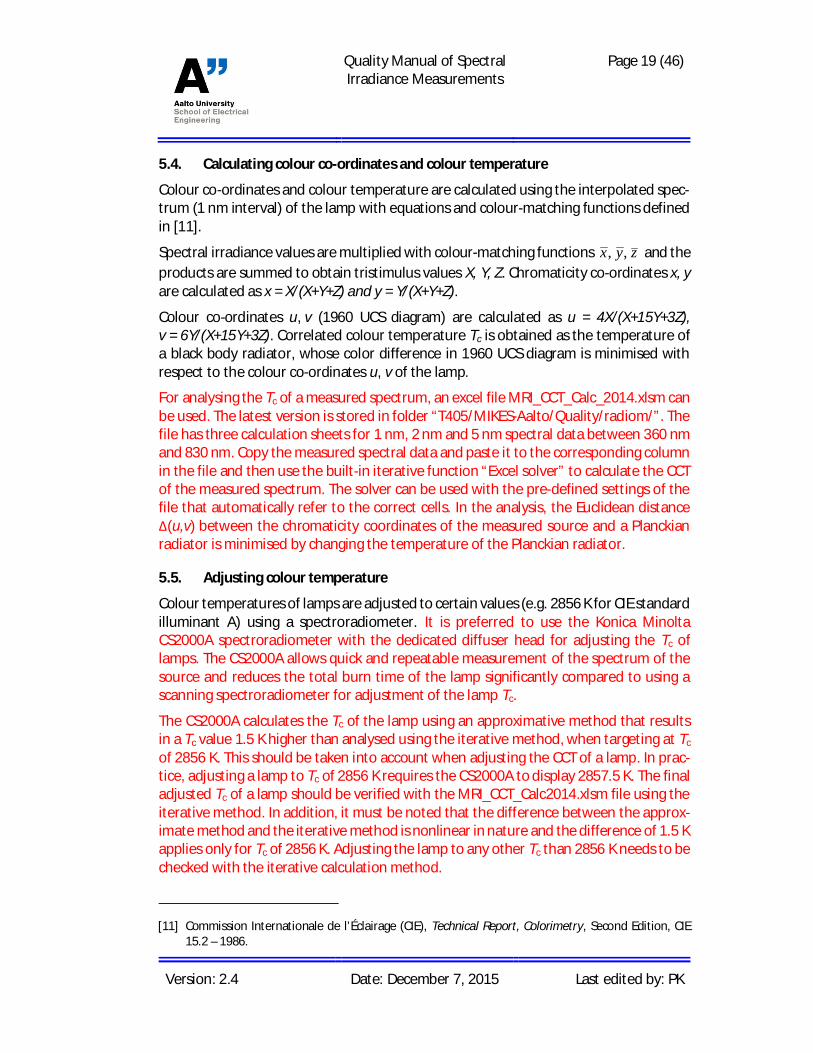
5.4. Calculating colour co-ordinates and colour temperature
Colour co-ordinates and colour temperature are calculated using the interpolated spec-trum (1 nm interval) of the lamp with equations and colour-matching functions definedin [11].
Spectral irradiance values are multiplied with colour-matching functions zyx ,, and theproducts are summed to obtain tristimulus values X, Y, Z. Chromaticity co-ordinates x, yare calculated as x = X/(X+Y+Z) and y = Y/(X+Y+Z).
Colour co-ordinates u, v (1960 UCS diagram) are calculated as u = 4X/(X+15Y+3Z),v = 6Y/(X+15Y+3Z). Correlated colour temperature Tc is obtained as the temperature ofa black body radiator, whose color difference in 1960 UCS diagram is minimised withrespect to the colour co-ordinates u, v of the lamp.
For analysing the Tc of a measured spectrum, an excel file MRI_CCT_Calc_2014.xlsm canbe used. The latest version is stored in folder “T405/MIKES-Aalto/Quality/radiom/”. Thefile has three calculation sheets for 1 nm, 2 nm and 5 nm spectral data between 360 nmand 830 nm. Copy the measured spectral data and paste it to the corresponding columnin the file and then use the built-in iterative function “Excel solver” to calculate the CCTof the measured spectrum. The solver can be used with the pre-defined settings of thefile that automatically refer to the correct cells. In the analysis, the Euclidean distance
(u,v) between the chromaticity coordinates of the measured source and a Planckianradiator is minimised by changing the temperature of the Planckian radiator.
5.5. Adjusting colour temperature
Colour temperatures of lamps are adjusted to certain values (e.g. 2856 K for CIE standardilluminant A) using a spectroradiometer. It is preferred to use the Konica MinoltaCS2000A spectroradiometer with the dedicated diffuser head for adjusting the Tc oflamps. The CS2000A allows quick and repeatable measurement of the spectrum of thesource and reduces the total burn time of the lamp significantly compared to using ascanning spectroradiometer for adjustment of the lamp Tc.
The CS2000A calculates the Tc of the lamp using an approximative method that resultsin a Tc value 1.5 K higher than analysed using the iterative method, when targeting at Tc
of 2856 K. This should be taken into account when adjusting the CCT of a lamp. In prac-tice, adjusting a lamp to Tc of 2856 K requires the CS2000A to display 2857.5 K. The finaladjusted Tc of a lamp should be verified with the MRI_CCT_Calc2014.xlsm file using theiterative method. In addition, it must be noted that the difference between the approx-imate method and the iterative method is nonlinear in nature and the difference of 1.5 Kapplies only for Tc of 2856 K. Adjusting the lamp to any other Tc than 2856 K needs to bechecked with the iterative calculation method.
[11] Commission Internationale de l’Éclairage (CIE), Technical Report, Colorimetry, Second Edition, CIE15.2 – 1986.
Quality Manual of SpectralIrradiance Measurements
Page 20 (46)
Version: 2.4 Date: December 7, 2015 Last edited by: PK
Procedure for adjusting the Tc of a lamp:
1. Measure the spectrum of the lamp within WL range of 380 – 780 nm (CS2000A).
2. Adjust the lamp current, wait for 1 minute and make a new measurement.
3. Repeat steps 1 and 2 until the colour temperature is within the specifications givenby the customer, typically within 0.5 K from the target Tc.
4. Repeat the measurement a few times within a period of 10-15 min to verify that theadjusted Tc is stable and within the specifications. Adjust current, if necessary.
5. Verify the final Tc of the lamp with the iterative calculation method using the fileMRI_CCT_Calc2014.xlsm
5.6. Using the DM150 spectroradiometer
The Bentham DM150 spectroradiometer (Registry code M124) is controlled by IBMThinkpad laptop computer (Registry code M125) via IEEE488 interface bus. The meas-urement setup is placed on a carriage which can be moved. MS-DOS 6.2 boot disk la-beled “Spectro-boot” should be used for starting up the computer. This way more con-ventional RAM is available for the measurement program. The location of the measure-ment program is
C:\bentham\bs.exe
5.6.1. Installing the setup
The setup is similar to the setup used with the filter radiometer measurements (Section5.2) but the filter radiometer is replaced with the measurement head (equipped with aTeflon diffuser) of the spectroradiometer. Alignment is carried out as with the filter ra-diometer. A mirror is placed in contact with the diffuser to generate reflection for angu-lar alignment. Distance is measured with the outermost surface of the diffuser as thereference plane.
5.6.2. Preparations
In order to reach a stable operating temperature, the controller unit of the spectroradi-ometer and its high voltage module should be turned on the day before the measure-ments take place. Check that the optical fiber is connected properly to the monochrom-ator and that it cannot move during the measurement. Check that all cables are con-nected. Figure 5 shows the controller unit of the spectroradiometer and its front panelconnections. The signal cable from the photomultiplier tube (PMT) must be connectedto the input 1 of the current amplifier.

Quality Manual of SpectralIrradiance Measurements
Page 21 (46)
Version: 2.4 Date: December 7, 2015 Last edited by: PK
Figure 5. The controller unit of the DM150 spectroradiometer and its connections.
The temperature of the PMT is monitored using a 10 k NTC-thermistor which is at-tached on the surface of the PMT. A multimeter of type Agilent 34410A is used for con-verting the resistance of the thermistor to a temperature reading. Check that the cablesare connected to the thermistor and turn the multimeter on. Press Shift + Config to enterthe temperature measurement mode. Press Config again and select “Thermistor 2W”using the arrow keys. Press Enter and select “10k”. Press Enter so many times that youget out of the menu. Finally press Shift + Trigger to start the temperature measurement.
5.6.3. Filter wheel and wavelength indicator
The filter wheel position and the wavelength indicator of the spectroradiometer mustbe checked before measuring with the device because they can sometimes get misa-ligned. In the measurement program, go to the Scan menu Select wavelength. Type“400” in the “New wavelength”-field and press Enter. This drives the monochromator to400 nm and the filter wheel to position 2. The correct position of the filter wheel isshown in Figure 6. If the filter wheel position is wrong, exit the program and switch thecontroller unit off. Carefully turn the filter wheel knob that it points at position 2. Switchthe equipment on again and launch the program. If the knob of the filter wheel is turnedmanually while the device power is switched on, a mechanical failure will occur.
Quality Manual of SpectralIrradiance Measurements
Page 22 (46)
Version: 2.4 Date: December 7, 2015 Last edited by: PK
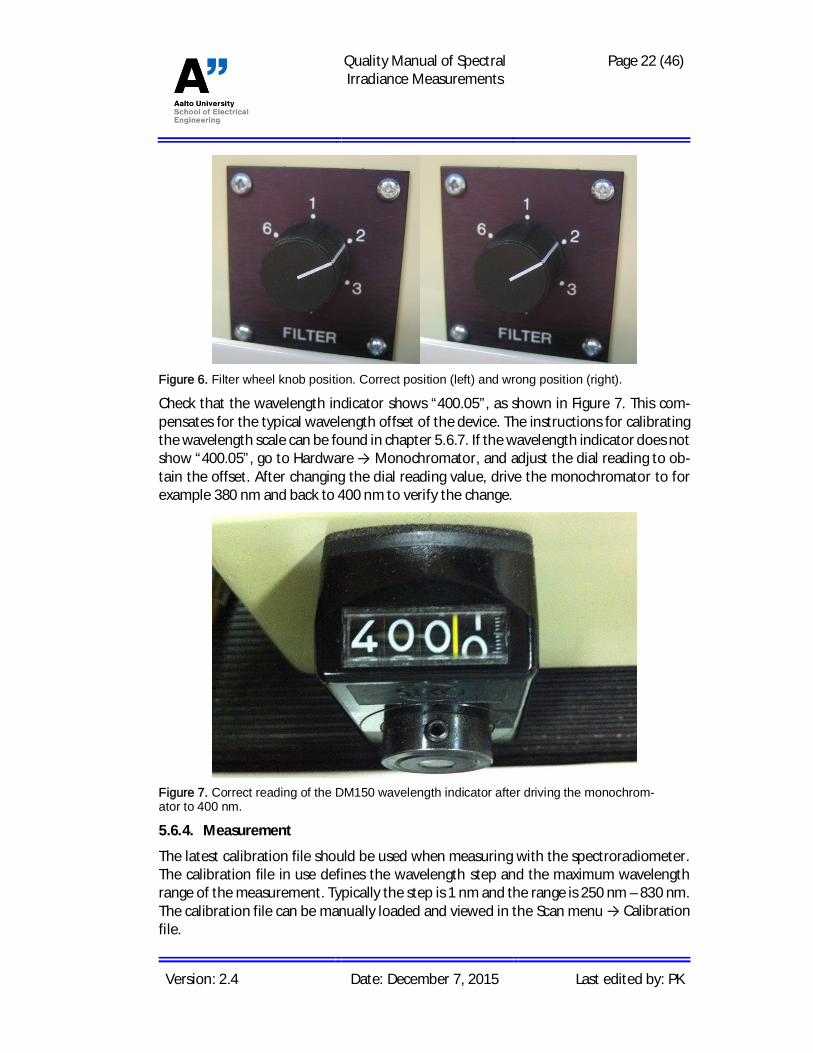
Figure 6. Filter wheel knob position. Correct position (left) and wrong position (right).
Check that the wavelength indicator shows “400.05”, as shown in Figure 7. This com-pensates for the typical wavelength offset of the device. The instructions for calibratingthe wavelength scale can be found in chapter 5.6.7. If the wavelength indicator does notshow “400.05”, go to Hardware Monochromator, and adjust the dial reading to ob-tain the offset. After changing the dial reading value, drive the monochromator to forexample 380 nm and back to 400 nm to verify the change.
Figure 7. Correct reading of the DM150 wavelength indicator after driving the monochrom-ator to 400 nm.
5.6.4. Measurement
The latest calibration file should be used when measuring with the spectroradiometer.The calibration file in use defines the wavelength step and the maximum wavelengthrange of the measurement. Typically the step is 1 nm and the range is 250 nm – 830 nm.The calibration file can be manually loaded and viewed in the Scan menu Calibra onfile.

Quality Manual of SpectralIrradiance Measurements
Page 23 (46)
Version: 2.4 Date: December 7, 2015 Last edited by: PK
The monochromator can be used with three different measurement bandwidths bychanging the slits manually before the measurement. 1 nm. 2 nm and 5 nm bandwidthsare obtained by using slit sizes of 0.56 mm. 1.12 mm and 2.78 mm. respectively. Higherbandwidths can be used in measurements of low signal levels to obtain better signal tonoise ratio. Two slits of each size are kept in a plastic bag which can be found in thecarriage of the spectroradiometer. The monochromator has 3 slots for slit installation.The two slots that are in use are labelled “Entrance” and “Exit” and are located at theoptical fiber port and the PMT port. The slits are installed in pairs and must be of thesame size. The entrance slit must be facing the optical fiber whereas the output slit mustbe facing the PMT.
Open the first slit installation slot by unscrewing the two screws and pull the slit up gen-tly by using pliers. Be careful not to drop any dust into the slot. Install the new slit care-fully by pushing it in as far as it goes by using for example a screwdriver and close theslot door immediately to avoid any unnecessary dust from entering the slot. A calibra-tion file corresponding to the new slit sizes must be loaded before the measurements.More information about the calibration files can be found in Chapters 5.6.7 and 5.6.8.
The measurement settings can be changed in the Scan menu Scan op ons. The fol-lowing settings should be selected for all typical measurements:
Scan type (•) Equidistant wl
Pre-scan [x] Confirm spec. id [x] Zero calibration
Scan [x] Graphics mode [x] Data correction
Post scan [x] Return to start [x] Close shutter
The comments for the measurement file can be typed in the Scan menu Next specoptions Comment. A er typing the comments, press Escape and select Ok.
The measurement range can be set in the Scan menu Equidistant wavelength. Givethe start and stop wavelengths and the measurement step. The measurement step mustbe the same as in the calibration file. The start and stop wavelengths cannot exceed therange of the calibration file.
The program uses automatic indexing for the filenames. The default filename is“spec***.dat”, where the *-symbols form the indexing part. If three *-symbols are used,the file names will be “spec001.dat. spec002.dat” etc. The file name can be changed inthe Scan menu Next spec op ons ID. A total of 8 characters can be used for thename and the extension must be .dat. At least one *-symbol must be included in the filename that the indexing works. The indexing can be disabled by deselecting the “Autoincrement sequence” in the same menu.
To start the measurement, select the Scan menu Start measurement. The programsuggests a file name defined in the ID menu. Confirm or change the file name and pressEnter. During the measurement, the program draws the spectral irradiance graph on the
Quality Manual of SpectralIrradiance Measurements
Page 24 (46)
Version: 2.4 Date: December 7, 2015 Last edited by: PK
computer display. The graphs can be viewed and compared after the measurements inthe Graphics menu Display specs.
The program can be set to measure multiple scans if needed. Go to the Scan menu Scan options and select “Multiple” in addition to the settings listed earlier. Additionalsettings for the multiple scan measurement can be made in the Scan menu Mul plescan setup. This measurement method is useful for averaging troubleshooting. All typi-cal measurements should be performed as single scans.
More detailed information about using the measurement program is found in [12].
5.6.5. Saving the files
The measurement files are stored in the computer’s RAM and must be saved onto afloppy disk or the hard drive before quitting the program. Go to the File menu Disk-memory manager. Press Tabulator to move the cursor to the right side of the screen.Select the files which you want to save by using the Space bar and press ‘e’ and selectSave. Choose the destination directory and select Save. The files can be temporarilysaved in the directory
C:\bentham\temp\
5.6.6. Temperature correction
Because of the temperature sensitivity of the PMT. its temperature must be writtendown when conducting the measurements. If the measurement temperature differsfrom the calibration temperature, a correction must be applied. To check the calibrationtemperature, go to the Scan menu Calibra on le Data info. An excel-file includingthe instructions for applying the correction can be found in the directory
\\metrology\webpages\quality\radiom\SRM temperature correction.xls
5.6.7. Calibration of the wavelength scale
The wavelength scale can be calibrated using a mercury lamp, or another lamp with well-known spectral lines. Suitable wavelengths of a mercury lamp are presented in Table 5.The lamps suitable for wavelength calibration of spectroradiometers are listed in Table1.
Table 5. Mercury lamp lines used in the wavelength scale calibration.
Wavelength in air [nm] Order of wavelength
253.6521 1
296.7283 1
[12] BENSOFT Manual.

Quality Manual of SpectralIrradiance Measurements
Page 25 (46)
Version: 2.4 Date: December 7, 2015 Last edited by: PK
365.0158 (doublet) 1
404.66 1
435.8335 1
507.3042 2
546.0750 1
593.4566 2
668.2968 2
760.9563 3
These wavelengths are compared with the wavelengths measured with the spectroradi-ometer. The wavelength calibration is conducted in four parts with 0.1 nm steps and 1nm bandwidth (see next section) using four different calibration files. These files (250-400.cal, 400-550.cal, 550-700.cal and 700-830.cal) are located in directory
C:\bentham\calibras\wave\
Each spectral line is measured separately (using a range of approximately ±3 nm aroundthe peak wavelength) and stored into the same directory with name Hgxxx.dat, wherexxx is the wavelength (without decimals). Because of relatively wide measurementbandwidth, the measured peaks are broadened. Therefore the peak wavelengths of themeasured lines have to be calculated using FWHM (Full Width Half Maximum) method.Resulting wavelength correction file bs.wcl is stored in directory
C:\bentham\
In a typical measurement, it is enough to use the method of chapter 5.6.3., and verifythat the wavelength indicator shows “400.05” after driving the monochromator to 400nm. In this case, the wavelength correction can be left unchecked in the Scan optionsmenu.
5.6.8. Calibration of the spectral irradiance responsivity
The spectral irradiance responsivity of the DM150 spectroradiometer is calibrated usingthe known spectral irradiance of a standard lamp Osram FEL T6. The measurement dis-tance is 500 mm between the front surface of the diffuser and the front surface of thelamp.
The measurement bandwidth depends on the width of the entrance and exit slits usedin the monochromator. Usually 0.56 mm slits are used to obtain 1 nm bandwidth. Forlow power light sources 2.78 mm slits (5 nm bandwidth) can be used.
The procedure to calibrate the DM150 spectroradiometer is listed below.
1. Align the standard lamp and the diffuser head on the optical rail.

Quality Manual of SpectralIrradiance Measurements
Page 26 (46)
Version: 2.4 Date: December 7, 2015 Last edited by: PK
2. Reset the distance measurement display while holding the 50.8 mm calibratedlength between the diffuser head and the front surface of the lamp. Move the railcarrier of the diffuser head further away from the lamp that the distance measuringdisplay shows “449.2” corresponding to the 500 mm measurement distance.
3. Install slits with correct size to obtain the desired measurement bandwidth.
4. Check the correct filter wheel and wavelength indicator positions by driving themonochromator to 400 nm and follow the instructions of chapter 5.6.3.
5. Turn on the light source and let it to stabilise for at least 20 minutes before the cali-bration measurements.
6. Set the wavelength range to be measured.
Scan Equidistant wavelength: 250 – 830 nm. 1 nm step
7. Set the integration time of the measurement.
Hardware ADC Setup Samples per reading: 15
8. Write comments for the new calibration file in Scan Next spec options Com-ment -menu. The following information should be included:
Calibration of DM150 with FEL-313250 – 830 nm, step: 1 nm, slit: 1 nm (0.56 mm)Temperature: 25.0 C. humidity 38 %PMT temperature: 26.7 C
9. Make two measurements to warm up the PMT.
10. The DM150 is calibrated against a spectral irradiance standard lamp by performingthree consecutive scans of the PMT current. The data correction must be disabled inthe measurement. The average of the scans is called the system response. The de-vice is able to make multiple successive scans automatically. Check that the optionsin Scan Scan Options -menu are as follows:
Scan type[x] Multiple (•) Equidistant wl
Pre-scan[x] Confirm spec id [x] Zero calibration
Scan[x] Graphics mode [ ] Data correction
Post scan[x] Return to start [x] Close shutter
Go to Scan Multiple scan options –menu and configure the options for multi-ple successive scans.

Quality Manual of SpectralIrradiance Measurements
Page 27 (46)
Version: 2.4 Date: December 7, 2015 Last edited by: PK
a) Total number of scans: 3b) Start number: 1
[x] Single specs
11. Start the measurement.
Scan Start Measurement
12. When using the multiple scans option, the measured data are saved in a single file,by default on the drive A: (floppy disk). The data need to be loaded into the memoryfor calculating the calibration file. Go to File Disk-Memory manager and open thefile. The file opens as three separate spectral files in the memory. The average of thethree files can now be calculated in
Process Mean and error
The name of the resulting system response file should be of type stddmmyy.dat,where “ddmmyy” is the calibration date. e.g. st160202.dat. Insert the name of thesystem response file into the MeAn: Spec-Id –field and press Process.
Go to File Disk-Memory manager and save the file from the memory to the direc-tory (if 0.56 mm slits are used)
C:\bentham\system\056slit\
13. The calibration file is calculated by using the produced system response file stddm-myy.dat and the spectral irradiance data of the lamp. The data of the spectral irradi-ance lamps are stored in the directory
C:\bentham\lamps\fel1000\
The name of the lamp data file is of type XXX_mmyy.dat, where XXX is the lampnumber (the last three digits of the serial number) and “mmyy” indicates when thespectral irradiance of the lamp has been calibrated. The latest available data shouldbe used. Load the spectral irradiance data into the memory.
Go to Scan Calibration file Calculate -menu. Get the proper lamp and systemfiles and press Compute. Go to Graphics Display specs and check that the graphsare OK.
14. Save the calibration file to the directory (if 0.56 mm slits are used)
C:\bentham\calibras\056slit\
The name of the calibration file is of type bsddmmyy.cal, where “ddmmyy” is thecalibration date.
15. While the lamp is still operating, make a test measurement by using the new calibra-tion file. Set the data correction on in Scan Scan Options –menu. Load the newcalibration file in Scan Calibration file Load data –menu. Compare the meas-ured spectrum to the lamp file; spectra should converge.

Quality Manual of SpectralIrradiance Measurements
Page 28 (46)
Version: 2.4 Date: December 7, 2015 Last edited by: PK
Note that the software makes a copy of the loaded calibration file called bs.cal anduses that file every time the software is started.
5.7. Using the DTMc300 spectroradiometer
The new spectroradiometer (Bentham DTMc300. registry code MIKES004664) is con-trolled by a portable computer (Fujitsu Siemens Amilo) via IEEE488 interface bus. Themeasurement setup is placed on a carriage which can be moved.
5.7.1. Preparations
The PMT needs at least 12 hours to reach a stable operating temperature, so the spec-troradiometer should be turned on the day before the measurements take place. Checkthat the optical fiber is connected properly to the monochromator and that it cannotmove during the measurement. Check all connections. Figure 8 shows the front panelconnections of the rack unit, the chopper controller and the PMT cooler power supply.The signal from the PMT must be connected to the input 1 of the current pre-amplifierand the output of the pre-amplifier to the input 1 of the lock-in amplifier. The signalfrom the lead sulphide (PbS) detector must be connected to the input 2 of the pre-am-plifier. High impedance of PbS allows to use it with a current pre-amp.
Figure 8. Rack unit. chopper controller and PMT cooler power supply and their front panelconnections.
The D-connector of the PMT cooler cable includes four additional banana sockets. Theyare meant for troubleshooting and do not need to be connected when doing typicalmeasurements. The D-connector should be connected to the socket at the front panel
Quality Manual of SpectralIrradiance Measurements
Page 29 (46)
Version: 2.4 Date: December 7, 2015 Last edited by: PK
of the CPS50 PMT cooler power supply. The detector output of the CPS1M cooler powersupply must be connected to the PbS detector. The back panel output of the choppercontroller should be connected to the optical chopper. Connect the computer to therack unit using a GPIB-USB adapter. The monochromator should be connected to thesame GPIB-socket using a standard GPIB-cable.
Connect the 215 high voltage supply to the PMT and the PbS detector using the HV1 andHV2 outputs. These outputs use special MHV (high voltage BNC) connectors. They looklike ordinary BNC-connectors but have higher voltage ratings. It is very important to usethe supplied MHV cables for these connections to avoid causing any damage to theequipment and for safety reasons. The PbS detector has a built-in volt-age divider witha ratio of 1/11. If the PMT is run at a typical level of 750 V. the bias voltage of the PbSdetector will be approximately 75 V.
The optical chopper uses an unprotected chopping disk with 10 slots. Avoid touching thedisk and make sure that no parts are in contact with the disk before turning the equip-ment on. Turn on the PMT cooler power supply, chopper controller, monochromatorand the rack unit. From the rack unit, turn on the CPS1M detector cooler power supplyand the 215 high voltage supply. Adjust the optical chopper frequency to 175Hz. Thischopping frequency should always be used in a 50Hz power system to achieve the bestsignal to noise ratio in the measurements. The frequency display shows the correct fre-quency for a 10 slot chopping disk. For other disks, multiply the dial reading by the factor
10discinslotsofno.
=f .
The display of the CPS50 cooler power supply shows either the target temperature orthe actual temperature of the PMT. depending on the position of the front panel switch.Use the “Set Temp”-knob to adjust the target temperature to -20.0 °C for the PMT andlock the knob position by pushing the knob in.
The monochromator uses two motorized slits (entrance slit and middle slit) and twomanual slits (both exit slits). The motorized slits can either be set manually or con-trolledautomatically based on the measurement step size. In the latter case, the pro-gram cal-culates corresponding slit width, using the step size as the bandwidth, and the lineardispersion of the grating in use.
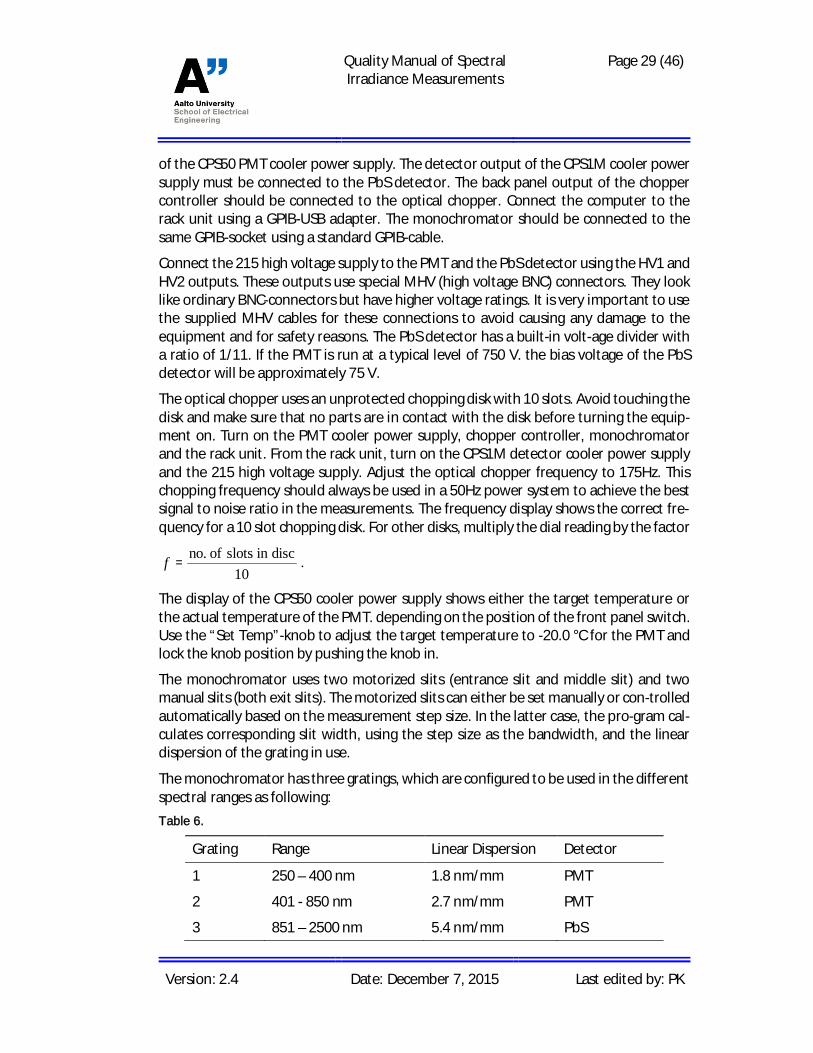
The monochromator has three gratings, which are configured to be used in the differentspectral ranges as following:Table 6.
Grating Range Linear Dispersion Detector
1 250 – 400 nm 1.8 nm/mm PMT
2 401 - 850 nm 2.7 nm/mm PMT
3 851 – 2500 nm 5.4 nm/mm PbS

Quality Manual of SpectralIrradiance Measurements
Page 30 (46)
Version: 2.4 Date: December 7, 2015 Last edited by: PK
The manual slits must be set accordingly to the range of the measurement and step sizecombination:
(nm/mm)dispersionLinear(nm)sizeStep(mm)sizeSlit =
The exit slit to the PMT is set at 20% larger than above value because of subtractiveconfiguration of double monochromator.
Because two gratings are used with the PMT as a detector, and it is impractical to changemanual slits during the measurement, in practice single measurement is limited to therange of 250 – 400 nm. 401 – 850 nm or 860-2500 nm. If it is necessary to scan the wholerange in one measurement, a variable step size must be used to compensate for thedifference in the linear dispersion between gratings.
By default, the step size for the infrared is 10 nm, so the PbS slit must be set at 1.852mm. For UV and visible step size is 2 nm for 250-400 nm range and 3 nm for 401–850nmrange, so the PMT slit must be set at 1.333 mm. Width of the exit window of the fibre-bundle should be considered when planning a measurement, as it effectively sets anupper limit on the slit widths.
Start the computer and launch the program
C:\Program Files\Bentham\BenWin+.exe
A shortcut for the program is located on the desktop of the computer. The equipmentmust be initialized before the measurement. Go to the Tools menu and select Initialize.Normally instrument settings from previous measurement are loaded automatically. Allmajor settings are listed in chapter 5.7.3.
5.7.2. Measurement
Comments for the measurement file can be typed in the Scan menu Set File Infor-mation. Double-click the text fields to enable typing. Press “+” to add more rows. Themeasurement settings can be changed in the Scan menu Scan setup. Click the “Ad-vanced”-button to view all parameters. The number of measurements can be set usingthe field “Number of Spectra”. Give the start and end wavelengths and the measure-ment step. To transform raw measured values to the real irradiance values. two meth-ods can be used.
Manual data correction:
Measure only within one wavelength range at a time. Ranges are: 250-400 (2nmstep). 403-850 (3nm step). 860-2500 (10nm step).
Use following scan settings:
( ) Use Custom Wavelengths
(•) Auto Range (•) Zero Calibrate ( ) Data Correction
(•) Close Shutter (•) Return to Start Wavelength
Quality Manual of SpectralIrradiance Measurements
Page 31 (46)
Version: 2.4 Date: December 7, 2015 Last edited by: PK
Results will be raw values from the lock-in amplifier. They can be transformedinto the irradiance values with the Excel table that contains correction multipli-ers. The table is found at: \\Metrology\webpages\quality\radiom\DTMc300-cor-rections.xls
Automatic data correction (untested!):
Calibration files can be used when measuring with the spectroradiometer, to au-tomatically transform the raw values from detectors into correct scale. Calibra-tion files can be manually loaded in the Scan menu Data Correc on LoadFrom File.
If the data correction is turned on, the start and end wavelengths cannot exceedthe range used in the calibration. If the measurement range includes a gratingchange while using the same detector, the issue of fixed exit slits (described inprevious chapter) has to be addressed by using variable step size. To do so, checkUse Custom Wavelengths checkbox and click Load Custom Wavelengths. Customwavelengths file is a text file with .dat extension, which has a list of wave-lengthsto be measured. A file custom_wavelengths_all.dat has a range of 250–2500 nm,with 2 nm step for 250–400 nm range, 3 nm step for 401–850 nm range, and10 nm step for 851–2500 nm range.
The following scan options should be selected for the measurements:
(•) Use Custom Wavelengths
(•) Auto Range (•) Zero Calibrate (•) Data Correction
(•) Close Shutter (•) Return to Start Wavelength
Data Correction option is selectable only if calibration file is loaded in Data Cor-rection options window.
To start the measurement, press the “New Scan”-button. The program draws the spec-tral irradiance graph(s) into a window. After the measurement, copy the data to clip-board and paste it into a program of your choice or export the data to Excel. It might bebetter to export to Excel from the File menu, rather than from the dialog provided bythe program after the measurement is finished, that way multiple measured spectra arenot separated into different tabs in the Excel, but are on the same tab. separated bycolumns.
If you chose the “Save to File” option, data will be saved in a text file. Use .ben as thefile extension. The data from a scan containing multiple spectra can be saved either toa number of files or to just one file. The parameter for this is “Save multiple spectra to asingle file” and can be found in the Tools menu Op ons. If this op on is deselected,the program asks for only one file name when saving but creates a number of files withautomatic indexing, each file containing a single spectrum data.
The monochromator can be driven to a certain wavelength using the Scan menu Sig-nal Setup. Type the target wavelength into the corresponding field and press “Go to
Quality Manual of SpectralIrradiance Measurements
Page 32 (46)
Version: 2.4 Date: December 7, 2015 Last edited by: PK
Wavelength”. Multiple measurements of a single wavelength can be made using theScan menu Sta onary Scan Setup. Give the scan length, time interval and wavelengthand press “New Scan” to start the measurement. This measurement method is usefulfor troubleshooting. Note that for the Signal Setup and the Stationary Setup bandwidth(= slit width) is carried over from the previous measurement. Slits can be set manually byclicking on the Instruments menu and Slits.
5.7.3. Instrument settings
All major settings can be found in Instrument menu.
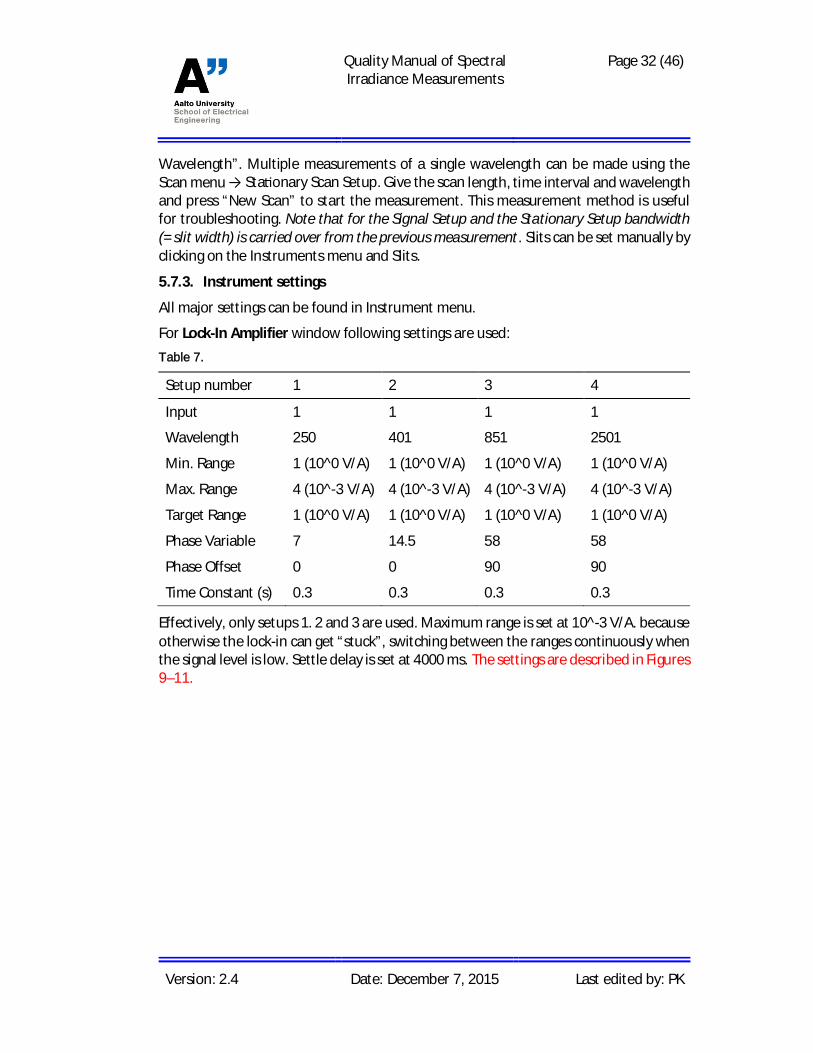
For Lock-In Amplifier window following settings are used:Table 7.
Setup number 1 2 3 4
Input 1 1 1 1
Wavelength 250 401 851 2501
Min. Range 1 (10^0 V/A) 1 (10^0 V/A) 1 (10^0 V/A) 1 (10^0 V/A)
Max. Range 4 (10^-3 V/A) 4 (10^-3 V/A) 4 (10^-3 V/A) 4 (10^-3 V/A)
Target Range 1 (10^0 V/A) 1 (10^0 V/A) 1 (10^0 V/A) 1 (10^0 V/A)
Phase Variable 7 14.5 58 58
Phase Offset 0 0 90 90
Time Constant (s) 0.3 0.3 0.3 0.3
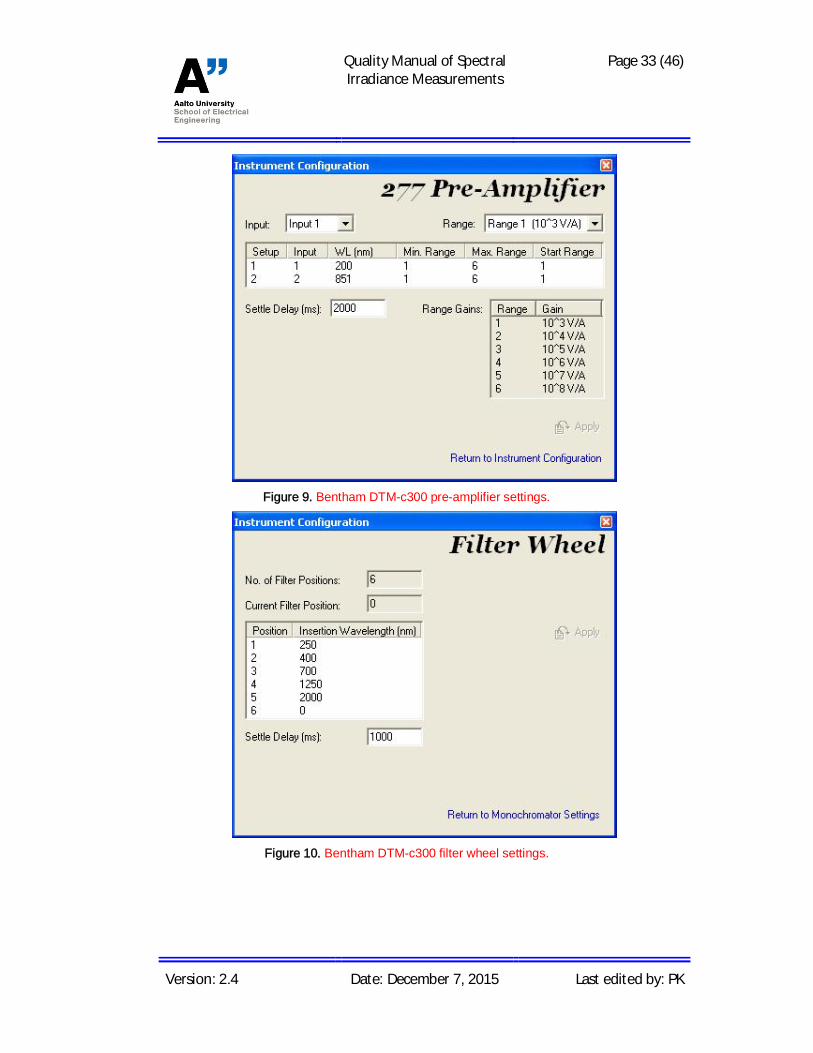
Effectively, only setups 1. 2 and 3 are used. Maximum range is set at 10^-3 V/A. becauseotherwise the lock-in can get “stuck”, switching between the ranges continuously whenthe signal level is low. Settle delay is set at 4000 ms. The settings are described in Figures9–11.
Quality Manual of SpectralIrradiance Measurements
Page 33 (46)
Version: 2.4 Date: December 7, 2015 Last edited by: PK
Figure 9. Bentham DTM-c300 pre-amplifier settings.
Figure 10. Bentham DTM-c300 filter wheel settings.

Quality Manual of SpectralIrradiance Measurements
Page 34 (46)
Version: 2.4 Date: December 7, 2015 Last edited by: PK
Figure 11. Bentham DTM-c300 monochromator settings.
The grating properties of the DTM-c300 spectroradiometer are listed in Table 8.Table 8. Properties of the Bentham DTM-c300 spectroradiometer gratings.
Turret 1 Turret 2
Grating 1 Grating 2 Grating 3 Grating 1 Grating 2 Grating 3
Line Density 1800 1200 600 1800 1200 600
Zero Order 11172 177940 343175 126650 293210 461770
Alpha 1 1.0015 1.001 0.999 1 0.999
Max Wave-length
400 850 2500 400 850 2500
Swing Away Mirrors can be adjusted by double clicking on each if them in the list. SwingAway Mirror 1 is deflected on wavelength up to 850nm (both monochromators areused), and not deflected from 851nm and up (only first monochromator is used). Mirrors2 and 3 are always deflected. Settle delay is 1000 ms.
In Slits configuration Auto mode is typically used, so the slit width is adjusted accord-ingly to the wavelength step size.
In miscellaneous settings Lock-in Preamplifier Input should be set to 1.

Quality Manual of SpectralIrradiance Measurements
Page 35 (46)
Version: 2.4 Date: December 7, 2015 Last edited by: PK
6. Handling of calibration items
· 1 kW lamps produce lots of UV. Avoid staring to the lamps. Use protective clothingand limit staying in the vicinity of the lamp to minimum.
· Never move hot lamps. They may explode or the filaments may damage! Allow lampto cool down for min. 2 hours before disassembling the setup.
· Do not touch the envelopes. If there are finger prints do not try to clean them. Beforeoperating, the dust should be removed with soft brush or by blowing clean air.
· Do not touch surfaces of the filters or edges of the apertures.
· If, by accident, any of the optical components get dirty or damaged, notify all col-leagues who might be using the equipment. In case of damage to the lamps, recordthe incidence to the log book.
· For more details, see [10].

Quality Manual of SpectralIrradiance Measurements
Page 36 (46)
Version: 2.4 Date: December 7, 2015 Last edited by: PK
7. Uncertainty budgets
7.1. Uncertainty of the filter radiometerTable 9. Uncertainty budget of the spectral irradiance measurements of a 1-kW tungsten-halogen lamp by using the filter radiometer [3].
Standard Uncertainty [%]
Source of Uncertainty 291 302 315 333 352 382 441 501 572 599 698 801 902
Detector responsivity 0.67 0.67 0.54 0.51 0.51 0.28 0.08 0.07 0.07 0.07 0.07 0.07 0.06
Cryogenic radiometer 0.03 0.03 0.03 0.03 0.03 0.03 0.03 0.03 0.03 0.03 0.03 0.03 0.03
Reflectance modelling 0.00 0.00 0.00 0.00 0.00 0.04 0.04 0.04 0.04 0.04 0.04 0.04 0.02
IQE modelling 0.00 0.00 0.00 0.00 0.00 0.05 0.05 0.05 0.05 0.05 0.05 0.05 0.05
Spectral flatness of pyro 0.50 0.50 0.30 0.30 0.30 0.15 0.00 0.00 0.00 0.00 0.00 0.00 0.00
Repeatability of pyro meas. 0.40 0.40 0.40 0.40 0.40 0.20 0.00 0.00 0.00 0.00 0.00 0.00 0.00
Current measurement 0.20 0.20 0.20 0.10 0.10 0.10 0.03 0.02 0.02 0.02 0.02 0.02 0.02
Nonlinearity 0.01 0.01 0.01 0.01 0.01 0.01 0.01 0.01 0.01 0.01 0.01 0.01 0.01
Filter transmittance 0.97 0.46 0.37 0.31 0.31 0.55 0.18 0.14 0.09 0.11 0.11 0.16 0.15
Peak transmittance 0.89 0.32 0.13 0.19 0.21 0.51 0.12 0.10 0.07 0.07 0.08 0.10 0.09
Wavelength uncertainty 0.24 0.21 0.19 0.17 0.14 0.11 0.08 0.05 0.03 0.03 0.01 0.01 0.01
Wavelength repeatability 0.08 0.12 0.12 0.15 0.14 0.15 0.11 0.08 0.01 0.07 0.07 0.11 0.11
Temperature 0.03 0.03 0.03 0.03 0.03 0.00 0.03 0.01 0.02 0.01 0.01 0.02 0.02
OOB leakage 0.30 0.22 0.26 0.10 0.11 0.08 0.03 0.04 0.03 0.03 0.04 0.05 0.05
Irradiance measurement 0.22 0.22 0.22 0.27 0.27 0.22 0.21 0.21 0.21 0.21 0.21 0.21 0.21
Lamp current 0.08 0.08 0.07 0.07 0.07 0.06 0.06 0.05 0.04 0.04 0.04 0.02 0.02
Distance measurement 0.14 0.14 0.14 0.21 0.21 0.14 0.14 0.14 0.14 0.14 0.14 0.14 0.14
Alignment 0.15 0.15 0.15 0.15 0.15 0.15 0.15 0.15 0.15 0.15 0.15 0.15 0.15
Diffraction 0.03 0.03 0.03 0.03 0.03 0.03 0.03 0.03 0.03 0.03 0.03 0.03 0.03
Aperture area 0.01 0.01 0.01 0.01 0.01 0.01 0.01 0.01 0.01 0.01 0.01 0.01 0.01
Interreflections 0.05 0.14 0.10 0.10 0.11 0.11 0.03 0.02 0.02 0.02 0.01 0.01 0.01
Interpolation 0.50 0.30 0.30 0.30 0.30 0.30 0.30 0.30 0.30 0.30 0.30 0.30 0.30
Combined standard uncertainty 1.30 0.91 0.76 0.73 0.73 0.73 0.42 0.40 0.38 0.39 0.39 0.40 0.40
Expanded uncertainty (k = 2) 2.6 1.8 1.5 1.5 1.5 1.5 0.84 0.80 0.8 0.8 0.8 0.81 0.80
The best measurement capability obtainable in irradiance measurements with the filterradiometer is shown in Table 9. Detailed description on the components may be foundin [1. 3].
7.2. Uncertainty of the DM150 spectroradiometer measurements
The additional uncertainty caused by the DM150 spectroradiometer may be estimatedfrom the results presented in section 5.1.2. The main uncertainty component is themeasurement uncertainty of the photocurrent of the photomultiplier tube, which is 5.5pA (k = 1). This causes an absolute uncertainty component which is different for each
Quality Manual of SpectralIrradiance Measurements
Page 37 (46)
Version: 2.4 Date: December 7, 2015 Last edited by: PK
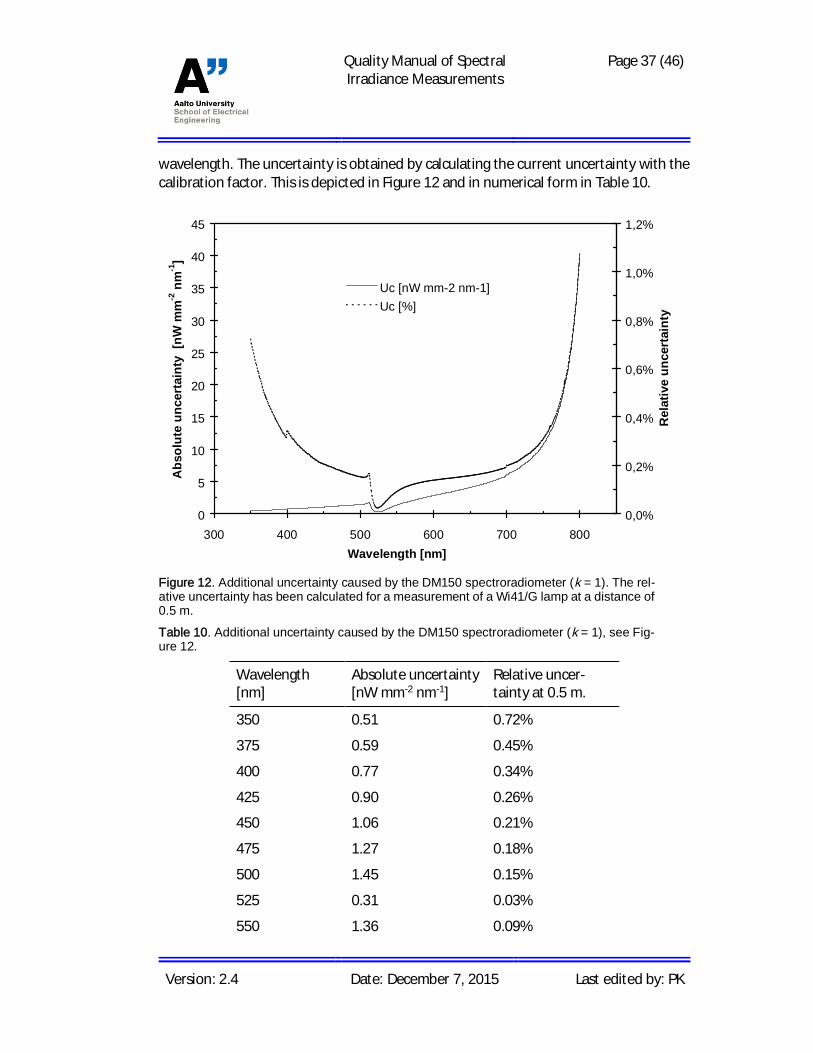
wavelength. The uncertainty is obtained by calculating the current uncertainty with thecalibration factor. This is depicted in Figure 12 and in numerical form in Table 10.
Figure 12. Additional uncertainty caused by the DM150 spectroradiometer (k = 1). The rel-ative uncertainty has been calculated for a measurement of a Wi41/G lamp at a distance of0.5 m.
Table 10. Additional uncertainty caused by the DM150 spectroradiometer (k = 1), see Fig-ure 12.
Wavelength[nm]
Absolute uncertainty[nW mm-2 nm-1]
Relative uncer-tainty at 0.5 m.
350 0.51 0.72%
375 0.59 0.45%
400 0.77 0.34%
425 0.90 0.26%
450 1.06 0.21%
475 1.27 0.18%
500 1.45 0.15%
525 0.31 0.03%
550 1.36 0.09%
0
5
10
15
20
25
30
35
40
45
300 400 500 600 700 800Wavelength [nm]
Abs
olut
eun
cert
aint
y[n
Wm
m-2
nm-1
]
0,0%
0,2%
0,4%
0,6%
0,8%
1,0%
1,2%
Rel
ativ
eun
cert
aint
y
Uc [nW mm-2 nm-1]Uc [%]

Quality Manual of SpectralIrradiance Measurements
Page 38 (46)
Version: 2.4 Date: December 7, 2015 Last edited by: PK
575 2.18 0.12%
600 2.84 0.14%
625 3.44 0.15%
650 4.08 0.16%
675 4.86 0.17%
700 6.13 0.20%
725 7.82 0.24%
750 10.75 0.31%
775 17.51 0.48%
800 40.25 1.07%
The uncertainty was verified by calibrating the DM150 spectroradiometer first with alamp, and thereafter immediately measuring the same lamp. The measurement resultswith the calculated absolute uncertainty are presented in Figure 13.
Figure 13. Calibration of the DM150 spectroradiometer using lamp CDS9502, measure-ment of the same lamp, and difference of the two measurements. Standard deviation in theregion [400-450 nm] is 1.25 nW mm-2 nm-1.
It can be seen that 63 % of the deviations fit within the measurement uncertainty. Thisseems to be justified, since there are two lamp measurements involved; the calibration
0,0
0,5
1,0
1,5
2,0
2,5
3,0
3,5
350 400 450 500 550 600 650 700 750 800Wavelength [nm]
Spec
tral
Irra
dian
ce[u
Wm
m-2
nm-1
]
-30
-20
-10
0
10
20
30
40
50
Diff
eren
ce[n
Wm
m-2
nm-1
]
MeasurementCalibrationDifferenceUncertainty (k=2)

Quality Manual of SpectralIrradiance Measurements
Page 39 (46)
Version: 2.4 Date: December 7, 2015 Last edited by: PK
and the measurement. The additional uncertainty values presented in Table 10 and Fig-ure 12 actually add up in both measurements. It may therefore be concluded that theminimum additional measurement uncertainties with the spectroradiometer are twicethe figures of Table 10 and Figure 12.
The deviations of Figure 13 are given in relative form in Figure 14. The relative uncer-tainty seems approximately wavelength independent. The value can be calculated as
%38,0%32,02,0 22 =+=cu (k = 1). If we add to this value the uncertainty of the stand-ard lamp. 0.32 % (k = 1), and the uncertainty of the distance measurement (0.5/500), weend up in the expanded uncertainty of the measurement, 1 % (k = 2).
Figure 14. Relative difference between the measurements in Figure 13. The average dif-ference is 0.20% and the standard deviation is 0.32%.
7.3. Uncertainty of colorimetric quantities
The principles for calculating the uncertainties for the correlated colour temperatureand colour co-ordinates (x, y) of a lamp have been presented in [1]. The uncertainty ofthe colour temperature was calculated by assuming a scenario, where all measurementerror accumulates as a function of wavelength. i.e., the other end of the spectrum wasraised and lowered by its uncertainty. The standard uncertainty of the correlated colourtemperature obtained was 2 K, thus resulting in expanded uncertainty of 4 K (k = 2).Expanded uncertainty of 5 K has been accepted into the BIPM CMC database. Obtainingthis low value requires use of the primary standard filter radiometer freshly calibrated.In most customer calibrations, U = 15 K (k = 2) is assumed.
Uncertainties of the colour co-ordinates (x, y) may be calculated using the uncertaintyof the correlated colour temperature. These uncertainties depend heavily on the colourtemperature of the source. Colour co-ordinates are calculated separately for a Planckian
-2,0%
-1,5%
-1,0%
-0,5%
0,0%
0,5%
1,0%
1,5%
2,0%
350 400 450 500 550 600 650 700 750 800Wavelength [nm]
Rel
ativ
edi
ffer
ence

Quality Manual of SpectralIrradiance Measurements
Page 40 (46)
Version: 2.4 Date: December 7, 2015 Last edited by: PK
radiator at three temperatures: the nominal colour temperature and temperatures 2 Klower and higher. The average of the colour differences from the nominal colour co-ordinates can be used as the standard uncertainty component for the colour co-ordi-nate. Standard uncertainties calculated this way are given in Table 11 for several colourtemperatures in the measurement range.Table 11. Uncertainties of colour co-ordinates as function of correlated colour temperature.Uncertainties are given separately for x and y co-ordinates, both as absolute and relativeuncertainties. Values are valid for black (grey) body sources only.
Tc ux ux/x uy uy/y
1000 0.00028 0.043 % 0.00025 0.073 %
1500 0.00025 0.043 % 0.00013 0.034 %
2000 0.00022 0.041 % 0.00003 0.008 %
2500 0.00018 0.038 % 0.00002 0.006 %
2856 0.00015 0.034 % 0.00004 0.011 %
3000 0.00014 0.033 % 0.00005 0.012 %
3200 0.00013 0.031 % 0.00005 0.013 %
3500 0.00011 0.028 % 0.00006 0.014 %
The best measurement capability may be estimated to be 0.1 % (k = 2).
Quality Manual of SpectralIrradiance Measurements
Page 41 (46)
Version: 2.4 Date: December 7, 2015 Last edited by: PK
8. Accommodation and environmental conditions
The spectral irradiance measurements are done mainly in the Optical Power Laboratory,which is located in room I136 in the basement of the Department of Electrical and Com-munications Engineering. This laboratory is a clean room. Instructions for using the cleanrooms have been given in [13]. The measurements are done on the optical bench.Maintenance and use of this bench is described in [14].
During calibrations:
· The Clean Zone -aggregate should be on to prevent dust.
· Temperature should be monitored.
· Humidity should be monitored.
Humidity and temperature values during the calibrations are written to calibration cer-tificates.
Measurements with the filter radiometer may also be done outside the university. The-se field measurements should be done in corresponding laboratory conditions.
[13] Clean room instructions / Puhdastilaohjeet.
[14] Quality manual of luminous intensity laboratory.
Quality Manual of SpectralIrradiance Measurements
Page 42 (46)
Version: 2.4 Date: December 7, 2015 Last edited by: PK
9. Field calibrations
Field calibrations may be done for certain customers. Equipment that needs to be trans-ported and changes to the methods used are mentioned in chapters 3 and 5.
Quality assurance routines and operating instructions of the customers are to be fol-lowed. This concerns e.g.
· Operation of the customer lamps, including current and voltage monitoring.
· Control and monitoring of environmental conditions.
· Alignment and distance measuring.
The procedures used should be recorded to the calibration setups with care, and theeffect of deviations should be estimated and added to the uncertainty budgets.
Quality Manual of SpectralIrradiance Measurements
Page 43 (46)
Version: 2.4 Date: December 7, 2015 Last edited by: PK
10. Control data
The measurement data coming from calibrations and development of equipment arearchived. The Excel or Matlab programs used for analysing the filter radiometer meas-urements are archived with the raw data. If Matlab programs are used to control themeasurements, these programs are stored as well.
Raw measurement data from filter radiometer measurements are archived by PetriKärhä. All data is written in a chronological order to a black notebook labelled “Detectorcalibrations and measurements.” If the data are in a computer-file, file name and loca-tion with description about the measurement are written to the book. By default, allfiles are stored in \\work.org.aalto.fi\T405\MIKES-Aalto\work\petek\Kalibroinnit\which contains folder for each customer. Stability of the components, especially the fil-ters, is monitored. This data is stored in calibration certificates, which are archived.
Data from the spectroradiometer measurements are archived by Jari Hovila. Computerfiles are transferred from the measurement computer to his office computer, which isused also to store the analyzed data. Data is organized by creating an own folder foreach customer. Written measurement notes including date, set-up and the names of thecomputer files are archived in a chronological order to a brown folder labelled “Photo-metric measurements and calibrations.”
Data from the spectral irradiance measurements are stored by Maija Ojanen. Data inelectrical form are stored in subfolders of \\metrology\mri-nfs\Maija\kalibroinnit. Thedata is organized by creating a subfolder for each customer each year, eg. 'customer2008'. Data in paper form are stored in a folder labeled 'Kalibrointitodistukset' in roomI427.
Raw measurement data from spectral irradiance measurements are stored by TuomoHyvönen. Data files are stored in subfolders by customer name in \\metrology\mri-nfs\Tuomo\Kalibroinnit\Kalibroinnit_201x, where x indicates to the year of calibration.Data in paper form are stored in the folder labeled Spectral Irradiance Calibrations inroom I427.
Lamp 245 is used as a control lamp to monitor the history of the scale.

Quality Manual of SpectralIrradiance Measurements
Page 44 (46)
Version: 2.4 Date: December 7, 2015 Last edited by: PK
11. Certificates
Calibration certificates are handled according to [15]. Include in the calibration certifi-cate:
· Optical axis used, vertical / horizontal
· Distance and reference plane used
· Lamp current and voltage before and after the measurements
· Burning time of the lamp during the measurements
· Ambient temperature and relative humidity
· Accurate spectral irradiance values at the effective wavelengths of the filter radiom-eters
· Values of the parameters for the interpolation function
· Interpolated spectral irradiance values with e.g. 1 nm or 0.5 nm interval as agreedwith the customer (in an attachment file).
· If required: Chromaticity co-ordinates x, y and correlated colour temperature Tc.
· Condition of the lamp:
- Filament sag
- Dust and stains on the envelope
- Electrical stability
[15] Instructions for writing calibration certificates.

Quality Manual of SpectralIrradiance Measurements
Page 45 (46)
Version: 2.4 Date: December 7, 2015 Last edited by: PK
12. Intercomparisons
· K. Jokela, L. Ylianttila, R. Visuri, P. Kärhä, and E. Ikonen, “Intercomparison of lampand detector-based UV-irradiance scales for solar UV radiometry,” J. Geophys. Res.105, 4821–4827 (2000).
· K. D. Stock, K.-H. Raatz, P. Sperfeld, J. Metzdorf, T. Kübarsepp, P. Kärhä, E. Ikonen,and L. Liedquist, “Detector-stabilized FEL lamps as transfer standards in an interna-tional comparison of spectral irradiance,” Metrologia 37, 441–444 (2000).
· T. Kübarsepp, P. Kärhä, F. Manoocheri, S. Nevas, L. Ylianttila, and E. Ikonen, “Spectralirradiance measurements of tungsten lamps with filter radiometers in the spectralrange 290 nm to 900 nm,” Metrologia 37, 305–312 (2000).
· T. Kübarsepp, H. Yoon, S. Nevas, P. Kärhä, and E. Ikonen, “Comparison of spectralirradiance scales between NIST and HUT,” Metrologia 39, 399–402 (2002).
· P. Kärhä, N. J. Harrison, S. Nevas, W. S. Hartree and I. Abu-Kassem, “Intercomparisonof characterisation techniques of filter radiometers in the ultraviolet region,” Metro-logia 40, S50–S54 (2003).
· E. Woolliams, N. Fox, M. Cox, P. Harris, and N. Harrison, “Final report on CCPR K1-a:Spectral irradiance from 250 nm to 2500 nm,” Metrologia 43, 02003 (2006).
· M Ojanen, M Shpak, P Kärhä, R Leecharoen, and E Ikonen, “Report of the spectralirradiance comparison EURAMET.PR-K1.a.1 between MIKES (Finland) and NIMT(Thailand),” Metrologia 46, 02001 (2009).

Quality Manual of SpectralIrradiance Measurements
Page 46 (46)
Version: 2.4 Date: December 7, 2015 Last edited by: PK
13. Publications


![Inter-hour direct normal irradiance forecast with multiple ... · ahead solar irradiance forecast [11, 12] and long-term solar irradiance estimation [13]. However, for an inter-hour](https://static.fdocuments.in/doc/165x107/5f43655640b4404ee374a6b6/inter-hour-direct-normal-irradiance-forecast-with-multiple-ahead-solar-irradiance.jpg)