
Quality Insurance of rectal cancer – phase 3: statistical ... · PDF file(Institut...
292
Quality Insurance of rectal cancer – phase 3: statistical methods to benchmark centers on a set of quality indicators – Supplement part II KCE reports 161S Belgian Health Care Knowledge Centre Federaal Kenniscentrum voor de Gezondheidszorg Centre fédéral d’expertise des soins de santé 2011
Transcript of Quality Insurance of rectal cancer – phase 3: statistical ... · PDF file(Institut...
Quality Insurance of rectal cancer – phase 3: statistical methods to
benchmark centers on a set of quality indicators – Supplement part II
KCE reports 161S
Belgian Health Care Knowledge Centre Federaal Kenniscentrum voor de Gezondheidszorg
Centre fédéral d’expertise des soins de santé 2011
The Belgian Health Care Knowledge Centre
Introduction: The Belgian Health Care Knowledge Centre (KCE) is an organization of public interest, created on the 24th of December 2002 under the supervision of the Minister of Public Health and Social Affairs. KCE is in charge of conducting studies that support the political decision making on health care and health insurance.
Executive Board
Actual Members: Pierre Gillet (President), Dirk Cuypers (Vice-president), Jo De Cock (Vice-president), Frank Van Massenhove (Vice-president), Maggie De Block, Jean-Pierre Baeyens, Ri de Ridder, Olivier De Stexhe, Johan Pauwels, Daniel Devos, Jean-Noël Godin, Xavier De Cuyper, Palstermans Paul, Xavier Brenez, Rita Thys, Marc Moens, Marco Schetgen, Patrick Verertbruggen, Michel Foulon, Myriam Hubinon, Michael Callens, Bernard Lange, Jean-Claude Praet.
Substitute Members: Rita Cuypers, Christiaan De Coster, Benoît Collin, Lambert Stamatakis, Karel Vermeyen, Katrien Kesteloot, Bart Ooghe, Frederic Lernoux, Anne Vanderstappen, Greet Musch, Geert Messiaen, Anne Remacle, Roland Lemeye, Annick Poncé, Pierre Smiets, Jan Bertels, Celien Van Moerkerke, Yolande Husden, Ludo Meyers, Olivier Thonon, François Perl.
Government commissioner: Yves Roger
Management
Chief Executive Officer: Raf Mertens
Assistant Chief Executive Officer: Jean-Pierre Closon
Information
Federaal Kenniscentrum voor de gezondheidszorg - Centre fédéral d’expertise des soins de santé – Belgian Health Care Knowlegde Centre. Centre Administratif Botanique, Doorbuilding (10th floor) Boulevard du Jardin Botanique 55 B-1000 Brussels Belgium Tel: +32 [0]2 287 33 88 Fax: +32 [0]2 287 33 85 Email : [email protected] Web : http://www.kce.fgov.be
Quality Assurance of rectal cancer diagnosis and treatment –
phase 3: statistical methods to benchmark centres on a set of quality indicators – Supplement
part II
KCE reports 161S
ELS GOETGHEBEUR, RONAN VAN ROSSEM, KATRIEN BAERT, KURT VANHOUTTE, TOM BOTERBERG, PIETER DEMETTER, MARK DE RIDDER, DAVID HARRINGTON,
MARC PEETERS, GUY STORME, JOHANNA VERHULST, VLAYEN JOAN, VRIJENS FRANCE, STIJN VANSTEELANDT, WIM CEELEN.
Belgian Health Care Knowledge Centre Federaal Kenniscentrum voor de Gezondheidszorg
Centre fédéral d’expertise des soins de santé 2011
KCE reports 161S
Title: Quality Insurance of rectal cancer – phase 3: statistical methods to benchmark centers on a set of quality indicators – Supplement part II
Authors: Els Goetghebeur (UGent), Ronan Van Rossem (UGent), Katrien Baert (UGent), Kurt Vanhoutte (UGent), Tom Boterberg (UZ Gent), Pieter Demetter (Erasme), Mark De Ridder (UZ Brussel), David Harrington (Harvard), Marc Peeters (UZ Antwerp), Guy Storme (UZ Brussel), Johanna Verhulst (UZGent), Joan Vlayen (KCE), France Vrijens (KCE), Stijn Vansteedlandt (Ugent), Wim Ceelen (UZgent)
Reviewers: none
External experts: PROCARE members: Anne Jouret-Mourin (UCL), Alex Kartheuser (UCL), Stephanie Laurent (UZGent), Gaëtan Molle (Hôpital Jolimont La Louvière), Freddy Penninckx (UZ Leuven, president steering group), Jean-Luc Van Laethem (ULB), Koen Vindevoghel (OLV Lourdes Waregem), Xavier de Béthune (ANMC), Catherine Legrand (UCL), Stefan Michiels (Institut Bordet), Ward Rommel (Vlaamse Liga tegen Kanker)
Acknowledgements: The authors thank the PROCARE steering group, their volunteer contributors and patients for making this continued effort for quality improvement. The authors are also grateful to Alain Visscher (Ugent), Geert Silversmit (Ugent) and Carine Staessens (Ugent) for technical assistance in the making of this report. Finally the authors thank Elisabeth Van Eyck (BCR) and Koen Beirens (BCR) for their assistance on the PROCARE database.
External validators: Pr Johan Hellings (ICURO), Pr Pierre Honoré (CHU Liège), Pr Hans C. van Houwelingen (Leiden University).
Conflict of interest: Any other direct or indirect relationship with a producer, distributor or healthcare institution that could be interpreted as a conflict of interests: Vindevoghel Koen
Disclaimer: - The external experts were consulted about a (preliminary) version of the scientific report. Their comments were discussed during meetings. They did not co-author the scientific report and did not necessarily agree with its content.
- Subsequently, a (final) version was submitted to the validators. The validation of the report results from a consensus or a voting process between the validators. The validators did not co-author the scientific report and did not necessarily all three agree with its content.
- Finally, this report has been approved by common assent by the Executive Board.
- Only the KCE is responsible for errors or omissions that could persist. The policy recommendations are also under the full responsibility of the KCE.
Layout: Ine Verhulst
Brussels, July 12th 2011
Study nr 2010-04
Domain: Good Clinical Practice (GCP)
MeSH: Rectal neoplasms ; Quality of health care ; Quality indicators, health care ; Benchmarking ; Regression Analysis
NLM classification: WI 610
Language: English
Format: Adobe® PDF™ (A4)
Legal depot: D/2011/10.273/42
This document is available on the website of the Belgian Health Care Knowledge Centre
KCE reports are published under a “by/nc/nd” Creative Commons Licence (http://creativecommons.org/licenses/by-nc-nd/2.0/be/deed.en).
How to refer to this document?
Goetghebeur E, Van Rossem R, Baert K, Vanhoutte K, Boterberg T, Demetter P, De Ridder M, Harrington D, Peeters M, Storme G, Verhulst J, Vlayen J, Vrijens F, Vansteedlandt S, Ceelen W. Quality Insurance of rectal cancer – phase 3: statistical methods to benchmark centers on a set of quality indicators – Supplement part II. Good Clinical Practice (GCP). Brussels: Belgian Health Care Knowledge Centre (KCE). 2011. KCE Report 161S. D/2011/10.273/42.
KCE Report 161S Procare III – Supplement 220
Appendix 5: Survey on the clinical importance and reliability of reporting of all QCIs discussed in the
PROCARE consensus (July 2010)
INTRODUCTION This document provides the updated list of quality of care indicators (QCIs) to be
used for feedback to the centers, according to the PROCARE consensus of July 24th,
2010.
We kindly ask you to indicate, for each QCI, 1) how you judge the clinical importance of this QCI for evaluating rectal cancer care and 2) to what extent you
think this QCI is reported reliably for each patient in the database.
Please cross out only one possible answer.
Additional thoughts or comments about specific QCIs, are invited in the “…” in the
lower box.
As described in the main report of Deliverable 3 (“Dimensions of care and their
aggregation”) of this project, the results of this survey will play an important role in
the selection of QCIs for constructing aggregate domain-specific and outcome- and
process quality indicators (QIs).
Many thanks for your kind corporation.
KCE Report 161S Procare III – Supplement 221
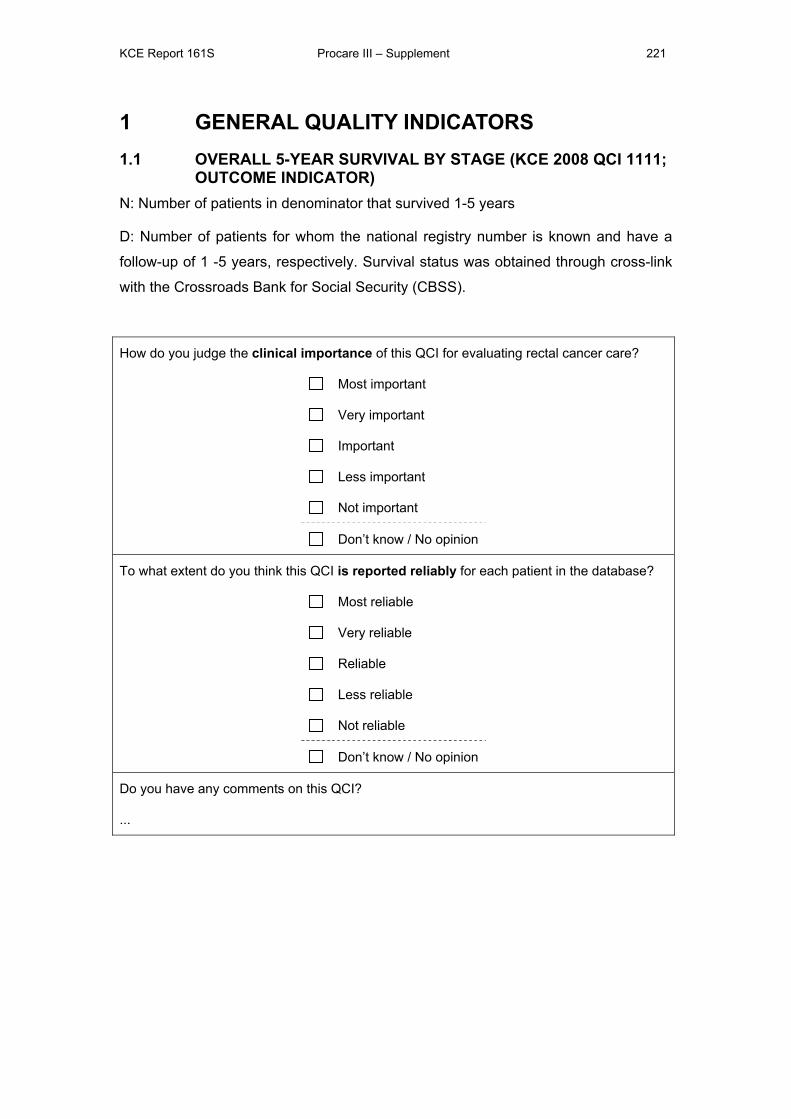
1 GENERAL QUALITY INDICATORS 1.1 OVERALL 5-YEAR SURVIVAL BY STAGE (KCE 2008 QCI 1111;
OUTCOME INDICATOR) N: Number of patients in denominator that survived 1-5 years
D: Number of patients for whom the national registry number is known and have a
follow-up of 1 -5 years, respectively. Survival status was obtained through cross-link
with the Crossroads Bank for Social Security (CBSS).
How do you judge the clinical importance of this QCI for evaluating rectal cancer care?
Most important
Very important
Important
Less important
Not important
Don’t know / No opinion
To what extent do you think this QCI is reported reliably for each patient in the database?
Most reliable
Very reliable
Reliable
Less reliable
Not reliable
Don’t know / No opinion
Do you have any comments on this QCI?
...
KCE Report 161S Procare III – Supplement 222
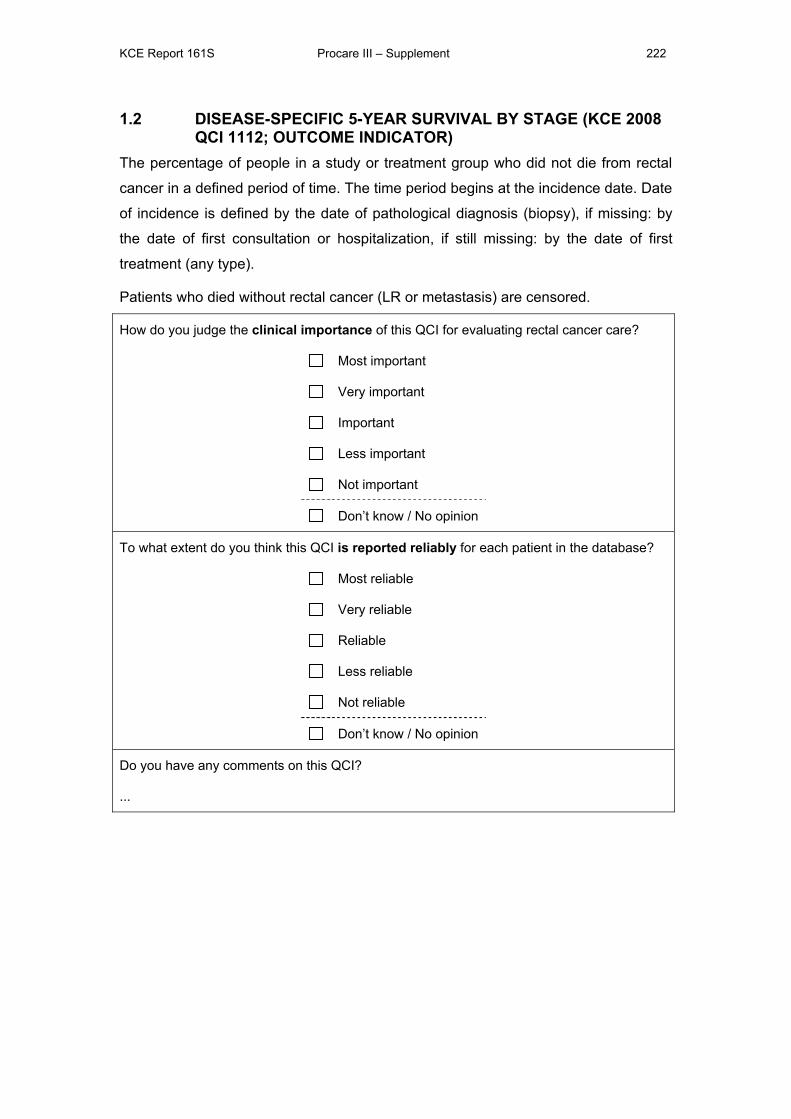
1.2 DISEASE-SPECIFIC 5-YEAR SURVIVAL BY STAGE (KCE 2008 QCI 1112; OUTCOME INDICATOR)
The percentage of people in a study or treatment group who did not die from rectal
cancer in a defined period of time. The time period begins at the incidence date. Date
of incidence is defined by the date of pathological diagnosis (biopsy), if missing: by
the date of first consultation or hospitalization, if still missing: by the date of first
treatment (any type).
Patients who died without rectal cancer (LR or metastasis) are censored.
How do you judge the clinical importance of this QCI for evaluating rectal cancer care?
Most important
Very important
Important
Less important
Not important
Don’t know / No opinion
To what extent do you think this QCI is reported reliably for each patient in the database?
Most reliable
Very reliable
Reliable
Less reliable
Not reliable
Don’t know / No opinion
Do you have any comments on this QCI?
...
KCE Report 161S Procare III – Supplement 223
1.3 RELATIVE SURVIVAL (NEW QCI 1112B; OUTCOME INDICATOR)
The relative survival is the ratio of observed survival in a population to the expected
survival rate. It estimates the chance that a patient will survive a set number of years
after a cancer diagnosis. It is calculated to exclude the chance of death from
diseases other than the cancer and shows whether or not that specific disease
shortens a person's life.
If reliable information on cause of death is available, it is preferable to use the
‘adjusted rate’, i.e. disease (rectal cancer)-specific survival. This is particularly true
when the series is small or when the patients are largely drawn from a particular
segment of the population (e.g. socioeconomic segment).
How do you judge the clinical importance of this QCI for evaluating rectal cancer care?
Most important
Very important
Important
Less important
Not important
Don’t know / No opinion
To what extent do you think this QCI is reported reliably for each patient in the database?
Most reliable
Very reliable
Reliable
Less reliable
Not reliable
Don’t know / No opinion
Do you have any comments on this QCI?
...
KCE Report 161S Procare III – Supplement 224
1.4 PROPORTION OF PATIENTS WITH LOCAL RECURRENCE (KCE 2008 QCI 1113; OUTCOME INDICATOR)
N: Number of patients in denominator who developed a local recurrence at 1-5 year
D: Number of (y)pStage 0-III patients with R0 resection who have a follow-up of 1-5
years, respectively.
How do you judge the clinical importance of this QCI for evaluating rectal cancer care?
Most important
Very important
Important
Less important
Not important
Don’t know / No opinion
To what extent do you think this QCI is reported reliably for each patient in the database?
Most reliable
Very reliable
Reliable
Less reliable
Not reliable
Don’t know / No opinion
Do you have any comments on this QCI?
...
KCE Report 161S Procare III – Supplement 225
1.5 DISEASE-FREE SURVIVAL (NEW QCI 1113B; OUTCOME INDICATOR)
N: Number of patients in denominator who did not develop a local recurrence and/or
distant metastasis at 1-5 year of follow-up.
D: Number of (y)pStage 0-III patients with R0 resection who have a follow-up of 1-5
years, respectively.
How do you judge the clinical importance of this QCI for evaluating rectal cancer care?
Most important
Very important
Important
Less important
Not important
Don’t know / No opinion
To what extent do you think this QCI is reported reliably for each patient in the database?
Most reliable
Very reliable
Reliable
Less reliable
Not reliable
Don’t know / No opinion
Do you have any comments on this QCI?
...
KCE Report 161S Procare III – Supplement 226
2 DIAGNOSIS AND STAGING 2.1 PROPORTION OF PATIENTS WITH A DOCUMENTED
DISTANCE FROM THE ANAL VERGE (KCE 2008 QCI 1211; PROCESS INDICATOR)
N: Number of patients in denominator for whom lower limit of the tumour is known
(see definition lower limit of tumour)
D: Number of registered patients
Priority sequence to determine lower limit: 1. pretreatment rectoscopy, 2.
pretreatment colonoscopy, 3. rectoscopy or colonoscopy at surgery.
Table 1: Level of tumour (lower limit determined by distance from anal verge)
Lower limit tumour (LL) Level tumour
≤ 5 cm Low
>5 - ≤ 10 cm Mid
>10 cm High
For patients with long course neoadjuvant radiotherapy the pretreatment lower limit is
taken as lower limit of the tumour. If no lower limit is available before neoadjuvant
treatment, the lower limit measured at surgery is taken as lower limit of the tumour.
For patients who received neoadjuvant treatment but for whom it is not known
whether they received short or long course radiotherapy, the lowest limit of either the
pretreatment or the lower limit at surgery is taken.
How do you judge the clinical importance of this QCI for evaluating rectal cancer care?
Most important
Very important
Important
Less important
Not important
Don’t know / No opinion
To what extent do you think this QCI is reported reliably for each patient in the database?
Most reliable
Very reliable

KCE Report 161S Procare III – Supplement 227
Reliable
Less reliable
Not reliable
Don’t know / No opinion
Do you have any comments on this QCI?
...
KCE Report 161S Procare III – Supplement 228
2.2 PROPORTION OF PATIENTS IN WHOM A CT OF THE ABDOMEN AND RX OR CT THORAX WAS PERFORMED BEFORE ANY TREATMENT (KCE 2008 QCI 1212; PROCESS INDICATOR)
N: Number of patients in denominator in whom an abdominal CT and (rx thorax or CT
thorax) was performed before any treatment
D: Number of registered patients with elective or scheduled surgery after August 1st
2008.
Until now not used for PROCARE feedback because the use of CT may be
underestimated in patients registered using forms dating prior to August 1st 2008
(related to the structure and formulation of the early forms).
How do you judge the clinical importance of this QCI for evaluating rectal cancer care?
Most important
Very important
Important
Less important
Not important
Don’t know / No opinion
To what extent do you think this QCI is reported reliably for each patient in the database?
Most reliable
Very reliable
Reliable
Less reliable
Not reliable
Don’t know / No opinion
Do you have any comments on this QCI?
...
KCE Report 161S Procare III – Supplement 229
2.3 PROPORTION OF PATIENTS IN WHOM A CEA WAS PERFORMED BEFORE ANY TREATMENT (KCE 2008 QCI 1213; PROCESS INDICATOR)
N: Number of patients in denominator for whom CEA serum level before treatment is
reported
D: Number of registered patients
How do you judge the clinical importance of this QCI for evaluating rectal cancer care?
Most important
Very important
Important
Less important
Not important
Don’t know / No opinion
To what extent do you think this QCI is reported reliably for each patient in the database?
Most reliable
Very reliable
Reliable
Less reliable
Not reliable
Don’t know / No opinion
Do you have any comments on this QCI?
...
KCE Report 161S Procare III – Supplement 230
2.4 PROPORTION OF PATIENTS UNDERGOING ELECTIVE SURGERY THAT HAD PREOPERATIVE COMPLETE LARGE BOWEL-IMAGING (KCE 2008 QCI 1214; PROCESS INDICATOR)
N: Number of patients in denominator who underwent a total coloscopy or a complete
double contrast enema or virtual colonoscopy
D: Number of patients treated with elective or scheduled surgery.
How do you judge the clinical importance of this QCI for evaluating rectal cancer care?
Most important
Very important
Important
Less important
Not important
Don’t know / No opinion
To what extent do you think this QCI is reported reliably for each patient in the database?
Most reliable
Very reliable
Reliable
Less reliable
Not reliable
Don’t know / No opinion
Do you have any comments on this QCI?
...
KCE Report 161S Procare III – Supplement 231
2.5 USE OF TRUS IN CT1/CT2 (NEW QCI 1214B; PROCESS INDICATOR)
N: Number of patients in denominator in whom cT was based on TRUS
D: Number of patients with cT1 or cT2 rectal cancer registered after August 1st 2008
CAUTION: the use of TRUS may be underestimated in patients registered using
forms dating prior to August 1st 2008.
How do you judge the clinical importance of this QCI for evaluating rectal cancer care?
Most important
Very important
Important
Less important
Not important
Don’t know / No opinion
To what extent do you think this QCI is reported reliably for each patient in the database?
Most reliable
Very reliable
Reliable
Less reliable
Not reliable
Don’t know / No opinion
Do you have any comments on this QCI?
...

KCE Report 161S Procare III – Supplement 232
2.6 USE OF MRI IN CSTAGE II OR III (NEW QCI 1214C; PROCESS INDICATOR)
N: Number of patients in denominator in whom cT was based on MRI
D: Number of patients with cStage II or III rectal cancer based on any imaging
technique registered after August 1st 2008.
CAUTION: the use of MRI may be underestimated in patients registered using forms
dating prior to August 1st 2008.
How do you judge the clinical importance of this QCI for evaluating rectal cancer care?
Most important
Very important
Important
Less important
Not important
Don’t know / No opinion
To what extent do you think this QCI is reported reliably for each patient in the database?
Most reliable
Very reliable
Reliable
Less reliable
Not reliable
Don’t know / No opinion
Do you have any comments on this QCI?
...
KCE Report 161S Procare III – Supplement 233
2.7 PROPORTION OF PATIENTS IN WHOM A TRUS AND PELVIC CT AND/OR PELVIC MRI WAS PERFORMED BEFORE ANY TREATMENT (KCE QCI 1215; PROCESS INDICATOR)
N: Number of patients in whom cT or cN were based on TRUS and at least one of
the two following:
• pelvic CT
• pelvic MRI
D: Number of registered patients with rectal cancer of any stage
CAUTION: may be underestimated in patients registered using forms dating prior to
August 1st 2008.
How do you judge the clinical importance of this QCI for evaluating rectal cancer care?
Most important
Very important
Important
Less important
Not important
Don’t know / No opinion
To what extent do you think this QCI is reported reliably for each patient in the database?
Most reliable
Very reliable
Reliable
Less reliable
Not reliable
Don’t know / No opinion
Do you have any comments on this QCI?
...
KCE Report 161S Procare III – Supplement 234
2.8 PROPORTION OF PATIENTS WITH CSTAGE II-III RC THAT HAVE A REPORTED CCRM (KCE QCI 1216; PROCESS INDICATOR)
N: Number of patients in denominator for whom cCRM is reported
D: Number of patients with cStage II-III treated with radical surgical resection.
How do you judge the clinical importance of this QCI for evaluating rectal cancer care?
Most important
Very important
Important
Less important
Not important
Don’t know / No opinion
To what extent do you think this QCI is reported reliably for each patient in the database?
Most reliable
Very reliable
Reliable
Less reliable
Not reliable
Don’t know / No opinion
Do you have any comments on this QCI?
...
KCE Report 161S Procare III – Supplement 235
2.9 ACCURACY OF CM0 STAGING (NEW QCI 1216B; PROCESS INDICATOR)
N: Patients in denominator in whom no metastatic disease was diagnosed within
3months following the date of first treatment (any type).
D: All patients with cStage I-III and for whom a 1 year follow-up is available.
How do you judge the clinical importance of this QCI for evaluating rectal cancer care?
Most important
Very important
Important
Less important
Not important
Don’t know / No opinion
To what extent do you think this QCI is reported reliably for each patient in the database?
Most reliable
Very reliable
Reliable
Less reliable
Not reliable
Don’t know / No opinion
Do you have any comments on this QCI?
...
KCE Report 161S Procare III – Supplement 236
2.10 TIME BETWEEN FIRST HISTOPATHOLOGIC DIAGNOSIS AND FIRST TREATMENT (KCE QCI 1217; PROCESS INDICATOR)
For the patients treated by surgery and/or radiotherapy and/or chemotherapy, the
time interval in days is computed between the date of pathologic diagnosis, if
available, otherwise the date of first contact/hospitalization, and the date of first
treatment.
How do you judge the clinical importance of this QCI for evaluating rectal cancer care?
Most important
Very important
Important
Less important
Not important
Don’t know / No opinion
To what extent do you think this QCI is reported reliably for each patient in the database?
Most reliable
Very reliable
Reliable
Less reliable
Not reliable
Don’t know / No opinion
Do you have any comments on this QCI?
...
For this QCI, what target should be reached for ‘good practice’?
...
KCE Report 161S Procare III – Supplement 237
2.11 ACCURACY OF CT/CN STAGING IF NO OR SHORT RADIOTHERAPY (SEPARATELY PRESENTED IN 2 TABLES) (NEW QCI; PROCESS INDICATOR)
For patients who did not receive neoadjuvant long course radio(chemo)therapy, the
(y)pT/(y)pN is shown related to the cT/cN for these patients.
D: All patients with TRUS/CT/MRI with no or short neoadjuvant radiotherapy (without
long R(C)T) and for whom the pT and pN is known and for whom the cT and cN is
known (excluding patients with c and/or pTx and/or c and/or pNx.
How do you judge the clinical importance of this QCI for evaluating rectal cancer care?
Most important
Very important
Important
Less important
Not important
Don’t know / No opinion
To what extent do you think this QCI is reported reliably for each patient in the database?
Most reliable
Very reliable
Reliable
Less reliable
Not reliable
Don’t know / No opinion
Do you have any comments on this QCI?
...
KCE Report 161S Procare III – Supplement 238
3 NEOADJUVANT TREATMENT Definition:
• Short course regimen are 5 x 5, 10 or 13 x 3 Gy (always without
chemotherapy).
• Long course regimen are 25 or more x 1.8 Gy (with or without
chemotherapy).
3.1 PROPORTION OF CSTAGE II-III PATIENTS THAT RECEIVED A NEOADJUVANT PELVIC RT (NEW QCI 1221; PROCESS INDICATOR)
For high rectal cancer (> 10 cm)
N: Number of patients in denominator who received neoadjuvant R(C)T
D: Number of patients in cStage II or III, treated with radical surgical resection with
tumour in upper third
For mid rectal cancer (>5 - 10 cm)
N: Number of patients in denominator who received neoadjuvant R(C)T
D: Number of patients in cStage II or III, treated with radical surgical resection with
tumour in middle third
For low rectal cancer (≤ 5 cm)
N: Number of patients in denominator who received neoadjuvant treatment
D: Number of patients in cStage II or III, treated with radical surgical resection with
tumour in lower third
How do you judge the clinical importance of this QCI for evaluating rectal cancer care?
Most important
Very important
Important
Less important
Not important
Don’t know / No opinion
To what extent do you think this QCI is reported reliably for each patient in the database?
Most reliable

KCE Report 161S Procare III – Supplement 239
Very reliable
Reliable
Less reliable
Not reliable
Don’t know / No opinion
Do you have any comments on this QCI?
...
KCE Report 161S Procare III – Supplement 240
3.2 PROPORTION OF PATIENTS WITH CCRM ≤ 2 MM ON MRI/CT THAT RECEIVED LONG COURSE NEOADJUVANT RADIO(CHEMO)THERAPY (NEW QCI 1221B; PROCESS INDICATOR)
N: Number of patients in denominator who received long course neoadjuvant
radio(chemo)therapy
D: Number of patients treated with radical surgical resection and for whom cCRM is ≤ 2 mm
How do you judge the clinical importance of this QCI for evaluating rectal cancer care?
Most important
Very important
Important
Less important
Not important
Don’t know / No opinion
To what extent do you think this QCI is reported reliably for each patient in the database?
Most reliable
Very reliable
Reliable
Less reliable
Not reliable
Don’t know / No opinion
Do you have any comments on this QCI?
...
KCE Report 161S Procare III – Supplement 241
3.3 PROPORTION OF PATIENTS WITH CSTAGE I THAT RECEIVED NEOADJUVANT RADIO(CHEMO)THERAPY (NEW QCI 1221C; PROCESS INDICATOR)
For high rectal cancer (> 10 cm)
N: Number of patients in denominator who received neoadjuvant R(C)T
D: Number of patients in cStage I, treated with radical surgical resection with tumour
in upper third
For mid rectal cancer (>5 - 10 cm)
N: Number of patients in denominator who received neoadjuvant R(C)T
D: Number of patients in cStage I, treated with radical surgical resection with tumour
in middle third
For low rectal cancer (≤ 5 cm)
N: Number of patients in denominator who received neoadjuvant treatment
D: Number of patients in cStage I, treated with radical surgical resection with tumour
in lower third
How do you judge the clinical importance of this QCI for evaluating rectal cancer care?
Most important
Very important
Important
Less important
Not important
Don’t know / No opinion
To what extent do you think this QCI is reported reliably for each patient in the database?
Most reliable
Very reliable
Reliable
Less reliable
Not reliable
Don’t know / No opinion
Do you have any comments on this QCI?...
KCE Report 161S Procare III – Supplement 242
3.4 PROPORTION OF CSTAGE II-III PATIENTS TREATED WITH NEOADJUVANT 5-FU BASED CHEMORADIATION, THAT RECEIVED A CONTINUOUS INFUSION OF 5-FU (KCE 2008 QCI 1224; PROCESS INDICATOR)
N: Number of patients in denominator that received a continuous infusion of 5-FU.
D: Number of patients with cStage II-III treated with radical surgical resection and
long course pelvic chemoradiotherapy
Note Not used in PROCARE feedback until 2009 because not enough data. Solved
retrospectively (at least partially by means of reminders in spring 2010). Also,
alternative methods became available in the meantime (e.g. oral capecitabine).
How do you judge the clinical importance of this QCI for evaluating rectal cancer care?
Most important
Very important
Important
Less important
Not important
Don’t know / No opinion
To what extent do you think this QCI is reported reliably for each patient in the database?
Most reliable
Very reliable
Reliable
Less reliable
Not reliable
Don’t know / No opinion
Do you have any comments on this QCI?
...
KCE Report 161S Procare III – Supplement 243
3.5 PROPORTION OF CSTAGE II-III PATIENTS TREATED WITH A LONG COURSE OF PREOPERATIVE PELVIC RT OR CHEMORADIATION, THAT COMPLETED THIS NEOADJUVANT TREATMENT WITHIN THE PLANNED TIMING (KCE 2008 QCI 1225; PROCESS INDICATOR)
N: Number of patients in denominator for whom the radiotherapy treatment was not
interrupted for more than five working days
D: Number of patients with cStage II-III who started with long course neoadjuvant
radiotherapy which was followed by radical surgical resection.
How do you judge the clinical importance of this QCI for evaluating rectal cancer care?
Most important
Very important
Important
Less important
Not important
Don’t know / No opinion
To what extent do you think this QCI is reported reliably for each patient in the database?
Most reliable
Very reliable
Reliable
Less reliable
Not reliable
Don’t know / No opinion
Do you have any comments on this QCI?
...
KCE Report 161S Procare III – Supplement 244
3.6 PROPORTION OF CSTAGE II-III PATIENTS TREATED WITH A LONG COURSE OF PREOPERATIVE PELVIC RT OR CHEMORADIATION, THAT WAS OPERATED 4 TO 12 WEEKS AFTER COMPLETION OF THE (CHEMO)RADIATION (KCE 2008 QCI 1226; PROCESS INDICATOR)
N: Number of patients in denominator that was operated 4 to 12 weeks after
completion of the (chemo)radiotherapy
D: Number of patients with cStage II-III treated with long course neoadjuvant
radiotherapy and for whom date of surgery and date of last irradiation are not missing
How do you judge the clinical importance of this QCI for evaluating rectal cancer care?
Most important
Very important
Important
Less important
Not important
Don’t know / No opinion
To what extent do you think this QCI is reported reliably for each patient in the database?
Most reliable
Very reliable
Reliable
Less reliable
Not reliable
Don’t know / No opinion
Do you have any comments on this QCI?
...
KCE Report 161S Procare III – Supplement 245
3.7 RATE OF ACUTE GRADE 4 RADIO(CHEMO)THERAPY-RELATED COMPLICATIONS (KCE 2008 QCI 1227; PROCESS INDICATOR)
N: Number of patients in denominator that were presented acute grade 4
complications during/up to 8 weeks after completion of neoadjuvant or adjuvant
(chemo)radiotherapy (long or short).
D: Number of patients treated with neoadjuvant or adjuvant radiotherapy and for
whom follow-up data (at least until 1 year) are available.
Note Not used in PROCARE feedback until 2009 because not enough data. Solved
retrospectively (at least partially by means of reminders in spring 2010).
How do you judge the clinical importance of this QCI for evaluating rectal cancer care?
Most important
Very important
Important
Less important
Not important
Don’t know / No opinion
To what extent do you think this QCI is reported reliably for each patient in the database?
Most reliable
Very reliable
Reliable
Less reliable
Not reliable
Don’t know / No opinion
Do you have any comments on this QCI?
...
KCE Report 161S Procare III – Supplement 246
4 SURGERY 4.1 PROPORTION OF R0 RESECTIONS (KCE 2008 QCI 1231;
OUTCOME INDICATOR) Definitions:
• R0 status. Resections are classified as R0 if cM does not equal ‘M1’
and if type of resection at surgery is not ‘R2’ and if no one of the four
criteria of R1 status are present.
• R1 status. Resections are classified as R1 if cM does not equal ‘M1’
and if type of resection at surgery is not ‘R2’ and if at least one of the
following four conditions is present:
o (y)pCRM < 1 mm
o distal resection margin < 1 mm
o rectum perforation as indicated by the surgeon
o rectum perforation as indicated by the pathologist
• R2 status. Resections are classified as R2 if cM equals M1 and/or
metastasis are discovered at surgery (and not completely resected).
Thus, if the type of resection at surgery is reported to be ‘R2’ then R
status equals ‘R2’.
• R status is reported as missing if cM status is missing and/or if data on
two or more of the following criteria are missing: tumor free status of
the (y)pCRM, the tumor free status of the distal resection margin,
rectum perforation as indicated by the surgeon or pathologist.
R0 resection
N: Number of patients in denominator with R0 resection
D: Number of patients treated with radical surgical resection and for whom R status is
not missing
R1 resection
N: Number of patients in denominator with R1 resection
D: Number of patients treated with radical surgical resection and for whom R status is
not missing
KCE Report 161S Procare III – Supplement 247
R2 resection
N: Number of patients in denominator with R status equal ‘R2’
D: Number of patients treated with radical surgical resection and for whom R status is
not missing
How do you judge the clinical importance of this QCI for evaluating rectal cancer care?
Most important
Very important
Important
Less important
Not important
Don’t know / No opinion
To what extent do you think this QCI is reported reliably for each patient in the database?
Most reliable
Very reliable
Reliable
Less reliable
Not reliable
Don’t know / No opinion
Do you have any comments on this QCI?
...
KCE Report 161S Procare III – Supplement 248
4.2 PROPORTION OF APR AND HARTMANN’S PROCEDURE OR TOTAL EXCISION OF COLON AND RECTUM WITH DEFINITIVE ILEOSTOMY (KCE 2008 QCI 1232A; OUTCOME INDICATOR)
Global (QCI)
N: Number of patients in denominator in whom APER or Hartmann’s procedure or
total excision of colon and rectum with definitive ileostomy was performed
D: Number of patients treated with any type of resection for rectal cancer at any
known level
For high rectal cancer (> 10 cm)
N: Number of patients in denominator in whom APER or Hartmann’s procedure or
total excision of colon and rectum with definitive ileostomy was performed
D: Number of patients treated with any type of resection for tumour in upper third
For mid rectal cancer (>5 - 10 cm)
N: Number of patients in denominator in whom APER or Hartmann’s procedure or
total excision of colon and rectum with definitive ileostomy was performed
D: Number of patients treated with any type of resection for tumour in middle third
For low rectal cancer (≤ 5 cm)
N: Number of patients in denominator in whom APR or Hartmann’s procedure or total
excision of colon and rectum with definitive ileostomy was performed
D: Number of patients treated with any type of resection for tumour in lower third
KCE Report 161S Procare III – Supplement 249
4.3 PROPORTION OF PATIENTS WITH STOMA 1 YEAR AFTER SPHINCTER-SPARING SURGERY (KCE 2008 QCI 1232B; OUTCOME INDICATOR)
N: Number of patients in denominator still having a stoma 1 year after surgery
D: Number of patients treated with TME (complete rectum resection (TME) + straight
CAA, coloplasty, pouch, side-to-end CAA, total excision of colon and rectum with
IPAA, or another specified type of reconstruction) with a primary (constructed at the
time of SSO) or secondary (constructed after SSO) derivative stoma or dismantling of
anastomosis still alive 1 year after surgery and for whom follow-up at 1 year or more
is known.
How do you judge the clinical importance of this QCI for evaluating rectal cancer care?
Most important
Very important
Important
Less important
Not important
Don’t know / No opinion
To what extent do you think this QCI is reported reliably for each patient in the database?
Most reliable
Very reliable
Reliable
Less reliable
Not reliable
Don’t know / No opinion
Do you have any comments on this QCI?
...
KCE Report 161S Procare III – Supplement 250
4.4 RATE OF PATIENTS WITH MAJOR LEAKAGE OF THE ANASTOMOSIS AFTER PME + SSO + RECONSTRUCTION (NEW QCI 1233A; OUTCOME INDICATOR)
N: Number of patients with major leakage of the anastomosis (requiring reoperation
for leakage)
D: Number of patients treated with PME (high or low anterior resection with colorectal
anastomsosis) and for whom it is reported whether there were postoperative
complications or not.
How do you judge the clinical importance of this QCI for evaluating rectal cancer care?
Most important
Very important
Important
Less important
Not important
Don’t know / No opinion
To what extent do you think this QCI is reported reliably for each patient in the database?
Most reliable
Very reliable
Reliable
Less reliable
Not reliable
Don’t know / No opinion
Do you have any comments on this QCI?
...
KCE Report 161S Procare III – Supplement 251
4.5 RATE OF PATIENTS WITH MAJOR LEAKAGE OF THE ANASTOMOSIS AFTER TME + SSO + RECONSTRUCTION (GLOBAL, I.E. WITH OR WITHOUT PRIMARY DERIVATIVE STOMA) (NEW QCI 1233B; OUTCOME INDICATOR)
N: Number of patients with major leakage of the anastomosis (requiring reoperation
for leakage)
D: Number of patients treated with TME (complete rectum resection (TME) + straight
CAA, coloplasty, pouch, side-to-end CAA, total excision of colon and rectum with
IPAA, or another specified type of reconstruction) and for whom it is reported
whether there were postoperative complications or not
How do you judge the clinical importance of this QCI for evaluating rectal cancer care?
Most important
Very important
Important
Less important
Not important
Don’t know / No opinion
To what extent do you think this QCI is reported reliably for each patient in the database?
Most reliable
Very reliable
Reliable
Less reliable
Not reliable
Don’t know / No opinion
Do you have any comments on this QCI?
...
KCE Report 161S Procare III – Supplement 252
4.6 INPATIENT OR 30-DAY MORTALITY (KCE 2008 QCI 1234; OUTCOME INDICATOR)
N: Number of patients in denominator who died in hospital or within 30 days after
surgery
D: Number of patients treated with radical surgical resection and for whom it is known
whether they died in hospital or within 30 days after surgery and for whom the dates
of surgery and survival or death are known.
How do you judge the clinical importance of this QCI for evaluating rectal cancer care?
Most important
Very important
Important
Less important
Not important
Don’t know / No opinion
To what extent do you think this QCI is reported reliably for each patient in the database?
Most reliable
Very reliable
Reliable
Less reliable
Not reliable
Don’t know / No opinion
Do you have any comments on this QCI?
...
KCE Report 161S Procare III – Supplement 253
4.7 POSTOPERATIVE MAJOR SURGICAL MORBIDITY WITH REINTERVENTION UNDER NARCOSIS AFTER RADICAL SURGICAL RESECTION (NEW QCI 1234B; OUTCOME INDICATOR)
N: Number of patients in denominator who presented major surgical morbidity
requiring reintervention under narcosis
D: Number of patients treated with radical surgical resection and for whom
postoperative data on morbidity/mortality are available
How do you judge the clinical importance of this QCI for evaluating rectal cancer care?
Most important
Very important
Important
Less important
Not important
Don’t know / No opinion
To what extent do you think this QCI is reported reliably for each patient in the database?
Most reliable
Very reliable
Reliable
Less reliable
Not reliable
Don’t know / No opinion
Do you have any comments on this QCI?
...
KCE Report 161S Procare III – Supplement 254
4.8 RATE OF INTRA-OPERATIVE RECTAL PERFORATION (KCE 2008 QCI 1235; OUTCOME INDICATOR)
N: Number of patients in denominator for whom the surgeon and/or pathologist
reported rectal perforation
D: Number of patients treated with radical surgical resection and for whom
perforation of the rectum (yes or no) is reported by either the surgeon or the
pathologist.
How do you judge the clinical importance of this QCI for evaluating rectal cancer care?
Most important
Very important
Important
Less important
Not important
Don’t know / No opinion
To what extent do you think this QCI is reported reliably for each patient in the database?
Most reliable
Very reliable
Reliable
Less reliable
Not reliable
Don’t know / No opinion
Do you have any comments on this QCI?
...
KCE Report 161S Procare III – Supplement 255
4.9 (Y)P DISTAL MARGIN INVOLVED (POSITIVE) AFTER SSO OR HARTMANN FOR LOW RECTAL CANCER (≤ 5 CM) (NEW QCI 1235B; OUTCOME INDICATOR)
N: Number of patients in denominator for whom the (y)p distal margin is invaded
D: Number of patients treated with Hartmann’s procedure or SSO for rectal cancer in
the lower third and for whom it is reported whether the (y)p distal margin is free or
invaded.
How do you judge the clinical importance of this QCI for evaluating rectal cancer care?
Most important
Very important
Important
Less important
Not important
Don’t know / No opinion
To what extent do you think this QCI is reported reliably for each patient in the database?
Most reliable
Very reliable
Reliable
Less reliable
Not reliable
Don’t know / No opinion
Do you have any comments on this QCI?
...
KCE Report 161S Procare III – Supplement 256
4.10 MESORECTAL (Y)PCRM POSITIVITY AFTER RADICAL SURGICAL RESECTION (NEW QCI 1235C; OUTCOME INDICATOR)
Note The definition of positivity (≤ 1 mm ) differs with the definition of R1 status
(invaded). It should apply only to the lateral margin of the mesorectum not to serosal
positivity
Global
N: Number of patients in denominator for whom the mesorectal (y)pCRM ≤ 1 mm
D: Number of patients treated with radical surgical resection and for whom the
mesorectal (y)pCRM is known
For high rectal cancer (> 10 cm)
N: Number of patients in denominator for whom the mesorectal (y)pCRM ≤ 1 mm
D: Number of patients treated with radical surgical resection with tumour in highest
third and for whom (y)pCRM is known
For mid rectal cancer (>5 - 10 cm)
N: Number of patients in denominator for whom the mesorectal (y)pCRM ≤ 1 mm
D: Number of patients treated with radical surgical resection with tumour in middle
third and for whom (y)pCRM is known
For low rectal cancer (≤ 5 cm)
N: Number of patients in denominator for whom the mesorectal (y)pCRM ≤ 1 mm
D: Number of patients treated with radical surgical resection with tumour in lowest
third and for whom the mesorectal (y)pCRM is known
How do you judge the clinical importance of this QCI for evaluating rectal cancer care?
Most important
Very important
Important
Less important
Not important
Don’t know / No opinion
To what extent do you think this QCI is reported reliably for each patient in the database?

KCE Report 161S Procare III – Supplement 257
Most reliable
Very reliable
Reliable
Less reliable
Not reliable
Don’t know / No opinion
Do you have any comments on this QCI?
...
KCE Report 161S Procare III – Supplement 258
5 ADJUVANT TREATMENT 5.1 PROPORTION OF (Y)PSTAGE III PATIENTS WITH R0
RESECTION THAT RECEIVED ADJUVANT CHEMOTHERAPY WITHIN 3 MONTHS AFTER SURGERY (KCE 2008 QCI 1241; PROCESS INDICATOR)
N: Number of patients in denominator receiving adjuvant chemotherapy within 3
months after surgery
D: Number of patients treated with R0 radical surgical resection for (y)pStage III and
for whom it is known whether they received adjuvant chemotherapy within 6 months
after surgery or not.
How do you judge the clinical importance of this QCI for evaluating rectal cancer care?
Most important
Very important
Important
Less important
Not important
Don’t know / No opinion
To what extent do you think this QCI is reported reliably for each patient in the database?
Most reliable
Very reliable
Reliable
Less reliable
Not reliable
Don’t know / No opinion
Do you have any comments on this QCI?
...
KCE Report 161S Procare III – Supplement 259
5.2 PROPORTION OF PSTAGE II-III PATIENTS WITH R0 RESECTION THAT RECEIVED ADJUVANT RADIOTHERAPY OR CHEMORADIOTHERAPY WITHIN 3 MONTHS AFTER SURGERY (KCE 2008 QCI 1242; PROCESS INDICATOR)
N: Number of patients in denominator receiving adjuvant radio(chemo)therapy within
3 months after surgery
D: Number of patients treated with R0 radical surgical resection for pStage II or III
without neoadjuvant treatment and for whom it is known whether they received
adjuvant radio(chemo)therapy or not.
How do you judge the clinical importance of this QCI for evaluating rectal cancer care?
Most important
Very important
Important
Less important
Not important
Don’t know / No opinion
To what extent do you think this QCI is reported reliably for each patient in the database?
Most reliable
Very reliable
Reliable
Less reliable
Not reliable
Don’t know / No opinion
Do you have any comments on this QCI?
...
KCE Report 161S Procare III – Supplement 260
5.3 PROPORTION OF (Y)PSTAGE II-III PATIENTS WITH R0 RESECTION THAT STARTED ADJUVANT CHEMOTHERAPY WITHIN 12 WEEKS AFTER SURGICAL RESECTION (KCE 2008 QCI 1243; PROCESS INDICATOR)
N: Number of patients in denominator receiving adjuvant chemotherapy within 3
months after surgery
D: Number of patients treated with R0 radical surgical resection for (y)pStage II or III
and for whom it is known whether they received adjuvant chemotherapy or not.
How do you judge the clinical importance of this QCI for evaluating rectal cancer care?
Most important
Very important
Important
Less important
Not important
Don’t know / No opinion
To what extent do you think this QCI is reported reliably for each patient in the database?
Most reliable
Very reliable
Reliable
Less reliable
Not reliable
Don’t know / No opinion
Do you have any comments on this QCI?
...
KCE Report 161S Procare III – Supplement 261
5.4 PROPORTION OF (Y)PSTAGE II-III PATIENTS WITH R0 RESECTION TREATED WITH ADJUVANT CHEMO(RADIO)THERAPY, THAT RECEIVED 5-FU BASED CHEMOTHERAPY (KCE 2008 QCI 1244; PROCESS INDICATOR)
N: Number of patients in denominator receiving 5-fluorouracil based adjuvant
chemotherapy
D: Number of patients who received adjuvant (radio)chemotherapy within 3 months
after R0 radical surgical resection for (y)pStage II or III and for whom the type of
adjuvant chemotherapy is known.
How do you judge the clinical importance of this QCI for evaluating rectal cancer care?
Most important
Very important
Important
Less important
Not important
Don’t know / No opinion
To what extent do you think this QCI is reported reliably for each patient in the database?
Most reliable
Very reliable
Reliable
Less reliable
Not reliable
Don’t know / No opinion
Do you have any comments on this QCI?
...
KCE Report 161S Procare III – Supplement 262
5.5 RATE OF ACUTE GRADE 4 CHEMOTHERAPY-RELATED COMPLICATIONS (KCE 2008 QCI 1245; PROCESS INDICATOR)
N: Number of patients in denominator that presented acute grade 4 complications
during or within 4 weeks after completion of adjuvant chemo(radio)therapy
D: Number of patients treated with adjuvant chemotherapy and for whom follow-up
data (at least until 1 year) are available.
Note Not used in PROCARE feedback until 2009 because not enough data. Solved
retrospectively (at least partially by means of reminders in spring 2010).
How do you judge the clinical importance of this QCI for evaluating rectal cancer care?
Most important
Very important
Important
Less important
Not important
Don’t know / No opinion
To what extent do you think this QCI is reported reliably for each patient in the database?
Most reliable
Very reliable
Reliable
Less reliable
Not reliable
Don’t know / No opinion
Do you have any comments on this QCI?
...
KCE Report 161S Procare III – Supplement 263
6 PALLIATIVE TREATMENT 6.1 RATE OF CSTAGE IV PATIENTS RECEIVING CHEMOTHERAPY
(KCE 2008 QCI 1251; PROCESS INDICATOR) N: Number of patients in denominator that received chemotherapy
D: Number of patients with cStage IV and for whom it is known whether they received
chemotherapy or not.
How do you judge the clinical importance of this QCI for evaluating rectal cancer care?
Most important
Very important
Important
Less important
Not important
Don’t know / No opinion
To what extent do you think this QCI is reported reliably for each patient in the database?
Most reliable
Very reliable
Reliable
Less reliable
Not reliable
Don’t know / No opinion
Do you have any comments on this QCI?
...
KCE Report 161S Procare III – Supplement 264
7 FOLLOW-UP 7.1 RATE OF CURATIVELY TREATED PATIENTS THAT RECEIVED
A COLONOSCOPY WITHIN 1 YEAR AFTER RESECTION (KCE 2008 QCI 1261; PROCESS INDICATOR)
N: Number of patients in denominator that received a colonoscopy
D: Number of patients treated with curative resection for c(p)Stage I-III and for whom
follow-up data (at least until 2 years) are available.
Note Not used in PROCARE feedback until 2009 because not enough data. Solved
retrospectively (at least partially by means of reminders in spring 2010).
How do you judge the clinical importance of this QCI for evaluating rectal cancer care?
Most important
Very important
Important
Less important
Not important
Don’t know / No opinion
To what extent do you think this QCI is reported reliably for each patient in the database?
Most reliable
Very reliable
Reliable
Less reliable
Not reliable
Don’t know / No opinion
Do you have any comments on this QCI?
...
KCE Report 161S Procare III – Supplement 265
7.2 LATE GRADE 4 COMPLICATIONS OF RADIOTHERAPY OR CHEMORADIATION (KCE 2008 QCI 1263; PROCESS INDICATOR)
N: Number of patients in denominator that presented late grade 4 complications after
completion of (neo)adjuvant chemo(radio)therapy
D: Number of patients treated with neoadjuvant or adjuvant radio(chemo)therapy and
for whom follow-up data (at least until 1 year) are available.
Note Not used in PROCARE feedback until 2009 because not enough data.
Grade refers to the severity of the AE. The CTCAE v3.0 displays Grades 1 through 5
with unique clinical descriptions of severity for each AE based on this general
guideline: Grade 1: Mild AE, Grade 2: Moderate AE, Grade 3: Severe AE, Grade 4:
Life-threatening or disabling AE (An AE whose existence or immediate sequelae are
associated with an imminent risk of death) and Grade 5: Death related to AE.
How do you judge the clinical importance of this QCI for evaluating rectal cancer care?
Most important
Very important
Important
Less important
Not important
Don’t know / No opinion
To what extent do you think this QCI is reported reliably for each patient in the database?
Most reliable
Very reliable
Reliable
Less reliable
Not reliable
Don’t know / No opinion
Do you have any comments on this QCI?
...
KCE Report 161S Procare III – Supplement 266
8 HISTOPATHOLOGIC EXAMINATION 8.1 USE OF THE PATHOLOGY REPORT SHEET (KCE 2008 QCI
1271; PROCESS INDICATOR) N: Number of patients in denominator for whom a pathology report sheet was
completed
D: Number of patients treated with (local or radical) resection and for whom date of
resection is later than or equal to the 1st of January 2007.
How do you judge the clinical importance of this QCI for evaluating rectal cancer care?
Most important
Very important
Important
Less important
Not important
Don’t know / No opinion
To what extent do you think this QCI is reported reliably for each patient in the database?
Most reliable
Very reliable
Reliable
Less reliable
Not reliable
Don’t know / No opinion
Do you have any comments on this QCI?
...
KCE Report 161S Procare III – Supplement 267
8.2 QUALITY OF TME ASSESSED ACCORDING TO QUIRKE AND MENTIONED IN THE PATHOLOGY REPORT (KCE 2008 QCI 1272; PROCESS INDICATOR)
N: Number of patients for whom the external surface of TME was reported in the
pathology report sheet
D: Number of patients treated with TME as indicated by the surgeon after the 1st of
January 2007.
How do you judge the clinical importance of this QCI for evaluating rectal cancer care?
Most important
Very important
Important
Less important
Not important
Don’t know / No opinion
To what extent do you think this QCI is reported reliably for each patient in the database?
Most reliable
Very reliable
Reliable
Less reliable
Not reliable
Don’t know / No opinion
Do you have any comments on this QCI?
...

KCE Report 161S Procare III – Supplement 268
8.3 DISTAL TUMOUR-FREE MARGIN MENTIONED IN THE PATHOLOGY REPORT (KCE 2008 QCI 1273; PROCESS INDICATOR)
N: Number of patients in denominator for whom the length of the distal free tumour
free margin was reported in the pathology report
D: Number of patients treated with SSO or Hartmann’s procedure.
How do you judge the clinical importance of this QCI for evaluating rectal cancer care?
Most important
Very important
Important
Less important
Not important
Don’t know / No opinion
To what extent do you think this QCI is reported reliably for each patient in the database?
Most reliable
Very reliable
Reliable
Less reliable
Not reliable
Don’t know / No opinion
Do you have any comments on this QCI?
...

KCE Report 161S Procare III – Supplement 269
8.4 DISTAL MARGIN INVOLVEMENT MENTIONED AFTER SSO OR HARTMANN (NEW QCI 1273B, PARTIALLY REPLACING KCE QCI 1231; OUTCOME QCI)
N: Number of patients in denominator for whom it was reported whether the distal
resection margin was invaded
D: Number of patients treated with Hartmann’s procedure or SSO with reconstruction
and for whom a pathology report sheet was completed.
How do you judge the clinical importance of this QCI for evaluating rectal cancer care?
Most important
Very important
Important
Less important
Not important
Don’t know / No opinion
To what extent do you think this QCI is reported reliably for each patient in the database?
Most reliable
Very reliable
Reliable
Less reliable
Not reliable
Don’t know / No opinion
Do you have any comments on this QCI?
...
KCE Report 161S Procare III – Supplement 270
8.5 NUMBER OF LYMPH NODES EXAMINED (KCE 2008 QCI 1274; PROCESS INDICATOR)
The median number of lymph nodes examined is computed for the following
conditions:
• no or short course neoadjuvant RT
• long course neoadjuvant RT
• course type missing
How do you judge the clinical importance of this QCI for evaluating rectal cancer care?
Most important
Very important
Important
Less important
Not important
Don’t know / No opinion
To what extent do you think this QCI is reported reliably for each patient in the database?
Most reliable
Very reliable
Reliable
Less reliable
Not reliable
Don’t know / No opinion
Do you have any comments on this QCI?
...
For this QCI, what target should be reached for ‘good practice’?
...
KCE Report 161S Procare III – Supplement 271
8.6 (Y)PCRM MENTIONED IN MM IN THE PATHOLOGY REPORT (KCE 2008 QCI 1275; PROCESS INDICATOR)
N: Number of patients in denominator for whom the mesorectal (y)pCRM was
mentioned in the pathology report
D: Number of patients treated with radical surgical resection and for whom a
pathology report was completed.
How do you judge the clinical importance of this QCI for evaluating rectal cancer care?
Most important
Very important
Important
Less important
Not important
Don’t know / No opinion
To what extent do you think this QCI is reported reliably for each patient in the database?
Most reliable
Very reliable
Reliable
Less reliable
Not reliable
Don’t know / No opinion
Do you have any comments on this QCI?
...
KCE Report 161S Procare III – Supplement 272
8.7 TUMOUR REGRESSION GRADE MENTIONED IN THE PATHOLOGY REPORT (AFTER NEOADJUVANT TREATMENT) (KCE 2008 QCI 1276; PROCESS INDICATOR)
N: Number of patients in denominator having their tumour regression grade
mentioned in the pathology report
D: Number of patients treated with neoadjuvant long course radio(chemo)therapy
and surgery.
How do you judge the clinical importance of this QCI for evaluating rectal cancer care?
Most important
Very important
Important
Less important
Not important
Don’t know / No opinion
To what extent do you think this QCI is reported reliably for each patient in the database?
Most reliable
Very reliable
Reliable
Less reliable
Not reliable
Don’t know / No opinion
Do you have any comments on this QCI?
...
KCE Report 161S Procare III – Supplement 273
Appendix 6: Descriptives of the prognostic factors and QCIs and detailed results of analysis of individual
QCIs
TABLE OF CONTENT
FOREWORD ........................................................................................................... 273
NOTATION .............................................................................................................. 277
1 DESCRIPTIVES ............................................................................................ 280
1.1 PROGNOSTIC FACTORS ............................................................................. 280
1.2 GENERAL QUALITY INDICATORS .............................................................. 290
1.3 QUALITY INDICATORS RELATED TO DIAGNOSIS AND STAGING .......... 294
1.4 QUALITY INDICATORS RELATED TO NEOADJUVANT TREATMENT ...... 315
1.5 QUALITY INDICATORS RELATED TO SURGERY ...................................... 329
1.6 QUALITY INDICATORS RELATED TO ADJUVANT TREATMENT .............. 349
1.7 QUALITY INDICATORS RELATED TO FOLLOW-UP .................................. 352
1.8 QUALITY INDICATORS RELATED TO HISTOPATHOLOGIC EXAMINATION
....................................................................................................................... 353
2 QUALITY OF CARE INDICATORS ............................................................... 368
2.1 GENERAL QUALITY INDICATORS .............................................................. 368
2.1.1 QCI 1111 [OS] ...................................................................................... 368
2.1.2 *Disease-specific 5-year survival by stage (QCI 1112, outcome) ......... 368
2.1.3 *Relative survival (new QCI 1112b, outcome) ...................................... 373
2.1.4 *Proportion of patients with local recurrence (QCI 1113, outcome)...... 374
2.1.5 *Disease-free survival (new QCI 1113b, outcome) .............................. 376
2.2 QUALITY INDICATORS RELATED TO DIAGNOSIS AND STAGING .......... 381
2.2.1 Proportion of patients with a documented distance from the anal verge
(QCI 1211, process) ...................................................................................... 381
2.2.2 Proportion of patients in whom a CT of the abdomen and RX or CT thorax
was performed before any treatment (QCI 1212, process) ............................ 383
KCE Report 161S Procare III – Supplement 274
2.2.3 Proportion of patients in whom a CEA was performed before any
treatment (QCI 1213, process) ...................................................................... 384
2.2.4 Proportion of patients undergoing elective surgery that had preoperative
complete large bowel-imaging (QCI 1214, process) ...................................... 386
2.2.5 Use of TRUS in cT1/cT2 (new QCI 1214b, process) ............................ 387
2.2.6 Use of MRI in cStage II or III (new QCI 1214c, process) ...................... 388
2.2.7 Proportion of patients in whom a TRUS and pelvic CT and/or pelvic MRI
was performed before any treatment (QCI 1215, process) ............................ 390
2.2.8 Proportion of patients with cStage II-III RC that have a reported cCRM
(QCI 1216, process) ...................................................................................... 392
2.2.9 Accuracy of cM0 staging (new QCI 1216b, process)............................ 393
2.2.10 Time between first histopathological examination and first treatment
(QCI 1217, process) ...................................................................................... 394
2.3 QUALITY INDICATORS RELATED TO NEOADJUVANT TREATMENT ...... 399
2.3.1 Proportion of cStage II-III patients that received a neoadjuvant pelvic RT
(new QCI 1221, process) ............................................................................... 399
2.3.2 Proportion of patients with cCRM ≤ 2 mm on MRI/CT that received long
course neoadjuvant radio(chemo)therapy (new QCI 1221b, process) .......... 401
2.3.3 Proportion of patients with cStage I that received neoadjuvant
radio(chemo)therapy (new QCI 1221c, process) ........................................... 402
2.3.4 Proportion of cStage II-III patients treated with neoadjuvant 5-FU based
chemoradiation, that received a continuous infusion of 5-FU (QCI 1224,
process) ......................................................................................................... 404
2.3.5 Proportion of cStage II-III patients treated with a long course of
preoperative pelvic RT or chemoradiation, that completed this neoadjuvant
treatment within the planned timing (QCI 1225, process) .............................. 405
2.3.6 Proportion of cStage II-III patients treated with a long course of
preoperative pelvic RT or chemoradiation, that was operated 4 to 12 weeks
after completion of the (chemo)radiation (QCI 1226, process) ...................... 406
2.3.7 *Rate of acute grade 4 radio(chemo)therapy-related complications (QCI
1227, outcome) .............................................................................................. 407
2.4 QUALITY INDICATORS RELATED TO SURGERY ...................................... 411
2.4.1 *Proportion of R0 resections (QCI 1231, outcome) .............................. 411
2.4.2 Proportion of APER, Hartmann’s procedure or total excision of colon and
rectum with definitive ileostomy (QCI 1232a, process) .................................. 414
KCE Report 161S Procare III – Supplement 275
2.4.3 *Proportion of patients with stoma 1 year after sphincter-sparing surgery
(QCI 1232b, outcome) ................................................................................... 416
2.4.4 *Rate of patients with major leakage of the anastomosis after PME +
SSO + reconstruction (new QCI 1233a, outcome) ........................................ 419
2.4.5 *Rate of patients with major leakage of the anastomosis after TME + SSO
+ reconstruction (new QCI 1233b, outcome) ................................................. 422
2.4.6 *Inpatient or 30-day mortality (QCI 1234, outcome) ............................. 425
2.4.7 *Postoperative major surgical morbidity with reintervention under narcosis
after radical surgical resection (new QCI 1234b, outcome) ........................... 428
2.4.8 *Rate of intra-operative rectal perforation (QCI 1235, outcome) .......... 432
2.4.9 *(y)p Distal margin involved (positive) after SSO or Hartmann for low
rectal cancer (≤ 5 cm) (new QCI 1235b, outcome) ........................................ 435
2.4.10 *Mesorectal (y)pCRM positivity after radical surgical resection (new
QCI 1235c, outcome) ..................................................................................... 438
2.5 QUALITY INDICATORS RELATED TO ADJUVANT TREATMENT .............. 441
2.5.1 Proportion of (y)pStage III patients with R0 resection that received
adjuvant chemotherapy within 3 months after surgery (QCI 1241, process) . 441
2.5.2 Proportion of pStage II-III patients with R0 resection that received
adjuvant radiotherapy or chemoradiotherapy within 6 months after surgery (QCI
1242, process) ............................................................................................... 443
2.5.3 Proportion of (y)pStage II-III patients with R0 resection that started
adjuvant chemotherapy for (y)pStage II or III within 12 weeks after surgery (QCI
1243, process) ............................................................................................... 443
2.5.4 Proportion of (y)pStage II-III patients with R0 resection treated with
adjuvant chemo(radio)therapy, that received 5-FU based chemotherapy (QCI
1244, process) ............................................................................................... 444
2.5.5 *Rate of acute grade 4 chemotherapy-related complications (QCI 1245,
outcome) ........................................................................................................ 445
2.6 QUALITY INDICATORS RELATED TO PALLIATIVE TREATMENT ............. 448
2.6.1 Rate of cStage IV patients receiving chemotherapy (QCI 1251, process)
448
2.7 QUALITY INDICATORS RELATED TO FOLLOW-UP .................................. 448
2.7.1 Rate of curatively treated patients that received a colonoscopy within 1
year after resection (QCI 1261, process) ....................................................... 448
2.7.2 *Late grade 4 complications of radiotherapy or chemoradiation (QCI
1263, outcome) .............................................................................................. 448
KCE Report 161S Procare III – Supplement 276
2.8 QUALITY INDICATORS RELATED TO HISTOPATHOLOGIC EXAMINATION
....................................................................................................................... 449
2.8.1 Use of the pathology report sheet (QCI 1271, process) ....................... 449
2.8.2 Quality of TME assessed according to Quirke and mentioned in the
pathology report (QCI 1272, process)............................................................ 450
2.8.3 Distal tumor-free margin mentioned in the pathology report (QCI 1273,
process) ......................................................................................................... 452
2.8.4 Distal margin involvement mentioned after SSO or Hartmann (new QCI
1273b, process) ............................................................................................. 453
2.8.5 Number of lymph nodes examined (QCI 1274, process) ..................... 455
2.8.6 Mesorectal (y)pCRM mentioned in the pathology report if radical surgical
resection (QCI 1275, process) ....................................................................... 456
2.8.7 Tumor regression grade (Dworak) mentioned in the pathology report
(after long course neoadjuvant treatment) (QCI 1276, process) .................... 458
KCE Report 161S Procare III – Supplement 277
FOREWORD In this Appendix 6, we apply the first set of methods to the data available in the
PROCARE register up to August 27th, 2010. We embark on a multivariate risk
adjustment of outcome QCIs and univariate risk adjustments for process QCIs in all 8
domains.
Section 1 contains a list of descriptive tables and figures, for both prognostic factors
and individual QCI’s. Results per center are shown in caterpillar plots and outlying
centers on either side of the spectrum are noted.
Section 2 is a detailed analysis of all QCI’s in the PROCARE database (often with
reference to descriptives and caterpillar plots in section 1).
Since the data register is in constant development and not yet fully matured, results
should be interpreted with caution. In particular, certain variables show more missing
data than one would normally expect, others still show some inconsistencies and for
specific survival outcomes, few events result in a very weak information base and
instability of the statistical methods used. Correspondingly, the implementation
developed below serves first and foremost as an illustration of the application of the
methods in this setting, for now adapted to the early version of the database.
NOTATION QCI Abbreviations Description 1111 OS Overall survival 1112 DSS Disease-specific survival
1112b RS Relative survival 1113 LRFS Proportion of patients with local recurrence
1113b DFS Disease-free survival
1211 %DocDist Proportion of patients with a documented distance from the anal verge
1212 %CT_Preop Proportion of patients in whom a CT of the abdomen and RX or CT thorax was performed before any treatment
1213 %CEA_Preop Proportion of patients in whom a CEA was performed before any treatment
1214 %Preop_Bowel_Im Proportion of patients undergoing elective surgery that had preoperative complete large bowel-imaging
1214b %TRUS_cT12 Use of TRUS in cT1/cT2 1214c %MR_cII/III Use of MRI in cStage II or III
1215 %Preop_Im Proportion of patients in whom a TRUS and pelvic CT and/or pelvic MRI was performed before any treatment
1216 %cCRM_rep Proportion of patients with cStage II-III RC that have a reported cCRM
1216b cM0_Acc Accuracy of cM0 staging
1217 Time_histo-1ther Time between first histopathologic diagnosis and first treatment
1221 %Preop_RT Proportion of cStage II-III patients that received a
KCE Report 161S Procare III – Supplement 278
neoadjuvant pelvic RT
1221b %(C)RT_cCRM+ Proportion of patients with cCRM = 2 mm on MRI/CT that received long course neoadjuvant radio(chemo)therapy
1221c %Preop_RT_cI Proportion of patients with cStage I that received neoadjuvant radio(chemo)therapy
1224 %Preop_cont_5FU Proportion of cStage II-III patients treated with neoadjuvant 5-FU based chemoradiation that received a continuous infusion of 5-FU
1225 %Completed_preop_RT Proportion of cStage II-III patients treated with a long course of preoperative pelvic RT or chemoradiation that completed this neoadjuvant treatment within the planned timing
1226 %Surg<12w_after_Preop_RT
Proportion of cStage II-III patients treated with a long course of preoperative pelvic RT or chemoradiation that was operated 4 to 12 weeks after completion of the (chemo)radiation
1227 %grade4_Tox_Preop_RT Rate of acute grade 4 radio(chemo)therapy-related complications
1231 %R0res Proportion of R0 resections
1232a %Defin_ostomy Proportion of APR- Hartmann’s procedure or total excision of colon and rectum with definitive ileostomy
1232b %stoma1year Proportion of patients with stoma 1 year after sphincter-sparing surgery
1233a %Leak_PME Major leakage after PME + SSO + reconstruction 1233b %Leak_TME Major leakage after TME + SSO + reconstruction (global) 1234 30d_mort Inpatient or 30-day mortality after radical surgical resection
1234b %Major_morb Postoperative major surgical morbidity with reintervention under narcosis after radical surgical resection
1235 %Perfor Rate of intra-operative rectal perforation
1235b %Pos_Dist_margin (y)p Distal margin involved (positive) after SSO or Hartmann for low rectal cancer (= 5 cm)
1235c %Pos_CRM Mesorectal (y)pCRM positivity after radical surgical resection
1241 %Adj-Chemo<3m Proportion of (y)pStage III patients with R0 resection that received adjuvant chemotherapy within 3 months after surgery
1242 %Adj_RT<3m Proportion of pStage II-III patients with R0 resection that received adjuvant radiotherapy or chemoradiotherapy within 3 months after surgery
1243 %Adj_Chemo<12w Proportion of (y)pStage II-III patients with R0 resection that started adjuvant chemotherapy within 12 weeks after surgical resection
1244 %Adj_5FU Proportion of (y)pStage II-III patients with R0 resection treated with adjuvant chemo(radio)therapy that received 5-FU based chemotherapy
1245 %grade4_Tox_Prostop_CT Rate of acute grade 4 chemotherapy-related complications 1251 %cStage4_Chemo Rate of cStage IV patients receiving chemotherapy
1261 Rate of curatively treated patients that received a colonoscopy within 1 year after resection
1263 %Late_Tox_RT Late grade 4 complications of radiotherapy or chemoradiation 1271 %Path_Rep_Use Use of the pathology report sheet
1272 %TME_Qual_Rep Quality of TME assessed according to Quirke and mentioned in the pathology report
1273 %Dist_Margin_Pos_Rep Distal margin involvement mentioned after SSO or Hartmann 1273b %Dist_Margin_Rep Distal tumour-free margin mentioned in the pathology report 1274 #Nodes_Examined Number of lymph nodes examined 1275 pCRM_mm_Rep (y)pCRM mentioned in mm in the pathology report
1276 TRG_Rep Tumour regression grade mentioned in the pathology report (after neoadjuvant treatment)
KCE Report 161S Procare III – Supplement 279
Abbreviations:
ARP: abdominoperineal;
ASA: American Society of Anesthesiologists;
cCRM: clinically assessed tumor-free circumferential resection margin;
CT: computed tomography;
cN: nodal status;
cT: clinical tumor;
CEA: carcinoembryonic antigen (test);
MRI: Magnetic Resonance Imaging;
PME: high or low anterior resection with colorectal anastomosis;
PROCARE: project on cancer of the rectum;
QCI: quality of care indicator; R0 resection: margin negative resection;
SSO: sphincter-saving operation;
TME: complete rectum resection;
TNM: Tumour Node Metastasis (cancer staging method; T describes the tumor, N
describes the lymph nodes, and M describes distant metastasis; clinical stage and
pathologic stage are denoted by a small "c" or "p" before the stage);
TRUS: transrectal ultra sound; (y)p
CRM: pathologic tumor-free circumferential resection margin either with (ypCRM)
preoperative radio(chemo)therapy or without (pCRM) preoperative treatment; 5-FU:
5-fluorouracil
KCE Report 161S Procare III – Supplement 280
DESCRIPTIVES
1.1 PROGNOSTIC FACTORS
Notes
As of Figure 2, centers with less than 5 patients available for the analysis are
presented as one.
The first three columns of all Tables in this Section contain the following information:
• Center: total and size-grouped centers,
• Total N: the total number of patients in the PROCARE database, and
• N (%): the number (percentage) of patients for which information on
the variable of interest is available in the PROCARE database.
‘SD’ stands for standard deviation.

KCE Report 161S Procare III – Supplement 281
Figure 1: Occurrence of incidence dates over time. Each line represents a centre present in the database. Centers with less than 10 registered patients are indicated in red circles, centers with 10 or more patients are indicated in blue dots.
Table 1: Percentages of male patients for the size-grouped centers.
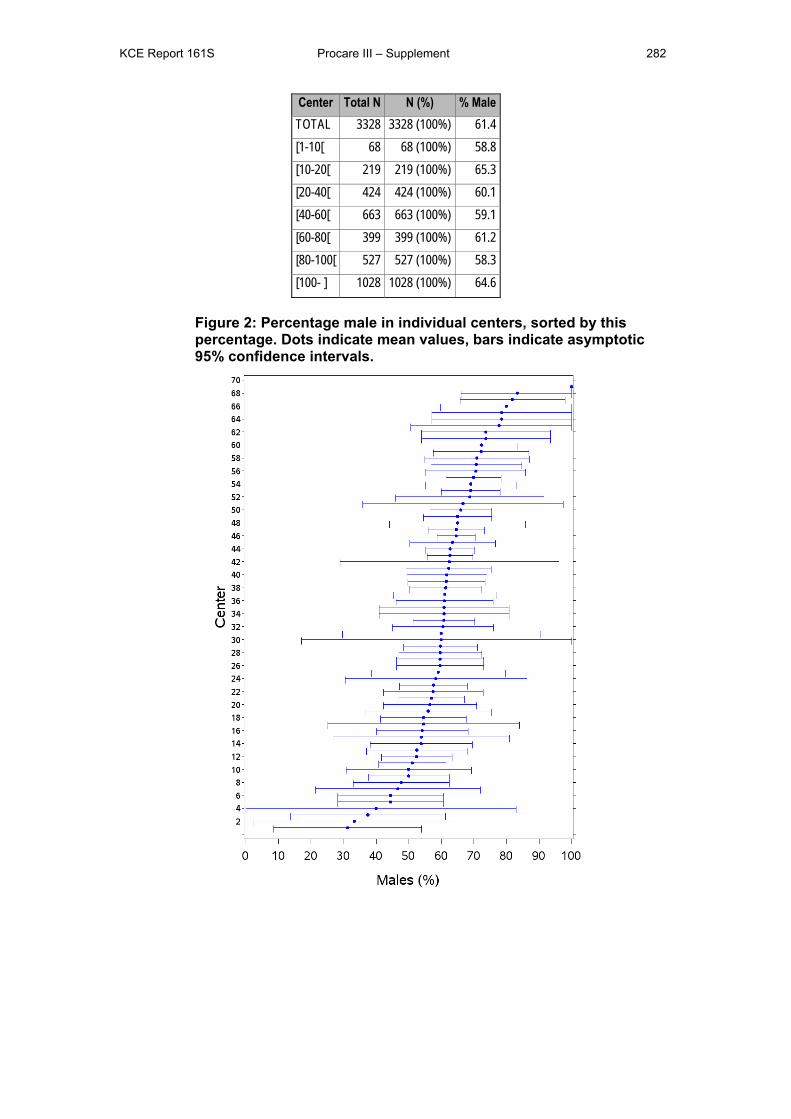
KCE Report 161S Procare III – Supplement 282
Center Total N N (%) % Male TOTAL 3328 3328 (100%) 61.4 [1-10[ 68 68 (100%) 58.8 [10-20[ 219 219 (100%) 65.3 [20-40[ 424 424 (100%) 60.1 [40-60[ 663 663 (100%) 59.1 [60-80[ 399 399 (100%) 61.2 [80-100[ 527 527 (100%) 58.3 [100- ] 1028 1028 (100%) 64.6
Figure 2: Percentage male in individual centers, sorted by this percentage. Dots indicate mean values, bars indicate asymptotic 95% confidence intervals.
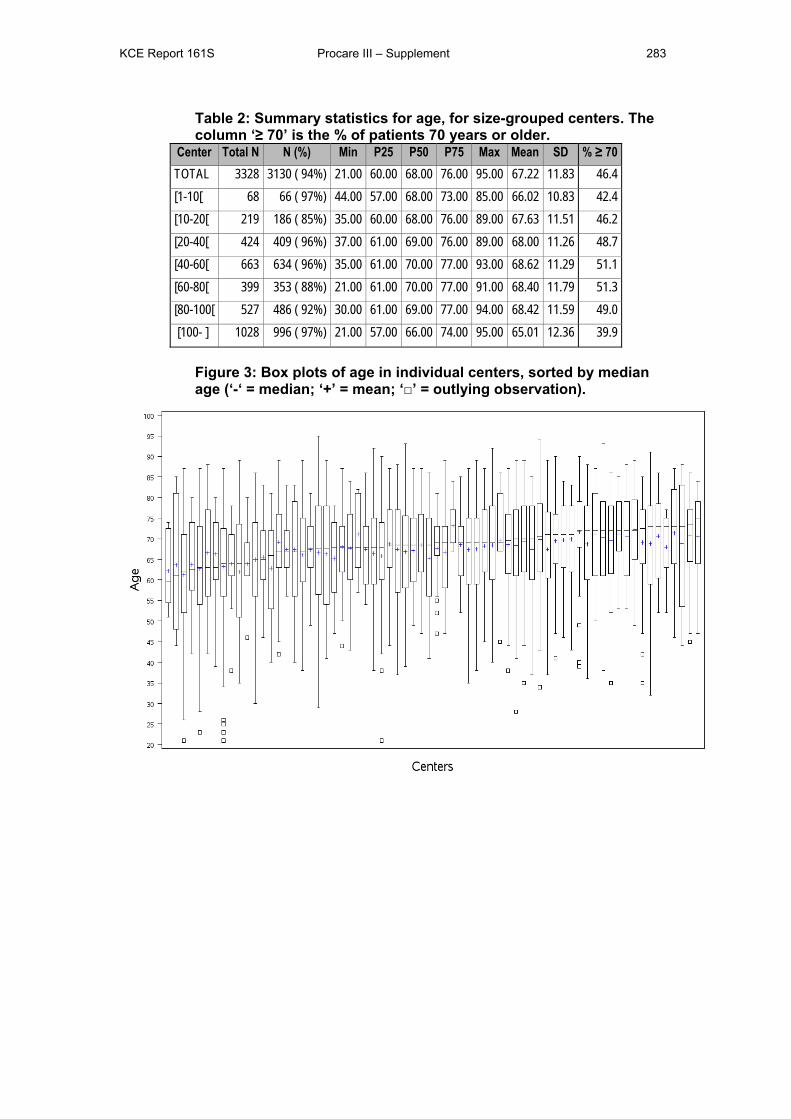
KCE Report 161S Procare III – Supplement 283
Table 2: Summary statistics for age, for size-grouped centers. The column ‘≥ 70’ is the % of patients 70 years or older.
Center Total N N (%) Min P25 P50 P75 Max Mean SD % ≥ 70 TOTAL 3328 3130 ( 94%) 21.00 60.00 68.00 76.00 95.00 67.22 11.83 46.4 [1-10[ 68 66 ( 97%) 44.00 57.00 68.00 73.00 85.00 66.02 10.83 42.4 [10-20[ 219 186 ( 85%) 35.00 60.00 68.00 76.00 89.00 67.63 11.51 46.2 [20-40[ 424 409 ( 96%) 37.00 61.00 69.00 76.00 89.00 68.00 11.26 48.7 [40-60[ 663 634 ( 96%) 35.00 61.00 70.00 77.00 93.00 68.62 11.29 51.1 [60-80[ 399 353 ( 88%) 21.00 61.00 70.00 77.00 91.00 68.40 11.79 51.3 [80-100[ 527 486 ( 92%) 30.00 61.00 69.00 77.00 94.00 68.42 11.59 49.0 [100- ] 1028 996 ( 97%) 21.00 57.00 66.00 74.00 95.00 65.01 12.36 39.9
Figure 3: Box plots of age in individual centers, sorted by median age (‘-‘ = median; ‘+’ = mean; ‘□’ = outlying observation).
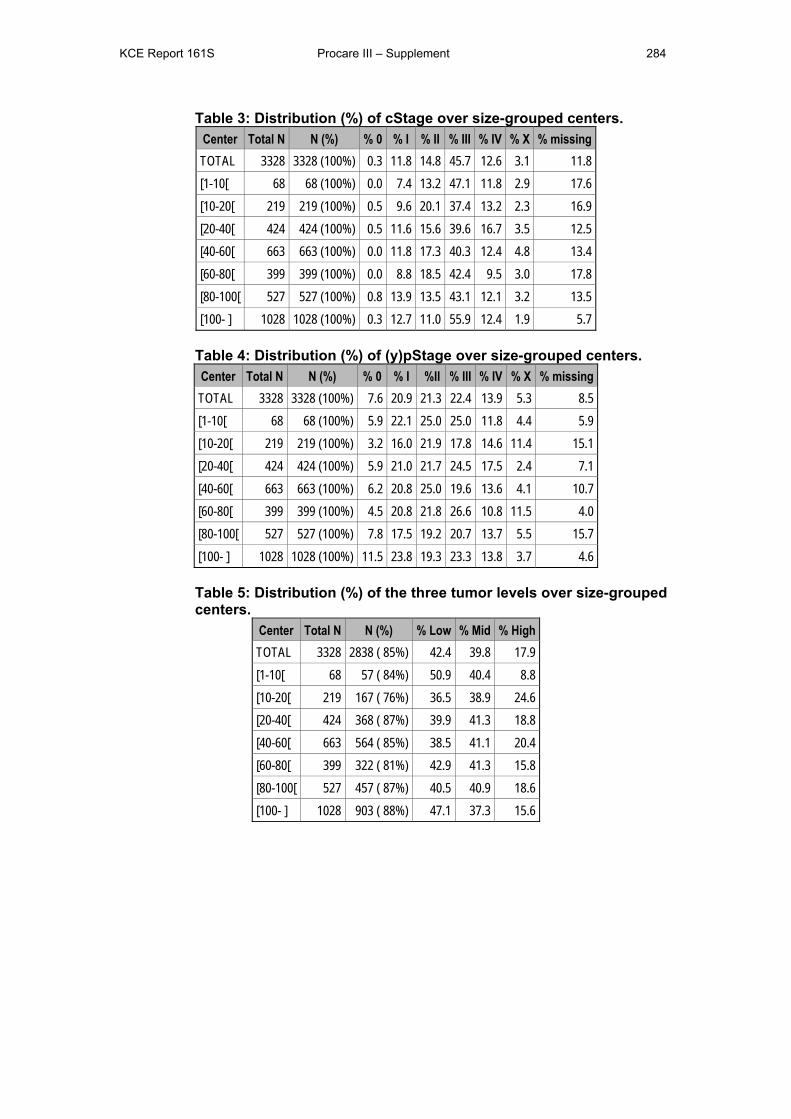
KCE Report 161S Procare III – Supplement 284
Table 3: Distribution (%) of cStage over size-grouped centers. Center Total N N (%) % 0 % I % II % III % IV % X % missing TOTAL 3328 3328 (100%) 0.3 11.8 14.8 45.7 12.6 3.1 11.8 [1-10[ 68 68 (100%) 0.0 7.4 13.2 47.1 11.8 2.9 17.6 [10-20[ 219 219 (100%) 0.5 9.6 20.1 37.4 13.2 2.3 16.9 [20-40[ 424 424 (100%) 0.5 11.6 15.6 39.6 16.7 3.5 12.5 [40-60[ 663 663 (100%) 0.0 11.8 17.3 40.3 12.4 4.8 13.4 [60-80[ 399 399 (100%) 0.0 8.8 18.5 42.4 9.5 3.0 17.8 [80-100[ 527 527 (100%) 0.8 13.9 13.5 43.1 12.1 3.2 13.5 [100- ] 1028 1028 (100%) 0.3 12.7 11.0 55.9 12.4 1.9 5.7
Table 4: Distribution (%) of (y)pStage over size-grouped centers. Center Total N N (%) % 0 % I %II % III % IV % X % missing TOTAL 3328 3328 (100%) 7.6 20.9 21.3 22.4 13.9 5.3 8.5 [1-10[ 68 68 (100%) 5.9 22.1 25.0 25.0 11.8 4.4 5.9 [10-20[ 219 219 (100%) 3.2 16.0 21.9 17.8 14.6 11.4 15.1 [20-40[ 424 424 (100%) 5.9 21.0 21.7 24.5 17.5 2.4 7.1 [40-60[ 663 663 (100%) 6.2 20.8 25.0 19.6 13.6 4.1 10.7 [60-80[ 399 399 (100%) 4.5 20.8 21.8 26.6 10.8 11.5 4.0 [80-100[ 527 527 (100%) 7.8 17.5 19.2 20.7 13.7 5.5 15.7 [100- ] 1028 1028 (100%) 11.5 23.8 19.3 23.3 13.8 3.7 4.6
Table 5: Distribution (%) of the three tumor levels over size-grouped centers.
Center Total N N (%) % Low % Mid % High TOTAL 3328 2838 ( 85%) 42.4 39.8 17.9 [1-10[ 68 57 ( 84%) 50.9 40.4 8.8 [10-20[ 219 167 ( 76%) 36.5 38.9 24.6 [20-40[ 424 368 ( 87%) 39.9 41.3 18.8 [40-60[ 663 564 ( 85%) 38.5 41.1 20.4 [60-80[ 399 322 ( 81%) 42.9 41.3 15.8 [80-100[ 527 457 ( 87%) 40.5 40.9 18.6 [100- ] 1028 903 ( 88%) 47.1 37.3 15.6
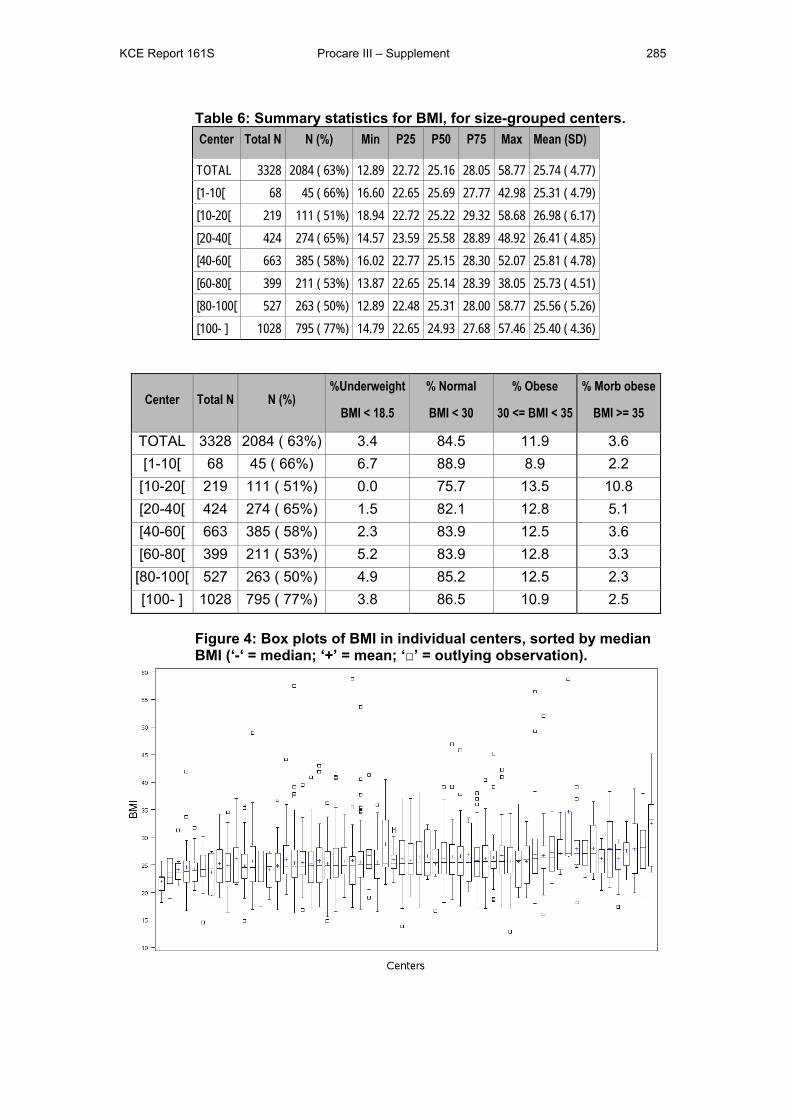
KCE Report 161S Procare III – Supplement 285
Table 6: Summary statistics for BMI, for size-grouped centers. Center Total N N (%) Min P25 P50 P75 Max Mean (SD)
TOTAL 3328 2084 ( 63%) 12.89 22.72 25.16 28.05 58.77 25.74 ( 4.77) [1-10[ 68 45 ( 66%) 16.60 22.65 25.69 27.77 42.98 25.31 ( 4.79) [10-20[ 219 111 ( 51%) 18.94 22.72 25.22 29.32 58.68 26.98 ( 6.17) [20-40[ 424 274 ( 65%) 14.57 23.59 25.58 28.89 48.92 26.41 ( 4.85) [40-60[ 663 385 ( 58%) 16.02 22.77 25.15 28.30 52.07 25.81 ( 4.78) [60-80[ 399 211 ( 53%) 13.87 22.65 25.14 28.39 38.05 25.73 ( 4.51) [80-100[ 527 263 ( 50%) 12.89 22.48 25.31 28.00 58.77 25.56 ( 5.26) [100- ] 1028 795 ( 77%) 14.79 22.65 24.93 27.68 57.46 25.40 ( 4.36)
Center Total N N (%) %Underweight
BMI < 18.5
% Normal
BMI < 30
% Obese
30 <= BMI < 35
% Morb obese
BMI >= 35
TOTAL 3328 2084 ( 63%) 3.4 84.5 11.9 3.6 [1-10[ 68 45 ( 66%) 6.7 88.9 8.9 2.2
[10-20[ 219 111 ( 51%) 0.0 75.7 13.5 10.8 [20-40[ 424 274 ( 65%) 1.5 82.1 12.8 5.1 [40-60[ 663 385 ( 58%) 2.3 83.9 12.5 3.6 [60-80[ 399 211 ( 53%) 5.2 83.9 12.8 3.3
[80-100[ 527 263 ( 50%) 4.9 85.2 12.5 2.3 [100- ] 1028 795 ( 77%) 3.8 86.5 10.9 2.5
Figure 4: Box plots of BMI in individual centers, sorted by median BMI (‘-‘ = median; ‘+’ = mean; ‘□’ = outlying observation).
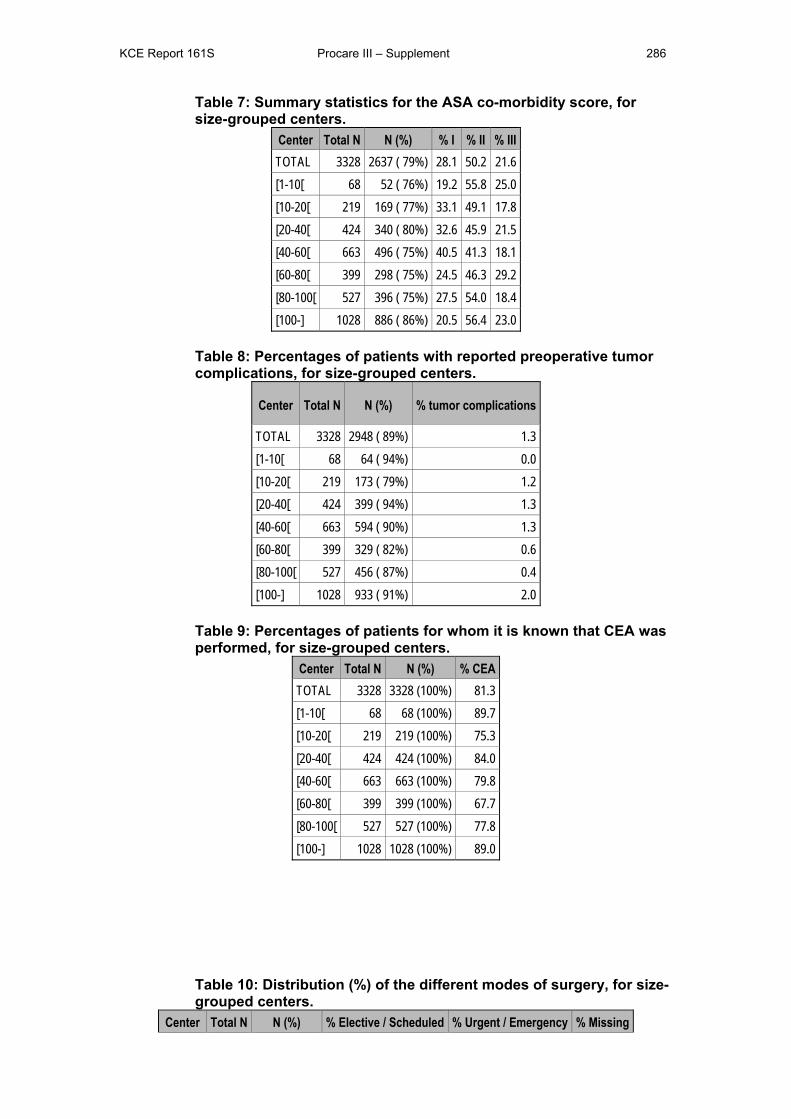
KCE Report 161S Procare III – Supplement 286
Table 7: Summary statistics for the ASA co-morbidity score, for size-grouped centers.
Center Total N N (%) % I % II % III TOTAL 3328 2637 ( 79%) 28.1 50.2 21.6 [1-10[ 68 52 ( 76%) 19.2 55.8 25.0 [10-20[ 219 169 ( 77%) 33.1 49.1 17.8 [20-40[ 424 340 ( 80%) 32.6 45.9 21.5 [40-60[ 663 496 ( 75%) 40.5 41.3 18.1 [60-80[ 399 298 ( 75%) 24.5 46.3 29.2 [80-100[ 527 396 ( 75%) 27.5 54.0 18.4 [100-] 1028 886 ( 86%) 20.5 56.4 23.0
Table 8: Percentages of patients with reported preoperative tumor complications, for size-grouped centers.
Center Total N N (%) % tumor complications
TOTAL 3328 2948 ( 89%) 1.3 [1-10[ 68 64 ( 94%) 0.0 [10-20[ 219 173 ( 79%) 1.2 [20-40[ 424 399 ( 94%) 1.3 [40-60[ 663 594 ( 90%) 1.3 [60-80[ 399 329 ( 82%) 0.6 [80-100[ 527 456 ( 87%) 0.4 [100-] 1028 933 ( 91%) 2.0
Table 9: Percentages of patients for whom it is known that CEA was performed, for size-grouped centers.
Center Total N N (%) % CEA TOTAL 3328 3328 (100%) 81.3 [1-10[ 68 68 (100%) 89.7 [10-20[ 219 219 (100%) 75.3 [20-40[ 424 424 (100%) 84.0 [40-60[ 663 663 (100%) 79.8 [60-80[ 399 399 (100%) 67.7 [80-100[ 527 527 (100%) 77.8 [100-] 1028 1028 (100%) 89.0
Table 10: Distribution (%) of the different modes of surgery, for size-grouped centers.
Center Total N N (%) % Elective / Scheduled % Urgent / Emergency % Missing
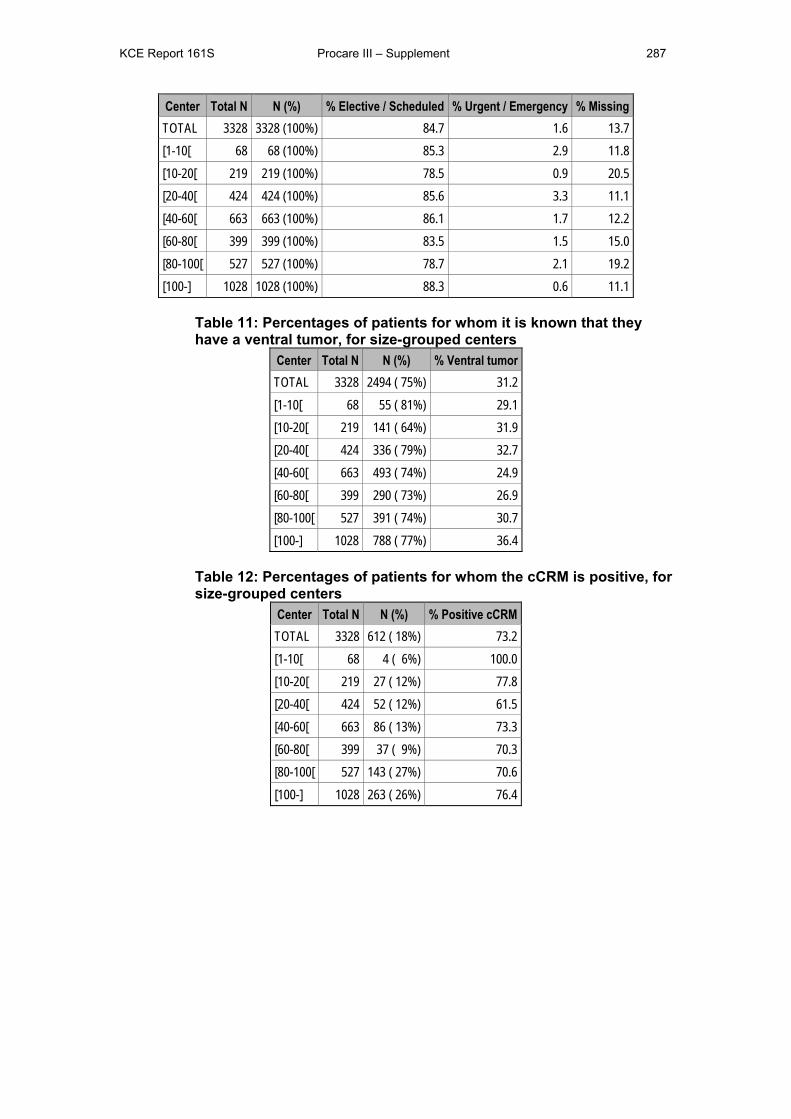
KCE Report 161S Procare III – Supplement 287
Center Total N N (%) % Elective / Scheduled % Urgent / Emergency % Missing TOTAL 3328 3328 (100%) 84.7 1.6 13.7 [1-10[ 68 68 (100%) 85.3 2.9 11.8 [10-20[ 219 219 (100%) 78.5 0.9 20.5 [20-40[ 424 424 (100%) 85.6 3.3 11.1 [40-60[ 663 663 (100%) 86.1 1.7 12.2 [60-80[ 399 399 (100%) 83.5 1.5 15.0 [80-100[ 527 527 (100%) 78.7 2.1 19.2 [100-] 1028 1028 (100%) 88.3 0.6 11.1
Table 11: Percentages of patients for whom it is known that they have a ventral tumor, for size-grouped centers
Center Total N N (%) % Ventral tumor TOTAL 3328 2494 ( 75%) 31.2 [1-10[ 68 55 ( 81%) 29.1 [10-20[ 219 141 ( 64%) 31.9 [20-40[ 424 336 ( 79%) 32.7 [40-60[ 663 493 ( 74%) 24.9 [60-80[ 399 290 ( 73%) 26.9 [80-100[ 527 391 ( 74%) 30.7 [100-] 1028 788 ( 77%) 36.4
Table 12: Percentages of patients for whom the cCRM is positive, for size-grouped centers
Center Total N N (%) % Positive cCRM TOTAL 3328 612 ( 18%) 73.2 [1-10[ 68 4 ( 6%) 100.0 [10-20[ 219 27 ( 12%) 77.8 [20-40[ 424 52 ( 12%) 61.5 [40-60[ 663 86 ( 13%) 73.3 [60-80[ 399 37 ( 9%) 70.3 [80-100[ 527 143 ( 27%) 70.6 [100-] 1028 263 ( 26%) 76.4
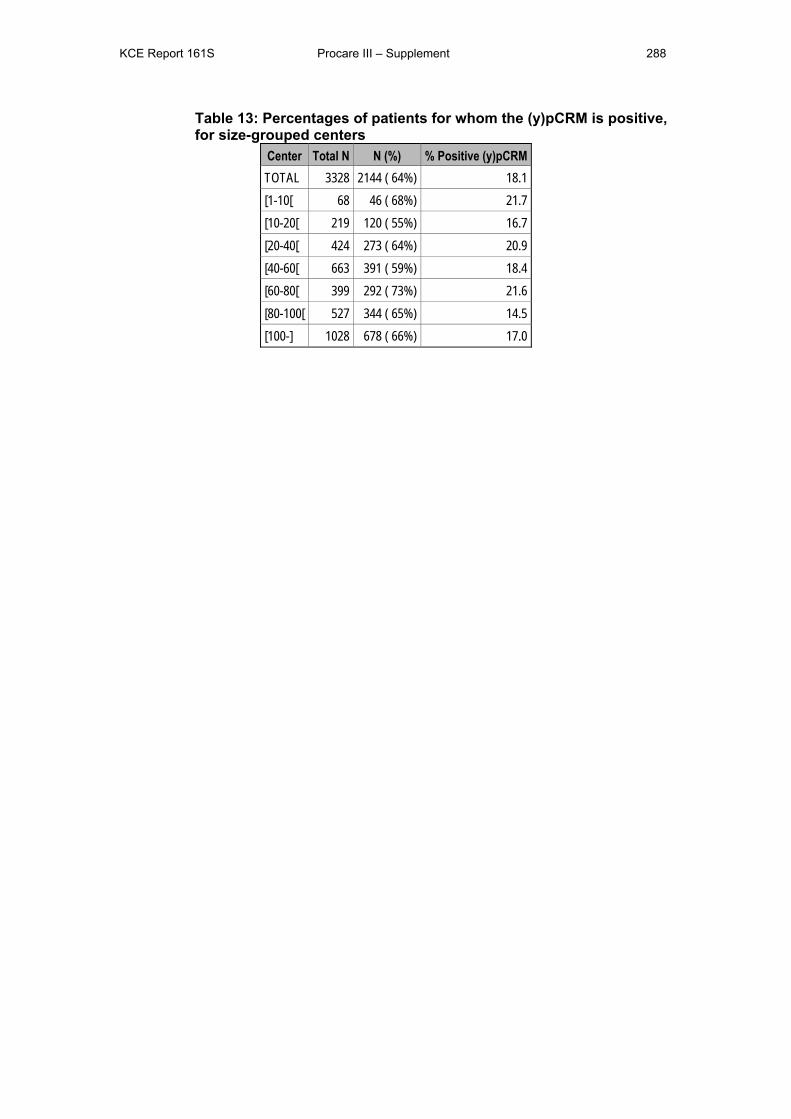
KCE Report 161S Procare III – Supplement 288
Table 13: Percentages of patients for whom the (y)pCRM is positive, for size-grouped centers
Center Total N N (%) % Positive (y)pCRM TOTAL 3328 2144 ( 64%) 18.1 [1-10[ 68 46 ( 68%) 21.7 [10-20[ 219 120 ( 55%) 16.7 [20-40[ 424 273 ( 64%) 20.9 [40-60[ 663 391 ( 59%) 18.4 [60-80[ 399 292 ( 73%) 21.6 [80-100[ 527 344 ( 65%) 14.5 [100-] 1028 678 ( 66%) 17.0

KCE Report 161S Procare III – Supplement 289
Table 14: Joint missingness patterns for prognostic factors. N
patients Gender Age Tumor level (y)pStage cStage ASA
score BMI N missing
1722 1 1 1 1 1 1 1 0 84 1 1 1 1 1 0 1 1
126 1 1 1 1 0 1 1 1 66 1 1 1 0 1 1 1 1
499 1 1 1 1 1 1 0 1 39 1 1 0 1 1 1 1 1 6 1 1 1 1 0 0 1 2 3 1 1 1 0 1 0 1 2
21 1 1 1 0 0 1 1 2 2 1 0 1 1 1 1 0 2
214 1 1 1 1 1 0 0 2 66 1 1 1 1 0 1 0 2 43 1 1 1 0 1 1 0 2 2 1 1 0 1 1 0 1 2 4 1 1 0 1 0 1 1 2
19 1 1 0 1 1 1 0 2 1 1 1 1 0 0 0 1 3 3 1 0 1 1 1 0 0 3
25 1 1 1 1 0 0 0 3 77 1 1 1 0 1 0 0 3 9 1 1 1 0 0 1 0 3 3 1 1 0 0 0 1 1 3
20 1 1 0 1 1 0 0 3 7 1 1 0 1 0 1 0 3 2 1 1 0 0 1 1 0 3
32 1 1 1 0 0 0 0 4 11 1 0 0 1 1 0 0 4 3 1 1 0 1 0 0 0 4
11 1 1 0 0 1 0 0 4 1 1 1 0 0 0 1 0 4 6 1 0 0 1 0 0 0 5 6 1 0 0 0 1 0 0 5
15 1 1 0 0 0 0 0 5 170 1 0 0 0 0 0 0 6
TOTAL 0 198 319 460 495 689 1241
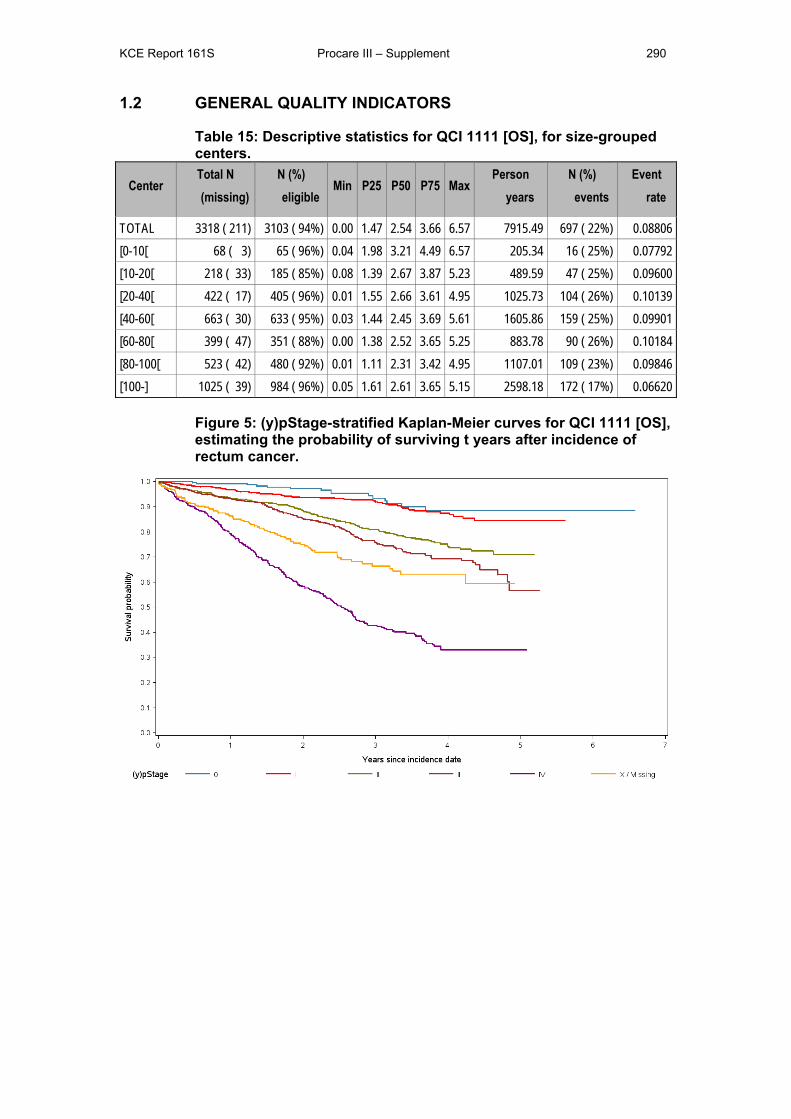
KCE Report 161S Procare III – Supplement 290
1.2 GENERAL QUALITY INDICATORS
Table 15: Descriptive statistics for QCI 1111 [OS], for size-grouped centers.
Center Total N (missing)
N (%) eligible
Min P25 P50 P75 Max Person
years N (%)
events Event
rate
TOTAL 3318 ( 211) 3103 ( 94%) 0.00 1.47 2.54 3.66 6.57 7915.49 697 ( 22%) 0.08806 [0-10[ 68 ( 3) 65 ( 96%) 0.04 1.98 3.21 4.49 6.57 205.34 16 ( 25%) 0.07792 [10-20[ 218 ( 33) 185 ( 85%) 0.08 1.39 2.67 3.87 5.23 489.59 47 ( 25%) 0.09600 [20-40[ 422 ( 17) 405 ( 96%) 0.01 1.55 2.66 3.61 4.95 1025.73 104 ( 26%) 0.10139 [40-60[ 663 ( 30) 633 ( 95%) 0.03 1.44 2.45 3.69 5.61 1605.86 159 ( 25%) 0.09901 [60-80[ 399 ( 47) 351 ( 88%) 0.00 1.38 2.52 3.65 5.25 883.78 90 ( 26%) 0.10184 [80-100[ 523 ( 42) 480 ( 92%) 0.01 1.11 2.31 3.42 4.95 1107.01 109 ( 23%) 0.09846 [100-] 1025 ( 39) 984 ( 96%) 0.05 1.61 2.61 3.65 5.15 2598.18 172 ( 17%) 0.06620
Figure 5: (y)pStage-stratified Kaplan-Meier curves for QCI 1111 [OS], estimating the probability of surviving t years after incidence of rectum cancer.
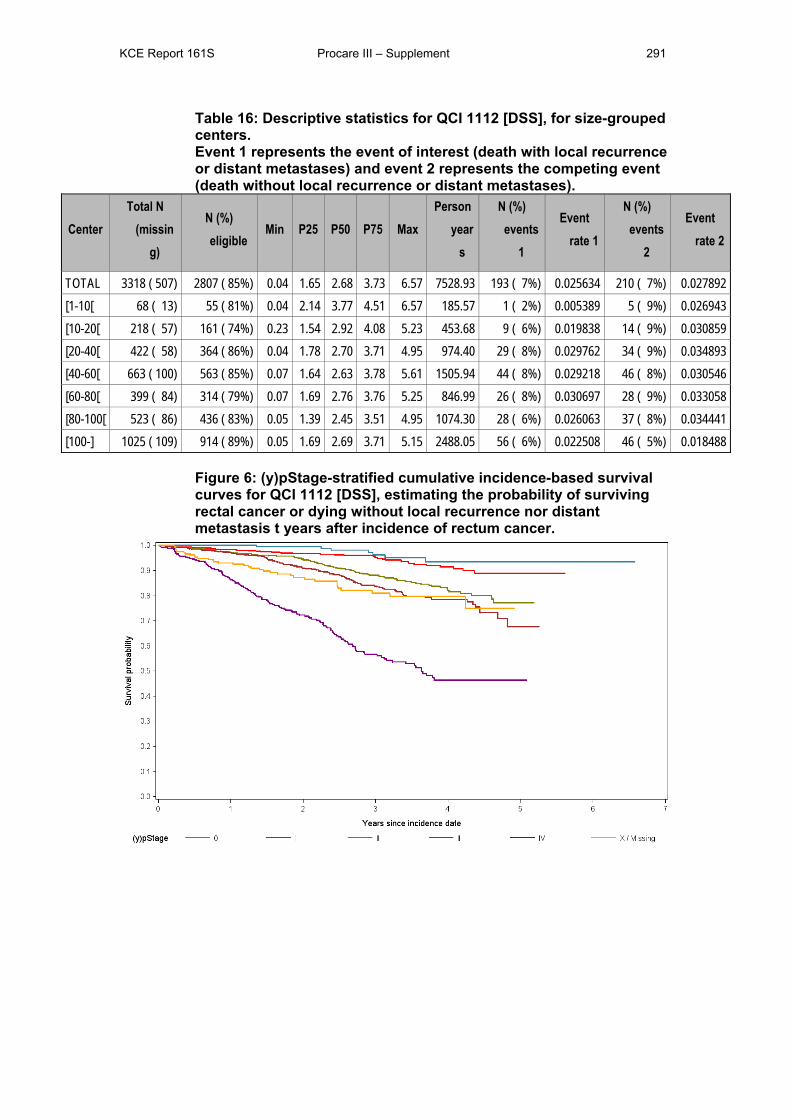
KCE Report 161S Procare III – Supplement 291
Table 16: Descriptive statistics for QCI 1112 [DSS], for size-grouped centers. Event 1 represents the event of interest (death with local recurrence or distant metastases) and event 2 represents the competing event (death without local recurrence or distant metastases).
Center Total N
(missing)
N (%) eligible
Min P25 P50 P75 Max Person
years
N (%) events
1
Event rate 1
N (%) events
2
Event rate 2
TOTAL 3318 ( 507) 2807 ( 85%) 0.04 1.65 2.68 3.73 6.57 7528.93 193 ( 7%) 0.025634 210 ( 7%) 0.027892 [1-10[ 68 ( 13) 55 ( 81%) 0.04 2.14 3.77 4.51 6.57 185.57 1 ( 2%) 0.005389 5 ( 9%) 0.026943 [10-20[ 218 ( 57) 161 ( 74%) 0.23 1.54 2.92 4.08 5.23 453.68 9 ( 6%) 0.019838 14 ( 9%) 0.030859 [20-40[ 422 ( 58) 364 ( 86%) 0.04 1.78 2.70 3.71 4.95 974.40 29 ( 8%) 0.029762 34 ( 9%) 0.034893 [40-60[ 663 ( 100) 563 ( 85%) 0.07 1.64 2.63 3.78 5.61 1505.94 44 ( 8%) 0.029218 46 ( 8%) 0.030546 [60-80[ 399 ( 84) 314 ( 79%) 0.07 1.69 2.76 3.76 5.25 846.99 26 ( 8%) 0.030697 28 ( 9%) 0.033058 [80-100[ 523 ( 86) 436 ( 83%) 0.05 1.39 2.45 3.51 4.95 1074.30 28 ( 6%) 0.026063 37 ( 8%) 0.034441 [100-] 1025 ( 109) 914 ( 89%) 0.05 1.69 2.69 3.71 5.15 2488.05 56 ( 6%) 0.022508 46 ( 5%) 0.018488
Figure 6: (y)pStage-stratified cumulative incidence-based survival curves for QCI 1112 [DSS], estimating the probability of surviving rectal cancer or dying without local recurrence nor distant metastasis t years after incidence of rectum cancer.
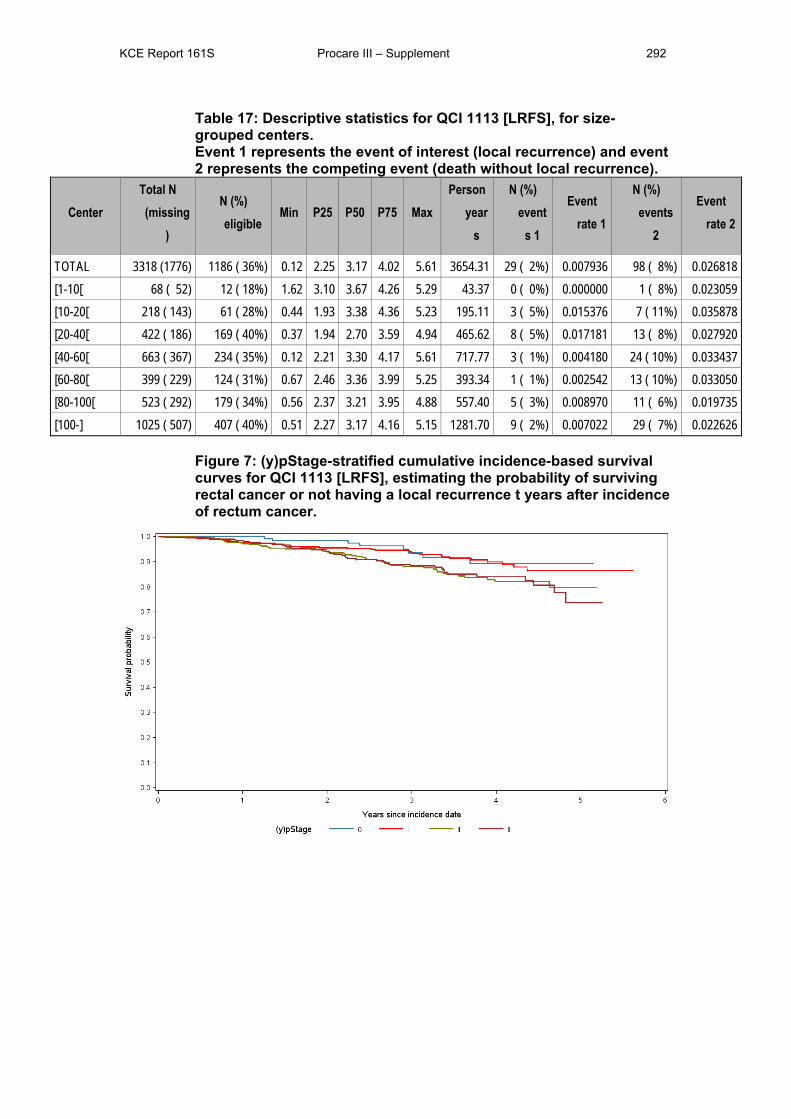
KCE Report 161S Procare III – Supplement 292
Table 17: Descriptive statistics for QCI 1113 [LRFS], for size-grouped centers. Event 1 represents the event of interest (local recurrence) and event 2 represents the competing event (death without local recurrence).
Center Total N (missing
)
N (%) eligible
Min P25 P50 P75 Max Person
years
N (%) event
s 1
Event rate 1
N (%) events
2
Event rate 2
TOTAL 3318 (1776) 1186 ( 36%) 0.12 2.25 3.17 4.02 5.61 3654.31 29 ( 2%) 0.007936 98 ( 8%) 0.026818 [1-10[ 68 ( 52) 12 ( 18%) 1.62 3.10 3.67 4.26 5.29 43.37 0 ( 0%) 0.000000 1 ( 8%) 0.023059 [10-20[ 218 ( 143) 61 ( 28%) 0.44 1.93 3.38 4.36 5.23 195.11 3 ( 5%) 0.015376 7 ( 11%) 0.035878 [20-40[ 422 ( 186) 169 ( 40%) 0.37 1.94 2.70 3.59 4.94 465.62 8 ( 5%) 0.017181 13 ( 8%) 0.027920 [40-60[ 663 ( 367) 234 ( 35%) 0.12 2.21 3.30 4.17 5.61 717.77 3 ( 1%) 0.004180 24 ( 10%) 0.033437 [60-80[ 399 ( 229) 124 ( 31%) 0.67 2.46 3.36 3.99 5.25 393.34 1 ( 1%) 0.002542 13 ( 10%) 0.033050 [80-100[ 523 ( 292) 179 ( 34%) 0.56 2.37 3.21 3.95 4.88 557.40 5 ( 3%) 0.008970 11 ( 6%) 0.019735 [100-] 1025 ( 507) 407 ( 40%) 0.51 2.27 3.17 4.16 5.15 1281.70 9 ( 2%) 0.007022 29 ( 7%) 0.022626
Figure 7: (y)pStage-stratified cumulative incidence-based survival curves for QCI 1113 [LRFS], estimating the probability of surviving rectal cancer or not having a local recurrence t years after incidence of rectum cancer.
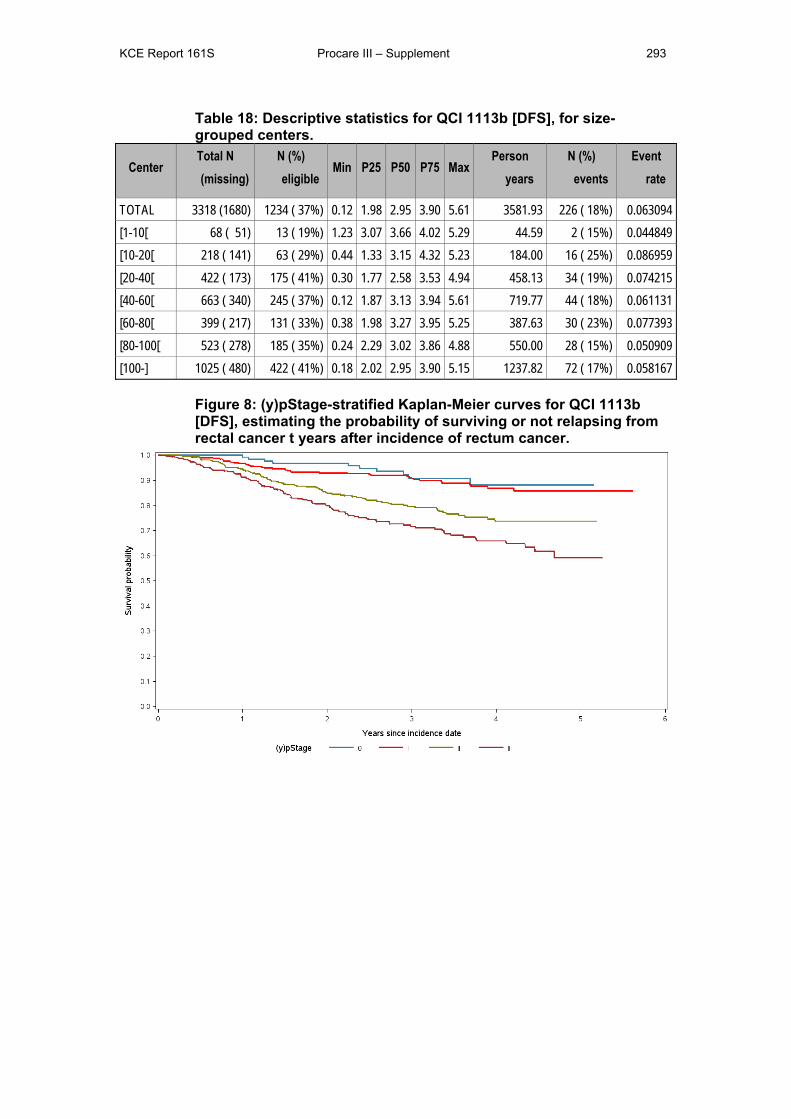
KCE Report 161S Procare III – Supplement 293
Table 18: Descriptive statistics for QCI 1113b [DFS], for size-grouped centers.
Center Total N (missing)
N (%) eligible
Min P25 P50 P75 Max Person
years N (%)
events Event
rate
TOTAL 3318 (1680) 1234 ( 37%) 0.12 1.98 2.95 3.90 5.61 3581.93 226 ( 18%) 0.063094 [1-10[ 68 ( 51) 13 ( 19%) 1.23 3.07 3.66 4.02 5.29 44.59 2 ( 15%) 0.044849 [10-20[ 218 ( 141) 63 ( 29%) 0.44 1.33 3.15 4.32 5.23 184.00 16 ( 25%) 0.086959 [20-40[ 422 ( 173) 175 ( 41%) 0.30 1.77 2.58 3.53 4.94 458.13 34 ( 19%) 0.074215 [40-60[ 663 ( 340) 245 ( 37%) 0.12 1.87 3.13 3.94 5.61 719.77 44 ( 18%) 0.061131 [60-80[ 399 ( 217) 131 ( 33%) 0.38 1.98 3.27 3.95 5.25 387.63 30 ( 23%) 0.077393 [80-100[ 523 ( 278) 185 ( 35%) 0.24 2.29 3.02 3.86 4.88 550.00 28 ( 15%) 0.050909 [100-] 1025 ( 480) 422 ( 41%) 0.18 2.02 2.95 3.90 5.15 1237.82 72 ( 17%) 0.058167
Figure 8: (y)pStage-stratified Kaplan-Meier curves for QCI 1113b [DFS], estimating the probability of surviving or not relapsing from rectal cancer t years after incidence of rectum cancer.
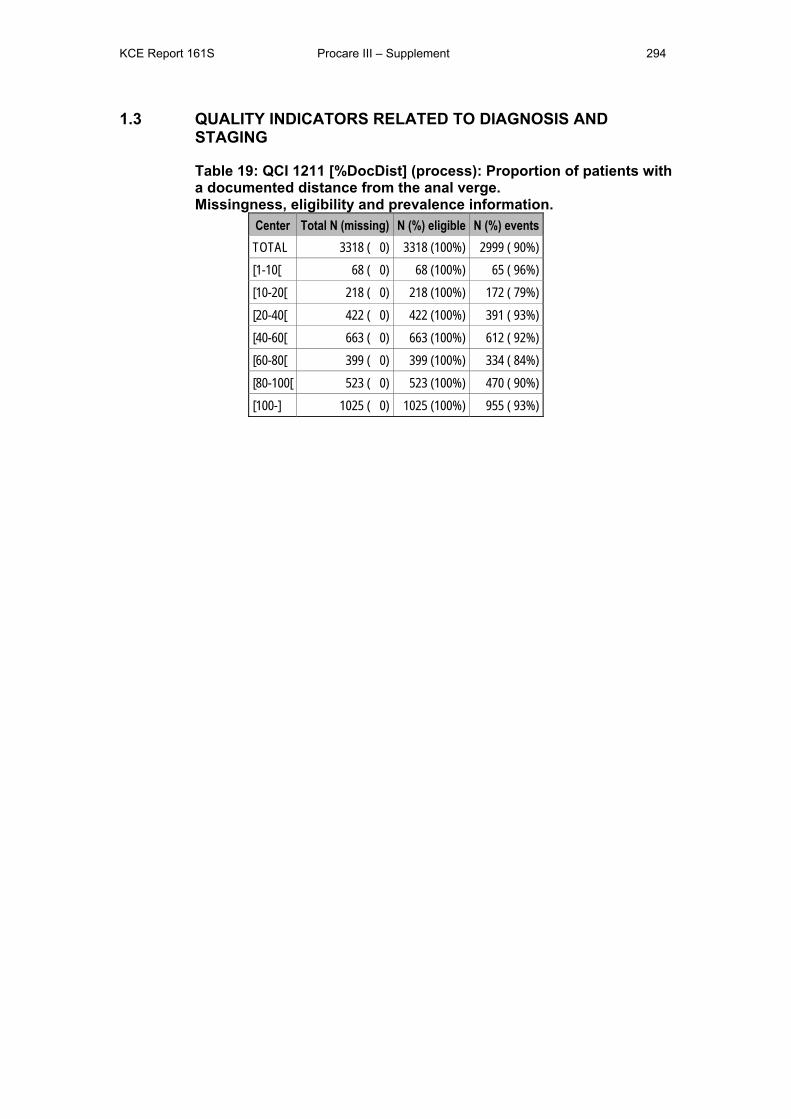
KCE Report 161S Procare III – Supplement 294
1.3 QUALITY INDICATORS RELATED TO DIAGNOSIS AND STAGING
Table 19: QCI 1211 [%DocDist] (process): Proportion of patients with a documented distance from the anal verge. Missingness, eligibility and prevalence information.
Center Total N (missing) N (%) eligible N (%) events TOTAL 3318 ( 0) 3318 (100%) 2999 ( 90%) [1-10[ 68 ( 0) 68 (100%) 65 ( 96%) [10-20[ 218 ( 0) 218 (100%) 172 ( 79%) [20-40[ 422 ( 0) 422 (100%) 391 ( 93%) [40-60[ 663 ( 0) 663 (100%) 612 ( 92%) [60-80[ 399 ( 0) 399 (100%) 334 ( 84%) [80-100[ 523 ( 0) 523 (100%) 470 ( 90%) [100-] 1025 ( 0) 1025 (100%) 955 ( 93%)
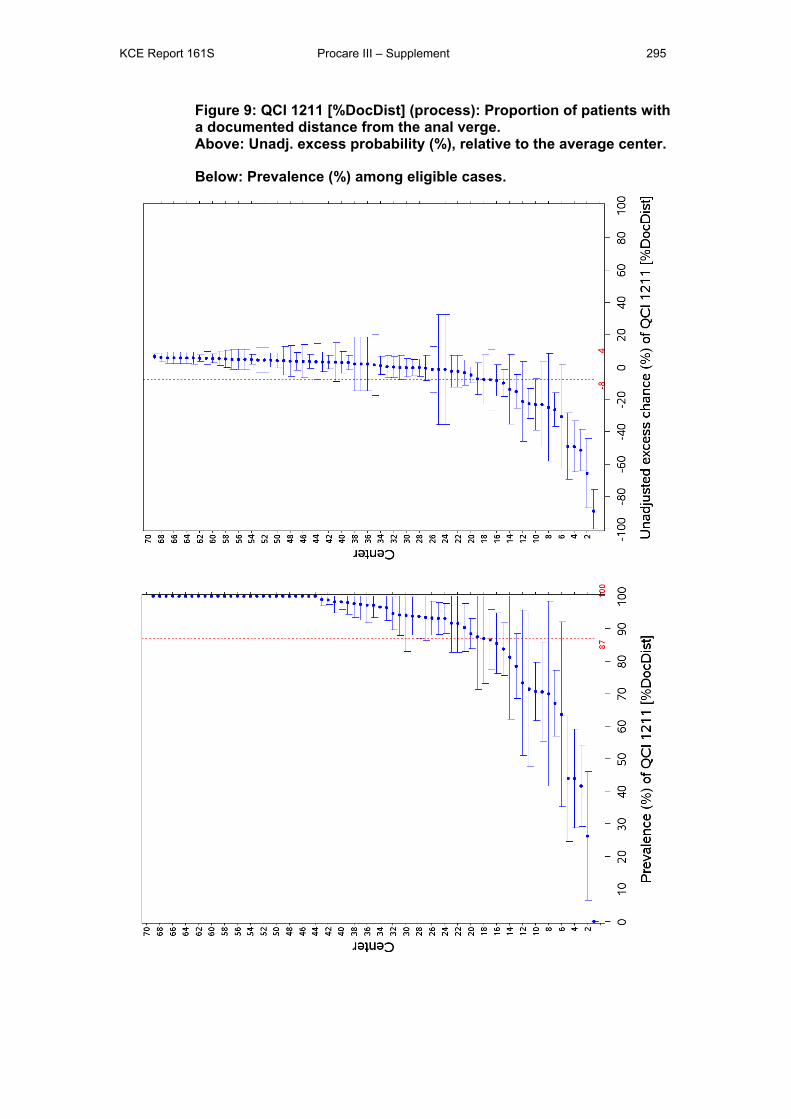
KCE Report 161S Procare III – Supplement 295
Figure 9: QCI 1211 [%DocDist] (process): Proportion of patients with a documented distance from the anal verge. Above: Unadj. excess probability (%), relative to the average center.
Below: Prevalence (%) among eligible cases.
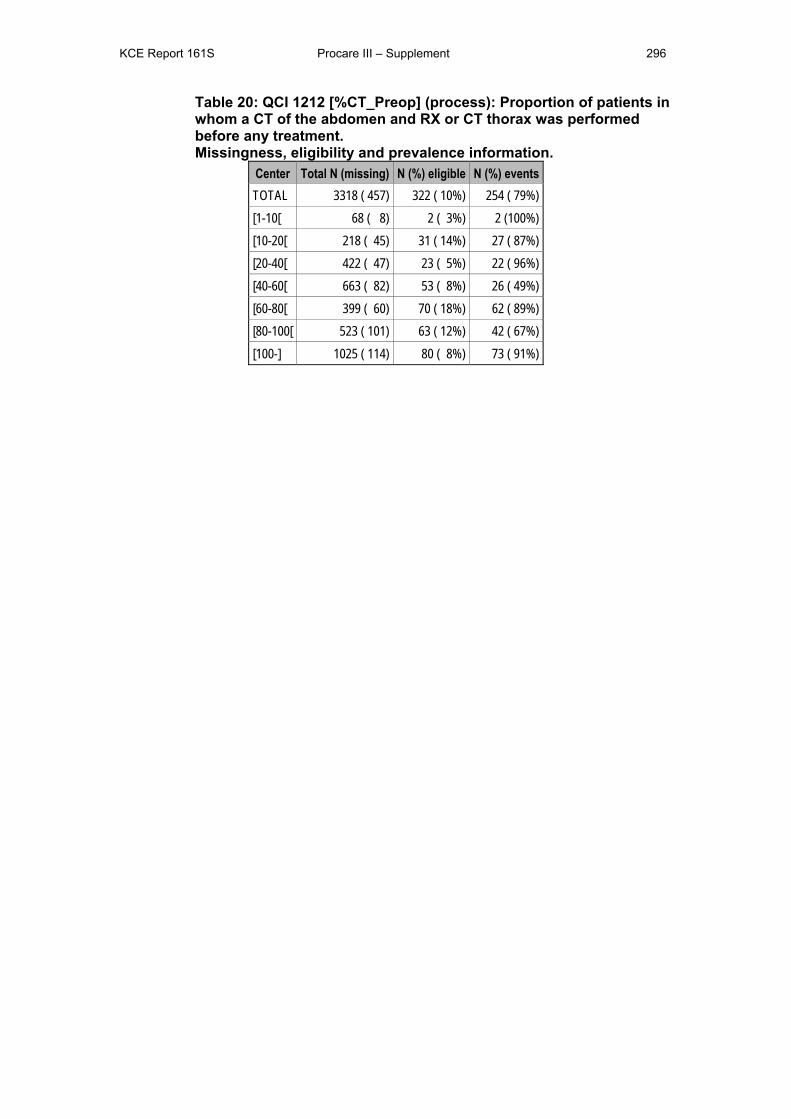
KCE Report 161S Procare III – Supplement 296
Table 20: QCI 1212 [%CT_Preop] (process): Proportion of patients in whom a CT of the abdomen and RX or CT thorax was performed before any treatment. Missingness, eligibility and prevalence information.
Center Total N (missing) N (%) eligible N (%) events TOTAL 3318 ( 457) 322 ( 10%) 254 ( 79%) [1-10[ 68 ( 8) 2 ( 3%) 2 (100%) [10-20[ 218 ( 45) 31 ( 14%) 27 ( 87%) [20-40[ 422 ( 47) 23 ( 5%) 22 ( 96%) [40-60[ 663 ( 82) 53 ( 8%) 26 ( 49%) [60-80[ 399 ( 60) 70 ( 18%) 62 ( 89%) [80-100[ 523 ( 101) 63 ( 12%) 42 ( 67%) [100-] 1025 ( 114) 80 ( 8%) 73 ( 91%)
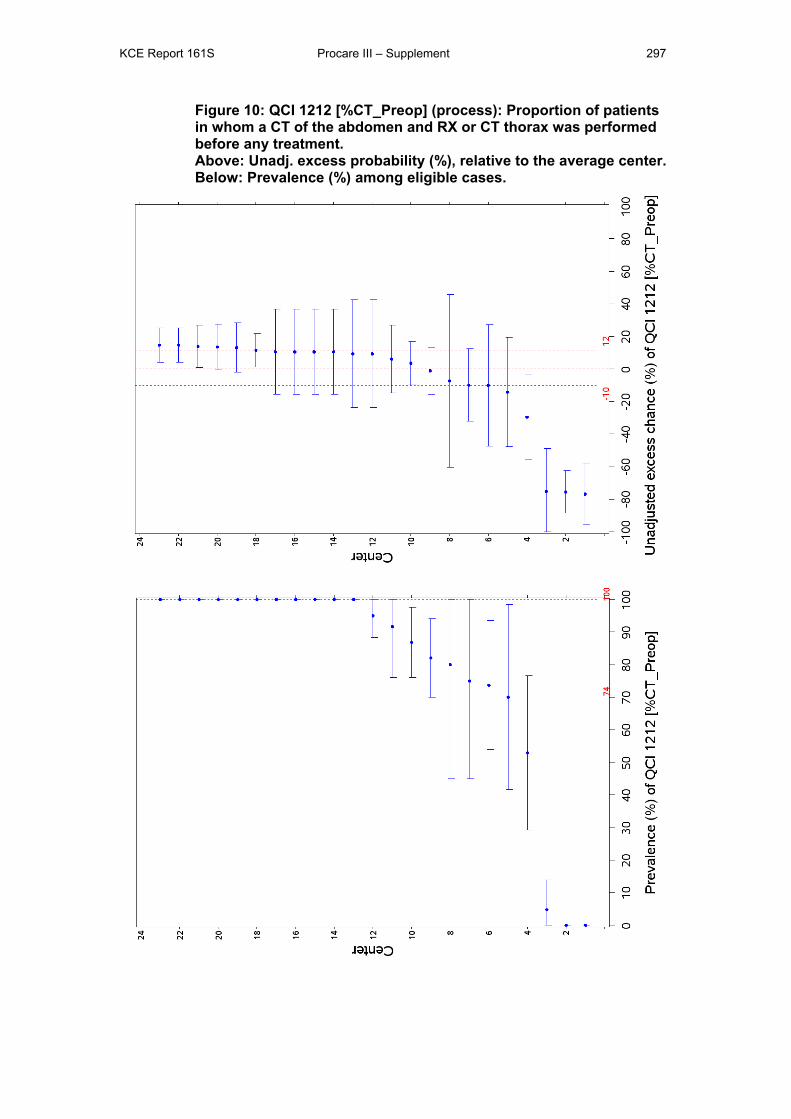
KCE Report 161S Procare III – Supplement 297
Figure 10: QCI 1212 [%CT_Preop] (process): Proportion of patients in whom a CT of the abdomen and RX or CT thorax was performed before any treatment. Above: Unadj. excess probability (%), relative to the average center. Below: Prevalence (%) among eligible cases.
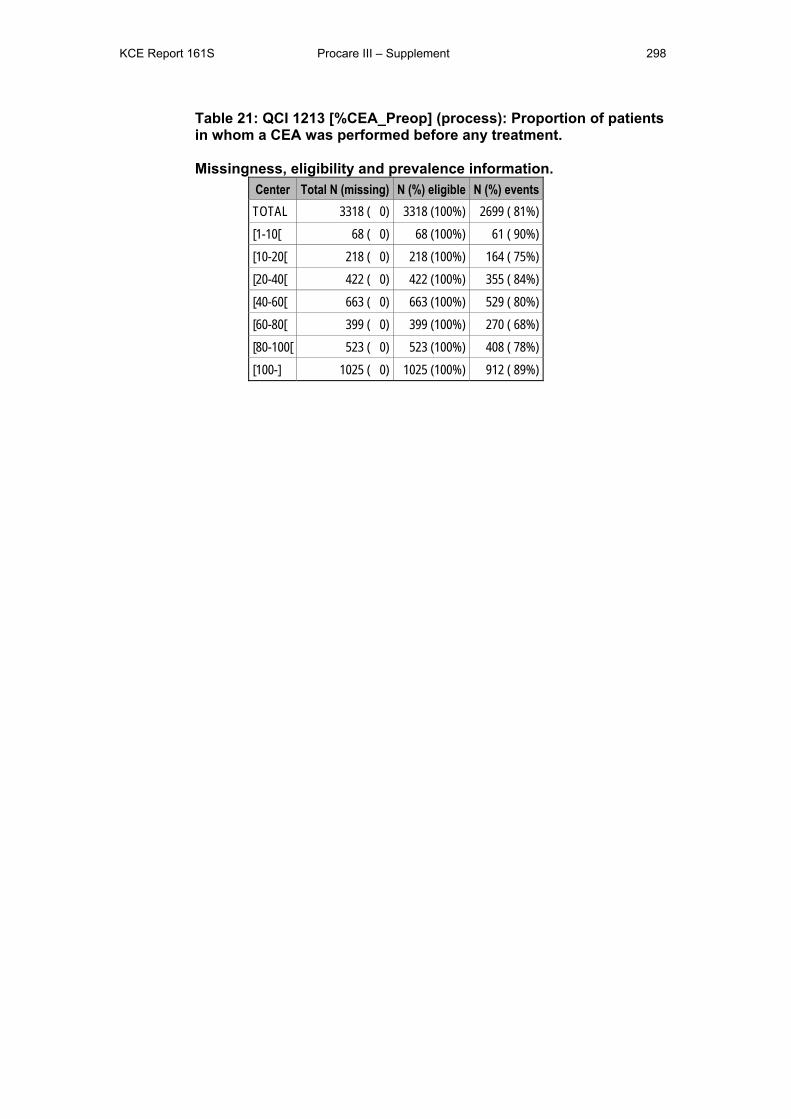
KCE Report 161S Procare III – Supplement 298
Table 21: QCI 1213 [%CEA_Preop] (process): Proportion of patients in whom a CEA was performed before any treatment. Missingness, eligibility and prevalence information.
Center Total N (missing) N (%) eligible N (%) events TOTAL 3318 ( 0) 3318 (100%) 2699 ( 81%) [1-10[ 68 ( 0) 68 (100%) 61 ( 90%) [10-20[ 218 ( 0) 218 (100%) 164 ( 75%) [20-40[ 422 ( 0) 422 (100%) 355 ( 84%) [40-60[ 663 ( 0) 663 (100%) 529 ( 80%) [60-80[ 399 ( 0) 399 (100%) 270 ( 68%) [80-100[ 523 ( 0) 523 (100%) 408 ( 78%) [100-] 1025 ( 0) 1025 (100%) 912 ( 89%)
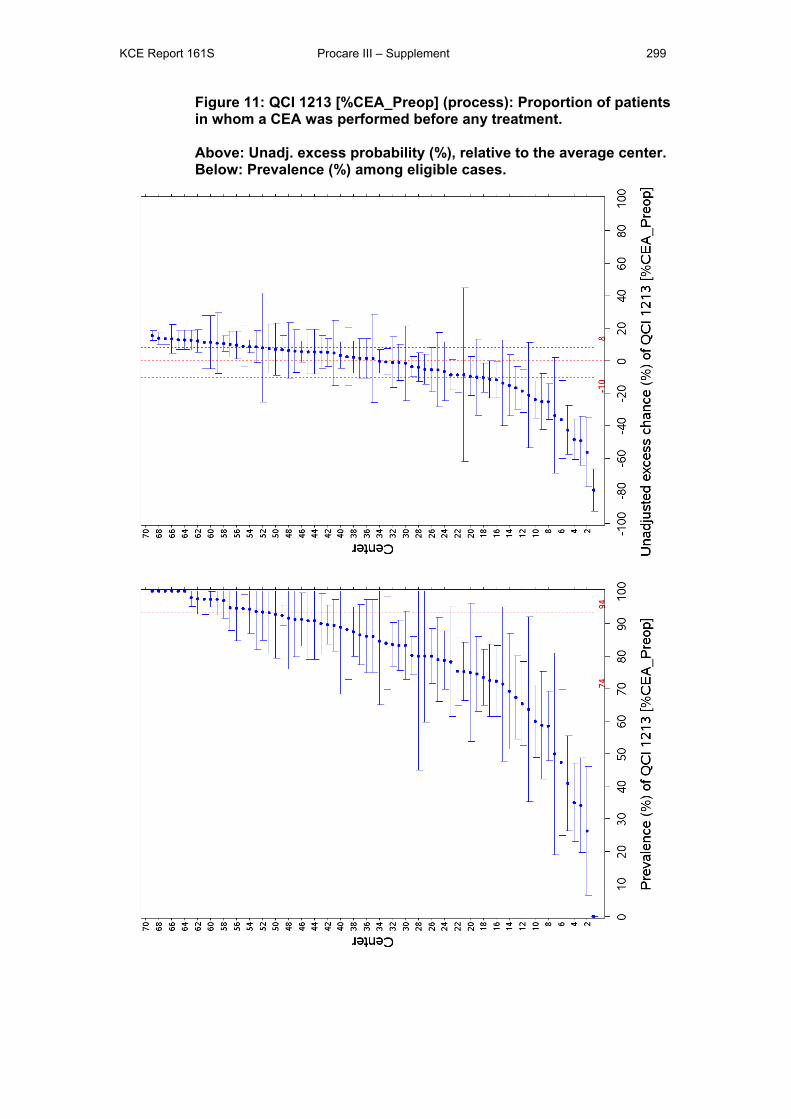
KCE Report 161S Procare III – Supplement 299
Figure 11: QCI 1213 [%CEA_Preop] (process): Proportion of patients in whom a CEA was performed before any treatment. Above: Unadj. excess probability (%), relative to the average center. Below: Prevalence (%) among eligible cases.
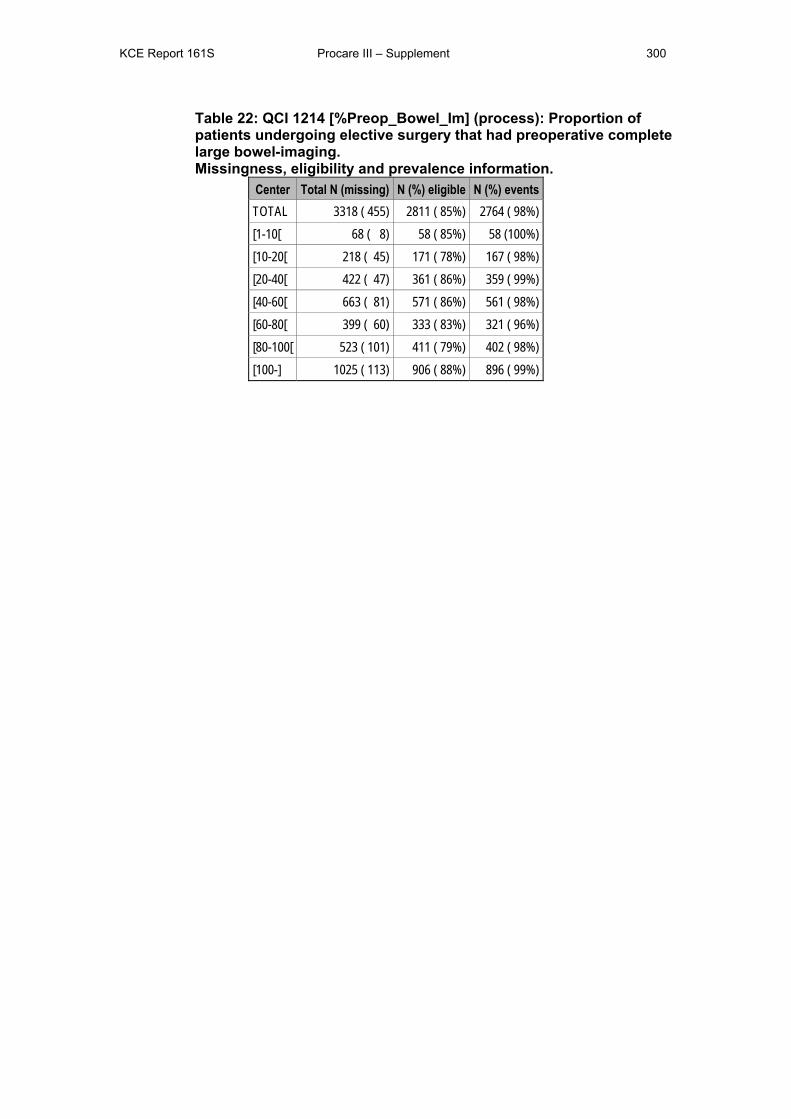
KCE Report 161S Procare III – Supplement 300
Table 22: QCI 1214 [%Preop_Bowel_Im] (process): Proportion of patients undergoing elective surgery that had preoperative complete large bowel-imaging. Missingness, eligibility and prevalence information.
Center Total N (missing) N (%) eligible N (%) events TOTAL 3318 ( 455) 2811 ( 85%) 2764 ( 98%) [1-10[ 68 ( 8) 58 ( 85%) 58 (100%) [10-20[ 218 ( 45) 171 ( 78%) 167 ( 98%) [20-40[ 422 ( 47) 361 ( 86%) 359 ( 99%) [40-60[ 663 ( 81) 571 ( 86%) 561 ( 98%) [60-80[ 399 ( 60) 333 ( 83%) 321 ( 96%) [80-100[ 523 ( 101) 411 ( 79%) 402 ( 98%) [100-] 1025 ( 113) 906 ( 88%) 896 ( 99%)
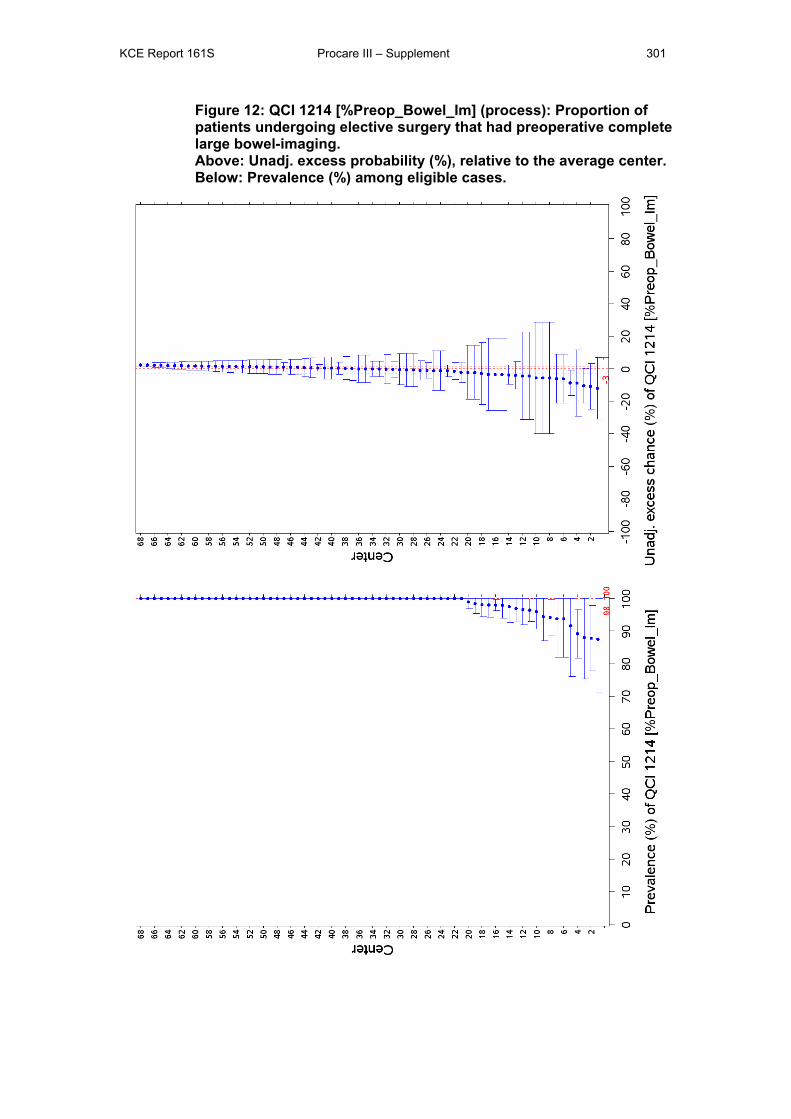
KCE Report 161S Procare III – Supplement 301
Figure 12: QCI 1214 [%Preop_Bowel_Im] (process): Proportion of patients undergoing elective surgery that had preoperative complete large bowel-imaging. Above: Unadj. excess probability (%), relative to the average center. Below: Prevalence (%) among eligible cases.
KCE Report 161S Procare III – Supplement 302
Table 23: QCI 1214b [%TRUS_cT12] (process): Use of TRUS in cT1/cT2. Missingness, eligibility and prevalence information.
Center Total N (missing) N (%) eligible N (%) events TOTAL 3318 ( 649) 74 ( 2%) 61 ( 82%) [1-10[ 68 ( 18) 0 ( 0%) [10-20[ 218 ( 53) 4 ( 2%) 3 ( 75%) [20-40[ 422 ( 86) 9 ( 2%) 9 (100%) [40-60[ 663 ( 142) 15 ( 2%) 11 ( 73%) [60-80[ 399 ( 82) 14 ( 4%) 12 ( 86%) [80-100[ 523 ( 127) 11 ( 2%) 7 ( 64%) [100-] 1025 ( 141) 21 ( 2%) 19 ( 90%)
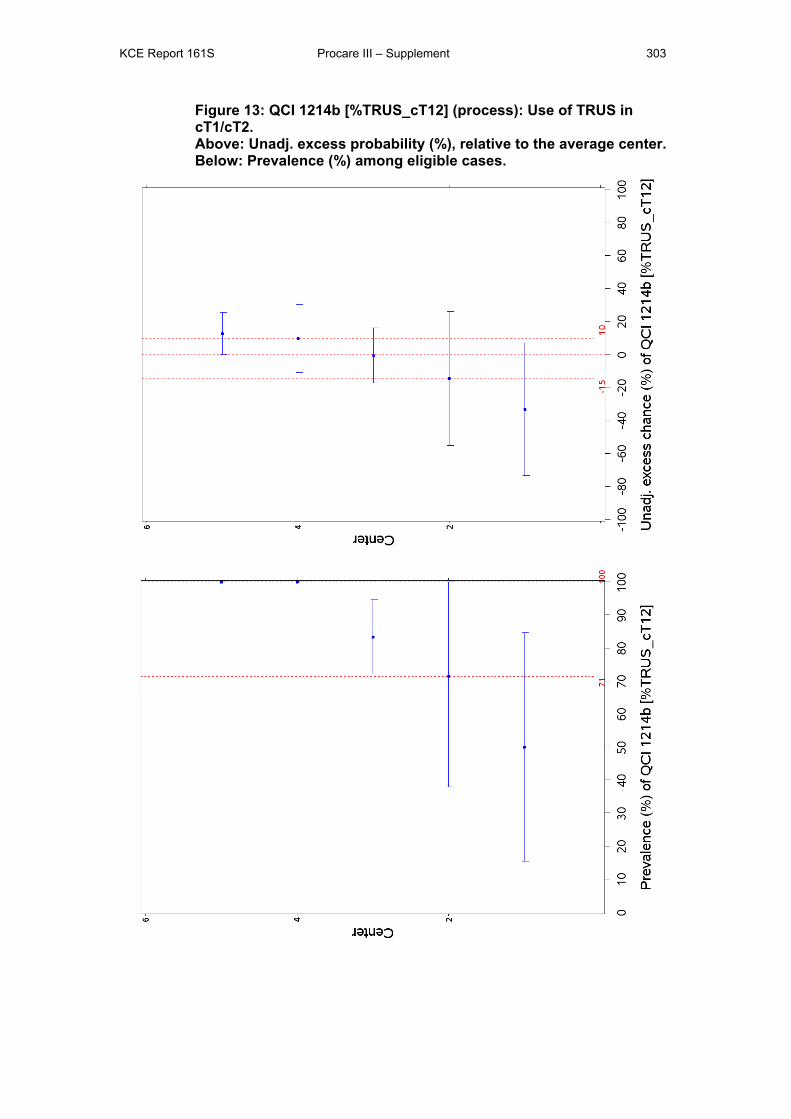
KCE Report 161S Procare III – Supplement 303
Figure 13: QCI 1214b [%TRUS_cT12] (process): Use of TRUS in cT1/cT2. Above: Unadj. excess probability (%), relative to the average center. Below: Prevalence (%) among eligible cases.
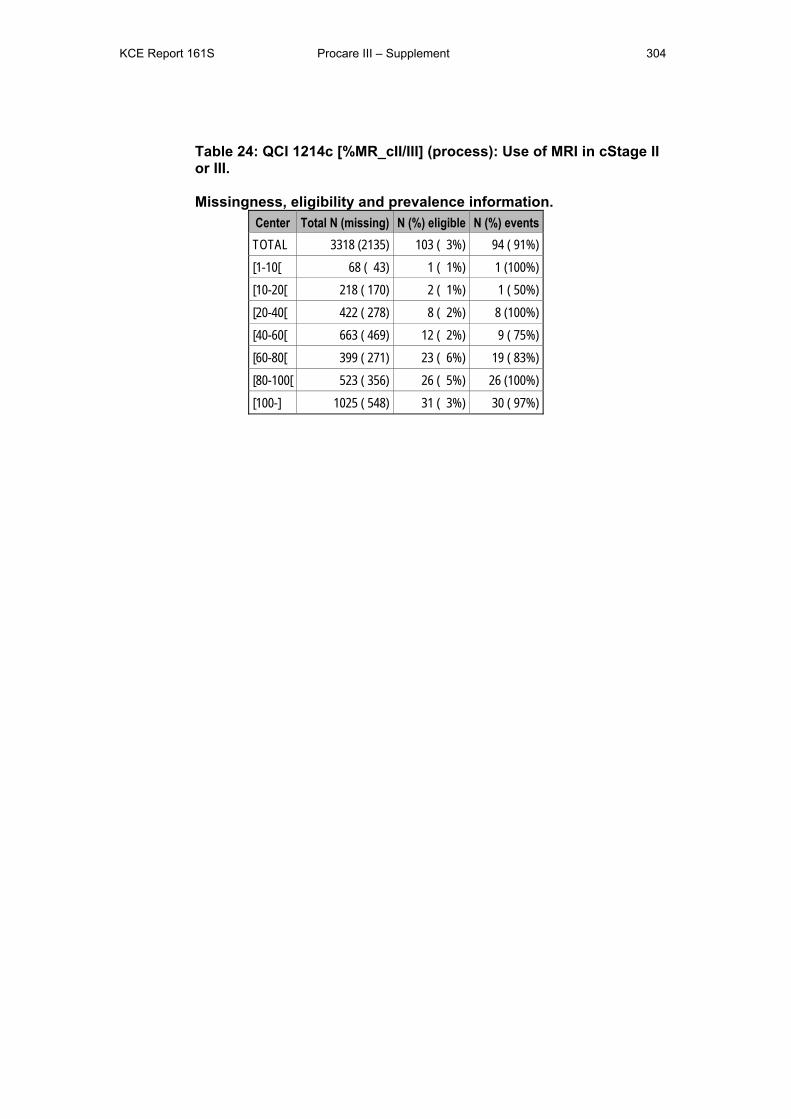
KCE Report 161S Procare III – Supplement 304
Table 24: QCI 1214c [%MR_cII/III] (process): Use of MRI in cStage II or III. Missingness, eligibility and prevalence information.
Center Total N (missing) N (%) eligible N (%) events TOTAL 3318 (2135) 103 ( 3%) 94 ( 91%) [1-10[ 68 ( 43) 1 ( 1%) 1 (100%) [10-20[ 218 ( 170) 2 ( 1%) 1 ( 50%) [20-40[ 422 ( 278) 8 ( 2%) 8 (100%) [40-60[ 663 ( 469) 12 ( 2%) 9 ( 75%) [60-80[ 399 ( 271) 23 ( 6%) 19 ( 83%) [80-100[ 523 ( 356) 26 ( 5%) 26 (100%) [100-] 1025 ( 548) 31 ( 3%) 30 ( 97%)
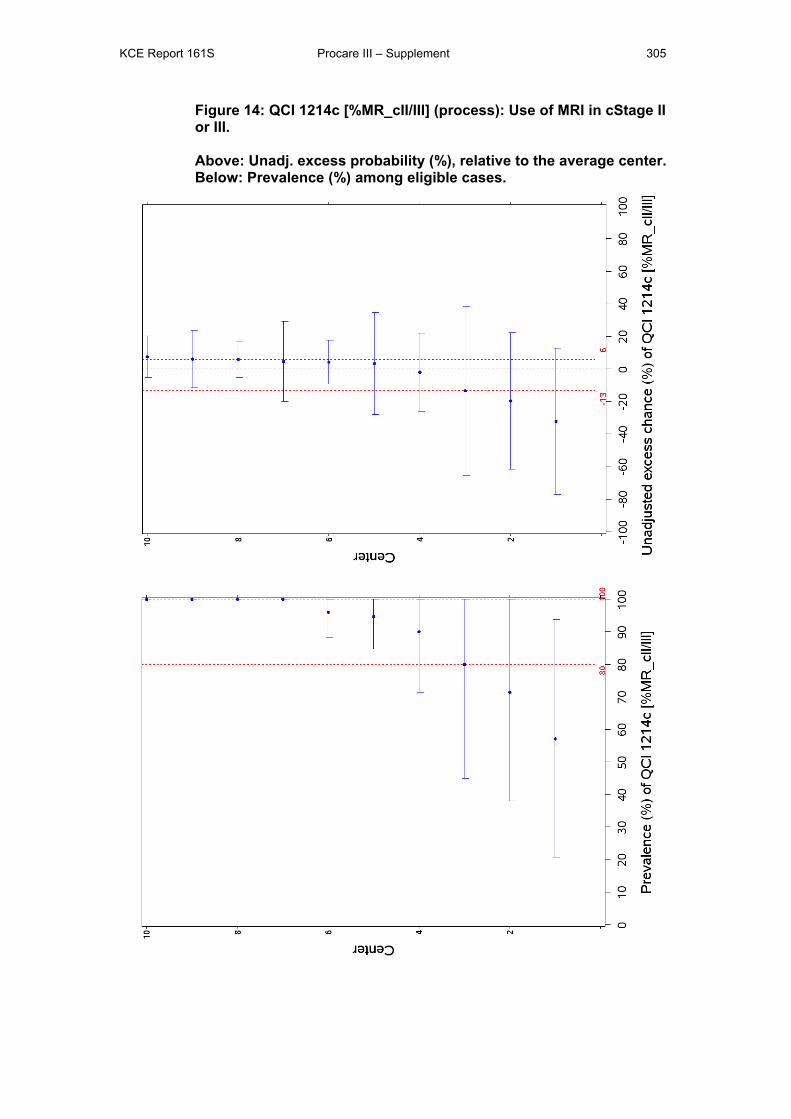
KCE Report 161S Procare III – Supplement 305
Figure 14: QCI 1214c [%MR_cII/III] (process): Use of MRI in cStage II or III. Above: Unadj. excess probability (%), relative to the average center. Below: Prevalence (%) among eligible cases.
KCE Report 161S Procare III – Supplement 306
Table 25: QCI 1215 [%Preop_Im] (process): Proportion of patients in whom a TRUS and pelvic CT and/or pelvic MRI was performed before any treatment. Missingness, eligibility and prevalence information.
Center Total N (missing) N (%) eligible N (%) events TOTAL 3318 ( 0) 435 ( 13%) 264 ( 61%) [1-10[ 68 ( 0) 6 ( 9%) 4 ( 67%) [10-20[ 218 ( 0) 42 ( 19%) 14 ( 33%) [20-40[ 422 ( 0) 31 ( 7%) 20 ( 65%) [40-60[ 663 ( 0) 79 ( 12%) 37 ( 47%) [60-80[ 399 ( 0) 94 ( 24%) 64 ( 68%) [80-100[ 523 ( 0) 89 ( 17%) 52 ( 58%) [100-] 1025 ( 0) 94 ( 9%) 73 ( 78%)
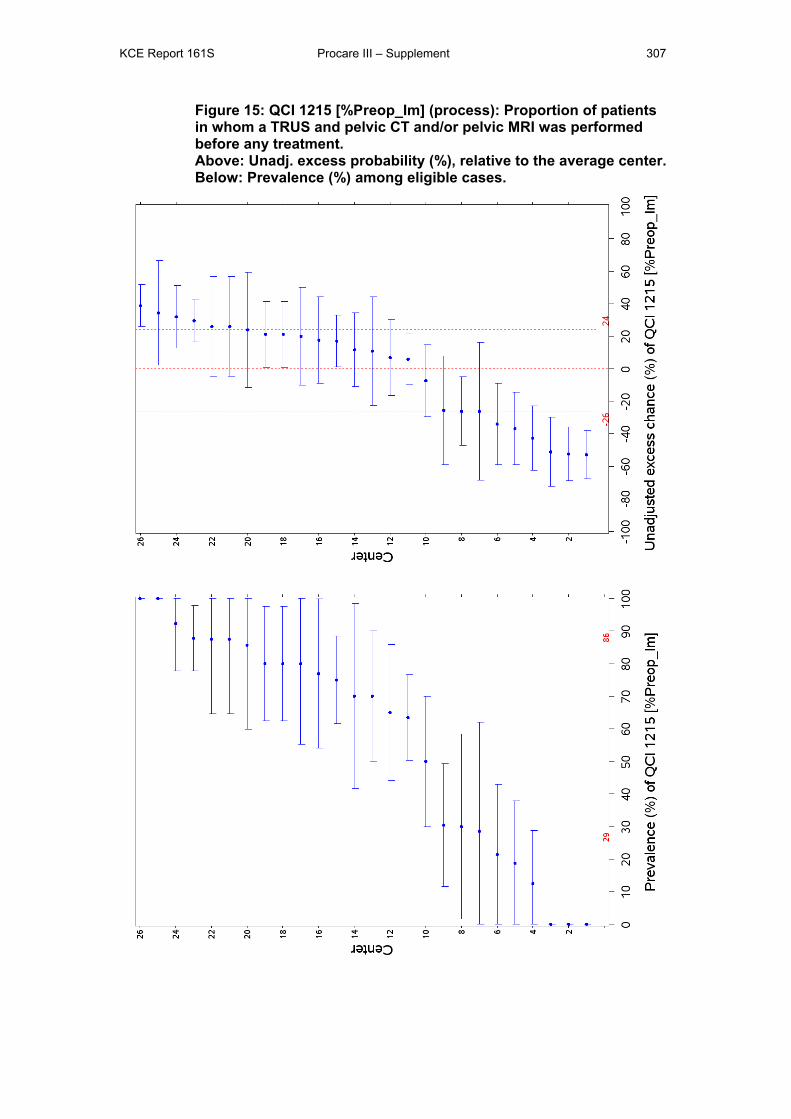
KCE Report 161S Procare III – Supplement 307
Figure 15: QCI 1215 [%Preop_Im] (process): Proportion of patients in whom a TRUS and pelvic CT and/or pelvic MRI was performed before any treatment. Above: Unadj. excess probability (%), relative to the average center. Below: Prevalence (%) among eligible cases.
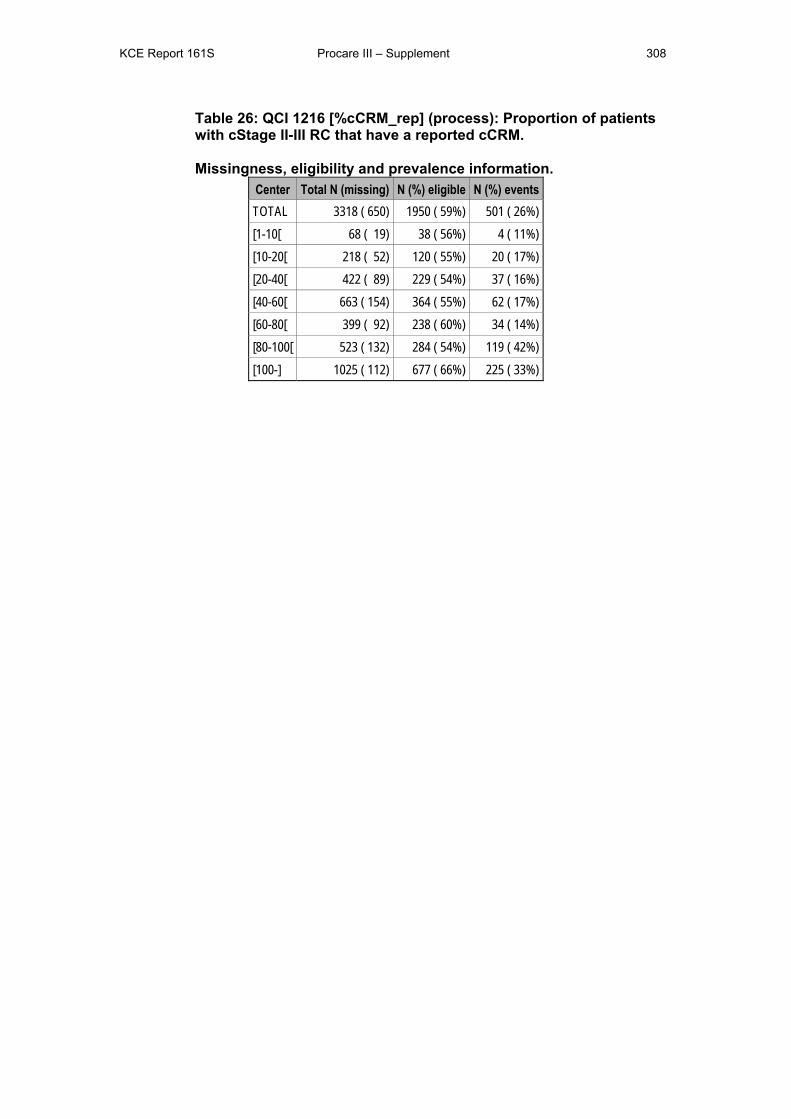
KCE Report 161S Procare III – Supplement 308
Table 26: QCI 1216 [%cCRM_rep] (process): Proportion of patients with cStage II-III RC that have a reported cCRM. Missingness, eligibility and prevalence information.
Center Total N (missing) N (%) eligible N (%) events TOTAL 3318 ( 650) 1950 ( 59%) 501 ( 26%) [1-10[ 68 ( 19) 38 ( 56%) 4 ( 11%) [10-20[ 218 ( 52) 120 ( 55%) 20 ( 17%) [20-40[ 422 ( 89) 229 ( 54%) 37 ( 16%) [40-60[ 663 ( 154) 364 ( 55%) 62 ( 17%) [60-80[ 399 ( 92) 238 ( 60%) 34 ( 14%) [80-100[ 523 ( 132) 284 ( 54%) 119 ( 42%) [100-] 1025 ( 112) 677 ( 66%) 225 ( 33%)
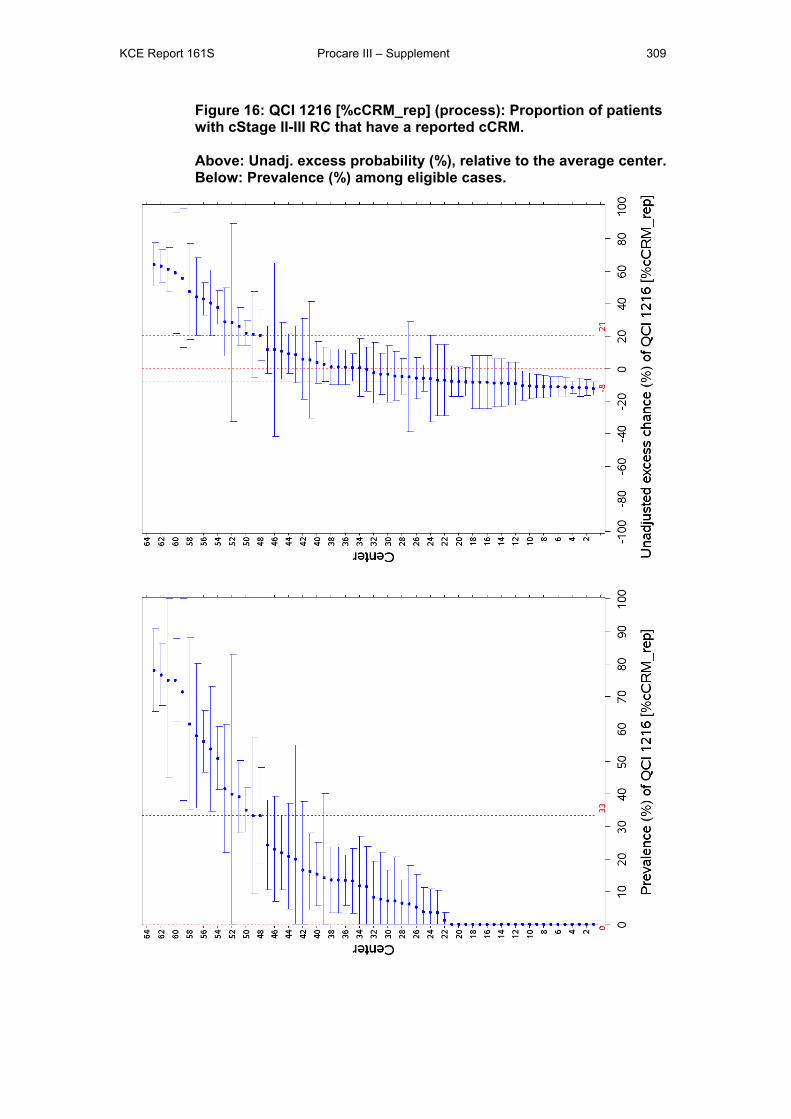
KCE Report 161S Procare III – Supplement 309
Figure 16: QCI 1216 [%cCRM_rep] (process): Proportion of patients with cStage II-III RC that have a reported cCRM. Above: Unadj. excess probability (%), relative to the average center. Below: Prevalence (%) among eligible cases.
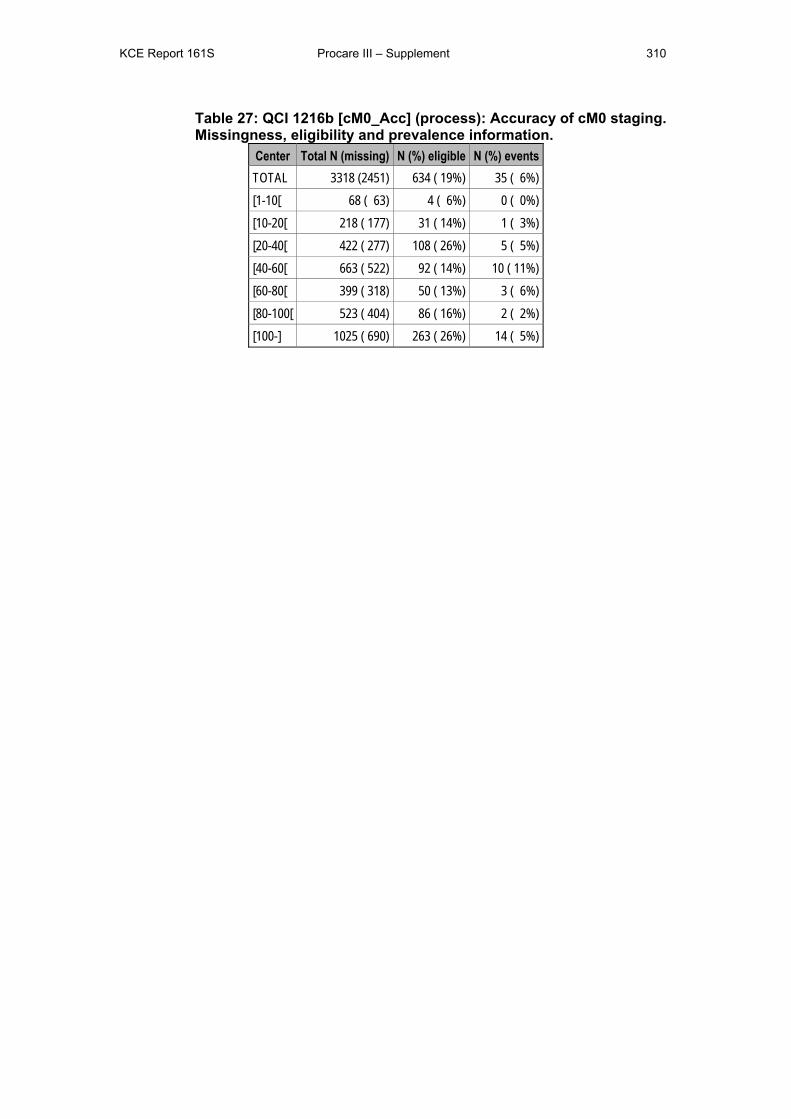
KCE Report 161S Procare III – Supplement 310
Table 27: QCI 1216b [cM0_Acc] (process): Accuracy of cM0 staging. Missingness, eligibility and prevalence information.
Center Total N (missing) N (%) eligible N (%) events TOTAL 3318 (2451) 634 ( 19%) 35 ( 6%) [1-10[ 68 ( 63) 4 ( 6%) 0 ( 0%) [10-20[ 218 ( 177) 31 ( 14%) 1 ( 3%) [20-40[ 422 ( 277) 108 ( 26%) 5 ( 5%) [40-60[ 663 ( 522) 92 ( 14%) 10 ( 11%) [60-80[ 399 ( 318) 50 ( 13%) 3 ( 6%) [80-100[ 523 ( 404) 86 ( 16%) 2 ( 2%) [100-] 1025 ( 690) 263 ( 26%) 14 ( 5%)
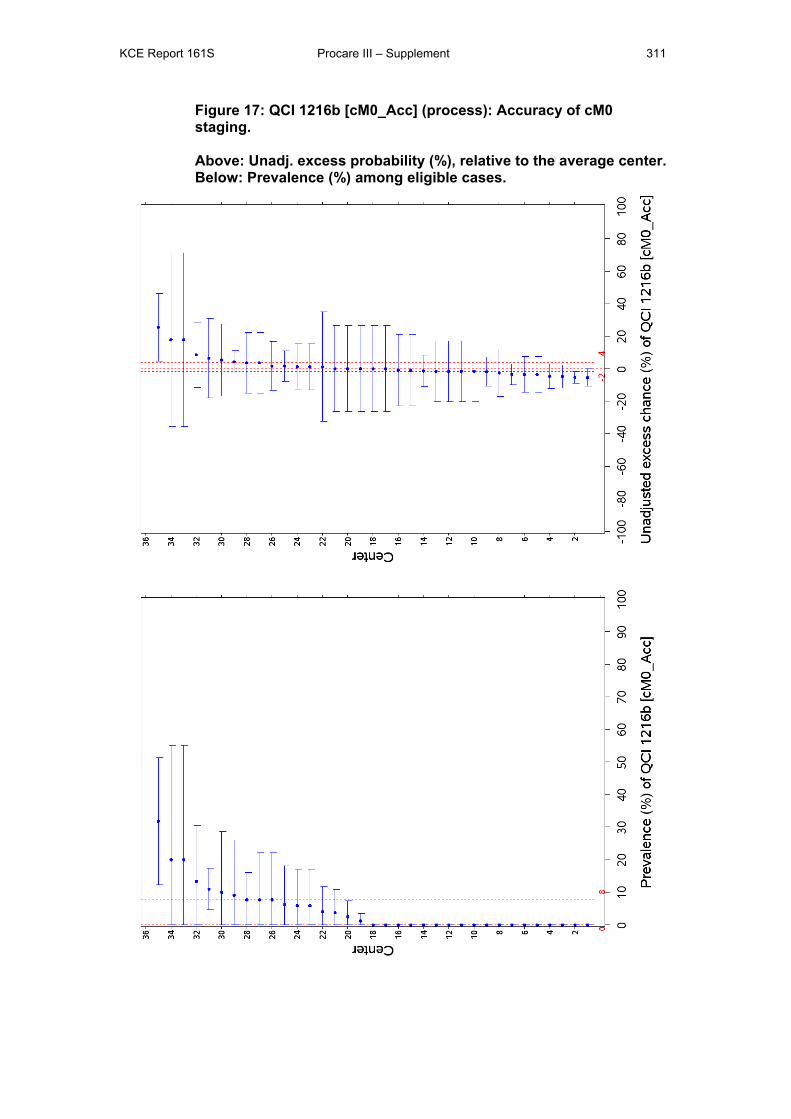
KCE Report 161S Procare III – Supplement 311
Figure 17: QCI 1216b [cM0_Acc] (process): Accuracy of cM0 staging. Above: Unadj. excess probability (%), relative to the average center. Below: Prevalence (%) among eligible cases.
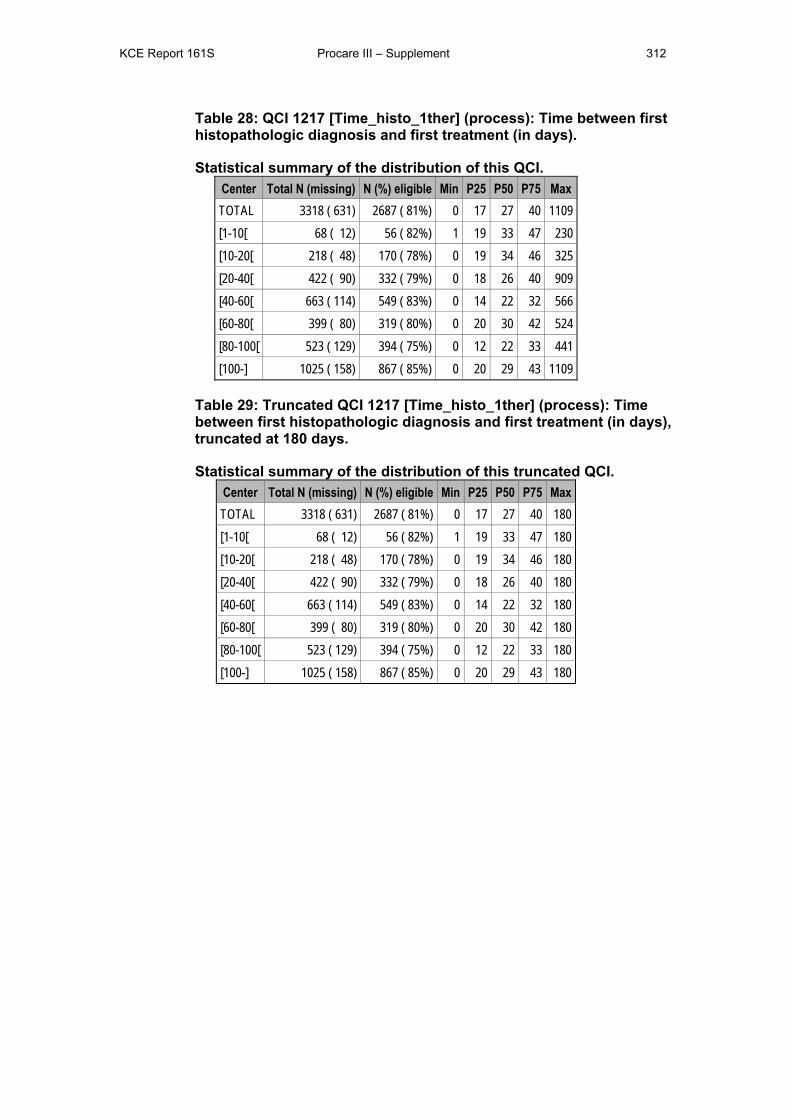
KCE Report 161S Procare III – Supplement 312
Table 28: QCI 1217 [Time_histo_1ther] (process): Time between first histopathologic diagnosis and first treatment (in days).
Statistical summary of the distribution of this QCI. Center Total N (missing) N (%) eligible Min P25 P50 P75 Max TOTAL 3318 ( 631) 2687 ( 81%) 0 17 27 40 1109 [1-10[ 68 ( 12) 56 ( 82%) 1 19 33 47 230 [10-20[ 218 ( 48) 170 ( 78%) 0 19 34 46 325 [20-40[ 422 ( 90) 332 ( 79%) 0 18 26 40 909 [40-60[ 663 ( 114) 549 ( 83%) 0 14 22 32 566 [60-80[ 399 ( 80) 319 ( 80%) 0 20 30 42 524 [80-100[ 523 ( 129) 394 ( 75%) 0 12 22 33 441 [100-] 1025 ( 158) 867 ( 85%) 0 20 29 43 1109
Table 29: Truncated QCI 1217 [Time_histo_1ther] (process): Time between first histopathologic diagnosis and first treatment (in days), truncated at 180 days.
Statistical summary of the distribution of this truncated QCI. Center Total N (missing) N (%) eligible Min P25 P50 P75 Max TOTAL 3318 ( 631) 2687 ( 81%) 0 17 27 40 180 [1-10[ 68 ( 12) 56 ( 82%) 1 19 33 47 180 [10-20[ 218 ( 48) 170 ( 78%) 0 19 34 46 180 [20-40[ 422 ( 90) 332 ( 79%) 0 18 26 40 180 [40-60[ 663 ( 114) 549 ( 83%) 0 14 22 32 180 [60-80[ 399 ( 80) 319 ( 80%) 0 20 30 42 180 [80-100[ 523 ( 129) 394 ( 75%) 0 12 22 33 180 [100-] 1025 ( 158) 867 ( 85%) 0 20 29 43 180
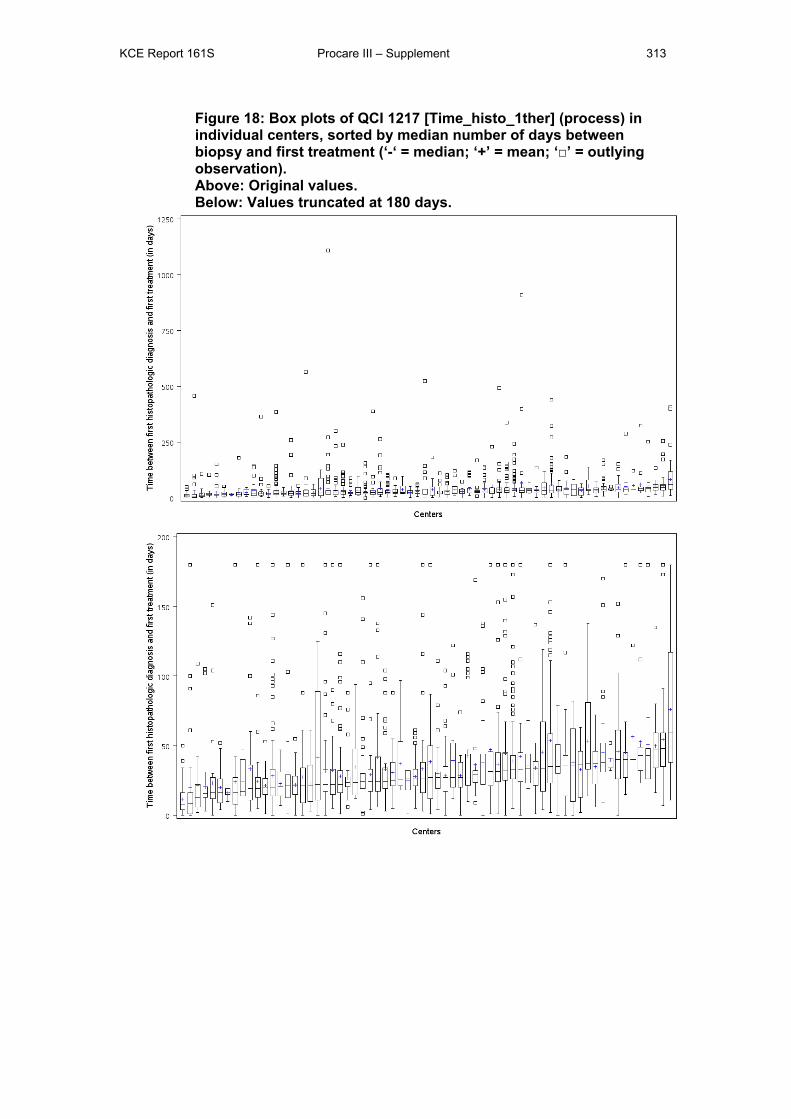
KCE Report 161S Procare III – Supplement 313
Figure 18: Box plots of QCI 1217 [Time_histo_1ther] (process) in individual centers, sorted by median number of days between biopsy and first treatment (‘-‘ = median; ‘+’ = mean; ‘□’ = outlying observation). Above: Original values. Below: Values truncated at 180 days.
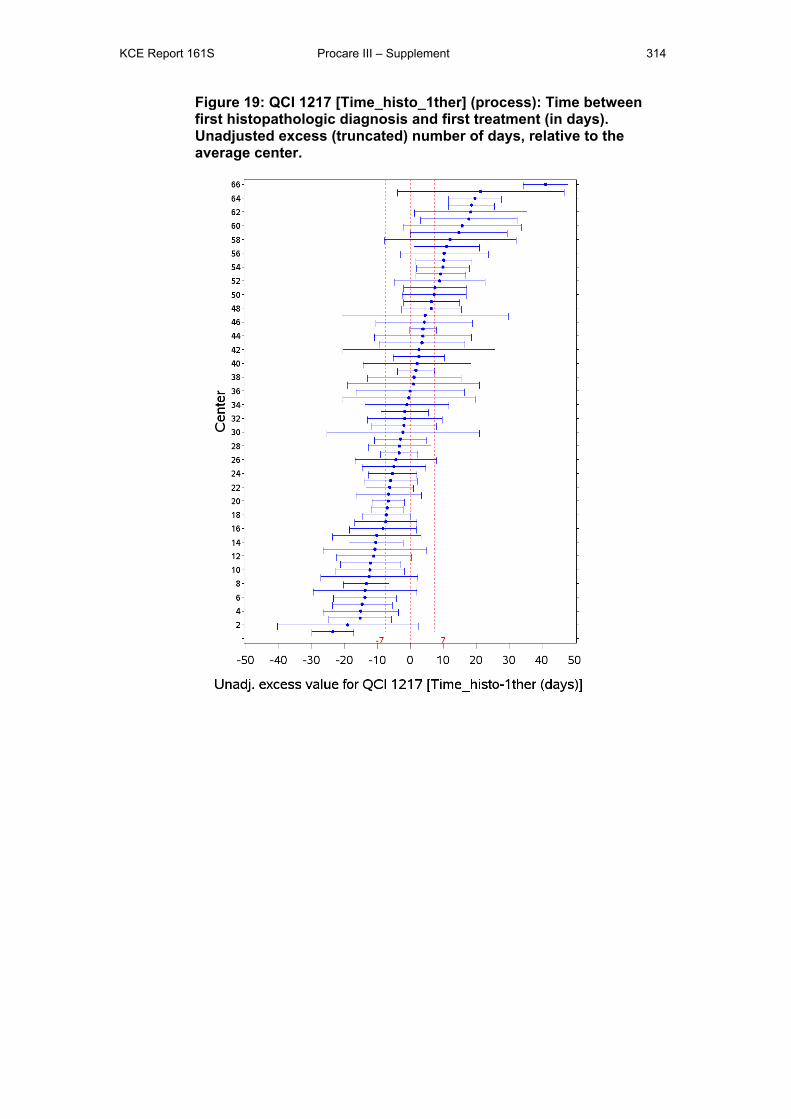
KCE Report 161S Procare III – Supplement 314
Figure 19: QCI 1217 [Time_histo_1ther] (process): Time between first histopathologic diagnosis and first treatment (in days). Unadjusted excess (truncated) number of days, relative to the average center.
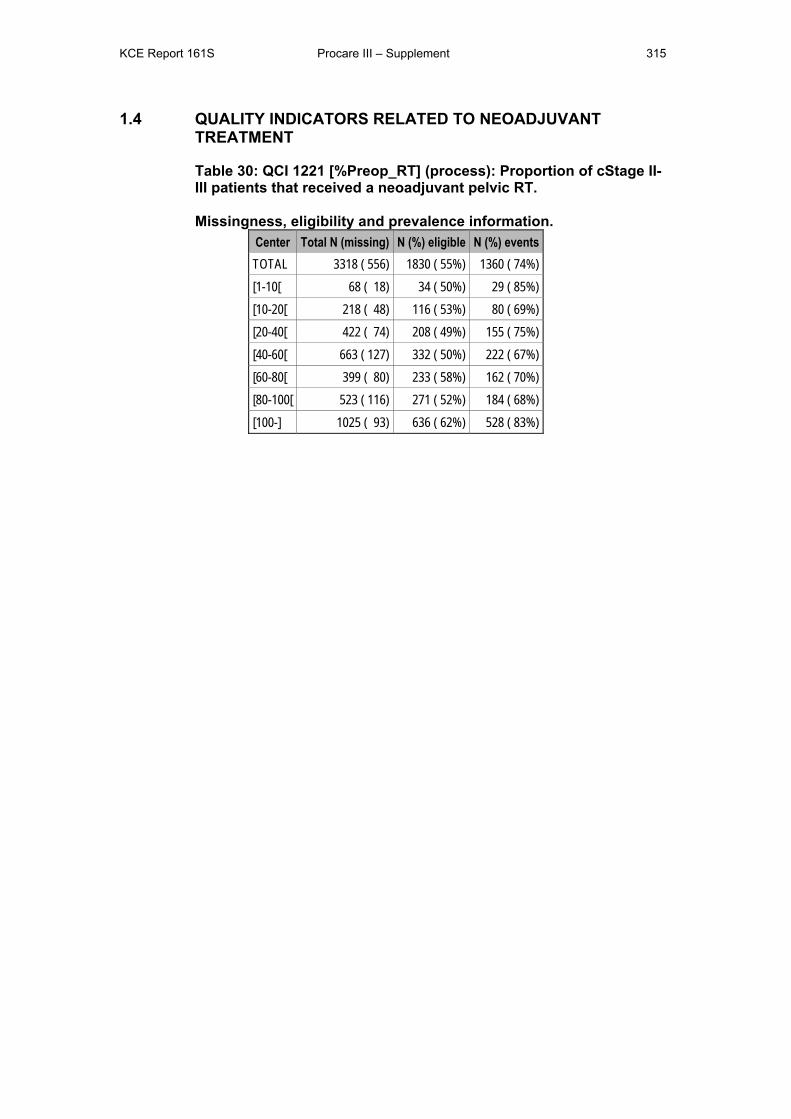
KCE Report 161S Procare III – Supplement 315
1.4 QUALITY INDICATORS RELATED TO NEOADJUVANT TREATMENT
Table 30: QCI 1221 [%Preop_RT] (process): Proportion of cStage II-III patients that received a neoadjuvant pelvic RT. Missingness, eligibility and prevalence information.
Center Total N (missing) N (%) eligible N (%) events TOTAL 3318 ( 556) 1830 ( 55%) 1360 ( 74%) [1-10[ 68 ( 18) 34 ( 50%) 29 ( 85%) [10-20[ 218 ( 48) 116 ( 53%) 80 ( 69%) [20-40[ 422 ( 74) 208 ( 49%) 155 ( 75%) [40-60[ 663 ( 127) 332 ( 50%) 222 ( 67%) [60-80[ 399 ( 80) 233 ( 58%) 162 ( 70%) [80-100[ 523 ( 116) 271 ( 52%) 184 ( 68%) [100-] 1025 ( 93) 636 ( 62%) 528 ( 83%)
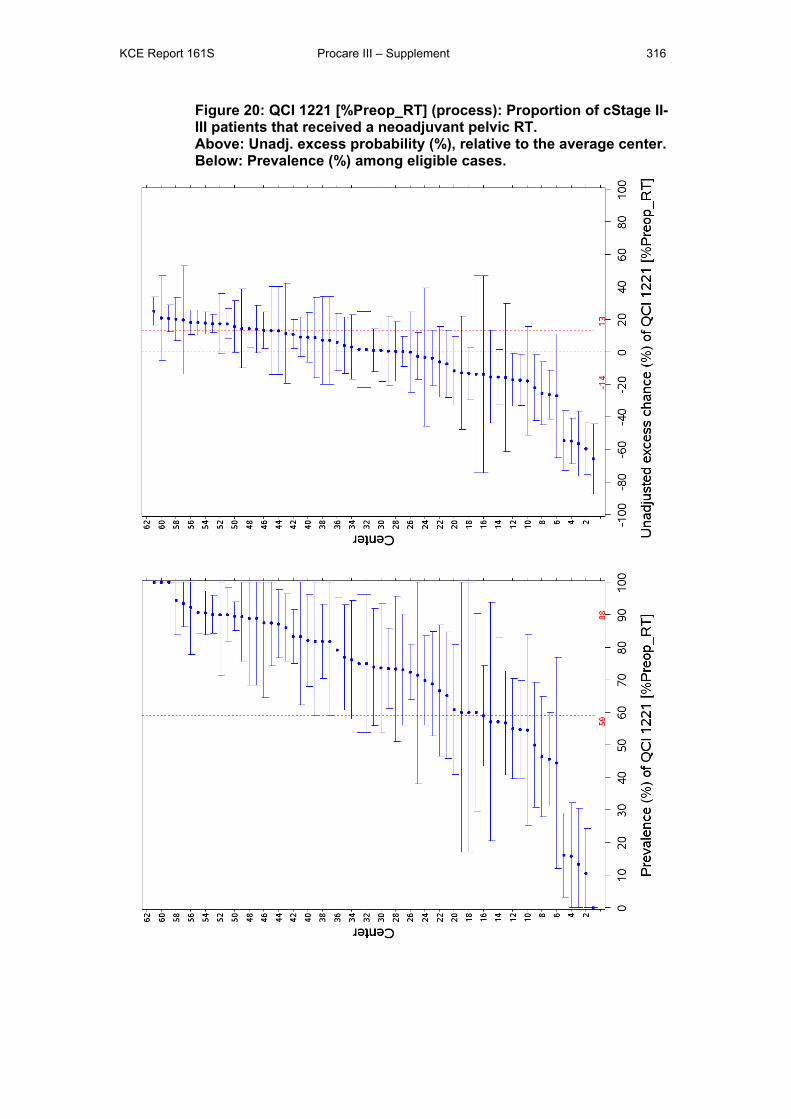
KCE Report 161S Procare III – Supplement 316
Figure 20: QCI 1221 [%Preop_RT] (process): Proportion of cStage II-III patients that received a neoadjuvant pelvic RT. Above: Unadj. excess probability (%), relative to the average center. Below: Prevalence (%) among eligible cases.
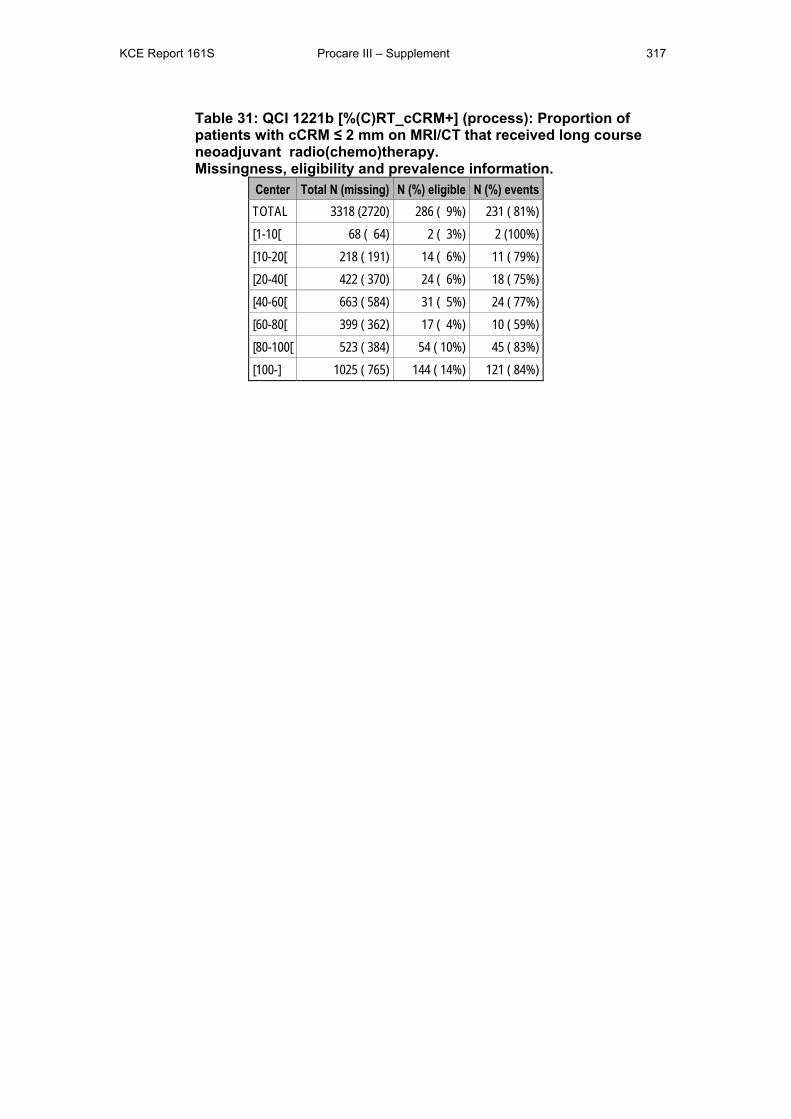
KCE Report 161S Procare III – Supplement 317
Table 31: QCI 1221b [%(C)RT_cCRM+] (process): Proportion of patients with cCRM ≤ 2 mm on MRI/CT that received long course neoadjuvant radio(chemo)therapy. Missingness, eligibility and prevalence information.
Center Total N (missing) N (%) eligible N (%) events TOTAL 3318 (2720) 286 ( 9%) 231 ( 81%) [1-10[ 68 ( 64) 2 ( 3%) 2 (100%) [10-20[ 218 ( 191) 14 ( 6%) 11 ( 79%) [20-40[ 422 ( 370) 24 ( 6%) 18 ( 75%) [40-60[ 663 ( 584) 31 ( 5%) 24 ( 77%) [60-80[ 399 ( 362) 17 ( 4%) 10 ( 59%) [80-100[ 523 ( 384) 54 ( 10%) 45 ( 83%) [100-] 1025 ( 765) 144 ( 14%) 121 ( 84%)
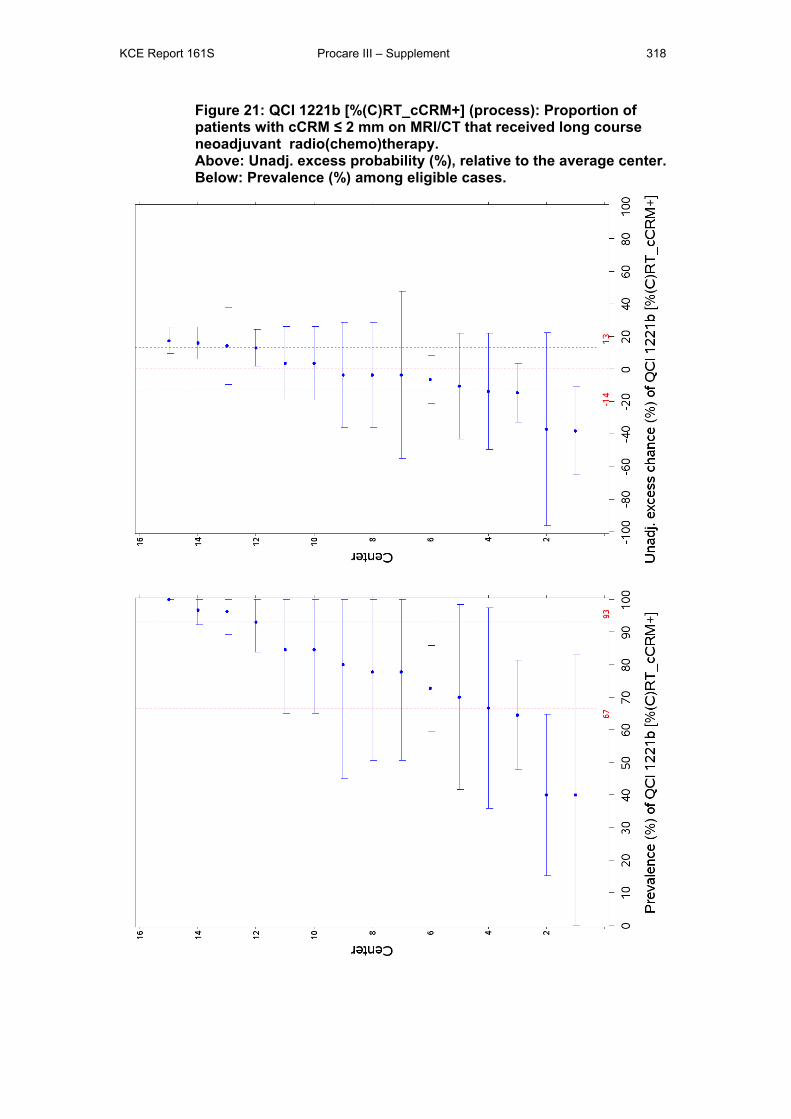
KCE Report 161S Procare III – Supplement 318
Figure 21: QCI 1221b [%(C)RT_cCRM+] (process): Proportion of patients with cCRM ≤ 2 mm on MRI/CT that received long course neoadjuvant radio(chemo)therapy. Above: Unadj. excess probability (%), relative to the average center. Below: Prevalence (%) among eligible cases.
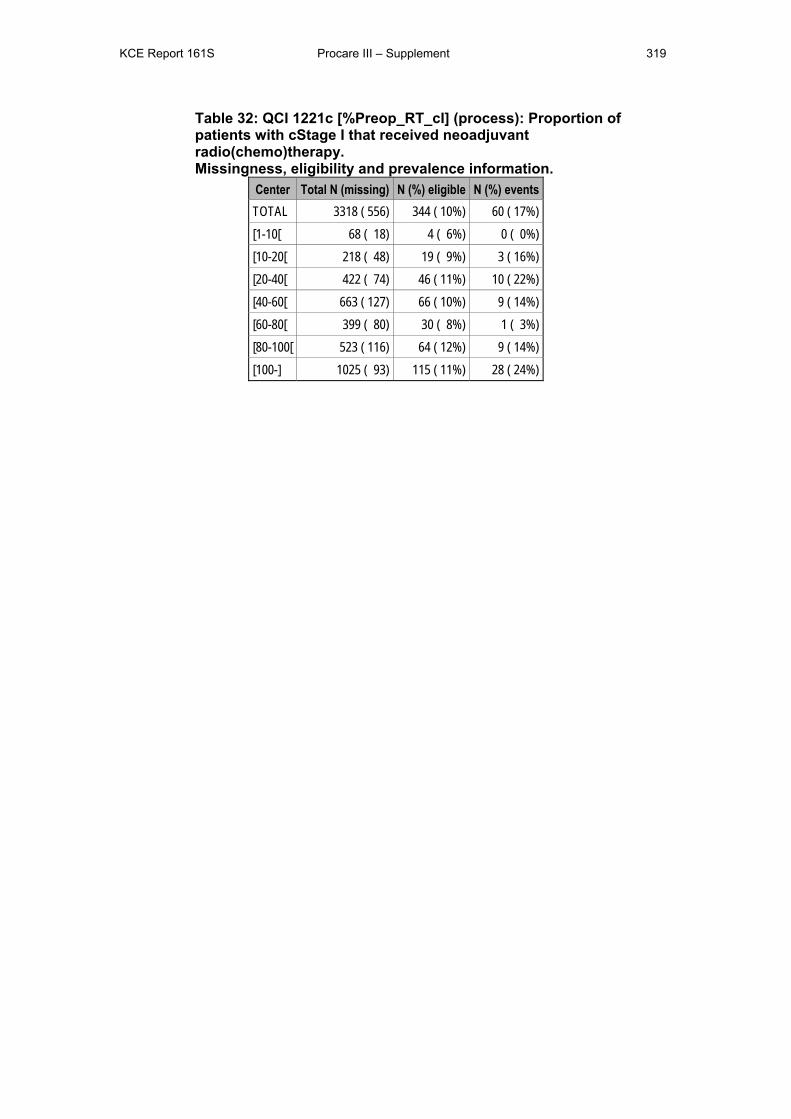
KCE Report 161S Procare III – Supplement 319
Table 32: QCI 1221c [%Preop_RT_cI] (process): Proportion of patients with cStage I that received neoadjuvant radio(chemo)therapy. Missingness, eligibility and prevalence information.
Center Total N (missing) N (%) eligible N (%) events TOTAL 3318 ( 556) 344 ( 10%) 60 ( 17%) [1-10[ 68 ( 18) 4 ( 6%) 0 ( 0%) [10-20[ 218 ( 48) 19 ( 9%) 3 ( 16%) [20-40[ 422 ( 74) 46 ( 11%) 10 ( 22%) [40-60[ 663 ( 127) 66 ( 10%) 9 ( 14%) [60-80[ 399 ( 80) 30 ( 8%) 1 ( 3%) [80-100[ 523 ( 116) 64 ( 12%) 9 ( 14%) [100-] 1025 ( 93) 115 ( 11%) 28 ( 24%)
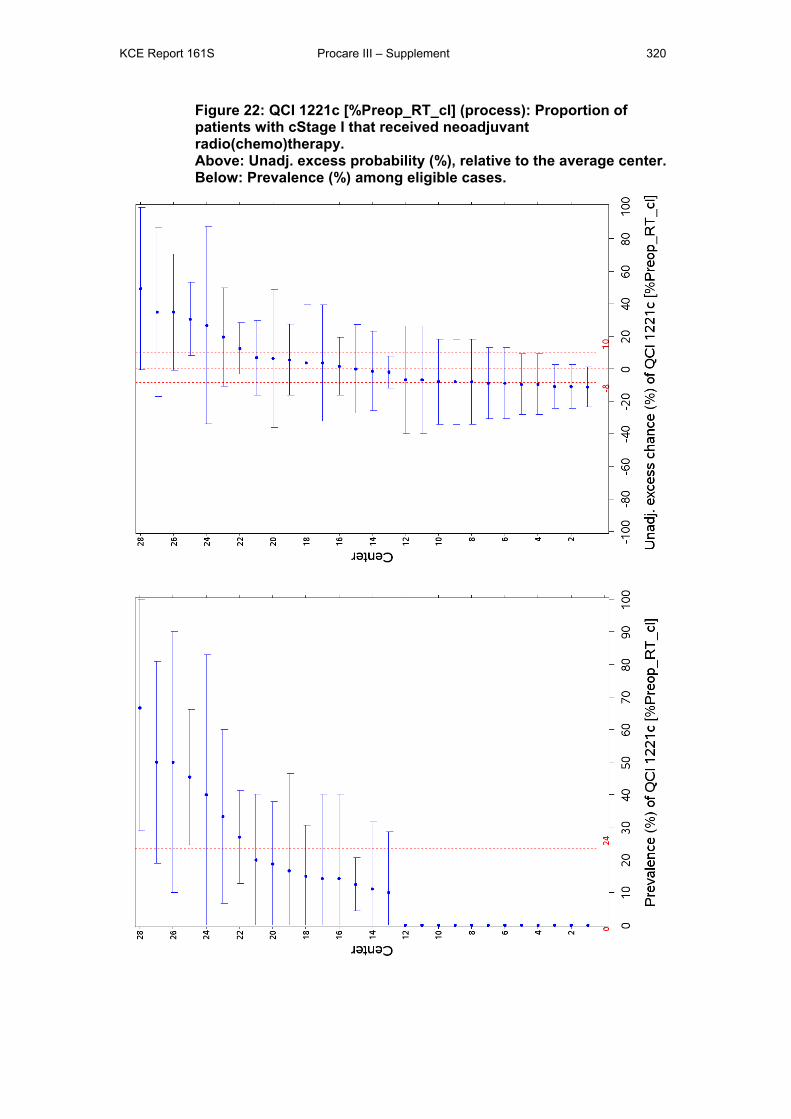
KCE Report 161S Procare III – Supplement 320
Figure 22: QCI 1221c [%Preop_RT_cI] (process): Proportion of patients with cStage I that received neoadjuvant radio(chemo)therapy. Above: Unadj. excess probability (%), relative to the average center. Below: Prevalence (%) among eligible cases.
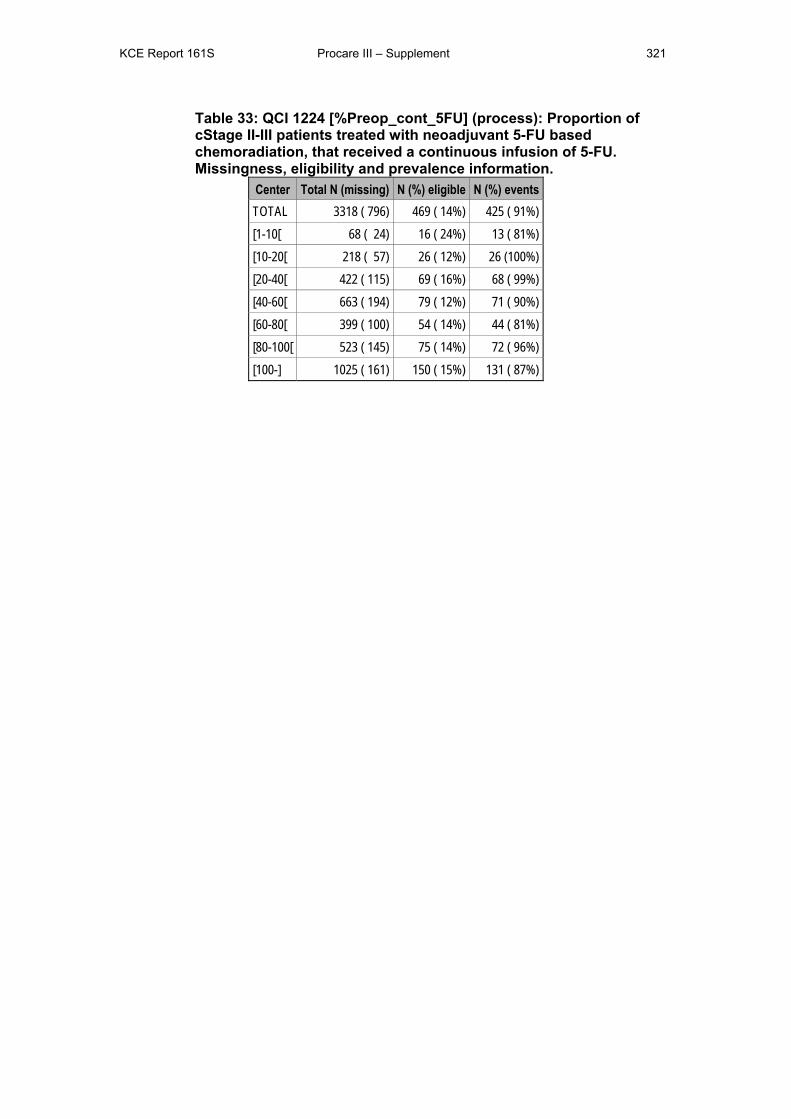
KCE Report 161S Procare III – Supplement 321
Table 33: QCI 1224 [%Preop_cont_5FU] (process): Proportion of cStage II-III patients treated with neoadjuvant 5-FU based chemoradiation, that received a continuous infusion of 5-FU. Missingness, eligibility and prevalence information.
Center Total N (missing) N (%) eligible N (%) events TOTAL 3318 ( 796) 469 ( 14%) 425 ( 91%) [1-10[ 68 ( 24) 16 ( 24%) 13 ( 81%) [10-20[ 218 ( 57) 26 ( 12%) 26 (100%) [20-40[ 422 ( 115) 69 ( 16%) 68 ( 99%) [40-60[ 663 ( 194) 79 ( 12%) 71 ( 90%) [60-80[ 399 ( 100) 54 ( 14%) 44 ( 81%) [80-100[ 523 ( 145) 75 ( 14%) 72 ( 96%) [100-] 1025 ( 161) 150 ( 15%) 131 ( 87%)
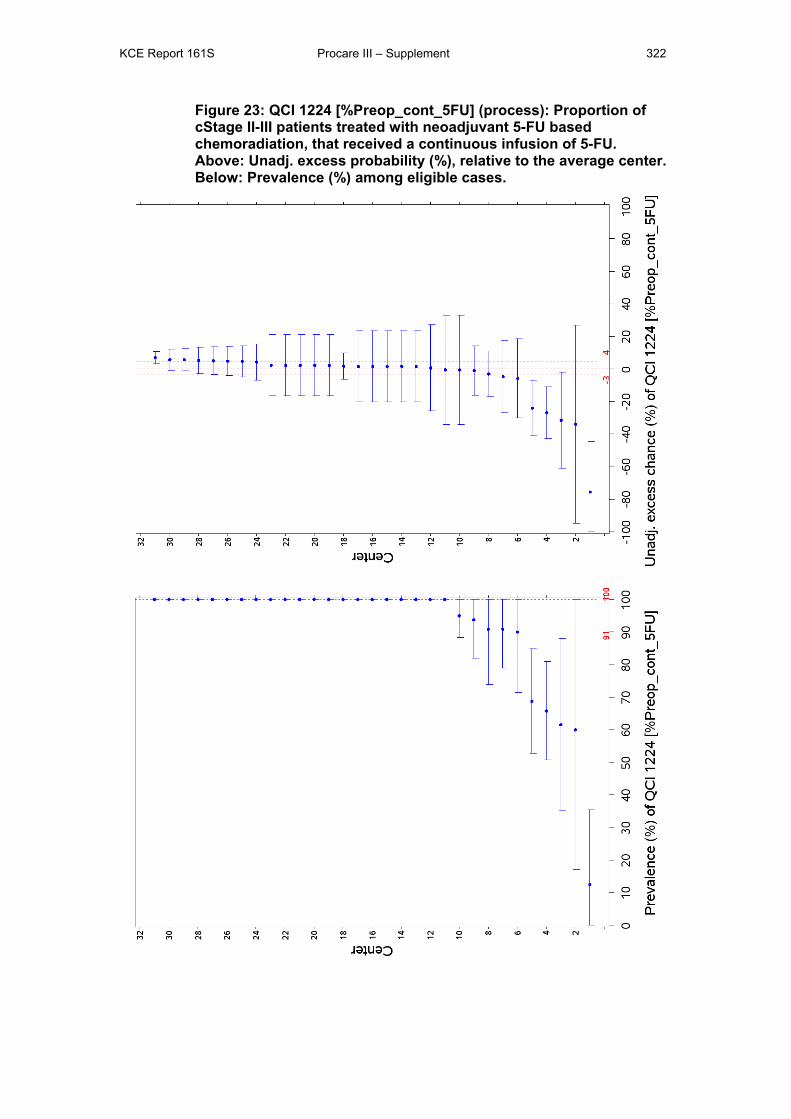
KCE Report 161S Procare III – Supplement 322
Figure 23: QCI 1224 [%Preop_cont_5FU] (process): Proportion of cStage II-III patients treated with neoadjuvant 5-FU based chemoradiation, that received a continuous infusion of 5-FU. Above: Unadj. excess probability (%), relative to the average center. Below: Prevalence (%) among eligible cases.
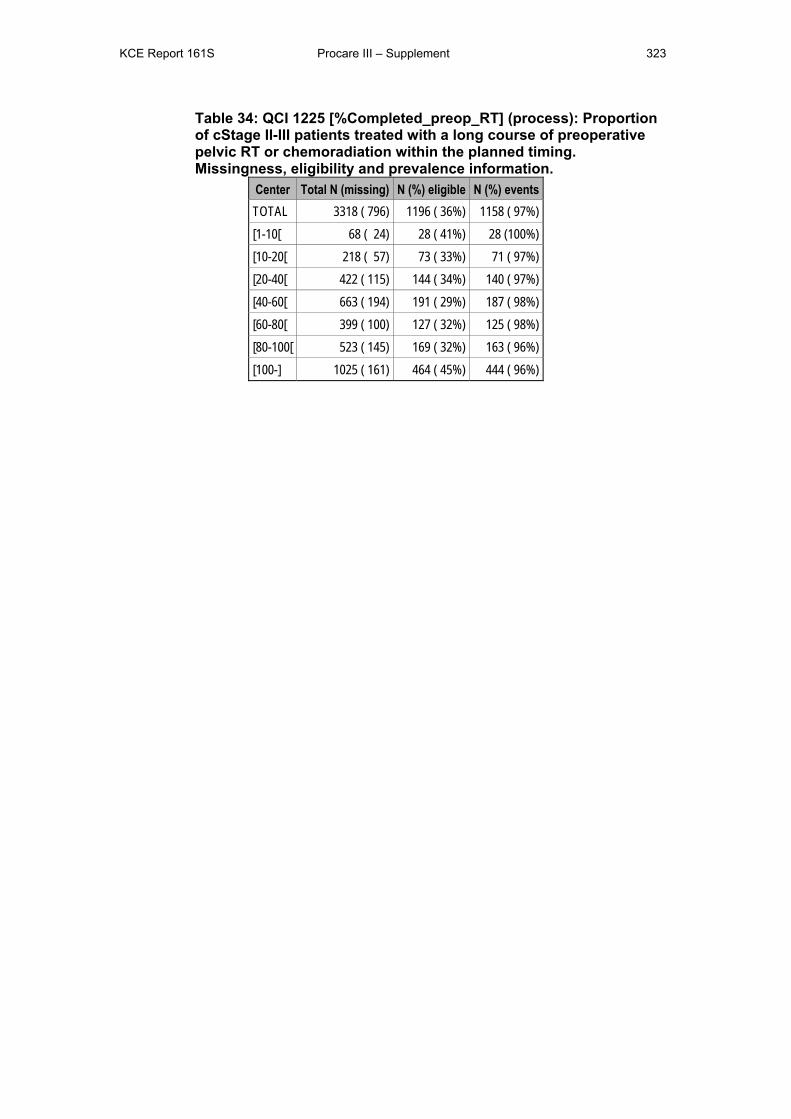
KCE Report 161S Procare III – Supplement 323
Table 34: QCI 1225 [%Completed_preop_RT] (process): Proportion of cStage II-III patients treated with a long course of preoperative pelvic RT or chemoradiation within the planned timing. Missingness, eligibility and prevalence information.
Center Total N (missing) N (%) eligible N (%) events TOTAL 3318 ( 796) 1196 ( 36%) 1158 ( 97%) [1-10[ 68 ( 24) 28 ( 41%) 28 (100%) [10-20[ 218 ( 57) 73 ( 33%) 71 ( 97%) [20-40[ 422 ( 115) 144 ( 34%) 140 ( 97%) [40-60[ 663 ( 194) 191 ( 29%) 187 ( 98%) [60-80[ 399 ( 100) 127 ( 32%) 125 ( 98%) [80-100[ 523 ( 145) 169 ( 32%) 163 ( 96%) [100-] 1025 ( 161) 464 ( 45%) 444 ( 96%)

KCE Report 161S Procare III – Supplement 324
Figure 24: QCI 1225 [%Completed_preop_RT] (process): Proportion of cStage II-III patients treated with a long course of preoperative pelvic RT or chemoradiation within the planned timing. Above: Unadj. excess probability (%), relative to the average center. Below: Prevalence (%) among eligible cases.
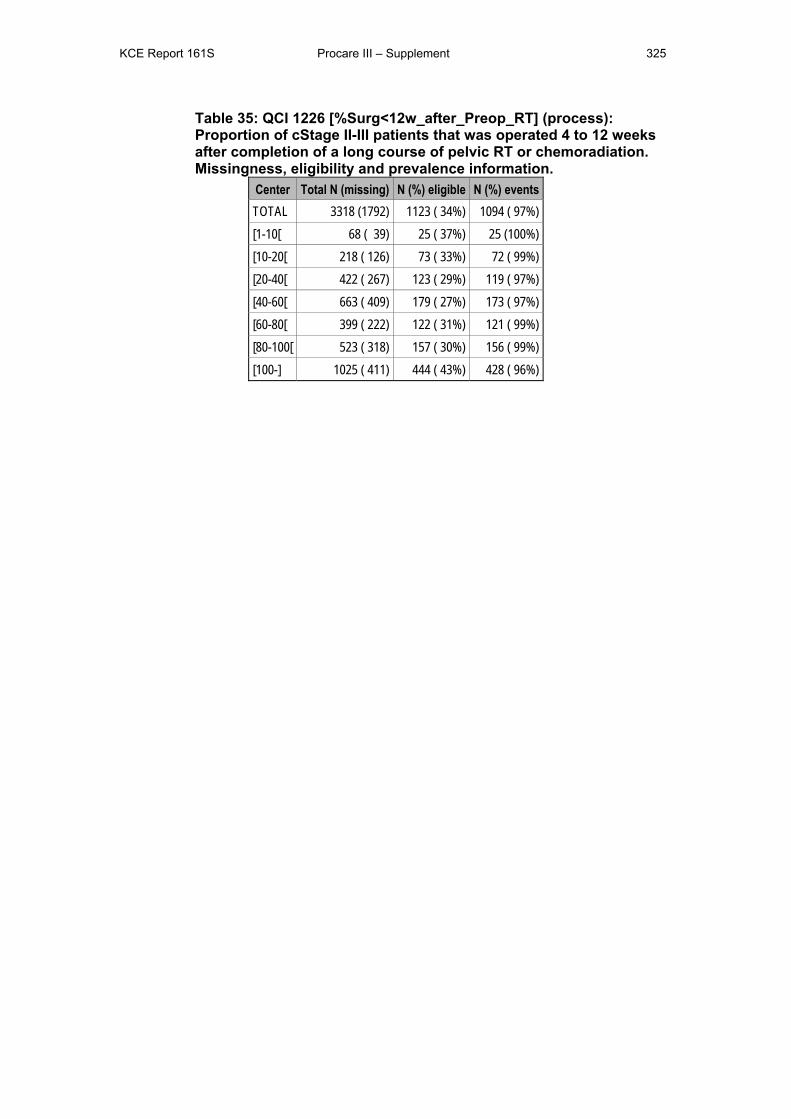
KCE Report 161S Procare III – Supplement 325
Table 35: QCI 1226 [%Surg<12w_after_Preop_RT] (process): Proportion of cStage II-III patients that was operated 4 to 12 weeks after completion of a long course of pelvic RT or chemoradiation. Missingness, eligibility and prevalence information.
Center Total N (missing) N (%) eligible N (%) events TOTAL 3318 (1792) 1123 ( 34%) 1094 ( 97%) [1-10[ 68 ( 39) 25 ( 37%) 25 (100%) [10-20[ 218 ( 126) 73 ( 33%) 72 ( 99%) [20-40[ 422 ( 267) 123 ( 29%) 119 ( 97%) [40-60[ 663 ( 409) 179 ( 27%) 173 ( 97%) [60-80[ 399 ( 222) 122 ( 31%) 121 ( 99%) [80-100[ 523 ( 318) 157 ( 30%) 156 ( 99%) [100-] 1025 ( 411) 444 ( 43%) 428 ( 96%)
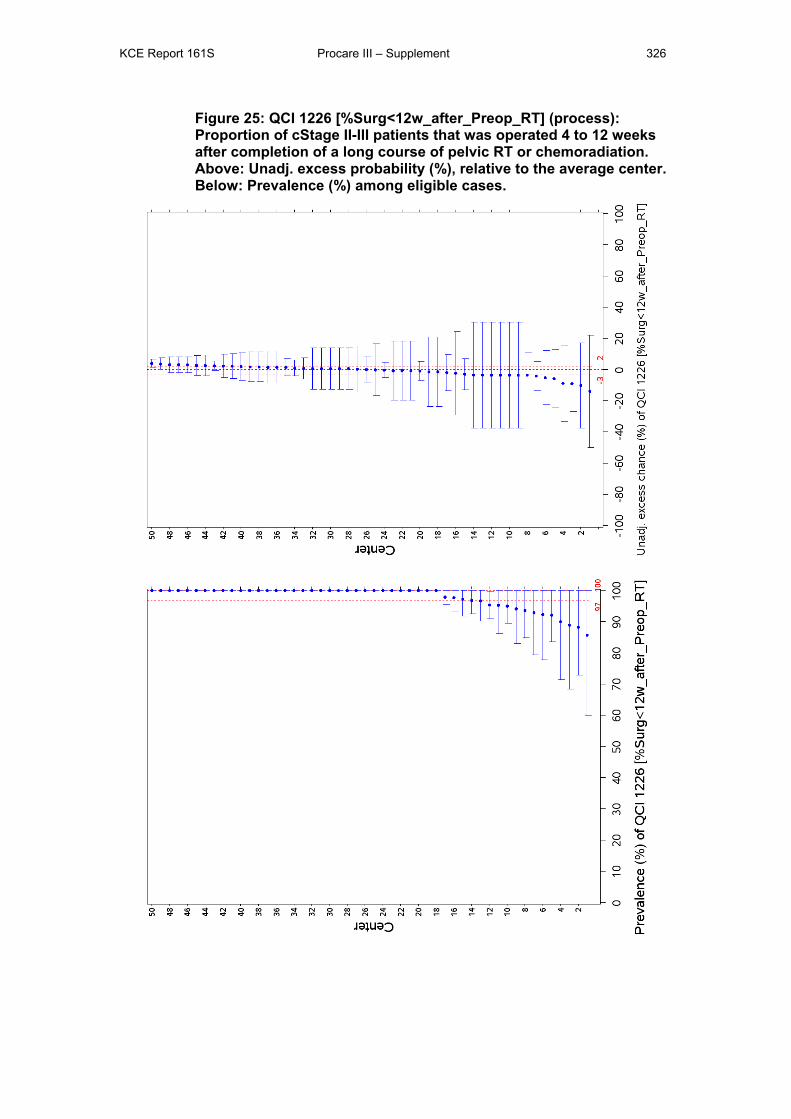
KCE Report 161S Procare III – Supplement 326
Figure 25: QCI 1226 [%Surg<12w_after_Preop_RT] (process): Proportion of cStage II-III patients that was operated 4 to 12 weeks after completion of a long course of pelvic RT or chemoradiation. Above: Unadj. excess probability (%), relative to the average center. Below: Prevalence (%) among eligible cases.
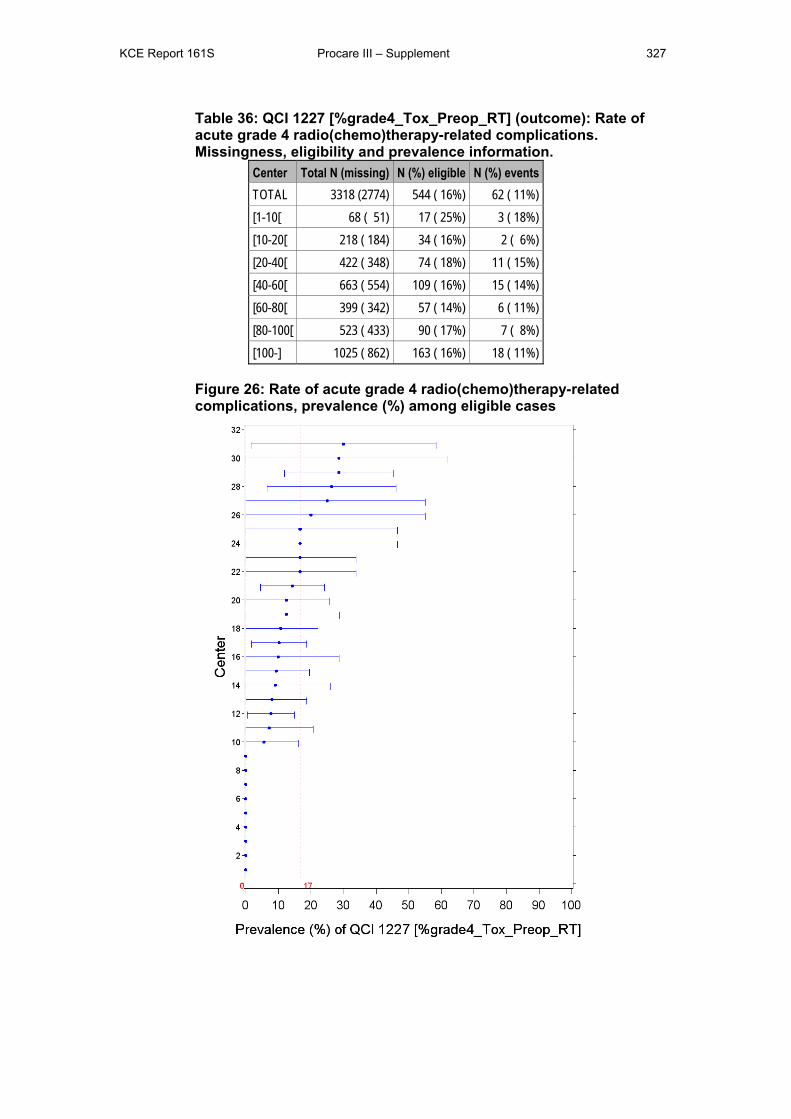
KCE Report 161S Procare III – Supplement 327
Table 36: QCI 1227 [%grade4_Tox_Preop_RT] (outcome): Rate of acute grade 4 radio(chemo)therapy-related complications. Missingness, eligibility and prevalence information.
Center Total N (missing) N (%) eligible N (%) events TOTAL 3318 (2774) 544 ( 16%) 62 ( 11%) [1-10[ 68 ( 51) 17 ( 25%) 3 ( 18%) [10-20[ 218 ( 184) 34 ( 16%) 2 ( 6%) [20-40[ 422 ( 348) 74 ( 18%) 11 ( 15%) [40-60[ 663 ( 554) 109 ( 16%) 15 ( 14%) [60-80[ 399 ( 342) 57 ( 14%) 6 ( 11%) [80-100[ 523 ( 433) 90 ( 17%) 7 ( 8%) [100-] 1025 ( 862) 163 ( 16%) 18 ( 11%)
Figure 26: Rate of acute grade 4 radio(chemo)therapy-related complications, prevalence (%) among eligible cases
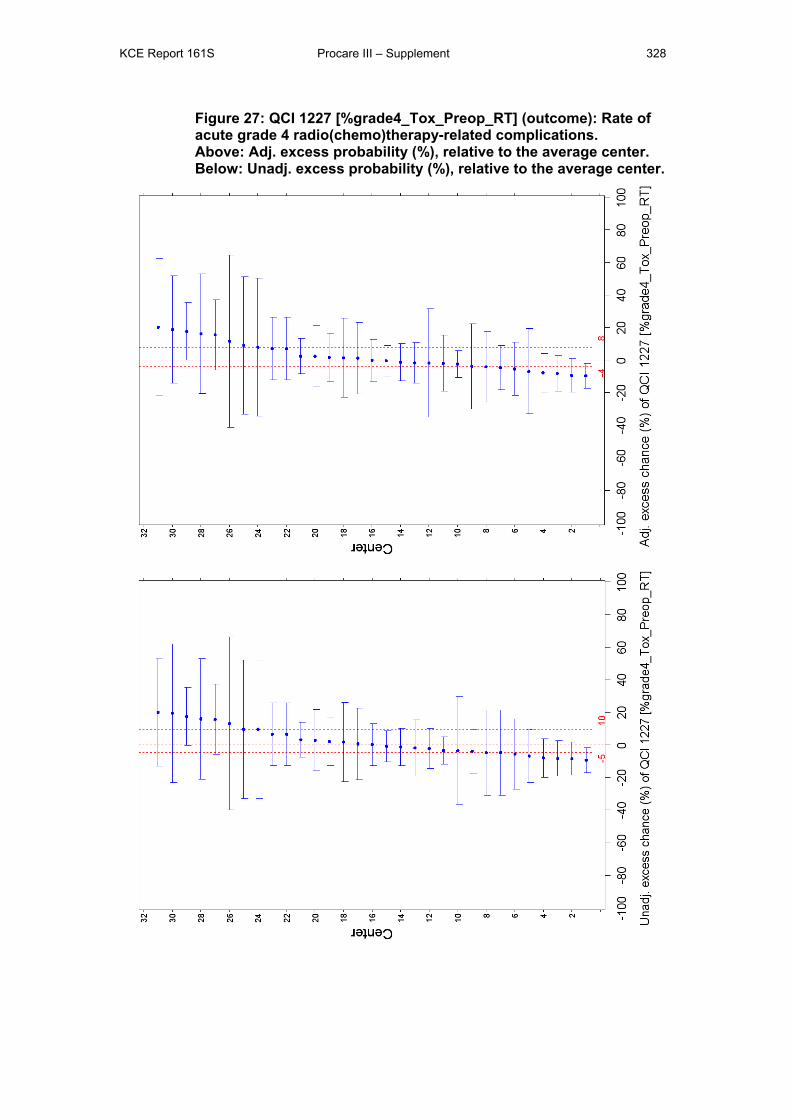
KCE Report 161S Procare III – Supplement 328
Figure 27: QCI 1227 [%grade4_Tox_Preop_RT] (outcome): Rate of acute grade 4 radio(chemo)therapy-related complications. Above: Adj. excess probability (%), relative to the average center. Below: Unadj. excess probability (%), relative to the average center.
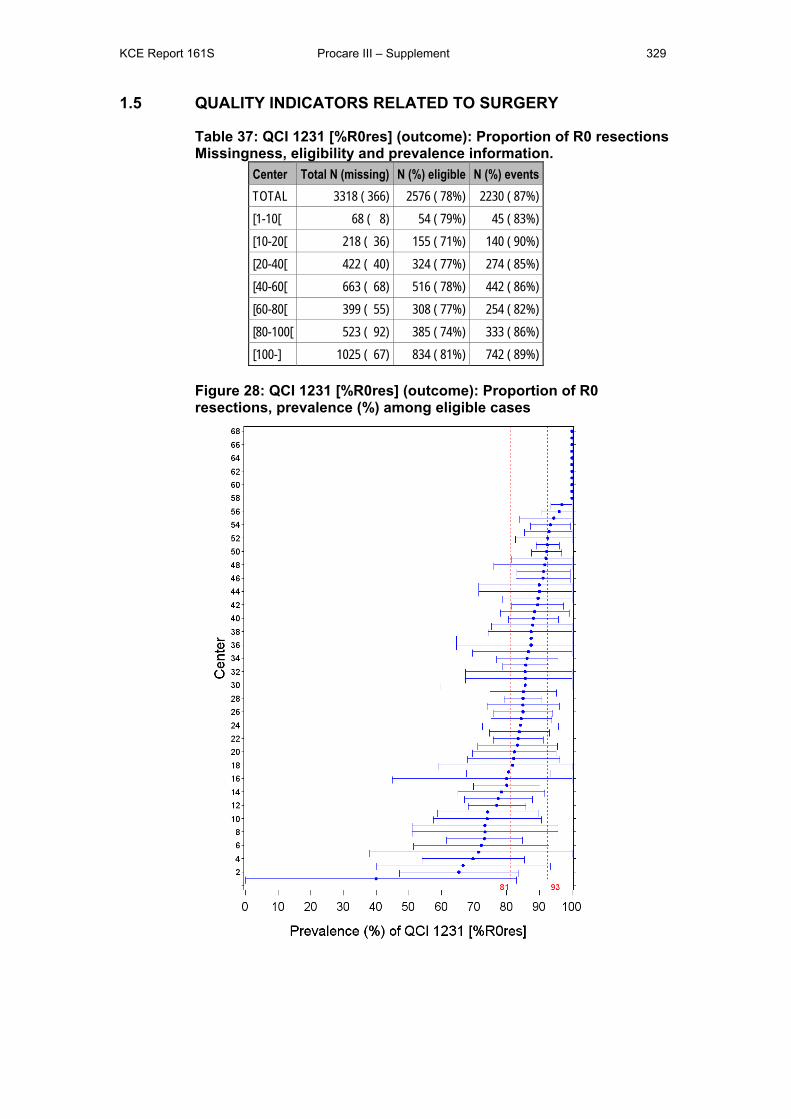
KCE Report 161S Procare III – Supplement 329
1.5 QUALITY INDICATORS RELATED TO SURGERY
Table 37: QCI 1231 [%R0res] (outcome): Proportion of R0 resections Missingness, eligibility and prevalence information.
Center Total N (missing) N (%) eligible N (%) events TOTAL 3318 ( 366) 2576 ( 78%) 2230 ( 87%) [1-10[ 68 ( 8) 54 ( 79%) 45 ( 83%) [10-20[ 218 ( 36) 155 ( 71%) 140 ( 90%) [20-40[ 422 ( 40) 324 ( 77%) 274 ( 85%) [40-60[ 663 ( 68) 516 ( 78%) 442 ( 86%) [60-80[ 399 ( 55) 308 ( 77%) 254 ( 82%) [80-100[ 523 ( 92) 385 ( 74%) 333 ( 86%) [100-] 1025 ( 67) 834 ( 81%) 742 ( 89%)
Figure 28: QCI 1231 [%R0res] (outcome): Proportion of R0 resections, prevalence (%) among eligible cases
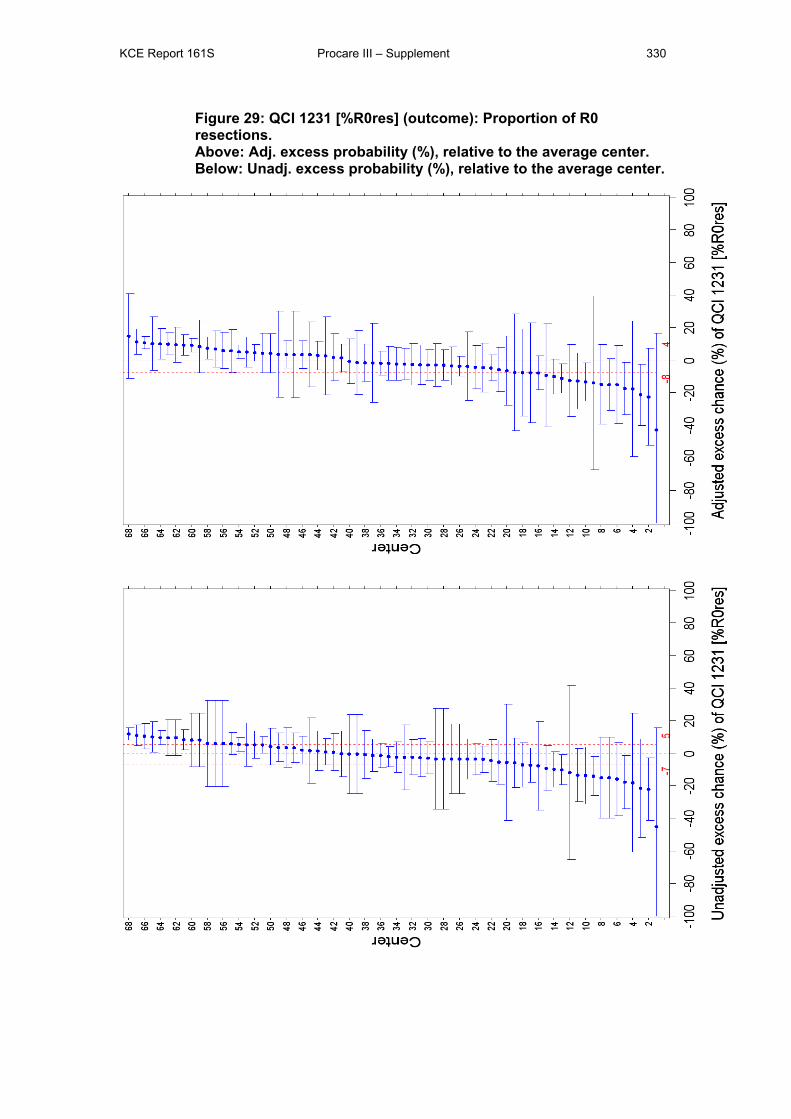
KCE Report 161S Procare III – Supplement 330
Figure 29: QCI 1231 [%R0res] (outcome): Proportion of R0 resections. Above: Adj. excess probability (%), relative to the average center. Below: Unadj. excess probability (%), relative to the average center.
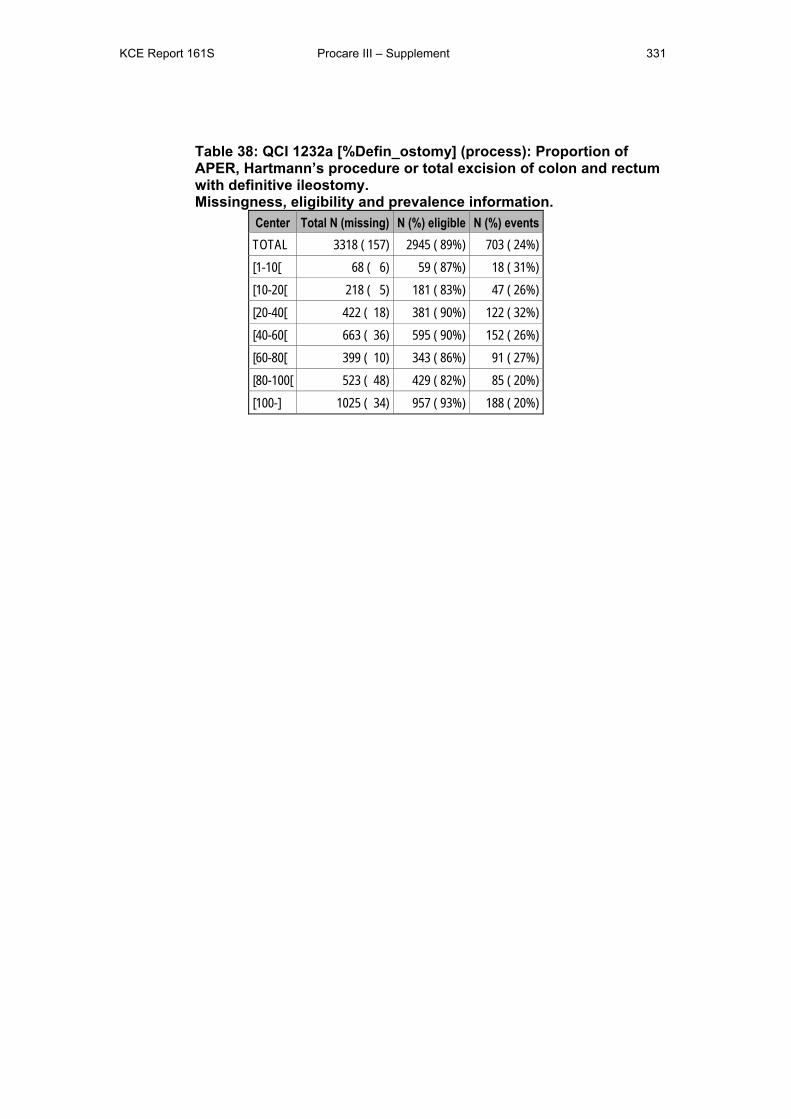
KCE Report 161S Procare III – Supplement 331
Table 38: QCI 1232a [%Defin_ostomy] (process): Proportion of APER, Hartmann’s procedure or total excision of colon and rectum with definitive ileostomy. Missingness, eligibility and prevalence information.
Center Total N (missing) N (%) eligible N (%) events TOTAL 3318 ( 157) 2945 ( 89%) 703 ( 24%) [1-10[ 68 ( 6) 59 ( 87%) 18 ( 31%) [10-20[ 218 ( 5) 181 ( 83%) 47 ( 26%) [20-40[ 422 ( 18) 381 ( 90%) 122 ( 32%) [40-60[ 663 ( 36) 595 ( 90%) 152 ( 26%) [60-80[ 399 ( 10) 343 ( 86%) 91 ( 27%) [80-100[ 523 ( 48) 429 ( 82%) 85 ( 20%) [100-] 1025 ( 34) 957 ( 93%) 188 ( 20%)
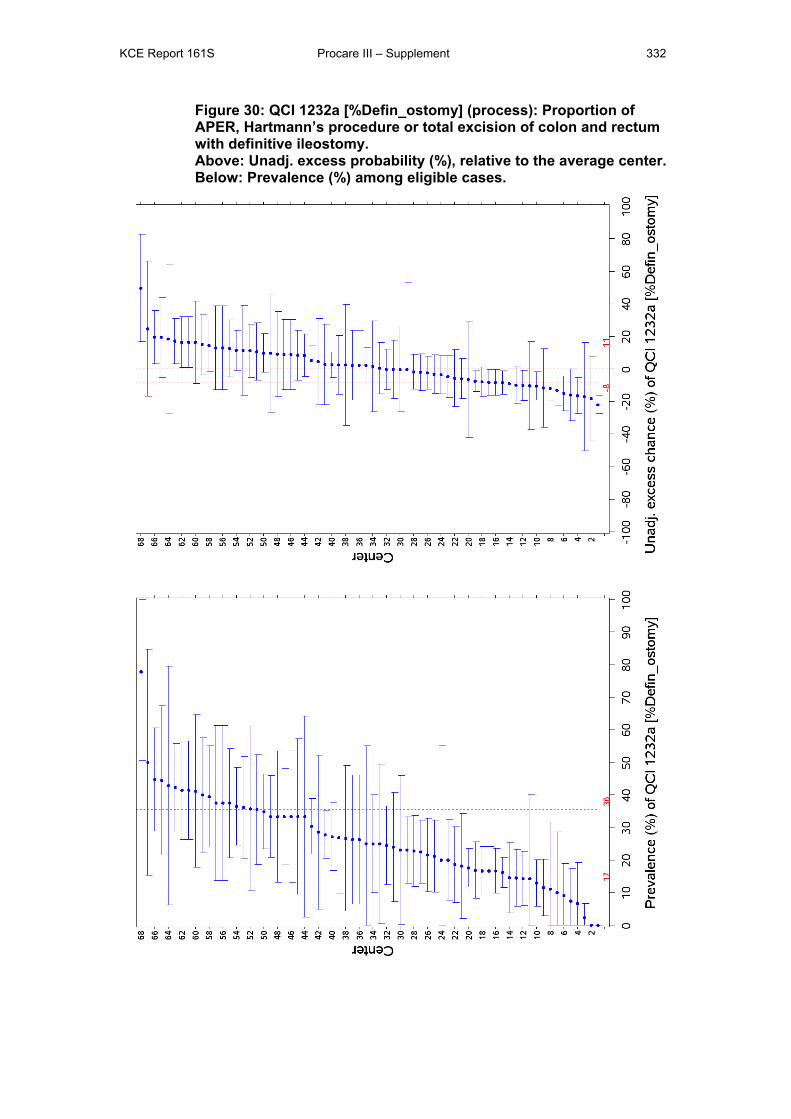
KCE Report 161S Procare III – Supplement 332
Figure 30: QCI 1232a [%Defin_ostomy] (process): Proportion of APER, Hartmann’s procedure or total excision of colon and rectum with definitive ileostomy. Above: Unadj. excess probability (%), relative to the average center. Below: Prevalence (%) among eligible cases.
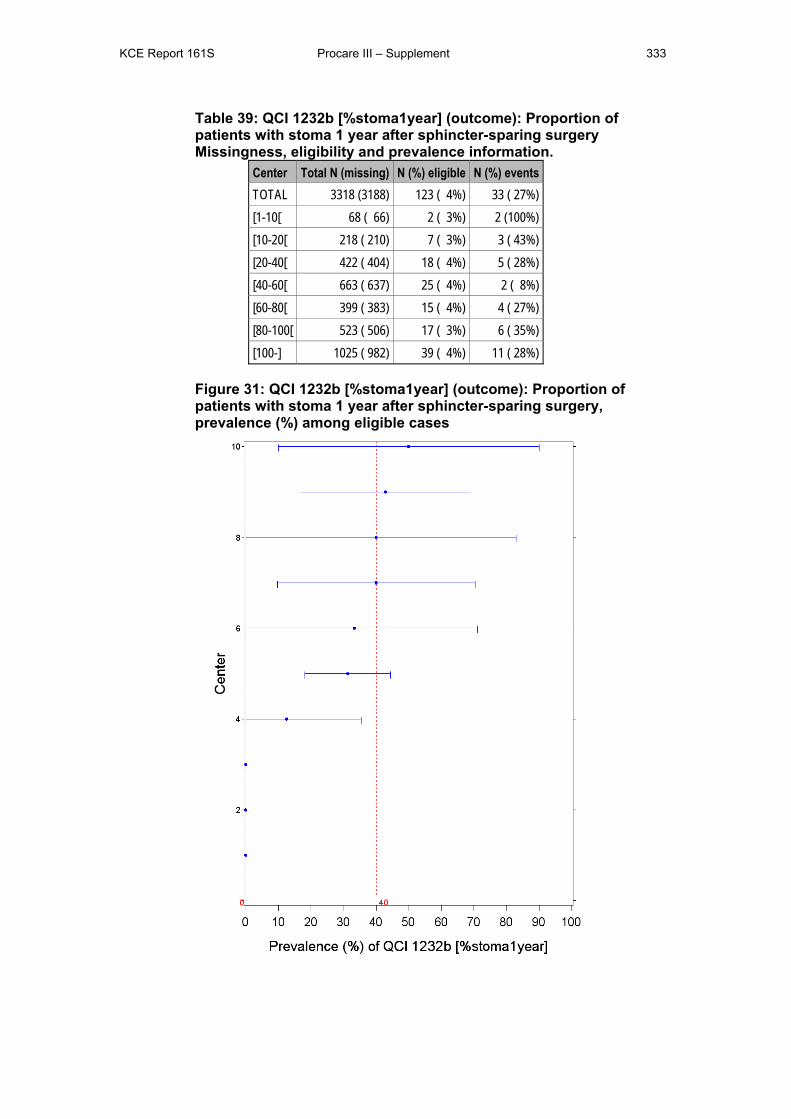
KCE Report 161S Procare III – Supplement 333
Table 39: QCI 1232b [%stoma1year] (outcome): Proportion of patients with stoma 1 year after sphincter-sparing surgery Missingness, eligibility and prevalence information.
Center Total N (missing) N (%) eligible N (%) events TOTAL 3318 (3188) 123 ( 4%) 33 ( 27%) [1-10[ 68 ( 66) 2 ( 3%) 2 (100%) [10-20[ 218 ( 210) 7 ( 3%) 3 ( 43%) [20-40[ 422 ( 404) 18 ( 4%) 5 ( 28%) [40-60[ 663 ( 637) 25 ( 4%) 2 ( 8%) [60-80[ 399 ( 383) 15 ( 4%) 4 ( 27%) [80-100[ 523 ( 506) 17 ( 3%) 6 ( 35%) [100-] 1025 ( 982) 39 ( 4%) 11 ( 28%)
Figure 31: QCI 1232b [%stoma1year] (outcome): Proportion of patients with stoma 1 year after sphincter-sparing surgery, prevalence (%) among eligible cases
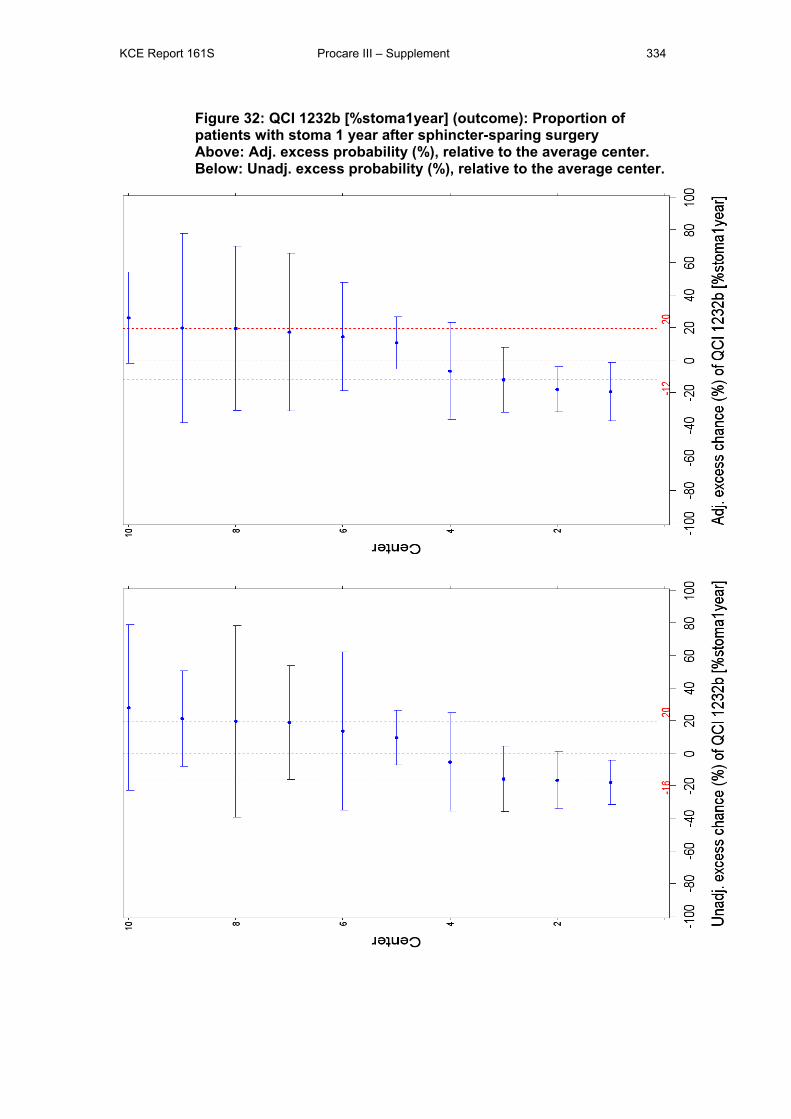
KCE Report 161S Procare III – Supplement 334
Figure 32: QCI 1232b [%stoma1year] (outcome): Proportion of patients with stoma 1 year after sphincter-sparing surgery Above: Adj. excess probability (%), relative to the average center. Below: Unadj. excess probability (%), relative to the average center.
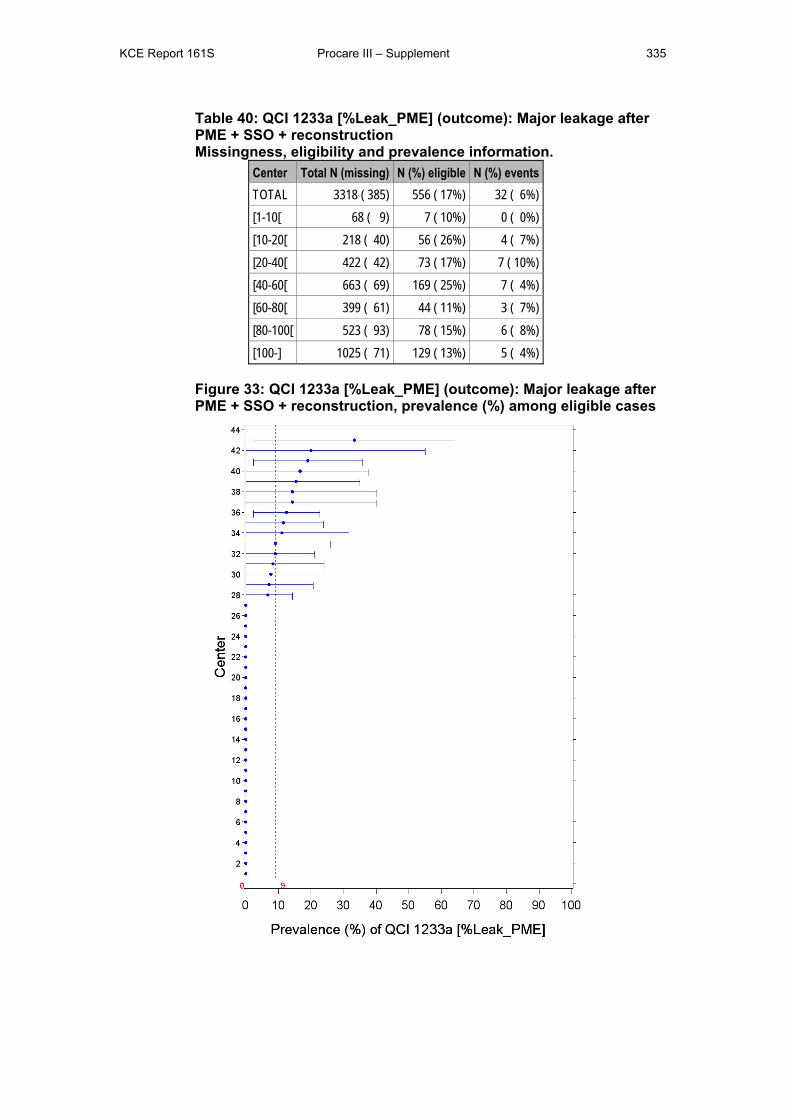
KCE Report 161S Procare III – Supplement 335
Table 40: QCI 1233a [%Leak_PME] (outcome): Major leakage after PME + SSO + reconstruction Missingness, eligibility and prevalence information.
Center Total N (missing) N (%) eligible N (%) events TOTAL 3318 ( 385) 556 ( 17%) 32 ( 6%) [1-10[ 68 ( 9) 7 ( 10%) 0 ( 0%) [10-20[ 218 ( 40) 56 ( 26%) 4 ( 7%) [20-40[ 422 ( 42) 73 ( 17%) 7 ( 10%) [40-60[ 663 ( 69) 169 ( 25%) 7 ( 4%) [60-80[ 399 ( 61) 44 ( 11%) 3 ( 7%) [80-100[ 523 ( 93) 78 ( 15%) 6 ( 8%) [100-] 1025 ( 71) 129 ( 13%) 5 ( 4%)
Figure 33: QCI 1233a [%Leak_PME] (outcome): Major leakage after PME + SSO + reconstruction, prevalence (%) among eligible cases
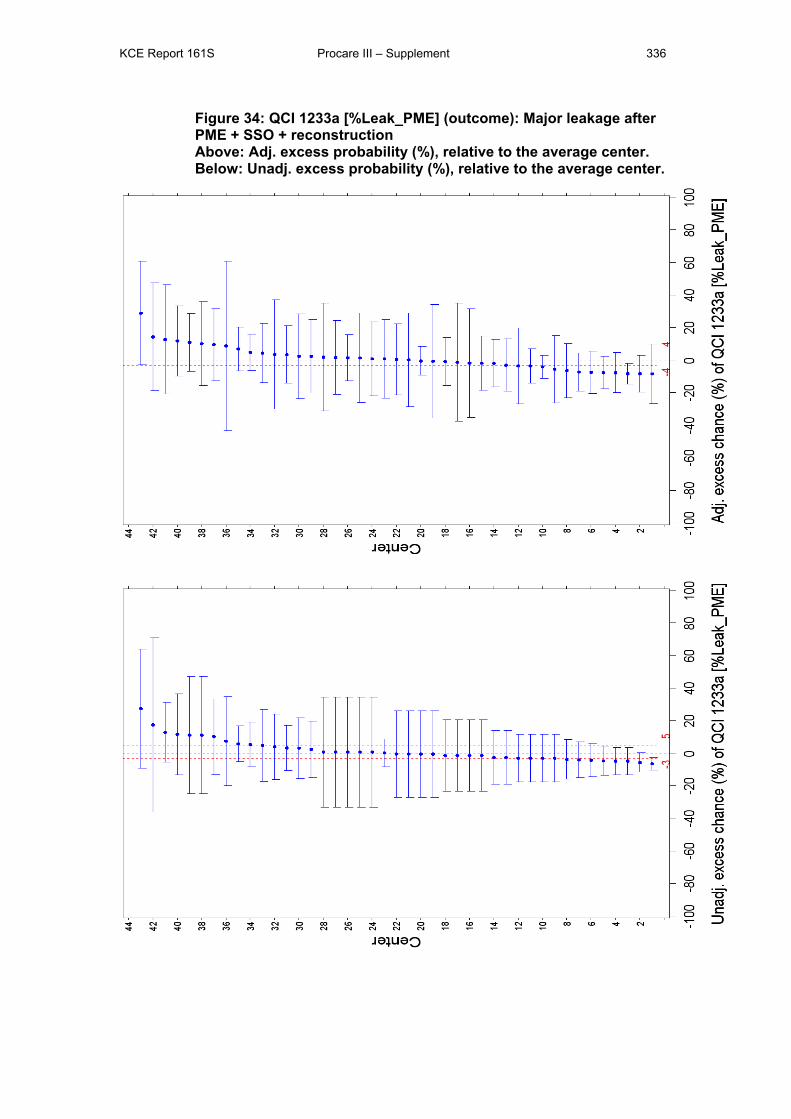
KCE Report 161S Procare III – Supplement 336
Figure 34: QCI 1233a [%Leak_PME] (outcome): Major leakage after PME + SSO + reconstruction Above: Adj. excess probability (%), relative to the average center. Below: Unadj. excess probability (%), relative to the average center.
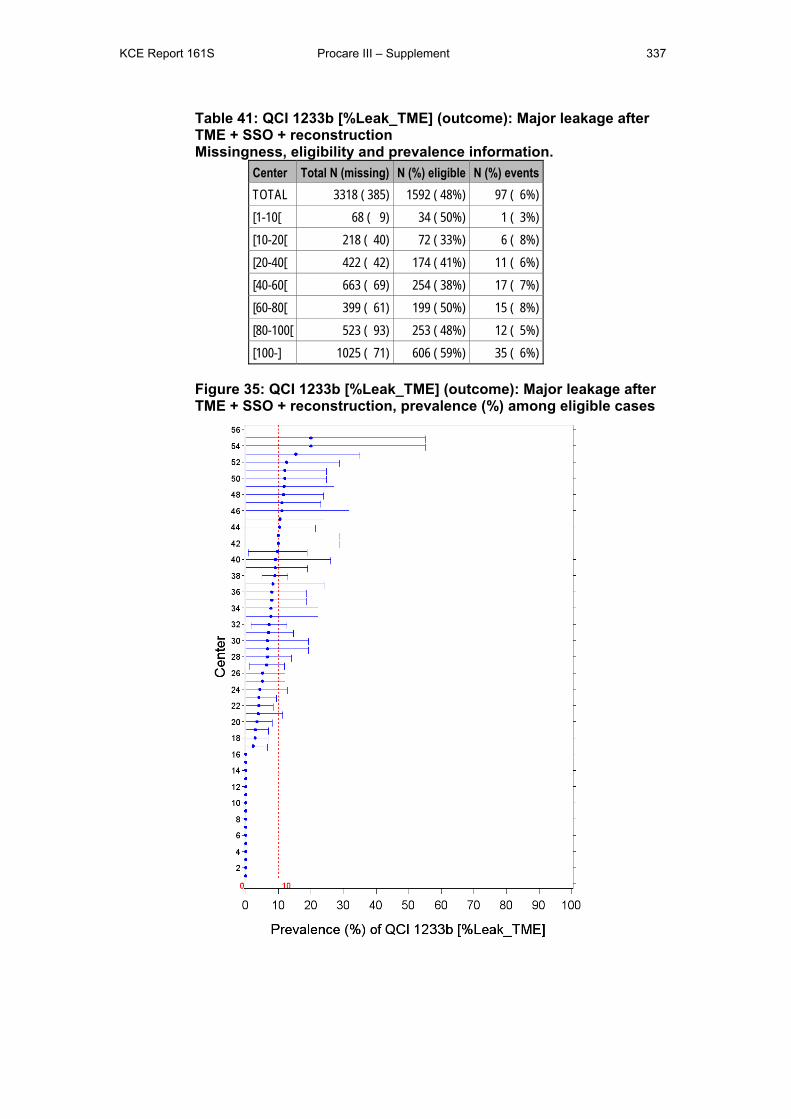
KCE Report 161S Procare III – Supplement 337
Table 41: QCI 1233b [%Leak_TME] (outcome): Major leakage after TME + SSO + reconstruction Missingness, eligibility and prevalence information.
Center Total N (missing) N (%) eligible N (%) events TOTAL 3318 ( 385) 1592 ( 48%) 97 ( 6%) [1-10[ 68 ( 9) 34 ( 50%) 1 ( 3%) [10-20[ 218 ( 40) 72 ( 33%) 6 ( 8%) [20-40[ 422 ( 42) 174 ( 41%) 11 ( 6%) [40-60[ 663 ( 69) 254 ( 38%) 17 ( 7%) [60-80[ 399 ( 61) 199 ( 50%) 15 ( 8%) [80-100[ 523 ( 93) 253 ( 48%) 12 ( 5%) [100-] 1025 ( 71) 606 ( 59%) 35 ( 6%)
Figure 35: QCI 1233b [%Leak_TME] (outcome): Major leakage after TME + SSO + reconstruction, prevalence (%) among eligible cases
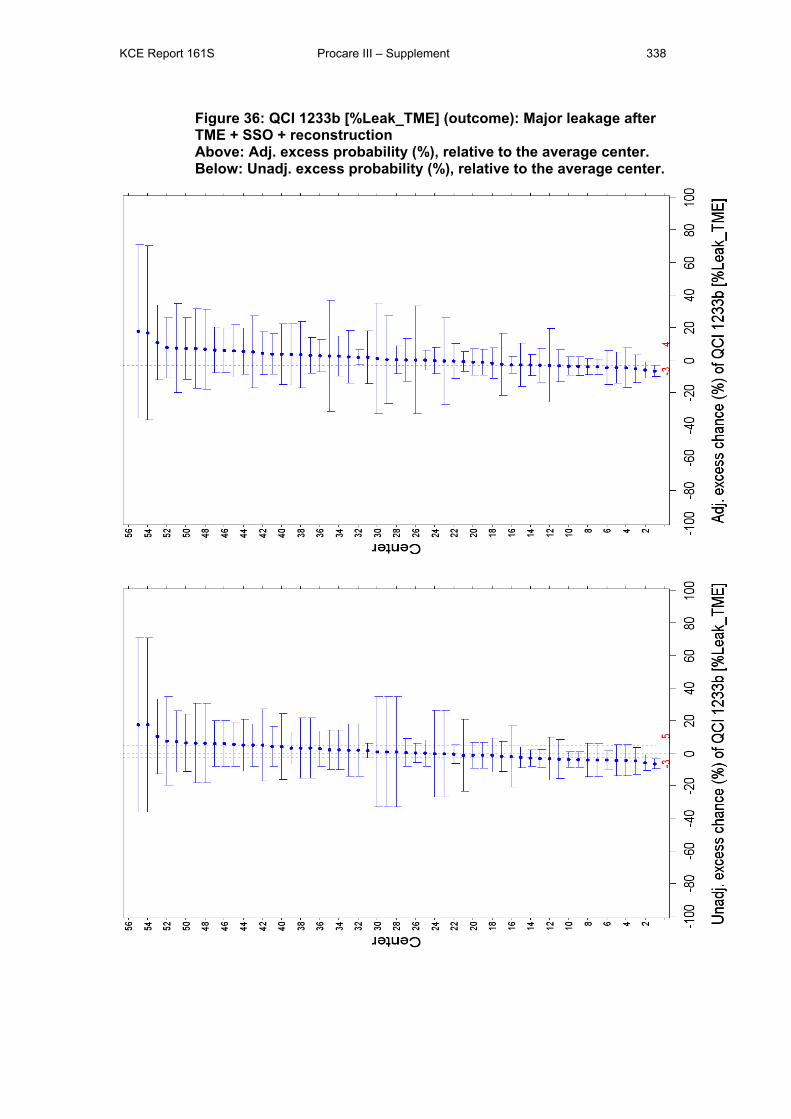
KCE Report 161S Procare III – Supplement 338
Figure 36: QCI 1233b [%Leak_TME] (outcome): Major leakage after TME + SSO + reconstruction Above: Adj. excess probability (%), relative to the average center. Below: Unadj. excess probability (%), relative to the average center.
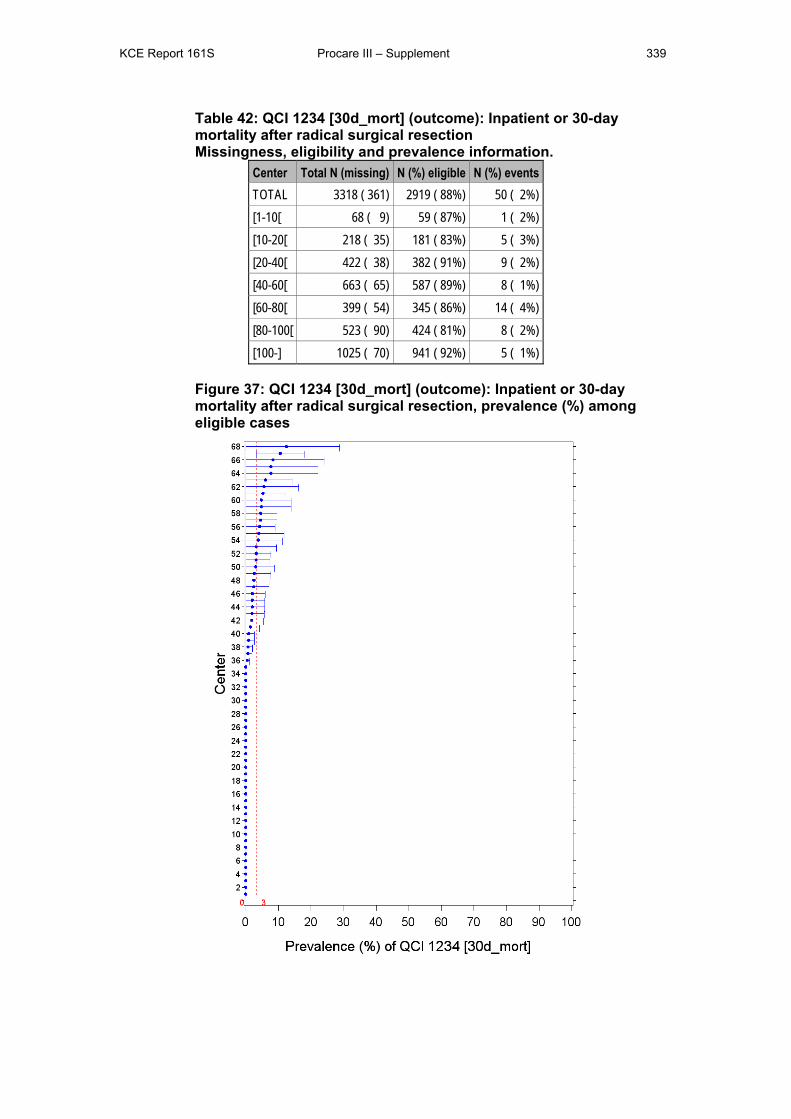
KCE Report 161S Procare III – Supplement 339
Table 42: QCI 1234 [30d_mort] (outcome): Inpatient or 30-day mortality after radical surgical resection Missingness, eligibility and prevalence information.
Center Total N (missing) N (%) eligible N (%) events TOTAL 3318 ( 361) 2919 ( 88%) 50 ( 2%) [1-10[ 68 ( 9) 59 ( 87%) 1 ( 2%) [10-20[ 218 ( 35) 181 ( 83%) 5 ( 3%) [20-40[ 422 ( 38) 382 ( 91%) 9 ( 2%) [40-60[ 663 ( 65) 587 ( 89%) 8 ( 1%) [60-80[ 399 ( 54) 345 ( 86%) 14 ( 4%) [80-100[ 523 ( 90) 424 ( 81%) 8 ( 2%) [100-] 1025 ( 70) 941 ( 92%) 5 ( 1%)
Figure 37: QCI 1234 [30d_mort] (outcome): Inpatient or 30-day mortality after radical surgical resection, prevalence (%) among eligible cases
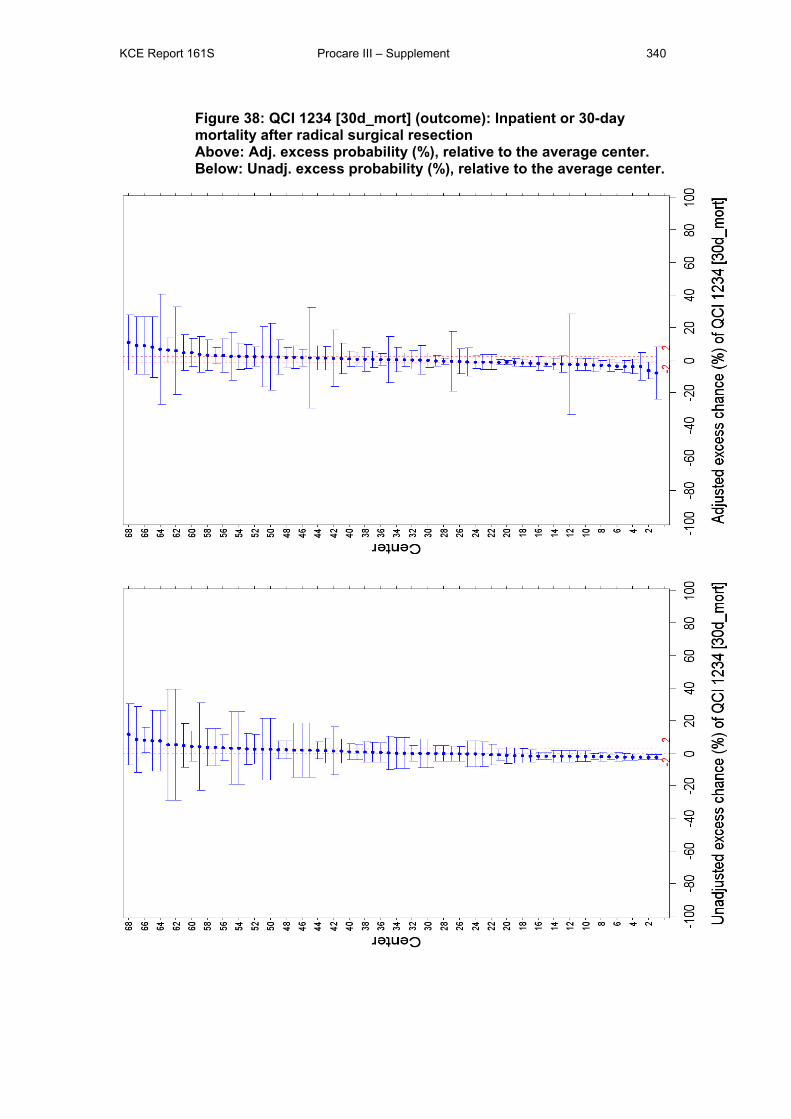
KCE Report 161S Procare III – Supplement 340
Figure 38: QCI 1234 [30d_mort] (outcome): Inpatient or 30-day mortality after radical surgical resection Above: Adj. excess probability (%), relative to the average center. Below: Unadj. excess probability (%), relative to the average center.
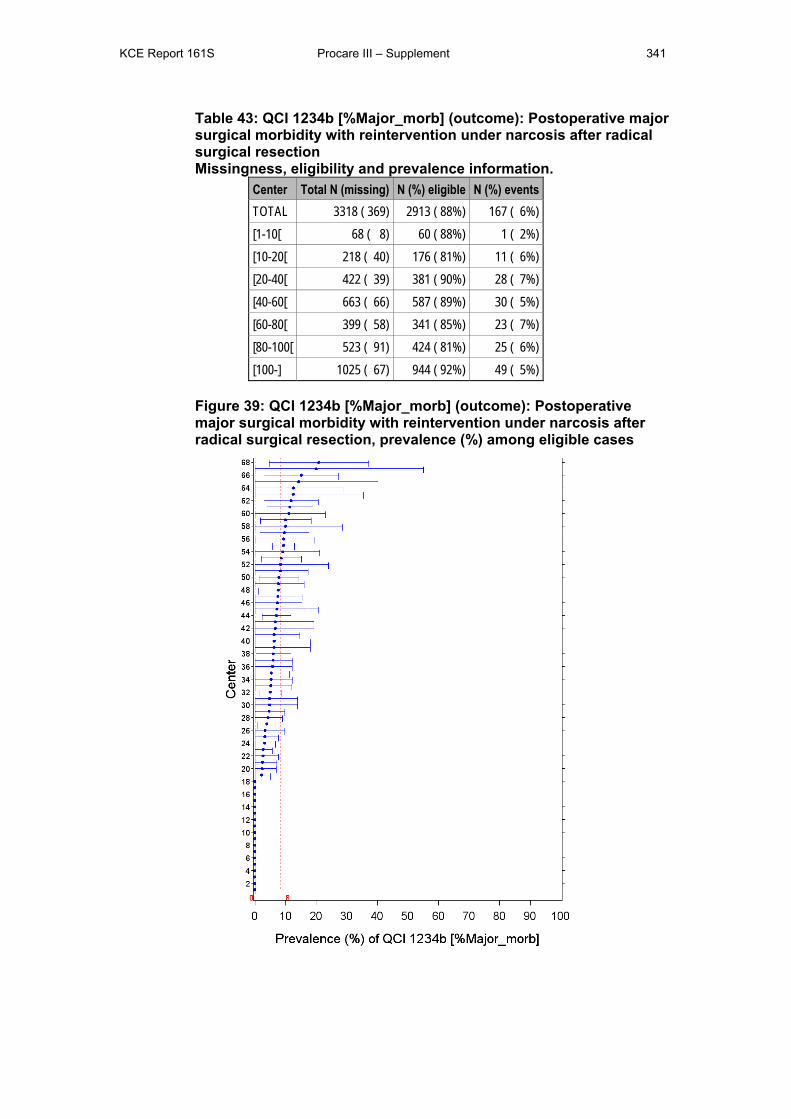
KCE Report 161S Procare III – Supplement 341
Table 43: QCI 1234b [%Major_morb] (outcome): Postoperative major surgical morbidity with reintervention under narcosis after radical surgical resection Missingness, eligibility and prevalence information.
Center Total N (missing) N (%) eligible N (%) events TOTAL 3318 ( 369) 2913 ( 88%) 167 ( 6%) [1-10[ 68 ( 8) 60 ( 88%) 1 ( 2%) [10-20[ 218 ( 40) 176 ( 81%) 11 ( 6%) [20-40[ 422 ( 39) 381 ( 90%) 28 ( 7%) [40-60[ 663 ( 66) 587 ( 89%) 30 ( 5%) [60-80[ 399 ( 58) 341 ( 85%) 23 ( 7%) [80-100[ 523 ( 91) 424 ( 81%) 25 ( 6%) [100-] 1025 ( 67) 944 ( 92%) 49 ( 5%)
Figure 39: QCI 1234b [%Major_morb] (outcome): Postoperative major surgical morbidity with reintervention under narcosis after radical surgical resection, prevalence (%) among eligible cases
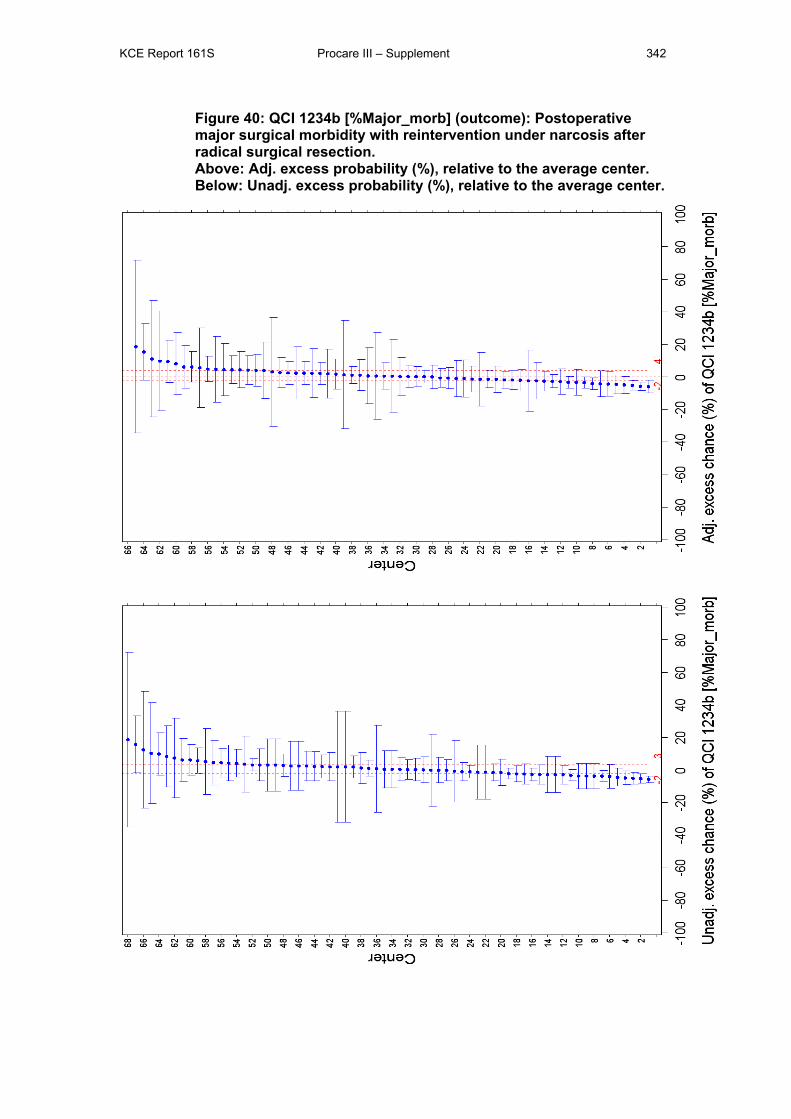
KCE Report 161S Procare III – Supplement 342
Figure 40: QCI 1234b [%Major_morb] (outcome): Postoperative major surgical morbidity with reintervention under narcosis after radical surgical resection. Above: Adj. excess probability (%), relative to the average center. Below: Unadj. excess probability (%), relative to the average center.
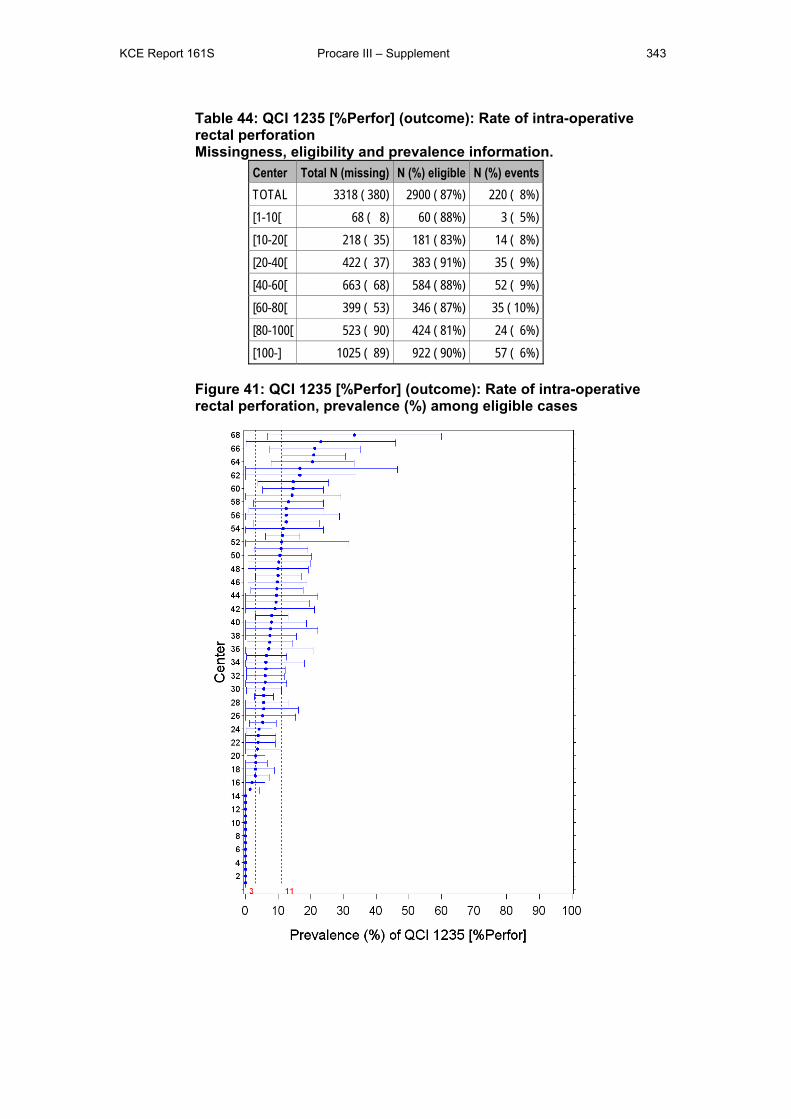
KCE Report 161S Procare III – Supplement 343
Table 44: QCI 1235 [%Perfor] (outcome): Rate of intra-operative rectal perforation Missingness, eligibility and prevalence information.
Center Total N (missing) N (%) eligible N (%) events TOTAL 3318 ( 380) 2900 ( 87%) 220 ( 8%) [1-10[ 68 ( 8) 60 ( 88%) 3 ( 5%) [10-20[ 218 ( 35) 181 ( 83%) 14 ( 8%) [20-40[ 422 ( 37) 383 ( 91%) 35 ( 9%) [40-60[ 663 ( 68) 584 ( 88%) 52 ( 9%) [60-80[ 399 ( 53) 346 ( 87%) 35 ( 10%) [80-100[ 523 ( 90) 424 ( 81%) 24 ( 6%) [100-] 1025 ( 89) 922 ( 90%) 57 ( 6%)
Figure 41: QCI 1235 [%Perfor] (outcome): Rate of intra-operative rectal perforation, prevalence (%) among eligible cases
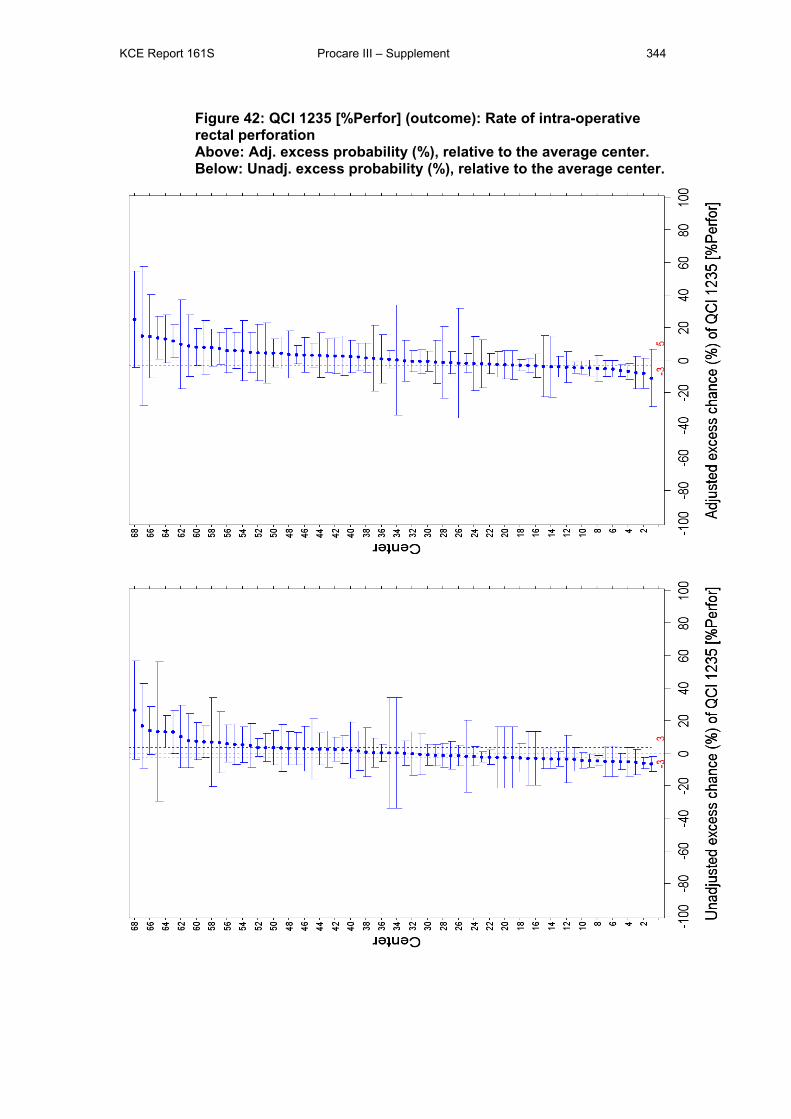
KCE Report 161S Procare III – Supplement 344
Figure 42: QCI 1235 [%Perfor] (outcome): Rate of intra-operative rectal perforation Above: Adj. excess probability (%), relative to the average center. Below: Unadj. excess probability (%), relative to the average center.
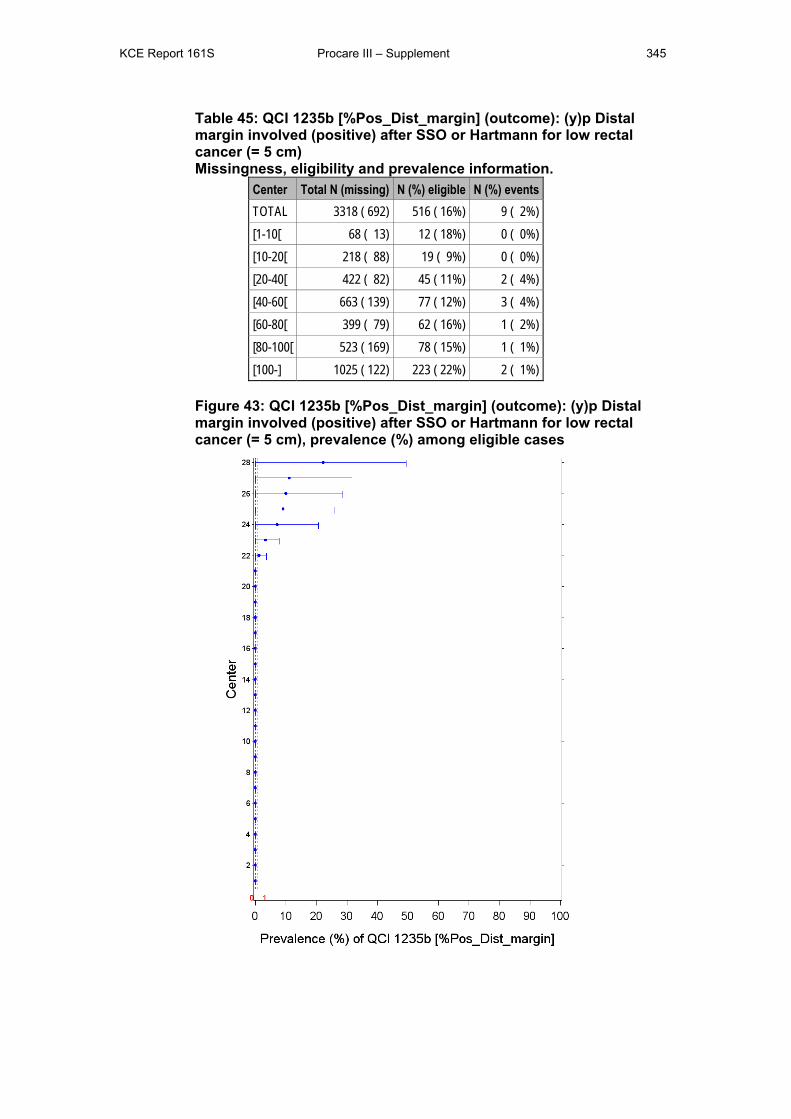
KCE Report 161S Procare III – Supplement 345
Table 45: QCI 1235b [%Pos_Dist_margin] (outcome): (y)p Distal margin involved (positive) after SSO or Hartmann for low rectal cancer (= 5 cm) Missingness, eligibility and prevalence information.
Center Total N (missing) N (%) eligible N (%) events TOTAL 3318 ( 692) 516 ( 16%) 9 ( 2%) [1-10[ 68 ( 13) 12 ( 18%) 0 ( 0%) [10-20[ 218 ( 88) 19 ( 9%) 0 ( 0%) [20-40[ 422 ( 82) 45 ( 11%) 2 ( 4%) [40-60[ 663 ( 139) 77 ( 12%) 3 ( 4%) [60-80[ 399 ( 79) 62 ( 16%) 1 ( 2%) [80-100[ 523 ( 169) 78 ( 15%) 1 ( 1%) [100-] 1025 ( 122) 223 ( 22%) 2 ( 1%)
Figure 43: QCI 1235b [%Pos_Dist_margin] (outcome): (y)p Distal margin involved (positive) after SSO or Hartmann for low rectal cancer (= 5 cm), prevalence (%) among eligible cases
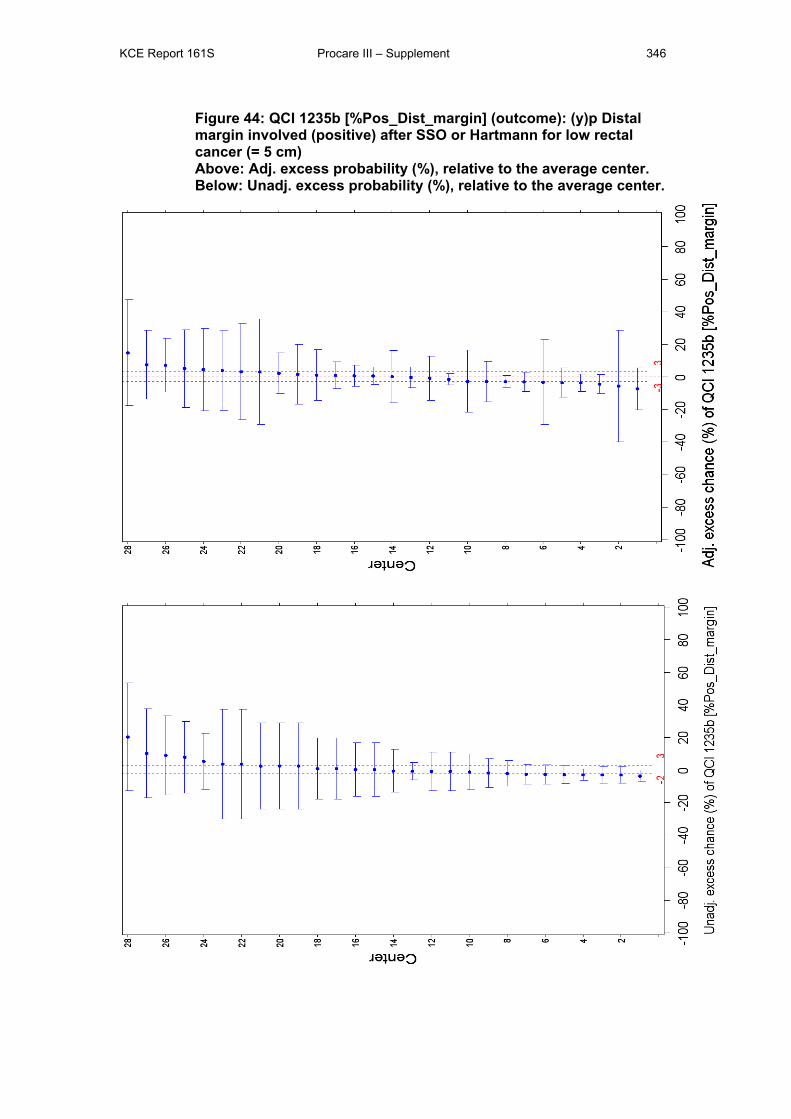
KCE Report 161S Procare III – Supplement 346
Figure 44: QCI 1235b [%Pos_Dist_margin] (outcome): (y)p Distal margin involved (positive) after SSO or Hartmann for low rectal cancer (= 5 cm) Above: Adj. excess probability (%), relative to the average center. Below: Unadj. excess probability (%), relative to the average center.
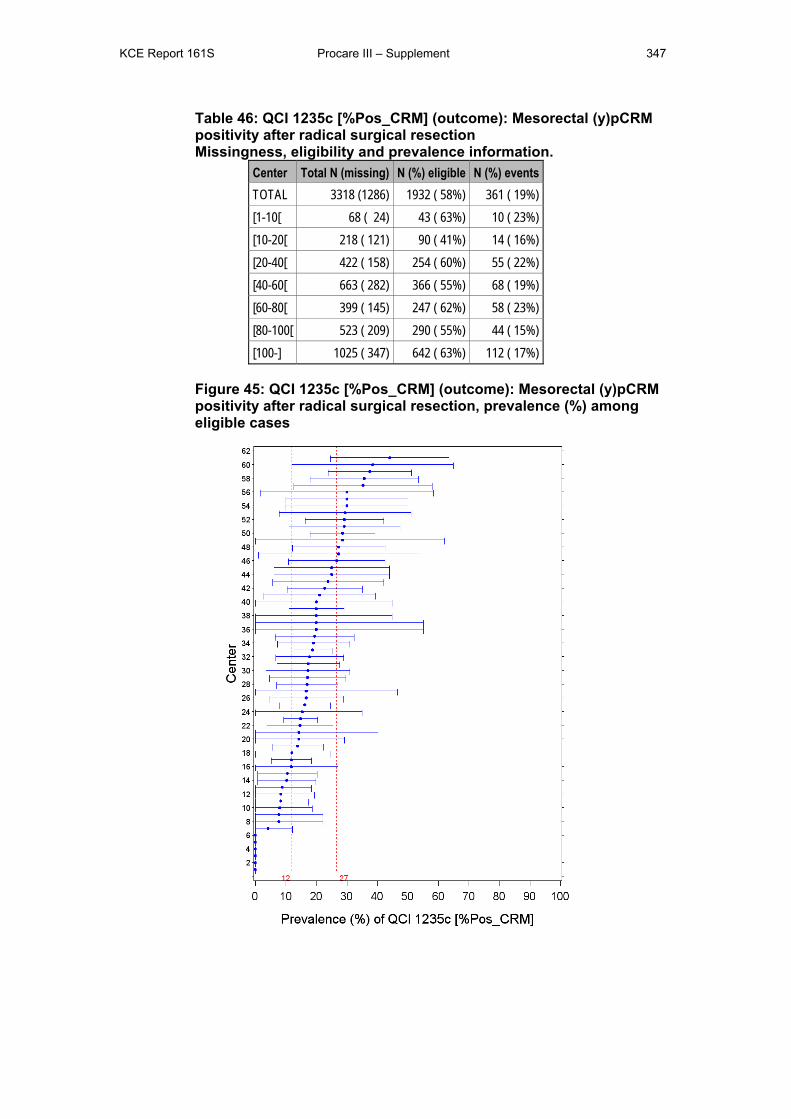
KCE Report 161S Procare III – Supplement 347
Table 46: QCI 1235c [%Pos_CRM] (outcome): Mesorectal (y)pCRM positivity after radical surgical resection Missingness, eligibility and prevalence information.
Center Total N (missing) N (%) eligible N (%) events TOTAL 3318 (1286) 1932 ( 58%) 361 ( 19%) [1-10[ 68 ( 24) 43 ( 63%) 10 ( 23%) [10-20[ 218 ( 121) 90 ( 41%) 14 ( 16%) [20-40[ 422 ( 158) 254 ( 60%) 55 ( 22%) [40-60[ 663 ( 282) 366 ( 55%) 68 ( 19%) [60-80[ 399 ( 145) 247 ( 62%) 58 ( 23%) [80-100[ 523 ( 209) 290 ( 55%) 44 ( 15%) [100-] 1025 ( 347) 642 ( 63%) 112 ( 17%)
Figure 45: QCI 1235c [%Pos_CRM] (outcome): Mesorectal (y)pCRM positivity after radical surgical resection, prevalence (%) among eligible cases
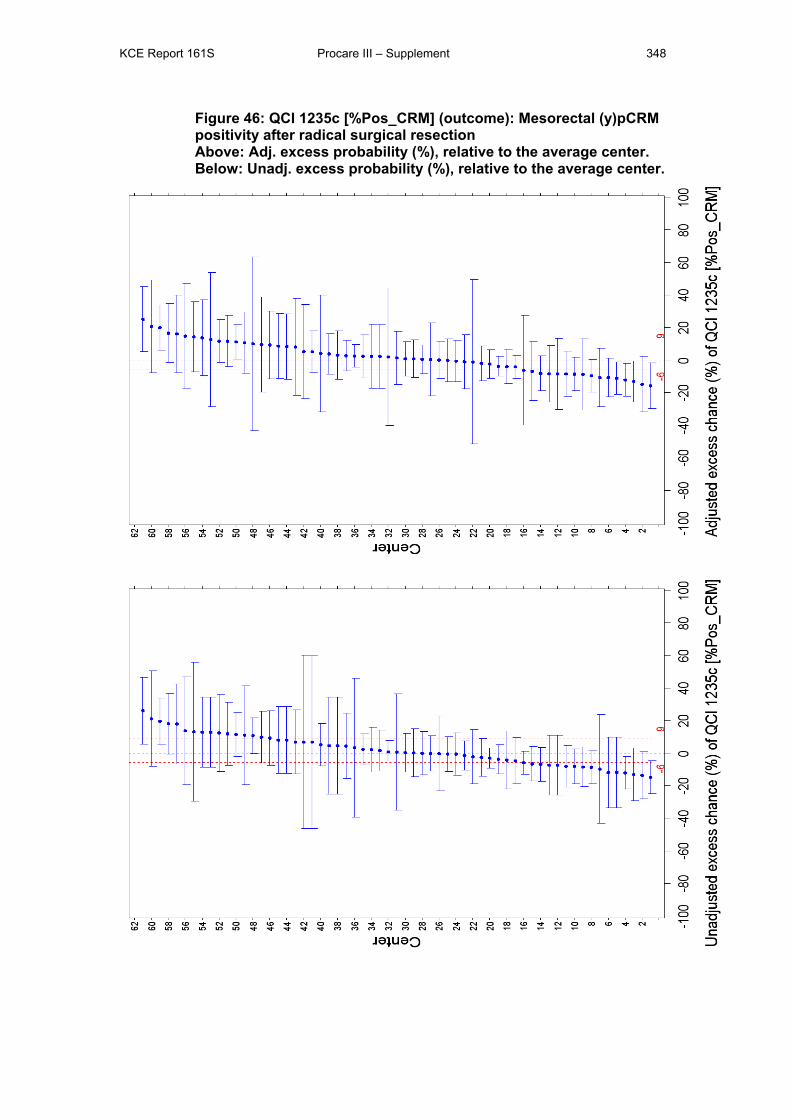
KCE Report 161S Procare III – Supplement 348
Figure 46: QCI 1235c [%Pos_CRM] (outcome): Mesorectal (y)pCRM positivity after radical surgical resection Above: Adj. excess probability (%), relative to the average center. Below: Unadj. excess probability (%), relative to the average center.
KCE Report 161S Procare III – Supplement 349
1.6 QUALITY INDICATORS RELATED TO ADJUVANT TREATMENT
Table 47: QCI 1241 [%Adj-Chemo<3m] (process): Proportion of (y)pStage III patients with R0 resection that received adjuvant chemotherapy within 3 months after surgery. Missingness, eligibility and prevalence information.
Center Total N (missing) N (%) eligible N (%) events TOTAL 3318 (2660) 28 ( 1%) 24 ( 86%) [1-10[ 68 ( 55) 0 ( 0%) [10-20[ 218 ( 179) 2 ( 1%) 2 (100%) [20-40[ 422 ( 338) 10 ( 2%) 9 ( 90%) [40-60[ 663 ( 535) 4 ( 1%) 3 ( 75%) [60-80[ 399 ( 318) 0 ( 0%) [80-100[ 523 ( 422) 6 ( 1%) 4 ( 67%) [100-] 1025 ( 813) 6 ( 1%) 6 (100%)
Table 48: QCI 1242 [%Adj_RT<3m] (process): Proportion of pStage II-III patients with R0 resection that received adjuvant radiotherapy or chemoradiotherapy within 3 months after surgery. Missingness, eligibility and prevalence information.
Center Total N (missing) N (%) eligible N (%) events TOTAL 3318 (3242) 46 ( 1%) 45 ( 98%) [1-10[ 68 ( 67) 1 ( 1%) 1 (100%) [10-20[ 218 ( 214) 2 ( 1%) 2 (100%) [20-40[ 422 ( 416) 4 ( 1%) 4 (100%) [40-60[ 663 ( 647) 9 ( 1%) 9 (100%) [60-80[ 399 ( 390) 3 ( 1%) 3 (100%) [80-100[ 523 ( 508) 11 ( 2%) 11 (100%) [100-] 1025 (1000) 16 ( 2%) 15 ( 94%)
Table 49: QCI 1243 [%Adj_Chemo<12w] (process): Proportion of (y)pStage II-III patients with R0 resection that started adjuvant chemotherapy for (y)pStage II or III within 12 weeks after surgery. Missingness, eligibility and prevalence information.
Center Total N (missing) N (%) eligible N (%) events TOTAL 3318 ( 126) 58 ( 2%) 54 ( 93%) [1-10[ 68 ( 5) 0 ( 0%) [10-20[ 218 ( 7) 2 ( 1%) 2 (100%) [20-40[ 422 ( 18) 12 ( 3%) 11 ( 92%) [40-60[ 663 ( 24) 16 ( 2%) 15 ( 94%) [60-80[ 399 ( 13) 1 ( 0%) 1 (100%) [80-100[ 523 ( 20) 14 ( 3%) 12 ( 86%) [100-] 1025 ( 39) 13 ( 1%) 13 (100%)
Table 50: QCI 1244 [%Adj_5FU] (process): Proportion of (y)pStage II-III patients with R0 resection treated with adjuvant chemo(radio)therapy, that received 5-FU based chemotherapy. Missingness, eligibility and prevalence information.
Center Total N (missing) N (%) eligible N (%) events TOTAL 3318 (2568) 57 ( 2%) 54 ( 95%) [1-10[ 68 ( 45) 0 ( 0%) [10-20[ 218 ( 173) 2 ( 1%) 2 (100%) [20-40[ 422 ( 319) 11 ( 3%) 11 (100%) [40-60[ 663 ( 514) 16 ( 2%) 16 (100%) [60-80[ 399 ( 334) 1 ( 0%) 1 (100%) [80-100[ 523 ( 392) 14 ( 3%) 14 (100%) [100-] 1025 ( 791) 13 ( 1%) 10 ( 77%)
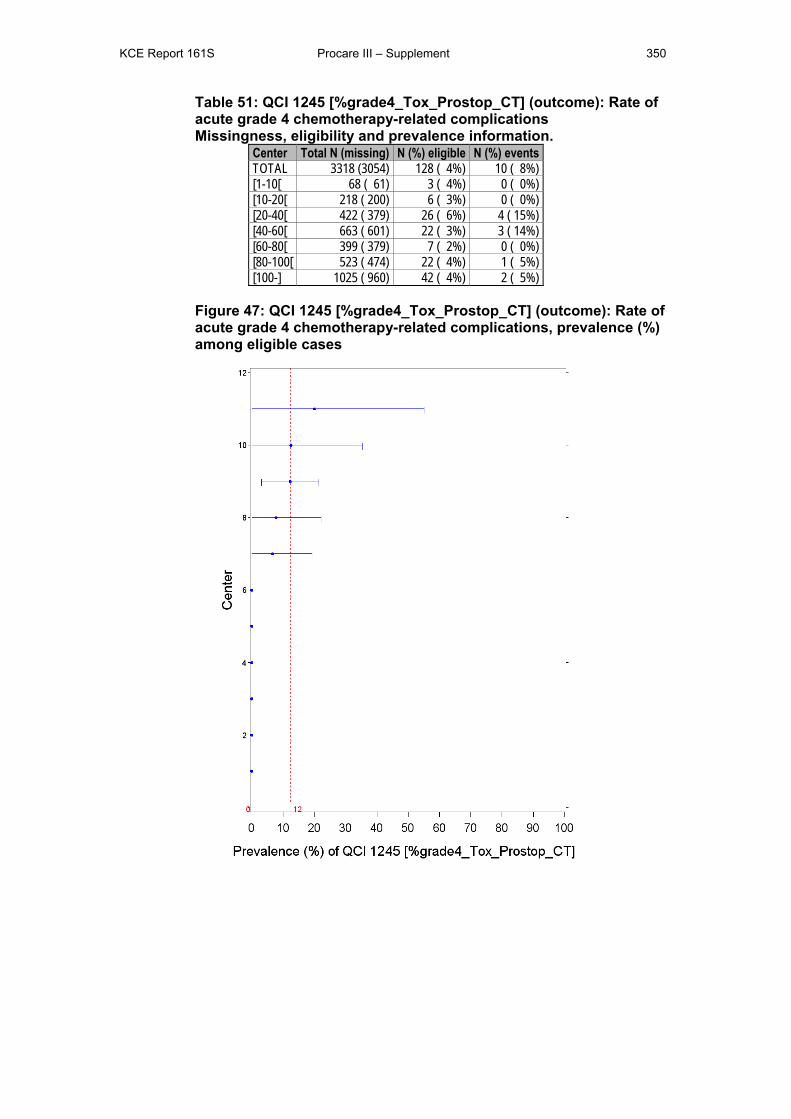
KCE Report 161S Procare III – Supplement 350
Table 51: QCI 1245 [%grade4_Tox_Prostop_CT] (outcome): Rate of acute grade 4 chemotherapy-related complications Missingness, eligibility and prevalence information.
Center Total N (missing) N (%) eligible N (%) events TOTAL 3318 (3054) 128 ( 4%) 10 ( 8%) [1-10[ 68 ( 61) 3 ( 4%) 0 ( 0%) [10-20[ 218 ( 200) 6 ( 3%) 0 ( 0%) [20-40[ 422 ( 379) 26 ( 6%) 4 ( 15%) [40-60[ 663 ( 601) 22 ( 3%) 3 ( 14%) [60-80[ 399 ( 379) 7 ( 2%) 0 ( 0%) [80-100[ 523 ( 474) 22 ( 4%) 1 ( 5%) [100-] 1025 ( 960) 42 ( 4%) 2 ( 5%)
Figure 47: QCI 1245 [%grade4_Tox_Prostop_CT] (outcome): Rate of acute grade 4 chemotherapy-related complications, prevalence (%) among eligible cases
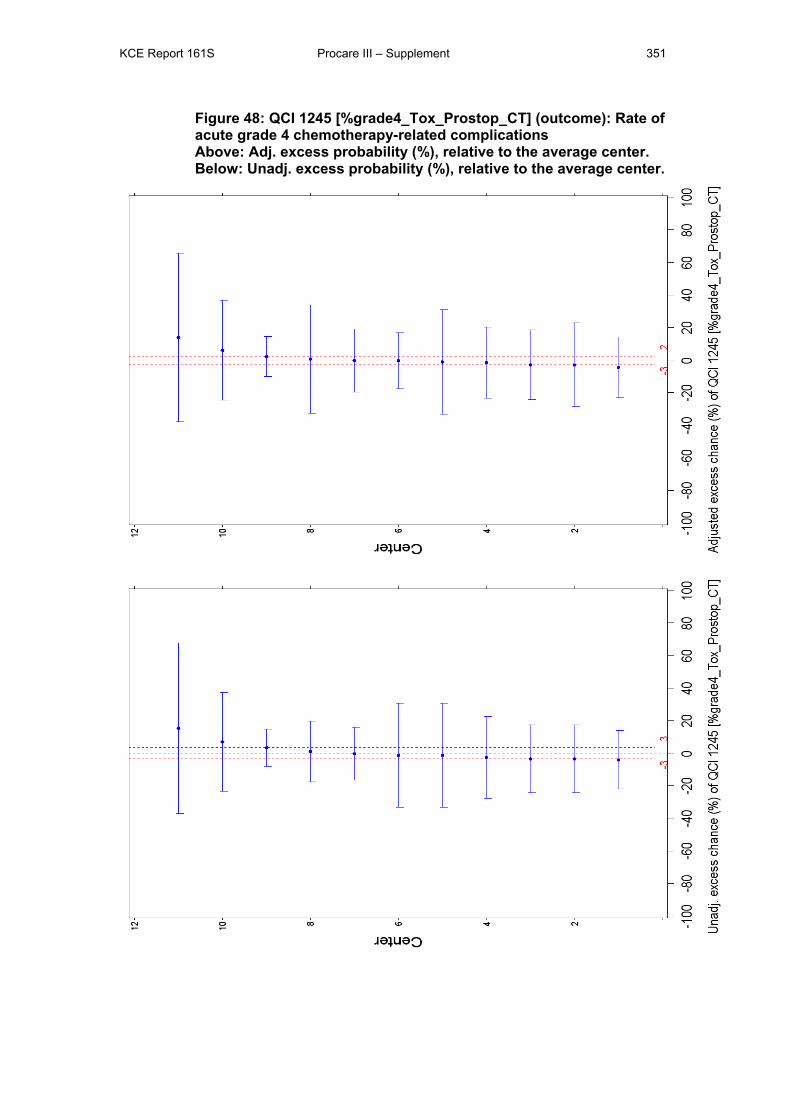
KCE Report 161S Procare III – Supplement 351
Figure 48: QCI 1245 [%grade4_Tox_Prostop_CT] (outcome): Rate of acute grade 4 chemotherapy-related complications Above: Adj. excess probability (%), relative to the average center. Below: Unadj. excess probability (%), relative to the average center.
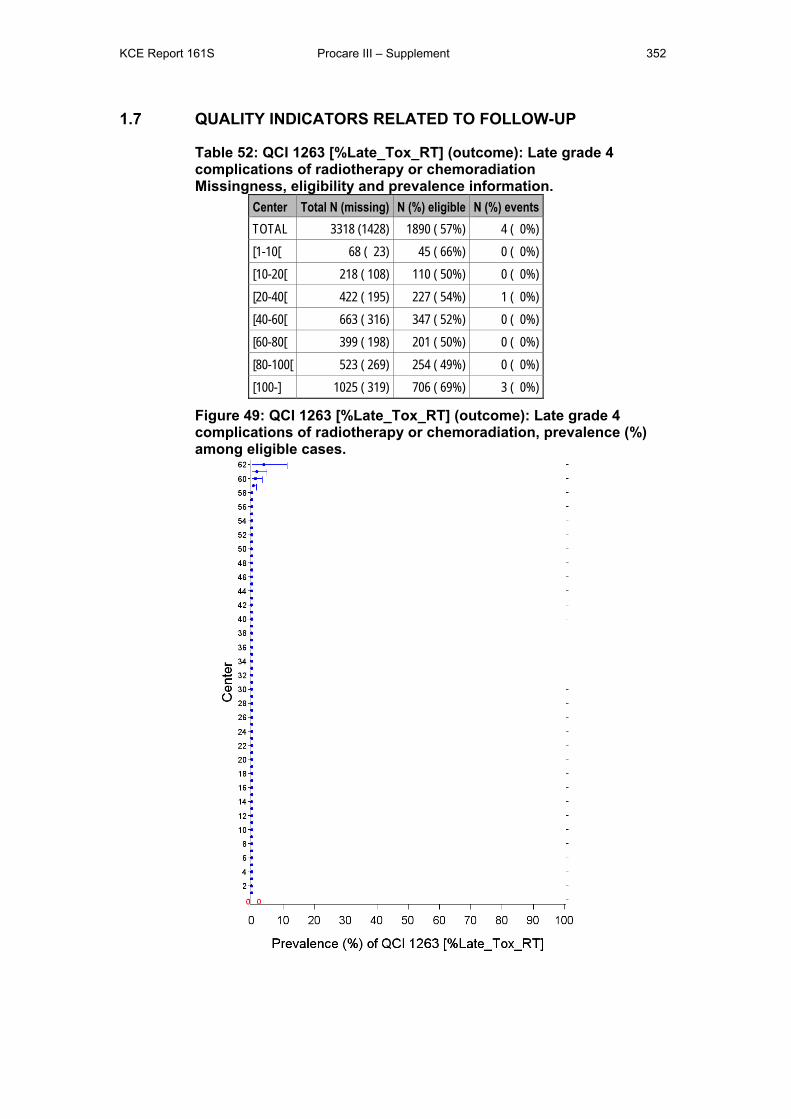
KCE Report 161S Procare III – Supplement 352
1.7 QUALITY INDICATORS RELATED TO FOLLOW-UP
Table 52: QCI 1263 [%Late_Tox_RT] (outcome): Late grade 4 complications of radiotherapy or chemoradiation Missingness, eligibility and prevalence information.
Center Total N (missing) N (%) eligible N (%) events TOTAL 3318 (1428) 1890 ( 57%) 4 ( 0%) [1-10[ 68 ( 23) 45 ( 66%) 0 ( 0%) [10-20[ 218 ( 108) 110 ( 50%) 0 ( 0%) [20-40[ 422 ( 195) 227 ( 54%) 1 ( 0%) [40-60[ 663 ( 316) 347 ( 52%) 0 ( 0%) [60-80[ 399 ( 198) 201 ( 50%) 0 ( 0%) [80-100[ 523 ( 269) 254 ( 49%) 0 ( 0%) [100-] 1025 ( 319) 706 ( 69%) 3 ( 0%)
Figure 49: QCI 1263 [%Late_Tox_RT] (outcome): Late grade 4 complications of radiotherapy or chemoradiation, prevalence (%) among eligible cases.
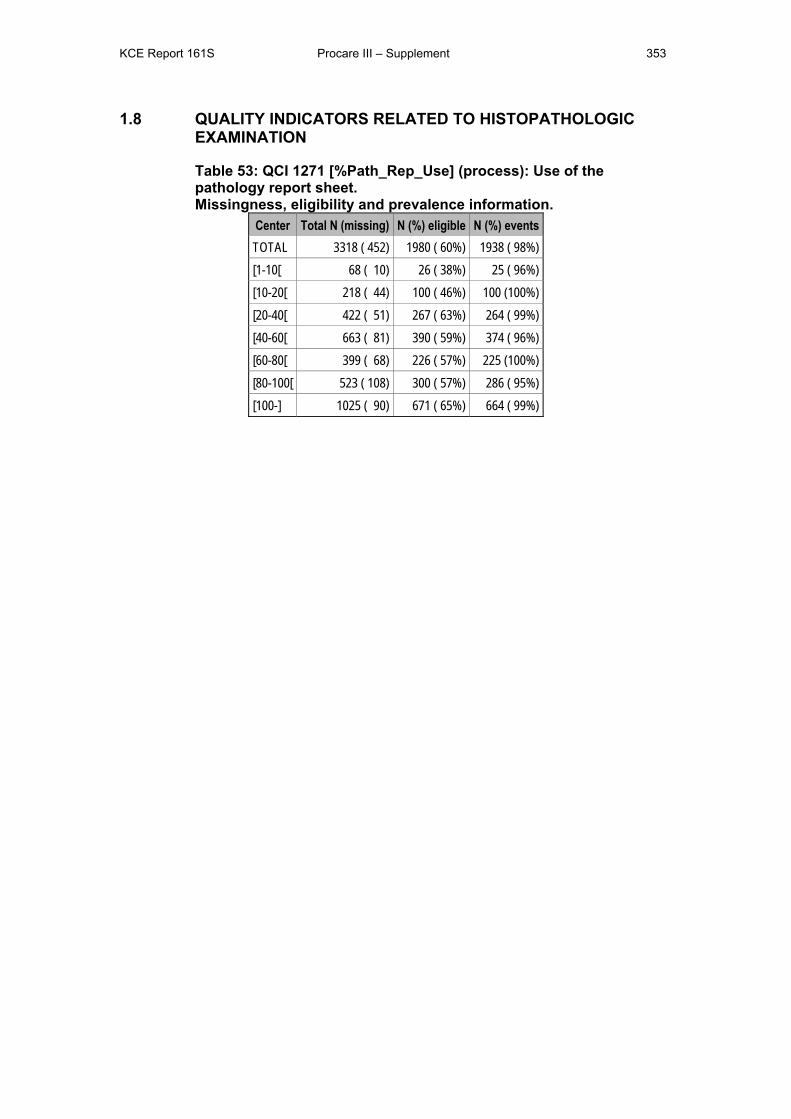
KCE Report 161S Procare III – Supplement 353
1.8 QUALITY INDICATORS RELATED TO HISTOPATHOLOGIC EXAMINATION
Table 53: QCI 1271 [%Path_Rep_Use] (process): Use of the pathology report sheet. Missingness, eligibility and prevalence information.
Center Total N (missing) N (%) eligible N (%) events TOTAL 3318 ( 452) 1980 ( 60%) 1938 ( 98%) [1-10[ 68 ( 10) 26 ( 38%) 25 ( 96%) [10-20[ 218 ( 44) 100 ( 46%) 100 (100%) [20-40[ 422 ( 51) 267 ( 63%) 264 ( 99%) [40-60[ 663 ( 81) 390 ( 59%) 374 ( 96%) [60-80[ 399 ( 68) 226 ( 57%) 225 (100%) [80-100[ 523 ( 108) 300 ( 57%) 286 ( 95%) [100-] 1025 ( 90) 671 ( 65%) 664 ( 99%)
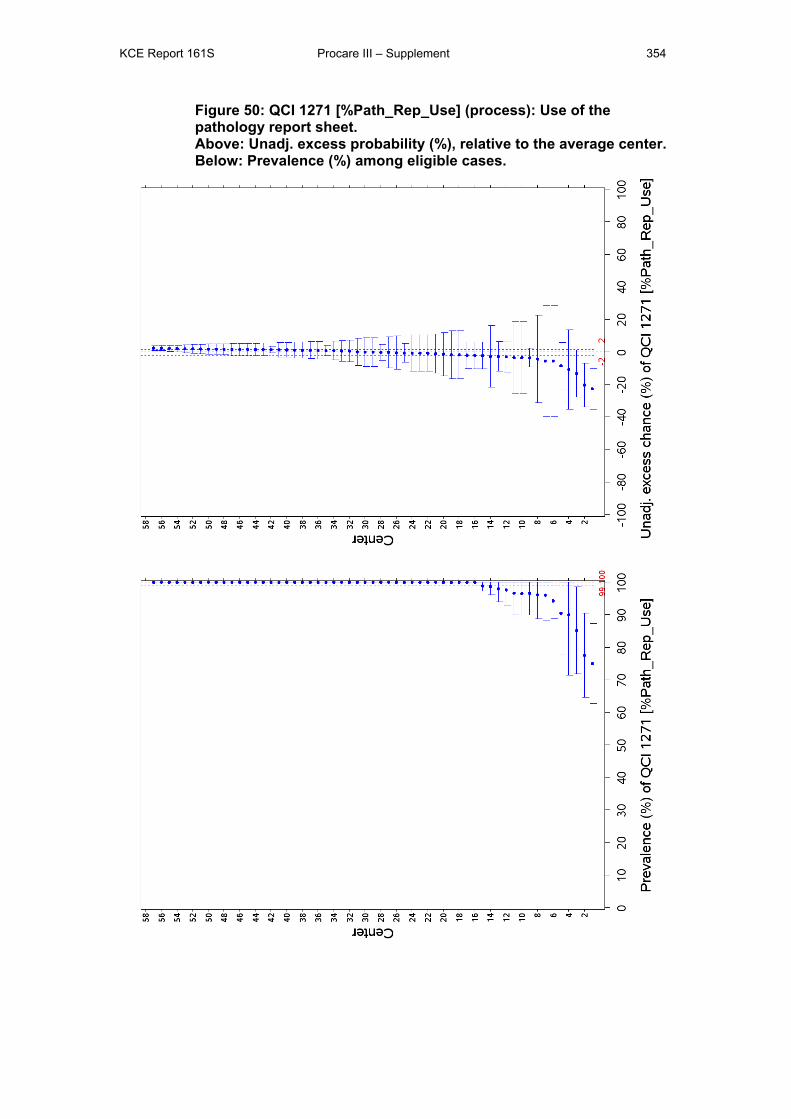
KCE Report 161S Procare III – Supplement 354
Figure 50: QCI 1271 [%Path_Rep_Use] (process): Use of the pathology report sheet. Above: Unadj. excess probability (%), relative to the average center. Below: Prevalence (%) among eligible cases.
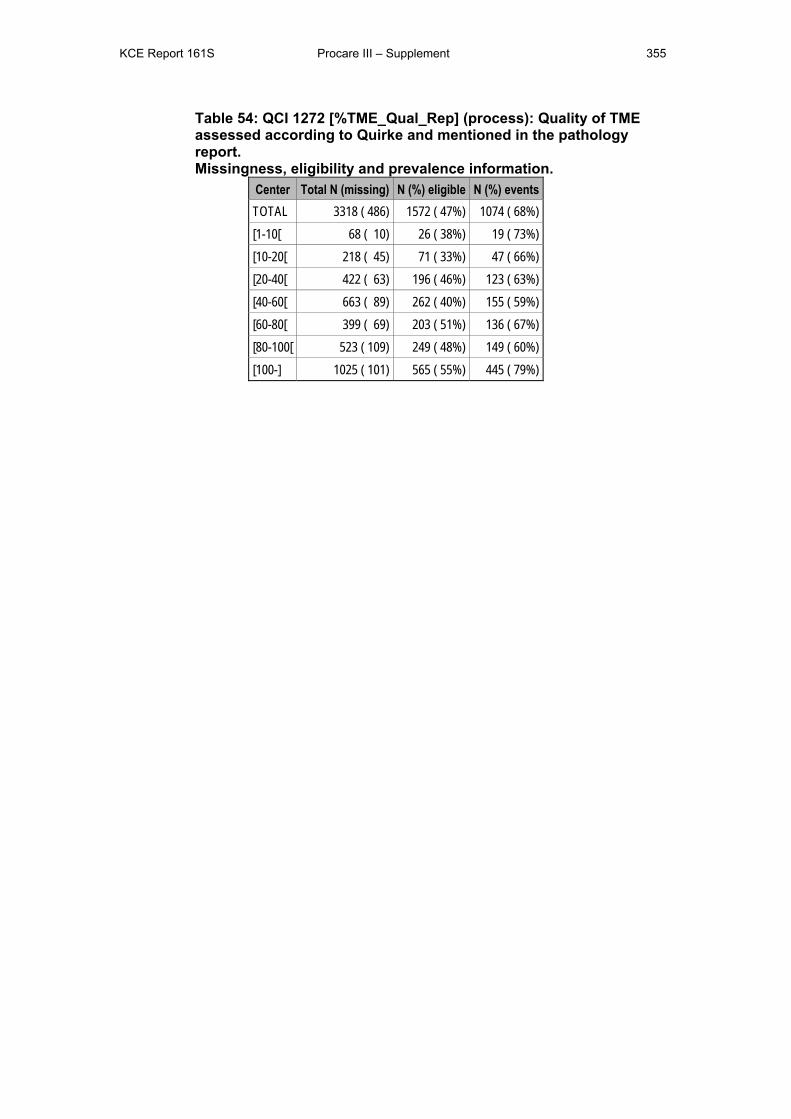
KCE Report 161S Procare III – Supplement 355
Table 54: QCI 1272 [%TME_Qual_Rep] (process): Quality of TME assessed according to Quirke and mentioned in the pathology report. Missingness, eligibility and prevalence information.
Center Total N (missing) N (%) eligible N (%) events TOTAL 3318 ( 486) 1572 ( 47%) 1074 ( 68%) [1-10[ 68 ( 10) 26 ( 38%) 19 ( 73%) [10-20[ 218 ( 45) 71 ( 33%) 47 ( 66%) [20-40[ 422 ( 63) 196 ( 46%) 123 ( 63%) [40-60[ 663 ( 89) 262 ( 40%) 155 ( 59%) [60-80[ 399 ( 69) 203 ( 51%) 136 ( 67%) [80-100[ 523 ( 109) 249 ( 48%) 149 ( 60%) [100-] 1025 ( 101) 565 ( 55%) 445 ( 79%)
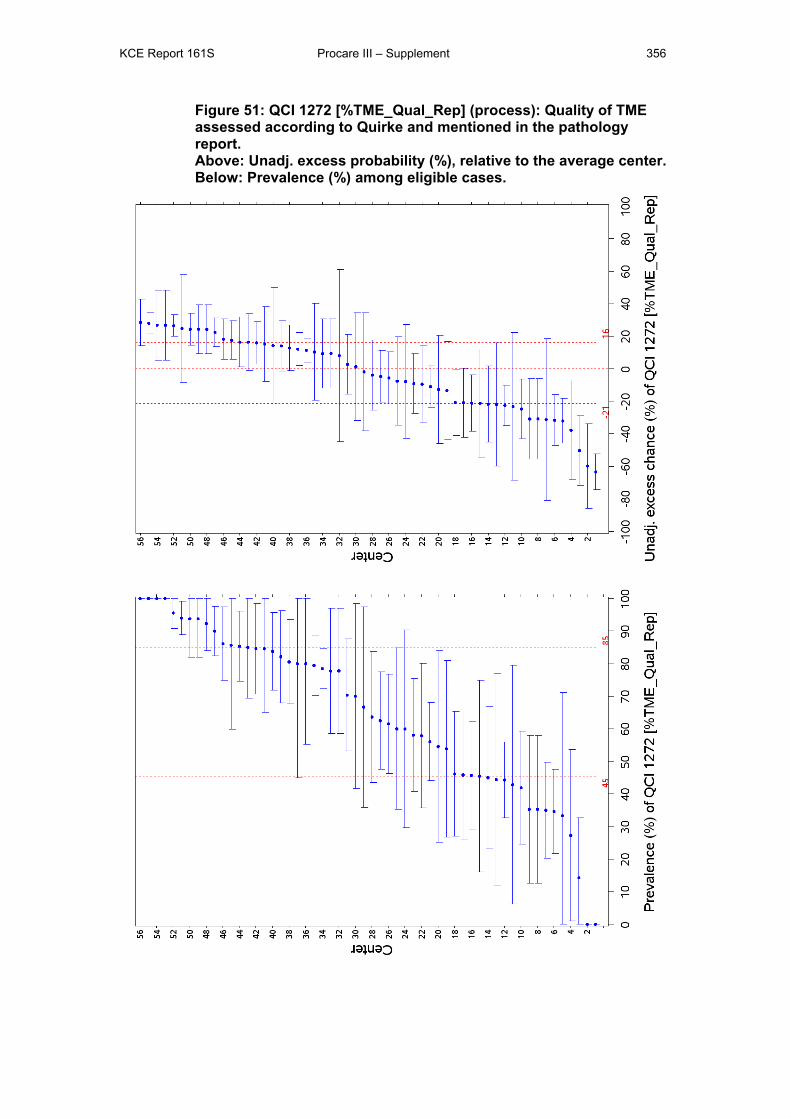
KCE Report 161S Procare III – Supplement 356
Figure 51: QCI 1272 [%TME_Qual_Rep] (process): Quality of TME assessed according to Quirke and mentioned in the pathology report. Above: Unadj. excess probability (%), relative to the average center. Below: Prevalence (%) among eligible cases.
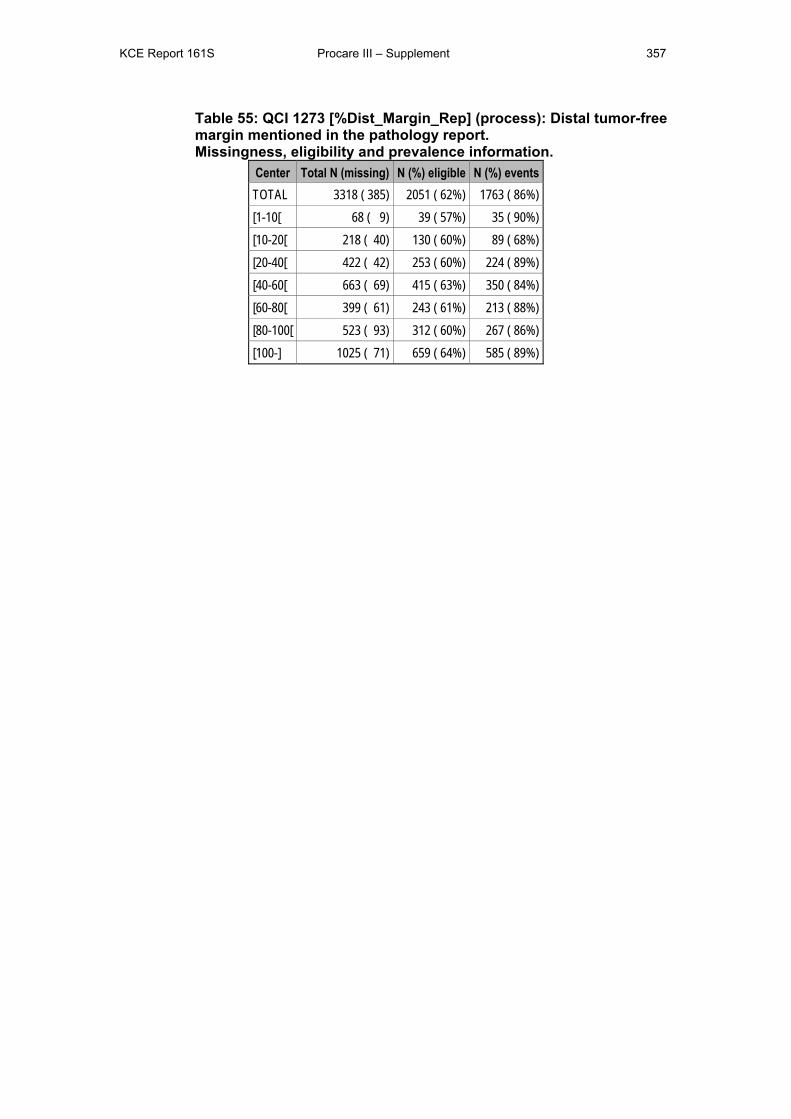
KCE Report 161S Procare III – Supplement 357
Table 55: QCI 1273 [%Dist_Margin_Rep] (process): Distal tumor-free margin mentioned in the pathology report. Missingness, eligibility and prevalence information.
Center Total N (missing) N (%) eligible N (%) events TOTAL 3318 ( 385) 2051 ( 62%) 1763 ( 86%) [1-10[ 68 ( 9) 39 ( 57%) 35 ( 90%) [10-20[ 218 ( 40) 130 ( 60%) 89 ( 68%) [20-40[ 422 ( 42) 253 ( 60%) 224 ( 89%) [40-60[ 663 ( 69) 415 ( 63%) 350 ( 84%) [60-80[ 399 ( 61) 243 ( 61%) 213 ( 88%) [80-100[ 523 ( 93) 312 ( 60%) 267 ( 86%) [100-] 1025 ( 71) 659 ( 64%) 585 ( 89%)

KCE Report 161S Procare III – Supplement 358
Figure 52: QCI 1273 [%Dist_Margin_Rep] (process): Distal tumor-free margin mentioned in the pathology report. Above: Unadj. excess probability (%), relative to the average center. Below: Prevalence (%) among eligible cases.
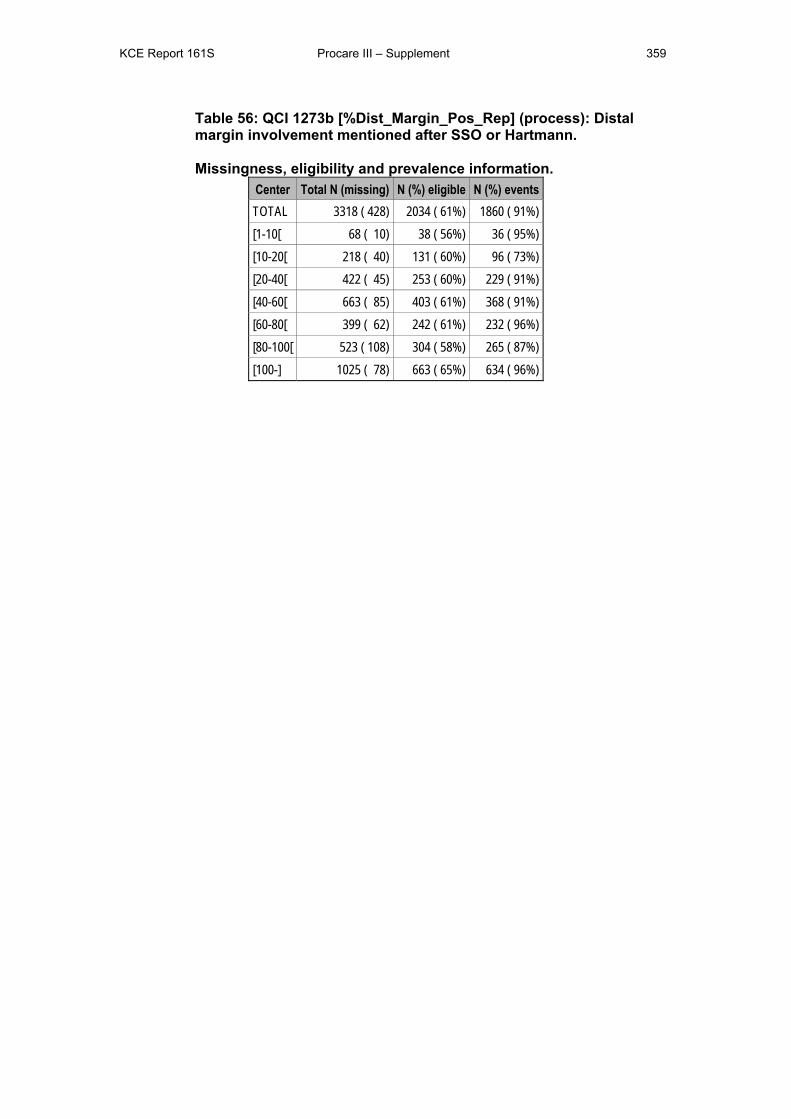
KCE Report 161S Procare III – Supplement 359
Table 56: QCI 1273b [%Dist_Margin_Pos_Rep] (process): Distal margin involvement mentioned after SSO or Hartmann. Missingness, eligibility and prevalence information.
Center Total N (missing) N (%) eligible N (%) events TOTAL 3318 ( 428) 2034 ( 61%) 1860 ( 91%) [1-10[ 68 ( 10) 38 ( 56%) 36 ( 95%) [10-20[ 218 ( 40) 131 ( 60%) 96 ( 73%) [20-40[ 422 ( 45) 253 ( 60%) 229 ( 91%) [40-60[ 663 ( 85) 403 ( 61%) 368 ( 91%) [60-80[ 399 ( 62) 242 ( 61%) 232 ( 96%) [80-100[ 523 ( 108) 304 ( 58%) 265 ( 87%) [100-] 1025 ( 78) 663 ( 65%) 634 ( 96%)
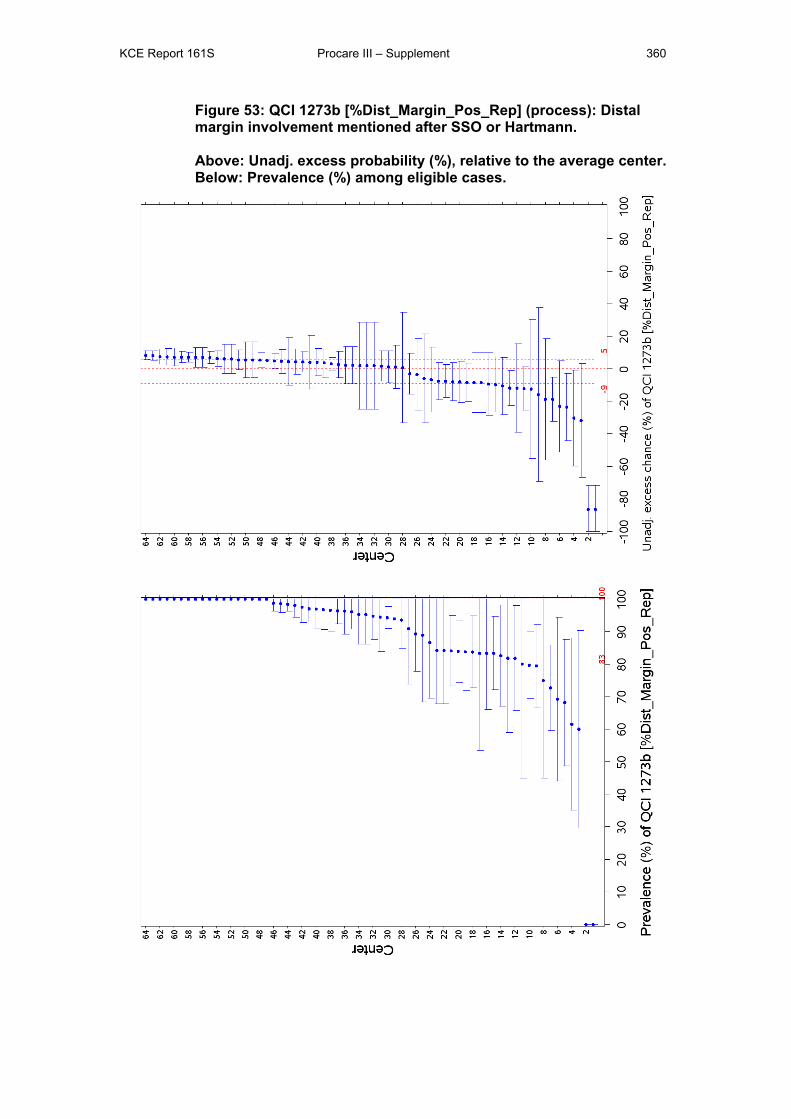
KCE Report 161S Procare III – Supplement 360
Figure 53: QCI 1273b [%Dist_Margin_Pos_Rep] (process): Distal margin involvement mentioned after SSO or Hartmann. Above: Unadj. excess probability (%), relative to the average center. Below: Prevalence (%) among eligible cases.

KCE Report 161S Procare III – Supplement 361
Table 57: QCI 1274 [#Nodes_examined] (process): Number of lymph nodes examined.
Statistical summary of the distribution of this QCI. Center Total N (missing) N (%) eligible Min P25 P50 P75 Max TOTAL 3318 ( 594) 2714 ( 82%) 0 7 11 16 135 [1-10[ 68 ( 10) 58 ( 85%) 2 6 10 14 22 [10-20[ 218 ( 75) 142 ( 65%) 0 6 11 15 43 [20-40[ 422 ( 76) 346 ( 82%) 0 7 11 15 50 [40-60[ 663 ( 121) 539 ( 81%) 0 7 11 16 58 [60-80[ 399 ( 65) 334 ( 84%) 0 10 14 19 64 [80-100[ 523 ( 151) 372 ( 71%) 1 9 13 17 61 [100-] 1025 ( 96) 923 ( 90%) 0 6 10 14 135
Table 58: Truncated QCI 1274 [#Nodes_examined] (process): Number of lymph nodes examined, truncated at 25 nodes.
Statistical summary of the distribution of this truncated QCI. Center Total N (missing) N (%) eligible Min P25 P50 P75 Max TOTAL 3318 ( 594) 2714 ( 82%) 0 7 11 16 25 [1-10[ 68 ( 10) 58 ( 85%) 2 6 10 14 22 [10-20[ 218 ( 75) 142 ( 65%) 0 6 11 15 25 [20-40[ 422 ( 76) 346 ( 82%) 0 7 11 15 25 [40-60[ 663 ( 121) 539 ( 81%) 0 7 11 16 25 [60-80[ 399 ( 65) 334 ( 84%) 0 10 14 19 25 [80-100[ 523 ( 151) 372 ( 71%) 1 9 13 17 25 [100-] 1025 ( 96) 923 ( 90%) 0 6 10 14 25
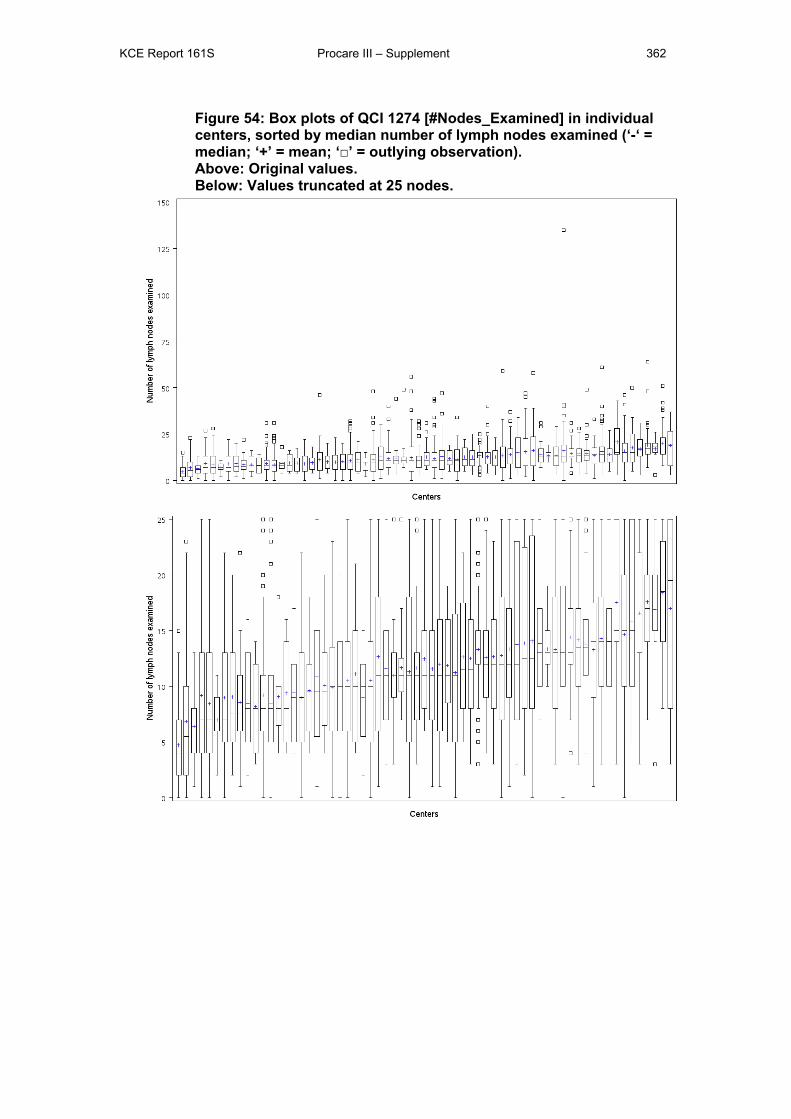
KCE Report 161S Procare III – Supplement 362
Figure 54: Box plots of QCI 1274 [#Nodes_Examined] in individual centers, sorted by median number of lymph nodes examined (‘-‘ = median; ‘+’ = mean; ‘□’ = outlying observation). Above: Original values. Below: Values truncated at 25 nodes.
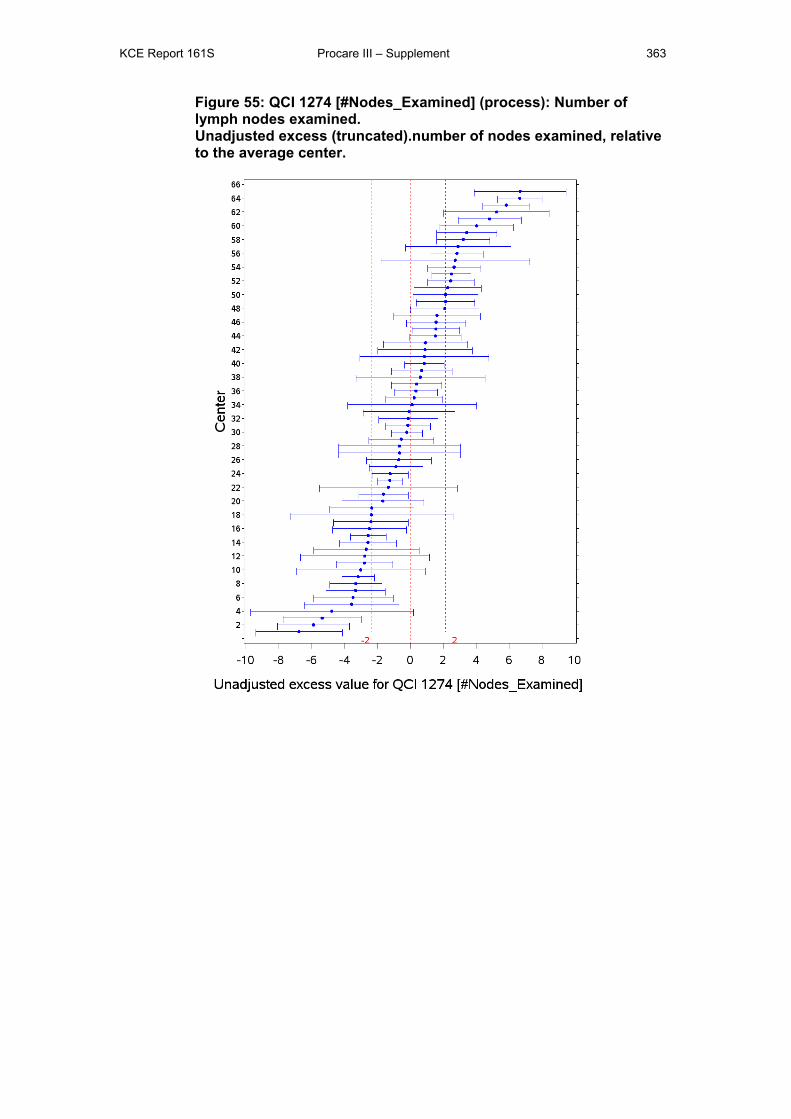
KCE Report 161S Procare III – Supplement 363
Figure 55: QCI 1274 [#Nodes_Examined] (process): Number of lymph nodes examined. Unadjusted excess (truncated).number of nodes examined, relative to the average center.
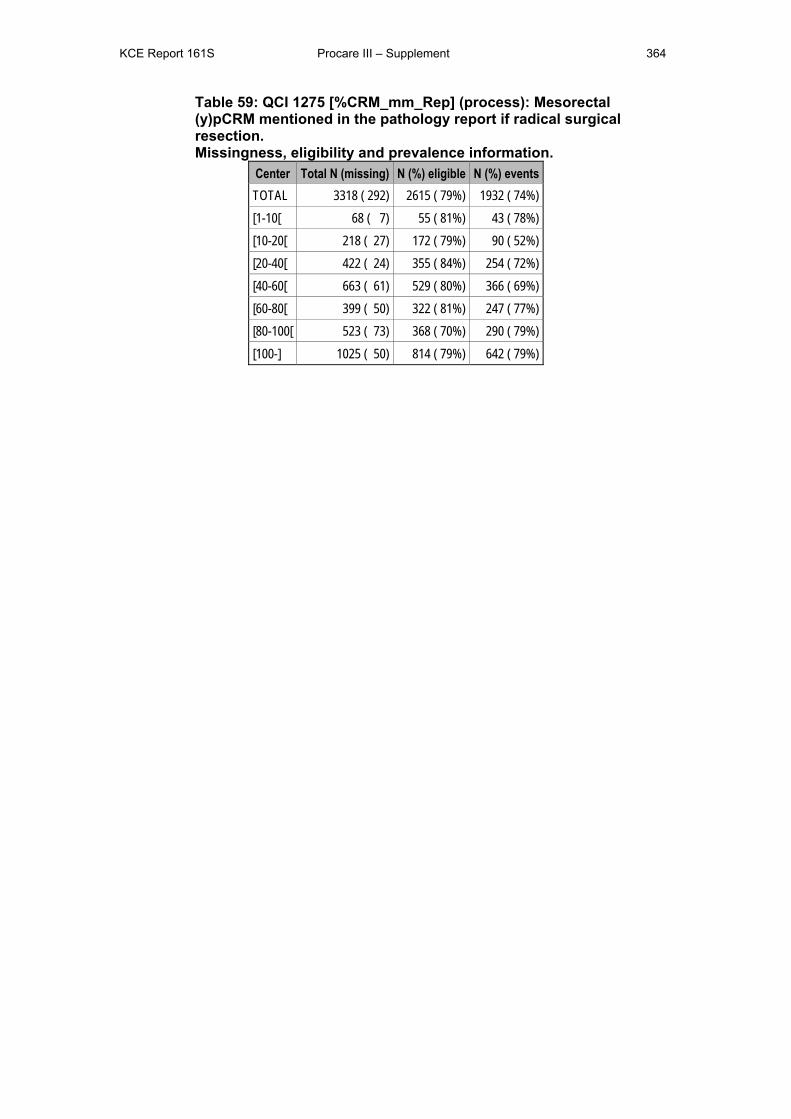
KCE Report 161S Procare III – Supplement 364
Table 59: QCI 1275 [%CRM_mm_Rep] (process): Mesorectal (y)pCRM mentioned in the pathology report if radical surgical resection. Missingness, eligibility and prevalence information.
Center Total N (missing) N (%) eligible N (%) events TOTAL 3318 ( 292) 2615 ( 79%) 1932 ( 74%) [1-10[ 68 ( 7) 55 ( 81%) 43 ( 78%) [10-20[ 218 ( 27) 172 ( 79%) 90 ( 52%) [20-40[ 422 ( 24) 355 ( 84%) 254 ( 72%) [40-60[ 663 ( 61) 529 ( 80%) 366 ( 69%) [60-80[ 399 ( 50) 322 ( 81%) 247 ( 77%) [80-100[ 523 ( 73) 368 ( 70%) 290 ( 79%) [100-] 1025 ( 50) 814 ( 79%) 642 ( 79%)
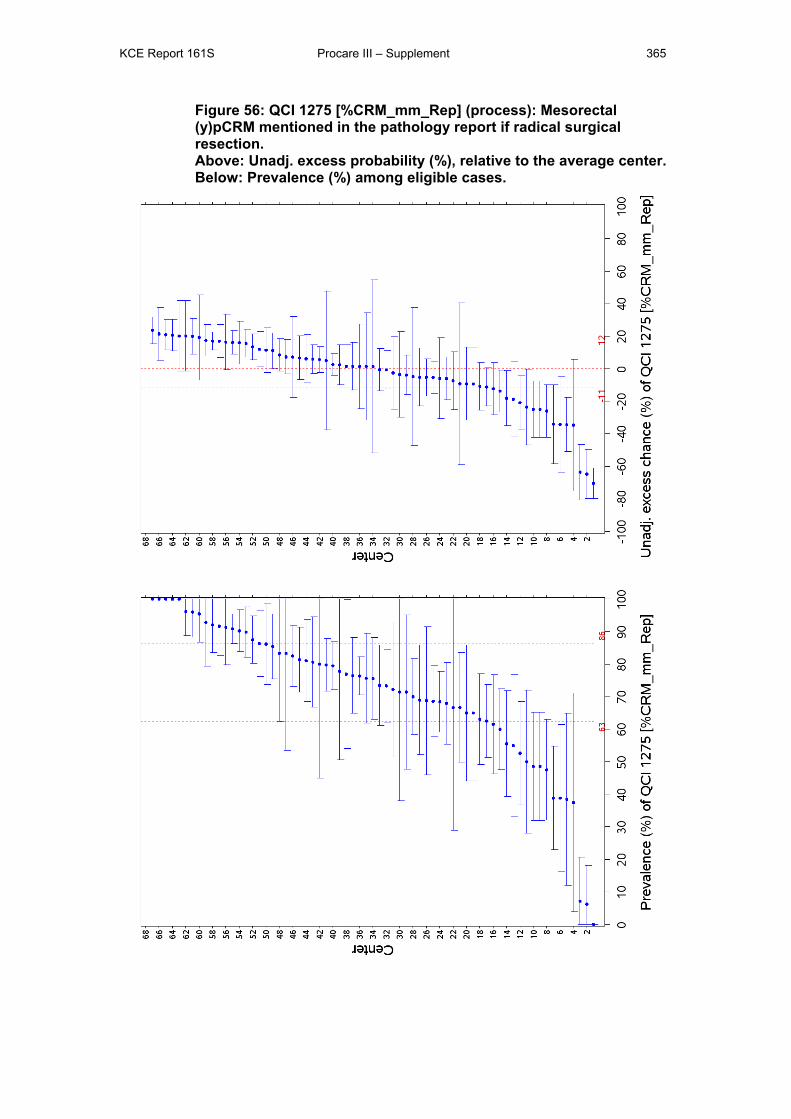
KCE Report 161S Procare III – Supplement 365
Figure 56: QCI 1275 [%CRM_mm_Rep] (process): Mesorectal (y)pCRM mentioned in the pathology report if radical surgical resection. Above: Unadj. excess probability (%), relative to the average center. Below: Prevalence (%) among eligible cases.
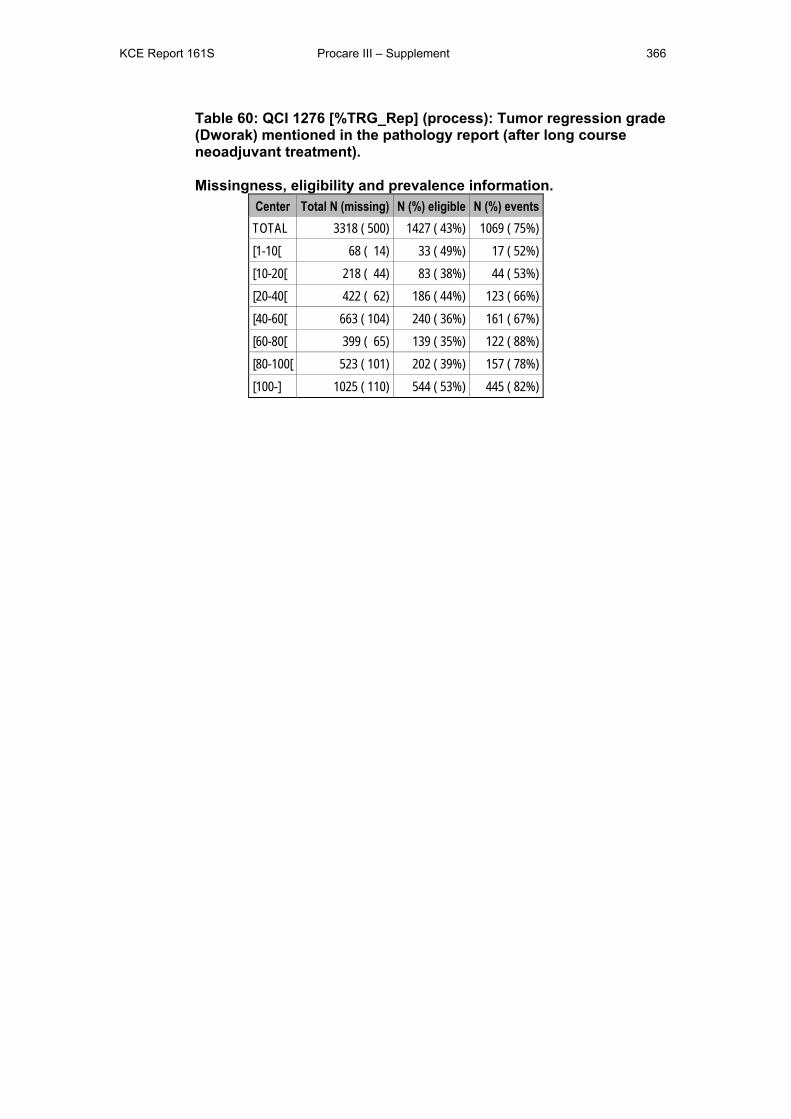
KCE Report 161S Procare III – Supplement 366
Table 60: QCI 1276 [%TRG_Rep] (process): Tumor regression grade (Dworak) mentioned in the pathology report (after long course neoadjuvant treatment). Missingness, eligibility and prevalence information.
Center Total N (missing) N (%) eligible N (%) events TOTAL 3318 ( 500) 1427 ( 43%) 1069 ( 75%) [1-10[ 68 ( 14) 33 ( 49%) 17 ( 52%) [10-20[ 218 ( 44) 83 ( 38%) 44 ( 53%) [20-40[ 422 ( 62) 186 ( 44%) 123 ( 66%) [40-60[ 663 ( 104) 240 ( 36%) 161 ( 67%) [60-80[ 399 ( 65) 139 ( 35%) 122 ( 88%) [80-100[ 523 ( 101) 202 ( 39%) 157 ( 78%) [100-] 1025 ( 110) 544 ( 53%) 445 ( 82%)
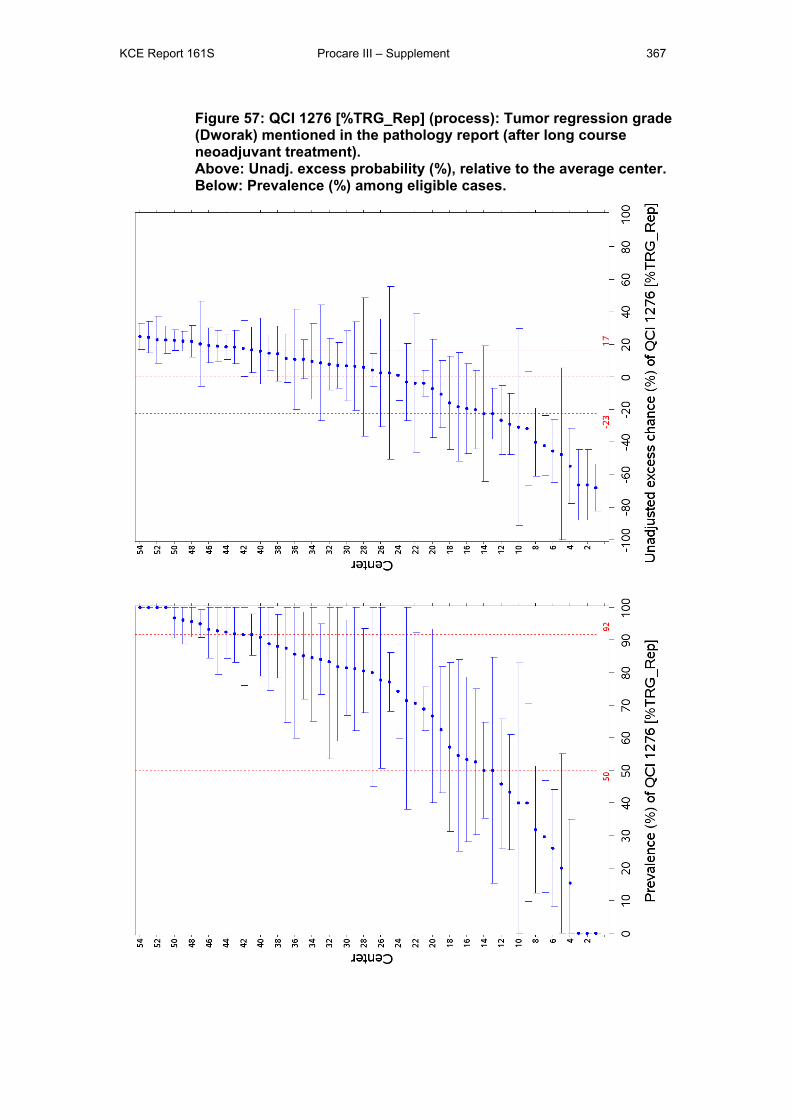
KCE Report 161S Procare III – Supplement 367
Figure 57: QCI 1276 [%TRG_Rep] (process): Tumor regression grade (Dworak) mentioned in the pathology report (after long course neoadjuvant treatment). Above: Unadj. excess probability (%), relative to the average center. Below: Prevalence (%) among eligible cases.
KCE Report 161S Procare III – Supplement 368
2 QUALITY OF CARE INDICATORS We follow the list of QCIs as presented in the PROCARE consensus of July 24th,
2010, summarized in Appendix 4. Sections on outcome indicators are marked with a
‘*’ in the beginning of their title.
Note that for the statistical analyses per QCI, the 10 patients with cStage 0 will be
discarded from the database, leaving a total of 3318 patients in the database.
2.1 GENERAL QUALITY INDICATORS The definitions as provided in the PROCARE documents are clear in principle, but
for good practice these QCIs need to be translated into technically correct working
definitions containing the observed time and endpoint, which may be either the event
of interest, a competing event or censoring.
Censoring happens for patients for whom no event of interest was observed before
closure of the database. The current PROCARE database was closed at the end of
October 2010 and was linked with the death records of the version of the Cross
Banks Social Security database of August 2010. The BCR argues that we may then
be confident that all deaths up to July 31st, 2010 are registered in the database we
have at our disposal. Therefore, July 31st, 2010 will be used as the administrative
censoring date for the current PROCARE database.
2.1.1 QCI 1111 [OS] This QCI has been explained in more detail in the main report (section 3.4.1).
2.1.2 *Disease-specific 5-year survival by stage (QCI 1112, outcome)
2.1.2.1 Definition PROCARE definition
N: Number of patients in denominator that did not die from rectal cancer during 1-5
years follow-up.
D: Number of patients for whom the national registry number is known and have a
follow-up of 1 -5 years, respectively. Survival status was obtained through cross-link
with the Crossroads Bank for Social Security (CBSS).
Patients who died without rectal cancer (local recurrence or metastasis) are
censored. Survival curves were calculated using the Kaplan Meier method.
KCE Report 161S Procare III – Supplement 369
Working definition
Cumulative incidence based probability of not dying from rectal cancer within 5 years
after rectum cancer diagnosis. This involves follow-up time (in years) and as event
the endpoint ‘death from rectal cancer’ (defined as ‘with record of local recurrence or
distant metastasis’). The other types of endpoints here are either censoring
(subsequent risk of disease-specific death is unaltered but masked from view) and
‘death from other causes’ which is a competing risk (subsequent risk of disease-
specific death = 0).
D: Number of patients for whom the national registry number is known and for whom
the incidence date is known to be before the administrative censoring date.
Additionally, deceased patients according to the CBSS, but for whom no follow-up
information is available in the PROCARE database are excluded from the
denominator.
Note that 5-year survival probabilities will for now be replaced with 3-year survival
probabilities.
Note that due to the low quality of the follow-up information in the PROCARE
database the general quality of this QCI is questionable.
2.1.2.2 Description A total of 2807 of the 3318 (85%) patients meet the requirements for the denominator
of this QCI. Of the 511 patients who are not eligible. 507 have missing information
(on social security number, incidence date, follow-up in case of death) and the other
4 have an incidence date after July 31st, 2010.
Of the 2807 eligible patients, 193 (7%) patients died with local recurrence and/or
distant metastasis and 210 (7%) patients died without (reported) local recurrence nor
distant metastasis. After merging centers with less than 5 eligible patients into one
overlapping center, 67 centers remain for performance evaluation in terms of
disease-specific survival. More detail per size-grouped centers on the follow-up time,
person years and event rate can be found in Table 16 in Section 1. The cStage-
stratified survival (i.e. 1 - cumulative incidence) curves are presented in Figure 58,
the corresponding (y)pStage-stratified survival curves are presented in Figure 6 of
Section 1. The graphs show the probability of surviving rectal cancer or dying without
local recurrence nor distant metastasis, accounting for the fact that indeed some
patients die of other causes.
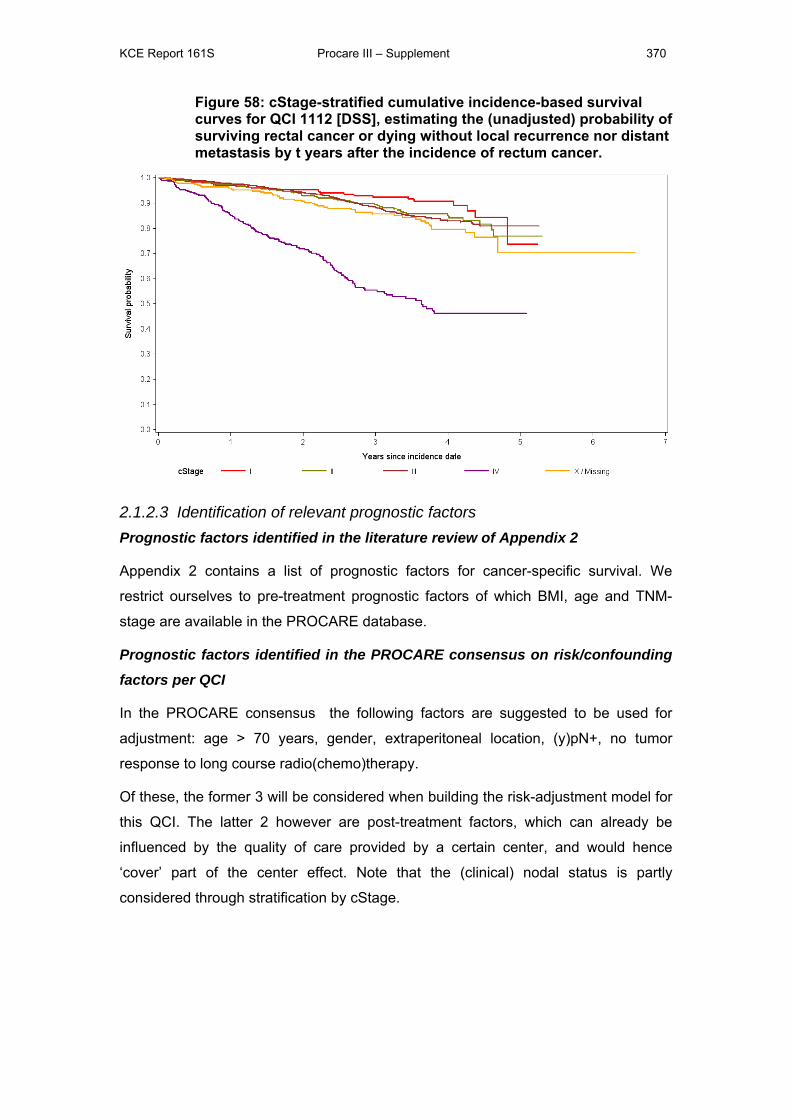
KCE Report 161S Procare III – Supplement 370
Figure 58: cStage-stratified cumulative incidence-based survival curves for QCI 1112 [DSS], estimating the (unadjusted) probability of surviving rectal cancer or dying without local recurrence nor distant metastasis by t years after the incidence of rectum cancer.
2.1.2.3 Identification of relevant prognostic factors Prognostic factors identified in the literature review of Appendix 2
Appendix 2 contains a list of prognostic factors for cancer-specific survival. We
restrict ourselves to pre-treatment prognostic factors of which BMI, age and TNM-
stage are available in the PROCARE database.
Prognostic factors identified in the PROCARE consensus on risk/confounding
factors per QCI
In the PROCARE consensus the following factors are suggested to be used for
adjustment: age > 70 years, gender, extraperitoneal location, (y)pN+, no tumor
response to long course radio(chemo)therapy.
Of these, the former 3 will be considered when building the risk-adjustment model for
this QCI. The latter 2 however are post-treatment factors, which can already be
influenced by the quality of care provided by a certain center, and would hence
‘cover’ part of the center effect. Note that the (clinical) nodal status is partly
considered through stratification by cStage.
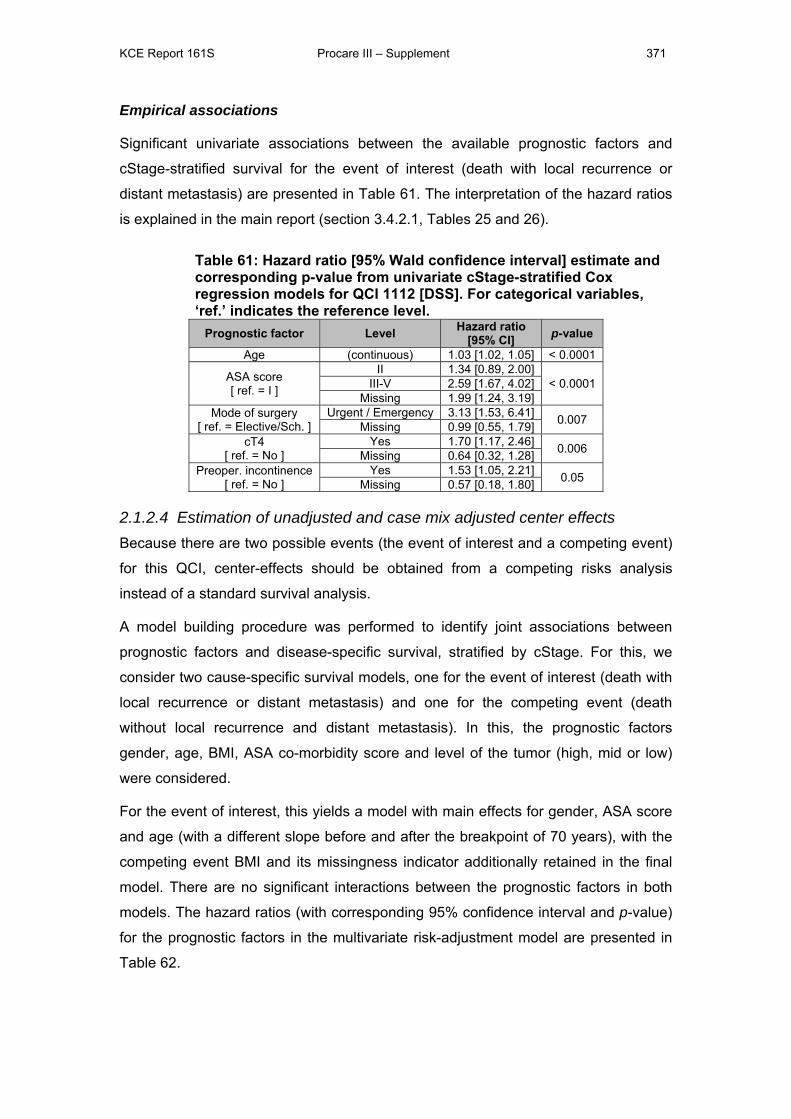
KCE Report 161S Procare III – Supplement 371
Empirical associations
Significant univariate associations between the available prognostic factors and
cStage-stratified survival for the event of interest (death with local recurrence or
distant metastasis) are presented in Table 61. The interpretation of the hazard ratios
is explained in the main report (section 3.4.2.1, Tables 25 and 26).
Table 61: Hazard ratio [95% Wald confidence interval] estimate and corresponding p-value from univariate cStage-stratified Cox regression models for QCI 1112 [DSS]. For categorical variables, ‘ref.’ indicates the reference level.
Prognostic factor Level Hazard ratio [95% CI] p-value
Age (continuous) 1.03 [1.02, 1.05] < 0.0001
ASA score [ ref. = I ]
II 1.34 [0.89, 2.00] < 0.0001 III-V 2.59 [1.67, 4.02]
Missing 1.99 [1.24, 3.19] Mode of surgery
[ ref. = Elective/Sch. ] Urgent / Emergency 3.13 [1.53, 6.41] 0.007 Missing 0.99 [0.55, 1.79]
cT4 [ ref. = No ]
Yes 1.70 [1.17, 2.46] 0.006 Missing 0.64 [0.32, 1.28] Preoper. incontinence
[ ref. = No ] Yes 1.53 [1.05, 2.21] 0.05 Missing 0.57 [0.18, 1.80]
2.1.2.4 Estimation of unadjusted and case mix adjusted center effects Because there are two possible events (the event of interest and a competing event)
for this QCI, center-effects should be obtained from a competing risks analysis
instead of a standard survival analysis.
A model building procedure was performed to identify joint associations between
prognostic factors and disease-specific survival, stratified by cStage. For this, we
consider two cause-specific survival models, one for the event of interest (death with
local recurrence or distant metastasis) and one for the competing event (death
without local recurrence and distant metastasis). In this, the prognostic factors
gender, age, BMI, ASA co-morbidity score and level of the tumor (high, mid or low)
were considered.
For the event of interest, this yields a model with main effects for gender, ASA score
and age (with a different slope before and after the breakpoint of 70 years), with the
competing event BMI and its missingness indicator additionally retained in the final
model. There are no significant interactions between the prognostic factors in both
models. The hazard ratios (with corresponding 95% confidence interval and p-value)
for the prognostic factors in the multivariate risk-adjustment model are presented in
Table 62.
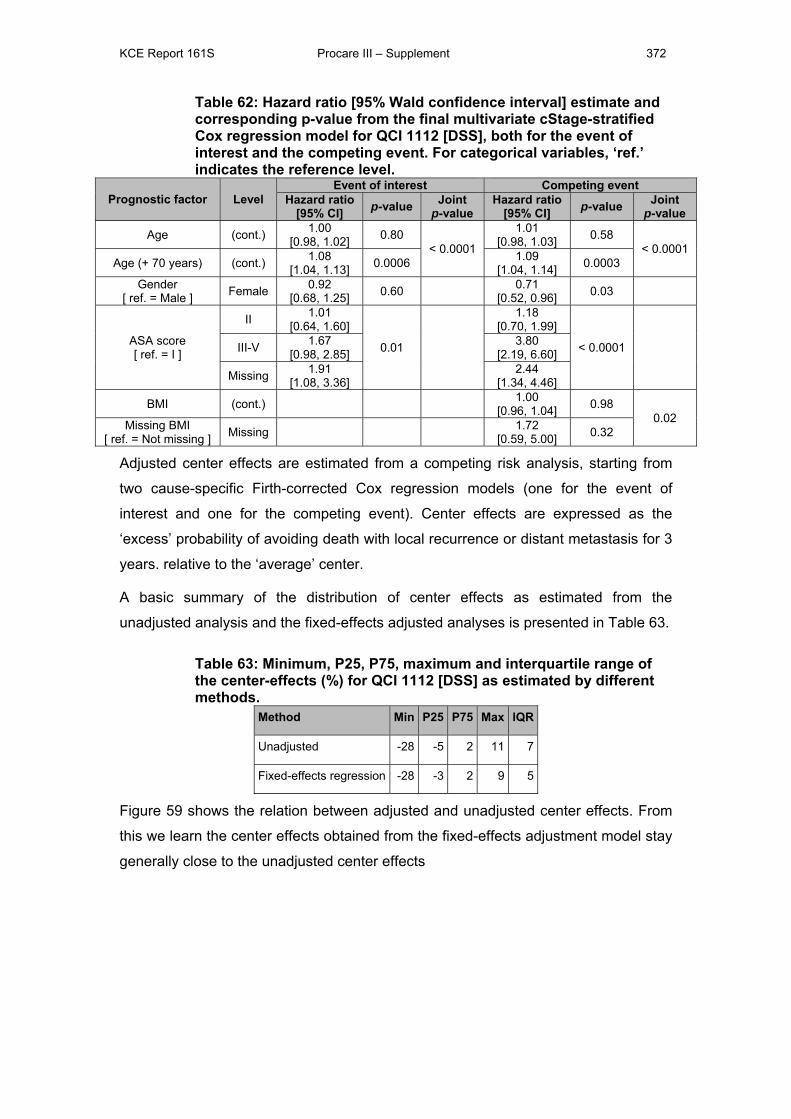
KCE Report 161S Procare III – Supplement 372
Table 62: Hazard ratio [95% Wald confidence interval] estimate and corresponding p-value from the final multivariate cStage-stratified Cox regression model for QCI 1112 [DSS], both for the event of interest and the competing event. For categorical variables, ‘ref.’ indicates the reference level.
Prognostic factor Level Event of interest Competing event
Hazard ratio [95% CI] p-value Joint
p-value Hazard ratio
[95% CI] p-value Joint p-value
Age (cont.) 1.00 [0.98, 1.02] 0.80
< 0.0001
1.01 [0.98, 1.03] 0.58
< 0.0001 Age (+ 70 years) (cont.) 1.08
[1.04, 1.13] 0.0006 1.09 [1.04, 1.14] 0.0003
Gender [ ref. = Male ] Female 0.92
[0.68, 1.25] 0.60 0.71 [0.52, 0.96] 0.03
ASA score [ ref. = I ]
II 1.01 [0.64, 1.60]
0.01
1.18 [0.70, 1.99]
< 0.0001
III-V 1.67 [0.98, 2.85]
3.80 [2.19, 6.60]
Missing 1.91 [1.08, 3.36]
2.44 [1.34, 4.46]
BMI (cont.) 1.00 [0.96, 1.04] 0.98
0.02 Missing BMI [ ref. = Not missing ] Missing 1.72
[0.59, 5.00] 0.32
Adjusted center effects are estimated from a competing risk analysis, starting from
two cause-specific Firth-corrected Cox regression models (one for the event of
interest and one for the competing event). Center effects are expressed as the
‘excess’ probability of avoiding death with local recurrence or distant metastasis for 3
years. relative to the ‘average’ center.
A basic summary of the distribution of center effects as estimated from the
unadjusted analysis and the fixed-effects adjusted analyses is presented in Table 63.
Table 63: Minimum, P25, P75, maximum and interquartile range of the center-effects (%) for QCI 1112 [DSS] as estimated by different methods.
Method Min P25 P75 Max IQR
Unadjusted -28 -5 2 11 7
Fixed-effects regression -28 -3 2 9 5
Figure 59 shows the relation between adjusted and unadjusted center effects. From
this we learn the center effects obtained from the fixed-effects adjustment model stay
generally close to the unadjusted center effects
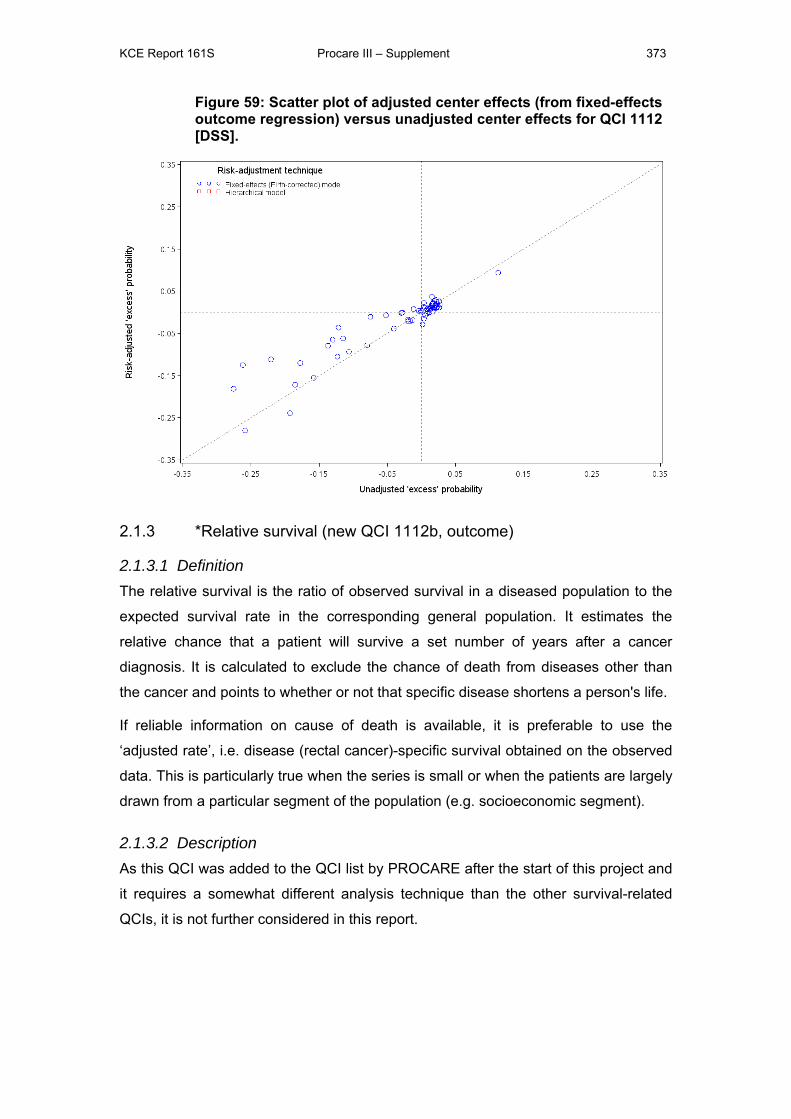
KCE Report 161S Procare III – Supplement 373
Figure 59: Scatter plot of adjusted center effects (from fixed-effects outcome regression) versus unadjusted center effects for QCI 1112 [DSS].
2.1.3 *Relative survival (new QCI 1112b, outcome)
2.1.3.1 Definition The relative survival is the ratio of observed survival in a diseased population to the
expected survival rate in the corresponding general population. It estimates the
relative chance that a patient will survive a set number of years after a cancer
diagnosis. It is calculated to exclude the chance of death from diseases other than
the cancer and points to whether or not that specific disease shortens a person's life.
If reliable information on cause of death is available, it is preferable to use the
‘adjusted rate’, i.e. disease (rectal cancer)-specific survival obtained on the observed
data. This is particularly true when the series is small or when the patients are largely
drawn from a particular segment of the population (e.g. socioeconomic segment).
2.1.3.2 Description As this QCI was added to the QCI list by PROCARE after the start of this project and
it requires a somewhat different analysis technique than the other survival-related
QCIs, it is not further considered in this report.
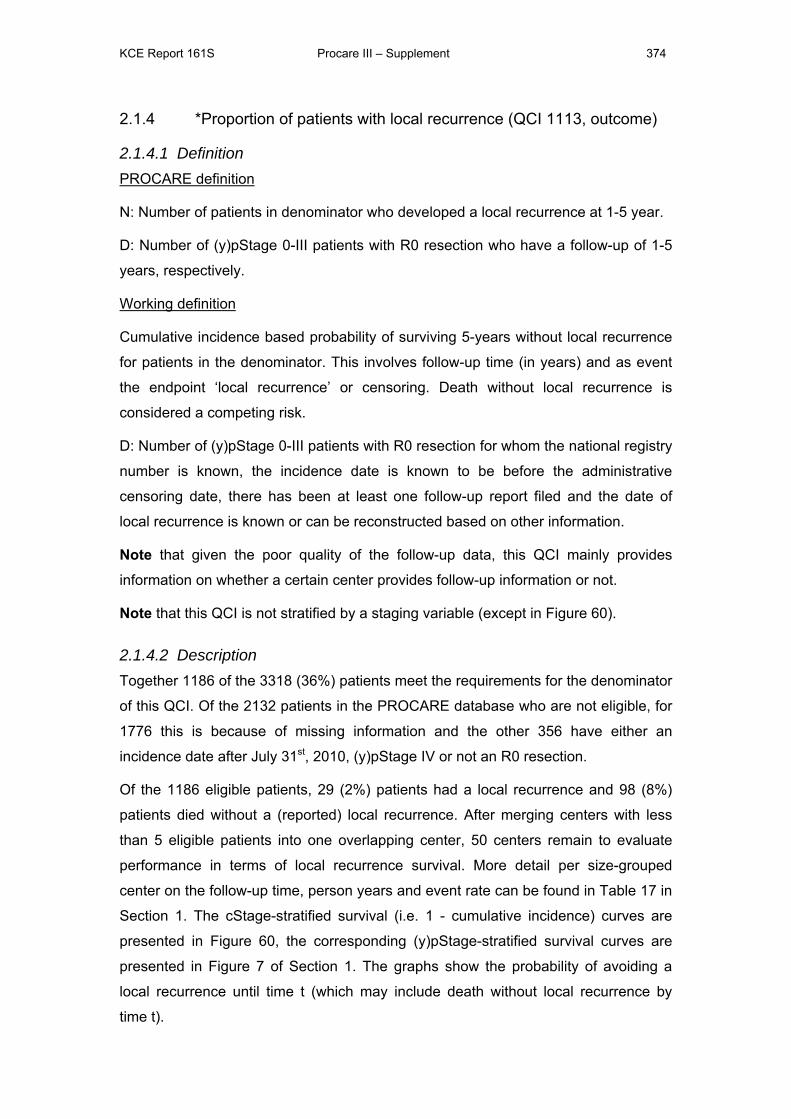
KCE Report 161S Procare III – Supplement 374
2.1.4 *Proportion of patients with local recurrence (QCI 1113, outcome)
2.1.4.1 Definition PROCARE definition
N: Number of patients in denominator who developed a local recurrence at 1-5 year.
D: Number of (y)pStage 0-III patients with R0 resection who have a follow-up of 1-5
years, respectively.
Working definition
Cumulative incidence based probability of surviving 5-years without local recurrence
for patients in the denominator. This involves follow-up time (in years) and as event
the endpoint ‘local recurrence’ or censoring. Death without local recurrence is
considered a competing risk.
D: Number of (y)pStage 0-III patients with R0 resection for whom the national registry
number is known, the incidence date is known to be before the administrative
censoring date, there has been at least one follow-up report filed and the date of
local recurrence is known or can be reconstructed based on other information.
Note that given the poor quality of the follow-up data, this QCI mainly provides
information on whether a certain center provides follow-up information or not.
Note that this QCI is not stratified by a staging variable (except in Figure 60).
2.1.4.2 Description Together 1186 of the 3318 (36%) patients meet the requirements for the denominator
of this QCI. Of the 2132 patients in the PROCARE database who are not eligible, for
1776 this is because of missing information and the other 356 have either an
incidence date after July 31st, 2010, (y)pStage IV or not an R0 resection.
Of the 1186 eligible patients, 29 (2%) patients had a local recurrence and 98 (8%)
patients died without a (reported) local recurrence. After merging centers with less
than 5 eligible patients into one overlapping center, 50 centers remain to evaluate
performance in terms of local recurrence survival. More detail per size-grouped
center on the follow-up time, person years and event rate can be found in Table 17 in
Section 1. The cStage-stratified survival (i.e. 1 - cumulative incidence) curves are
presented in Figure 60, the corresponding (y)pStage-stratified survival curves are
presented in Figure 7 of Section 1. The graphs show the probability of avoiding a
local recurrence until time t (which may include death without local recurrence by
time t).
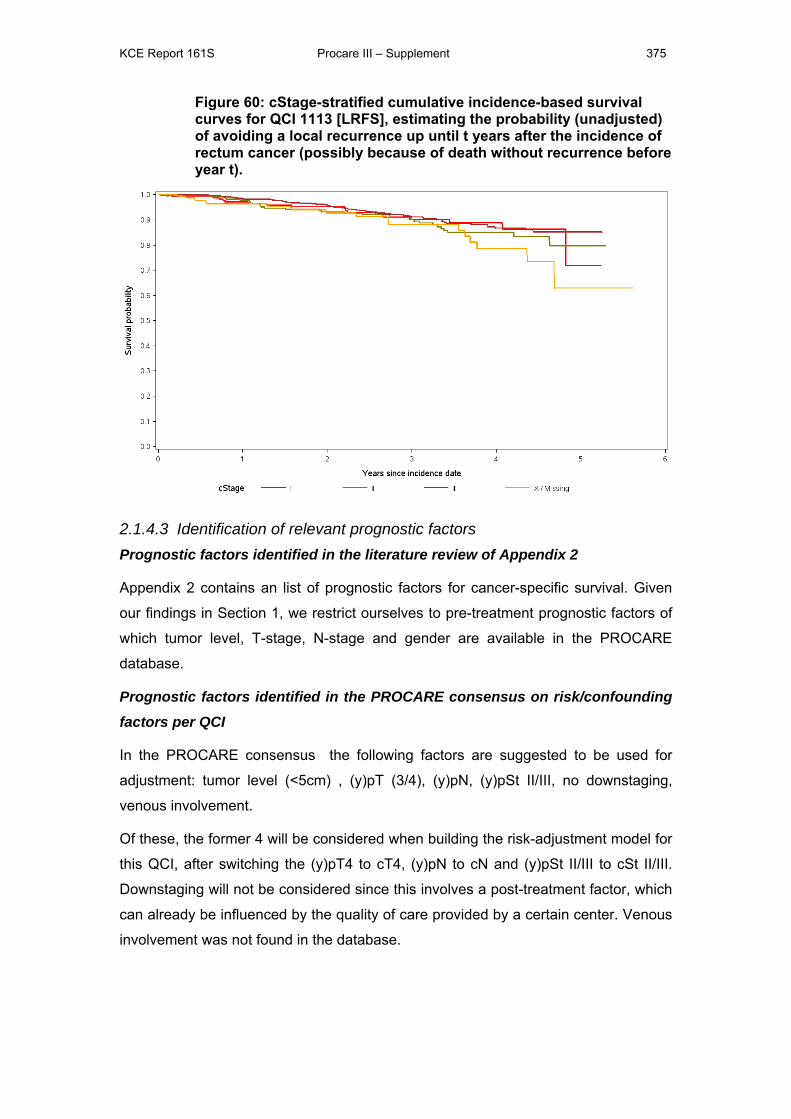
KCE Report 161S Procare III – Supplement 375
Figure 60: cStage-stratified cumulative incidence-based survival curves for QCI 1113 [LRFS], estimating the probability (unadjusted) of avoiding a local recurrence up until t years after the incidence of rectum cancer (possibly because of death without recurrence before year t).
2.1.4.3 Identification of relevant prognostic factors Prognostic factors identified in the literature review of Appendix 2
Appendix 2 contains an list of prognostic factors for cancer-specific survival. Given
our findings in Section 1, we restrict ourselves to pre-treatment prognostic factors of
which tumor level, T-stage, N-stage and gender are available in the PROCARE
database.
Prognostic factors identified in the PROCARE consensus on risk/confounding
factors per QCI
In the PROCARE consensus the following factors are suggested to be used for
adjustment: tumor level (<5cm) , (y)pT (3/4), (y)pN, (y)pSt II/III, no downstaging,
venous involvement.
Of these, the former 4 will be considered when building the risk-adjustment model for
this QCI, after switching the (y)pT4 to cT4, (y)pN to cN and (y)pSt II/III to cSt II/III.
Downstaging will not be considered since this involves a post-treatment factor, which
can already be influenced by the quality of care provided by a certain center. Venous
involvement was not found in the database.
KCE Report 161S Procare III – Supplement 376
Empirical associations
Of the considered prognostic factors, only tumor location (ventral versus not or
missing) is significantly associated with the intensity of local recurrences, see Table
64. The interpretation of the hazard ratios is as explained in the main report (section
3.4.1)
Table 64: Hazard ratio [95% Wald confidence interval] estimate and corresponding p-value from univariate Cox regression models for QCI 1113 [LRFS]. For categorical variables, ‘ref.’ indicates the reference level.
Prognostic factor Level Hazard ratio [95% CI] p-value
Ventral tumor [ ref. = No ]
Yes 0.33 [0.11, 0.95] 0.05 Missing 0.32 [0.08, 1.37]
2.1.4.4 Estimation of unadjusted and case mix adjusted center effects Because there are very few (2%) events of interest (local recurrence) it was not
possible to fit a stable proportional hazards model with an indicator variable for each
center, hence no unadjusted center effects could be estimated and no model building
procedure to identify joint associations between the rate of local recurrence and
prognostic factors was performed.
2.1.5 *Disease-free survival (new QCI 1113b, outcome)
2.1.5.1 Definition PROCARE definition
N: Number of patients in denominator who did not develop a local recurrence and/or
distant metastasis at 1-5 year of follow-up.
D: Number of (y)pStage 0-III patients with R0 resection who have a follow-up of 1-5
years, respectively.
Working definition
Kaplan-Meier based probability of ‘surviving’ 5-years without rectal cancer for
patients in the denominator. This involves follow-up time (in years) and as event the
first endpoint of death, local recurrence and distant metastasis versus censoring.
D: Number of (y)pStage 0-III patients with R0 resection for whom the national registry
number is known, the incidence date is known to be before the administrative
censoring date, there has been at least one follow-up report filed and the date of
local recurrence or distant metastasis is known or can be reconstructed based on
other information.
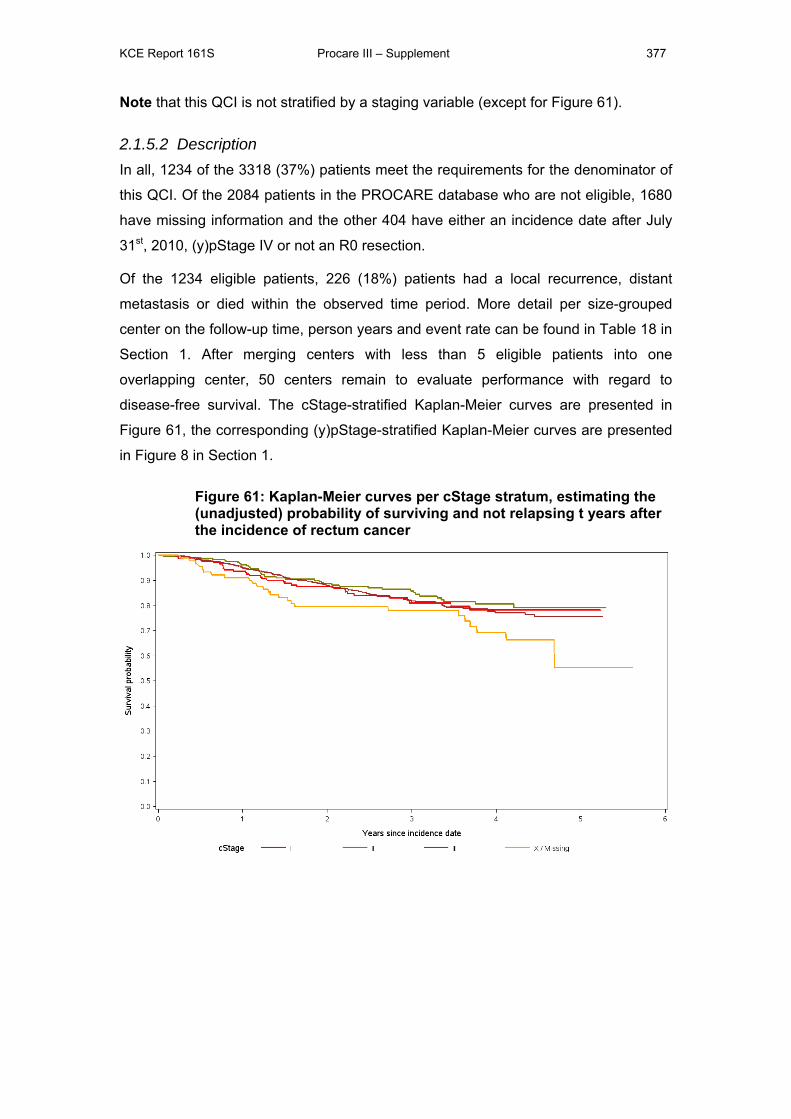
KCE Report 161S Procare III – Supplement 377
Note that this QCI is not stratified by a staging variable (except for Figure 61).
2.1.5.2 Description In all, 1234 of the 3318 (37%) patients meet the requirements for the denominator of
this QCI. Of the 2084 patients in the PROCARE database who are not eligible, 1680
have missing information and the other 404 have either an incidence date after July
31st, 2010, (y)pStage IV or not an R0 resection.
Of the 1234 eligible patients, 226 (18%) patients had a local recurrence, distant
metastasis or died within the observed time period. More detail per size-grouped
center on the follow-up time, person years and event rate can be found in Table 18 in
Section 1. After merging centers with less than 5 eligible patients into one
overlapping center, 50 centers remain to evaluate performance with regard to
disease-free survival. The cStage-stratified Kaplan-Meier curves are presented in
Figure 61, the corresponding (y)pStage-stratified Kaplan-Meier curves are presented
in Figure 8 in Section 1.
Figure 61: Kaplan-Meier curves per cStage stratum, estimating the (unadjusted) probability of surviving and not relapsing t years after the incidence of rectum cancer
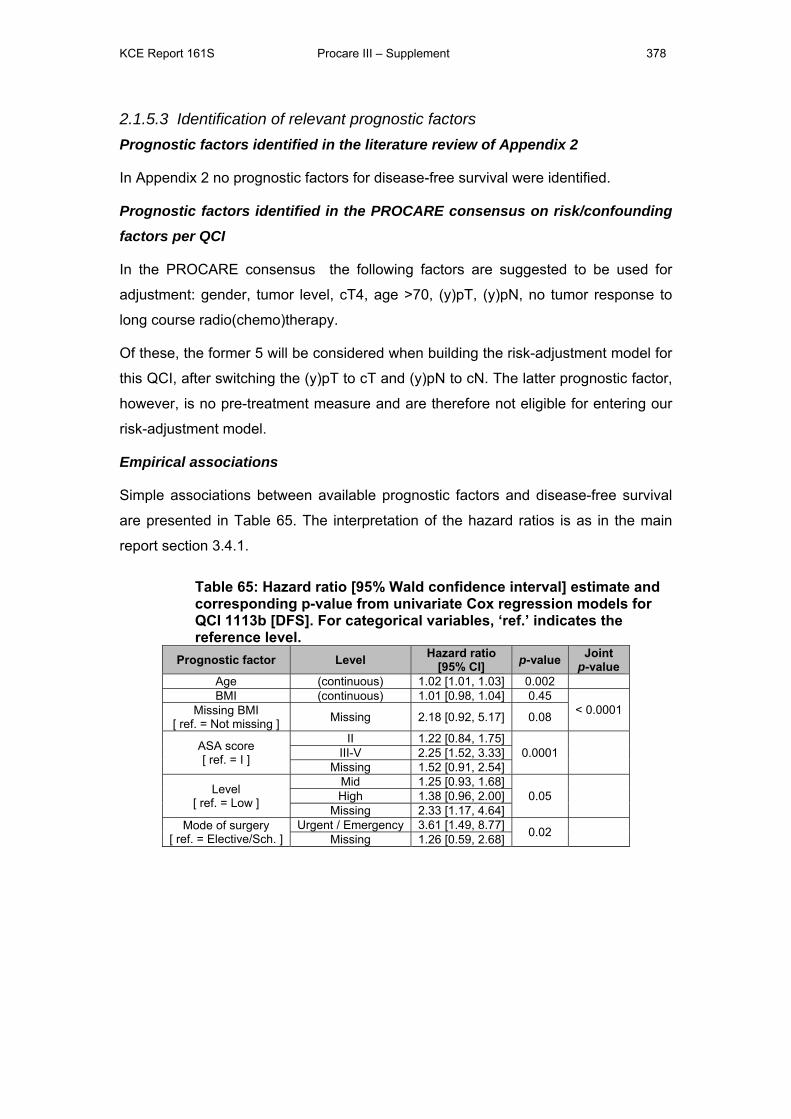
KCE Report 161S Procare III – Supplement 378
2.1.5.3 Identification of relevant prognostic factors Prognostic factors identified in the literature review of Appendix 2
In Appendix 2 no prognostic factors for disease-free survival were identified.
Prognostic factors identified in the PROCARE consensus on risk/confounding
factors per QCI
In the PROCARE consensus the following factors are suggested to be used for
adjustment: gender, tumor level, cT4, age >70, (y)pT, (y)pN, no tumor response to
long course radio(chemo)therapy.
Of these, the former 5 will be considered when building the risk-adjustment model for
this QCI, after switching the (y)pT to cT and (y)pN to cN. The latter prognostic factor,
however, is no pre-treatment measure and are therefore not eligible for entering our
risk-adjustment model.
Empirical associations
Simple associations between available prognostic factors and disease-free survival
are presented in Table 65. The interpretation of the hazard ratios is as in the main
report section 3.4.1.
Table 65: Hazard ratio [95% Wald confidence interval] estimate and corresponding p-value from univariate Cox regression models for QCI 1113b [DFS]. For categorical variables, ‘ref.’ indicates the reference level.
Prognostic factor Level Hazard ratio [95% CI] p-value Joint
p-value Age (continuous) 1.02 [1.01, 1.03] 0.002 BMI (continuous) 1.01 [0.98, 1.04] 0.45
< 0.0001 Missing BMI [ ref. = Not missing ] Missing 2.18 [0.92, 5.17] 0.08
ASA score [ ref. = I ]
II 1.22 [0.84, 1.75] 0.0001
III-V 2.25 [1.52, 3.33]
Missing 1.52 [0.91, 2.54]
Level [ ref. = Low ]
Mid 1.25 [0.93, 1.68] 0.05
High 1.38 [0.96, 2.00]
Missing 2.33 [1.17, 4.64] Mode of surgery
[ ref. = Elective/Sch. ] Urgent / Emergency 3.61 [1.49, 8.77] 0.02
Missing 1.26 [0.59, 2.68]
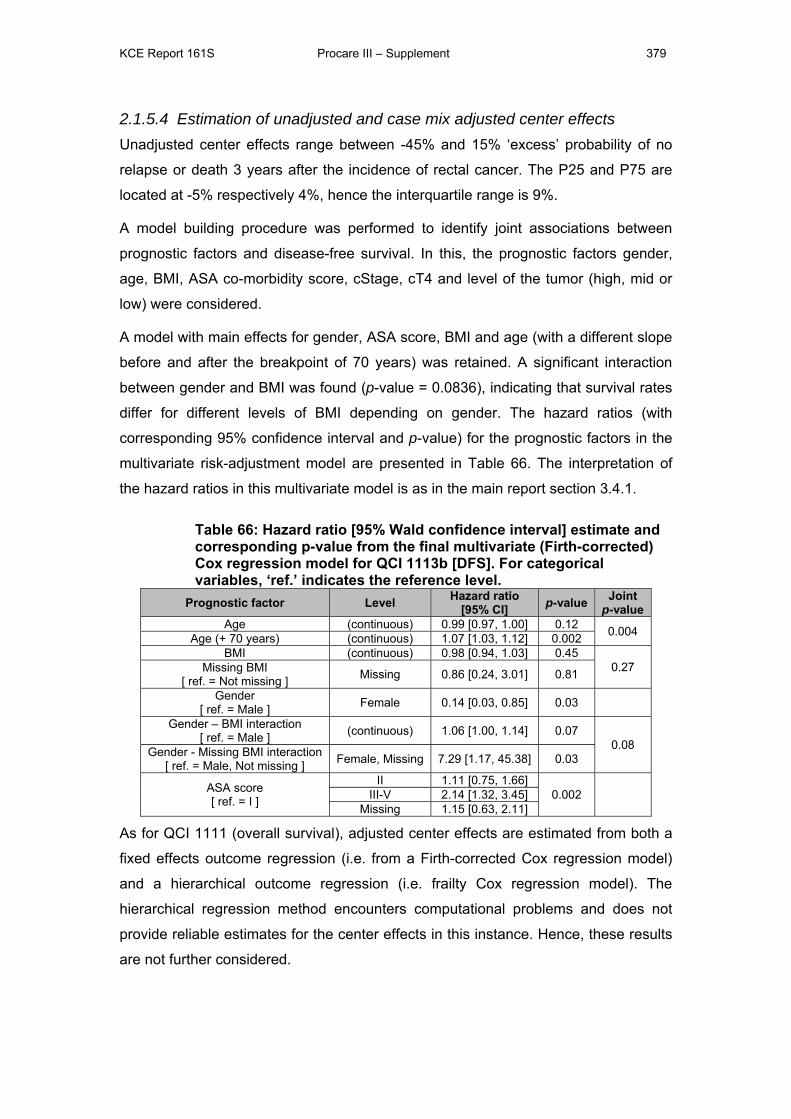
KCE Report 161S Procare III – Supplement 379
2.1.5.4 Estimation of unadjusted and case mix adjusted center effects Unadjusted center effects range between -45% and 15% ‘excess’ probability of no
relapse or death 3 years after the incidence of rectal cancer. The P25 and P75 are
located at -5% respectively 4%, hence the interquartile range is 9%.
A model building procedure was performed to identify joint associations between
prognostic factors and disease-free survival. In this, the prognostic factors gender,
age, BMI, ASA co-morbidity score, cStage, cT4 and level of the tumor (high, mid or
low) were considered.
A model with main effects for gender, ASA score, BMI and age (with a different slope
before and after the breakpoint of 70 years) was retained. A significant interaction
between gender and BMI was found (p-value = 0.0836), indicating that survival rates
differ for different levels of BMI depending on gender. The hazard ratios (with
corresponding 95% confidence interval and p-value) for the prognostic factors in the
multivariate risk-adjustment model are presented in Table 66. The interpretation of
the hazard ratios in this multivariate model is as in the main report section 3.4.1.
Table 66: Hazard ratio [95% Wald confidence interval] estimate and corresponding p-value from the final multivariate (Firth-corrected) Cox regression model for QCI 1113b [DFS]. For categorical variables, ‘ref.’ indicates the reference level.
Prognostic factor Level Hazard ratio [95% CI] p-value Joint
p-value Age (continuous) 0.99 [0.97, 1.00] 0.12 0.004 Age (+ 70 years) (continuous) 1.07 [1.03, 1.12] 0.002 BMI (continuous) 0.98 [0.94, 1.03] 0.45
0.27 Missing BMI [ ref. = Not missing ] Missing 0.86 [0.24, 3.01] 0.81
Gender [ ref. = Male ] Female 0.14 [0.03, 0.85] 0.03
Gender – BMI interaction [ ref. = Male ] (continuous) 1.06 [1.00, 1.14] 0.07
0.08 Gender - Missing BMI interaction [ ref. = Male, Not missing ] Female, Missing 7.29 [1.17, 45.38] 0.03
ASA score [ ref. = I ]
II 1.11 [0.75, 1.66] 0.002
III-V 2.14 [1.32, 3.45]
Missing 1.15 [0.63, 2.11]
As for QCI 1111 (overall survival), adjusted center effects are estimated from both a
fixed effects outcome regression (i.e. from a Firth-corrected Cox regression model)
and a hierarchical outcome regression (i.e. frailty Cox regression model). The
hierarchical regression method encounters computational problems and does not
provide reliable estimates for the center effects in this instance. Hence, these results
are not further considered.
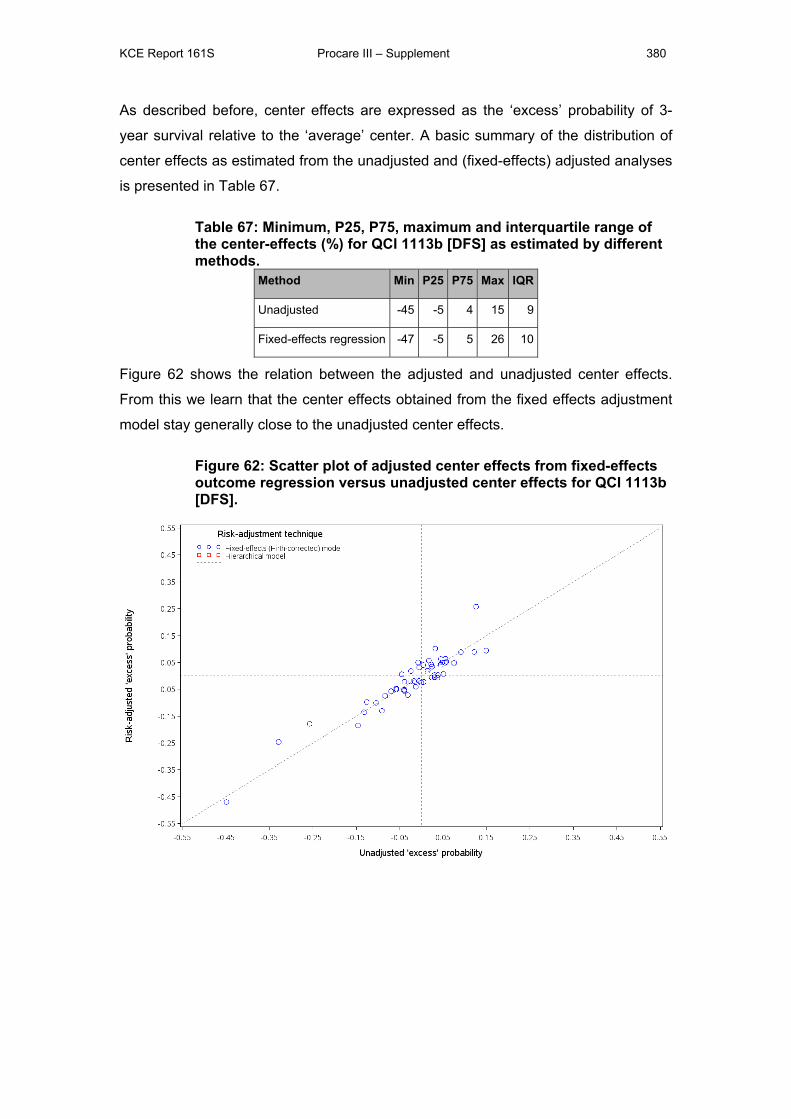
KCE Report 161S Procare III – Supplement 380
As described before, center effects are expressed as the ‘excess’ probability of 3-
year survival relative to the ‘average’ center. A basic summary of the distribution of
center effects as estimated from the unadjusted and (fixed-effects) adjusted analyses
is presented in Table 67.
Table 67: Minimum, P25, P75, maximum and interquartile range of the center-effects (%) for QCI 1113b [DFS] as estimated by different methods.
Method Min P25 P75 Max IQR
Unadjusted -45 -5 4 15 9
Fixed-effects regression -47 -5 5 26 10
Figure 62 shows the relation between the adjusted and unadjusted center effects.
From this we learn that the center effects obtained from the fixed effects adjustment
model stay generally close to the unadjusted center effects.
Figure 62: Scatter plot of adjusted center effects from fixed-effects outcome regression versus unadjusted center effects for QCI 1113b [DFS].
KCE Report 161S Procare III – Supplement 381
2.2 QUALITY INDICATORS RELATED TO DIAGNOSIS AND STAGING
2.2.1 Proportion of patients with a documented distance from the anal verge (QCI 1211, process)
2.2.1.1 Definition N: Number of patients in denominator for whom lower limit of the tumor is known.
D: Number of registered patients.
Note that – probably due to a data management error – there are 10 patients in the
PROCARE database with a missing lower limit of the primary tumor who are said to
have a documented distance from the anal verge. This is not possible and corrected
accordingly.
2.2.1.2 Description Contrary to the definition in PROCARE II, where the denominator was restricted to
patients undergoing resection, currently all patients are eligible for this QCI. Of the
3318 patients in the PROCARE database, 2999 (90%, or 89% unweighted) achieved
the QCI. The proportion of patients that achieved the QCI is shown in Table 19 (per
size-grouped center) and Figure 9 (per participating center, after merging all centers
with less than five eligible patients in one overlapping center) in Section 1. This
proportion ranges from 0% in one of the 69 (merged) centers to 100% in twenty-six of
the (merged) centers. The funnel plot points to systematic variation between the
centers.
2.2.1.3 Univariate associations with prognostic factors We find significant univariate associations between this QCI and ten prognostic
factors, as shown in Table 68. For the prognostic factor ‘age’, the significant
association is not with age itself, but with ‘missingness for age’. The separate
associations of ‘BMI’ and ‘missingness for BMI’ are not significant, but jointly they are
a strong prognostic factor for this QCI. The odds ratios for the ‘missing’ level for the
other prognostic factors in Table 68 demonstrate a strong selection effect of
missingness for these prognostic factors as well.
Table 69 describes the interpretation of the odds ratios obtained from univariate
logistic regression models, such as those for QCI 1211 (Table 68) and all following
QCIs.
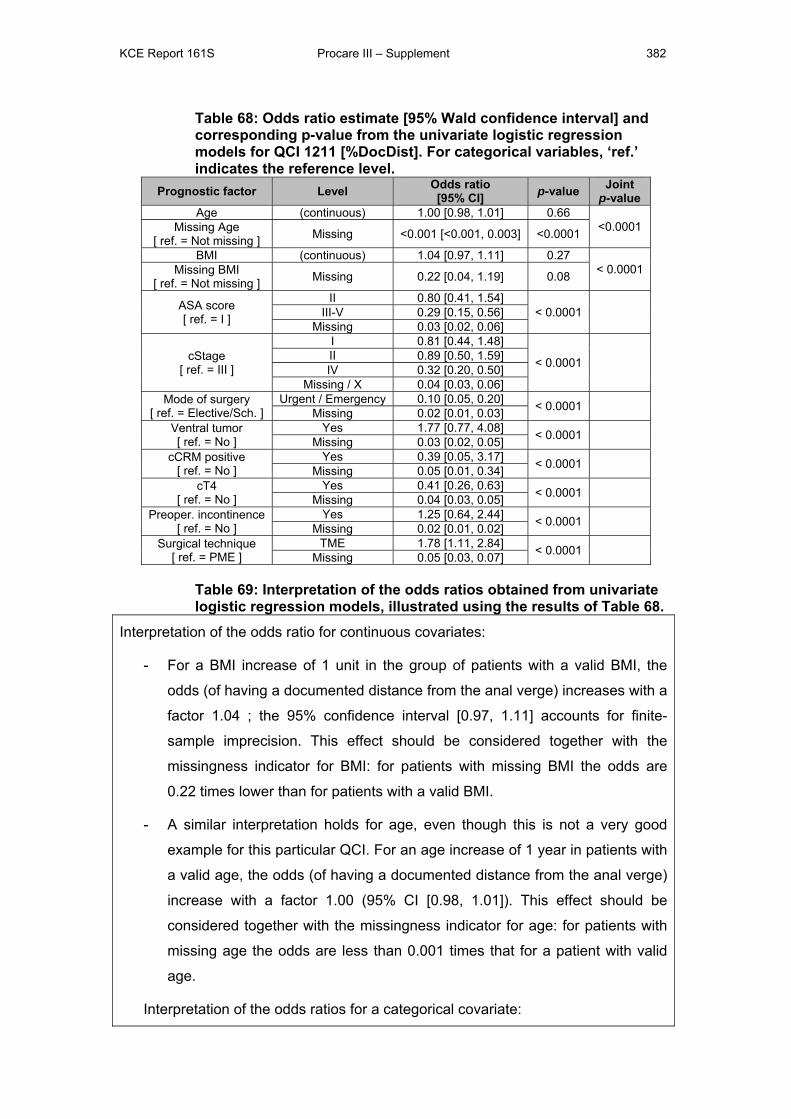
KCE Report 161S Procare III – Supplement 382
Table 68: Odds ratio estimate [95% Wald confidence interval] and corresponding p-value from the univariate logistic regression models for QCI 1211 [%DocDist]. For categorical variables, ‘ref.’ indicates the reference level.
Prognostic factor Level Odds ratio [95% CI] p-value Joint
p-value Age (continuous) 1.00 [0.98, 1.01] 0.66
<0.0001 Missing Age [ ref. = Not missing ] Missing <0.001 [<0.001, 0.003] <0.0001
BMI (continuous) 1.04 [0.97, 1.11] 0.27 < 0.0001 Missing BMI
[ ref. = Not missing ] Missing 0.22 [0.04, 1.19] 0.08
ASA score [ ref. = I ]
II 0.80 [0.41, 1.54] < 0.0001
III-V 0.29 [0.15, 0.56]
Missing 0.03 [0.02, 0.06]
cStage [ ref. = III ]
I 0.81 [0.44, 1.48]
< 0.0001
II 0.89 [0.50, 1.59] IV 0.32 [0.20, 0.50]
Missing / X 0.04 [0.03, 0.06] Mode of surgery
[ ref. = Elective/Sch. ] Urgent / Emergency 0.10 [0.05, 0.20] < 0.0001
Missing 0.02 [0.01, 0.03] Ventral tumor [ ref. = No ]
Yes 1.77 [0.77, 4.08] < 0.0001 Missing 0.03 [0.02, 0.05]
cCRM positive [ ref. = No ]
Yes 0.39 [0.05, 3.17] < 0.0001 Missing 0.05 [0.01, 0.34]
cT4 [ ref. = No ]
Yes 0.41 [0.26, 0.63] < 0.0001 Missing 0.04 [0.03, 0.05]
Preoper. incontinence [ ref. = No ]
Yes 1.25 [0.64, 2.44] < 0.0001 Missing 0.02 [0.01, 0.02]
Surgical technique [ ref. = PME ]
TME 1.78 [1.11, 2.84] < 0.0001 Missing 0.05 [0.03, 0.07]
Table 69: Interpretation of the odds ratios obtained from univariate logistic regression models, illustrated using the results of Table 68.
Interpretation of the odds ratio for continuous covariates:
- For a BMI increase of 1 unit in the group of patients with a valid BMI, the
odds (of having a documented distance from the anal verge) increases with a
factor 1.04 ; the 95% confidence interval [0.97, 1.11] accounts for finite-
sample imprecision. This effect should be considered together with the
missingness indicator for BMI: for patients with missing BMI the odds are
0.22 times lower than for patients with a valid BMI.
- A similar interpretation holds for age, even though this is not a very good
example for this particular QCI. For an age increase of 1 year in patients with
a valid age, the odds (of having a documented distance from the anal verge)
increase with a factor 1.00 (95% CI [0.98, 1.01]). This effect should be
considered together with the missingness indicator for age: for patients with
missing age the odds are less than 0.001 times that for a patient with valid
age.
Interpretation of the odds ratios for a categorical covariate:
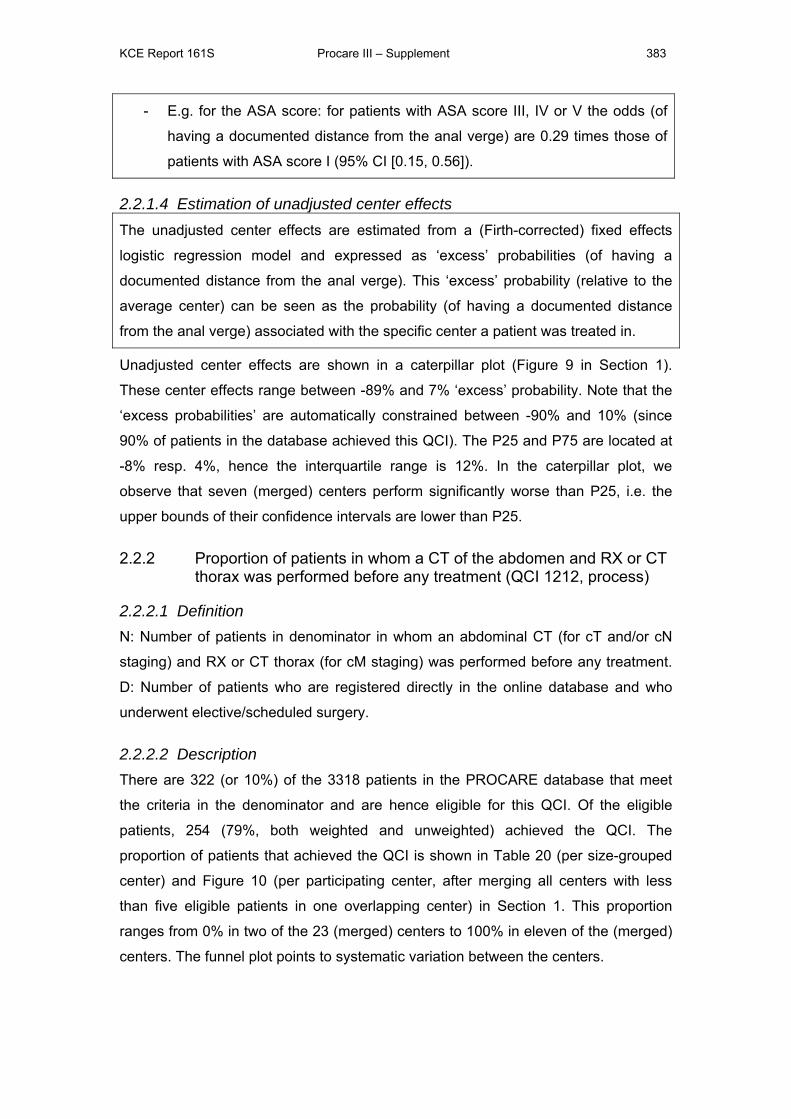
KCE Report 161S Procare III – Supplement 383
- E.g. for the ASA score: for patients with ASA score III, IV or V the odds (of
having a documented distance from the anal verge) are 0.29 times those of
patients with ASA score I (95% CI [0.15, 0.56]).
2.2.1.4 Estimation of unadjusted center effects The unadjusted center effects are estimated from a (Firth-corrected) fixed effects
logistic regression model and expressed as ‘excess’ probabilities (of having a
documented distance from the anal verge). This ‘excess’ probability (relative to the
average center) can be seen as the probability (of having a documented distance
from the anal verge) associated with the specific center a patient was treated in.
Unadjusted center effects are shown in a caterpillar plot (Figure 9 in Section 1).
These center effects range between -89% and 7% ‘excess’ probability. Note that the
‘excess probabilities’ are automatically constrained between -90% and 10% (since
90% of patients in the database achieved this QCI). The P25 and P75 are located at
-8% resp. 4%, hence the interquartile range is 12%. In the caterpillar plot, we
observe that seven (merged) centers perform significantly worse than P25, i.e. the
upper bounds of their confidence intervals are lower than P25.
2.2.2 Proportion of patients in whom a CT of the abdomen and RX or CT thorax was performed before any treatment (QCI 1212, process)
2.2.2.1 Definition N: Number of patients in denominator in whom an abdominal CT (for cT and/or cN
staging) and RX or CT thorax (for cM staging) was performed before any treatment.
D: Number of patients who are registered directly in the online database and who
underwent elective/scheduled surgery.
2.2.2.2 Description There are 322 (or 10%) of the 3318 patients in the PROCARE database that meet
the criteria in the denominator and are hence eligible for this QCI. Of the eligible
patients, 254 (79%, both weighted and unweighted) achieved the QCI. The
proportion of patients that achieved the QCI is shown in Table 20 (per size-grouped
center) and Figure 10 (per participating center, after merging all centers with less
than five eligible patients in one overlapping center) in Section 1. This proportion
ranges from 0% in two of the 23 (merged) centers to 100% in eleven of the (merged)
centers. The funnel plot points to systematic variation between the centers.
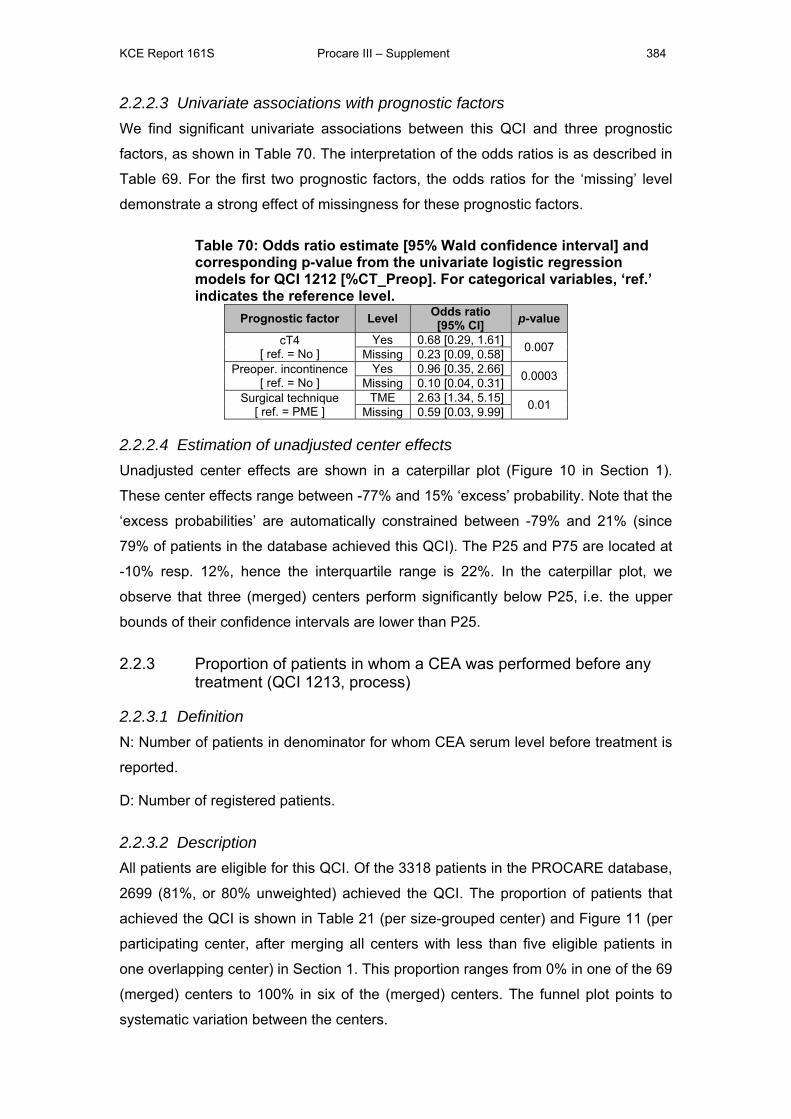
KCE Report 161S Procare III – Supplement 384
2.2.2.3 Univariate associations with prognostic factors We find significant univariate associations between this QCI and three prognostic
factors, as shown in Table 70. The interpretation of the odds ratios is as described in
Table 69. For the first two prognostic factors, the odds ratios for the ‘missing’ level
demonstrate a strong effect of missingness for these prognostic factors.
Table 70: Odds ratio estimate [95% Wald confidence interval] and corresponding p-value from the univariate logistic regression models for QCI 1212 [%CT_Preop]. For categorical variables, ‘ref.’ indicates the reference level.
Prognostic factor Level Odds ratio [95% CI] p-value
cT4 [ ref. = No ]
Yes 0.68 [0.29, 1.61] 0.007 Missing 0.23 [0.09, 0.58] Preoper. incontinence
[ ref. = No ] Yes 0.96 [0.35, 2.66] 0.0003 Missing 0.10 [0.04, 0.31]
Surgical technique [ ref. = PME ]
TME 2.63 [1.34, 5.15] 0.01 Missing 0.59 [0.03, 9.99]
2.2.2.4 Estimation of unadjusted center effects Unadjusted center effects are shown in a caterpillar plot (Figure 10 in Section 1).
These center effects range between -77% and 15% ‘excess’ probability. Note that the
‘excess probabilities’ are automatically constrained between -79% and 21% (since
79% of patients in the database achieved this QCI). The P25 and P75 are located at
-10% resp. 12%, hence the interquartile range is 22%. In the caterpillar plot, we
observe that three (merged) centers perform significantly below P25, i.e. the upper
bounds of their confidence intervals are lower than P25.
2.2.3 Proportion of patients in whom a CEA was performed before any treatment (QCI 1213, process)
2.2.3.1 Definition N: Number of patients in denominator for whom CEA serum level before treatment is
reported.
D: Number of registered patients.
2.2.3.2 Description All patients are eligible for this QCI. Of the 3318 patients in the PROCARE database,
2699 (81%, or 80% unweighted) achieved the QCI. The proportion of patients that
achieved the QCI is shown in Table 21 (per size-grouped center) and Figure 11 (per
participating center, after merging all centers with less than five eligible patients in
one overlapping center) in Section 1. This proportion ranges from 0% in one of the 69
(merged) centers to 100% in six of the (merged) centers. The funnel plot points to
systematic variation between the centers.
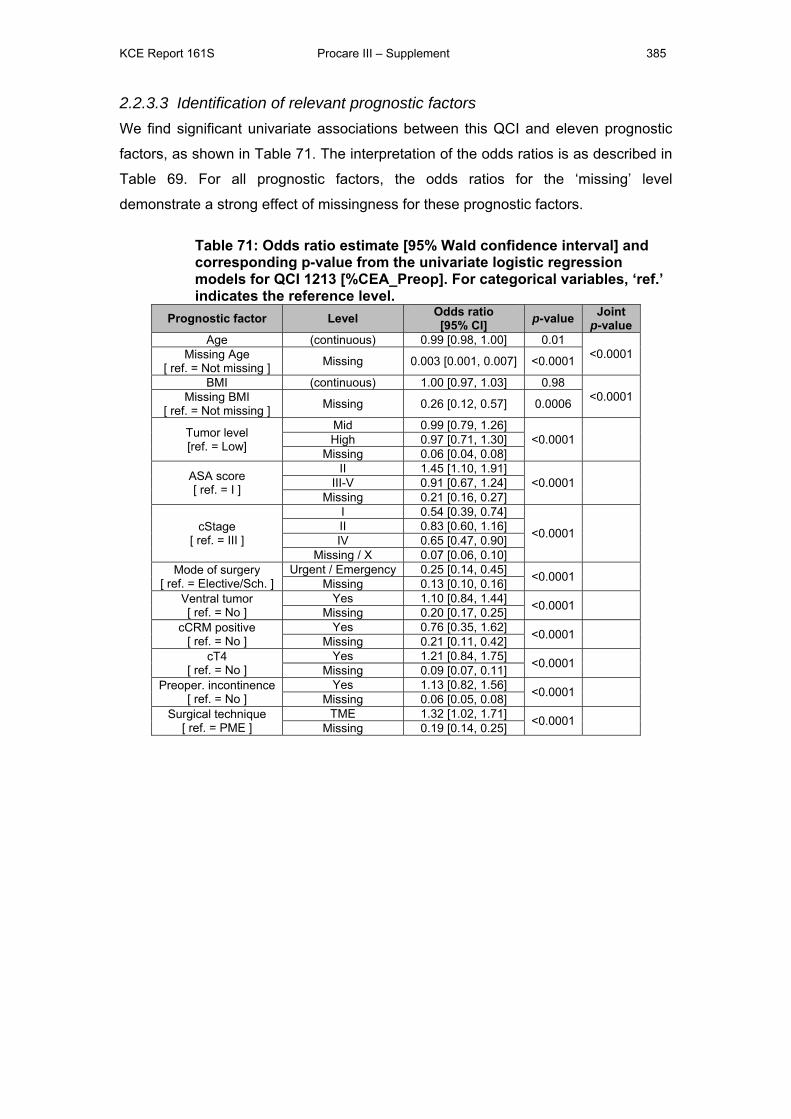
KCE Report 161S Procare III – Supplement 385
2.2.3.3 Identification of relevant prognostic factors We find significant univariate associations between this QCI and eleven prognostic
factors, as shown in Table 71. The interpretation of the odds ratios is as described in
Table 69. For all prognostic factors, the odds ratios for the ‘missing’ level
demonstrate a strong effect of missingness for these prognostic factors.
Table 71: Odds ratio estimate [95% Wald confidence interval] and corresponding p-value from the univariate logistic regression models for QCI 1213 [%CEA_Preop]. For categorical variables, ‘ref.’ indicates the reference level.
Prognostic factor Level Odds ratio [95% CI] p-value Joint
p-value Age (continuous) 0.99 [0.98, 1.00] 0.01
<0.0001 Missing Age [ ref. = Not missing ] Missing 0.003 [0.001, 0.007] <0.0001
BMI (continuous) 1.00 [0.97, 1.03] 0.98 <0.0001 Missing BMI
[ ref. = Not missing ] Missing 0.26 [0.12, 0.57] 0.0006
Tumor level [ref. = Low]
Mid 0.99 [0.79, 1.26] <0.0001
High 0.97 [0.71, 1.30]
Missing 0.06 [0.04, 0.08]
ASA score [ ref. = I ]
II 1.45 [1.10, 1.91] <0.0001
III-V 0.91 [0.67, 1.24]
Missing 0.21 [0.16, 0.27]
cStage [ ref. = III ]
I 0.54 [0.39, 0.74]
<0.0001
II 0.83 [0.60, 1.16] IV 0.65 [0.47, 0.90]
Missing / X 0.07 [0.06, 0.10] Mode of surgery
[ ref. = Elective/Sch. ] Urgent / Emergency 0.25 [0.14, 0.45] <0.0001
Missing 0.13 [0.10, 0.16] Ventral tumor [ ref. = No ]
Yes 1.10 [0.84, 1.44] <0.0001 Missing 0.20 [0.17, 0.25]
cCRM positive [ ref. = No ]
Yes 0.76 [0.35, 1.62] <0.0001 Missing 0.21 [0.11, 0.42]
cT4 [ ref. = No ]
Yes 1.21 [0.84, 1.75] <0.0001 Missing 0.09 [0.07, 0.11]
Preoper. incontinence [ ref. = No ]
Yes 1.13 [0.82, 1.56] <0.0001 Missing 0.06 [0.05, 0.08]
Surgical technique [ ref. = PME ]
TME 1.32 [1.02, 1.71] <0.0001 Missing 0.19 [0.14, 0.25]
KCE Report 161S Procare III – Supplement 386
2.2.3.4 Estimation of unadjusted center effects Unadjusted center effects are shown in a caterpillar plot (Figure 11 in Section 1).
These center effects range between -79% and 15% ‘excess’ probability. Note that the
‘excess probabilities’ are automatically constrained between -81% and 19% (since
81% of patients in the database achieved this QCI). The P25 and P75 are located at
-10% resp. 8%, hence the interquartile range is 18%. In the caterpillar plot, we
observe that eight (merged) centers perform significantly below P25, i.e. the upper
bounds of their confidence intervals are lower than P25. We also observe that three
(merged) centers perform significantly above P75, i.e. the lower bounds of their
confidence intervals are higher than P75.
2.2.4 Proportion of patients undergoing elective surgery that had preoperative complete large bowel-imaging (QCI 1214, process)
2.2.4.1 Definition N: Number of patients in denominator who underwent a total colonoscopy or a
complete double contrast enema or virtual colonoscopy.
D: Number of patients treated with elective or scheduled surgery.
2.2.4.2 Description There are 2811 (or 85%) of the 3318 patients in the PROCARE database who meet
the criteria in the denominator and are hence eligible for this QCI. Of the eligible
patients, 2764 (98%, both weighted and unweighted) achieved the QCI. The
proportion of patients that achieved the QCI is shown in Table 22 (per size-grouped
center) and Figure 12 (per participating center, after merging all centers with less
than five eligible patients in one overlapping center) in Section 1. This proportion
ranges from 87% in one of the 68 (merged) centers to 100% in forty-eight of the
(merged) centers. The funnel plot points to systematic variation between the centers.
2.2.4.3 Identification of relevant prognostic factors We find significant univariate associations between this QCI and eight prognostic
factors, as shown in Table 72. The interpretation of the odds ratios is as described in
Table 69. For most prognostic factors, the odds ratios for the ‘missing’ level
demonstrate a strong effect of missingness for these prognostic factors.
KCE Report 161S Procare III – Supplement 387
Table 72: Odds ratio estimate [95% Wald confidence interval] and corresponding p-value from the univariate logistic regression models for QCI 1214 [%Preop_Bowel_Im]. For categorical variables, ‘ref.’ indicates the reference level. Prognostic factor Level Odds ratio
[95% CI] p-value Joint p-value
Age (continuous) 1.00 [0.98, 1.03] 0.99 0.02 Missing Age
[ ref. = Not missing ] Missing 0.02 [<0.001, 0.42] 0.01
BMI (continuous) 1.04 [0.96, 1.14] 0.34 0.07 Missing BMI
[ ref. = Not missing ] Missing 1.57 [0.16, 15.51] 0.70
Tumor level [ref. = Low]
Mid 0.93 [0.47, 1.83] 0.0004
High 0.97 [0.40, 2.36]
Missing 0.14 [0.05, 0.37]
ASA score [ ref. = I ]
II 0.32 [0.12, 0.85] 0.08
III-V 0.30 [0.11, 0.87]
Missing 0.65 [0.16, 2.75]
cStage [ ref. = III ]
I 1.82 [0.41, 8.00]
<0.0001
II 0.79 [0.31, 2.05] IV 0.36 [0.16, 0.83]
Missing / X 0.17 [0.08, 0.35] Ventral tumor [ ref. = No ]
Yes 1.16 [0.56, 2.44] 0.06 Missing 0.47 [0.23, 0.94]
cT4 [ ref. = No ]
Yes 0.81 [0.28, 2.33] <0.0001 Missing 0.13 [0.07, 0.25]
Preoper. incontinence [ ref. = No ]
Yes 1.79 [0.42, 7.63] <0.0001 Missing 0.03 [0.01, 0.05]
2.2.4.4 Estimation of unadjusted center effects Unadjusted center effects are shown in a caterpillar plot (Figure 12 in Section 1).
These center effects range between -12% and 2% ‘excess’ probability. Note that the
‘excess probabilities’ are automatically constrained between -98% and 2% (since
98% of patients in the database achieved this QCI). The P25 and P75 are located at
-3% resp. 1%, hence the interquartile range is 4%. In the caterpillar plot, we observe
that there are no (merged) centers that perform significantly below P25 or above
P75.
2.2.5 Use of TRUS in cT1/cT2 (new QCI 1214b, process)
2.2.5.1 Definition N: Number of patients in denominator in whom cT was based on TRUS.
D: Number of patients with cT1 or cT2 rectal cancer, who underwent
elective/scheduled surgery and are registered directly in the online database.
KCE Report 161S Procare III – Supplement 388
2.2.5.2 Description There are 74 (or 2%) of the 3318 patients in the PROCARE database who meet the
criteria in the denominator and are hence eligible for this QCI. Of the eligible patients,
61 (82%, or 81% unweighted) achieved the QCI. The proportion of patients that
achieved the QCI is shown in Table 23 (per size-grouped center) and Figure 13 (per
participating center, after merging all centers with less than five eligible patients in
one overlapping center) in Section 1. This proportion ranges from 50% in one of the 5
(merged) centers to 100% in two of the (merged) centers. The funnel plot does not
point to systematic variation between the centers.
2.2.5.3 Identification of relevant prognostic factors We find significant univariate association between this QCI and one prognostic
factor, as shown in Table 73. The interpretation of the odds ratio is as described in
Table 69. Note that while there is no association with BMI itself, the odds ratio for
‘missing BMI’ demonstrates a strong effect of missingness for the BMI covariate.
Table 73: Odds ratio estimate [95% Wald confidence interval] and corresponding p-value from the univariate logistic regression models for QCI 1214b [%TRUS_cT12]. For categorical variables, ‘ref.’ indicates the reference level.
Prognostic factor Level Odds ratio [95% CI] p-value
Missing BMI [ ref. = Not missing ] Missing 0.31 [0.09, 1.04] 0.06
2.2.5.4 Estimation of unadjusted center effects Unadjusted center effects are shown in a caterpillar plot (Figure 13 in Section 1).
These center effects range between -33% and 13% ‘excess’ probability. Note that the
‘excess probabilities’ are automatically constrained between -82% and 18% (since
82% of patients in the database achieved this QCI). The P25 and P75 are located at
-15% resp. 10%, hence the interquartile range is 25%. In the caterpillar plot, we
observe that there are no (merged) centers that perform significantly below P25 or
above P75.
2.2.6 Use of MRI in cStage II or III (new QCI 1214c, process)
2.2.6.1 Definition N: Number of patients in denominator in whom cStaging was based on MRI.
D: Number of patients with cStage II or III rectal cancer based on any imaging
technique, who underwent elective/scheduled surgery and are registered directly in
the online database.
KCE Report 161S Procare III – Supplement 389
2.2.6.2 Description There are 103 (or 3%) of the 3318 patients in the PROCARE database who meet the
criteria in the denominator and are hence eligible for this QCI. Of the eligible patients,
94 (91%, or 89% unweighted) have achieved the QCI. The proportion of patients that
achieved the QCI is shown in Table 24 (per size-grouped center) and Figure 14 (per
participating center, after merging all centers with less than five eligible patients in
one overlapping center) in Section 1. This proportion ranges from 57% in one of the
10 (merged) centers to 100% in four (merged) centers. The funnel plot does not point
to systematic variation between the centers.
2.2.6.3 Identification of relevant prognostic factors We find significant univariate association between this QCI and one prognostic
factor, as shown in Table 74. The interpretation of the odds ratio is as described in
Table 69. Note that only two levels of cStage are considered, as a consequence of
the QCI definition.
Table 74: Odds ratio estimate [95% Wald confidence interval] and corresponding p-value from the univariate logistic regression models for QCI 1214c [%MR_cII/III]. For categorical variables, ‘ref.’ indicates the reference level.
Prognostic factor Level Odds ratio [95% CI]
p-value
cStage
[ ref. = III ] II 0.27 [0.06, 1.21] 0.09
2.2.6.4 Estimation of unadjusted center effects Unadjusted center effects are shown in a caterpillar plot (Figure 14 in Section 1).
These center effects range between -32% and 8% ‘excess’ probability. Note that the
‘excess probabilities’ are automatically constrained between -91% and 9% (since
91% of patients in the database achieved this QCI). The P25 and P75 are located at
-13% resp. 6%, hence the interquartile range is 19%. In the caterpillar plot, we
observe that there are no (merged) centers that perform significantly below P25 or
above P75.
KCE Report 161S Procare III – Supplement 390
2.2.7 Proportion of patients in whom a TRUS and pelvic CT and/or pelvic MRI was performed before any treatment (QCI 1215, process)
2.2.7.1 Definition N: Number of patients in whom cT or cN were based on TRUS and at least one of
the two following: pelvic CT and/or pelvic MRI.
D: Number of patients with rectal cancer of any stage and registered directly in the
online database.
2.2.7.2 Description There are 435 (or 13%) of the 3318 patients in the PROCARE database who meet
the criteria in the denominator and are hence eligible for this QCI. Of the eligible
patients, 264 (61%, or 57% unweighted) achieved the QCI. The proportion of patients
that achieved the QCI is shown in Table 25 (per size-grouped center) and Figure 15
(per participating center, after merging all centers with less than five eligible patients
in one overlapping center) in Section 1. This proportion ranges from 0% in three of
the 26 (merged) centers to 100% in two (merged) centers. The funnel plot points to
systematic variation between the centers.
2.2.7.3 Identification of relevant prognostic factors We find significant univariate associations between this QCI and ten prognostic
factors, as shown in Table 75. The interpretation of the odds ratios is as described in
Table 69. For all prognostic factors, the odds ratios for the ‘missing’ level
demonstrate a strong effect of missingness for these prognostic factors.
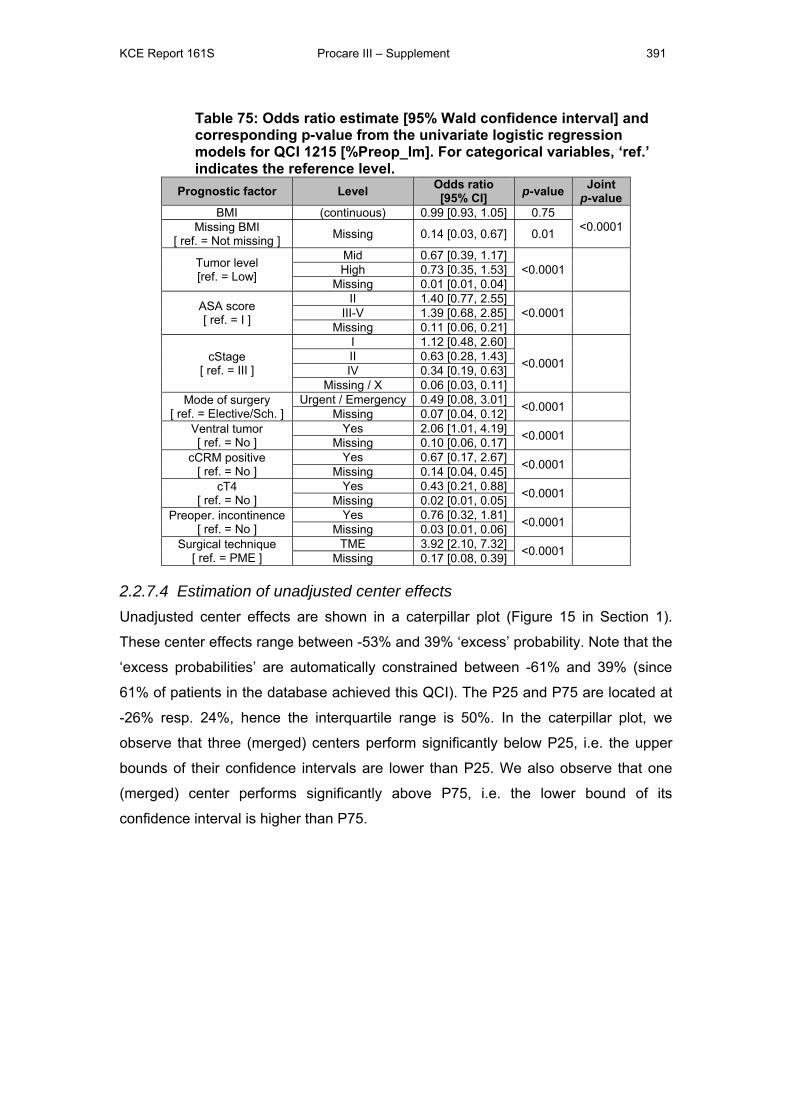
KCE Report 161S Procare III – Supplement 391
Table 75: Odds ratio estimate [95% Wald confidence interval] and corresponding p-value from the univariate logistic regression models for QCI 1215 [%Preop_Im]. For categorical variables, ‘ref.’ indicates the reference level.
Prognostic factor Level Odds ratio [95% CI] p-value Joint
p-value BMI (continuous) 0.99 [0.93, 1.05] 0.75
<0.0001 Missing BMI [ ref. = Not missing ] Missing 0.14 [0.03, 0.67] 0.01
Tumor level [ref. = Low]
Mid 0.67 [0.39, 1.17] <0.0001
High 0.73 [0.35, 1.53]
Missing 0.01 [0.01, 0.04]
ASA score [ ref. = I ]
II 1.40 [0.77, 2.55] <0.0001
III-V 1.39 [0.68, 2.85]
Missing 0.11 [0.06, 0.21]
cStage [ ref. = III ]
I 1.12 [0.48, 2.60]
<0.0001
II 0.63 [0.28, 1.43] IV 0.34 [0.19, 0.63]
Missing / X 0.06 [0.03, 0.11] Mode of surgery
[ ref. = Elective/Sch. ] Urgent / Emergency 0.49 [0.08, 3.01] <0.0001
Missing 0.07 [0.04, 0.12] Ventral tumor [ ref. = No ]
Yes 2.06 [1.01, 4.19] <0.0001 Missing 0.10 [0.06, 0.17]
cCRM positive [ ref. = No ]
Yes 0.67 [0.17, 2.67] <0.0001 Missing 0.14 [0.04, 0.45]
cT4 [ ref. = No ]
Yes 0.43 [0.21, 0.88] <0.0001 Missing 0.02 [0.01, 0.05]
Preoper. incontinence [ ref. = No ]
Yes 0.76 [0.32, 1.81] <0.0001 Missing 0.03 [0.01, 0.06]
Surgical technique [ ref. = PME ]
TME 3.92 [2.10, 7.32] <0.0001 Missing 0.17 [0.08, 0.39]
2.2.7.4 Estimation of unadjusted center effects Unadjusted center effects are shown in a caterpillar plot (Figure 15 in Section 1).
These center effects range between -53% and 39% ‘excess’ probability. Note that the
‘excess probabilities’ are automatically constrained between -61% and 39% (since
61% of patients in the database achieved this QCI). The P25 and P75 are located at
-26% resp. 24%, hence the interquartile range is 50%. In the caterpillar plot, we
observe that three (merged) centers perform significantly below P25, i.e. the upper
bounds of their confidence intervals are lower than P25. We also observe that one
(merged) center performs significantly above P75, i.e. the lower bound of its
confidence interval is higher than P75.
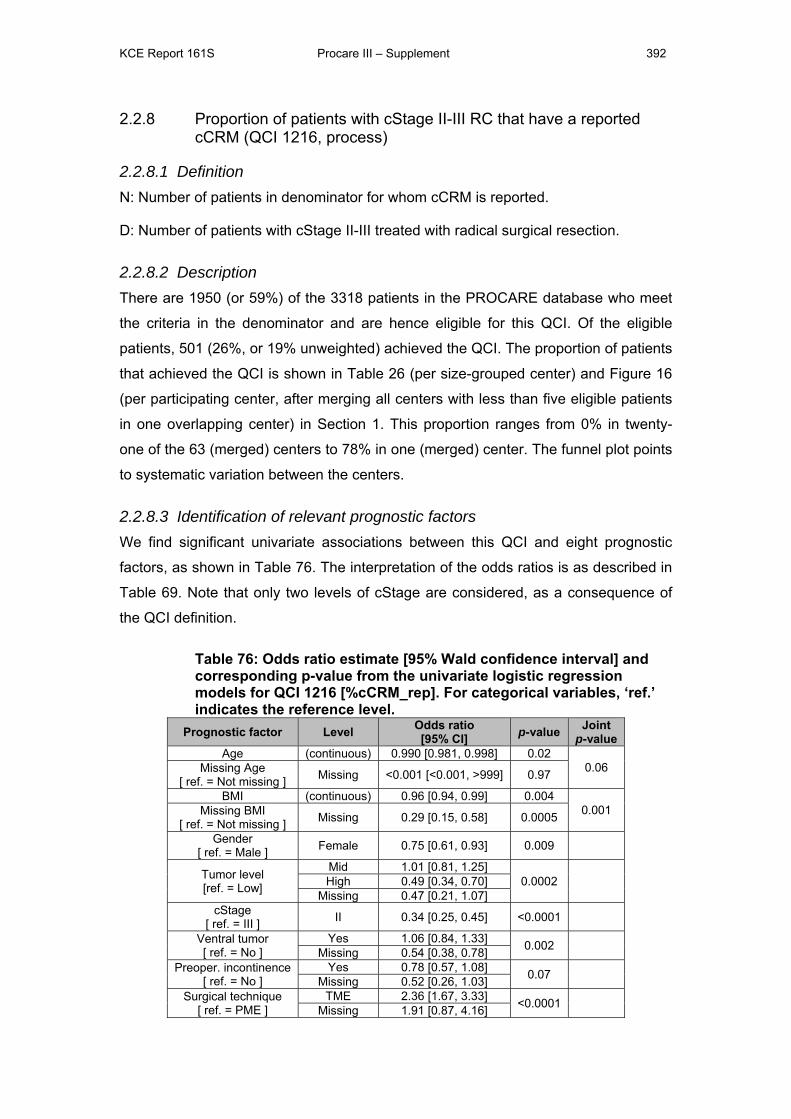
KCE Report 161S Procare III – Supplement 392
2.2.8 Proportion of patients with cStage II-III RC that have a reported cCRM (QCI 1216, process)
2.2.8.1 Definition N: Number of patients in denominator for whom cCRM is reported.
D: Number of patients with cStage II-III treated with radical surgical resection.
2.2.8.2 Description There are 1950 (or 59%) of the 3318 patients in the PROCARE database who meet
the criteria in the denominator and are hence eligible for this QCI. Of the eligible
patients, 501 (26%, or 19% unweighted) achieved the QCI. The proportion of patients
that achieved the QCI is shown in Table 26 (per size-grouped center) and Figure 16
(per participating center, after merging all centers with less than five eligible patients
in one overlapping center) in Section 1. This proportion ranges from 0% in twenty-
one of the 63 (merged) centers to 78% in one (merged) center. The funnel plot points
to systematic variation between the centers.
2.2.8.3 Identification of relevant prognostic factors We find significant univariate associations between this QCI and eight prognostic
factors, as shown in Table 76. The interpretation of the odds ratios is as described in
Table 69. Note that only two levels of cStage are considered, as a consequence of
the QCI definition.
Table 76: Odds ratio estimate [95% Wald confidence interval] and corresponding p-value from the univariate logistic regression models for QCI 1216 [%cCRM_rep]. For categorical variables, ‘ref.’ indicates the reference level.
Prognostic factor Level Odds ratio [95% CI] p-value Joint
p-value Age (continuous) 0.990 [0.981, 0.998] 0.02
0.06 Missing Age [ ref. = Not missing ] Missing <0.001 [<0.001, >999] 0.97
BMI (continuous) 0.96 [0.94, 0.99] 0.004 0.001 Missing BMI
[ ref. = Not missing ] Missing 0.29 [0.15, 0.58] 0.0005
Gender [ ref. = Male ] Female 0.75 [0.61, 0.93] 0.009
Tumor level [ref. = Low]
Mid 1.01 [0.81, 1.25] 0.0002
High 0.49 [0.34, 0.70]
Missing 0.47 [0.21, 1.07] cStage
[ ref. = III ] II 0.34 [0.25, 0.45] <0.0001
Ventral tumor [ ref. = No ]
Yes 1.06 [0.84, 1.33] 0.002 Missing 0.54 [0.38, 0.78]
Preoper. incontinence [ ref. = No ]
Yes 0.78 [0.57, 1.08] 0.07 Missing 0.52 [0.26, 1.03]
Surgical technique [ ref. = PME ]
TME 2.36 [1.67, 3.33] <0.0001 Missing 1.91 [0.87, 4.16]
KCE Report 161S Procare III – Supplement 393
2.2.8.4 Estimation of unadjusted center effects Unadjusted center effects are shown in a caterpillar plot (Figure 16 in Section 1).
These center effects range between -12% and 64% ‘excess’ probability. Note that the
‘excess probabilities’ are automatically constrained between -26% and 74% (since
26% of patients in the database achieved this QCI). The P25 and P75 are located at
-8% resp. 21%, hence the interquartile range is 29%. In the caterpillar plot, we
observe that five (merged) centers perform significantly above P75, i.e. the lower
bounds of their confidence intervals are higher than P75.
2.2.9 Accuracy of cM0 staging (new QCI 1216b, process)
2.2.9.1 Definition N: Patients in denominator in whom no distant metastatic disease was diagnosed
within 6 months following the date of first treatment (any type).
D: All patients with cStage I-III (as determined during staging and/or surgery) and for
whom a 1 year follow-up is available.
2.2.9.2 Description There are 634 (or 19%) of the 3318 patients in the PROCARE database who meet
the criteria in the denominator and are hence eligible for this QCI. Of the eligible
patients, 35 (6%, or 5% unweighted) achieved the QCI. The proportion of patients
that achieved the QCI is shown in Table 27 (per size-grouped center) and Figure 17
(per participating center, after merging all centers with less than five eligible patients
in one overlapping center) in Section 1. This proportion ranges from 0% in eighteen
(merged) centers to 32% in one (merged) center. The funnel plot does not point to
systematic variation between the centers.
2.2.9.3 Identification of relevant prognostic factors We find significant univariate associations between this QCI and six prognostic
factors, as shown in Table 77. The interpretation of the odds ratios is as described in
Table 69. For the prognostic factors BMI, ASA score, ventral tumor and surgical
technique, the odds ratios for the ‘missing’ level demonstrate a strong effect of
missingness for these prognostic factors. Note that only three levels of cStage are
considered, as a consequence of the QCI definition

KCE Report 161S Procare III – Supplement 394
Table 77: Odds ratio estimate [95% Wald confidence interval] and corresponding p-value from the univariate logistic regression models for QCI 1216b [cM0_Acc]. For categorical variables, ‘ref.’ indicates the reference level.
Prognostic factor Level Odds ratio [95% CI] p-value
Age [ ref. = < 70 years ] 70+ years 0.51 [0.23, 1.12] 0.09
Missing BMI [ ref. = Not missing ] Missing 2.06 [1.00, 4.26] 0.05
ASA score [ ref. = I ]
II 1.04 [0.42, 2.57] 0.05 III-V 0.51 [0.13, 2.02]
Missing 2.88 [0.99, 8.34] cStage
[ ref. = III ] I 2.59 [1.16, 5.78] 0.06 II 1.13 [0.44, 2.89]
Ventral tumor [ ref. = No ]
Yes 1.36 [0.62, 2.98] 0.08 Missing 2.78 [1.14, 6.75] Surgical technique
[ ref. = PME ] TME 1.42 [0.49, 4.15] 0.01 Missing 7.85 [1.75, 35.2]
2.2.9.4 Estimation of unadjusted center effects Unadjusted center effects are shown in a caterpillar plot (Figure 17 in Section 1).
These center effects range between -5% and 26% ‘excess’ probability. Note that the
‘excess probabilities’ are automatically constrained between -6% and 94% (since 6%
of patients in the database achieved this QCI). The P25 and P75 are located at -2%
resp. 4%, hence the interquartile range is 6%. In the caterpillar plot, we observe that
one (merged) center performs significantly above P75, i.e. the lower bound of its
confidence interval is higher than P75.
2.2.10 Time between first histopathological examination and first treatment (QCI 1217, process)
2.2.10.1 Definition The time interval in days is computed between the date of pathologic diagnosis, if
available, otherwise the date of first contact/hospitalization, and the date of first
treatment.
D: All patients who underwent treatment (surgery and/or radiotherapy and/or
chemotherapy) and for whom the date of biopsy or date of first consultation and the
date of first treatment is known.
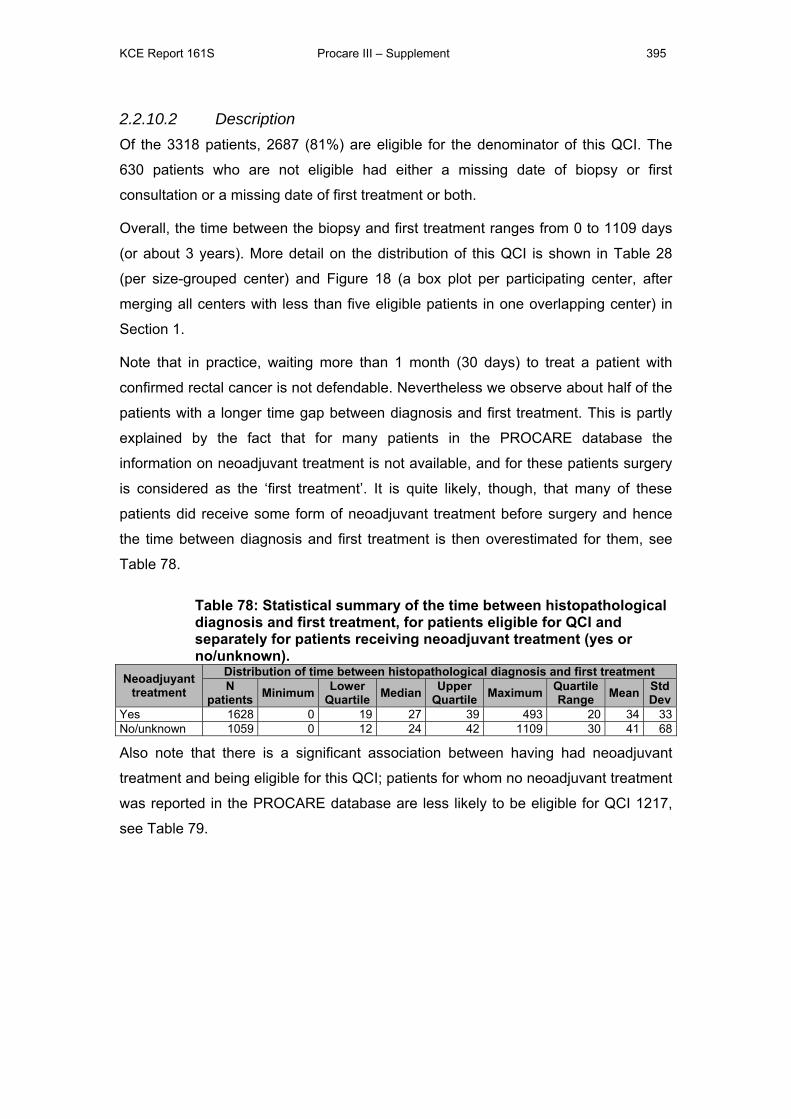
KCE Report 161S Procare III – Supplement 395
2.2.10.2 Description Of the 3318 patients, 2687 (81%) are eligible for the denominator of this QCI. The
630 patients who are not eligible had either a missing date of biopsy or first
consultation or a missing date of first treatment or both.
Overall, the time between the biopsy and first treatment ranges from 0 to 1109 days
(or about 3 years). More detail on the distribution of this QCI is shown in Table 28
(per size-grouped center) and Figure 18 (a box plot per participating center, after
merging all centers with less than five eligible patients in one overlapping center) in
Section 1.
Note that in practice, waiting more than 1 month (30 days) to treat a patient with
confirmed rectal cancer is not defendable. Nevertheless we observe about half of the
patients with a longer time gap between diagnosis and first treatment. This is partly
explained by the fact that for many patients in the PROCARE database the
information on neoadjuvant treatment is not available, and for these patients surgery
is considered as the ‘first treatment’. It is quite likely, though, that many of these
patients did receive some form of neoadjuvant treatment before surgery and hence
the time between diagnosis and first treatment is then overestimated for them, see
Table 78.
Table 78: Statistical summary of the time between histopathological diagnosis and first treatment, for patients eligible for QCI and separately for patients receiving neoadjuvant treatment (yes or no/unknown).
Neoadjuyant treatment
Distribution of time between histopathological diagnosis and first treatmentN
patients Minimum Lower Quartile Median Upper
Quartile Maximum Quartile Range Mean Std
DevYes 1628 0 19 27 39 493 20 34 33No/unknown 1059 0 12 24 42 1109 30 41 68
Also note that there is a significant association between having had neoadjuvant
treatment and being eligible for this QCI; patients for whom no neoadjuvant treatment
was reported in the PROCARE database are less likely to be eligible for QCI 1217,
see Table 79.
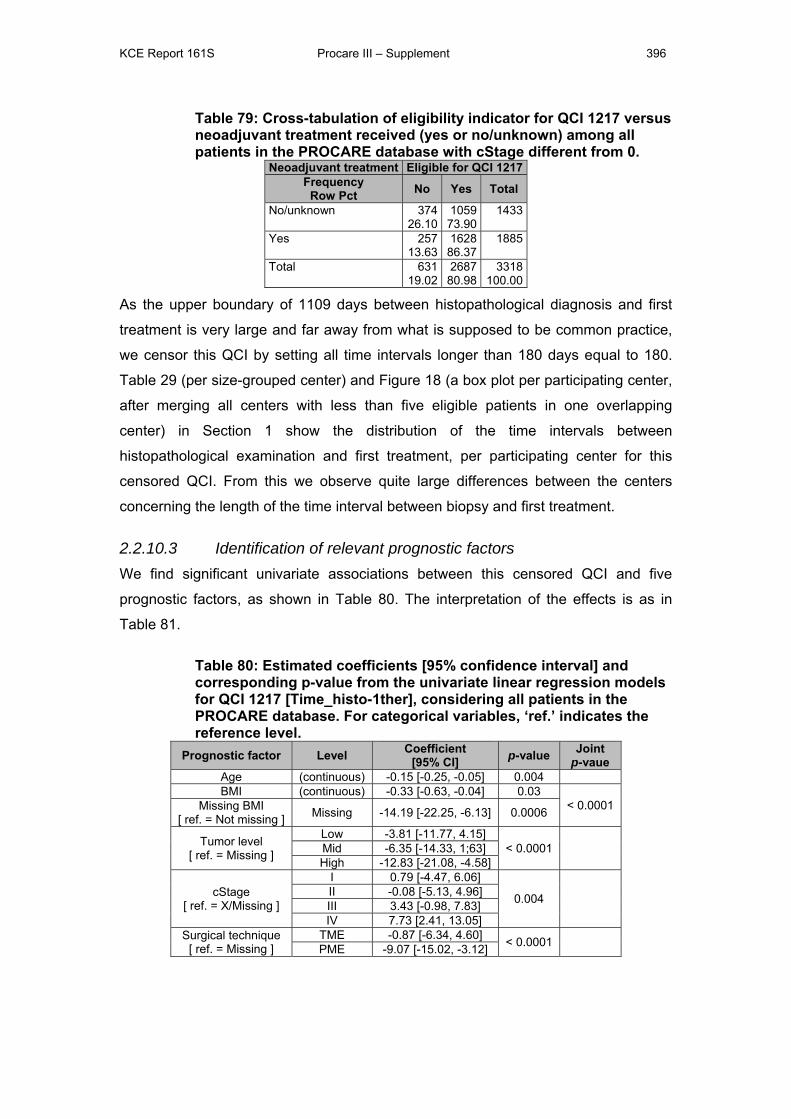
KCE Report 161S Procare III – Supplement 396
Table 79: Cross-tabulation of eligibility indicator for QCI 1217 versus neoadjuvant treatment received (yes or no/unknown) among all patients in the PROCARE database with cStage different from 0.
Neoadjuvant treatment Eligible for QCI 1217Frequency
Row Pct No Yes Total
No/unknown 37426.10
105973.90
1433
Yes 25713.63
162886.37
1885
Total 63119.02
268780.98
3318100.00
As the upper boundary of 1109 days between histopathological diagnosis and first
treatment is very large and far away from what is supposed to be common practice,
we censor this QCI by setting all time intervals longer than 180 days equal to 180.
Table 29 (per size-grouped center) and Figure 18 (a box plot per participating center,
after merging all centers with less than five eligible patients in one overlapping
center) in Section 1 show the distribution of the time intervals between
histopathological examination and first treatment, per participating center for this
censored QCI. From this we observe quite large differences between the centers
concerning the length of the time interval between biopsy and first treatment.
2.2.10.3 Identification of relevant prognostic factors We find significant univariate associations between this censored QCI and five
prognostic factors, as shown in Table 80. The interpretation of the effects is as in
Table 81.
Table 80: Estimated coefficients [95% confidence interval] and corresponding p-value from the univariate linear regression models for QCI 1217 [Time_histo-1ther], considering all patients in the PROCARE database. For categorical variables, ‘ref.’ indicates the reference level.
Prognostic factor Level Coefficient[95% CI] p-value Joint
p-vaue Age (continuous) -0.15 [-0.25, -0.05] 0.004 BMI (continuous) -0.33 [-0.63, -0.04] 0.03
< 0.0001 Missing BMI [ ref. = Not missing ] Missing -14.19 [-22.25, -6.13] 0.0006
Tumor level [ ref. = Missing ]
Low -3.81 [-11.77, 4.15] < 0.0001
Mid -6.35 [-14.33, 1;63] High -12.83 [-21.08, -4.58]
cStage [ ref. = X/Missing ]
I 0.79 [-4.47, 6.06]
0.004
II -0.08 [-5.13, 4.96] III 3.43 [-0.98, 7.83] IV 7.73 [2.41, 13.05]
Surgical technique [ ref. = Missing ]
TME -0.87 [-6.34, 4.60] < 0.0001 PME -9.07 [-15.02, -3.12]
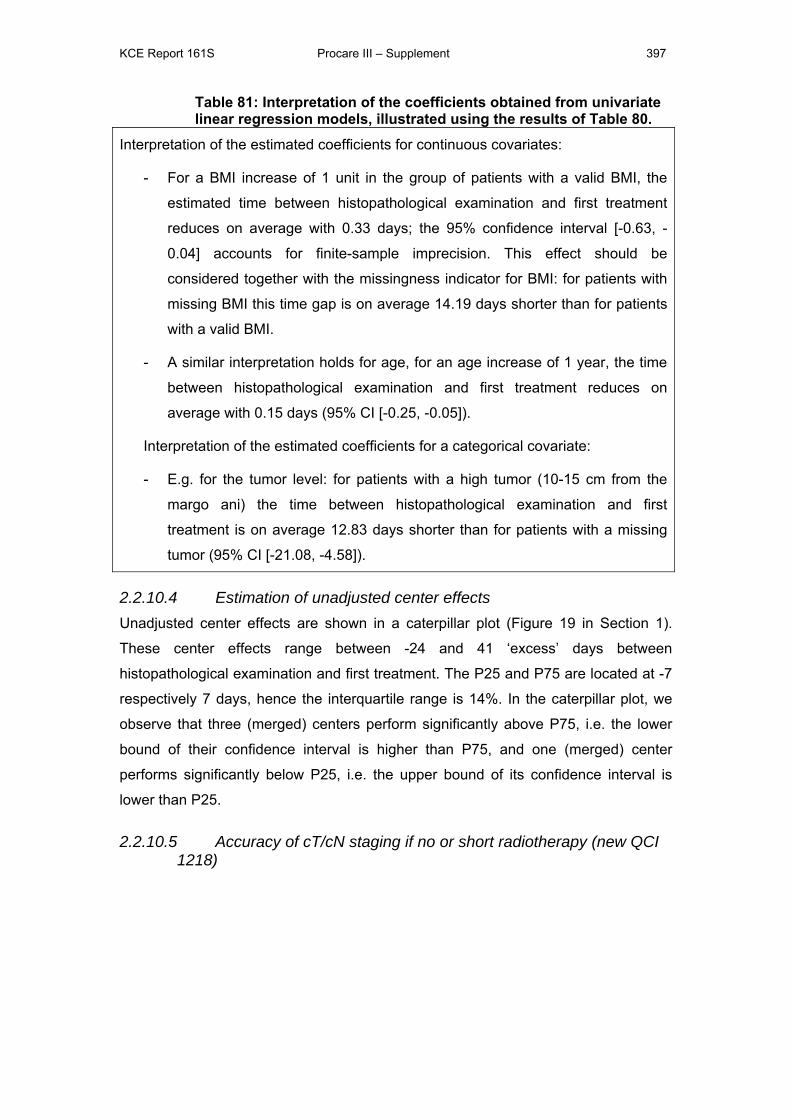
KCE Report 161S Procare III – Supplement 397
Table 81: Interpretation of the coefficients obtained from univariate linear regression models, illustrated using the results of Table 80.
Interpretation of the estimated coefficients for continuous covariates:
- For a BMI increase of 1 unit in the group of patients with a valid BMI, the
estimated time between histopathological examination and first treatment
reduces on average with 0.33 days; the 95% confidence interval [-0.63, -
0.04] accounts for finite-sample imprecision. This effect should be
considered together with the missingness indicator for BMI: for patients with
missing BMI this time gap is on average 14.19 days shorter than for patients
with a valid BMI.
- A similar interpretation holds for age, for an age increase of 1 year, the time
between histopathological examination and first treatment reduces on
average with 0.15 days (95% CI [-0.25, -0.05]).
Interpretation of the estimated coefficients for a categorical covariate:
- E.g. for the tumor level: for patients with a high tumor (10-15 cm from the
margo ani) the time between histopathological examination and first
treatment is on average 12.83 days shorter than for patients with a missing
tumor (95% CI [-21.08, -4.58]).
2.2.10.4 Estimation of unadjusted center effects Unadjusted center effects are shown in a caterpillar plot (Figure 19 in Section 1).
These center effects range between -24 and 41 ‘excess’ days between
histopathological examination and first treatment. The P25 and P75 are located at -7
respectively 7 days, hence the interquartile range is 14%. In the caterpillar plot, we
observe that three (merged) centers perform significantly above P75, i.e. the lower
bound of their confidence interval is higher than P75, and one (merged) center
performs significantly below P25, i.e. the upper bound of its confidence interval is
lower than P25.
2.2.10.5 Accuracy of cT/cN staging if no or short radiotherapy (new QCI 1218)
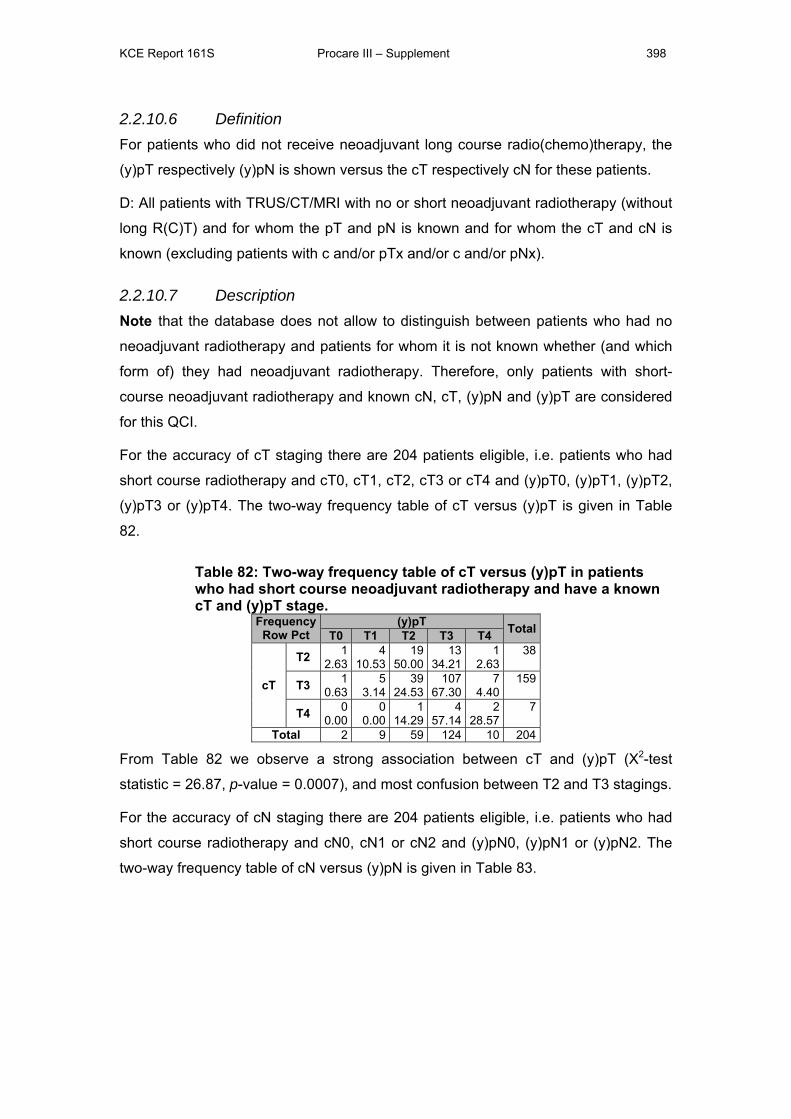
KCE Report 161S Procare III – Supplement 398
2.2.10.6 Definition For patients who did not receive neoadjuvant long course radio(chemo)therapy, the
(y)pT respectively (y)pN is shown versus the cT respectively cN for these patients.
D: All patients with TRUS/CT/MRI with no or short neoadjuvant radiotherapy (without
long R(C)T) and for whom the pT and pN is known and for whom the cT and cN is
known (excluding patients with c and/or pTx and/or c and/or pNx).
2.2.10.7 Description Note that the database does not allow to distinguish between patients who had no
neoadjuvant radiotherapy and patients for whom it is not known whether (and which
form of) they had neoadjuvant radiotherapy. Therefore, only patients with short-
course neoadjuvant radiotherapy and known cN, cT, (y)pN and (y)pT are considered
for this QCI.
For the accuracy of cT staging there are 204 patients eligible, i.e. patients who had
short course radiotherapy and cT0, cT1, cT2, cT3 or cT4 and (y)pT0, (y)pT1, (y)pT2,
(y)pT3 or (y)pT4. The two-way frequency table of cT versus (y)pT is given in Table
82.
Table 82: Two-way frequency table of cT versus (y)pT in patients who had short course neoadjuvant radiotherapy and have a known cT and (y)pT stage.
Frequency Row Pct
(y)pT TotalT0 T1 T2 T3 T4
cT
T2 12.63
410.53
1950.00
1334.21
12.63
38
T3 10.63
53.14
3924.53
10767.30
74.40
159
T4 00.00
00.00
114.29
457.14
228.57
7
Total 2 9 59 124 10 204
From Table 82 we observe a strong association between cT and (y)pT (Χ2-test
statistic = 26.87, p-value = 0.0007), and most confusion between T2 and T3 stagings.
For the accuracy of cN staging there are 204 patients eligible, i.e. patients who had
short course radiotherapy and cN0, cN1 or cN2 and (y)pN0, (y)pN1 or (y)pN2. The
two-way frequency table of cN versus (y)pN is given in Table 83.
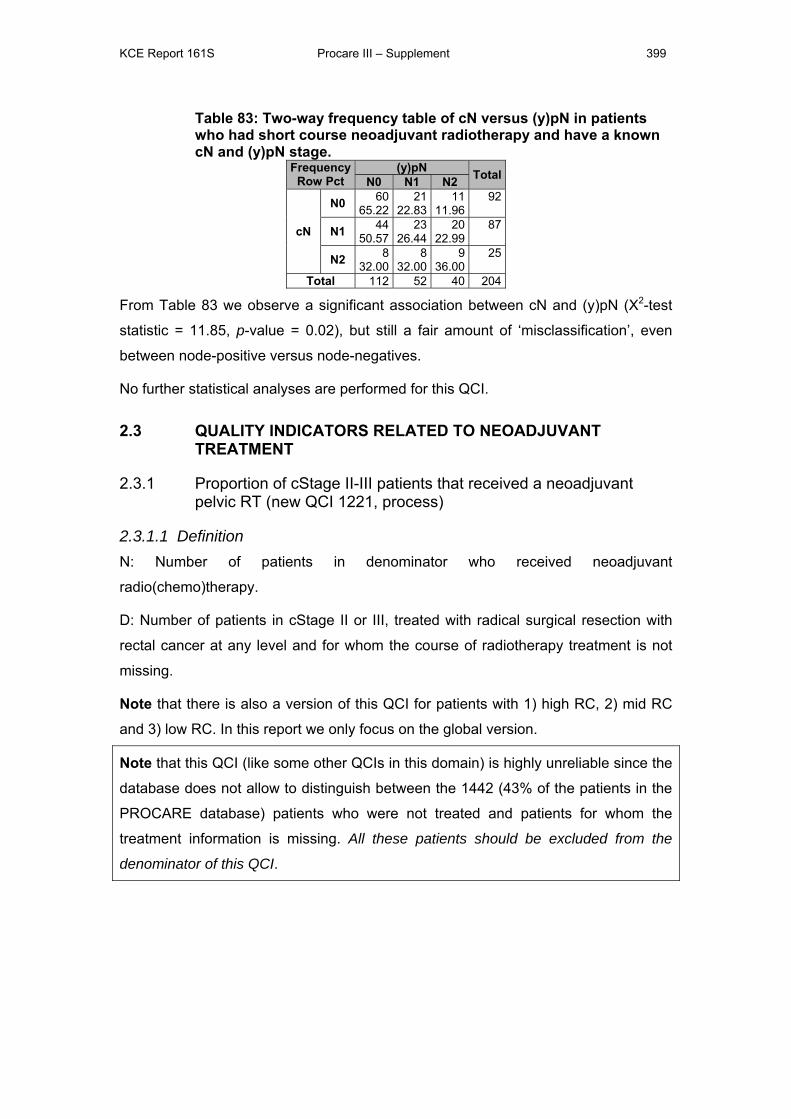
KCE Report 161S Procare III – Supplement 399
Table 83: Two-way frequency table of cN versus (y)pN in patients who had short course neoadjuvant radiotherapy and have a known cN and (y)pN stage.
FrequencyRow Pct
(y)pN TotalN0 N1 N2
cN
N0 6065.22
2122.83
1111.96
92
N1 4450.57
2326.44
2022.99
87
N2 832.00
832.00
936.00
25
Total 112 52 40 204
From Table 83 we observe a significant association between cN and (y)pN (Χ2-test
statistic = 11.85, p-value = 0.02), but still a fair amount of ‘misclassification’, even
between node-positive versus node-negatives.
No further statistical analyses are performed for this QCI.
2.3 QUALITY INDICATORS RELATED TO NEOADJUVANT TREATMENT
2.3.1 Proportion of cStage II-III patients that received a neoadjuvant pelvic RT (new QCI 1221, process)
2.3.1.1 Definition N: Number of patients in denominator who received neoadjuvant
radio(chemo)therapy.
D: Number of patients in cStage II or III, treated with radical surgical resection with
rectal cancer at any level and for whom the course of radiotherapy treatment is not
missing.
Note that there is also a version of this QCI for patients with 1) high RC, 2) mid RC
and 3) low RC. In this report we only focus on the global version.
Note that this QCI (like some other QCIs in this domain) is highly unreliable since the
database does not allow to distinguish between the 1442 (43% of the patients in the
PROCARE database) patients who were not treated and patients for whom the
treatment information is missing. All these patients should be excluded from the
denominator of this QCI.
KCE Report 161S Procare III – Supplement 400
2.3.1.2 Description There are 1830 (or 55%) of the 3318 patients in the PROCARE database who meet
the criteria in the denominator and are hence eligible for this QCI. Of the eligible
patients, 1360 (74%, or 70% unweighted) achieved the QCI. The proportion of
patients that achieved the QCI is shown in Table 30 (per size-grouped center) and
Figure 20 (per participating center, after merging all centers with less than five
eligible patients in one overlapping center) in Section 1. This proportion ranges from
0% in one of the 61 (merged) centers to 100% in three (merged) centers. The funnel
plot points to systematic variation between the centers.
2.3.1.3 Univariate associations with prognostic factors We find significant univariate associations between this QCI and eleven prognostic
factors, as shown in Table 84. The interpretation of the odds ratios is as described in
Table 69. Note that only two levels of cStage are considered, as a consequence of
the QCI definition.
2.3.1.4 Estimation of unadjusted center effects Unadjusted center effects are shown in a caterpillar plot (Figure 20 in Section 1).
These center effects range between -66% and 25% ‘excess’ probability. Note that the
‘excess probabilities’ are automatically constrained between -70% and 30% (since
the average center achievement is at 70% for this QCI). The P25 and P75 are
located at -14% resp. 13%, hence the interquartile range is 27%. In the caterpillar
plot, we observe that five (merged) centers perform significantly below P25, i.e. the
upper bounds of their confidence intervals are lower than P25. We also observe that
one (merged) center performs significantly above P75, i.e. the lower bound of its
confidence interval is higher than P75.
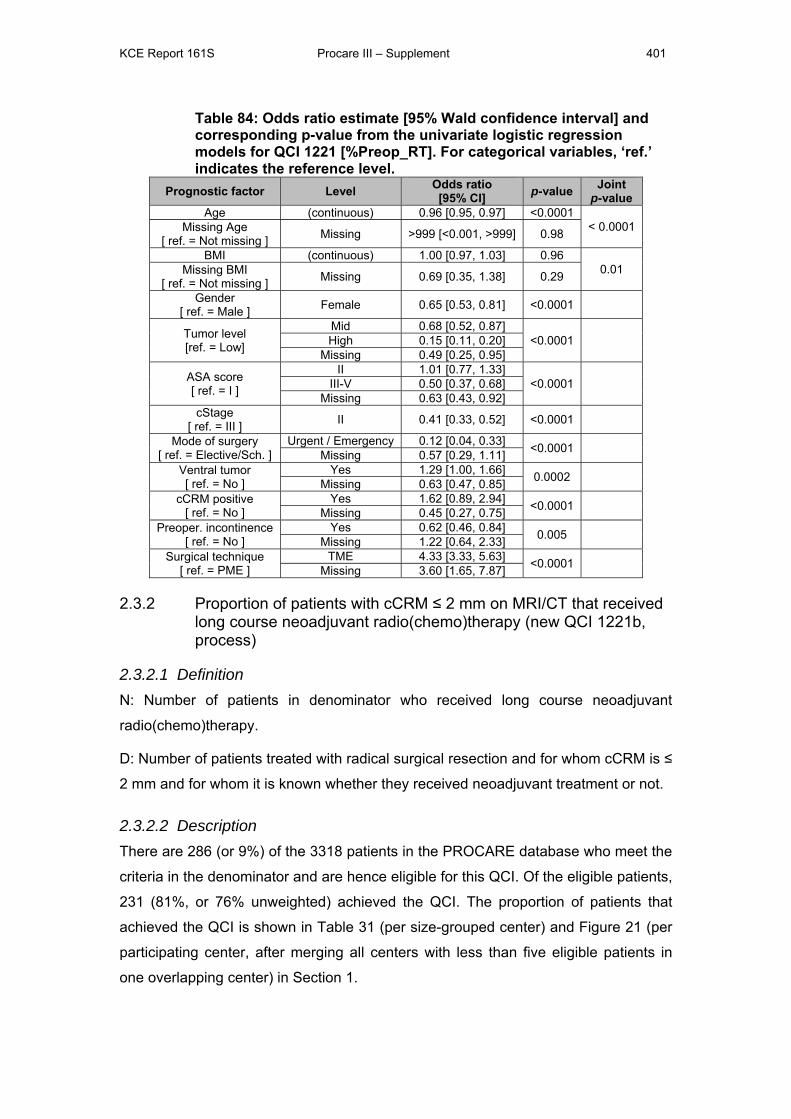
KCE Report 161S Procare III – Supplement 401
Table 84: Odds ratio estimate [95% Wald confidence interval] and corresponding p-value from the univariate logistic regression models for QCI 1221 [%Preop_RT]. For categorical variables, ‘ref.’ indicates the reference level.
Prognostic factor Level Odds ratio [95% CI] p-value Joint
p-value Age (continuous) 0.96 [0.95, 0.97] <0.0001
< 0.0001 Missing Age [ ref. = Not missing ] Missing >999 [<0.001, >999] 0.98
BMI (continuous) 1.00 [0.97, 1.03] 0.96 0.01 Missing BMI
[ ref. = Not missing ] Missing 0.69 [0.35, 1.38] 0.29
Gender [ ref. = Male ] Female 0.65 [0.53, 0.81] <0.0001
Tumor level [ref. = Low]
Mid 0.68 [0.52, 0.87] <0.0001
High 0.15 [0.11, 0.20]
Missing 0.49 [0.25, 0.95]
ASA score [ ref. = I ]
II 1.01 [0.77, 1.33] <0.0001
III-V 0.50 [0.37, 0.68]
Missing 0.63 [0.43, 0.92] cStage
[ ref. = III ] II 0.41 [0.33, 0.52] <0.0001
Mode of surgery [ ref. = Elective/Sch. ]
Urgent / Emergency 0.12 [0.04, 0.33] <0.0001 Missing 0.57 [0.29, 1.11]
Ventral tumor [ ref. = No ]
Yes 1.29 [1.00, 1.66] 0.0002 Missing 0.63 [0.47, 0.85]
cCRM positive [ ref. = No ]
Yes 1.62 [0.89, 2.94] <0.0001 Missing 0.45 [0.27, 0.75]
Preoper. incontinence [ ref. = No ]
Yes 0.62 [0.46, 0.84] 0.005 Missing 1.22 [0.64, 2.33]
Surgical technique [ ref. = PME ]
TME 4.33 [3.33, 5.63] <0.0001 Missing 3.60 [1.65, 7.87]
2.3.2 Proportion of patients with cCRM ≤ 2 mm on MRI/CT that received long course neoadjuvant radio(chemo)therapy (new QCI 1221b, process)
2.3.2.1 Definition N: Number of patients in denominator who received long course neoadjuvant
radio(chemo)therapy.
D: Number of patients treated with radical surgical resection and for whom cCRM is ≤
2 mm and for whom it is known whether they received neoadjuvant treatment or not.
2.3.2.2 Description There are 286 (or 9%) of the 3318 patients in the PROCARE database who meet the
criteria in the denominator and are hence eligible for this QCI. Of the eligible patients,
231 (81%, or 76% unweighted) achieved the QCI. The proportion of patients that
achieved the QCI is shown in Table 31 (per size-grouped center) and Figure 21 (per
participating center, after merging all centers with less than five eligible patients in
one overlapping center) in Section 1.
KCE Report 161S Procare III – Supplement 402
This proportion ranges from 40% in two of the 15 (merged) centers to 99% in one
(merged) center. The funnel plot points to systematic variation between the centers.
2.3.2.3 Univariate associations with prognostic factors We find significant univariate associations between this QCI and five prognostic
factors, as shown in Table 85. The interpretation of the odds ratios is as described in
Table 69. For ASA score and preoperative incontinence, the odds ratios for the
‘missing’ level demonstrate a strong effect of missingness for these prognostic
factors.
Table 85: Odds ratio estimate [95% Wald confidence interval] and corresponding p-value from the univariate logistic regression models for QCI 1221b [%(C)RT_cCRM+]. For categorical variables, ‘ref.’ indicates the reference level.
Prognostic factor Level Odds ratio [95% CI] p-value
Age (continuous) 0.96 [0.93, 0.98] 0.002 Gender
[ ref. = Male ] Female 0.50 [0.28, 0.91] 0.02
ASA score [ ref. = I ]
II 0.35 [0.13, 0.94] 0.04 III-V 0.21 [0.07, 0.61]
Missing 0.44 [0.11, 1.80]
cStage [ ref. = III ]
I 0.05 [0.01, 0.47]
0.10 II 0.73 [0.26, 2.09] IV 0.64 [0.26, 1.60]
Missing / X 0.61 [0.06, 6.02] Preoper. incontinence
[ ref. = No ] Yes 0.48 [0.22, 1.01] 0.06 Missing 0.20 [0.03, 1.49]
2.3.2.4 Estimation of unadjusted center effects Unadjusted center effects are shown in a caterpillar plot (Figure 21 in Section 1).
These center effects range between -38% and 17% ‘excess’ probability. Note that the
‘excess probabilities’ are automatically constrained between -81% and 19% (since
81% of patients in the database achieved this QCI). The P25 and P75 are located at
-14% resp. 13%, hence the interquartile range is 27%. In the caterpillar plot, we
observe that there are no (merged) centers that perform significantly below P25 or
above P75.
2.3.3 Proportion of patients with cStage I that received neoadjuvant radio(chemo)therapy (new QCI 1221c, process)
2.3.3.1 Definition N: Number of patients in denominator who received neoadjuvant R(C)T.
D: Number of patients treated with radical surgical resection for cStage I rectal
cancer.

KCE Report 161S Procare III – Supplement 403
Note that there is also a version of this QCI for patients with 1) high RC, 2) mid RC
and 3) low RC. In this report we only focus on the global version.
2.3.3.2 Description There are 344 (or 10%) of the 3318 patients in the PROCARE database who meet
the criteria in the denominator and are hence eligible for this QCI. Of the eligible
patients, 60 (17%, or 16% unweighted) achieved the QCI. The proportion of patients
that achieved the QCI is shown in Table 32 (per size-grouped center) and Figure 22
(per participating center, after merging all centers with less than five eligible patients
in one overlapping center) in Section 1. This proportion ranges from 0% in twelve of
the 28 (merged) centers to 66% in one (merged) center. The funnel plot does not
point to systematic variation between the centers.
Note that, since also patients for whom it is not known whether they received
neoadjuvant treatment or not are included in the denominator, this QCI provides a
lower limit for the proportion of patients with cStage I that received neoadjuvant
radio(chemo)therapy.
2.3.3.3 Univariate associations with prognostic factors We find significant univariate associations between this QCI and two prognostic
factors, as shown in Table 86. The interpretation of the odds ratios is as described in
Table 69. For surgical technique, the odds ratio for the ‘missing’ level demonstrates a
very strong effect of missingness for this prognostic factor.
Table 86: Odds ratio estimate [95% Wald confidence interval] and corresponding p-value from the univariate logistic regression models for QCI 1221c [%Preop_RT_cI]. For categorical variables, ‘ref.’ indicates the reference level. Prognostic factor Level Odds ratio
[95% CI] p-value Joint p-value
BMI (continuous) 0.98 [0.91, 1.06] 0.63 0.04 Missing BMI
[ ref. = Not missing ] Missing 0.26 [0.03, 2.23] 0.22
Surgical technique [ ref. = PME ]
TME 2.26 [1.06, 4.81] 0.02 Missing 18.44 [1.52, 224]
2.3.3.4 Estimation of unadjusted center effects Unadjusted center effects are shown in a caterpillar plot (Figure 22 in Section 1).
These center effects range between -11% and 49% ‘excess’ probability. Note that the
‘excess probabilities’ are automatically constrained between -17% and 83% (since
17% of patients in the database achieved this QCI). The P25 and P75 are located at
-8% resp. 10%, hence the interquartile range is 18%. In the caterpillar plot, we
KCE Report 161S Procare III – Supplement 404
observe that there are no (merged) centers that perform significantly below P25 or
above P75.
2.3.4 Proportion of cStage II-III patients treated with neoadjuvant 5-FU based chemoradiation, that received a continuous infusion of 5-FU (QCI 1224, process)
2.3.4.1 Definition N: Number of patients in denominator that received a continuous infusion of 5-FU.
D: Number of patients with cStage II-III treated with radical surgical resection and
long course pelvic chemoradiotherapy.
2.3.4.2 Description There are 469 (or 14%) of the 3318 patients in the PROCARE database who meet
the criteria in the denominator and are hence eligible for this QCI. Of the eligible
patients, 425 (91%, both weighted and unweighted) achieved the QCI. The
proportion of patients that achieved the QCI is shown in Table 33 (per size-grouped
center) and Figure 23 (per participating center, after merging all centers with less
than five eligible patients in one overlapping center) in Section 1. This proportion
ranges from 12% in one of the 31 (merged) center to 100% in twenty-one (merged)
centers. The funnel plot points to systematic variation between the centers.
2.3.4.3 Univariate associations with prognostic factors We find significant univariate associations between this QCI and three prognostic
factors, as shown in Table 87. The interpretation of the odds ratios is as described in
Table 69. Note that only two levels of cStage are considered, as a consequence of
the QCI definition.
Table 87: Odds ratio estimate [95% Wald confidence interval] and corresponding p-value from the univariate logistic regression models for QCI 1224 [%Preop_cont_5FU]. For categorical variables, ‘ref.’ indicates the reference level. Prognostic factor Level Odds ratio
[95% CI] p-value Joint p-value
BMI (continuous) 1.21 [1.03, 1.22] 0.01 0.03 Missing BMI
[ ref. = Not missing ] Missing 24.2 [2.3, 252] 0.008
ASA score [ ref. = I ]
II 0.25 [0.09, 0.73] 0.05
III-V 0.24 [0.07, 0.86]
Missing 0.86 [0.09, 8.05] cStage
[ ref. = III ] II 0.46 [0.22, 0.95] 0.04
KCE Report 161S Procare III – Supplement 405
2.3.4.4 Estimation of unadjusted center effects Unadjusted center effects are shown in a caterpillar plot (Figure 23 in Section 1).
These center effects range between -75% and 7% ‘excess’ probability. Note that the
‘excess probabilities’ are automatically constrained between -91% and 9% (since 9%
of patients in the database achieved this QCI). The P25 and P75 are located at -3%
resp. 4%, hence the interquartile range is 7%. In the caterpillar plot, we observe that
three (merged) centers perform significantly below P25, i.e. the upper bounds of their
confidence intervals are lower than P25.
2.3.5 Proportion of cStage II-III patients treated with a long course of preoperative pelvic RT or chemoradiation, that completed this neoadjuvant treatment within the planned timing (QCI 1225, process)
2.3.5.1 Definition N: Number of patients in denominator for whom the radiotherapy treatment was not
interrupted for more than five working days.
D: Number of patients with cStage II-III who started with long course neoadjuvant
radiotherapy which was followed by radical surgical resection.
2.3.5.2 Description There are 1196 (or 36%) of the 3318 patients in the PROCARE database who meet
the criteria in the denominator and are hence eligible for this QCI. Of the eligible
patients, 1158 (97%, both weighted and unweighted) achieved the QCI. The
proportion of patients that achieved the QCI is shown in Table 34 (per size-grouped
center) and Figure 24 (per participating center, after merging all centers with less
than five eligible patients in one overlapping center) in Section 1. This proportion
ranges from 60% in one of the 52 (merged) centers to 100% in thirty-four (merged)
centers. The funnel plot points to systematic variation between the centers.
2.3.5.3 Univariate associations with prognostic factors We find significant univariate associations between this QCI and six prognostic
factors, as shown in Table 88. The interpretation of the odds ratios is as described in
Table 69. For all prognostic factors except age, the odds ratios for the ‘missing’ level
demonstrate a strong effect of missingness for these prognostic factors.
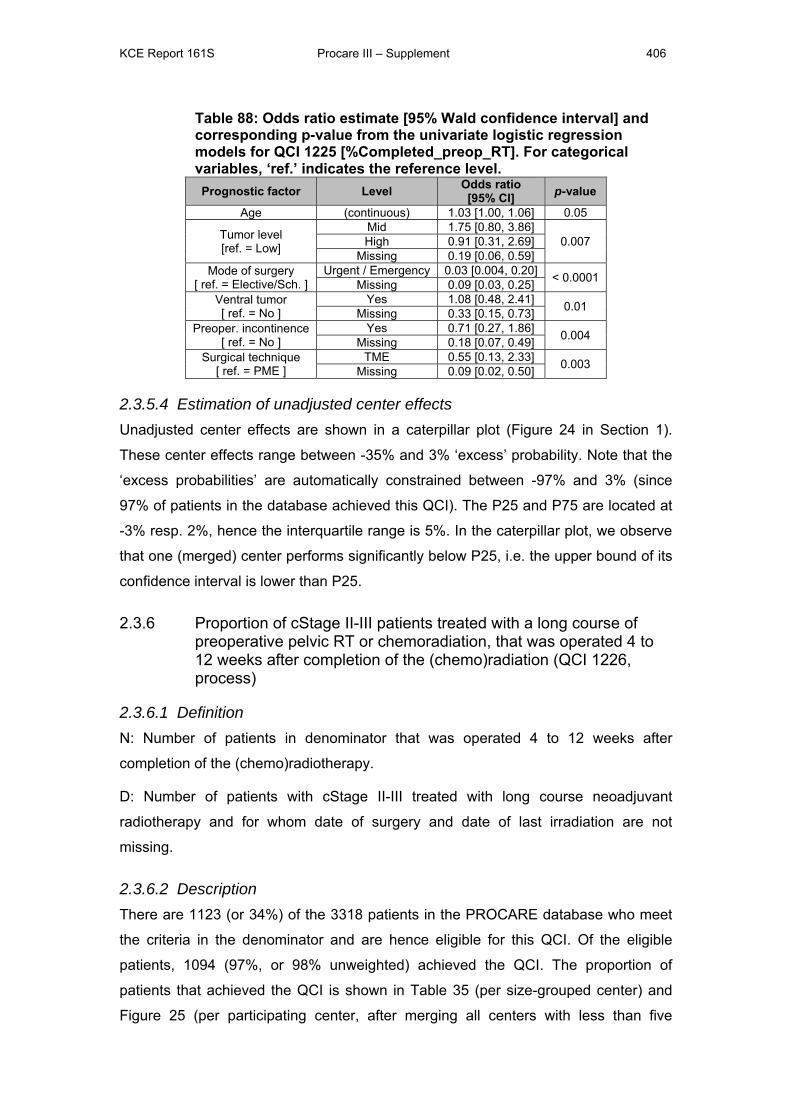
KCE Report 161S Procare III – Supplement 406
Table 88: Odds ratio estimate [95% Wald confidence interval] and corresponding p-value from the univariate logistic regression models for QCI 1225 [%Completed_preop_RT]. For categorical variables, ‘ref.’ indicates the reference level. Prognostic factor Level Odds ratio
[95% CI] p-value
Age (continuous) 1.03 [1.00, 1.06] 0.05
Tumor level [ref. = Low]
Mid 1.75 [0.80, 3.86] 0.007 High 0.91 [0.31, 2.69]
Missing 0.19 [0.06, 0.59] Mode of surgery
[ ref. = Elective/Sch. ] Urgent / Emergency 0.03 [0.004, 0.20] < 0.0001 Missing 0.09 [0.03, 0.25]
Ventral tumor [ ref. = No ]
Yes 1.08 [0.48, 2.41] 0.01 Missing 0.33 [0.15, 0.73] Preoper. incontinence
[ ref. = No ] Yes 0.71 [0.27, 1.86] 0.004 Missing 0.18 [0.07, 0.49]
Surgical technique [ ref. = PME ]
TME 0.55 [0.13, 2.33] 0.003 Missing 0.09 [0.02, 0.50]
2.3.5.4 Estimation of unadjusted center effects Unadjusted center effects are shown in a caterpillar plot (Figure 24 in Section 1).
These center effects range between -35% and 3% ‘excess’ probability. Note that the
‘excess probabilities’ are automatically constrained between -97% and 3% (since
97% of patients in the database achieved this QCI). The P25 and P75 are located at
-3% resp. 2%, hence the interquartile range is 5%. In the caterpillar plot, we observe
that one (merged) center performs significantly below P25, i.e. the upper bound of its
confidence interval is lower than P25.
2.3.6 Proportion of cStage II-III patients treated with a long course of preoperative pelvic RT or chemoradiation, that was operated 4 to 12 weeks after completion of the (chemo)radiation (QCI 1226, process)
2.3.6.1 Definition N: Number of patients in denominator that was operated 4 to 12 weeks after
completion of the (chemo)radiotherapy.
D: Number of patients with cStage II-III treated with long course neoadjuvant
radiotherapy and for whom date of surgery and date of last irradiation are not
missing.
2.3.6.2 Description There are 1123 (or 34%) of the 3318 patients in the PROCARE database who meet
the criteria in the denominator and are hence eligible for this QCI. Of the eligible
patients, 1094 (97%, or 98% unweighted) achieved the QCI. The proportion of
patients that achieved the QCI is shown in Table 35 (per size-grouped center) and
Figure 25 (per participating center, after merging all centers with less than five
KCE Report 161S Procare III – Supplement 407
eligible patients in one overlapping center) in Section 1. This proportion ranges from
86% in one of the 50 (merged) centers to 100% in thirty-three (merged) centers. The
funnel plot does not point to systematic variation between the centers.
2.3.6.3 Univariate associations with prognostic factors We find no significant univariate association between this QCI and any of the
candidate prognostic factors.
2.3.6.4 Estimation of unadjusted center effects Unadjusted center effects are shown in a caterpillar plot (Figure 25 in Section 1).
These center effects range between -14% and 3% ‘excess’ probability. Note that the
‘excess probabilities’ are automatically constrained between -97% and 3% (since
97% of patients in the database achieved this QCI). The P25 and P75 are located at
-3% resp. 2%, hence the interquartile range is 5%. In the caterpillar plot, we observe
that there are no (merged) centers that perform significantly below P25 or above
P75.
2.3.7 *Rate of acute grade 4 radio(chemo)therapy-related complications (QCI 1227, outcome)
2.3.7.1 Definition N: Number of patients in denominator that presented acute grade 4 complications
during the interval until surgery for neoadjuvant (chemo)radiotherapy or as
mentioned in the first follow-up for adjuvant (chemo)radiotherapy.
D: Number of patients treated with neoadjuvant or adjuvant radiotherapy and for
whom date of surgery in case of neoadjuvant (chemoradiotherapy) and/or follow-up
data are available in case of adjuvant radio(chemo)therapy.
2.3.7.2 Description Note that – contrary to most other QCIs - fulfilling this QCI is not a positive event.
There are 544 patients of the 3318 (16%) patients in the PROCARE database
eligible for this QCI. Of the 544 patients eligible for this QCI, 62 (11%, both weighted
and unweighted) showed acute grade 4 radio(chemo)therapy-related complications.
The proportion of patients that achieved the QCI is shown in Table 36 (per size-
grouped center) and Figure 26 (per participating center, after merging all centers with
less than five eligible patients in one overlapping center) in Section 1. This proportion
ranges from 0% in 9 of the 31 (merged) centers to 30% in one (merged) centers. The
funnel plot does not point to systematic variation between the centers.

KCE Report 161S Procare III – Supplement 408
2.3.7.3 Identification of relevant prognostic factors Prognostic factors identified in the literature review of Appendix 2
In Appendix 2 no prognostic factors were identified for this QCI.
Prognostic factors identified in the PROCARE consensus on risk/confounding
factors per QCI
In the PROCARE consensus the prognostic factor BMI is suggested to be used for
risk-adjustment.
Empirical associations
We find significant univariate associations between this QCI and two prognostic
factors, as shown in Table 89. The interpretation of the odds ratios is as described in
Table 69.
Table 89: Odds ratio estimate [95% Wald confidence interval] and corresponding p-value from the univariate logistic regression models for QCI 1227 [%grade4_Tox_Preop_RT]. For categorical variables, ‘ref.’ indicates the reference level. Prognostic factor Level Odds ratio
[95% CI] p-value
Age (continuous) 1.03 [1.00, 1.06] 0.03
ASA score [ ref. = I ]
II 1.12 [0.57, 2.21] 0.07 III-V 1.21 [0.46, 3.21]
Missing 3.08 [1.23, 7.67]
2.3.7.4 Estimation of unadjusted and case mix adjusted center effects Unadjusted center effects are shown in a caterpillar plot (Figure 27 in Section 1).
Unadjusted center effects range between -9% and 20% ‘excess’ probability of acute
grade 4 radio(chemo)therapy-related complications. Note that the ‘excess
probabilities’ are automatically constrained between -11% and 89% (since 11% of
patients in the database achieved this QCI). The P25 and P75 are located at -5%
respectively 10%, hence the interquartile range is 15%.
A model building procedure was performed to identify joint associations between
prognostic factors and the proportion of acute grade 4 radio(chemo)therapy-related
complications. In this, the prognostic factors gender, age, BMI, ASA co-morbidity
score, cStage and level of the tumor (high, mid or low) were considered.
A model with main effects for age and gender was retained. The odds ratios (with
corresponding 95% confidence interval and p-value) for the prognostic factors in the
multivariate risk-adjustment model are presented in Table 90 and interpreted in Table
91.
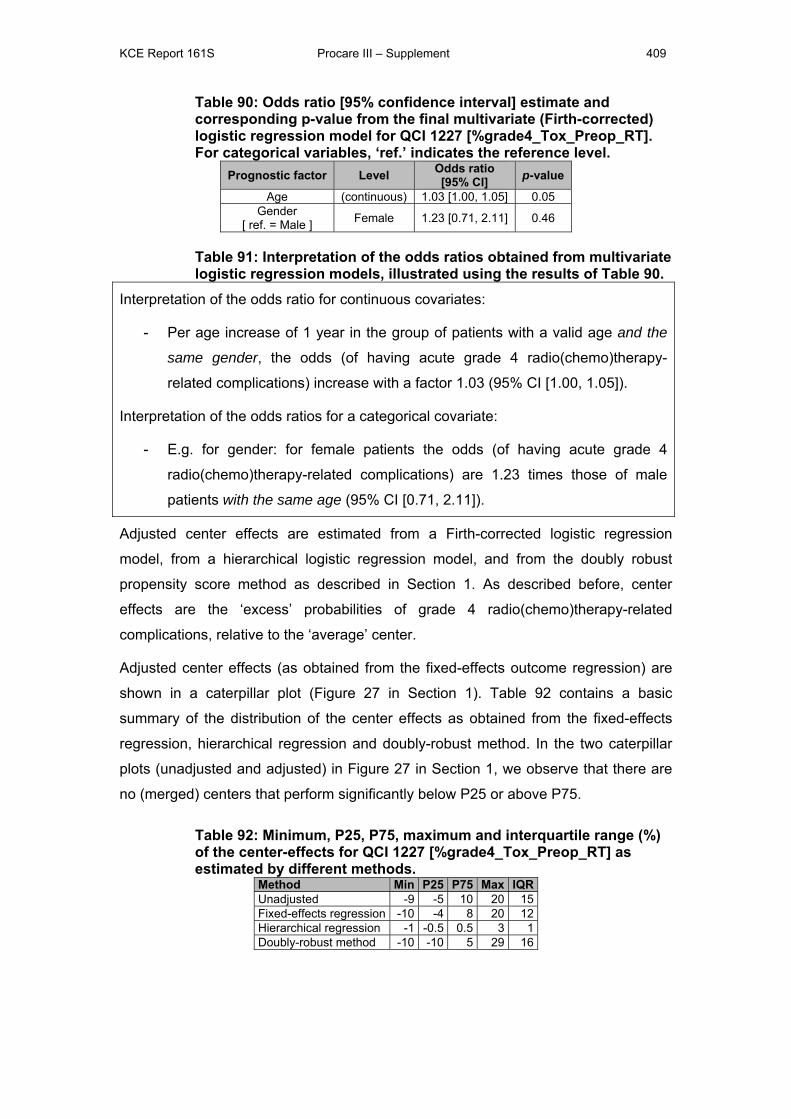
KCE Report 161S Procare III – Supplement 409
Table 90: Odds ratio [95% confidence interval] estimate and corresponding p-value from the final multivariate (Firth-corrected) logistic regression model for QCI 1227 [%grade4_Tox_Preop_RT]. For categorical variables, ‘ref.’ indicates the reference level.
Prognostic factor Level Odds ratio [95% CI] p-value
Age (continuous) 1.03 [1.00, 1.05] 0.05 Gender
[ ref. = Male ] Female 1.23 [0.71, 2.11] 0.46
Table 91: Interpretation of the odds ratios obtained from multivariate logistic regression models, illustrated using the results of Table 90.
Interpretation of the odds ratio for continuous covariates:
- Per age increase of 1 year in the group of patients with a valid age and the
same gender, the odds (of having acute grade 4 radio(chemo)therapy-
related complications) increase with a factor 1.03 (95% CI [1.00, 1.05]).
Interpretation of the odds ratios for a categorical covariate:
- E.g. for gender: for female patients the odds (of having acute grade 4
radio(chemo)therapy-related complications) are 1.23 times those of male
patients with the same age (95% CI [0.71, 2.11]).
Adjusted center effects are estimated from a Firth-corrected logistic regression
model, from a hierarchical logistic regression model, and from the doubly robust
propensity score method as described in Section 1. As described before, center
effects are the ‘excess’ probabilities of grade 4 radio(chemo)therapy-related
complications, relative to the ‘average’ center.
Adjusted center effects (as obtained from the fixed-effects outcome regression) are
shown in a caterpillar plot (Figure 27 in Section 1). Table 92 contains a basic
summary of the distribution of the center effects as obtained from the fixed-effects
regression, hierarchical regression and doubly-robust method. In the two caterpillar
plots (unadjusted and adjusted) in Figure 27 in Section 1, we observe that there are
no (merged) centers that perform significantly below P25 or above P75.
Table 92: Minimum, P25, P75, maximum and interquartile range (%) of the center-effects for QCI 1227 [%grade4_Tox_Preop_RT] as estimated by different methods.
Method Min P25 P75 Max IQRUnadjusted -9 -5 10 20 15Fixed-effects regression -10 -4 8 20 12Hierarchical regression -1 -0.5 0.5 3 1Doubly-robust method -10 -10 5 29 16
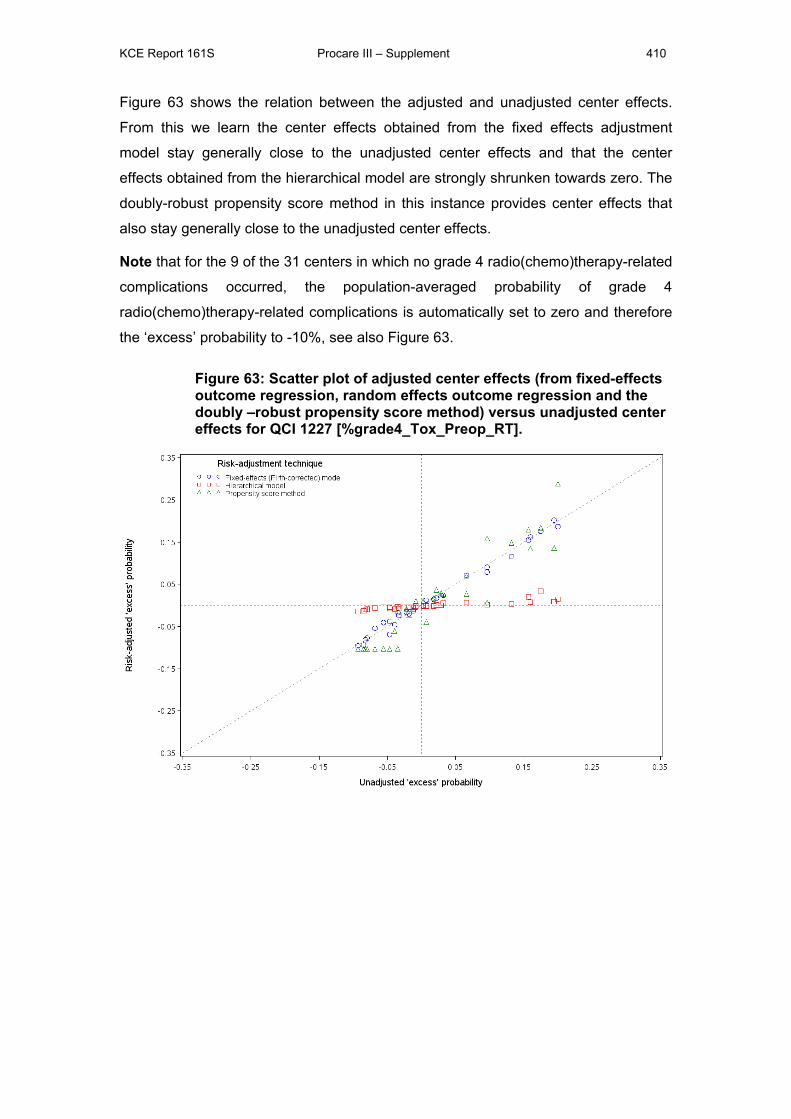
KCE Report 161S Procare III – Supplement 410
Figure 63 shows the relation between the adjusted and unadjusted center effects.
From this we learn the center effects obtained from the fixed effects adjustment
model stay generally close to the unadjusted center effects and that the center
effects obtained from the hierarchical model are strongly shrunken towards zero. The
doubly-robust propensity score method in this instance provides center effects that
also stay generally close to the unadjusted center effects.
Note that for the 9 of the 31 centers in which no grade 4 radio(chemo)therapy-related
complications occurred, the population-averaged probability of grade 4
radio(chemo)therapy-related complications is automatically set to zero and therefore
the ‘excess’ probability to -10%, see also Figure 63.
Figure 63: Scatter plot of adjusted center effects (from fixed-effects outcome regression, random effects outcome regression and the doubly –robust propensity score method) versus unadjusted center effects for QCI 1227 [%grade4_Tox_Preop_RT].
KCE Report 161S Procare III – Supplement 411
2.4 QUALITY INDICATORS RELATED TO SURGERY
2.4.1 *Proportion of R0 resections (QCI 1231, outcome)
2.4.1.1 Definition N: Number of patients in denominator with R0 resection.
D: Number of patients treated with radical surgical resection and for whom R status is
not missing.
Note that – like in PROCARE II [1] – the denominator was additionally restricted such
that all cStage IV patients automatically become not eligible for this QCI. The
rationale behind this decision is that cStage IV patients can in practice not have a
complete resection since they have secondary tumors in other organs than the
rectum.
2.4.1.2 Description There are 2576 of the 3318 (78%) patients in the PROCARE database eligible for
this QCI. Of the 2576 patients eligible for this QCI, 2230 (87%, or 86% unweighted)
had an R0 resection. The proportion of patients that achieved the QCI is shown in
Table 37 (per size-grouped center) and Figure 28 (per participating center, after
merging all centers with less than five eligible patients in one overlapping center) in
Section 1. This proportion ranges from 40% in one of the 68 (merged) centers to
100% in 11 (merged) centers. The funnel plot points to systematic variation between
the centers.
2.4.1.3 Identification of relevant prognostic factors Prognostic factors identified in the literature review of Appendix 2
In Appendix 2 no prognostic factors were identified for this QCI.
Prognostic factors identified in the PROCARE consensus on risk/confounding
factors per QCI
In the PROCARE consensus no prognostic factors were identified for this QCI, but
clinical experts suggested to use cT4 (yes or no) instead of cStage as prognostic
factor.
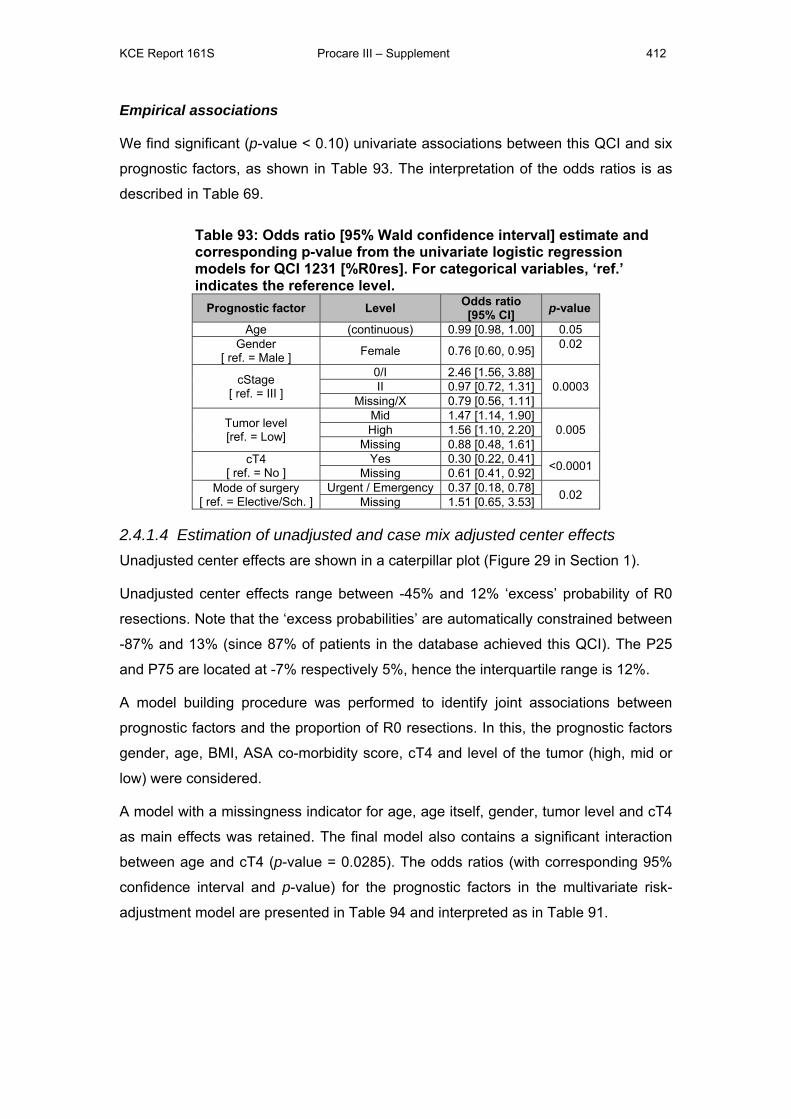
KCE Report 161S Procare III – Supplement 412
Empirical associations
We find significant (p-value < 0.10) univariate associations between this QCI and six
prognostic factors, as shown in Table 93. The interpretation of the odds ratios is as
described in Table 69.
Table 93: Odds ratio [95% Wald confidence interval] estimate and corresponding p-value from the univariate logistic regression models for QCI 1231 [%R0res]. For categorical variables, ‘ref.’ indicates the reference level.
Prognostic factor Level Odds ratio [95% CI] p-value
Age (continuous) 0.99 [0.98, 1.00] 0.05 Gender
[ ref. = Male ] Female 0.76 [0.60, 0.95] 0.02
cStage [ ref. = III ]
0/I 2.46 [1.56, 3.88] 0.0003 II 0.97 [0.72, 1.31]
Missing/X 0.79 [0.56, 1.11]
Tumor level [ref. = Low]
Mid 1.47 [1.14, 1.90] 0.005 High 1.56 [1.10, 2.20]
Missing 0.88 [0.48, 1.61] cT4
[ ref. = No ] Yes 0.30 [0.22, 0.41] <0.0001 Missing 0.61 [0.41, 0.92]
Mode of surgery [ ref. = Elective/Sch. ]
Urgent / Emergency 0.37 [0.18, 0.78] 0.02 Missing 1.51 [0.65, 3.53]
2.4.1.4 Estimation of unadjusted and case mix adjusted center effects Unadjusted center effects are shown in a caterpillar plot (Figure 29 in Section 1).
Unadjusted center effects range between -45% and 12% ‘excess’ probability of R0
resections. Note that the ‘excess probabilities’ are automatically constrained between
-87% and 13% (since 87% of patients in the database achieved this QCI). The P25
and P75 are located at -7% respectively 5%, hence the interquartile range is 12%.
A model building procedure was performed to identify joint associations between
prognostic factors and the proportion of R0 resections. In this, the prognostic factors
gender, age, BMI, ASA co-morbidity score, cT4 and level of the tumor (high, mid or
low) were considered.
A model with a missingness indicator for age, age itself, gender, tumor level and cT4
as main effects was retained. The final model also contains a significant interaction
between age and cT4 (p-value = 0.0285). The odds ratios (with corresponding 95%
confidence interval and p-value) for the prognostic factors in the multivariate risk-
adjustment model are presented in Table 94 and interpreted as in Table 91.

KCE Report 161S Procare III – Supplement 413
Table 94: Odds ratio [95% confidence interval] estimate and corresponding p-value from the final multivariate (Firth-corrected) logistic regression model for QCI 1231 [%R0res]. For categorical variables, ‘ref.’ indicates the reference level.
Prognostic factor Level Odds ratio [95% CI] p-value Joint
p-value Age (continuous) 0.99 [0.98, 1.00] 0.03
0.08 Missing Age [ ref. = Not missing ] Missing 0.24 [0.03, 2.12] 0.20
Gender [ ref. = Male ] Female 0.80 [0.63, 1.02] 0.07
Tumor level [ref. = Low]
Mid 1.40 [1.07, 1.83] 0.02
High 1.37 [0.96, 1.97]
Missing 0.64 [0.32, 1.28] cT4
[ ref. = No ] Yes 0.05 [0.01, 0.27] 0.002
Missing 2.24 [0.14, 35.49] cT4 – Missing Age interaction
[ ref. = No, Not missing] Missing, Missing 4.80 [0.05, 446.38] 0.50 0.03 cT4 – Age interaction
[ ref. = No cT4, (cont.)] Yes, (cont.) 1.03 [1.00, 1.06] 0.04
Missing, (cont.) 0.98 [0.94, 1.02] 0.30
Adjusted center effects are estimated from a Firth-corrected logistic regression model
and a hierarchical logistic regression model. Center effects are the center-specific
‘excess’ probabilities of R0 resections, relative to the ‘average’ center.
Adjusted center effects (as obtained from the fixed-effects outcome regression) are
shown in a caterpillar plot (Figure 29 in Section 1). Table 95 contains a basic
summary of the distribution of the center effects as obtained from the unadjusted
analysis and from the fixed-effects and hierarchical outcome regression.
In the two caterpillar plots (unadjusted and adjusted) in Figure 29 in Section 1, we
observe that there are two (merged) centers that perform significantly better than
P75.
Table 95: Minimum, P25, P75, maximum and interquartile range (%) of the center-effects for QCI 1231 [%R0res] as estimated by different methods.
Method Min P25 P75 Max IQRUnadjusted -45 -7 5 12 12Fixed-effects regression -43 -8 4 15 12Hierarchical regression -10 -2 2 6 4
Figure 64 shows the relation between the adjusted and unadjusted center effects.
From this we learn the center effects obtained from the fixed effects adjustment
model stay generally close to the unadjusted center effects and that there is some
shrinkage in results obtained from the hierarchical approach.
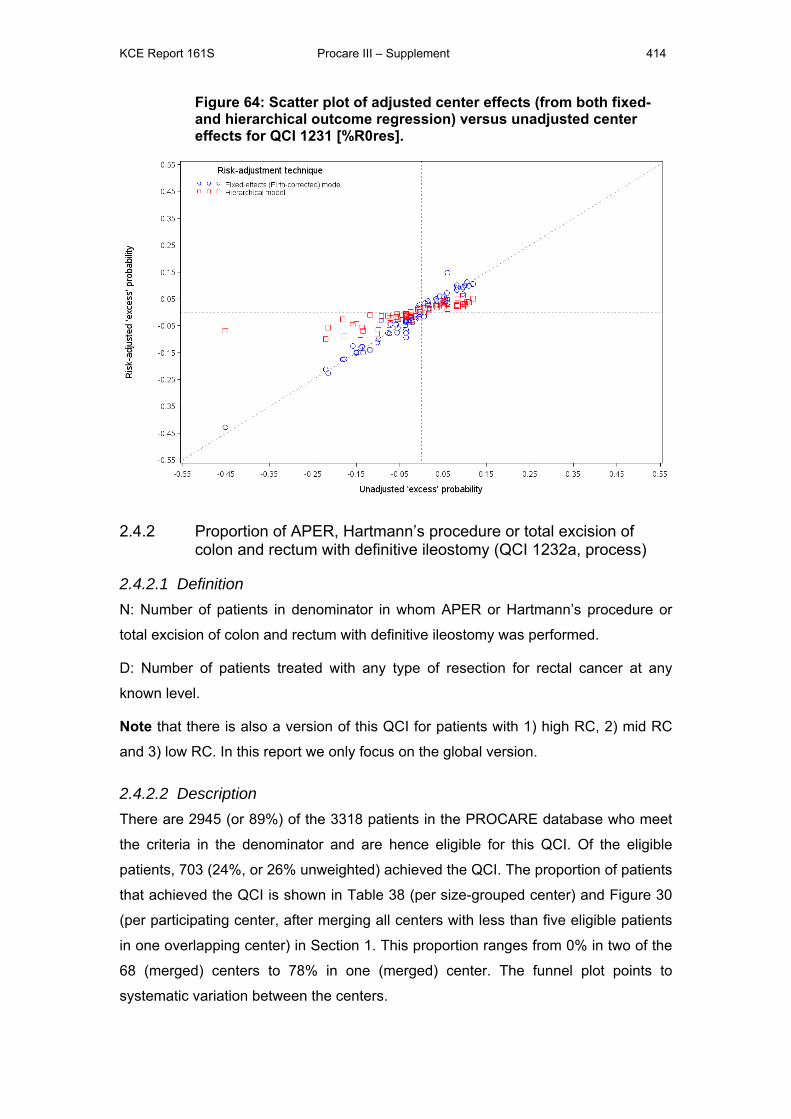
KCE Report 161S Procare III – Supplement 414
Figure 64: Scatter plot of adjusted center effects (from both fixed- and hierarchical outcome regression) versus unadjusted center effects for QCI 1231 [%R0res].
2.4.2 Proportion of APER, Hartmann’s procedure or total excision of colon and rectum with definitive ileostomy (QCI 1232a, process)
2.4.2.1 Definition N: Number of patients in denominator in whom APER or Hartmann’s procedure or
total excision of colon and rectum with definitive ileostomy was performed.
D: Number of patients treated with any type of resection for rectal cancer at any
known level.
Note that there is also a version of this QCI for patients with 1) high RC, 2) mid RC
and 3) low RC. In this report we only focus on the global version.
2.4.2.2 Description There are 2945 (or 89%) of the 3318 patients in the PROCARE database who meet
the criteria in the denominator and are hence eligible for this QCI. Of the eligible
patients, 703 (24%, or 26% unweighted) achieved the QCI. The proportion of patients
that achieved the QCI is shown in Table 38 (per size-grouped center) and Figure 30
(per participating center, after merging all centers with less than five eligible patients
in one overlapping center) in Section 1. This proportion ranges from 0% in two of the
68 (merged) centers to 78% in one (merged) center. The funnel plot points to
systematic variation between the centers.
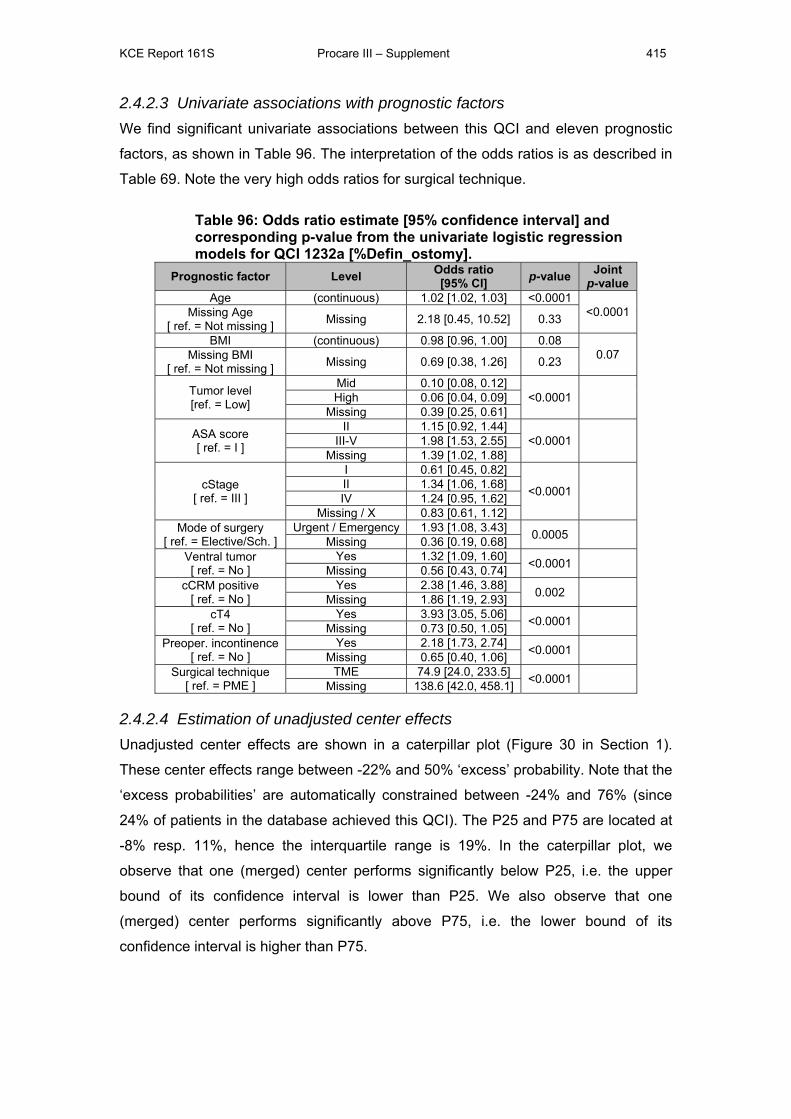
KCE Report 161S Procare III – Supplement 415
2.4.2.3 Univariate associations with prognostic factors We find significant univariate associations between this QCI and eleven prognostic
factors, as shown in Table 96. The interpretation of the odds ratios is as described in
Table 69. Note the very high odds ratios for surgical technique.
Table 96: Odds ratio estimate [95% confidence interval] and corresponding p-value from the univariate logistic regression models for QCI 1232a [%Defin_ostomy].
Prognostic factor Level Odds ratio [95% CI] p-value Joint
p-value Age (continuous) 1.02 [1.02, 1.03] <0.0001
<0.0001 Missing Age [ ref. = Not missing ] Missing 2.18 [0.45, 10.52] 0.33
BMI (continuous) 0.98 [0.96, 1.00] 0.08 0.07 Missing BMI
[ ref. = Not missing ] Missing 0.69 [0.38, 1.26] 0.23
Tumor level [ref. = Low]
Mid 0.10 [0.08, 0.12] <0.0001
High 0.06 [0.04, 0.09]
Missing 0.39 [0.25, 0.61]
ASA score [ ref. = I ]
II 1.15 [0.92, 1.44] <0.0001
III-V 1.98 [1.53, 2.55]
Missing 1.39 [1.02, 1.88]
cStage [ ref. = III ]
I 0.61 [0.45, 0.82]
<0.0001
II 1.34 [1.06, 1.68] IV 1.24 [0.95, 1.62]
Missing / X 0.83 [0.61, 1.12] Mode of surgery
[ ref. = Elective/Sch. ] Urgent / Emergency 1.93 [1.08, 3.43] 0.0005
Missing 0.36 [0.19, 0.68] Ventral tumor [ ref. = No ]
Yes 1.32 [1.09, 1.60] <0.0001 Missing 0.56 [0.43, 0.74]
cCRM positive [ ref. = No ]
Yes 2.38 [1.46, 3.88] 0.002 Missing 1.86 [1.19, 2.93]
cT4 [ ref. = No ]
Yes 3.93 [3.05, 5.06] <0.0001 Missing 0.73 [0.50, 1.05]
Preoper. incontinence [ ref. = No ]
Yes 2.18 [1.73, 2.74] <0.0001 Missing 0.65 [0.40, 1.06]
Surgical technique [ ref. = PME ]
TME 74.9 [24.0, 233.5] <0.0001 Missing 138.6 [42.0, 458.1]
2.4.2.4 Estimation of unadjusted center effects Unadjusted center effects are shown in a caterpillar plot (Figure 30 in Section 1).
These center effects range between -22% and 50% ‘excess’ probability. Note that the
‘excess probabilities’ are automatically constrained between -24% and 76% (since
24% of patients in the database achieved this QCI). The P25 and P75 are located at
-8% resp. 11%, hence the interquartile range is 19%. In the caterpillar plot, we
observe that one (merged) center performs significantly below P25, i.e. the upper
bound of its confidence interval is lower than P25. We also observe that one
(merged) center performs significantly above P75, i.e. the lower bound of its
confidence interval is higher than P75.
KCE Report 161S Procare III – Supplement 416
2.4.3 *Proportion of patients with stoma 1 year after sphincter-sparing surgery (QCI 1232b, outcome)
2.4.3.1 Definition N: Number of patients in denominator still having a stoma 1 year after surgery.
D: Number of patients treated with TME (complete rectum resection (TME) + straight
CAA, coloplasty, pouch, side-to-end CAA, total excision of colon and rectum with
IPAA, or another specified type of reconstruction) with a primary (constructed at the
time of SSO) or secondary (constructed after SSO) derivative stoma or dismantling of
anastomosis still alive 1 year after surgery and for whom follow-up at 1 year or more
is known.
Note that – contrary to most other QCIs - fulfilling the QCI is not a positive event.
2.4.3.2 Description There are only 123 of the 3318 (4%) patients in the PROCARE database eligible for
this QCI. Of these 123 patients, 33 (27%, or 25% unweighted) had a stoma 1 year
after sphincter-sparing surgery. The proportion of patients that achieved the QCI is
shown in Table 39 (per size-grouped center) and Figure 31 (per participating center,
after merging all centers with less than five eligible patients in one overlapping
center) in Section 1. This proportion ranges from 0% in three of the 10 (merged)
centers to 50% in one (merged) center. The funnel plot does not point to systematic
variation between the centers.
2.4.3.3 Identification of relevant prognostic factors Prognostic factors identified in the literature review of Appendix 2
In Appendix 2 no prognostic factors for were identified for this QCI.
Prognostic factors identified in the PROCARE consensus on risk/confounding
factors per QCI
In the PROCARE consensus the ASA co-morbidity score is identified as possible
prognostic factor for this QCI.
Empirical associations
We find a significant (p-value < 0.10) univariate association between this QCI and
age, as shown in Table 93. The interpretation of the odds ratios is as described in
Table 69.
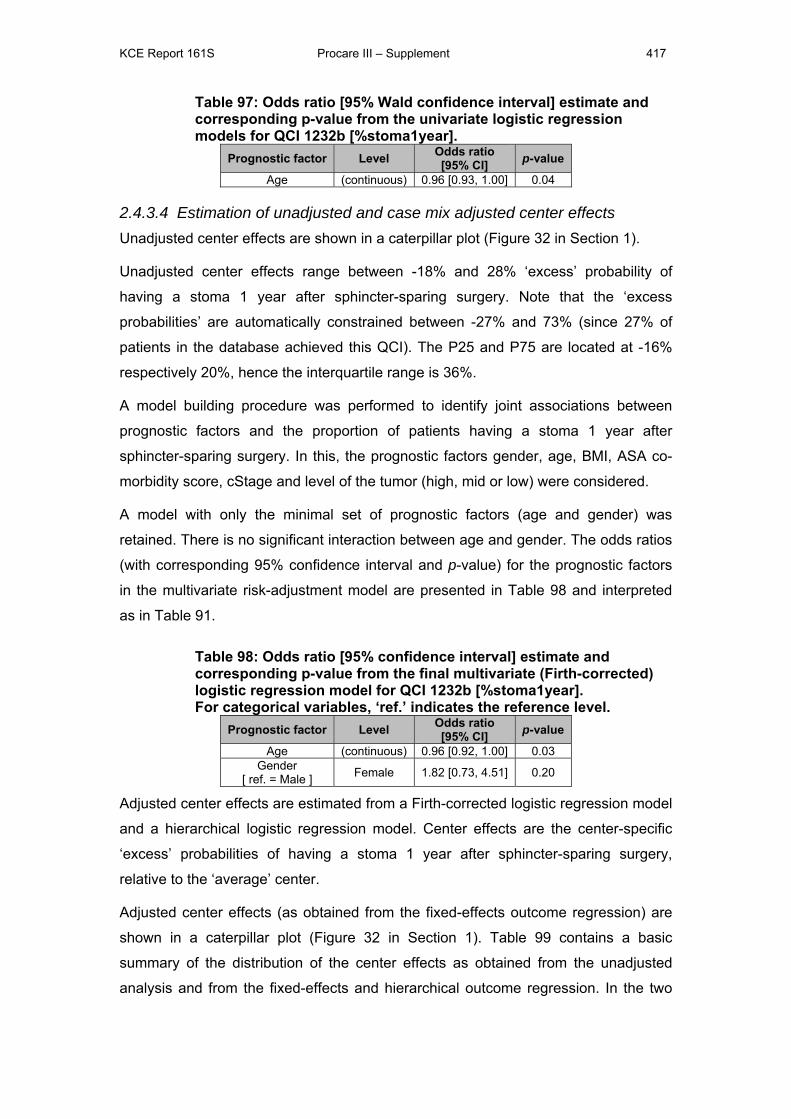
KCE Report 161S Procare III – Supplement 417
Table 97: Odds ratio [95% Wald confidence interval] estimate and corresponding p-value from the univariate logistic regression models for QCI 1232b [%stoma1year].
Prognostic factor Level Odds ratio [95% CI] p-value
Age (continuous) 0.96 [0.93, 1.00] 0.04
2.4.3.4 Estimation of unadjusted and case mix adjusted center effects Unadjusted center effects are shown in a caterpillar plot (Figure 32 in Section 1).
Unadjusted center effects range between -18% and 28% ‘excess’ probability of
having a stoma 1 year after sphincter-sparing surgery. Note that the ‘excess
probabilities’ are automatically constrained between -27% and 73% (since 27% of
patients in the database achieved this QCI). The P25 and P75 are located at -16%
respectively 20%, hence the interquartile range is 36%.
A model building procedure was performed to identify joint associations between
prognostic factors and the proportion of patients having a stoma 1 year after
sphincter-sparing surgery. In this, the prognostic factors gender, age, BMI, ASA co-
morbidity score, cStage and level of the tumor (high, mid or low) were considered.
A model with only the minimal set of prognostic factors (age and gender) was
retained. There is no significant interaction between age and gender. The odds ratios
(with corresponding 95% confidence interval and p-value) for the prognostic factors
in the multivariate risk-adjustment model are presented in Table 98 and interpreted
as in Table 91.
Table 98: Odds ratio [95% confidence interval] estimate and corresponding p-value from the final multivariate (Firth-corrected) logistic regression model for QCI 1232b [%stoma1year]. For categorical variables, ‘ref.’ indicates the reference level.
Prognostic factor Level Odds ratio [95% CI] p-value
Age (continuous) 0.96 [0.92, 1.00] 0.03 Gender
[ ref. = Male ] Female 1.82 [0.73, 4.51] 0.20
Adjusted center effects are estimated from a Firth-corrected logistic regression model
and a hierarchical logistic regression model. Center effects are the center-specific
‘excess’ probabilities of having a stoma 1 year after sphincter-sparing surgery,
relative to the ‘average’ center.
Adjusted center effects (as obtained from the fixed-effects outcome regression) are
shown in a caterpillar plot (Figure 32 in Section 1). Table 99 contains a basic
summary of the distribution of the center effects as obtained from the unadjusted
analysis and from the fixed-effects and hierarchical outcome regression. In the two
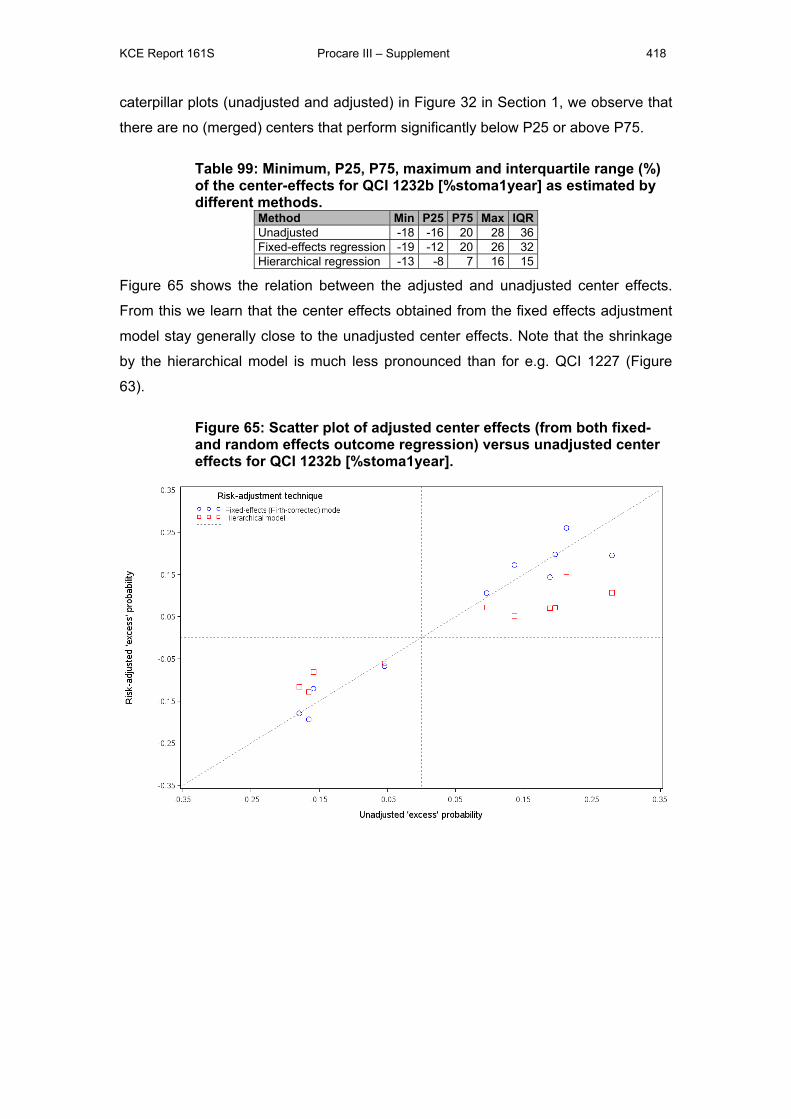
KCE Report 161S Procare III – Supplement 418
caterpillar plots (unadjusted and adjusted) in Figure 32 in Section 1, we observe that
there are no (merged) centers that perform significantly below P25 or above P75.
Table 99: Minimum, P25, P75, maximum and interquartile range (%) of the center-effects for QCI 1232b [%stoma1year] as estimated by different methods.
Method Min P25 P75 Max IQRUnadjusted -18 -16 20 28 36Fixed-effects regression -19 -12 20 26 32Hierarchical regression -13 -8 7 16 15
Figure 65 shows the relation between the adjusted and unadjusted center effects.
From this we learn that the center effects obtained from the fixed effects adjustment
model stay generally close to the unadjusted center effects. Note that the shrinkage
by the hierarchical model is much less pronounced than for e.g. QCI 1227 (Figure
63).
Figure 65: Scatter plot of adjusted center effects (from both fixed- and random effects outcome regression) versus unadjusted center effects for QCI 1232b [%stoma1year].
KCE Report 161S Procare III – Supplement 419
2.4.4 *Rate of patients with major leakage of the anastomosis after PME + SSO + reconstruction (new QCI 1233a, outcome)
2.4.4.1 Definition N: Number of patients with major leakage of the anastomosis (requiring reoperation
for leakage).
D: Number of patients treated with PME (high or low anterior resection with colorectal
anastomsosis) and for whom it is reported whether there were postoperative
complications or not.
Note that – contrary to most other QCIs - fulfilling the QCI is not a positive event.
2.4.4.2 Description There are 556 of the 3318 (17%) patients in the PROCARE database eligible for this
QCI. Of these 556 patients, 32 (6%, or 5% unweighted) had a major leakage of the
anastomosis after PME + SSO + reconstruction. The proportion of patients that
achieved the QCI is shown in Table 40 (per size-grouped center) and Figure 33 (per
participating center, after merging all centers with less than five eligible patients in
one overlapping center) in Section 1. This proportion ranges from 0% in 27 of the 43
(merged) centers to 33% in one (merged) center. The funnel plot does not point to
systematic variation between the centers.
2.4.4.3 Identification of relevant prognostic factors Prognostic factors identified in the literature review of Appendix 2
In Appendix 2 no prognostic factors for were identified for this QCI.
Prognostic factors identified in the PROCARE consensus on risk/confounding
factors per QCI
In the PROCARE consensus no prognostic factors for were identified for this QCI.
Empirical associations
We find no significant univariate associations between this QCI and prognostic
factors.
2.4.4.4 Estimation of unadjusted and case mix adjusted center effects Unadjusted center effects are shown in a caterpillar plot (Figure 34 in Section 1).
Unadjusted center effects range between -6% and 27% ‘excess’ probability of having
a major leakage of the anastomosis after PME + SSO + reconstruction. Note that the
‘excess probabilities’ are automatically constrained between -6% and 94% (since 6%
KCE Report 161S Procare III – Supplement 420
of patients in the database achieved this QCI). The P25 and P75 are located at -3%
respectively 4%, hence the interquartile range is 7%.
A model building procedure was performed to identify joint associations between
prognostic factors and the proportion of having a major leakage of the anastomosis
after PME + SSO + reconstruction. In this, the prognostic factors gender, age, BMI,
ASA co-morbidity score, cStage and level of the tumor (high, mid or low) were
considered.
A model with prognostic factors age, gender, tumor level, cStage and ASA score as
main effects was retained. There is one significant interaction, between gender and
the ASA score. The odds ratios (with corresponding 95% confidence interval and p-
value) for the prognostic factors in the multivariate risk-adjustment model are
presented in Table 100 and interpreted as in Table 91.
Table 100: Odds ratio [95% confidence interval] estimate and corresponding p-value from the final multivariate (Firth-corrected) logistic regression model for QCI 1233a [%Leak_PME]. For categorical variables, ‘ref.’ indicates the reference level.
Prognostic factor Level Odds ratio [95% CI] p-value Joint
p-value Age (continuous) 0.98 [0.95, 1.01] 0.27
Gender [ ref. = Male ] Female 0.83 [0.21, 3.27] 0.80
Tumor level [ref. = Low]
Mid 4.74 [0.61, 36.53] 0.09
High 2.02 [0.25, 16.38]
Missing 2.26 [0.19, 26.81]
ASA score [ ref. = I ]
II 1.97 [0.67, 5.81] 0.02
III 6.07 [1.52, 24.17]
Missing 0.25 [0.02, 2.92]
cStage [ ref. = III ]
0/I 0.82 [0.29, 2.31]
0.07 II 0.15 [0.03, 0.65] IV 1.55 [0.60, 4.00]
X/Missing 0.98 [0.36, 2.66]
Gender – ASA interaction [ ref. = Male, I]
Female, II 0.21 [0.03, 1.32] 0.10 0.03 Female, III 0.38 [0.05, 3.05] 0.36
Female, Missing 13.30 [0.68, 258.97] 0.09
Adjusted center effects are estimated from a Firth-corrected logistic regression model
and a hierarchical logistic regression model. Center effects are the center-specific
‘excess’ probabilities of having a major leakage of the anastomosis after PME + SSO
+ reconstruction, relative to the ‘average’ center.
Adjusted center effects (as obtained from the fixed-effects outcome regression) are
shown in a caterpillar plot (Figure 34 in Section 1). Table 101 contains a basic
summary of the distribution of the center effects as obtained from the unadjusted
analysis and from the fixed-effects and hierarchical outcome regression. In the two
caterpillar plots (unadjusted and adjusted) in Figure 34 in Section 1, we observe that
there are no (merged) centers that perform significantly above P75.
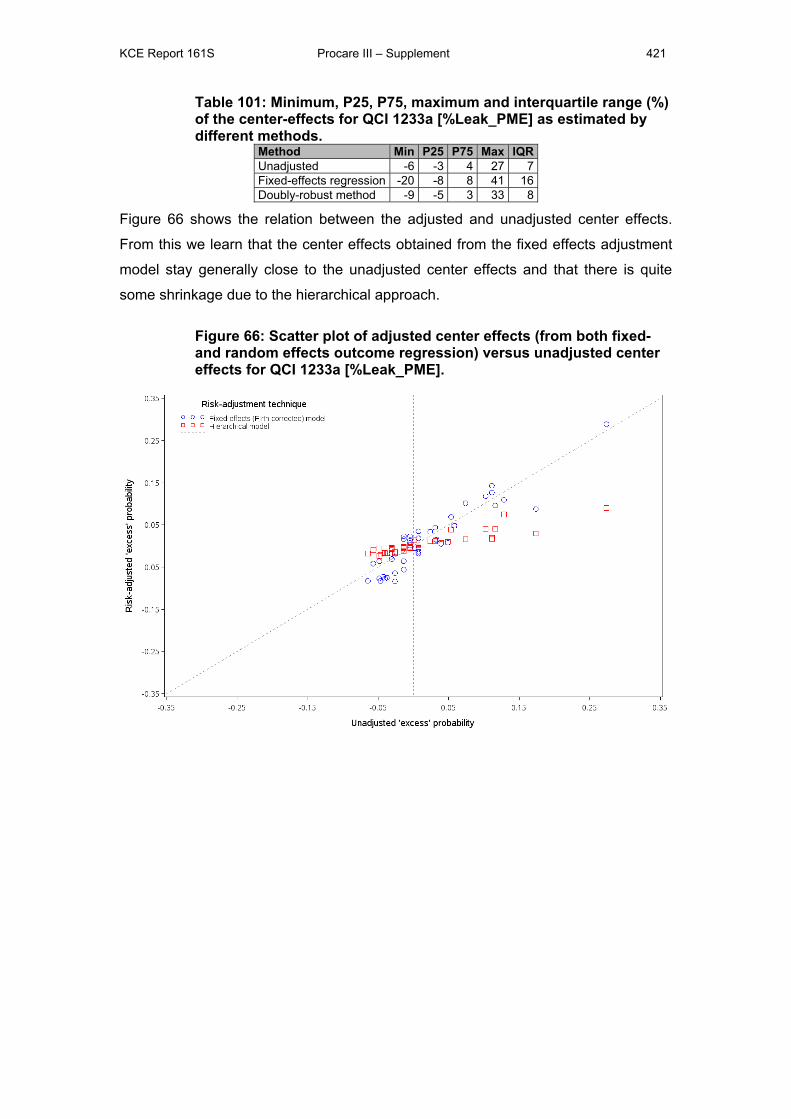
KCE Report 161S Procare III – Supplement 421
Table 101: Minimum, P25, P75, maximum and interquartile range (%) of the center-effects for QCI 1233a [%Leak_PME] as estimated by different methods.
Method Min P25 P75 Max IQRUnadjusted -6 -3 4 27 7Fixed-effects regression -20 -8 8 41 16Doubly-robust method -9 -5 3 33 8
Figure 66 shows the relation between the adjusted and unadjusted center effects.
From this we learn that the center effects obtained from the fixed effects adjustment
model stay generally close to the unadjusted center effects and that there is quite
some shrinkage due to the hierarchical approach.
Figure 66: Scatter plot of adjusted center effects (from both fixed- and random effects outcome regression) versus unadjusted center effects for QCI 1233a [%Leak_PME].
KCE Report 161S Procare III – Supplement 422
2.4.5 *Rate of patients with major leakage of the anastomosis after TME + SSO + reconstruction (new QCI 1233b, outcome)
2.4.5.1 Definition N: Number of patients with major leakage of the anastomosis (requiring reoperation
for leakage)
D: Number of patients treated with TME (complete rectum resection (TME) + straight
CAA, coloplasty, pouch, side-to-end CAA, total excision of colon and rectum with
IPAA, or another specified type of reconstruction) and for whom it is reported whether
there were postoperative complications or not.
Note that – contrary to most other QCIs - fulfilling the QCI is not a positive event.
2.4.5.2 Description There are 1592 of the 3318 (48%) patients in the PROCARE database eligible for
this QCI. Of these 1592 patients, 91 (6% both weighted and unweighted) had a major
leakage of the anastomosis after TME + SSO + reconstruction. The proportion of
patients that achieved the QCI is shown in Table 41 (per size-grouped center) and
Figure 35 (per participating center, after merging all centers with less than five
eligible patients in one overlapping center) in Section 1. This proportion ranges from
0% in 16 of the 55 (merged) centers to 20% in 2 (merged) centers. The funnel plot
does not point to systematic variation between the centers.
2.4.5.3 Identification of relevant prognostic factors Prognostic factors identified in the literature review of Appendix 2
In Appendix 2 no prognostic factors for were identified for this QCI.
Prognostic factors identified in the PROCARE consensus on risk/confounding
factors per QCI
In the PROCARE consensus the factors gender, age, ASA score, obesity and
preoperative radio(chemo)therapy were identified as possible prognostic factors for
this QCI. The former four will be considered in the model building procedure, but the
latter is not a pre-treatment variable and will therefore not be considered in our risk-
adjustment model.
Empirical associations
We find no significant univariate associations between this QCI and the prognostic
factors.
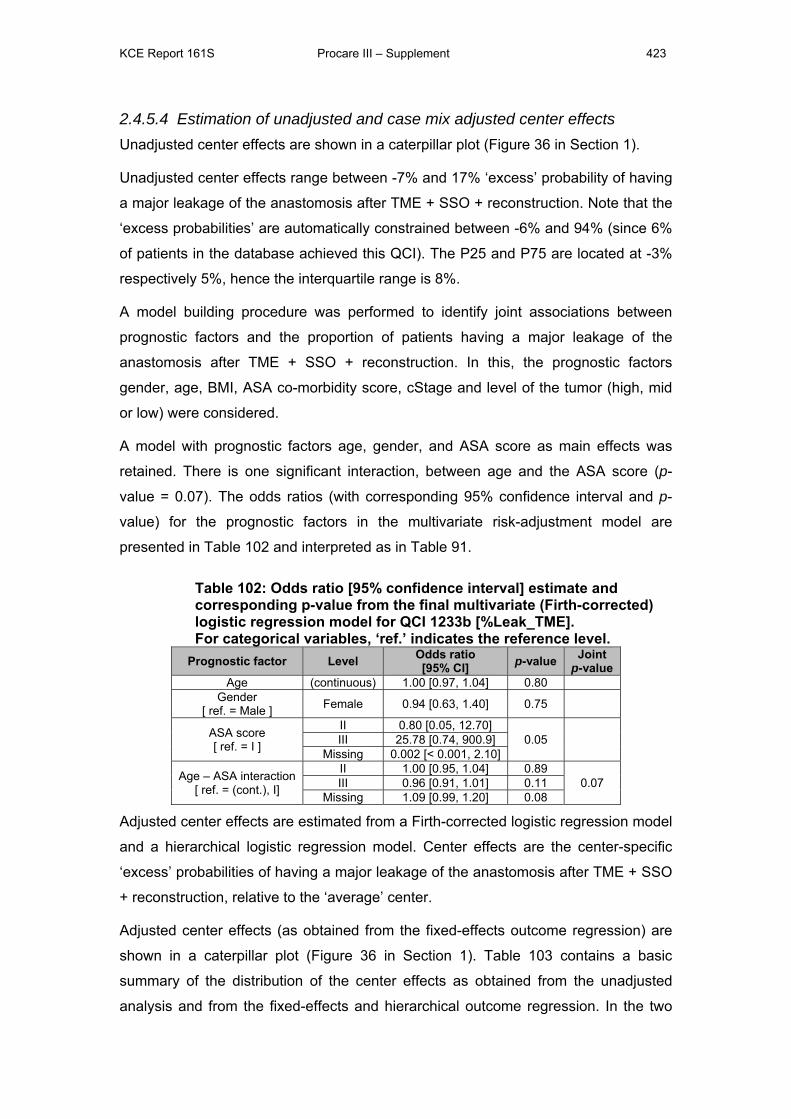
KCE Report 161S Procare III – Supplement 423
2.4.5.4 Estimation of unadjusted and case mix adjusted center effects Unadjusted center effects are shown in a caterpillar plot (Figure 36 in Section 1).
Unadjusted center effects range between -7% and 17% ‘excess’ probability of having
a major leakage of the anastomosis after TME + SSO + reconstruction. Note that the
‘excess probabilities’ are automatically constrained between -6% and 94% (since 6%
of patients in the database achieved this QCI). The P25 and P75 are located at -3%
respectively 5%, hence the interquartile range is 8%.
A model building procedure was performed to identify joint associations between
prognostic factors and the proportion of patients having a major leakage of the
anastomosis after TME + SSO + reconstruction. In this, the prognostic factors
gender, age, BMI, ASA co-morbidity score, cStage and level of the tumor (high, mid
or low) were considered.
A model with prognostic factors age, gender, and ASA score as main effects was
retained. There is one significant interaction, between age and the ASA score (p-
value = 0.07). The odds ratios (with corresponding 95% confidence interval and p-
value) for the prognostic factors in the multivariate risk-adjustment model are
presented in Table 102 and interpreted as in Table 91.
Table 102: Odds ratio [95% confidence interval] estimate and corresponding p-value from the final multivariate (Firth-corrected) logistic regression model for QCI 1233b [%Leak_TME]. For categorical variables, ‘ref.’ indicates the reference level.
Prognostic factor Level Odds ratio [95% CI] p-value Joint
p-value Age (continuous) 1.00 [0.97, 1.04] 0.80
Gender [ ref. = Male ] Female 0.94 [0.63, 1.40] 0.75
ASA score [ ref. = I ]
II 0.80 [0.05, 12.70] 0.05
III 25.78 [0.74, 900.9]
Missing 0.002 [< 0.001, 2.10]
Age – ASA interaction [ ref. = (cont.), I]
II 1.00 [0.95, 1.04] 0.89 0.07 III 0.96 [0.91, 1.01] 0.11
Missing 1.09 [0.99, 1.20] 0.08
Adjusted center effects are estimated from a Firth-corrected logistic regression model
and a hierarchical logistic regression model. Center effects are the center-specific
‘excess’ probabilities of having a major leakage of the anastomosis after TME + SSO
+ reconstruction, relative to the ‘average’ center.
Adjusted center effects (as obtained from the fixed-effects outcome regression) are
shown in a caterpillar plot (Figure 36 in Section 1). Table 103 contains a basic
summary of the distribution of the center effects as obtained from the unadjusted
analysis and from the fixed-effects and hierarchical outcome regression. In the two
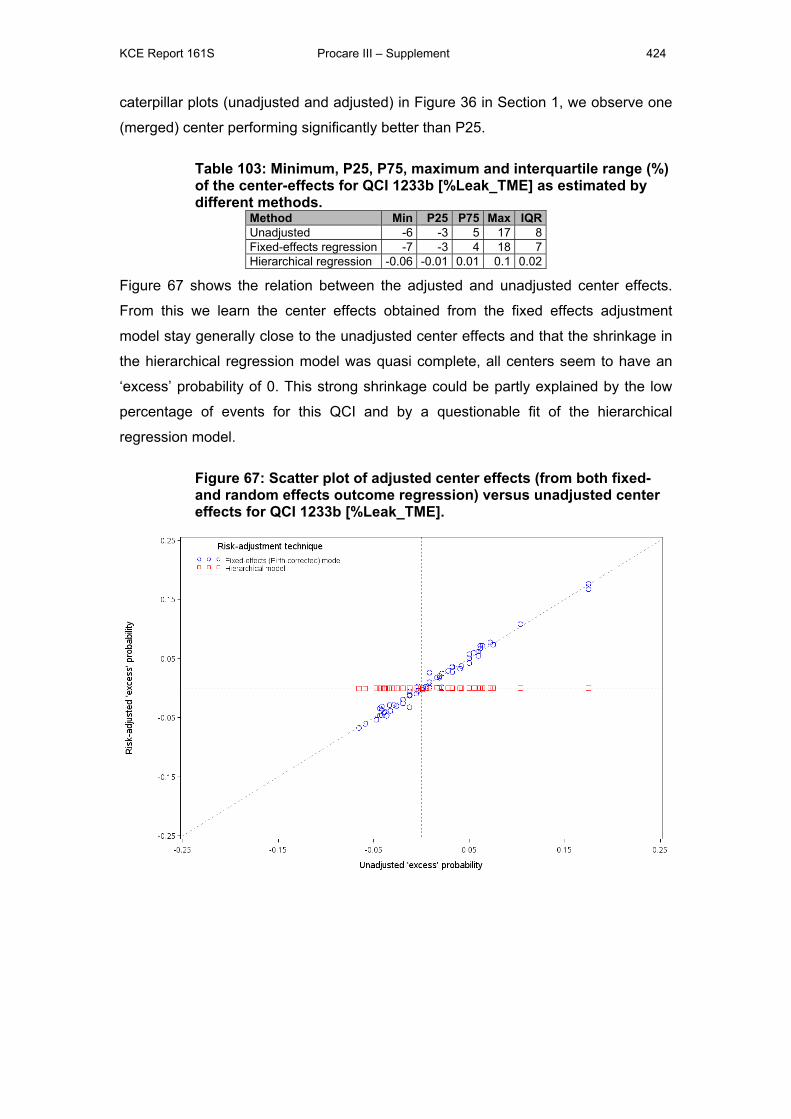
KCE Report 161S Procare III – Supplement 424
caterpillar plots (unadjusted and adjusted) in Figure 36 in Section 1, we observe one
(merged) center performing significantly better than P25.
Table 103: Minimum, P25, P75, maximum and interquartile range (%) of the center-effects for QCI 1233b [%Leak_TME] as estimated by different methods.
Method Min P25 P75 Max IQRUnadjusted -6 -3 5 17 8Fixed-effects regression -7 -3 4 18 7Hierarchical regression -0.06 -0.01 0.01 0.1 0.02
Figure 67 shows the relation between the adjusted and unadjusted center effects.
From this we learn the center effects obtained from the fixed effects adjustment
model stay generally close to the unadjusted center effects and that the shrinkage in
the hierarchical regression model was quasi complete, all centers seem to have an
‘excess’ probability of 0. This strong shrinkage could be partly explained by the low
percentage of events for this QCI and by a questionable fit of the hierarchical
regression model.
Figure 67: Scatter plot of adjusted center effects (from both fixed- and random effects outcome regression) versus unadjusted center effects for QCI 1233b [%Leak_TME].

KCE Report 161S Procare III – Supplement 425
2.4.6 Inpatient or 30-day mortality (QCI 1234, outcome)
2.4.6.1 Definition N: Number of patients in denominator who died within 30 days after surgery.
D: Number of patients treated with radical surgical resection and for whom it is known
whether they died within 30 days after surgery and for whom the dates of surgery
and survival or death are known.
Note that this definition was changed by PROCARE (deletion of the condition ‘who
died in hospital or within …’ in both denominator and numerator) since the
information about inpatient mortality was not reliable.
Note that – contrary to most other QCIs - fulfilling the QCI is not a positive event.
2.4.6.2 Description There are 2919 of the 3318 (88%) patients in the PROCARE database eligible for
this QCI. Of these 2919 patients, 50 (2% both weighted and unweighted) died within
30 days after surgery. The proportion of patients that achieved the QCI is shown in
Table 42 (per size-grouped center) and Figure 37 (per participating center, after
merging all centers with less than five eligible patients in one overlapping center) in
Section 1. This proportion ranges from 0% in 35 of the 68 (merged) centers to 13% in
one (merged) center. The funnel plot does not point to systematic variation between
the centers.
2.4.6.3 Identification of relevant prognostic factors Prognostic factors identified in the literature review of Appendix 2
In Appendix 2 no prognostic factors for were identified for this QCI.
Prognostic factors identified in the PROCARE consensus on risk/confounding
factors per QCI
In the PROCARE consensus the factors age, ASA score, emergency surgery, ca
excision and HCT were identified as possible prognostic factors for this QCI. The
former three will be considered in the model building procedure, but the latter two are
1) not pre-treatment variables and 2) not found in the PROCARE database and will
therefore not be considered in our risk-adjustment model.
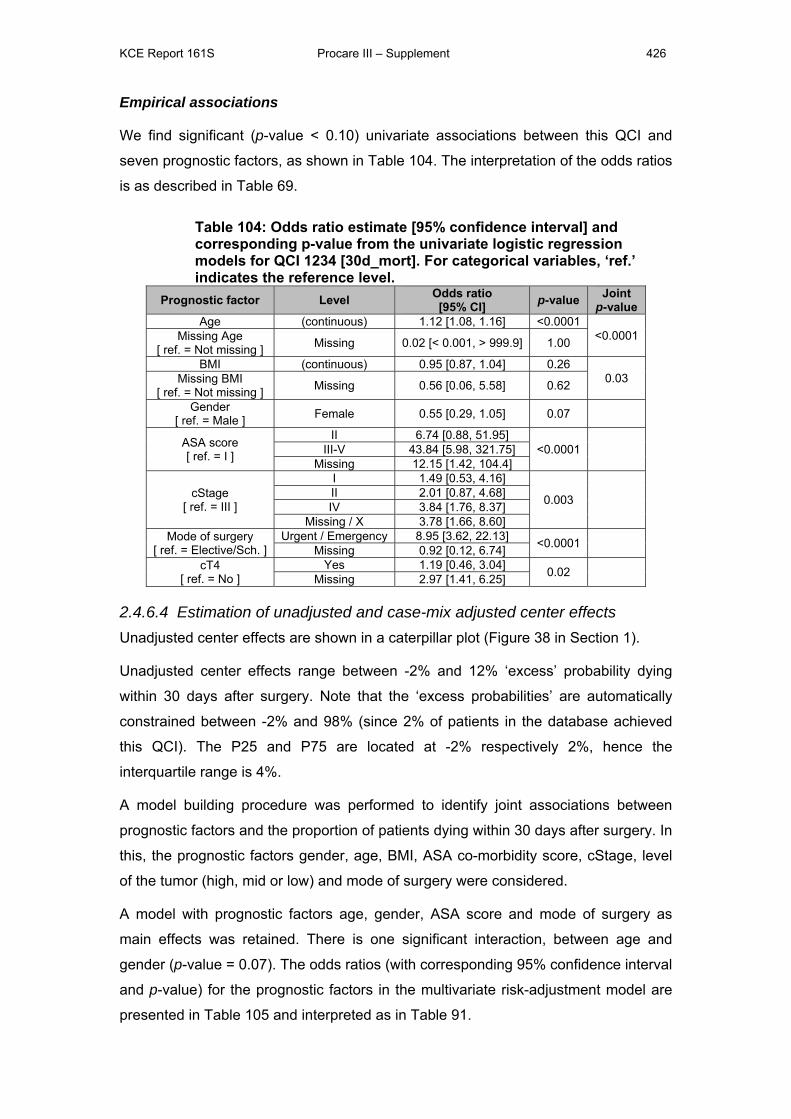
KCE Report 161S Procare III – Supplement 426
Empirical associations
We find significant (p-value < 0.10) univariate associations between this QCI and
seven prognostic factors, as shown in Table 104. The interpretation of the odds ratios
is as described in Table 69.
Table 104: Odds ratio estimate [95% confidence interval] and corresponding p-value from the univariate logistic regression models for QCI 1234 [30d_mort]. For categorical variables, ‘ref.’ indicates the reference level.
Prognostic factor Level Odds ratio [95% CI] p-value Joint
p-value Age (continuous) 1.12 [1.08, 1.16] <0.0001
<0.0001 Missing Age [ ref. = Not missing ] Missing 0.02 [< 0.001, > 999.9] 1.00
BMI (continuous) 0.95 [0.87, 1.04] 0.26 0.03 Missing BMI
[ ref. = Not missing ] Missing 0.56 [0.06, 5.58] 0.62
Gender [ ref. = Male ] Female 0.55 [0.29, 1.05] 0.07
ASA score [ ref. = I ]
II 6.74 [0.88, 51.95] <0.0001
III-V 43.84 [5.98, 321.75]
Missing 12.15 [1.42, 104.4]
cStage [ ref. = III ]
I 1.49 [0.53, 4.16]
0.003
II 2.01 [0.87, 4.68] IV 3.84 [1.76, 8.37]
Missing / X 3.78 [1.66, 8.60] Mode of surgery
[ ref. = Elective/Sch. ] Urgent / Emergency 8.95 [3.62, 22.13] <0.0001
Missing 0.92 [0.12, 6.74] cT4
[ ref. = No ] Yes 1.19 [0.46, 3.04] 0.02
Missing 2.97 [1.41, 6.25]
2.4.6.4 Estimation of unadjusted and case-mix adjusted center effects Unadjusted center effects are shown in a caterpillar plot (Figure 38 in Section 1).
Unadjusted center effects range between -2% and 12% ‘excess’ probability dying
within 30 days after surgery. Note that the ‘excess probabilities’ are automatically
constrained between -2% and 98% (since 2% of patients in the database achieved
this QCI). The P25 and P75 are located at -2% respectively 2%, hence the
interquartile range is 4%.
A model building procedure was performed to identify joint associations between
prognostic factors and the proportion of patients dying within 30 days after surgery. In
this, the prognostic factors gender, age, BMI, ASA co-morbidity score, cStage, level
of the tumor (high, mid or low) and mode of surgery were considered.
A model with prognostic factors age, gender, ASA score and mode of surgery as
main effects was retained. There is one significant interaction, between age and
gender (p-value = 0.07). The odds ratios (with corresponding 95% confidence interval
and p-value) for the prognostic factors in the multivariate risk-adjustment model are
presented in Table 105 and interpreted as in Table 91.
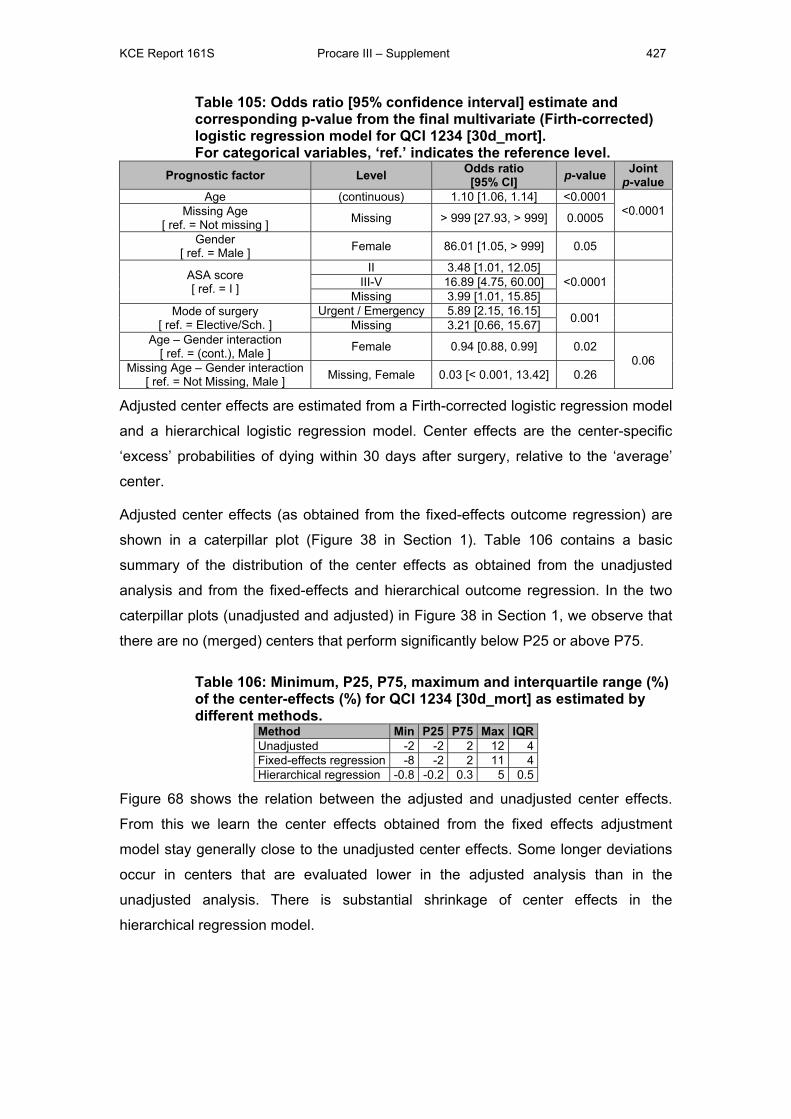
KCE Report 161S Procare III – Supplement 427
Table 105: Odds ratio [95% confidence interval] estimate and corresponding p-value from the final multivariate (Firth-corrected) logistic regression model for QCI 1234 [30d_mort]. For categorical variables, ‘ref.’ indicates the reference level.
Prognostic factor Level Odds ratio [95% CI] p-value Joint
p-value Age (continuous) 1.10 [1.06, 1.14] <0.0001
<0.0001 Missing Age [ ref. = Not missing ] Missing > 999 [27.93, > 999] 0.0005
Gender [ ref. = Male ] Female 86.01 [1.05, > 999] 0.05
ASA score [ ref. = I ]
II 3.48 [1.01, 12.05] <0.0001
III-V 16.89 [4.75, 60.00]
Missing 3.99 [1.01, 15.85] Mode of surgery
[ ref. = Elective/Sch. ] Urgent / Emergency 5.89 [2.15, 16.15] 0.001
Missing 3.21 [0.66, 15.67] Age – Gender interaction
[ ref. = (cont.), Male ] Female 0.94 [0.88, 0.99] 0.02 0.06 Missing Age – Gender interaction
[ ref. = Not Missing, Male ] Missing, Female 0.03 [< 0.001, 13.42] 0.26
Adjusted center effects are estimated from a Firth-corrected logistic regression model
and a hierarchical logistic regression model. Center effects are the center-specific
‘excess’ probabilities of dying within 30 days after surgery, relative to the ‘average’
center.
Adjusted center effects (as obtained from the fixed-effects outcome regression) are
shown in a caterpillar plot (Figure 38 in Section 1). Table 106 contains a basic
summary of the distribution of the center effects as obtained from the unadjusted
analysis and from the fixed-effects and hierarchical outcome regression. In the two
caterpillar plots (unadjusted and adjusted) in Figure 38 in Section 1, we observe that
there are no (merged) centers that perform significantly below P25 or above P75.
Table 106: Minimum, P25, P75, maximum and interquartile range (%) of the center-effects (%) for QCI 1234 [30d_mort] as estimated by different methods.
Method Min P25 P75 Max IQRUnadjusted -2 -2 2 12 4Fixed-effects regression -8 -2 2 11 4Hierarchical regression -0.8 -0.2 0.3 5 0.5
Figure 68 shows the relation between the adjusted and unadjusted center effects.
From this we learn the center effects obtained from the fixed effects adjustment
model stay generally close to the unadjusted center effects. Some longer deviations
occur in centers that are evaluated lower in the adjusted analysis than in the
unadjusted analysis. There is substantial shrinkage of center effects in the
hierarchical regression model.
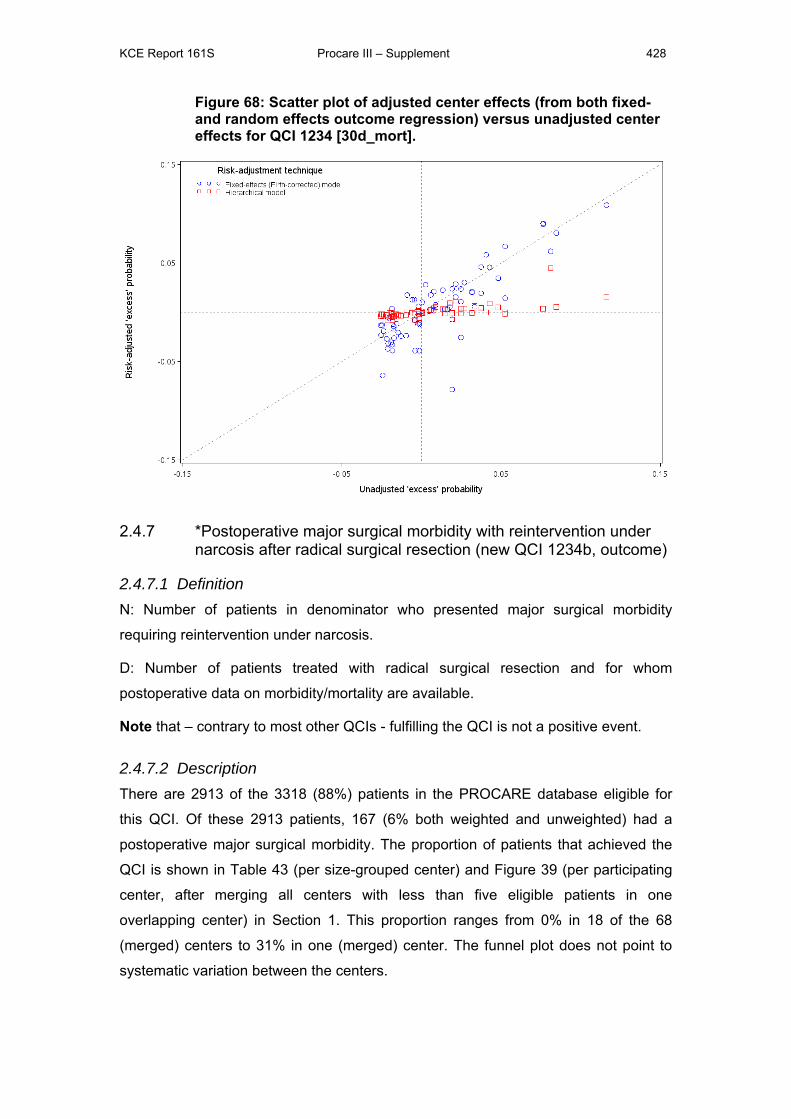
KCE Report 161S Procare III – Supplement 428
Figure 68: Scatter plot of adjusted center effects (from both fixed- and random effects outcome regression) versus unadjusted center effects for QCI 1234 [30d_mort].
2.4.7 *Postoperative major surgical morbidity with reintervention under narcosis after radical surgical resection (new QCI 1234b, outcome)
2.4.7.1 Definition N: Number of patients in denominator who presented major surgical morbidity
requiring reintervention under narcosis.
D: Number of patients treated with radical surgical resection and for whom
postoperative data on morbidity/mortality are available.
Note that – contrary to most other QCIs - fulfilling the QCI is not a positive event.
2.4.7.2 Description There are 2913 of the 3318 (88%) patients in the PROCARE database eligible for
this QCI. Of these 2913 patients, 167 (6% both weighted and unweighted) had a
postoperative major surgical morbidity. The proportion of patients that achieved the
QCI is shown in Table 43 (per size-grouped center) and Figure 39 (per participating
center, after merging all centers with less than five eligible patients in one
overlapping center) in Section 1. This proportion ranges from 0% in 18 of the 68
(merged) centers to 31% in one (merged) center. The funnel plot does not point to
systematic variation between the centers.
KCE Report 161S Procare III – Supplement 429
2.4.7.3 Identification of relevant prognostic factors Prognostic factors identified in the literature review of Appendix 2
In Appendix 2 no prognostic factors for were identified for this QCI.
Prognostic factors identified in the PROCARE consensus on risk/confounding
factors per QCI
In the PROCARE consensus the factors age, ASA score and emergency surgery
were identified and will be considered as possible prognostic factors for this QCI.
Empirical associations
We find significant (p-value < 0.10) univariate associations between this QCI and two
prognostic factors, as shown in Table 107. The interpretation of the odds ratios is as
described in Table 69.
Table 107: Odds ratio estimate [95% confidence interval] and corresponding p-value from the univariate logistic regression models for QCI 1234b [%Major_morb]. For categorical variables, ‘ref.’ indicates the reference level.
Prognostic factor Level Odds ratio [95% CI] p-value
ASA score [ ref. = I ]
II 0.90 [0.61, 1.32] 0.05 III-V 1.30 [0.84, 2.01]
Missing 0.50 [0.24, 1.03]
Level [ ref. = Low ]
Mid 2.06 [1.42, 2.97] 0.001 High 1.77 [1.12, 2.80]
Missing 0.94 [0.29, 3.10]
2.4.7.4 Estimation of unadjusted and case mix adjusted center effects Unadjusted center effects are shown in a caterpillar plot (Figure 40 in Section 1).
Unadjusted center effects range between -6% and 19% ‘excess’ probability having
postoperative major surgical morbidity. Note that the ‘excess probabilities’ are
automatically constrained between -6% and 94% (since 6% of patients in the
database achieved this QCI). The P25 and P75 are located at -2% respectively 3%,
hence the interquartile range is 5%.
A model building procedure was performed to identify joint associations between
prognostic factors and the proportion of patients having postoperative major surgical
morbidity. In this, the prognostic factors gender, age, BMI, ASA co-morbidity score,
cStage, level of the tumor (high, mid or low) and mode of surgery were considered.
A model with prognostic factors age, gender, ASA score and tumor level as main
effects was retained. There are two significant interactions, between age and ASA
score (p-value = 0.0230) and gender and ASA score (p-value = 0.0867). The odds
ratios (with corresponding 95% confidence interval and p-value) for the prognostic
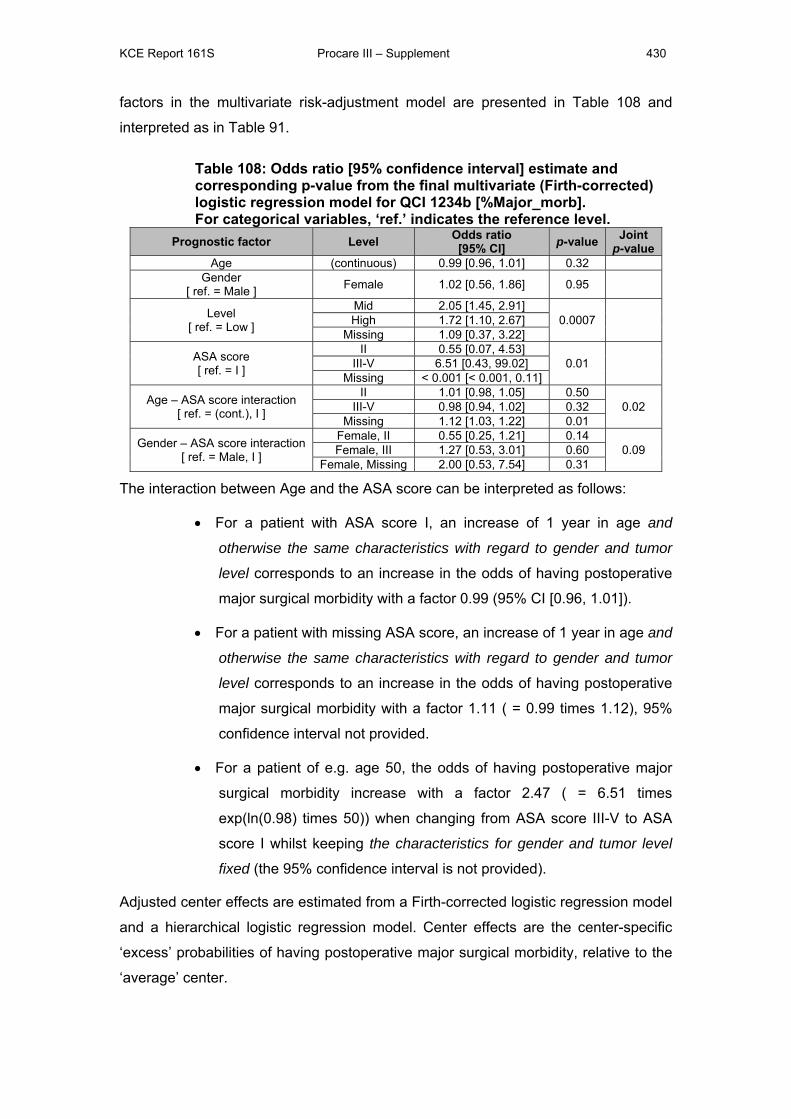
KCE Report 161S Procare III – Supplement 430
factors in the multivariate risk-adjustment model are presented in Table 108 and
interpreted as in Table 91.
Table 108: Odds ratio [95% confidence interval] estimate and corresponding p-value from the final multivariate (Firth-corrected) logistic regression model for QCI 1234b [%Major_morb]. For categorical variables, ‘ref.’ indicates the reference level.
Prognostic factor Level Odds ratio [95% CI] p-value Joint
p-value Age (continuous) 0.99 [0.96, 1.01] 0.32
Gender [ ref. = Male ] Female 1.02 [0.56, 1.86] 0.95
Level [ ref. = Low ]
Mid 2.05 [1.45, 2.91] 0.0007
High 1.72 [1.10, 2.67]
Missing 1.09 [0.37, 3.22]
ASA score [ ref. = I ]
II 0.55 [0.07, 4.53] 0.01
III-V 6.51 [0.43, 99.02]
Missing < 0.001 [< 0.001, 0.11]
Age – ASA score interaction [ ref. = (cont.), I ]
II 1.01 [0.98, 1.05] 0.50 0.02 III-V 0.98 [0.94, 1.02] 0.32
Missing 1.12 [1.03, 1.22] 0.01
Gender – ASA score interaction [ ref. = Male, I ]
Female, II 0.55 [0.25, 1.21] 0.14 0.09 Female, III 1.27 [0.53, 3.01] 0.60
Female, Missing 2.00 [0.53, 7.54] 0.31
The interaction between Age and the ASA score can be interpreted as follows:
• For a patient with ASA score I, an increase of 1 year in age and
otherwise the same characteristics with regard to gender and tumor
level corresponds to an increase in the odds of having postoperative
major surgical morbidity with a factor 0.99 (95% CI [0.96, 1.01]).
• For a patient with missing ASA score, an increase of 1 year in age and
otherwise the same characteristics with regard to gender and tumor
level corresponds to an increase in the odds of having postoperative
major surgical morbidity with a factor 1.11 ( = 0.99 times 1.12), 95%
confidence interval not provided.
• For a patient of e.g. age 50, the odds of having postoperative major
surgical morbidity increase with a factor 2.47 ( = 6.51 times
exp(ln(0.98) times 50)) when changing from ASA score III-V to ASA
score I whilst keeping the characteristics for gender and tumor level
fixed (the 95% confidence interval is not provided).
Adjusted center effects are estimated from a Firth-corrected logistic regression model
and a hierarchical logistic regression model. Center effects are the center-specific
‘excess’ probabilities of having postoperative major surgical morbidity, relative to the
‘average’ center.
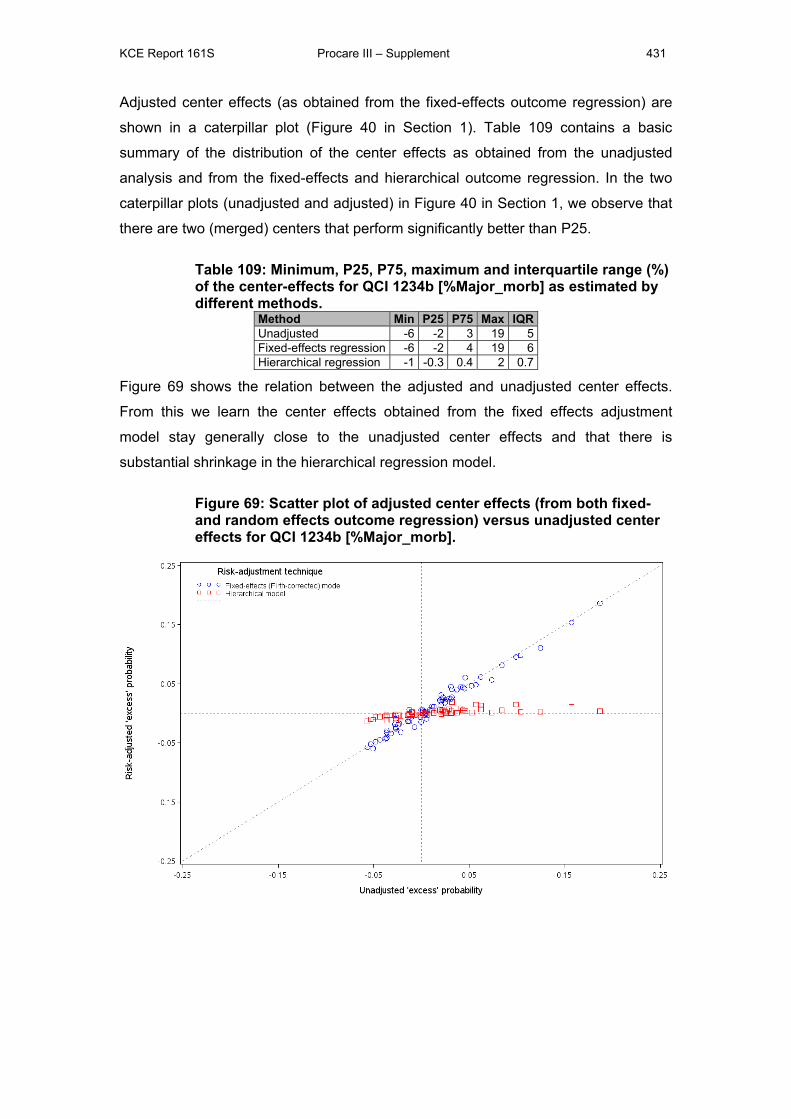
KCE Report 161S Procare III – Supplement 431
Adjusted center effects (as obtained from the fixed-effects outcome regression) are
shown in a caterpillar plot (Figure 40 in Section 1). Table 109 contains a basic
summary of the distribution of the center effects as obtained from the unadjusted
analysis and from the fixed-effects and hierarchical outcome regression. In the two
caterpillar plots (unadjusted and adjusted) in Figure 40 in Section 1, we observe that
there are two (merged) centers that perform significantly better than P25.
Table 109: Minimum, P25, P75, maximum and interquartile range (%) of the center-effects for QCI 1234b [%Major_morb] as estimated by different methods.
Method Min P25 P75 Max IQRUnadjusted -6 -2 3 19 5Fixed-effects regression -6 -2 4 19 6Hierarchical regression -1 -0.3 0.4 2 0.7
Figure 69 shows the relation between the adjusted and unadjusted center effects.
From this we learn the center effects obtained from the fixed effects adjustment
model stay generally close to the unadjusted center effects and that there is
substantial shrinkage in the hierarchical regression model.
Figure 69: Scatter plot of adjusted center effects (from both fixed- and random effects outcome regression) versus unadjusted center effects for QCI 1234b [%Major_morb].
KCE Report 161S Procare III – Supplement 432
2.4.8 *Rate of intra-operative rectal perforation (QCI 1235, outcome)
2.4.8.1 Definition N: Number of patients in denominator for whom the surgeon and/or pathologist
reported rectal perforation.
D: Number of patients treated with radical surgical resection and for whom
perforation of the rectum (yes or no) is reported by either the surgeon or the
pathologist.
Note that – contrary to most other QCIs - fulfilling the QCI is not a positive event.
2.4.8.2 Description There are 2900 of the 3318 (87%) patients in the PROCARE database eligible for
this QCI. Of these 2900 patients, 220 (8% both weighted and unweighted) had an
intra-operative rectal perforation. The proportion of patients that achieved the QCI is
shown in Table 44 (per size-grouped center) and Figure 41 (per participating center,
after merging all centers with less than five eligible patients in one overlapping
center) in Section 1. This proportion ranges from 0% in 14 of the 68 (merged) centers
to 33% in one (merged) center. The funnel plot does not point to systematic variation
between the centers.
2.4.8.3 Identification of relevant prognostic factors Prognostic factors identified in the literature review of Appendix 2
In Appendix 2 no prognostic factors for were identified for this QCI.
Prognostic factors identified in the PROCARE consensus on risk/confounding
factors per QCI
In the PROCARE consensus the factor age is identified and will be considered as
possible prognostic factors for this QCI.
Empirical associations
We find significant (p-value < 0.10) univariate associations between this QCI and
seven prognostic factors, as shown in Table 110. The interpretation of the odds ratios
is as described in Table 69.
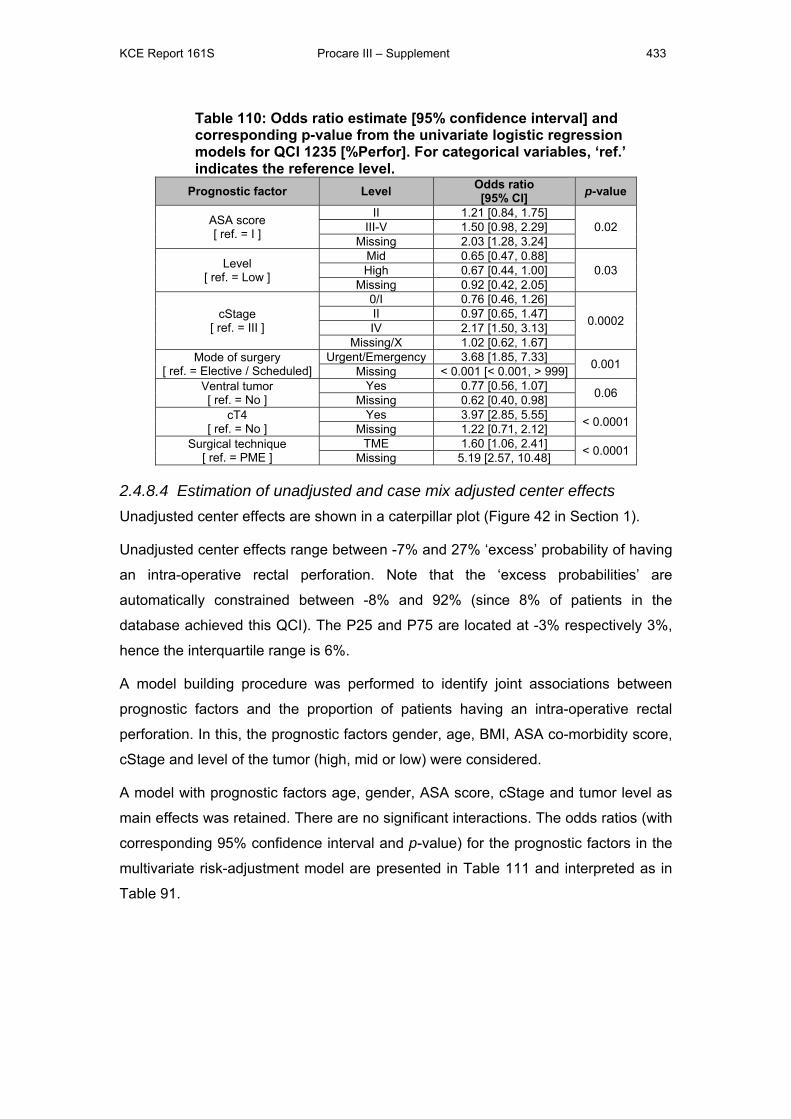
KCE Report 161S Procare III – Supplement 433
Table 110: Odds ratio estimate [95% confidence interval] and corresponding p-value from the univariate logistic regression models for QCI 1235 [%Perfor]. For categorical variables, ‘ref.’ indicates the reference level.
Prognostic factor Level Odds ratio [95% CI] p-value
ASA score [ ref. = I ]
II 1.21 [0.84, 1.75] 0.02 III-V 1.50 [0.98, 2.29]
Missing 2.03 [1.28, 3.24]
Level [ ref. = Low ]
Mid 0.65 [0.47, 0.88] 0.03 High 0.67 [0.44, 1.00]
Missing 0.92 [0.42, 2.05]
cStage [ ref. = III ]
0/I 0.76 [0.46, 1.26]
0.0002 II 0.97 [0.65, 1.47] IV 2.17 [1.50, 3.13]
Missing/X 1.02 [0.62, 1.67] Mode of surgery
[ ref. = Elective / Scheduled] Urgent/Emergency 3.68 [1.85, 7.33] 0.001 Missing < 0.001 [< 0.001, > 999]
Ventral tumor [ ref. = No ]
Yes 0.77 [0.56, 1.07] 0.06 Missing 0.62 [0.40, 0.98] cT4
[ ref. = No ] Yes 3.97 [2.85, 5.55] < 0.0001 Missing 1.22 [0.71, 2.12]
Surgical technique [ ref. = PME ]
TME 1.60 [1.06, 2.41] < 0.0001 Missing 5.19 [2.57, 10.48]
2.4.8.4 Estimation of unadjusted and case mix adjusted center effects Unadjusted center effects are shown in a caterpillar plot (Figure 42 in Section 1).
Unadjusted center effects range between -7% and 27% ‘excess’ probability of having
an intra-operative rectal perforation. Note that the ‘excess probabilities’ are
automatically constrained between -8% and 92% (since 8% of patients in the
database achieved this QCI). The P25 and P75 are located at -3% respectively 3%,
hence the interquartile range is 6%.
A model building procedure was performed to identify joint associations between
prognostic factors and the proportion of patients having an intra-operative rectal
perforation. In this, the prognostic factors gender, age, BMI, ASA co-morbidity score,
cStage and level of the tumor (high, mid or low) were considered.
A model with prognostic factors age, gender, ASA score, cStage and tumor level as
main effects was retained. There are no significant interactions. The odds ratios (with
corresponding 95% confidence interval and p-value) for the prognostic factors in the
multivariate risk-adjustment model are presented in Table 111 and interpreted as in
Table 91.
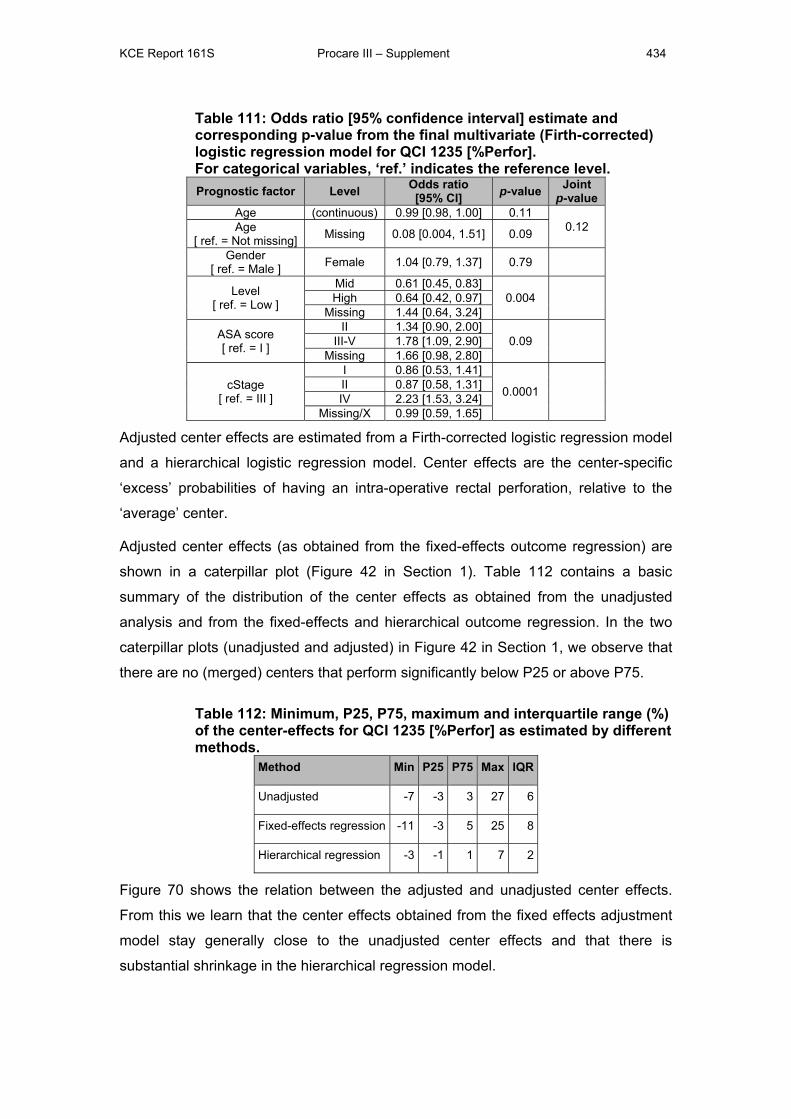
KCE Report 161S Procare III – Supplement 434
Table 111: Odds ratio [95% confidence interval] estimate and corresponding p-value from the final multivariate (Firth-corrected) logistic regression model for QCI 1235 [%Perfor]. For categorical variables, ‘ref.’ indicates the reference level. Prognostic factor Level Odds ratio
[95% CI] p-value Joint p-value
Age (continuous) 0.99 [0.98, 1.00] 0.11 0.12 Age
[ ref. = Not missing] Missing 0.08 [0.004, 1.51] 0.09
Gender [ ref. = Male ] Female 1.04 [0.79, 1.37] 0.79
Level [ ref. = Low ]
Mid 0.61 [0.45, 0.83] 0.004
High 0.64 [0.42, 0.97]
Missing 1.44 [0.64, 3.24]
ASA score [ ref. = I ]
II 1.34 [0.90, 2.00] 0.09
III-V 1.78 [1.09, 2.90]
Missing 1.66 [0.98, 2.80]
cStage [ ref. = III ]
I 0.86 [0.53, 1.41]
0.0001
II 0.87 [0.58, 1.31] IV 2.23 [1.53, 3.24]
Missing/X 0.99 [0.59, 1.65]
Adjusted center effects are estimated from a Firth-corrected logistic regression model
and a hierarchical logistic regression model. Center effects are the center-specific
‘excess’ probabilities of having an intra-operative rectal perforation, relative to the
‘average’ center.
Adjusted center effects (as obtained from the fixed-effects outcome regression) are
shown in a caterpillar plot (Figure 42 in Section 1). Table 112 contains a basic
summary of the distribution of the center effects as obtained from the unadjusted
analysis and from the fixed-effects and hierarchical outcome regression. In the two
caterpillar plots (unadjusted and adjusted) in Figure 42 in Section 1, we observe that
there are no (merged) centers that perform significantly below P25 or above P75.
Table 112: Minimum, P25, P75, maximum and interquartile range (%) of the center-effects for QCI 1235 [%Perfor] as estimated by different methods.
Method Min P25 P75 Max IQR
Unadjusted -7 -3 3 27 6
Fixed-effects regression -11 -3 5 25 8
Hierarchical regression -3 -1 1 7 2
Figure 70 shows the relation between the adjusted and unadjusted center effects.
From this we learn that the center effects obtained from the fixed effects adjustment
model stay generally close to the unadjusted center effects and that there is
substantial shrinkage in the hierarchical regression model.

KCE Report 161S Procare III – Supplement 435
Figure 70: Scatter plot of adjusted center effects (from both fixed- and random effects outcome regression) versus unadjusted center effects for QCI 1235 [%Perfor].
2.4.9 *(y)p Distal margin involved (positive) after SSO or Hartmann for low rectal cancer (≤ 5 cm) (new QCI 1235b, outcome)
2.4.9.1 Definition N: Number of patients in denominator for whom the (y)p distal margin is invaded.
D: Number of patients treated with Hartmann’s procedure or SSO for rectal cancer in
the lower third and for whom it is reported whether the (y)p distal margin is free or
invaded.
Note that – contrary to most other QCIs - fulfilling the QCI is not a positive event.
2.4.9.2 Description There are 516 of the 3318 (16%) patients in the PROCARE database eligible for this
QCI. Of these 516 patients, 9 (2% both weighted and unweighted) had an involved
(y)p distal margin. The proportion of patients that achieved the QCI is shown in Table
45 (per size-grouped center) and Figure 43 (per participating center, after merging all
centers with less than five eligible patients in one overlapping center) in Section 1.
This proportion ranges from 0% in 21 of the 28 (merged) centers to 22% in one
(merged) center. The funnel plot does not point to systematic variation between the
centers.
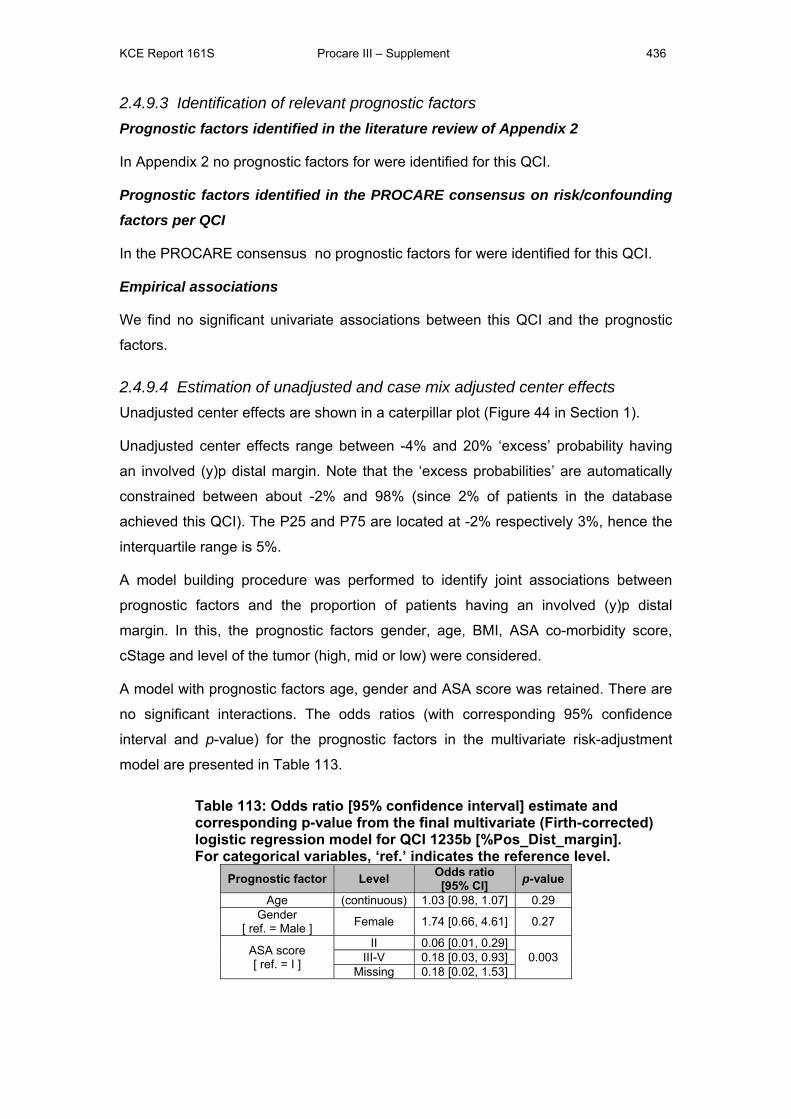
KCE Report 161S Procare III – Supplement 436
2.4.9.3 Identification of relevant prognostic factors Prognostic factors identified in the literature review of Appendix 2
In Appendix 2 no prognostic factors for were identified for this QCI.
Prognostic factors identified in the PROCARE consensus on risk/confounding
factors per QCI
In the PROCARE consensus no prognostic factors for were identified for this QCI.
Empirical associations
We find no significant univariate associations between this QCI and the prognostic
factors.
2.4.9.4 Estimation of unadjusted and case mix adjusted center effects Unadjusted center effects are shown in a caterpillar plot (Figure 44 in Section 1).
Unadjusted center effects range between -4% and 20% ‘excess’ probability having
an involved (y)p distal margin. Note that the ‘excess probabilities’ are automatically
constrained between about -2% and 98% (since 2% of patients in the database
achieved this QCI). The P25 and P75 are located at -2% respectively 3%, hence the
interquartile range is 5%.
A model building procedure was performed to identify joint associations between
prognostic factors and the proportion of patients having an involved (y)p distal
margin. In this, the prognostic factors gender, age, BMI, ASA co-morbidity score,
cStage and level of the tumor (high, mid or low) were considered.
A model with prognostic factors age, gender and ASA score was retained. There are
no significant interactions. The odds ratios (with corresponding 95% confidence
interval and p-value) for the prognostic factors in the multivariate risk-adjustment
model are presented in Table 113.
Table 113: Odds ratio [95% confidence interval] estimate and corresponding p-value from the final multivariate (Firth-corrected) logistic regression model for QCI 1235b [%Pos_Dist_margin]. For categorical variables, ‘ref.’ indicates the reference level.
Prognostic factor Level Odds ratio [95% CI] p-value
Age (continuous) 1.03 [0.98, 1.07] 0.29 Gender
[ ref. = Male ] Female 1.74 [0.66, 4.61] 0.27
ASA score [ ref. = I ]
II 0.06 [0.01, 0.29] 0.003 III-V 0.18 [0.03, 0.93]
Missing 0.18 [0.02, 1.53]
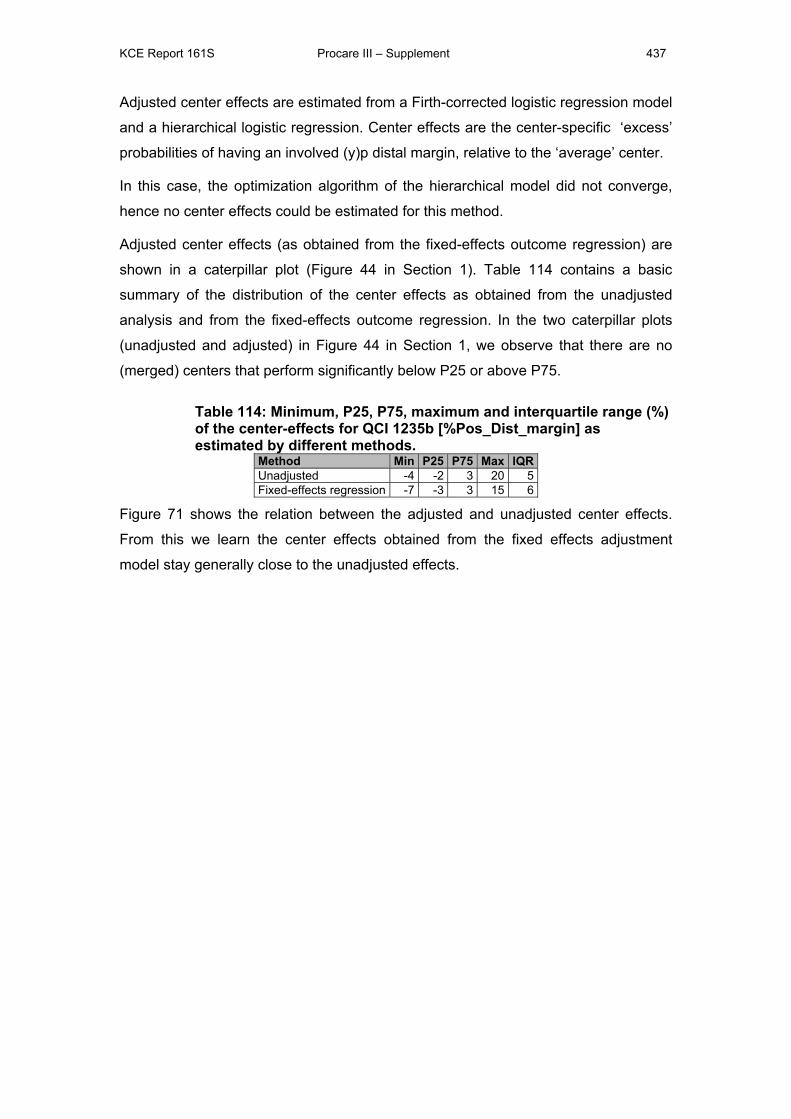
KCE Report 161S Procare III – Supplement 437
Adjusted center effects are estimated from a Firth-corrected logistic regression model
and a hierarchical logistic regression. Center effects are the center-specific ‘excess’
probabilities of having an involved (y)p distal margin, relative to the ‘average’ center.
In this case, the optimization algorithm of the hierarchical model did not converge,
hence no center effects could be estimated for this method.
Adjusted center effects (as obtained from the fixed-effects outcome regression) are
shown in a caterpillar plot (Figure 44 in Section 1). Table 114 contains a basic
summary of the distribution of the center effects as obtained from the unadjusted
analysis and from the fixed-effects outcome regression. In the two caterpillar plots
(unadjusted and adjusted) in Figure 44 in Section 1, we observe that there are no
(merged) centers that perform significantly below P25 or above P75.
Table 114: Minimum, P25, P75, maximum and interquartile range (%) of the center-effects for QCI 1235b [%Pos_Dist_margin] as estimated by different methods.
Method Min P25 P75 Max IQRUnadjusted -4 -2 3 20 5Fixed-effects regression -7 -3 3 15 6
Figure 71 shows the relation between the adjusted and unadjusted center effects.
From this we learn the center effects obtained from the fixed effects adjustment
model stay generally close to the unadjusted effects.
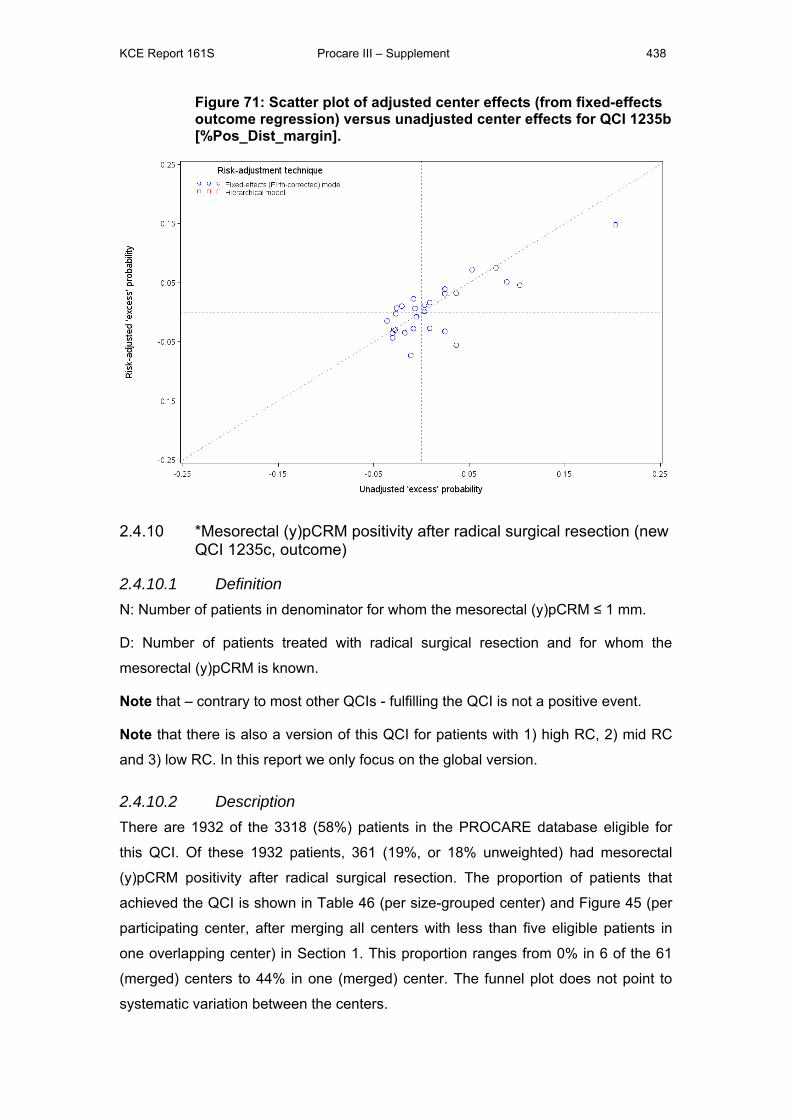
KCE Report 161S Procare III – Supplement 438
Figure 71: Scatter plot of adjusted center effects (from fixed-effects outcome regression) versus unadjusted center effects for QCI 1235b [%Pos_Dist_margin].
2.4.10 *Mesorectal (y)pCRM positivity after radical surgical resection (new QCI 1235c, outcome)
2.4.10.1 Definition N: Number of patients in denominator for whom the mesorectal (y)pCRM ≤ 1 mm.
D: Number of patients treated with radical surgical resection and for whom the
mesorectal (y)pCRM is known.
Note that – contrary to most other QCIs - fulfilling the QCI is not a positive event.
Note that there is also a version of this QCI for patients with 1) high RC, 2) mid RC
and 3) low RC. In this report we only focus on the global version.
2.4.10.2 Description There are 1932 of the 3318 (58%) patients in the PROCARE database eligible for
this QCI. Of these 1932 patients, 361 (19%, or 18% unweighted) had mesorectal
(y)pCRM positivity after radical surgical resection. The proportion of patients that
achieved the QCI is shown in Table 46 (per size-grouped center) and Figure 45 (per
participating center, after merging all centers with less than five eligible patients in
one overlapping center) in Section 1. This proportion ranges from 0% in 6 of the 61
(merged) centers to 44% in one (merged) center. The funnel plot does not point to
systematic variation between the centers.
KCE Report 161S Procare III – Supplement 439
2.4.10.3 Identification of relevant prognostic factors Prognostic factors identified in the literature review of Appendix 2
In Appendix 2 no prognostic factors were identified for this QCI.
Prognostic factors identified in the PROCARE consensus on risk/confounding
factors per QCI
In the PROCARE consensus the prognostic factors ventral tumor, Ccrm positivity (<
5mm), (y)pStage, (y)pT and (y)pN were identified as possible prognostic factors for
this QCI. The former two will be considered in the model building step, but the other
three are not pre-treatment variables and hence not eligible for entering our risk
adjustment model.
Empirical associations
We find significant (p-value < 0.10) univariate associations between this QCI and
three prognostic factors, as shown in Table 115. The interpretation of the odds ratios
is as described in Table 69.
Table 115: Odds ratio estimate [95% confidence interval] and corresponding p-value from the univariate logistic regression models for QCI 1235c [%Pos_CRM]. For categorical variables, ‘ref.’ indicates the reference level.
Prognostic factor Level Odds ratio [95% CI] p-value
cStage [ ref. = III ]
0/I 0.27 [0.15, 0.47]
< 0.0001 II 0.85 [0.60, 1.19] IV 2.11 [1.53, 2.90]
Missing/X 1.49 [1.01, 2.21] Mode of surgery
[ ref. = Elective / Scheduled] Urgent/Emergency 2.55 [1.20, 5.41] 0.04 Missing 0.69 [0.27, 1.78]
cT4 [ ref. = No ]
Yes 3.74 [2.73, 5.15] < 0.0001 Missing 1.56 [1.01, 2.43]
2.4.10.4 Estimation of unadjusted and case mix adjusted center effects Unadjusted center effects are shown in a caterpillar plot (Figure 46 in Section 1).
Unadjusted center effects range between -15% and 26% ‘excess’ probability of
having mesorectal (y)pCRM positivity after radical surgical resection. Note that the
‘excess probabilities’ are automatically constrained between -19% and 81% (since
19% of patients in the database achieved this QCI). The P25 and P75 are located at
-6% respectively 9%, hence the interquartile range is 15%.
A model building procedure was performed to identify joint associations between
prognostic factors and the proportion of patients having mesorectal (y)pCRM
positivity after radical surgical resection. In this, the prognostic factors gender, age,
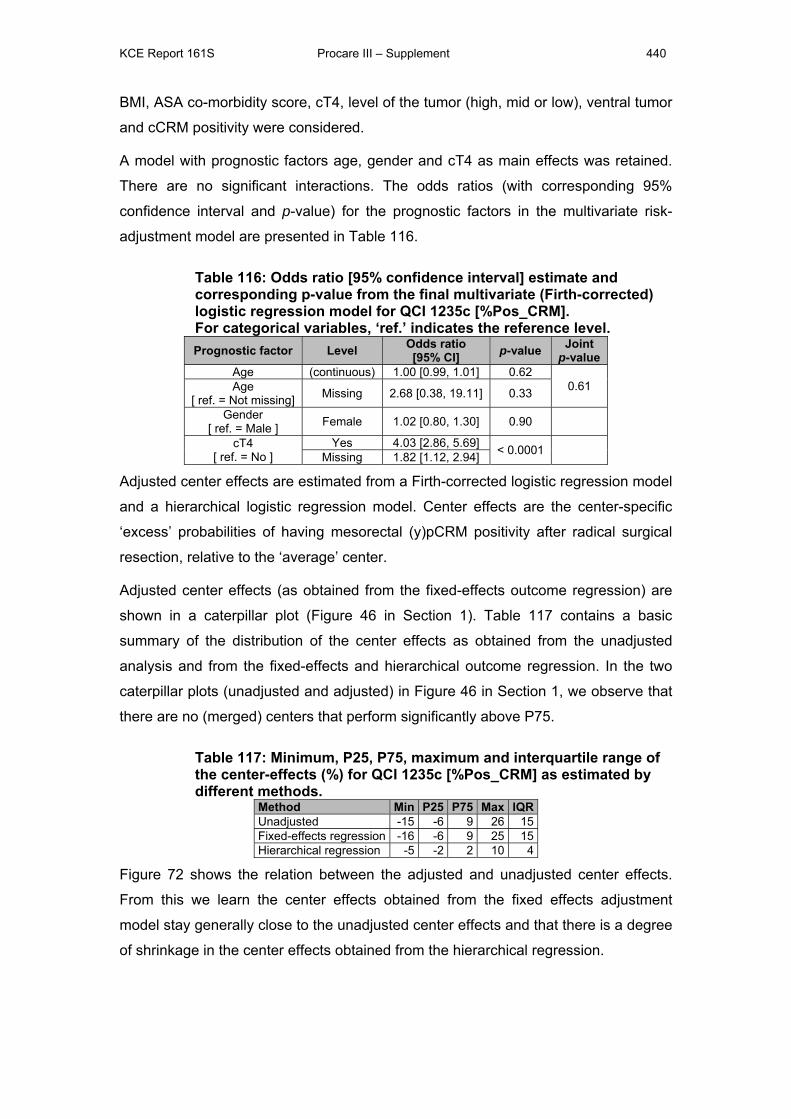
KCE Report 161S Procare III – Supplement 440
BMI, ASA co-morbidity score, cT4, level of the tumor (high, mid or low), ventral tumor
and cCRM positivity were considered.
A model with prognostic factors age, gender and cT4 as main effects was retained.
There are no significant interactions. The odds ratios (with corresponding 95%
confidence interval and p-value) for the prognostic factors in the multivariate risk-
adjustment model are presented in Table 116.
Table 116: Odds ratio [95% confidence interval] estimate and corresponding p-value from the final multivariate (Firth-corrected) logistic regression model for QCI 1235c [%Pos_CRM]. For categorical variables, ‘ref.’ indicates the reference level. Prognostic factor Level Odds ratio
[95% CI] p-value Joint p-value
Age (continuous) 1.00 [0.99, 1.01] 0.62 0.61 Age
[ ref. = Not missing] Missing 2.68 [0.38, 19.11] 0.33
Gender [ ref. = Male ] Female 1.02 [0.80, 1.30] 0.90
cT4 [ ref. = No ]
Yes 4.03 [2.86, 5.69] < 0.0001 Missing 1.82 [1.12, 2.94]
Adjusted center effects are estimated from a Firth-corrected logistic regression model
and a hierarchical logistic regression model. Center effects are the center-specific
‘excess’ probabilities of having mesorectal (y)pCRM positivity after radical surgical
resection, relative to the ‘average’ center.
Adjusted center effects (as obtained from the fixed-effects outcome regression) are
shown in a caterpillar plot (Figure 46 in Section 1). Table 117 contains a basic
summary of the distribution of the center effects as obtained from the unadjusted
analysis and from the fixed-effects and hierarchical outcome regression. In the two
caterpillar plots (unadjusted and adjusted) in Figure 46 in Section 1, we observe that
there are no (merged) centers that perform significantly above P75.
Table 117: Minimum, P25, P75, maximum and interquartile range of the center-effects (%) for QCI 1235c [%Pos_CRM] as estimated by different methods.
Method Min P25 P75 Max IQRUnadjusted -15 -6 9 26 15Fixed-effects regression -16 -6 9 25 15Hierarchical regression -5 -2 2 10 4
Figure 72 shows the relation between the adjusted and unadjusted center effects.
From this we learn the center effects obtained from the fixed effects adjustment
model stay generally close to the unadjusted center effects and that there is a degree
of shrinkage in the center effects obtained from the hierarchical regression.
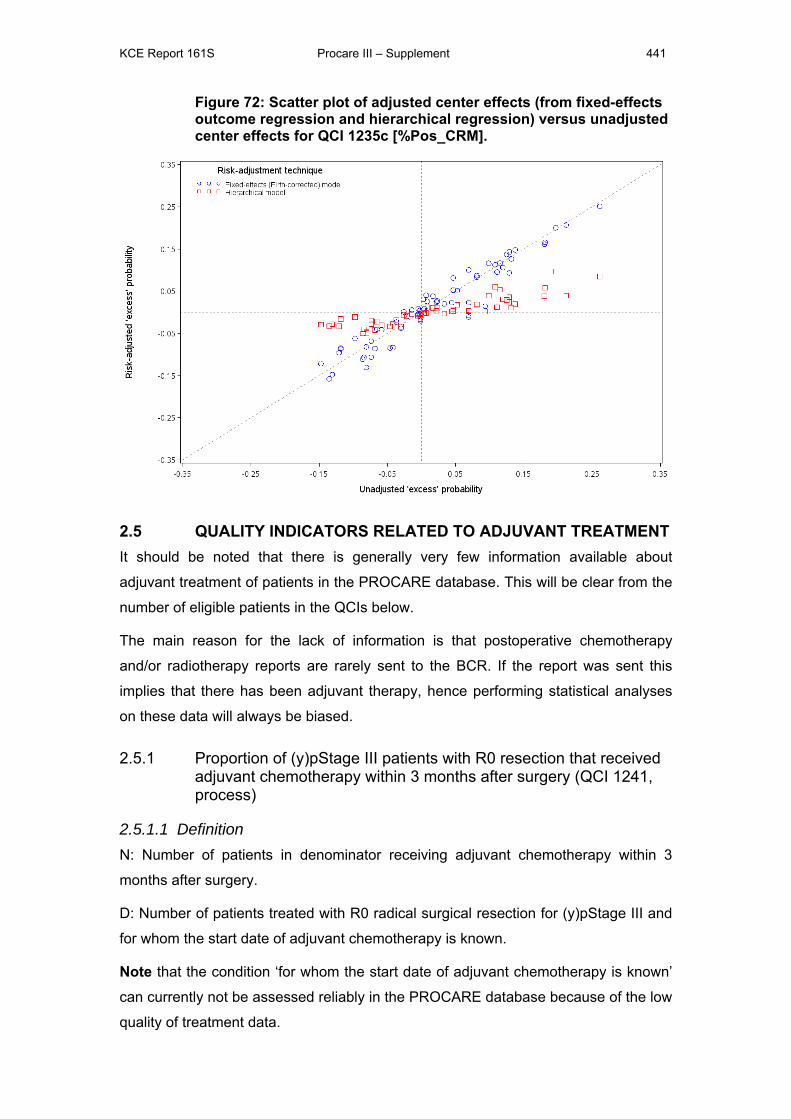
KCE Report 161S Procare III – Supplement 441
Figure 72: Scatter plot of adjusted center effects (from fixed-effects outcome regression and hierarchical regression) versus unadjusted center effects for QCI 1235c [%Pos_CRM].
2.5 QUALITY INDICATORS RELATED TO ADJUVANT TREATMENT It should be noted that there is generally very few information available about
adjuvant treatment of patients in the PROCARE database. This will be clear from the
number of eligible patients in the QCIs below.
The main reason for the lack of information is that postoperative chemotherapy
and/or radiotherapy reports are rarely sent to the BCR. If the report was sent this
implies that there has been adjuvant therapy, hence performing statistical analyses
on these data will always be biased.
2.5.1 Proportion of (y)pStage III patients with R0 resection that received adjuvant chemotherapy within 3 months after surgery (QCI 1241, process)
2.5.1.1 Definition N: Number of patients in denominator receiving adjuvant chemotherapy within 3
months after surgery.
D: Number of patients treated with R0 radical surgical resection for (y)pStage III and
for whom the start date of adjuvant chemotherapy is known.
Note that the condition ‘for whom the start date of adjuvant chemotherapy is known’
can currently not be assessed reliably in the PROCARE database because of the low
quality of treatment data.
KCE Report 161S Procare III – Supplement 442
2.5.1.2 Description There are 28 (or 1%) of the 3318 patients in the PROCARE database who meet the
criteria in the denominator and are hence eligible for this QCI. Of the eligible patients,
24 (86%, or 87% unweighted) achieved the QCI. The proportion of patients that
achieved the QCI is shown in Table 47 (per size-grouped center) in Section 1.
2.5.1.3 Univariate associations with prognostic factors Despite the very small number of eligible patients, we find a significant univariate
association between this QCI and the prognostic factor pre-operative incontinence,
as shown in Table 118. The interpretation of the odds ratio is as described in Table
69. Note that in the small subset of eligible patients, preoperative incontinence was
never missing (hence only the ‘Yes’ level).
Table 118: Odds ratio estimate [95% Wald confidence interval] and corresponding p-value from the univariate logistic regression models for QCI 1241 [%Adj-Chemo<3m]. For categorical variables, ‘ref.’ indicates the reference level.
Prognostic factor Level Odds ratio [95% CI] p-value
Preoper. incontinence [ ref. = No ] Yes 0.09 [0.01, 1.04] 0.05
2.5.1.4 Estimation of unadjusted center effects Given the very limited amount of information, it is not meaningful to estimate center
effects.
KCE Report 161S Procare III – Supplement 443
2.5.2 Proportion of pStage II-III patients with R0 resection that received adjuvant radiotherapy or chemoradiotherapy within 6 months after surgery (QCI 1242, process)
2.5.2.1 Definition N: Number of patients in denominator receiving adjuvant radio(chemo)therapy within
6 months after surgery.
D: Number of patients treated with R0 radical surgical resection for (y)pStage II or III
without neoadjuvant treatment and for whom the start date of adjuvant chemo and
the surgery date are known.
Note that the condition ‘without neoadjuvant treatment’ can currently not be
assessed reliably in the PROCARE database because of the low quality of treatment
data.
2.5.2.2 Description There are 46 (or 1%) of the 3318 patients in the PROCARE database who meet the
criteria in the denominator and are hence eligible for this QCI. Of the eligible patients,
45 (98%, or 99% unweighted) achieved the QCI. The proportion of patients that
achieved the QCI is shown in Table 48 (per size-grouped center) in Section 1.
2.5.2.3 Univariate associations with prognostic factors Given the very small number of eligible patients, we find no significant univariate
association between this QCI and any of the candidate prognostic factors.
2.5.2.4 Estimation of unadjusted center effects Given the amount of information, it is not meaningful to estimate center effects.
2.5.3 Proportion of (y)pStage II-III patients with R0 resection that started adjuvant chemotherapy for (y)pStage II or III within 12 weeks after surgery (QCI 1243, process)
2.5.3.1 Definition N: Number of patients in denominator receiving adjuvant chemotherapy within 3
months after surgery
D: Number of patients treated with R0 radical surgical resection for (y)pStage II or III
and for whom the start date of adjuvant chemotherapy is known.
KCE Report 161S Procare III – Supplement 444
2.5.3.2 Description There are 58 (or 2%) of the 3318 patients in the PROCARE database who meet the
criteria in the denominator and are hence eligible for this QCI. Of the eligible patients,
54 (93%, both weighted and unweighted) achieved the QCI. The proportion of
patients that achieved the QCI is shown in Table 49 (per size-grouped center) in
Section 1.
2.5.3.3 Univariate associations with prognostic factors Given the very small number of eligible patients, we find no significant univariate
association between this QCI and any of the candidate prognostic factors.
2.5.3.4 Estimation of unadjusted center effects Given the amount of information, it is not meaningful to estimate center effects.
2.5.4 Proportion of (y)pStage II-III patients with R0 resection treated with adjuvant chemo(radio)therapy, that received 5-FU based chemotherapy (QCI 1244, process)
2.5.4.1 Definition N: Number of patients in denominator receiving 5-fluorouracil based adjuvant
chemotherapy
D: Number of patients who received adjuvant (radio)chemotherapy within 6 months
after R0 radical surgical resection for (y)pStage II or III and for whom the type of
adjuvant chemotherapy is known.
Note that the condition ‘patients who received adjuvant (radio)chemotherapy’ can
currently not be assessed reliably in the PROCARE database because of the low
quality of treatment data.
2.5.4.2 Description There are 57 (or 2%) of the 3318 patients in the PROCARE database who meet the
criteria in the denominator and are hence eligible for this QCI. Of the eligible patients,
54 (95%, or 97% unweighted) achieved the QCI. The proportion of patients that
achieved the QCI is shown in Table 50 (per size-grouped center) in Section 1.
2.5.4.3 Univariate associations with prognostic factors Given the very small number of eligible patients, we find no significant univariate
association between this QCI and any of the candidate prognostic factors.
2.5.4.4 Estimation of unadjusted center effects Given the amount of information, it is not meaningful to estimate center effects.
KCE Report 161S Procare III – Supplement 445
2.5.5 *Rate of acute grade 4 chemotherapy-related complications (QCI 1245, outcome)
2.5.5.1 Definition N: Number of patients in denominator that presented acute grade 4 complications
during or within 4 weeks after completion of adjuvant chemo(radio)therapy
D: Number of patients treated with adjuvant chemotherapy and for whom follow-up
data (at least until 1 year) are available.
Note that – contrary to most other QCIs - fulfilling the QCI is not a positive event.
Note that the condition ‘patients treated with adjuvant chemotherapy’ can currently
not be assessed reliably in the PROCARE database because of the low quality of
treatment data.
2.5.5.2 Description There are 128 patients of the 3318 (4%) patients in the PROCARE database eligible
for this QCI. Of these 128 eligible patients, 10 (8%, or unweighted 5%) presented
acute grade 4 complications during or within 4 weeks after completion of adjuvant
chemo(radio)therapy. The proportion of patients that achieved the QCI is shown in
Table 51 (per size-grouped center) and Figure 47 (per participating center, after
merging all centers with less than five eligible patients in one overlapping center) in
Section 1. This proportion ranges from 0% in 6 of the 11 (merged) centers to 20% in
one (merged) center. The funnel plot does not point to systematic variation between
the centers.
2.5.5.3 Identification of relevant prognostic factors Prognostic factors identified in the literature review of Appendix 2
In Appendix 2 no prognostic factors for were identified for this QCI.
Prognostic factors identified in the PROCARE consensus on risk/confounding
factors per QCI
In the PROCARE consensus no prognostic factors were identified for this QCI.
Empirical associations
We find a borderline significant (p-value = 0.09) univariate associations between this
QCI and gender, as shown in Table 119. The interpretation of the odds ratios is as
described in Table 69.
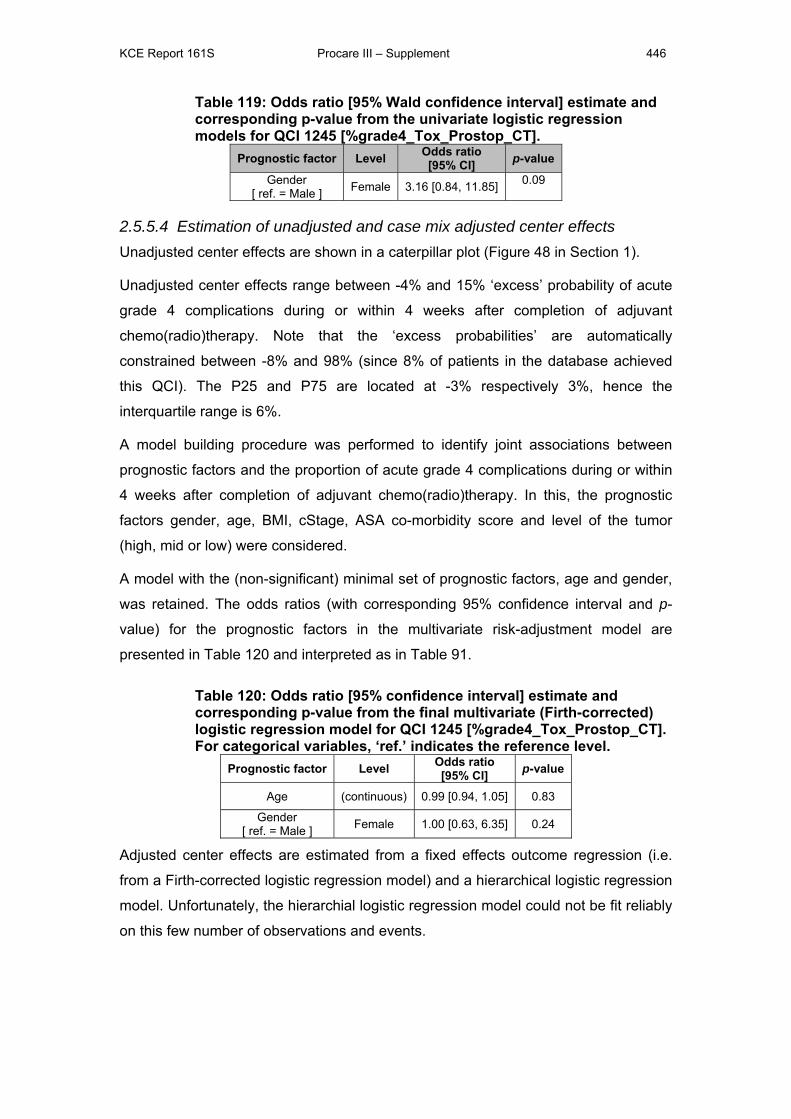
KCE Report 161S Procare III – Supplement 446
Table 119: Odds ratio [95% Wald confidence interval] estimate and corresponding p-value from the univariate logistic regression models for QCI 1245 [%grade4_Tox_Prostop_CT].
Prognostic factor Level Odds ratio [95% CI] p-value
Gender [ ref. = Male ] Female 3.16 [0.84, 11.85] 0.09
2.5.5.4 Estimation of unadjusted and case mix adjusted center effects Unadjusted center effects are shown in a caterpillar plot (Figure 48 in Section 1).
Unadjusted center effects range between -4% and 15% ‘excess’ probability of acute
grade 4 complications during or within 4 weeks after completion of adjuvant
chemo(radio)therapy. Note that the ‘excess probabilities’ are automatically
constrained between -8% and 98% (since 8% of patients in the database achieved
this QCI). The P25 and P75 are located at -3% respectively 3%, hence the
interquartile range is 6%.
A model building procedure was performed to identify joint associations between
prognostic factors and the proportion of acute grade 4 complications during or within
4 weeks after completion of adjuvant chemo(radio)therapy. In this, the prognostic
factors gender, age, BMI, cStage, ASA co-morbidity score and level of the tumor
(high, mid or low) were considered.
A model with the (non-significant) minimal set of prognostic factors, age and gender,
was retained. The odds ratios (with corresponding 95% confidence interval and p-
value) for the prognostic factors in the multivariate risk-adjustment model are
presented in Table 120 and interpreted as in Table 91.
Table 120: Odds ratio [95% confidence interval] estimate and corresponding p-value from the final multivariate (Firth-corrected) logistic regression model for QCI 1245 [%grade4_Tox_Prostop_CT]. For categorical variables, ‘ref.’ indicates the reference level.
Prognostic factor Level Odds ratio [95% CI] p-value
Age (continuous) 0.99 [0.94, 1.05] 0.83
Gender [ ref. = Male ] Female 1.00 [0.63, 6.35] 0.24
Adjusted center effects are estimated from a fixed effects outcome regression (i.e.
from a Firth-corrected logistic regression model) and a hierarchical logistic regression
model. Unfortunately, the hierarchial logistic regression model could not be fit reliably
on this few number of observations and events.
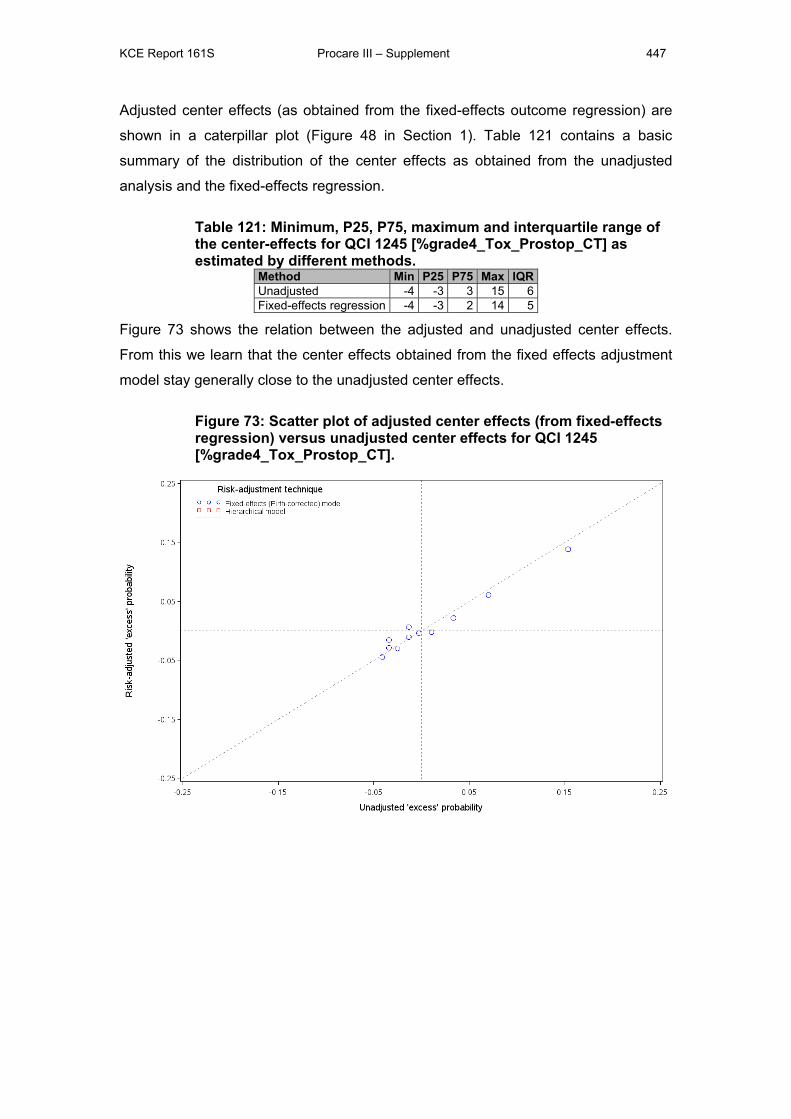
KCE Report 161S Procare III – Supplement 447
Adjusted center effects (as obtained from the fixed-effects outcome regression) are
shown in a caterpillar plot (Figure 48 in Section 1). Table 121 contains a basic
summary of the distribution of the center effects as obtained from the unadjusted
analysis and the fixed-effects regression.
Table 121: Minimum, P25, P75, maximum and interquartile range of the center-effects for QCI 1245 [%grade4_Tox_Prostop_CT] as estimated by different methods.
Method Min P25 P75 Max IQRUnadjusted -4 -3 3 15 6Fixed-effects regression -4 -3 2 14 5
Figure 73 shows the relation between the adjusted and unadjusted center effects.
From this we learn that the center effects obtained from the fixed effects adjustment
model stay generally close to the unadjusted center effects.
Figure 73: Scatter plot of adjusted center effects (from fixed-effects regression) versus unadjusted center effects for QCI 1245 [%grade4_Tox_Prostop_CT].
KCE Report 161S Procare III – Supplement 448
2.6 QUALITY INDICATORS RELATED TO PALLIATIVE TREATMENT
2.6.1 Rate of cStage IV patients receiving chemotherapy (QCI 1251, process)
2.6.1.1 Definition N: Number of patients in denominator that received chemotherapy
D: Number of patients with cStage IV and for whom it is known whether they received
chemotherapy or not.
2.6.1.2 Description In view of the limited number of adequate and updated follow-up date, no valuable
analysis can be performed for this QCI.
2.7 QUALITY INDICATORS RELATED TO FOLLOW-UP
2.7.1 Rate of curatively treated patients that received a colonoscopy within 1 year after resection (QCI 1261, process)
2.7.1.1 Definition N: Number of patients in denominator that received a colonoscopy.
D: Number of patients treated with curative resection for c(p)Stage I-III and for whom
follow-up data (at least until 2 years) are available.
2.7.1.2 Description This QCI cannot be computed reliably yet, but will be in the future. It is not further
considered in the report.
2.7.2 *Late grade 4 complications of radiotherapy or chemoradiation (QCI 1263, outcome)
2.7.2.1 Definition N: Number of patients in the denominator that presented late grade 4 complications
after completion of (neo)adjuvant chemo(radio)therapy (excluding early toxicity).
D: Number of patients treated with neoadjuvant or adjuvant radio(chemo)therapy and
for whom follow-up data (at least until 1 year) are available.
Note that – contrary to most other QCIs - fulfilling the QCI is not a positive event.
KCE Report 161S Procare III – Supplement 449
Note that the BCR did not determine the denominator of this QCI in the same way as
the denominator for QCI 1245 (Rate of acute grade 4 chemotherapy-related
complications), too few patients were discarded from the denominator for the current
QCI.
Either way the condition ‘patients treated with neoadjuvant or adjuvant
radio(chemo)therapy’ can currently not be assessed reliably in the PROCARE
database because of the low quality of treatment data.
2.7.2.2 Description There are 1890 patients of the 3318 (4%) patients in the PROCARE database
eligible for this QCI. Of these 1890 eligible patients, 4 (0%, both weighted and
unweighted) presented late grade 4 complications of radiotherapy or chemoradiation.
The proportion of patients that achieved the QCI is shown in Table 52 (per size-
grouped center) and Figure 49 (per participating center, after merging all centers with
less than five eligible patients in one overlapping center) in Section 1. This proportion
ranges from 0% in 58 of the 62 (merged) centers to 4% in one (merged) center. The
funnel plot does not point to systematic variation between the centers.
Because there are only 4 patients who presented late grade 4 complications after
completion of (neo)adjuvant chemo(radio)therapy, each in a different center, this QCI
is not further usable for evaluating the quality of rectum cancer care on center level.
On a patient level we can state that all centers perform very well for this QCI.
2.8 QUALITY INDICATORS RELATED TO HISTOPATHOLOGIC EXAMINATION
2.8.1 Use of the pathology report sheet (QCI 1271, process)
2.8.1.1 Definition N: Number of patients in denominator for whom a pathology report sheet was
completed.
D: Number of patients treated with (local or radical) resection and for whom date of
resection is later than or equal to the January 1st, 2007.
2.8.1.2 Description There are 1980 (or 60%) of the 3318 patients in the PROCARE database who meet
the criteria in the denominator and are hence eligible for this QCI. Of the eligible
patients, 1938 (98%, both weighted and unweighted) achieved the QCI. The
proportion of patients that achieved the QCI is shown in Table 53 (per size-grouped
KCE Report 161S Procare III – Supplement 450
center) and Figure 50 (per participating center, after merging all centers with less
than five eligible patients in one overlapping center) in Section 1. This proportion
ranges from 75% in one of the 57 (merged) centers to 100% in forty-two (merged)
centers. The funnel plot points to systematic variation between the centers.
2.8.1.3 Univariate associations with prognostic factors We find significant univariate associations between this QCI and two prognostic
factors, as shown in Table 122. The interpretation of the odds ratios is as described
in Table 69. Note that the odds of using the pathology report sheet are higher for
patients with cStage II and lower for patients with cStage I or IV (compared to
patients with cStage III).
Table 122: Odds ratio estimate [95% Wald confidence interval] and corresponding p-value from the univariate logistic regression models for QCI 1271 [%Path_Rep_Use]. For categorical variables, ‘ref.’ indicates the reference level.
Prognostic factor Level Odds ratio [95% CI] p-value
cStage [ ref. = III ]
I 0.73 [0.31, 1.73]
0.09 II 3.09 [0.72, 13.23] IV 0.86 [0.32, 2.31]
Missing / X 0.39 [0.17, 0.95] cT4
[ ref. = No ] Yes 0.46 [0.20, 1.07] 0.003 Missing 0.23 [0.09, 0.57]
2.8.1.4 Estimation of unadjusted center effects Unadjusted center effects are shown in a caterpillar plot (Figure 50 in Section 1).
These center effects range between -23% and 2% ‘excess’ probability. Note that the
‘excess probabilities’ are automatically constrained between -98% and 2% (since
98% of patients in the database achieved this QCI). The P25 and P75 are located at
-2% resp. 2%, hence the interquartile range is 4%. In the caterpillar plot, we observe
that two (merged) centers perform significantly below P25, i.e. the upper bounds of
their confidence intervals are lower than P25.
2.8.2 Quality of TME assessed according to Quirke and mentioned in the pathology report (QCI 1272, process)
2.8.2.1 Definition N: Number of patients for whom the external surface of TME was reported in the
pathology report sheet.
D: Number of patients treated with TME as indicated by the surgeon after the
January 1st, 2007.
KCE Report 161S Procare III – Supplement 451
2.8.2.2 Description There are 1572 (or 47%) of the 3318 patients in the PROCARE database who meet
the criteria in the denominator and are hence eligible for this QCI. Of the eligible
patients, 1074 (68%, or 64% unweighted) achieved the QCI. The proportion of
patients that achieved the QCI is shown in Table 54 (per size-grouped center) and
Figure 51 (per participating center, after merging all centers with less than five
eligible patients in one overlapping center) in Section 1. This proportion ranges from
0% in two of the 55 (merged) centers to 100% in four (merged) centers. The funnel
plot points to systematic variation between the centers.
2.8.2.3 Univariate associations with prognostic factors We find significant univariate associations between this QCI and six prognostic
factors, as shown in Table 123. The interpretation of the odds ratios is as described
in Table 69.
Table 123: Odds ratio estimate [95% Wald confidence interval] and corresponding p-value from the univariate logistic regression models for QCI 1272 [%TME_Qual_Rep]. For categorical variables, ‘ref.’ indicates the reference level.
Prognostic factor Level Odds ratio [95% CI] p-value Joint
p-value BMI (continuous) 1.02 [0.99, 1.05] 0.24
0.003 Missing BMI [ ref. = Not missing ] Missing 1.03 [0.49, 2.18] 0.93
ASA score [ ref. = I ]
II 1.30 [1.00, 1.70] 0.01
III-V 0.94 [0.69, 1.29]
Missing 0.75 [0.49, 1.15]
cStage [ ref. = III ]
I 0.77 [0.54, 1.08]
0.0008
II 0.55 [0.41, 0.74] IV 0.65 [0.46, 0.92]
Missing / X 0.72 [0.45, 1.17] Mode of surgery
[ ref. = Elective/Sch. ] Urgent / Emergency 0.23 [0.09, 0.61] 0.008
Missing 1.65 [0.61, 4.47] cCRM positive
[ ref. = No ] Yes 1.21 [0.73, 2.02] <0.0001
Missing 0.59 [0.38, 0.93] cT4
[ ref. = No ] Yes 0.86 [0.61, 1.21] 0.04
Missing 0.47 [0.25, 0.86]
2.8.2.4 Estimation of unadjusted center effects Unadjusted center effects are shown in a caterpillar plot (Figure 51 in Section 1).
These center effects range between -63% and 29% ‘excess’ probability. Note that the
‘excess probabilities’ are automatically constrained between -68% and 32% (since
68% of patients in the database achieved this QCI). The P25 and P75 are located at
-21% resp. 16%, hence the interquartile range is 37%. In the caterpillar plot, we
observe that three (merged) centers perform significantly below P25, i.e. the upper
bounds of their confidence intervals are lower than P25. We also observe that two
KCE Report 161S Procare III – Supplement 452
(merged) centers perform significantly above P75, i.e. the lower bounds of their
confidence intervals are higher than P75.
2.8.3 Distal tumor-free margin mentioned in the pathology report (QCI 1273, process)
2.8.3.1 Definition N: Number of patients in denominator for whom the length of the distal free tumor
free margin was reported in the pathology report.
D: Number of patients treated with SSO or Hartmann’s procedure.
Note that patients with (y)pT0 and (y)pTis are excluded for analysis.
2.8.3.2 Description There are 2051 (or 62%) of the 3318 patients in the PROCARE database who meet
the criteria in the denominator and are hence eligible for this QCI. Of the eligible
patients, 1763 (86%, or 83% unweighted) achieved the QCI. The proportion of
patients that achieved the QCI is shown in Table 55 (per size-grouped center) and
Figure 52 (per participating center, after merging all centers with less than five
eligible patients in one overlapping center) in Section 1. This proportion ranges from
0% in two of the 64 (merged) centers to 100% in thirteen (merged) centers. The
funnel plot points to systematic variation between the centers.
2.8.3.3 Univariate associations with prognostic factors We find significant univariate associations between this QCI and ten prognostic
factors, as shown in Table 124. The interpretation of the odds ratios is as described
in Table 69.
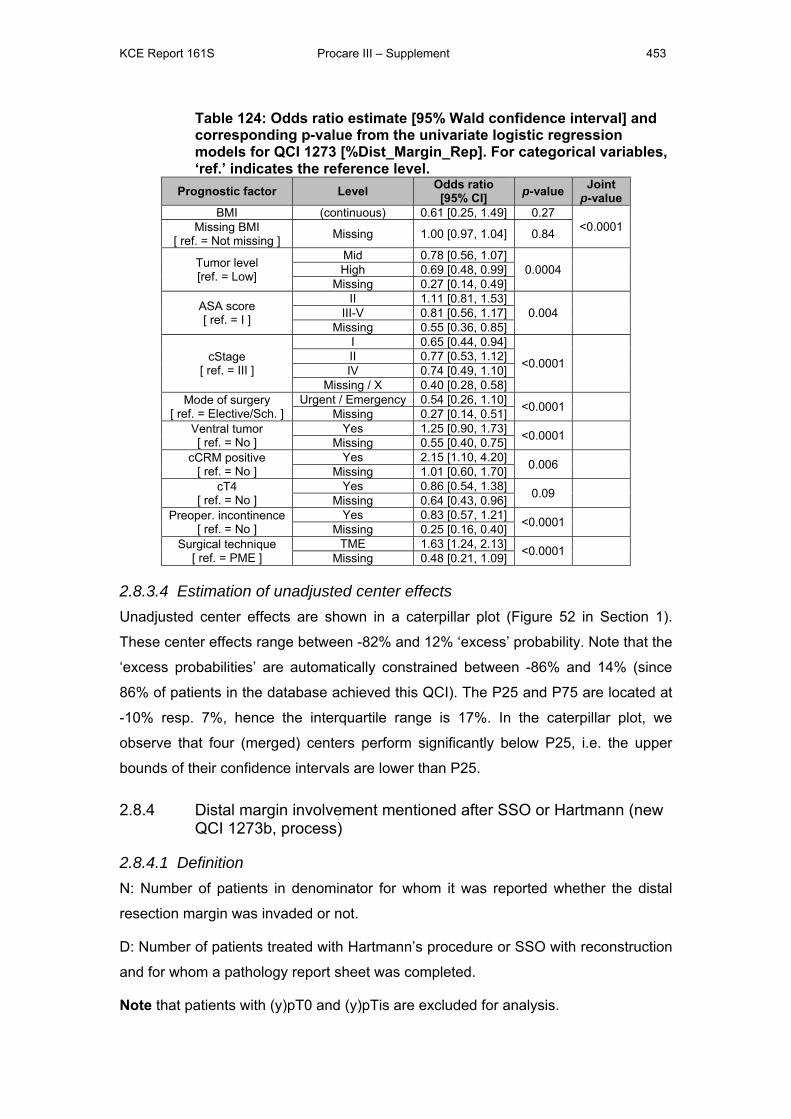
KCE Report 161S Procare III – Supplement 453
Table 124: Odds ratio estimate [95% Wald confidence interval] and corresponding p-value from the univariate logistic regression models for QCI 1273 [%Dist_Margin_Rep]. For categorical variables, ‘ref.’ indicates the reference level.
Prognostic factor Level Odds ratio [95% CI] p-value Joint
p-value BMI (continuous) 0.61 [0.25, 1.49] 0.27
<0.0001 Missing BMI [ ref. = Not missing ] Missing 1.00 [0.97, 1.04] 0.84
Tumor level [ref. = Low]
Mid 0.78 [0.56, 1.07] 0.0004
High 0.69 [0.48, 0.99]
Missing 0.27 [0.14, 0.49]
ASA score [ ref. = I ]
II 1.11 [0.81, 1.53] 0.004
III-V 0.81 [0.56, 1.17]
Missing 0.55 [0.36, 0.85]
cStage [ ref. = III ]
I 0.65 [0.44, 0.94]
<0.0001
II 0.77 [0.53, 1.12] IV 0.74 [0.49, 1.10]
Missing / X 0.40 [0.28, 0.58] Mode of surgery
[ ref. = Elective/Sch. ] Urgent / Emergency 0.54 [0.26, 1.10] <0.0001
Missing 0.27 [0.14, 0.51] Ventral tumor [ ref. = No ]
Yes 1.25 [0.90, 1.73] <0.0001 Missing 0.55 [0.40, 0.75]
cCRM positive [ ref. = No ]
Yes 2.15 [1.10, 4.20] 0.006 Missing 1.01 [0.60, 1.70]
cT4 [ ref. = No ]
Yes 0.86 [0.54, 1.38] 0.09 Missing 0.64 [0.43, 0.96]
Preoper. incontinence [ ref. = No ]
Yes 0.83 [0.57, 1.21] <0.0001 Missing 0.25 [0.16, 0.40]
Surgical technique [ ref. = PME ]
TME 1.63 [1.24, 2.13] <0.0001 Missing 0.48 [0.21, 1.09]
2.8.3.4 Estimation of unadjusted center effects Unadjusted center effects are shown in a caterpillar plot (Figure 52 in Section 1).
These center effects range between -82% and 12% ‘excess’ probability. Note that the
‘excess probabilities’ are automatically constrained between -86% and 14% (since
86% of patients in the database achieved this QCI). The P25 and P75 are located at
-10% resp. 7%, hence the interquartile range is 17%. In the caterpillar plot, we
observe that four (merged) centers perform significantly below P25, i.e. the upper
bounds of their confidence intervals are lower than P25.
2.8.4 Distal margin involvement mentioned after SSO or Hartmann (new QCI 1273b, process)
2.8.4.1 Definition N: Number of patients in denominator for whom it was reported whether the distal
resection margin was invaded or not.
D: Number of patients treated with Hartmann’s procedure or SSO with reconstruction
and for whom a pathology report sheet was completed.
Note that patients with (y)pT0 and (y)pTis are excluded for analysis.
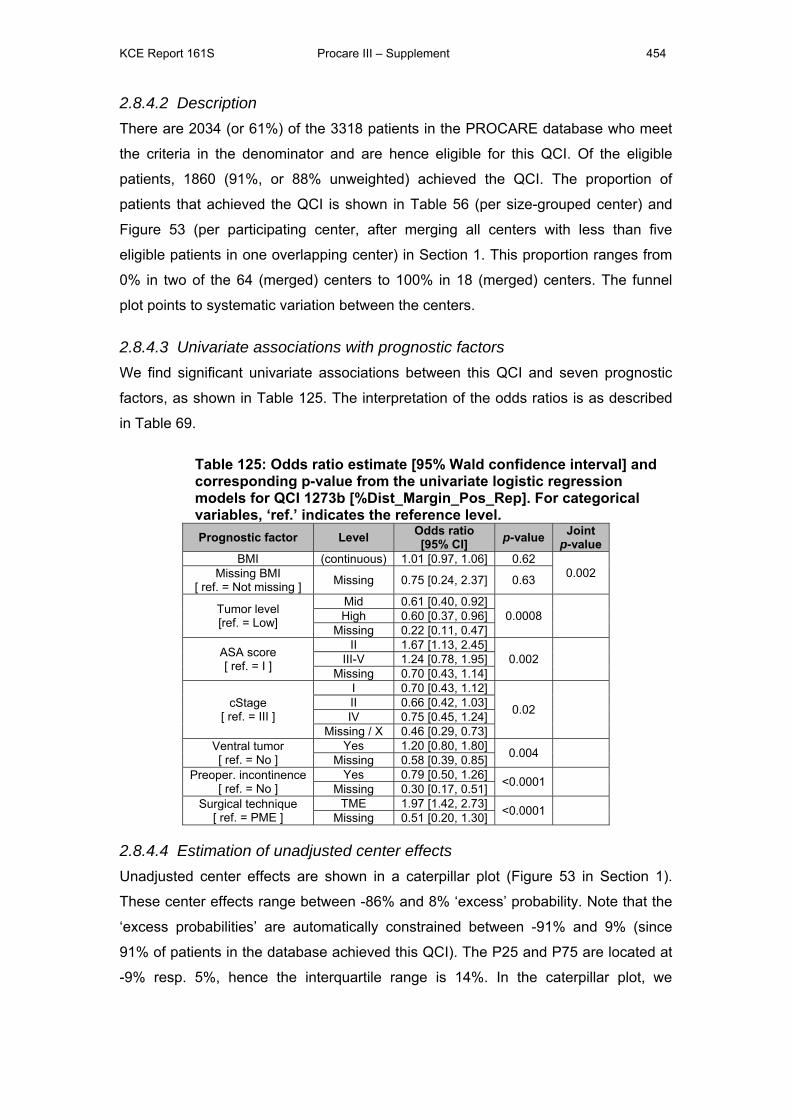
KCE Report 161S Procare III – Supplement 454
2.8.4.2 Description There are 2034 (or 61%) of the 3318 patients in the PROCARE database who meet
the criteria in the denominator and are hence eligible for this QCI. Of the eligible
patients, 1860 (91%, or 88% unweighted) achieved the QCI. The proportion of
patients that achieved the QCI is shown in Table 56 (per size-grouped center) and
Figure 53 (per participating center, after merging all centers with less than five
eligible patients in one overlapping center) in Section 1. This proportion ranges from
0% in two of the 64 (merged) centers to 100% in 18 (merged) centers. The funnel
plot points to systematic variation between the centers.
2.8.4.3 Univariate associations with prognostic factors We find significant univariate associations between this QCI and seven prognostic
factors, as shown in Table 125. The interpretation of the odds ratios is as described
in Table 69.
Table 125: Odds ratio estimate [95% Wald confidence interval] and corresponding p-value from the univariate logistic regression models for QCI 1273b [%Dist_Margin_Pos_Rep]. For categorical variables, ‘ref.’ indicates the reference level. Prognostic factor Level Odds ratio
[95% CI] p-value Joint p-value
BMI (continuous) 1.01 [0.97, 1.06] 0.62 0.002 Missing BMI
[ ref. = Not missing ] Missing 0.75 [0.24, 2.37] 0.63
Tumor level [ref. = Low]
Mid 0.61 [0.40, 0.92] 0.0008
High 0.60 [0.37, 0.96]
Missing 0.22 [0.11, 0.47]
ASA score [ ref. = I ]
II 1.67 [1.13, 2.45] 0.002
III-V 1.24 [0.78, 1.95]
Missing 0.70 [0.43, 1.14]
cStage [ ref. = III ]
I 0.70 [0.43, 1.12]
0.02
II 0.66 [0.42, 1.03] IV 0.75 [0.45, 1.24]
Missing / X 0.46 [0.29, 0.73] Ventral tumor [ ref. = No ]
Yes 1.20 [0.80, 1.80] 0.004 Missing 0.58 [0.39, 0.85]
Preoper. incontinence [ ref. = No ]
Yes 0.79 [0.50, 1.26] <0.0001 Missing 0.30 [0.17, 0.51]
Surgical technique [ ref. = PME ]
TME 1.97 [1.42, 2.73] <0.0001 Missing 0.51 [0.20, 1.30]
2.8.4.4 Estimation of unadjusted center effects Unadjusted center effects are shown in a caterpillar plot (Figure 53 in Section 1).
These center effects range between -86% and 8% ‘excess’ probability. Note that the
‘excess probabilities’ are automatically constrained between -91% and 9% (since
91% of patients in the database achieved this QCI). The P25 and P75 are located at
-9% resp. 5%, hence the interquartile range is 14%. In the caterpillar plot, we
KCE Report 161S Procare III – Supplement 455
observe that two (merged) centers perform significantly below P25, i.e. the upper
bounds of their confidence intervals are lower than P25.
2.8.5 Number of lymph nodes examined (QCI 1274, process)
2.8.5.1 Definition The number of lymph nodes examined.
D: All patients treated with radical surgical resection for whom the number of
examined lymph nodes is mentioned in the pathology report.
2.8.5.2 Description Of the 3318 patients, 2714 (82%) are eligible for the denominator of this QCI. Of the
604 patients who are not eligible, 594 had either a missing surgical resection status
or missing number of lymph nodes examined and for the other 10 patients it is known
that they did not undergo radical surgical resection.
Overall, the number of lymph nodes examined ranges from 0 to 135. More detail on
the distribution of this QCI is shown in Table 57 (per size-grouped center) and Figure
54 (a box plot per participating center, after merging all centers with less than five
eligible patients in one overlapping center) in Section 1.
As this upper boundary is very large and far away from what is supposed to be
common practice, we have censored this QCI by setting all numbers examined larger
than 25 lymph nodes equal to 25. Table 58 (per size-grouped center) and Figure 54
(a box plot per participating center, after merging all centers with less than five
eligible patients in one overlapping center) in Section 1 show the distribution of the
number of lymph nodes examined, per participating center, for the censored version
of this QCI. From this we observe substantial differences between the centers
concerning the number of lymph nodes examined.
2.8.5.3 Identification of relevant prognostic factors We find significant univariate associations between this censored QCI and four
prognostic factors, as shown in Table 126. The interpretation of the effects is as
described in Table 81.
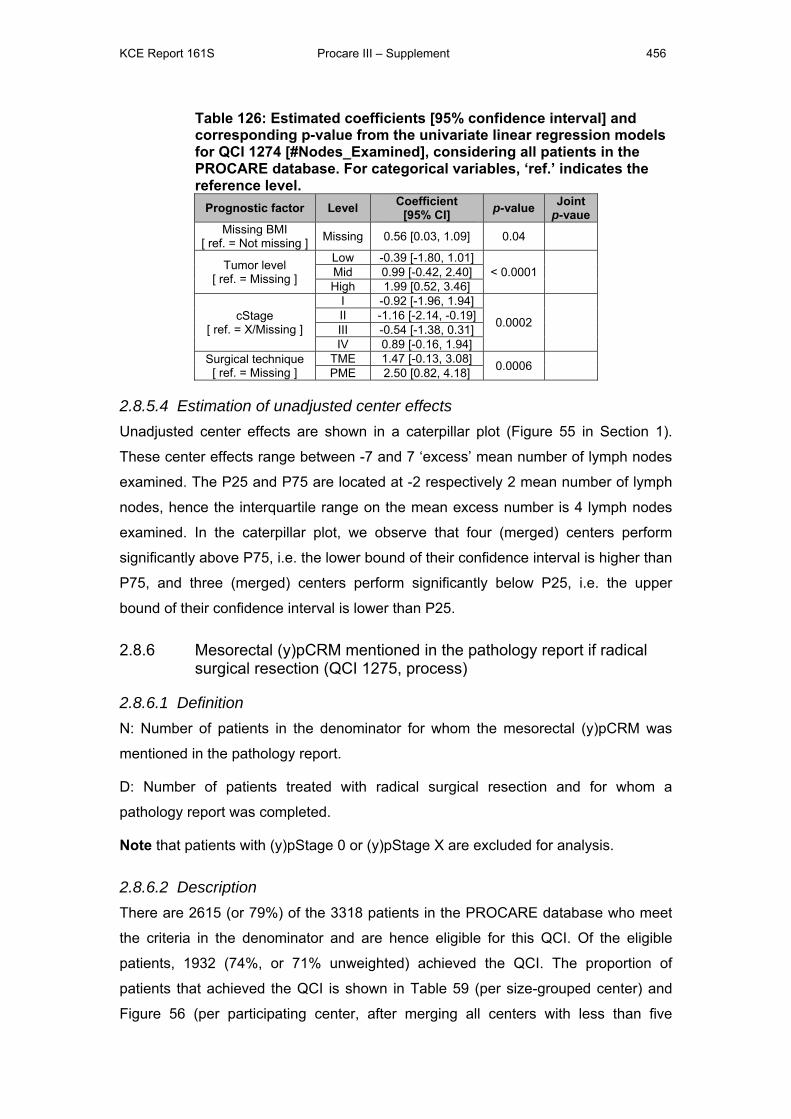
KCE Report 161S Procare III – Supplement 456
Table 126: Estimated coefficients [95% confidence interval] and corresponding p-value from the univariate linear regression models for QCI 1274 [#Nodes_Examined], considering all patients in the PROCARE database. For categorical variables, ‘ref.’ indicates the reference level.
Prognostic factor Level Coefficient[95% CI] p-value Joint
p-vaue Missing BMI
[ ref. = Not missing ] Missing 0.56 [0.03, 1.09] 0.04
Tumor level [ ref. = Missing ]
Low -0.39 [-1.80, 1.01] < 0.0001
Mid 0.99 [-0.42, 2.40] High 1.99 [0.52, 3.46]
cStage [ ref. = X/Missing ]
I -0.92 [-1.96, 1.94]
0.0002
II -1.16 [-2.14, -0.19] III -0.54 [-1.38, 0.31] IV 0.89 [-0.16, 1.94]
Surgical technique [ ref. = Missing ]
TME 1.47 [-0.13, 3.08] 0.0006 PME 2.50 [0.82, 4.18]
2.8.5.4 Estimation of unadjusted center effects Unadjusted center effects are shown in a caterpillar plot (Figure 55 in Section 1).
These center effects range between -7 and 7 ‘excess’ mean number of lymph nodes
examined. The P25 and P75 are located at -2 respectively 2 mean number of lymph
nodes, hence the interquartile range on the mean excess number is 4 lymph nodes
examined. In the caterpillar plot, we observe that four (merged) centers perform
significantly above P75, i.e. the lower bound of their confidence interval is higher than
P75, and three (merged) centers perform significantly below P25, i.e. the upper
bound of their confidence interval is lower than P25.
2.8.6 Mesorectal (y)pCRM mentioned in the pathology report if radical surgical resection (QCI 1275, process)
2.8.6.1 Definition N: Number of patients in the denominator for whom the mesorectal (y)pCRM was
mentioned in the pathology report.
D: Number of patients treated with radical surgical resection and for whom a
pathology report was completed.
Note that patients with (y)pStage 0 or (y)pStage X are excluded for analysis.
2.8.6.2 Description There are 2615 (or 79%) of the 3318 patients in the PROCARE database who meet
the criteria in the denominator and are hence eligible for this QCI. Of the eligible
patients, 1932 (74%, or 71% unweighted) achieved the QCI. The proportion of
patients that achieved the QCI is shown in Table 59 (per size-grouped center) and
Figure 56 (per participating center, after merging all centers with less than five
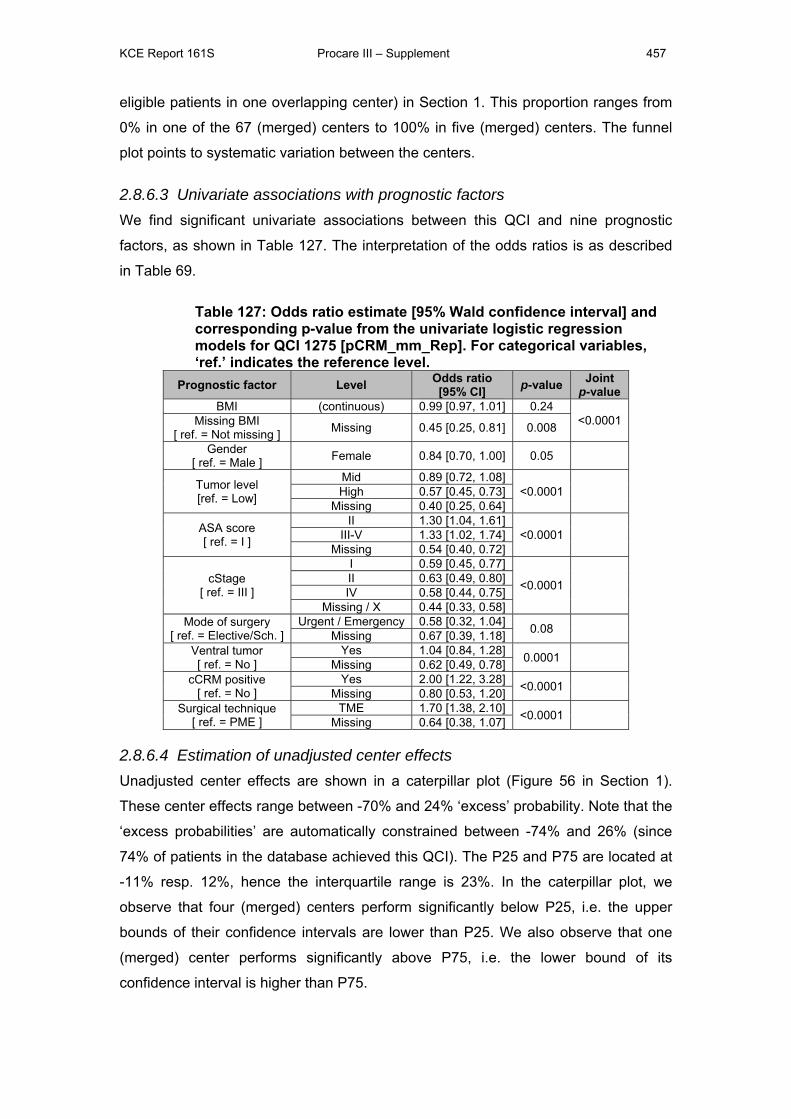
KCE Report 161S Procare III – Supplement 457
eligible patients in one overlapping center) in Section 1. This proportion ranges from
0% in one of the 67 (merged) centers to 100% in five (merged) centers. The funnel
plot points to systematic variation between the centers.
2.8.6.3 Univariate associations with prognostic factors We find significant univariate associations between this QCI and nine prognostic
factors, as shown in Table 127. The interpretation of the odds ratios is as described
in Table 69.
Table 127: Odds ratio estimate [95% Wald confidence interval] and corresponding p-value from the univariate logistic regression models for QCI 1275 [pCRM_mm_Rep]. For categorical variables, ‘ref.’ indicates the reference level.
Prognostic factor Level Odds ratio [95% CI] p-value Joint
p-value BMI (continuous) 0.99 [0.97, 1.01] 0.24
<0.0001 Missing BMI [ ref. = Not missing ] Missing 0.45 [0.25, 0.81] 0.008
Gender [ ref. = Male ] Female 0.84 [0.70, 1.00] 0.05
Tumor level [ref. = Low]
Mid 0.89 [0.72, 1.08] <0.0001
High 0.57 [0.45, 0.73]
Missing 0.40 [0.25, 0.64]
ASA score [ ref. = I ]
II 1.30 [1.04, 1.61] <0.0001
III-V 1.33 [1.02, 1.74]
Missing 0.54 [0.40, 0.72]
cStage [ ref. = III ]
I 0.59 [0.45, 0.77]
<0.0001
II 0.63 [0.49, 0.80] IV 0.58 [0.44, 0.75]
Missing / X 0.44 [0.33, 0.58] Mode of surgery
[ ref. = Elective/Sch. ] Urgent / Emergency 0.58 [0.32, 1.04] 0.08
Missing 0.67 [0.39, 1.18] Ventral tumor [ ref. = No ]
Yes 1.04 [0.84, 1.28] 0.0001 Missing 0.62 [0.49, 0.78]
cCRM positive [ ref. = No ]
Yes 2.00 [1.22, 3.28] <0.0001 Missing 0.80 [0.53, 1.20]
Surgical technique [ ref. = PME ]
TME 1.70 [1.38, 2.10] <0.0001 Missing 0.64 [0.38, 1.07]
2.8.6.4 Estimation of unadjusted center effects Unadjusted center effects are shown in a caterpillar plot (Figure 56 in Section 1).
These center effects range between -70% and 24% ‘excess’ probability. Note that the
‘excess probabilities’ are automatically constrained between -74% and 26% (since
74% of patients in the database achieved this QCI). The P25 and P75 are located at
-11% resp. 12%, hence the interquartile range is 23%. In the caterpillar plot, we
observe that four (merged) centers perform significantly below P25, i.e. the upper
bounds of their confidence intervals are lower than P25. We also observe that one
(merged) center performs significantly above P75, i.e. the lower bound of its
confidence interval is higher than P75.
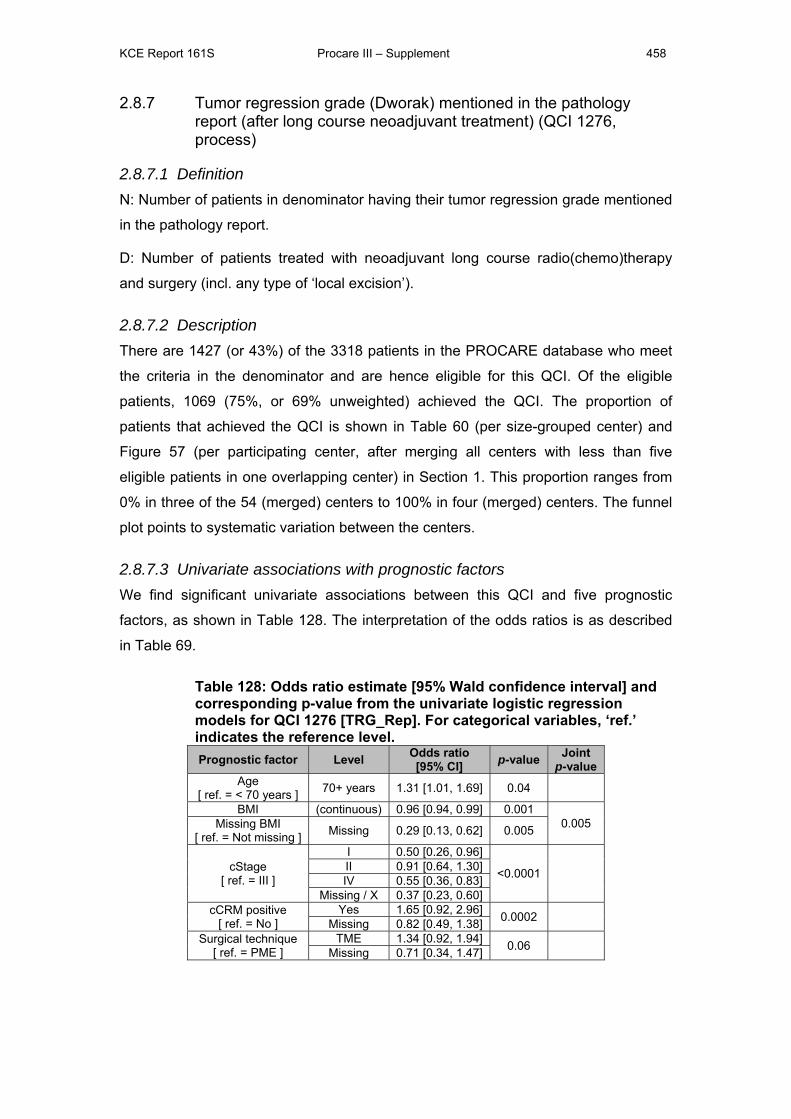
KCE Report 161S Procare III – Supplement 458
2.8.7 Tumor regression grade (Dworak) mentioned in the pathology report (after long course neoadjuvant treatment) (QCI 1276, process)
2.8.7.1 Definition N: Number of patients in denominator having their tumor regression grade mentioned
in the pathology report.
D: Number of patients treated with neoadjuvant long course radio(chemo)therapy
and surgery (incl. any type of ‘local excision’).
2.8.7.2 Description There are 1427 (or 43%) of the 3318 patients in the PROCARE database who meet
the criteria in the denominator and are hence eligible for this QCI. Of the eligible
patients, 1069 (75%, or 69% unweighted) achieved the QCI. The proportion of
patients that achieved the QCI is shown in Table 60 (per size-grouped center) and
Figure 57 (per participating center, after merging all centers with less than five
eligible patients in one overlapping center) in Section 1. This proportion ranges from
0% in three of the 54 (merged) centers to 100% in four (merged) centers. The funnel
plot points to systematic variation between the centers.
2.8.7.3 Univariate associations with prognostic factors We find significant univariate associations between this QCI and five prognostic
factors, as shown in Table 128. The interpretation of the odds ratios is as described
in Table 69.
Table 128: Odds ratio estimate [95% Wald confidence interval] and corresponding p-value from the univariate logistic regression models for QCI 1276 [TRG_Rep]. For categorical variables, ‘ref.’ indicates the reference level. Prognostic factor Level Odds ratio
[95% CI] p-value Joint p-value
Age [ ref. = < 70 years ] 70+ years 1.31 [1.01, 1.69] 0.04
BMI (continuous) 0.96 [0.94, 0.99] 0.001 0.005 Missing BMI
[ ref. = Not missing ] Missing 0.29 [0.13, 0.62] 0.005
cStage [ ref. = III ]
I 0.50 [0.26, 0.96]
<0.0001
II 0.91 [0.64, 1.30] IV 0.55 [0.36, 0.83]
Missing / X 0.37 [0.23, 0.60] cCRM positive
[ ref. = No ] Yes 1.65 [0.92, 2.96] 0.0002
Missing 0.82 [0.49, 1.38] Surgical technique
[ ref. = PME ] TME 1.34 [0.92, 1.94] 0.06
Missing 0.71 [0.34, 1.47]
KCE Report 161S Procare III – Supplement 459
2.8.7.4 Estimation of unadjusted center effects Unadjusted center effects are shown in a caterpillar plot (Figure 57 in Section 1).
These center effects range between -68% and 25% ‘excess’ probability. Note that the
‘excess probabilities’ are automatically constrained between -75% and 25% (since
75% of patients in the database achieved this QCI). The P25 and P75 are located at
-23% resp. 17%, hence the interquartile range is 40%. In the caterpillar plot, we
observe that six (merged) centers perform significantly below P25, i.e. the upper
bounds of their confidence intervals are lower than P25.
KCE Report 161S Procare III – Supplement 460
APPENDIX 7: ACCURACY AND COMPLETENESS OF PROCARE DATABASE Table of contents
1 INTRODUCTION ............................................................................................. 461
2 METHOD ......................................................................................................... 462
2.1 PROCARE DATABASE .................................................................................. 462
2.2 BCR DATA SELECTION ................................................................................. 462
2.3 LINKING AND FINAL SELECTION ................................................................ 463
2.4 ANALYSIS PER CENTRE .............................................................................. 464
3 RESULTS ........................................................................................................ 468
3.1 DATABASE DESCRIPTION ........................................................................... 468 3.1.1 PROCARE database ............................................................................. 468 3.1.2 BCR database – first selection .............................................................. 469
3.2 LINKING PROCARE AND BCR ...................................................................... 469
3.3 COMPLETENESS OF THE PROCARE DATABASE ..................................... 470
3.4 COMPLETENESS OF THE PROCARE DATABASE PER CENTRE ............ 472
4 CONCLUDING REMARKS ............................................................................. 475
KCE Report 161S Procare III – Supplement 461
1 INTRODUCTION Participation in PROCARE is on a voluntary basis. This means that the PROCARE
database has no full coverage of rectal cancer patients in Belgium, because:
- Some centres do not participate
- Within participating centres, not every specialist, involved in the treatment of
rectal cancer participates
- A participating specialist may not include certain cases in PROCARE
To get a better insight into the participation rate (completeness) and the degree of
randomness in participation, the PROCARE database is linked with and compared to the
BCR database.
The BCR database has full coverage of all new primary cancers in Belgium from 2004
onwards and in addition, this database provides information on topography, morphology,
staging, and the centre that delivered the data. Therefore, the BCR database is the most
suitable source to investigate the completeness of the PROCARE database.
The aim of this deliverable is to link and compare the PROCARE database with the BCR
database in order to investigate the participation rate in general and per centre.
KCE Report 161S Procare III – Supplement 462
2 METHOD 2.1 PROCARE DATABASE The rules for patients to be included in PROCARE are the following:
1. The lower limit of the tumour must be situated between 0 and 15 cm above the
margo ani
2. Only adenocarcinoma are included
3. Only invasive tumours are included
4. Multiple synchrounous tumours are left out in PROCARE if it is indicated on the
PROCARE data entry form. Note that before January 2010, this was not
mentioned on the data entry form, therefore, this exclusion criterion will not be
considered for the present study.
5. Patients for whom the INSS is not indicated cannot be included in the PROCARE
database system. People not residing in Belgium are not included in the
PROCARE database.
For the present analysis, only PROCARE patients with year of incidence between 2005
and 2008 were selected, because the BCR data after 2008 are not yet available.
2.2 BCR DATA SELECTION Data were selected from the BCR database in order to link as many PROCARE patients
as possible to this database. In this initial selection ICD-10 codes C18 (colon) and C19
(rectosigmoid) and all morphologies were included because:
- In PROCARE, all tumours more than 15 cm above the margo ani are regarded
as (recto)sigmoid tumours, whereas in the BCR database, this limit is not so
strictly interpreted in the coding practices and can be 17cm.
- The rectal tumour in PROCARE could be an extension from a tumour in the
colon
- A tumour might be registered as colon, not otherwise specified in the BCR
database when it is in fact a rectal tumour
- Some tumours with other morphologies than adenocarcinoma might have been
included accidentally in PROCARE
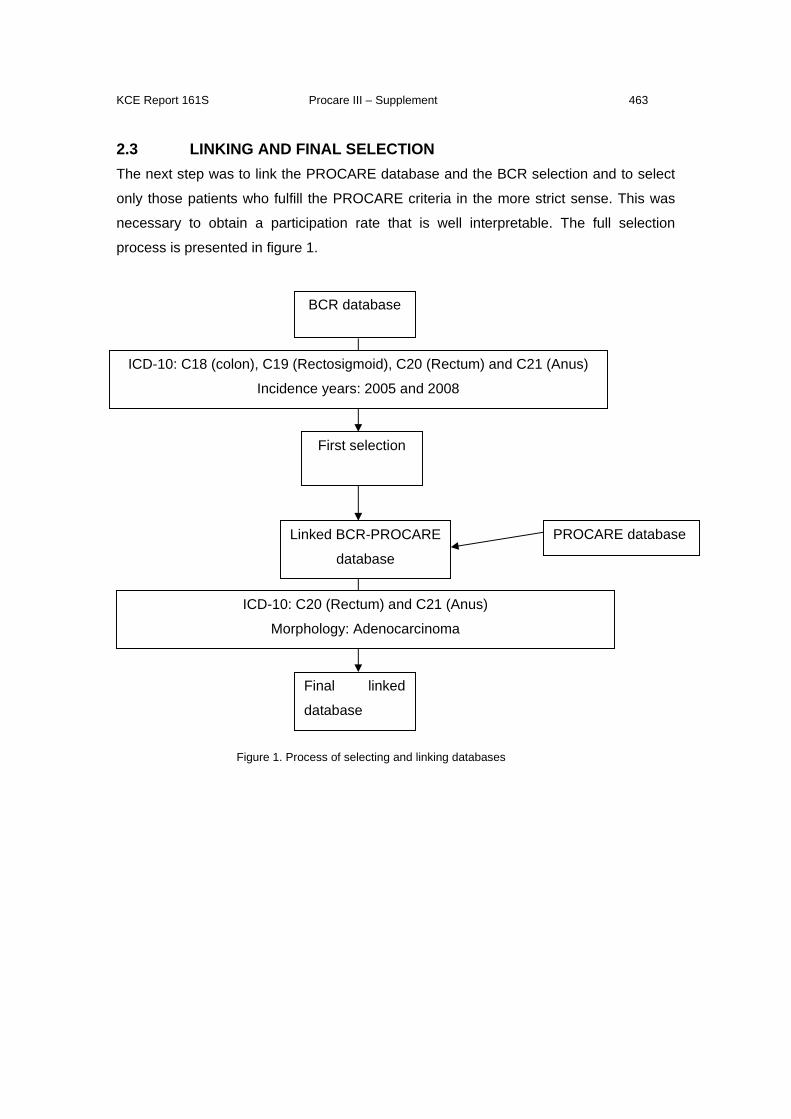
KCE Report 161S Procare III – Supplement 463
2.3 LINKING AND FINAL SELECTION The next step was to link the PROCARE database and the BCR selection and to select
only those patients who fulfill the PROCARE criteria in the more strict sense. This was
necessary to obtain a participation rate that is well interpretable. The full selection
process is presented in figure 1.
Figure 1. Process of selecting and linking databases
BCR database
First selection
Final linked
database
ICD-10: C18 (colon), C19 (Rectosigmoid), C20 (Rectum) and C21 (Anus)
Incidence years: 2005 and 2008
ICD-10: C20 (Rectum) and C21 (Anus)
Morphology: Adenocarcinoma
Linked BCR-PROCARE
database
PROCARE database
KCE Report 161S Procare III – Supplement 464
2.4 ANALYSIS PER CENTRE In PROCARE, the decision rule to assign a patient to a centre is based on the medical
specialism that delivered the data. In case a patient has been operated, the centre of
surgery is chosen, if this is missing, the centre in which the pathological examination is
performed is chosen, and if this still yields no centre, the centre of chemotherapy is
chosen. If no surgery is performed, then the centre of chemotherapy is chosen.
In the BCR database, it is less clear which speciality has delivered data. BCR data
comes from multiple sources:
- in the clinical network, hospitals register all new cancer diagnosis and transfer them
either directly to the Cancer Registry, either through the sickness funds and then to the
Cancer Registry
- laboratories for pathological anatomy register every (pre-) malignant diagnosis and
tranfser these data (electronically) to the Cancer Registry
This means that tumour data of the same patient can be delivered through multiple
sources. Therefore we first defined an algorithm to assign a patient to a centre (figure 2).
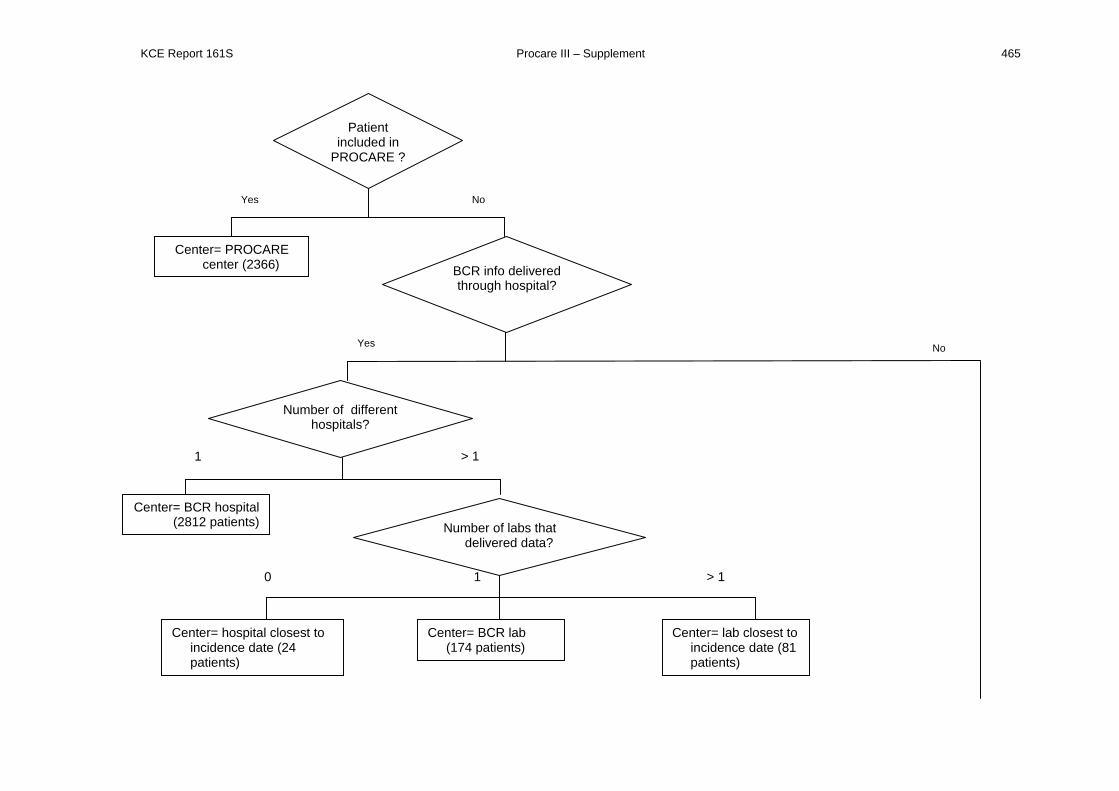
KCE Report 161S Procare III – Supplement 465
1
Patient included in
PROCARE ?
Yes No
Center= PROCARE center (2366) BCR info delivered
through hospital?
Yes No
Number of different hospitals?
1 > 1
Center= BCR hospital (2812 patients) Number of labs that
delivered data?
0 > 1
Center= hospital closest to incidence date (24 patients)
Center= BCR lab (174 patients)
Center= lab closest to incidence date (81 patients)
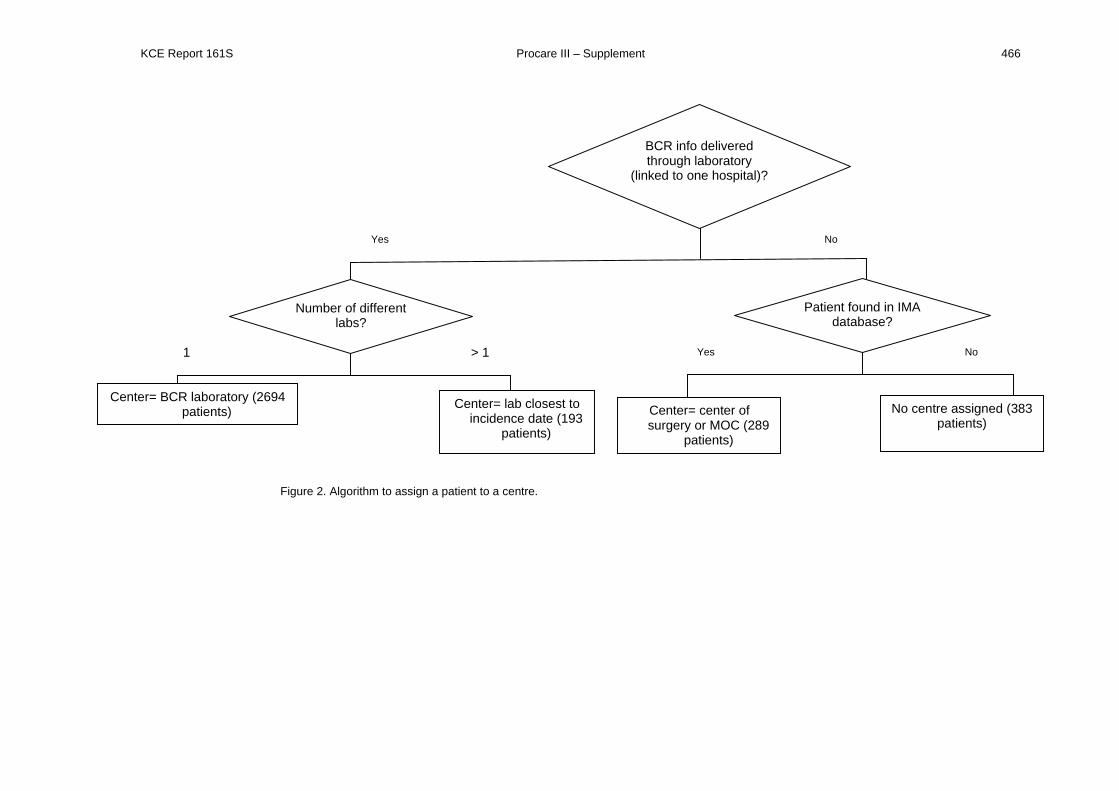
KCE Report 161S Procare III – Supplement 466
Figure 2. Algorithm to assign a patient to a centre.
BCR info delivered through laboratory
(linked to one hospital)?
Yes No
Number of different labs?
1 > 1
Center= BCR laboratory (2694 patients) Center= lab closest to
incidence date (193 patients)
Patient found in IMA database?
Yes No
Center= center of surgery or MOC (289
patients)
No centre assigned (383 patients)
KCE Report 161S Procare III – Supplement 467
The algorithm should be read as follows. When the patient is present in PROCARE, then
the PROCARE centre is chosen. When the patient is not in PROCARE, one of the BCR
sources is chosen in the following way:
- If there is a hospital source, this is preferred above the laboratory source.
o If there is only one hospital, then this hospital is the final source
o If there are multiple hospitals, then the laboratory is considered
o If there are multiple hospitals and no laboratory, the hospital that
delivered data closest to the incidence date is selected
- If there is no hospital source or multiple hospital sources, then the laboratory is
considered
o If there is only one laboratory involved, then this laboratory is the final
source
o If multiple laboratories are involved, the laboratory that delivered the data
closest to the incidence date is chosen
- If data are only delivered through the sickness funds or through a laboratory that
is not linked to a hospital then the IMA database was consulted. Note that at this
moment, the IMA database, available to the BCR is limited to patients, diagnosed
in 2005 and 2006. In the IMA database, the centre of surgery was considered
first and if missing, the centre where the multidisciplinary oncological consultation
(MOC) was performed was chosen.
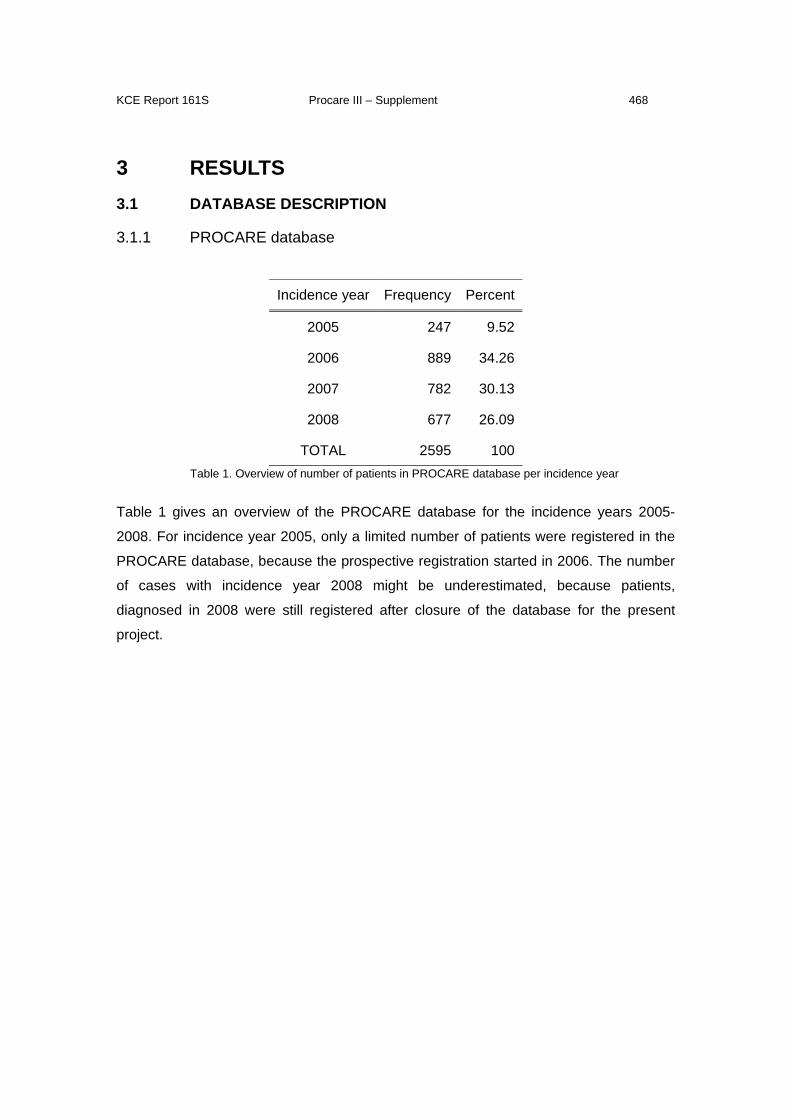
KCE Report 161S Procare III – Supplement 468
3 RESULTS 3.1 DATABASE DESCRIPTION
3.1.1 PROCARE database
Incidence year Frequency Percent
2005 247 9.52
2006 889 34.26
2007 782 30.13
2008 677 26.09
TOTAL 2595 100Table 1. Overview of number of patients in PROCARE database per incidence year
Table 1 gives an overview of the PROCARE database for the incidence years 2005-
2008. For incidence year 2005, only a limited number of patients were registered in the
PROCARE database, because the prospective registration started in 2006. The number
of cases with incidence year 2008 might be underestimated, because patients,
diagnosed in 2008 were still registered after closure of the database for the present
project.
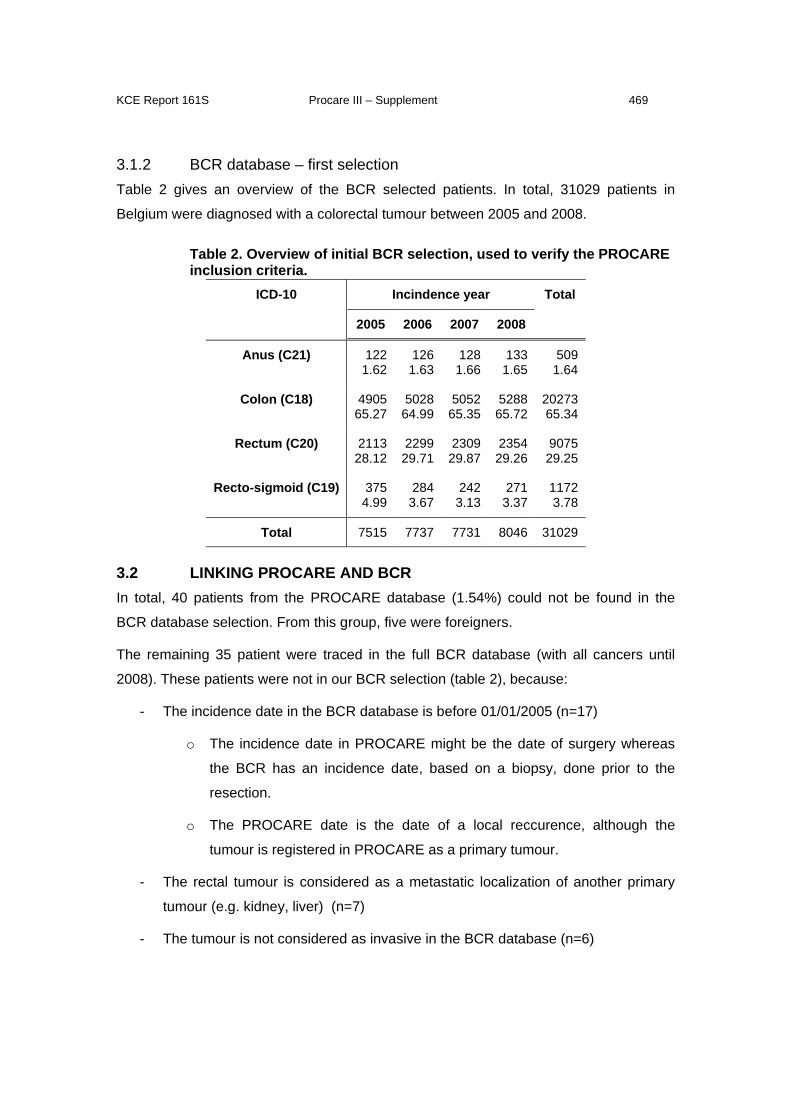
KCE Report 161S Procare III – Supplement 469
3.1.2 BCR database – first selection Table 2 gives an overview of the BCR selected patients. In total, 31029 patients in
Belgium were diagnosed with a colorectal tumour between 2005 and 2008.
Table 2. Overview of initial BCR selection, used to verify the PROCARE inclusion criteria.
ICD-10 Incindence year Total
2005 2006 2007 2008
Anus (C21) 1221.62
1261.63
1281.66
1331.65
509 1.64
Colon (C18) 490565.27
502864.99
505265.35
528865.72
20273 65.34
Rectum (C20) 211328.12
229929.71
230929.87
235429.26
9075 29.25
Recto-sigmoid (C19) 3754.99
2843.67
2423.13
2713.37
1172 3.78
Total 7515 7737 7731 8046 31029
3.2 LINKING PROCARE AND BCR In total, 40 patients from the PROCARE database (1.54%) could not be found in the
BCR database selection. From this group, five were foreigners.
The remaining 35 patient were traced in the full BCR database (with all cancers until
2008). These patients were not in our BCR selection (table 2), because:
- The incidence date in the BCR database is before 01/01/2005 (n=17)
o The incidence date in PROCARE might be the date of surgery whereas
the BCR has an incidence date, based on a biopsy, done prior to the
resection.
o The PROCARE date is the date of a local reccurence, although the
tumour is registered in PROCARE as a primary tumour.
- The rectal tumour is considered as a metastatic localization of another primary
tumour (e.g. kidney, liver) (n=7)
- The tumour is not considered as invasive in the BCR database (n=6)
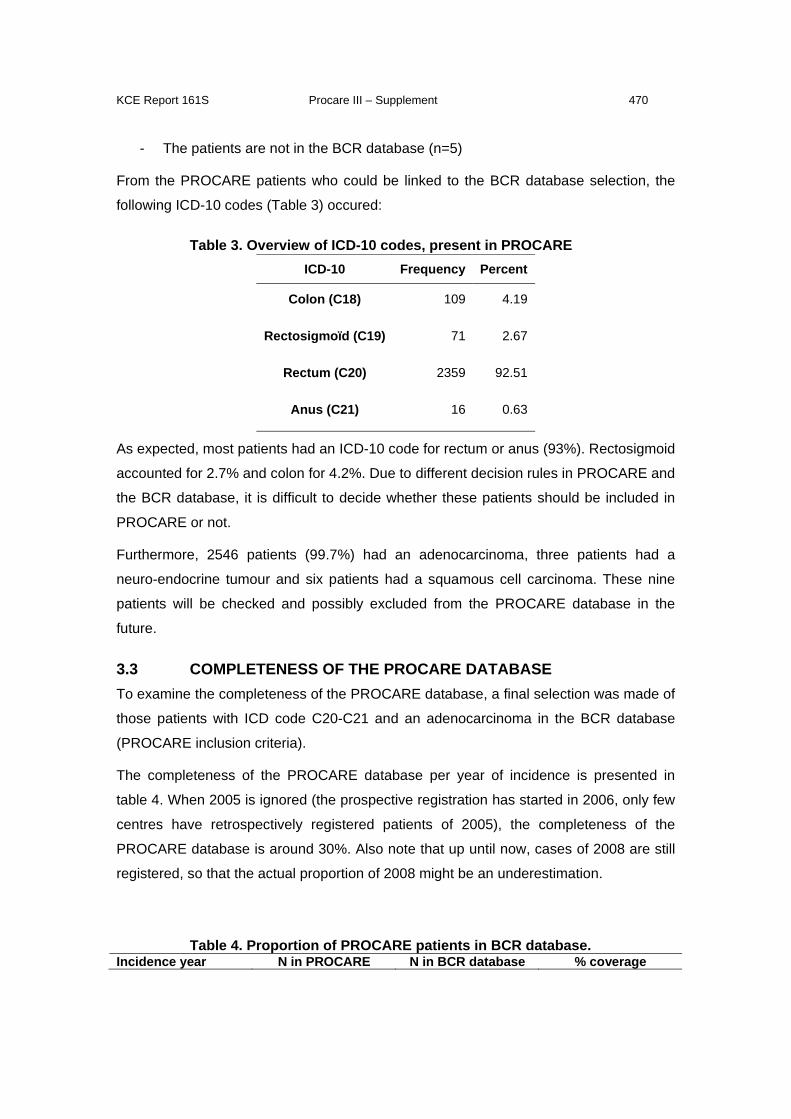
KCE Report 161S Procare III – Supplement 470
- The patients are not in the BCR database (n=5)
From the PROCARE patients who could be linked to the BCR database selection, the
following ICD-10 codes (Table 3) occured:
Table 3. Overview of ICD-10 codes, present in PROCARE ICD-10 Frequency Percent
Colon (C18) 109 4.19
Rectosigmoïd (C19) 71 2.67
Rectum (C20) 2359 92.51
Anus (C21) 16 0.63
As expected, most patients had an ICD-10 code for rectum or anus (93%). Rectosigmoid
accounted for 2.7% and colon for 4.2%. Due to different decision rules in PROCARE and
the BCR database, it is difficult to decide whether these patients should be included in
PROCARE or not.
Furthermore, 2546 patients (99.7%) had an adenocarcinoma, three patients had a
neuro-endocrine tumour and six patients had a squamous cell carcinoma. These nine
patients will be checked and possibly excluded from the PROCARE database in the
future.
3.3 COMPLETENESS OF THE PROCARE DATABASE To examine the completeness of the PROCARE database, a final selection was made of
those patients with ICD code C20-C21 and an adenocarcinoma in the BCR database
(PROCARE inclusion criteria).
The completeness of the PROCARE database per year of incidence is presented in
table 4. When 2005 is ignored (the prospective registration has started in 2006, only few
centres have retrospectively registered patients of 2005), the completeness of the
PROCARE database is around 30%. Also note that up until now, cases of 2008 are still
registered, so that the actual proportion of 2008 might be an underestimation.
Table 4. Proportion of PROCARE patients in BCR database. Incidence year N in PROCARE N in BCR database % coverage
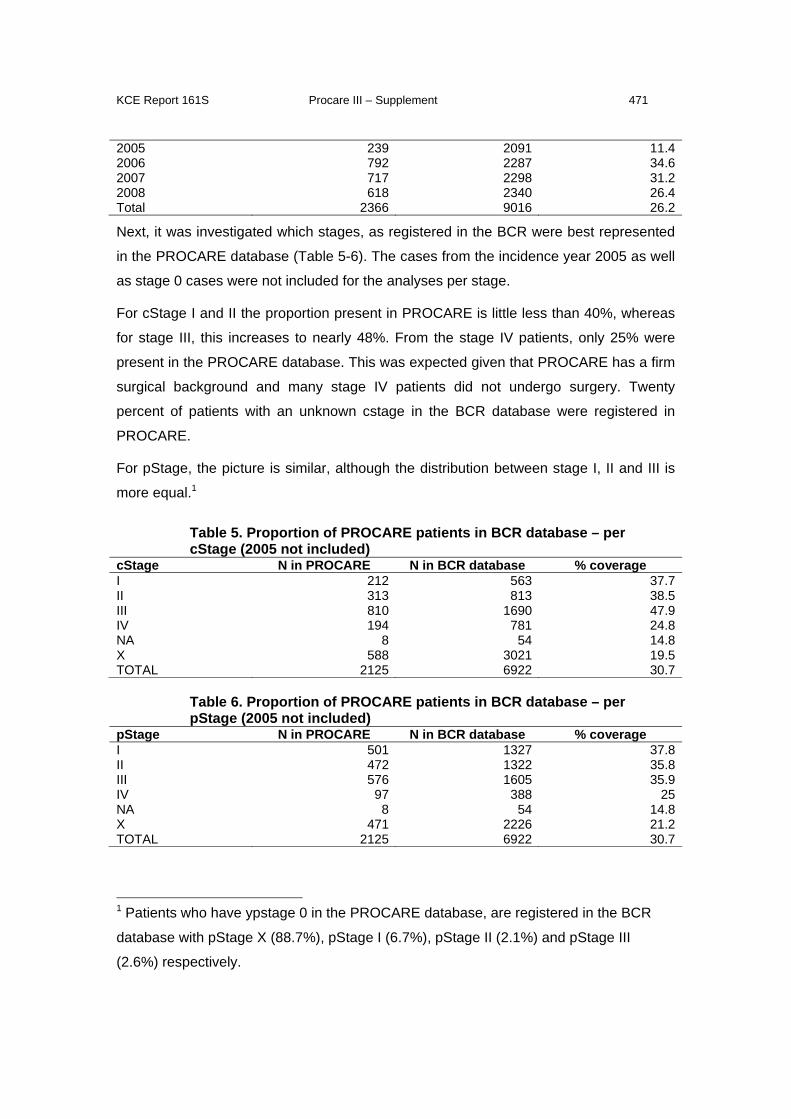
KCE Report 161S Procare III – Supplement 471
2005 239 2091 11.42006 792 2287 34.62007 717 2298 31.22008 618 2340 26.4Total 2366 9016 26.2
Next, it was investigated which stages, as registered in the BCR were best represented
in the PROCARE database (Table 5-6). The cases from the incidence year 2005 as well
as stage 0 cases were not included for the analyses per stage.
For cStage I and II the proportion present in PROCARE is little less than 40%, whereas
for stage III, this increases to nearly 48%. From the stage IV patients, only 25% were
present in the PROCARE database. This was expected given that PROCARE has a firm
surgical background and many stage IV patients did not undergo surgery. Twenty
percent of patients with an unknown cstage in the BCR database were registered in
PROCARE.
For pStage, the picture is similar, although the distribution between stage I, II and III is
more equal.1
Table 5. Proportion of PROCARE patients in BCR database – per cStage (2005 not included)
cStage N in PROCARE N in BCR database % coverage I 212 563 37.7II 313 813 38.5III 810 1690 47.9IV 194 781 24.8NA 8 54 14.8X 588 3021 19.5TOTAL 2125 6922 30.7
Table 6. Proportion of PROCARE patients in BCR database – per pStage (2005 not included)
pStage N in PROCARE N in BCR database % coverage I 501 1327 37.8II 472 1322 35.8III 576 1605 35.9IV 97 388 25NA 8 54 14.8X 471 2226 21.2TOTAL 2125 6922 30.7
1 Patients who have ypstage 0 in the PROCARE database, are registered in the BCR
database with pStage X (88.7%), pStage I (6.7%), pStage II (2.1%) and pStage III
(2.6%) respectively.
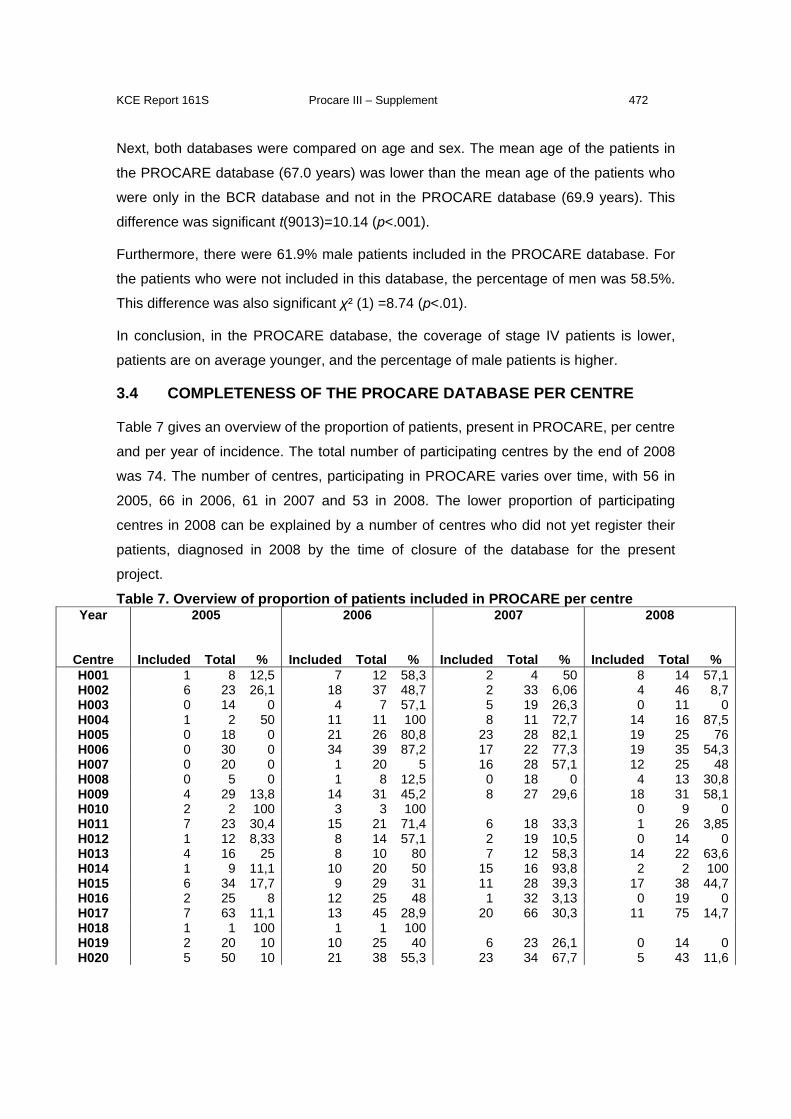
KCE Report 161S Procare III – Supplement 472
Next, both databases were compared on age and sex. The mean age of the patients in
the PROCARE database (67.0 years) was lower than the mean age of the patients who
were only in the BCR database and not in the PROCARE database (69.9 years). This
difference was significant t(9013)=10.14 (p<.001).
Furthermore, there were 61.9% male patients included in the PROCARE database. For
the patients who were not included in this database, the percentage of men was 58.5%.
This difference was also significant χ² (1) =8.74 (p<.01).
In conclusion, in the PROCARE database, the coverage of stage IV patients is lower,
patients are on average younger, and the percentage of male patients is higher.
3.4 COMPLETENESS OF THE PROCARE DATABASE PER CENTRE
Table 7 gives an overview of the proportion of patients, present in PROCARE, per centre
and per year of incidence. The total number of participating centres by the end of 2008
was 74. The number of centres, participating in PROCARE varies over time, with 56 in
2005, 66 in 2006, 61 in 2007 and 53 in 2008. The lower proportion of participating
centres in 2008 can be explained by a number of centres who did not yet register their
patients, diagnosed in 2008 by the time of closure of the database for the present
project.
Table 7. Overview of proportion of patients included in PROCARE per centre Year 2005
2006
2007
2008
Centre Included Total % Included Total % Included Total % Included Total % H001 1 8 12,5 7 12 58,3 2 4 50 8 14 57,1H002 6 23 26,1 18 37 48,7 2 33 6,06 4 46 8,7H003 0 14 0 4 7 57,1 5 19 26,3 0 11 0H004 1 2 50 11 11 100 8 11 72,7 14 16 87,5H005 0 18 0 21 26 80,8 23 28 82,1 19 25 76H006 0 30 0 34 39 87,2 17 22 77,3 19 35 54,3H007 0 20 0 1 20 5 16 28 57,1 12 25 48H008 0 5 0 1 8 12,5 0 18 0 4 13 30,8H009 4 29 13,8 14 31 45,2 8 27 29,6 18 31 58,1H010 2 2 100 3 3 100 0 9 0H011 7 23 30,4 15 21 71,4 6 18 33,3 1 26 3,85H012 1 12 8,33 8 14 57,1 2 19 10,5 0 14 0H013 4 16 25 8 10 80 7 12 58,3 14 22 63,6H014 1 9 11,1 10 20 50 15 16 93,8 2 2 100H015 6 34 17,7 9 29 31 11 28 39,3 17 38 44,7H016 2 25 8 12 25 48 1 32 3,13 0 19 0H017 7 63 11,1 13 45 28,9 20 66 30,3 11 75 14,7H018 1 1 100 1 1 100 H019 2 20 10 10 25 40 6 23 26,1 0 14 0H020 5 50 10 21 38 55,3 23 34 67,7 5 43 11,6
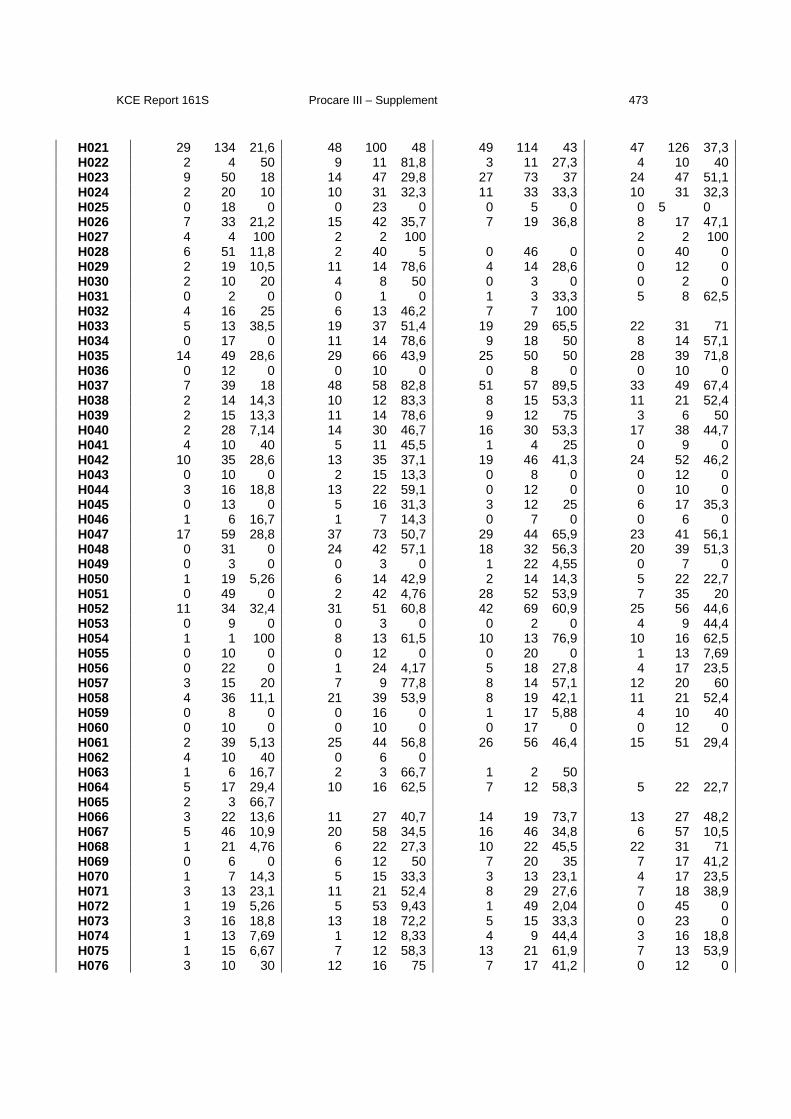
KCE Report 161S Procare III – Supplement 473
H021 29 134 21,6 48 100 48 49 114 43 47 126 37,3H022 2 4 50 9 11 81,8 3 11 27,3 4 10 40H023 9 50 18 14 47 29,8 27 73 37 24 47 51,1H024 2 20 10 10 31 32,3 11 33 33,3 10 31 32,3H025 0 18 0 0 23 0 0 5 0 0 5 0 H026 7 33 21,2 15 42 35,7 7 19 36,8 8 17 47,1H027 4 4 100 2 2 100 2 2 100H028 6 51 11,8 2 40 5 0 46 0 0 40 0H029 2 19 10,5 11 14 78,6 4 14 28,6 0 12 0H030 2 10 20 4 8 50 0 3 0 0 2 0H031 0 2 0 0 1 0 1 3 33,3 5 8 62,5H032 4 16 25 6 13 46,2 7 7 100 H033 5 13 38,5 19 37 51,4 19 29 65,5 22 31 71H034 0 17 0 11 14 78,6 9 18 50 8 14 57,1H035 14 49 28,6 29 66 43,9 25 50 50 28 39 71,8H036 0 12 0 0 10 0 0 8 0 0 10 0H037 7 39 18 48 58 82,8 51 57 89,5 33 49 67,4H038 2 14 14,3 10 12 83,3 8 15 53,3 11 21 52,4H039 2 15 13,3 11 14 78,6 9 12 75 3 6 50H040 2 28 7,14 14 30 46,7 16 30 53,3 17 38 44,7H041 4 10 40 5 11 45,5 1 4 25 0 9 0H042 10 35 28,6 13 35 37,1 19 46 41,3 24 52 46,2H043 0 10 0 2 15 13,3 0 8 0 0 12 0H044 3 16 18,8 13 22 59,1 0 12 0 0 10 0H045 0 13 0 5 16 31,3 3 12 25 6 17 35,3H046 1 6 16,7 1 7 14,3 0 7 0 0 6 0H047 17 59 28,8 37 73 50,7 29 44 65,9 23 41 56,1H048 0 31 0 24 42 57,1 18 32 56,3 20 39 51,3H049 0 3 0 0 3 0 1 22 4,55 0 7 0H050 1 19 5,26 6 14 42,9 2 14 14,3 5 22 22,7H051 0 49 0 2 42 4,76 28 52 53,9 7 35 20H052 11 34 32,4 31 51 60,8 42 69 60,9 25 56 44,6H053 0 9 0 0 3 0 0 2 0 4 9 44,4H054 1 1 100 8 13 61,5 10 13 76,9 10 16 62,5H055 0 10 0 0 12 0 0 20 0 1 13 7,69H056 0 22 0 1 24 4,17 5 18 27,8 4 17 23,5H057 3 15 20 7 9 77,8 8 14 57,1 12 20 60H058 4 36 11,1 21 39 53,9 8 19 42,1 11 21 52,4H059 0 8 0 0 16 0 1 17 5,88 4 10 40H060 0 10 0 0 10 0 0 17 0 0 12 0H061 2 39 5,13 25 44 56,8 26 56 46,4 15 51 29,4H062 4 10 40 0 6 0 H063 1 6 16,7 2 3 66,7 1 2 50 H064 5 17 29,4 10 16 62,5 7 12 58,3 5 22 22,7H065 2 3 66,7 H066 3 22 13,6 11 27 40,7 14 19 73,7 13 27 48,2H067 5 46 10,9 20 58 34,5 16 46 34,8 6 57 10,5H068 1 21 4,76 6 22 27,3 10 22 45,5 22 31 71H069 0 6 0 6 12 50 7 20 35 7 17 41,2H070 1 7 14,3 5 15 33,3 3 13 23,1 4 17 23,5H071 3 13 23,1 11 21 52,4 8 29 27,6 7 18 38,9H072 1 19 5,26 5 53 9,43 1 49 2,04 0 45 0H073 3 16 18,8 13 18 72,2 5 15 33,3 0 23 0H074 1 13 7,69 1 12 8,33 4 9 44,4 3 16 18,8H075 1 15 6,67 7 12 58,3 13 21 61,9 7 13 53,9H076 3 10 30 12 16 75 7 17 41,2 0 12 0
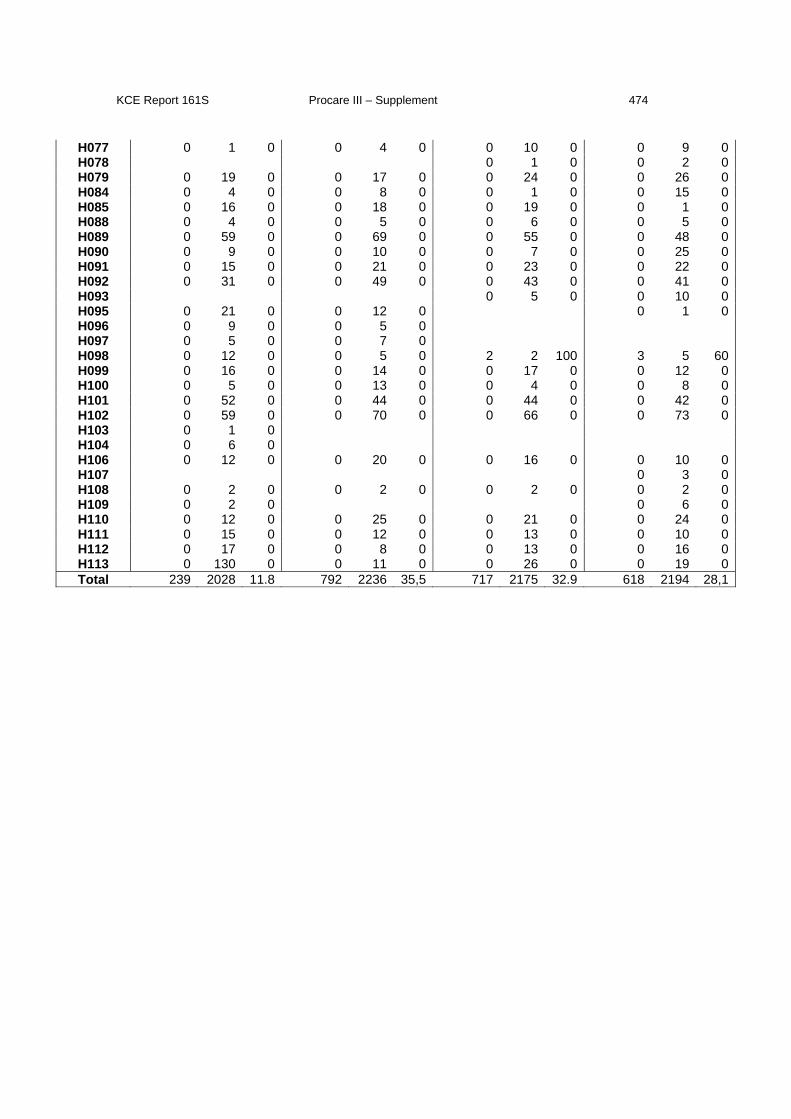
KCE Report 161S Procare III – Supplement 474
H077 0 1 0 0 4 0 0 10 0 0 9 0H078 0 1 0 0 2 0H079 0 19 0 0 17 0 0 24 0 0 26 0H084 0 4 0 0 8 0 0 1 0 0 15 0H085 0 16 0 0 18 0 0 19 0 0 1 0H088 0 4 0 0 5 0 0 6 0 0 5 0H089 0 59 0 0 69 0 0 55 0 0 48 0H090 0 9 0 0 10 0 0 7 0 0 25 0H091 0 15 0 0 21 0 0 23 0 0 22 0H092 0 31 0 0 49 0 0 43 0 0 41 0H093 0 5 0 0 10 0H095 0 21 0 0 12 0 0 1 0H096 0 9 0 0 5 0 H097 0 5 0 0 7 0 H098 0 12 0 0 5 0 2 2 100 3 5 60H099 0 16 0 0 14 0 0 17 0 0 12 0H100 0 5 0 0 13 0 0 4 0 0 8 0H101 0 52 0 0 44 0 0 44 0 0 42 0H102 0 59 0 0 70 0 0 66 0 0 73 0H103 0 1 0 H104 0 6 0 H106 0 12 0 0 20 0 0 16 0 0 10 0H107 0 3 0H108 0 2 0 0 2 0 0 2 0 0 2 0H109 0 2 0 0 6 0H110 0 12 0 0 25 0 0 21 0 0 24 0H111 0 15 0 0 12 0 0 13 0 0 10 0H112 0 17 0 0 8 0 0 13 0 0 16 0H113 0 130 0 0 11 0 0 26 0 0 19 0Total 239 2028 11.8 792 2236 35,5 717 2175 32.9 618 2194 28,1
KCE Report 161S Procare III – Supplement 475
4 CONCLUDING REMARKS Using the BCR database, we were able to examine the completeness of the PROCARE
database. However, the interpretation of the results has to be performed with great
caution due to the following reasons:
- When tumours are situated between 15 and 17cm above the margo ani, they are
considered as rectal tumours in the BCR database, but they are excluded in
PROCARE.
- Patients who are not treated are not included in PROCARE. Furthermore, a
number of centres only register surgically treated patients, meaning that patients
who did not have surgery are not registered.
- There is no deadline in PROCARE to register patients. A number of patients with
incidence year 2008 were added to the database after closure for the present
project.
- Assigning a patient to a centre is done differently in the BCR database,
compared to the PROCARE database. This might cause problems, especially
when a patient is treated in multiple centres.
In the future, administrative databases, such as the IMA database may help to overcome
some of these problems.
KCE Report 161S- Procare III – Supplement 476
Appendix 8: Further detail on the construction of adjusted excess probabilities for aggregated quality
indexes Table of contents
1 ADJUSTMENT OF EXCESS PROBABILITIES ............................................ 478
1.1 PROTOCOL HIERARCHICAL STEPWISE FORWARD SELECTION
PROCEDURE ................................................................................................ 478
1.2 SUMMARY MODEL BUILDING PROCEDURE: ............................................ 478
2 DOMAIN 1 ‘GENERAL QUALITY INDICATORS’ ......................................... 479
2.1 CALCULATING SCORES BASED ON A BINARY QI FOR QCI1111 ........... 479
2.2 COX MODEL FOR IMPUTATION OF (3 YEAR) SURVIVAL (QCI 1111) ..... 479
2.3 MAIN EFFECTS MODELS ............................................................................ 480
2.3.1 Main effects based on ”imputed” score 1 ............................................. 480
2.3.2 Main effects based on ”imputed” SCORE 2 ......................................... 480
2.3.3 Main effects based on ”imputed” SCORE 3 ......................................... 480
2.4 INTERACTIONS BETWEEN MAIN EFFECTS (IMPUTED DATASET 1) ..... 480
2.5 ALL-OR-NONE SCORE DOMAIN 1 .............................................................. 481
3 DOMAIN 2 ‘DIAGNOSIS AND STAGING’ AGGREGATION ........................ 482
3.1 MAIN EFFECTS ............................................................................................ 482
3.2 INTERACTIONS BETWEEN MAIN EFFECTS .............................................. 483
3.3 ALL-OR-NONE SCORE DOMAIN 2 .............................................................. 483
4 DOMAIN 3 ‘NEOADJUVANT TREATMENT’ AGGREGATION .................... 484
5 DOMAIN 4 ‘SURGERY’ AGGREGATION .................................................... 484
5.1 MAIN EFFECTS ............................................................................................ 484
5.2 INTERACTIONS BETWEEN MAIN EFFECTS .............................................. 485
5.3 ALL-OR-NONE SCORE DOMAIN 4 .............................................................. 486
6 DOMAIN 8 ‘HISTOPATHOLOGIC EXAMINATION’ AGGREGATION ......... 488
KCE Report 161S- Procare III – Supplement 477
6.1 MAIN EFFECTS ............................................................................................ 488
6.2 INTERACTIONS BETWEEN MAIN EFFECTS .............................................. 488
6.3 ALL-OR-NONE SCORE DOMAIN 8 .............................................................. 488
7 COMPOSITE SCORE AGGREGATION ...................................................... 490
7.1 COMPOSITE ALL-OR-NONE SCORE BASED ON THE 4 PROCESS AND 3
OUTCOME QCIS ........................................................................................... 490
7.1.1 List of candidate QCIs .......................................................................... 490
7.1.2 Concurrent validity of selected QCIs .................................................... 490
7.1.3 Construction of the quality index (QI) ................................................... 492
7.2 CALCULATING SCORES BASED ON A BINARY QI FOR QCIS 1111, 1273,
1274, 1231, 1211 AND 1272 ......................................................................... 495
7.3 ADJUSTMENT WITH MAIN EFFECTS: ........................................................ 495
7.3.1 Main effects based on ”imputed” score 1 ............................................. 495
7.3.2 Main effects based on ”imputed” score 2 ............................................. 495
7.3.3 Main effects based on ”imputed” score 3 ............................................. 495
7.4 INTERACTIONS BETWEEN MAIN EFFECTS .............................................. 496
7.5 “COMPOSITE” ALL-OR-NONE SCORE ........................................................ 497
8 OUTCOME SCORE AGGREGATION ........................................................... 498
8.1 CALCULATING SCORES BASED ON A BINARY QI FOR QCIS 1111, 1231,
1234B ............................................................................................................ 498
8.2 ADJUSTMENT WITH MAIN EFFECTS: ........................................................ 498
8.2.1 Main effects based on ”imputed” score 1 ............................................. 498
8.3 INTERACTIONS BETWEEN MAIN EFFECTS .............................................. 498
8.4 ADJUSTED “OUTCOME” ALL-OR-NONE SCORE ....................................... 499
KCE Report 161S- Procare III – Supplement 478
1 ADJUSTMENT OF EXCESS PROBABILITIES 1.1 PROTOCOL HIERARCHICAL STEPWISE FORWARD
SELECTION PROCEDURE A model building procedure –i.c. a logistic regression model with Firth's bias
correction - is performed to predict an aggregated all-or-none quality score from the
center and patient-level characteristics.
1.2 SUMMARY MODEL BUILDING PROCEDURE: We will adjust all-or-none scores for baseline patient characteristics as was done for
outcome QCI’s. Specifically, we conduct a Stepwise procedure as follows:
1) Adjustment for main effects of age (continuous, with breakpoint after 70 years) and
gender enter the model first
2) We build a main effects model, allowing the following variables to enter: BMI with
an indicator of its missingness, and the 9 categorical variables including a category
for missingness: cSTAGE, ASA co-morbidity score, level of the tumor, mode of
surgery, ventral tumor, cCRM, cT4, pre-operative incontinence, surgical technique.
Table 1: Summary: levels of prognostic factors Effect Levels
BMI (continuous)- BMI missing [ ref. = Not missing ] Missing
Cstage [ref=I] II, III, IV, missing ASA score [ ref. = I ] II, III-V, missing
Tumor level [ref. = Low] Mid, High, Missing Mode of surgery
[ ref. = Elective/Scheduled ] Urgent / Emergency, missing
Ventral tumor [ ref. = No ] Yes, missing cCRM positive [ ref. = No ] Yes, missing
cT4 [ ref. = No ] Yes, missing Preoper. incontinence [ ref. = No ] Yes, missing Surgical technique [ ref. = PME ] TME, missing
After adding significant main effects in a stepwise forward manner (with significance
level 0.05 for entering the model and 0.1 for leaving the model), significant
interactions from among the main effects are added, again in a stepwise forward
manner (with significance level 0.05 for entering the model and 0.1 for leaving the
model).
Note: Missingness has been observed mainly for the factors cCRM positive, BMI,
ventral tumor, and -ASA-score (more than 20% missingness, see Table 1).
KCE Report 161S- Procare III – Supplement 479
Table 2: Number of patients with missing values in the adjustment factors
Effect N Patients missing
%
cCRM positive 2706 82% BMI 1241 37%
Ventral tumor 832 25% ASA score 689 21%
Cstage (XM) 495 15% Mode of surgery 455 14%
Surgical technique 455 14% cT4 421 13%
Preoper. incontinence 333 10% Tumor level 319 10%
2 DOMAIN 1 ‘GENERAL QUALITY INDICATORS’ 2.1 CALCULATING SCORES BASED ON A BINARY QI FOR
QCI1111 All-or-none scores for this domain are based on overall survival (QCI 1111) in
general and on the probability to survive 3 years or longer in particular. When
QCI1111 is the sole contributor to the aggregated domain, the (3 year) survival
probability is derived directly from the Cox-model fit. When (3 year) survival is
combined with binary quality indicators in a binary all-or-none score, we impute a
binary outcome for 3 year survival in the set of 1279 patients who was not observed
to die and followed for less than 3 years. For the current exercise, the imputation
model starts form the conditional probability of surviving 3 years, given baseline
covariates and how long one was observed to survive so far. In general it may be
advantageous to allow for time-varying covariates to influence the imputation model.
We impute 10-fold here from the Cox proportional hazards model, built in a forward
stepwise manner with the same factors considered for the all-or-none score models.
For illustration purposes, and in the interest of time, the model was built separately
on the first 3 imputed datasets before deciding on a common model fit to all imputed
datasets leading to averaged estimates of the excess center-specific probabilities.
2.2 COX MODEL FOR IMPUTATION OF (3 YEAR) SURVIVAL (QCI 1111)
The most significant factor in a proportional hazards model corrected for confounding
by age and gender is asa score. (p<.0001). Next, the factors “Mode of surgery”
(p<.0001) and “cT4” (p=.0029) enter the model. No other factors have added further
‘significant’ value to this model (smallest p-value is .095).
KCE Report 161S- Procare III – Supplement 480
2.3 MAIN EFFECTS MODELS The following exercise on the analysis of 3 year survival with imputed outcomes, is
for illustrative and comparative purposes since we do not need the imputations for a
single score. Also, it should be emphasized that as the dataset matures, fewer and
fewer imputations should be necessary so that their impact is reduced.
In view of an aggregated all-or-none score we start by estimating adjusted center
effects based on each of the first three datasets with imputed 3-year survival
probabilities.
2.3.1 Main effects based on ”imputed” score 1 The most significant factor in a model corrected for confounding by age and gender
is c-stage. (p<.0001). Next, the factors “asa score” (p<.0001), “Mode of Surgery”
(p<.0001), “cT4” (p=.0013), “Ventral Tumor” (p=.0016), “preop. Incont.” (p=0.040)
enter the model. No other factors enter the model (smallest p-value is 0.063).
2.3.2 Main effects based on ”imputed” SCORE 2 The most significant factor in a model corrected for confounding by age and gender
is c-stage. (p<.0001). Next, the factors “asa score” (p<.0001), “Mode of Surgery”
(p<.0001), “cT4” (p=.0020), “Ventral Tumor” (p=.0054), “preop. Incont.” (p=0.024)
enter the model. No other factors enter the model (smallest p-value is 0.090).
2.3.3 Main effects based on ”imputed” SCORE 3 The most significant factor in a model corrected for confounding by age and gender
is c-stage. (p<.0001). Next, the factors “asa score” (p<.0001), “Mode of Surgery”
(p<.0001), “cT4” (p=.0039), “preop. Incont.” (p=0.024) and “Ventral Tumor” (p=.022),
enter the model. No other factors enter the model (smallest p-value is 0.36).
The final adjustment models for score 1-3 are identical; the only exception is that
factors “ventral tumor” and “preop incont” enter the model in reverse order in score
2 vs. score 3 models. In the interest of time. one decides to test for significant
interactions between main effects based on the significant main effects in the
dataset 1.
2.4 INTERACTIONS BETWEEN MAIN EFFECTS (IMPUTED DATASET 1)
Subsequently, interactions are added to the model with main effects for age (with a
different slope before and after the breakpoint of 70 years), gender, c-Stage, ASA-
score, Mode of Surgery, cT4, ventral tumor and preoperative incontinence.
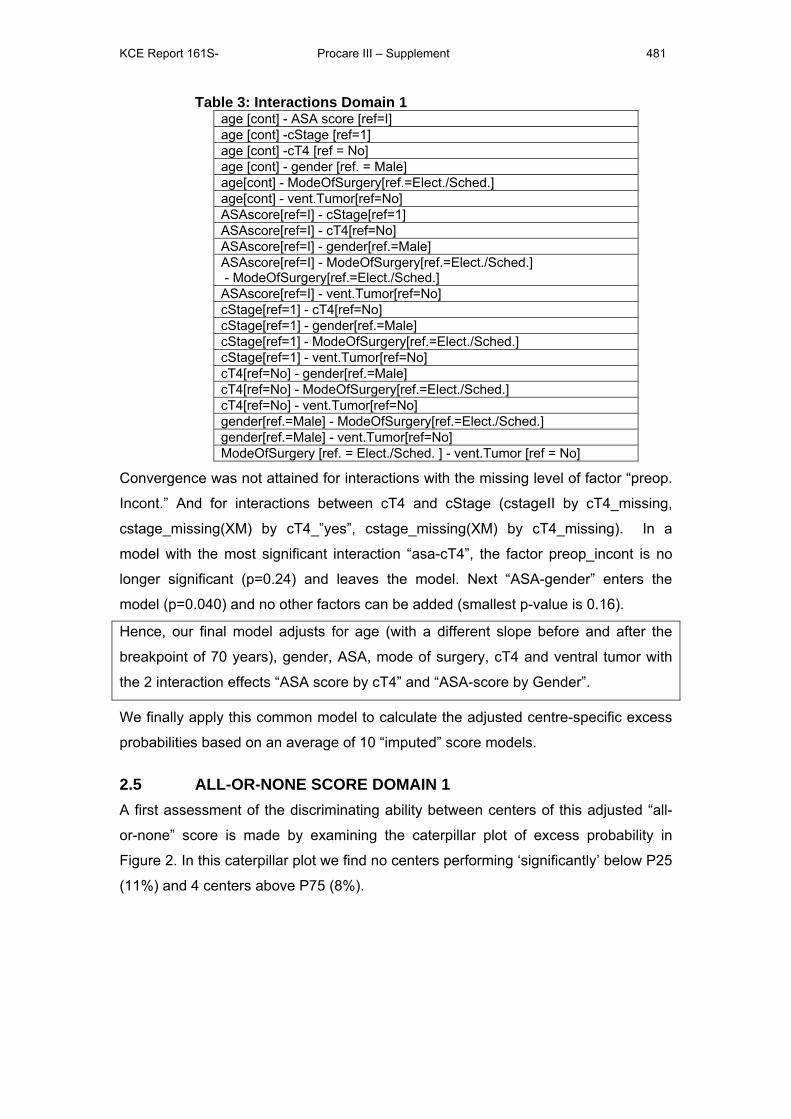
KCE Report 161S- Procare III – Supplement 481
Table 3: Interactions Domain 1 age [cont] - ASA score [ref=I] age [cont] -cStage [ref=1] age [cont] -cT4 [ref = No] age [cont] - gender [ref. = Male] age[cont] - ModeOfSurgery[ref.=Elect./Sched.] age[cont] - vent.Tumor[ref=No] ASAscore[ref=I] - cStage[ref=1] ASAscore[ref=I] - cT4[ref=No] ASAscore[ref=I] - gender[ref.=Male] ASAscore[ref=I] - ModeOfSurgery[ref.=Elect./Sched.] - ModeOfSurgery[ref.=Elect./Sched.] ASAscore[ref=I] - vent.Tumor[ref=No] cStage[ref=1] - cT4[ref=No] cStage[ref=1] - gender[ref.=Male] cStage[ref=1] - ModeOfSurgery[ref.=Elect./Sched.] cStage[ref=1] - vent.Tumor[ref=No] cT4[ref=No] - gender[ref.=Male] cT4[ref=No] - ModeOfSurgery[ref.=Elect./Sched.] cT4[ref=No] - vent.Tumor[ref=No] gender[ref.=Male] - ModeOfSurgery[ref.=Elect./Sched.] gender[ref.=Male] - vent.Tumor[ref=No] ModeOfSurgery [ref. = Elect./Sched. ] - vent.Tumor [ref = No]
Convergence was not attained for interactions with the missing level of factor “preop.
Incont.” And for interactions between cT4 and cStage (cstageII by cT4_missing,
cstage_missing(XM) by cT4_”yes”, cstage_missing(XM) by cT4_missing). In a
model with the most significant interaction “asa-cT4”, the factor preop_incont is no
longer significant (p=0.24) and leaves the model. Next “ASA-gender” enters the
model (p=0.040) and no other factors can be added (smallest p-value is 0.16).
Hence, our final model adjusts for age (with a different slope before and after the
breakpoint of 70 years), gender, ASA, mode of surgery, cT4 and ventral tumor with
the 2 interaction effects “ASA score by cT4” and “ASA-score by Gender”.
We finally apply this common model to calculate the adjusted centre-specific excess
probabilities based on an average of 10 “imputed” score models.
2.5 ALL-OR-NONE SCORE DOMAIN 1 A first assessment of the discriminating ability between centers of this adjusted “all-
or-none” score is made by examining the caterpillar plot of excess probability in
Figure 2. In this caterpillar plot we find no centers performing ‘significantly’ below P25
(11%) and 4 centers above P75 (8%).
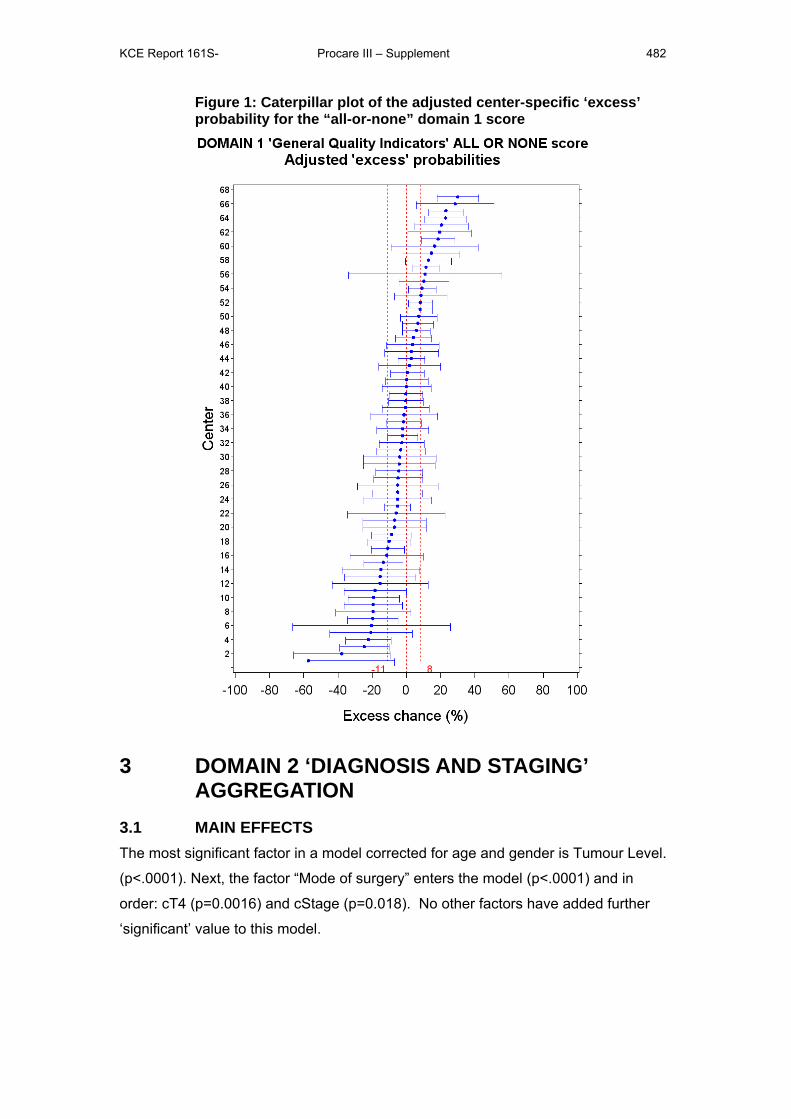
KCE Report 161S- Procare III – Supplement 482
Figure 1: Caterpillar plot of the adjusted center-specific ‘excess’ probability for the “all-or-none” domain 1 score
3 DOMAIN 2 ‘DIAGNOSIS AND STAGING’ AGGREGATION
3.1 MAIN EFFECTS The most significant factor in a model corrected for age and gender is Tumour Level.
(p<.0001). Next, the factor “Mode of surgery” enters the model (p<.0001) and in
order: cT4 (p=0.0016) and cStage (p=0.018). No other factors have added further
‘significant’ value to this model.

KCE Report 161S- Procare III – Supplement 483
3.2 INTERACTIONS BETWEEN MAIN EFFECTS Next, interactions are added to the model with main effects for age (with a different
slope before and after the breakpoint of 70 years), gender, tumour level, mode of
surgery, cT4 and cStage.
Table 4: Interactions examined for Domain 2 age[cont.] - cStage[ref=I] age[cont.] - cT4[ref=No]
age[cont.] - gender[ref=male] age[cont.] - modeofsurgery[ref=Sched.]
age[cont.] - tumorlevel[ref=Low] cStage[ref=I] - cT4[ref=No]
cStage[ref=I] - gender[ref=male] cStage[ref=I] - modeofsurgery[ref=Sched.]
cStage[ref=I] - tumorlevel[ref=Low] cT4[ref=No] - gender[ref=male]
cT4[ref=No] - modeofsurgery[ref=Sched.] cT4[ref=No] - tumorlevel[ref=Low]
gender[ref=male] - modeofsurgery[ref=Sched.] gender[ref=male] - tumorlevel[ref=Low]
modeofsurgery[ref=Sched.] - tumorlevel[ref=Low] The most significant interaction was “Age-gender” (p=0.033) followed by “gender by
cStage” (p-value: 0.023). No further interactions contributed significantly (smallest p-
value is 0.12)
Hence, our final model adjusts for age (with a different slope before and after the
breakpoint of 70 years), gender, Tumor Level, cT4 and cStage with the 2
interaction effects “Age by Gender” and “Gender by cStage”.
3.3 ALL-OR-NONE SCORE DOMAIN 2 A caterpillar plot of adjusted excess probabilities for the all-or-none score for
“diagnosis and staging” is shown in Figure 2. We find 5 centers performing
‘significantly’ below P25 (-14%) and 5 above P75 (+11%).
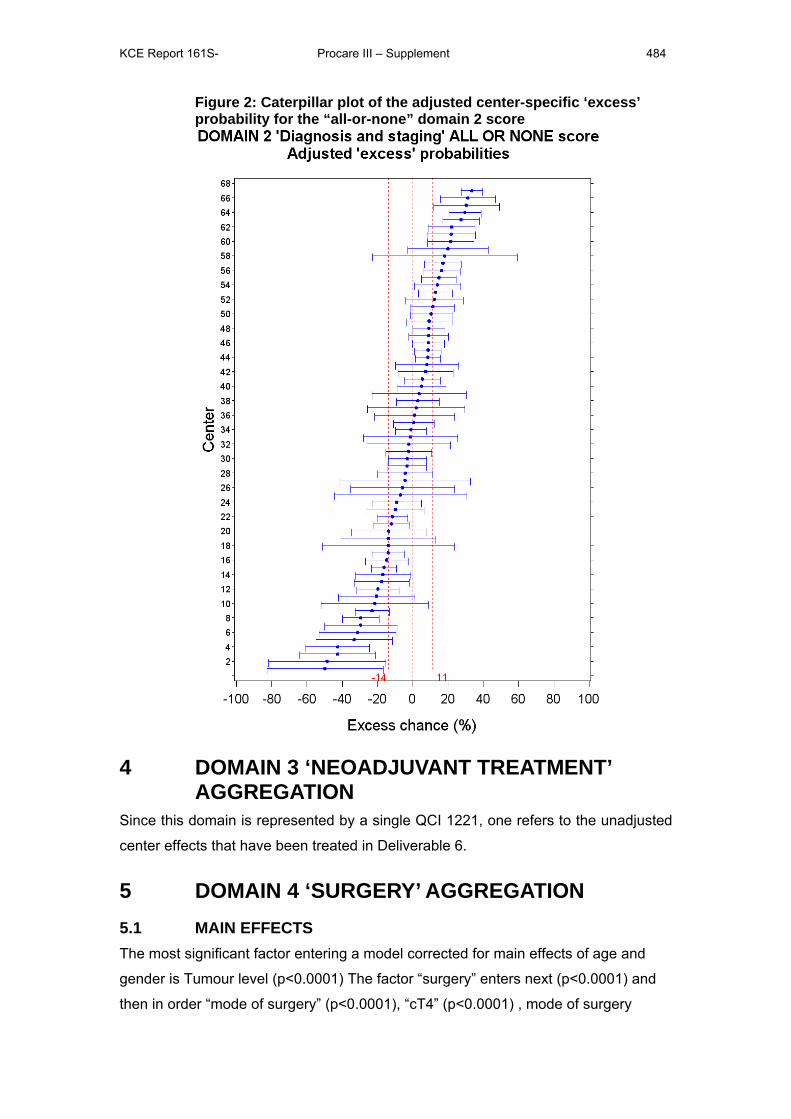
KCE Report 161S- Procare III – Supplement 484
Figure 2: Caterpillar plot of the adjusted center-specific ‘excess’ probability for the “all-or-none” domain 2 score
4 DOMAIN 3 ‘NEOADJUVANT TREATMENT’ AGGREGATION
Since this domain is represented by a single QCI 1221, one refers to the unadjusted
center effects that have been treated in Deliverable 6.
5 DOMAIN 4 ‘SURGERY’ AGGREGATION 5.1 MAIN EFFECTS The most significant factor entering a model corrected for main effects of age and
gender is Tumour level (p<0.0001) The factor “surgery” enters next (p<0.0001) and
then in order “mode of surgery” (p<0.0001), “cT4” (p<0.0001) , mode of surgery
KCE Report 161S- Procare III – Supplement 485
(p<0.0001), cCRM (p=0.0009), cStage (p=0.0051), Ventral Tumor (p=0.0088) and
ASA score (p=0.017). No other factors are significant at the .05 level (smallest p-
value is 0.078). Our final model is left with 10 main effects (Age, gender, Tumour
level, surgery, mode of surgery, cT4, cCRM, cStage, Ventral Tumor, ASA score).
5.2 INTERACTIONS BETWEEN MAIN EFFECTS Subsequently, interactions between the main effects are added to the model:
Table 5: Interactions examined for Domain 4 age[cont.] - ASA[ref=I]
age[cont.] - cCRM[ref=No] age[cont.] - cStage[ref=I] age[cont.] - cT4[ref=No]
age[cont.] - gender[ref=male] age[cont.] – mode of surgery[ref=Sched.]
age[cont.] - surgery[ref=PME] age[cont.] – tumor level[ref=Low]
age[cont.] – ventral Tumor[ref=No] ASA[ref=I] - cCRM[ref=No] ASA[ref=I] - cStage[ref=I] ASA[ref=I] - cT4[ref=No]
ASA[ref=I] - gender[ref=male] ASA[ref=I] – mode of surgery[ref=Sched.]
ASA[ref=I] - surgery[ref=PME] ASA[ref=I] – tumor level[ref=Low]
ASA[ref=I] – ventral Tumor[ref=No] cCRM[ref=No] - cStage[ref=I] cCRM[ref=No] - cT4[ref=No]
cCRM[ref=No] - gender[ref=male] cCRM[ref=No] – mode of surgery[ref=Sched.]
cCRM[ref=No] - surgery[ref=PME] cCRM[ref=No] – tumor level[ref=Low]
cCRM[ref=No] – ventral Tumor[ref=No] cStage[ref=I] - cT4[ref=No]
cStage[ref=I] - gender[ref=male] cStage[ref=I] – mode of surgery[ref=Sched.]
cStage[ref=I] - surgery[ref=PME] cStage[ref=I] – tumor level[ref=Low]
cStage[ref=I] – ventral Tumor[ref=No] cT4[ref=No] - gender[ref=male]
cT4[ref=No] – mode of surgery[ref=Sched.] cT4[ref=No] - surgery[ref=PME]
cT4[ref=No] – tumor level[ref=Low] cT4[ref=No] – ventral Tumor[ref=No]
gender[ref=male] – mode of surgery[ref=Sched.] gender[ref=male] - surgery[ref=PME]
gender[ref=male] – tumor level[ref=Low] gender[ref=male] - ventralTumor[ref=No]
modeofsurgery[ref=Sched.] - surgery[ref=PME] modeofsurgery[ref=Sched.] – tumor level[ref=Low]
modeofsurgery[ref=Sched.] – ventral Tumor[ref=No] surgery[ref=PME] – tumor level[ref=Low]
surgery[ref=PME] – ventral Tumor[ref=No] Tumor level[ref=Low] – ventral Tumor[ref=No]
KCE Report 161S- Procare III – Supplement 486
We add interaction terms starting from the model with the interaction “ASA score by
Mode of surgery” (which is most significant among the 45 interactions, p<0.0001),
“cStage by ventralTumour” (p=0.023). Adding other interactions does not improve
the model (smallest p-value is 0.0504). It was not possible to assess significance of interaction effects for all combination of levels, i.c. one lacks sufficient
data to assess the interaction of ASA score level Missing by all cStage levels and surgery technique Missing, cT4
Missing by cCRM “Missing” and cstage Missing by all levels of cT4, ASA score III by Surgery technique Missing,
cStage II by Surgery Technique Missin, asaIII by surgery Missing, cStageII by cT4 Missing and Mode of
surgeryEM by ventralTumor “Yes”.
Hence, our final model will adjust for age (with a different slope before and after the
breakpoint of 70 years), gender, Tumour level, surgery, mode of surgery, cT4,
cCRM, cStage, Ventral Tumor, ASA score and 2 interactions 1 ) “ASA score by
Mode of surgery” and 2) ”cStage by ventralTumour”.
5.3 ALL-OR-NONE SCORE DOMAIN 4 Adjusted center effects are shown in the caterpillar plot (see Figure 4Error! Reference source not found.)where we find one center performing ‘significantly’
below P25 (-6%) and two centers significantly above P75 (6%), where we find one
center performing ‘significantly’ below P25 and 2 above P75.
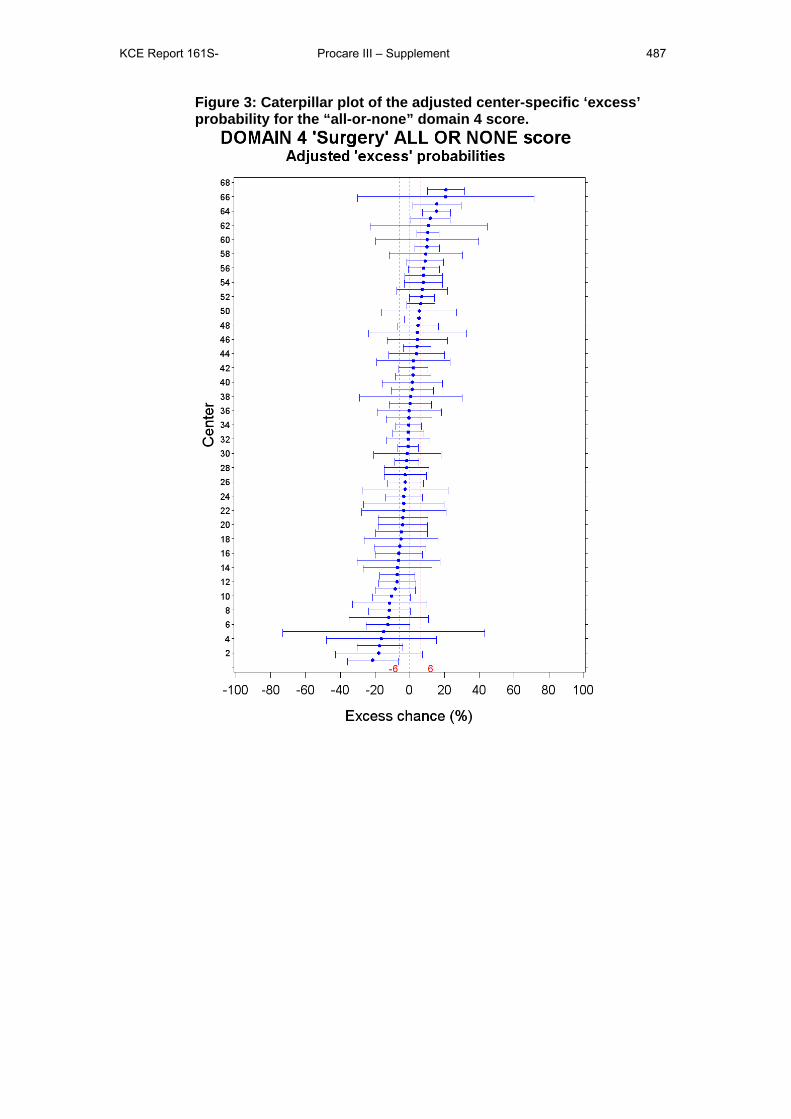
KCE Report 161S- Procare III – Supplement 487
Figure 3: Caterpillar plot of the adjusted center-specific ‘excess’ probability for the “all-or-none” domain 4 score.
KCE Report 161S- Procare III – Supplement 488
6 DOMAIN 8 ‘HISTOPATHOLOGIC EXAMINATION’ AGGREGATION
6.1 MAIN EFFECTS The most significant factor in a model corrected for confounding by age and gender
is “mode of surgery”. (p<0001) The factor “cStage” is the best factor in a model with
gender, age and mode of surgery (p<0001). Addition of factor “surgery” (p=0.04322)
yields a model with 3 additional effects to adjust for (no factors leave the model).
Adding other factors does not add further ‘significant’ value to the model (all p ≥ .07).
6.2 INTERACTIONS BETWEEN MAIN EFFECTS Subsequently, interactions are added to the main effects:
Table 6: Interactions Domain 8 age [cont]- cstage [ref=I] age [cont] - gender [ref. = Male] age [cont] - mode_of_surgery [ ref. = Elective/Sch. ] age [cont] - surgical technique [ref. = PME] cstage [ref=I] -gender [ref. = Male] cstage [ref=I] - mode_of_surgery [ ref. = Elective/Sch. ] cstage [ref=I] -surgical technique [ref. = PME] gender [ref. = Male] - mode_of_surgery [ ref. = Elective/Sch. ] gender [ref. = Male] - surgical technique [ref. = PME] mode_of_surgery [ ref. = Elective/Sch. ] - surgical technique [ref. = PME]
Now we add interaction terms starting from the model with the interaction “mode of
surgery-surgery” (which is most significant among the 10 interactions, p<.0001), then
enters “cStage by gender” (p=.044) among 9 remaining interactions. Other
interactions do not enter the model (smallest p-value is 0.50).
Hence our final model contains main effects age, gender, “mode-of-surgery”, “c-
Stage”, “surgery technique” together with 2 interaction effects, i.e.
“mode of surgery by surgery technique” and “cStage by gender”.
6.3 ALL-OR-NONE SCORE DOMAIN 8 A first assessment of the discriminating ability between centers of this “all-or-none”
score is made by examining the caterpillar plot of the excess probability in Figure 4.
In this caterpillar plot we find 2 centers performing ‘significantly’ below P25 and 5
above P75.
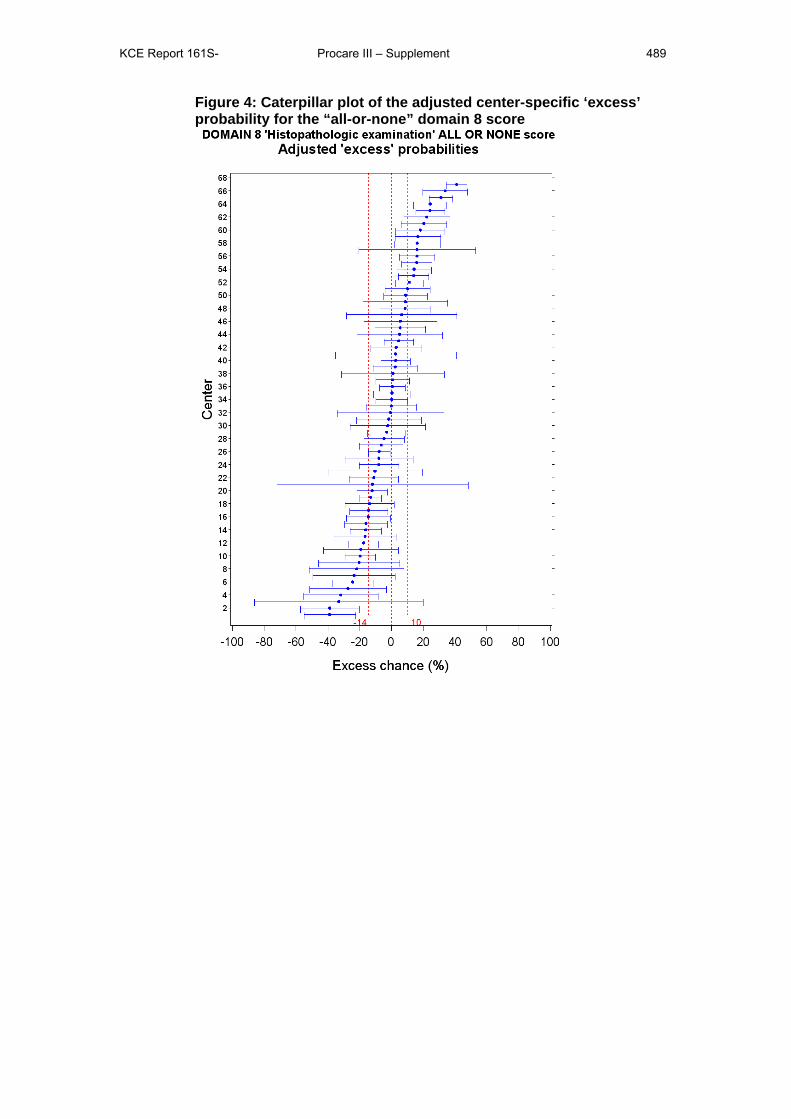
KCE Report 161S- Procare III – Supplement 489
Figure 4: Caterpillar plot of the adjusted center-specific ‘excess’ probability for the “all-or-none” domain 8 score
KCE Report 161S- Procare III – Supplement 490
7 COMPOSITE SCORE AGGREGATION We constructed a composite index for outcome and process QCIs combined. We
appreciated this is a complex measure to interpret and produced it in response to the
request to arrive at a single global quality index. The relative weight of outcome and
process QCIs in this construction is to some degree a matter of choice. In an attempt
to give similar chances to outcome and process QCIs to enter, the first approach
starts from the previously selected QCIs for respectively outcome and process
aggregated scores. The second approach starts instead from all available QCIs with
sufficient data quality. The second approach was developed in the main report and
kept as the approach of choice. The first one is detailed below.
7.1 COMPOSITE ALL-OR-NONE SCORE BASED ON THE 4 PROCESS AND 3 OUTCOME QCIS
7.1.1 List of candidate QCIs Previously the combined outcome QI was constructed using an all-or-none score
involving the following QCIs:
• QCI 1111: Overall survival [cut-off at 3 years]
• QCI 1231: Proportion of R0 resections
• QCI 1234b: Postoperative major surgical morbidity with reintervention
under narcosis after radical surgical resection.
The combined process QI was constructed using the all-or-none score involving the
following QCIs:
• QCI 1217: Time between first histopathological diagnosis and first
treatment [cut-off at 30 days].
• QCI 1232a: Proportion of APR- Hartmann’s procedure or total excision
of colon and rectum with definitive ileostomy. [Negative QCI]
• QCI 1273: Distal tumour-free margin mentioned in the pathology
report.
• QCI 1274: Number of lymph nodes examined [cut-off at 10].
7.1.2 Concurrent validity of selected QCIs To examine the concurrent validity we performed a principal component analysis on
the ‘excess’ probabilities for QCIs 1111, 1231, 1234b, 1217, 1232a, 1273 and 1274.
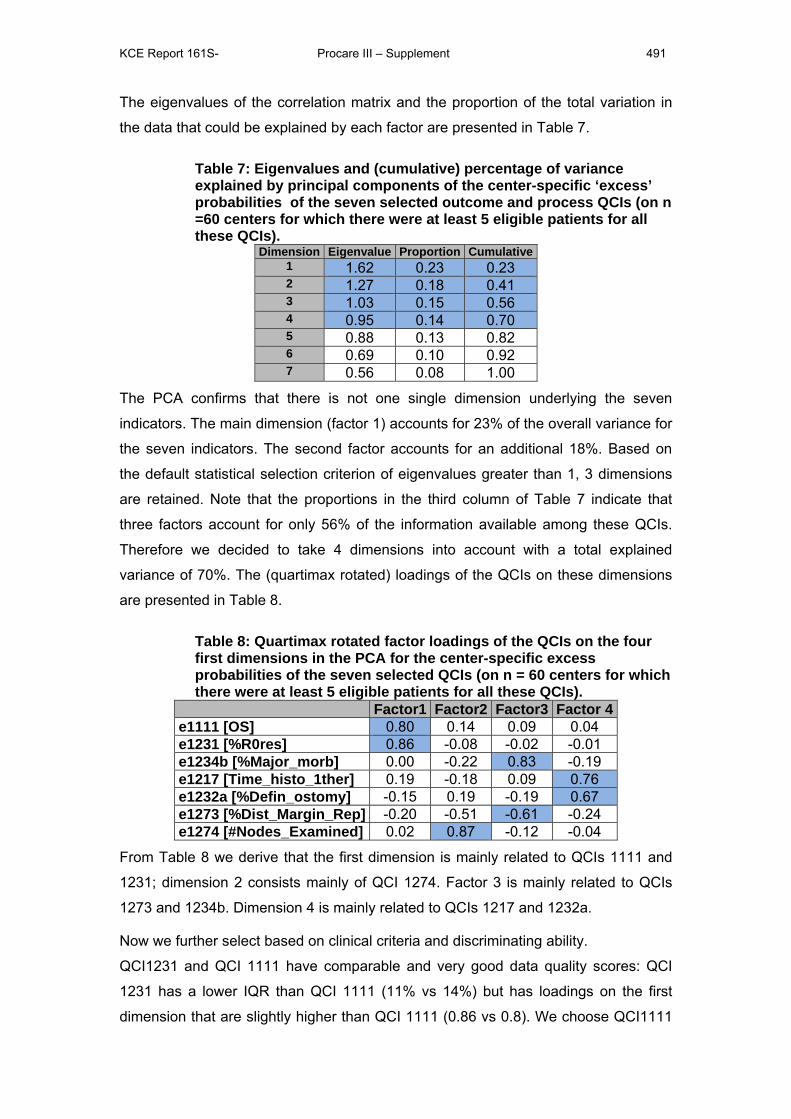
KCE Report 161S- Procare III – Supplement 491
The eigenvalues of the correlation matrix and the proportion of the total variation in
the data that could be explained by each factor are presented in Table 7.
Table 7: Eigenvalues and (cumulative) percentage of variance explained by principal components of the center-specific ‘excess’ probabilities of the seven selected outcome and process QCIs (on n =60 centers for which there were at least 5 eligible patients for all these QCIs).
Dimension Eigenvalue Proportion Cumulative1 1.62 0.23 0.23 2 1.27 0.18 0.41 3 1.03 0.15 0.56 4 0.95 0.14 0.70 5 0.88 0.13 0.82 6 0.69 0.10 0.92 7 0.56 0.08 1.00
The PCA confirms that there is not one single dimension underlying the seven
indicators. The main dimension (factor 1) accounts for 23% of the overall variance for
the seven indicators. The second factor accounts for an additional 18%. Based on
the default statistical selection criterion of eigenvalues greater than 1, 3 dimensions
are retained. Note that the proportions in the third column of Table 7 indicate that
three factors account for only 56% of the information available among these QCIs.
Therefore we decided to take 4 dimensions into account with a total explained
variance of 70%. The (quartimax rotated) loadings of the QCIs on these dimensions
are presented in Table 8.
Table 8: Quartimax rotated factor loadings of the QCIs on the four first dimensions in the PCA for the center-specific excess probabilities of the seven selected QCIs (on n = 60 centers for which there were at least 5 eligible patients for all these QCIs).
Factor1 Factor2 Factor3 Factor 4 e1111 [OS] 0.80 0.14 0.09 0.04 e1231 [%R0res] 0.86 -0.08 -0.02 -0.01 e1234b [%Major_morb] 0.00 -0.22 0.83 -0.19 e1217 [Time_histo_1ther] 0.19 -0.18 0.09 0.76 e1232a [%Defin_ostomy] -0.15 0.19 -0.19 0.67 e1273 [%Dist_Margin_Rep] -0.20 -0.51 -0.61 -0.24 e1274 [#Nodes_Examined] 0.02 0.87 -0.12 -0.04
From Table 8 we derive that the first dimension is mainly related to QCIs 1111 and
1231; dimension 2 consists mainly of QCI 1274. Factor 3 is mainly related to QCIs
1273 and 1234b. Dimension 4 is mainly related to QCIs 1217 and 1232a.
Now we further select based on clinical criteria and discriminating ability.
QCI1231 and QCI 1111 have comparable and very good data quality scores: QCI
1231 has a lower IQR than QCI 1111 (11% vs 14%) but has loadings on the first
dimension that are slightly higher than QCI 1111 (0.86 vs 0.8). We choose QCI1111

KCE Report 161S- Procare III – Supplement 492
as the clinically most relevant candidate to represent the first dimension. QCI 1274 is
the only retained candidate for the second dimension. For the third dimension QCI
1234b has a lower PROCARE survey score of 2 on clinical importance, therefore
QCI 1273 is chosen, although data availability is inferior to 1234b (72% vs 90% for
QCI 1234b). QCI 1217 has poor data quality parameters and therefore 1232a is
chosen as the representative for the fourth dimension.
7.1.3 Construction of the quality index (QI) In summary, the composite QI will be constructed using the following QCIs:
• QCI 1111: Overall survival
• QCI 1232a: Proportion of APR- Hartmann’s procedure or total excision
of colon and rectum with definitive ileostomy.
• QCI 1273: Distal tumour-free margin mentioned in the pathology
report.
• QCI 1274: Number of lymph nodes examined.
7.1.3.1 All-or-none score The “all-or-none” score for the composite index indicates whether a patient reaches
patient-level benchmarks, in this case:
• whether he/she survived 3-years since incidence of rectal cancer,
For patients with a follow-up of less than 3 years, a model based
multiple imputation technique is used to construct the all-or-none
score and corresponding confidence limits. More details on multiple
imputation are provided in Appendix 2.
• whether he/she did avoid the APR- Hartmann’s procedure or total
excision of colon and rectum with definitive ileostomy,
• whether he/she had a tumour-free margin mentioned in the pathology
report, and
• whether there were at least 10 lymph nodes examined
Of the 3318 patients in the database, 3136 (94.5%) patients are eligible for at least
one QCI in the QI, while 1881 (56.7%) are eligible for all (four) contributing QCIs.
Of the 3318 patients, 1270 (38.3%) patients achieved the all-or-none score or 44.5%
(weighted), or 39.1% (unweighted) on average per center.
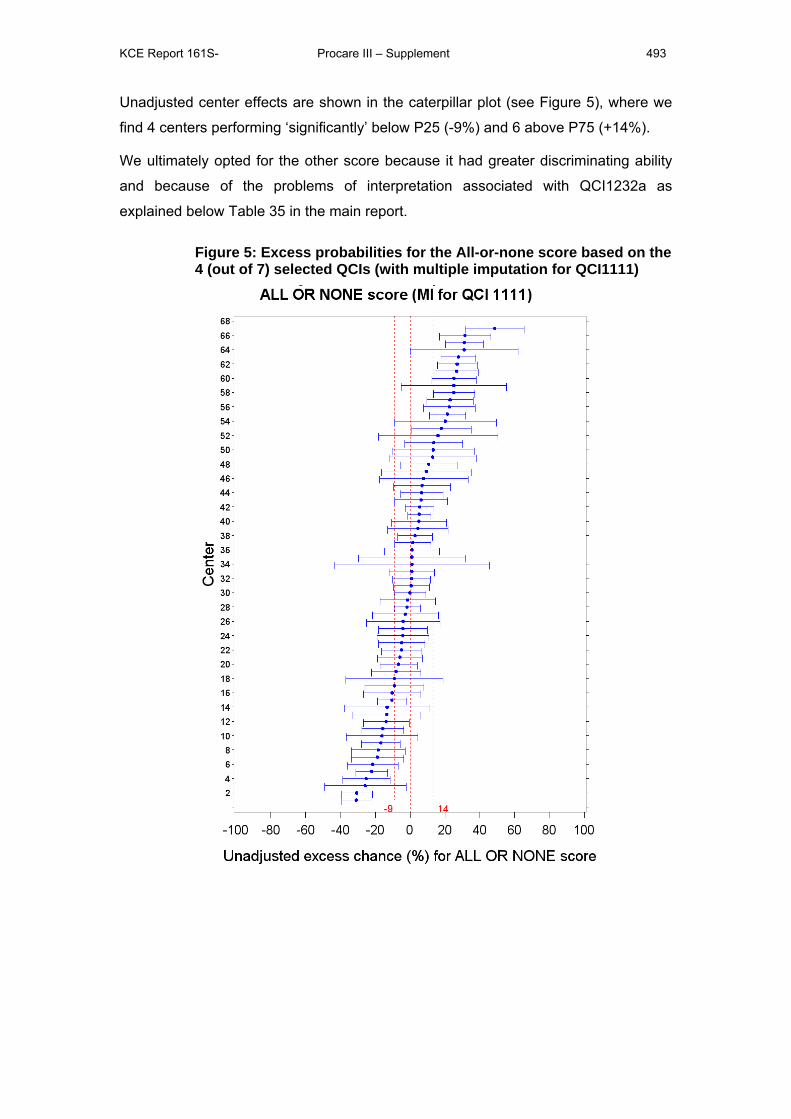
KCE Report 161S- Procare III – Supplement 493
Unadjusted center effects are shown in the caterpillar plot (see Figure 5), where we
find 4 centers performing ‘significantly’ below P25 (-9%) and 6 above P75 (+14%).
We ultimately opted for the other score because it had greater discriminating ability
and because of the problems of interpretation associated with QCI1232a as
explained below Table 35 in the main report.
Figure 5: Excess probabilities for the All-or-none score based on the 4 (out of 7) selected QCIs (with multiple imputation for QCI1111)
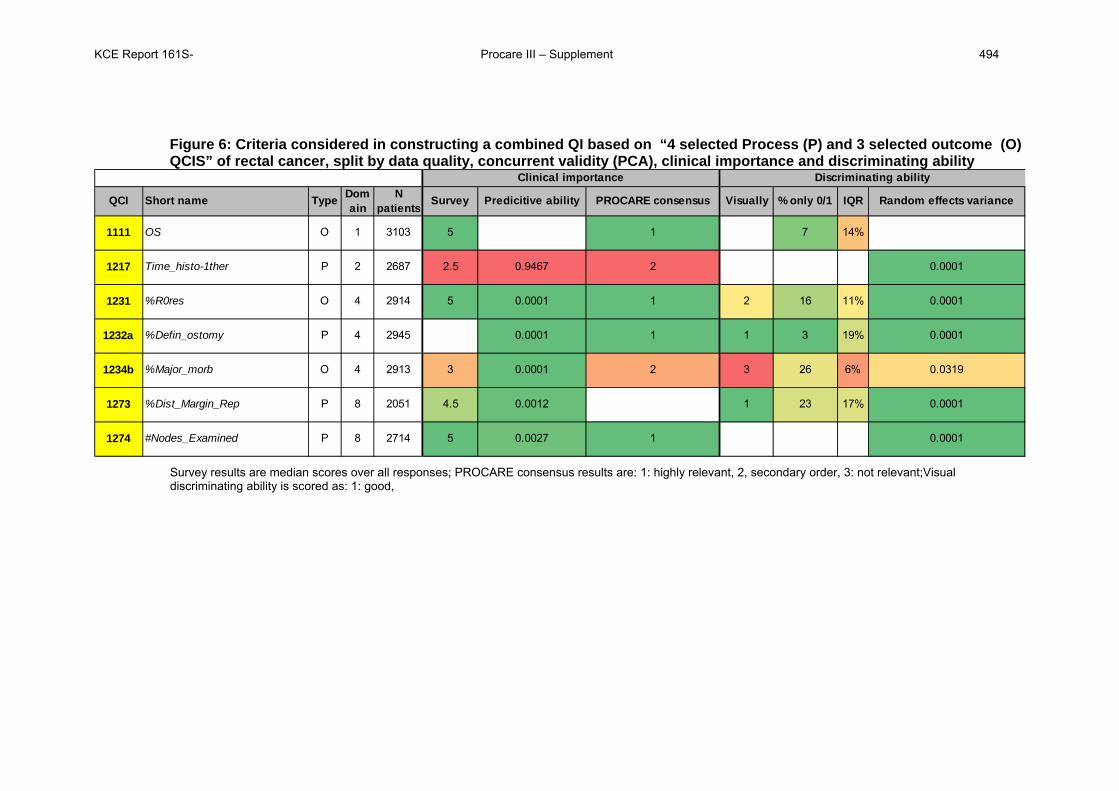
KCE Report 161S- Procare III – Supplement 494
Figure 6: Criteria considered in constructing a combined QI based on “4 selected Process (P) and 3 selected outcome (O) QCIS” of rectal cancer, split by data quality, concurrent validity (PCA), clinical importance and discriminating ability
QCI Short name Type Domain
N patients
Survey Predicitive ability PROCARE consensus Visually % only 0/1 IQR Random effects variance
1111 OS O 1 3103 5 1 7 14%
1217 Time_histo-1ther P 2 2687 2.5 0.9467 2 0.0001
1231 %R0res O 4 2914 5 0.0001 1 2 16 11% 0.0001
1232a %Defin_ostomy P 4 2945 0.0001 1 1 3 19% 0.0001
1234b %Major_morb O 4 2913 3 0.0001 2 3 26 6% 0.0319
1273 %Dist_Margin_Rep P 8 2051 4.5 0.0012 1 23 17% 0.0001
1274 #Nodes_Examined P 8 2714 5 0.0027 1 0.0001
Clinical importance Discriminating ability
Survey results are median scores over all responses; PROCARE consensus results are: 1: highly relevant, 2, secondary order, 3: not relevant;Visual discriminating ability is scored as: 1: good,
KCE Report 161S- Procare III – Supplement 495
7.2 CALCULATING SCORES BASED ON A BINARY QI FOR QCIS 1111, 1273, 1274, 1231, 1211 AND 1272
The all-or-none scores for the composite QI is based on the probability to survive 3
years or longer (QCI 1111) and 5 other binary quality criteria (defined previously for
QCI’s 1273,1274, 1231, 1211 and 1272). To obtain a binary index -for (not) having
survived longer than 3 years- one needs to estimate the 3-year survival probability in
patients who did not have follow-up for at least 3 years. To this end, a Cox
proportional hazard model is used which is built in a forward stepwise manner as
done previously for domain 1 aggregation (see section 2).
We calculate the scores based on the aggregated binary indices. For the survival
index one uses an imputation procedure. The procedure is repeated 10 times to
obtain averaged estimates of the excess center-specific probabilities.
7.3 ADJUSTMENT WITH MAIN EFFECTS: One needs to ajust the logistic regression model for each imputed score outcome.
7.3.1 Main effects based on ”imputed” score 1 The most significant factor in a model corrected for confounding by age and gender
is ASA (p<0.0001). Next in order, the factors level (p<0.0001), cStage (p=0.026), cT4
(p=0.014) and surgery (p=0.045) enter the model. No other factors enter the model
(smallest p-value is 0.29).
7.3.2 Main effects based on ”imputed” score 2 The most significant factor in a model corrected for confounding by age and gender
is ASA (p<0.0001). Next in order, one enters the factors level (p<0.0001), cStage
(p=0.0006), cT4 (p=0.018; 2nd in order to the most significant factor mode of surgery
with p=0.010, but chosen to parallel the previous adjustment) and surgery (p=0.0018)
enter the model. No other factors enter the model (smallest p-value is 0.06).
7.3.3 Main effects based on ”imputed” score 3 The most significant factor in a model corrected for confounding by age and gender
is ASA (p<0.0001). Next in order, one enters the factors level (p<0.0001), cStage
(p=0.0044), cT4 (p=0.018) and surgery (p=0.06; 2nd in order to the most significant
factor mode of surgery with p=0.035, but chosen to parallel the previous adjustment)
enter the model. No other factors enter the model (smallest p-value is 0.12).
Here we decide to take identical adjustments with main effects ASA, level, cStage,
cT4 and surgery. One notes that mode-of-surgery could have been used as a valid
alternative to surgery (in models with all-or-none scores “2” and “3”).
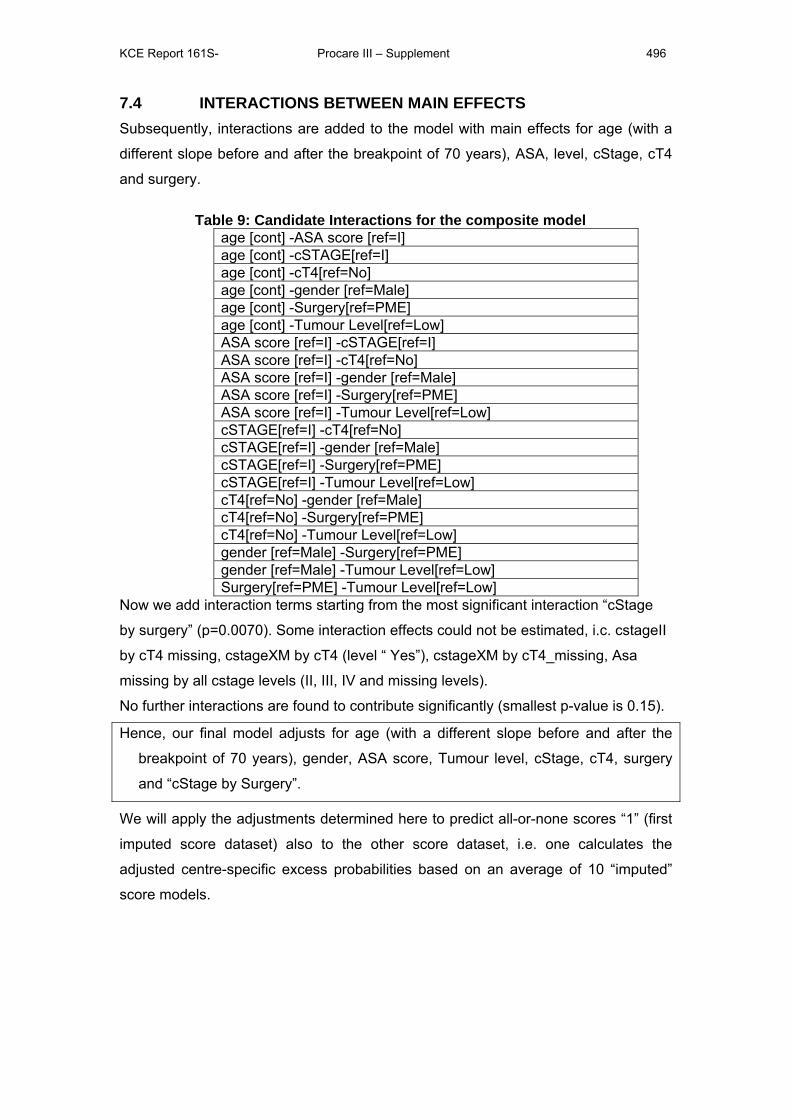
KCE Report 161S- Procare III – Supplement 496
7.4 INTERACTIONS BETWEEN MAIN EFFECTS Subsequently, interactions are added to the model with main effects for age (with a
different slope before and after the breakpoint of 70 years), ASA, level, cStage, cT4
and surgery.
Table 9: Candidate Interactions for the composite model age [cont] -ASA score [ref=I] age [cont] -cSTAGE[ref=I] age [cont] -cT4[ref=No] age [cont] -gender [ref=Male] age [cont] -Surgery[ref=PME] age [cont] -Tumour Level[ref=Low] ASA score [ref=I] -cSTAGE[ref=I] ASA score [ref=I] -cT4[ref=No] ASA score [ref=I] -gender [ref=Male] ASA score [ref=I] -Surgery[ref=PME] ASA score [ref=I] -Tumour Level[ref=Low] cSTAGE[ref=I] -cT4[ref=No] cSTAGE[ref=I] -gender [ref=Male] cSTAGE[ref=I] -Surgery[ref=PME] cSTAGE[ref=I] -Tumour Level[ref=Low] cT4[ref=No] -gender [ref=Male] cT4[ref=No] -Surgery[ref=PME] cT4[ref=No] -Tumour Level[ref=Low] gender [ref=Male] -Surgery[ref=PME] gender [ref=Male] -Tumour Level[ref=Low] Surgery[ref=PME] -Tumour Level[ref=Low]
Now we add interaction terms starting from the most significant interaction “cStage
by surgery” (p=0.0070). Some interaction effects could not be estimated, i.c. cstageII
by cT4 missing, cstageXM by cT4 (level “ Yes”), cstageXM by cT4_missing, Asa
missing by all cstage levels (II, III, IV and missing levels).
No further interactions are found to contribute significantly (smallest p-value is 0.15).
Hence, our final model adjusts for age (with a different slope before and after the
breakpoint of 70 years), gender, ASA score, Tumour level, cStage, cT4, surgery
and “cStage by Surgery”.
We will apply the adjustments determined here to predict all-or-none scores “1” (first
imputed score dataset) also to the other score dataset, i.e. one calculates the
adjusted centre-specific excess probabilities based on an average of 10 “imputed”
score models.
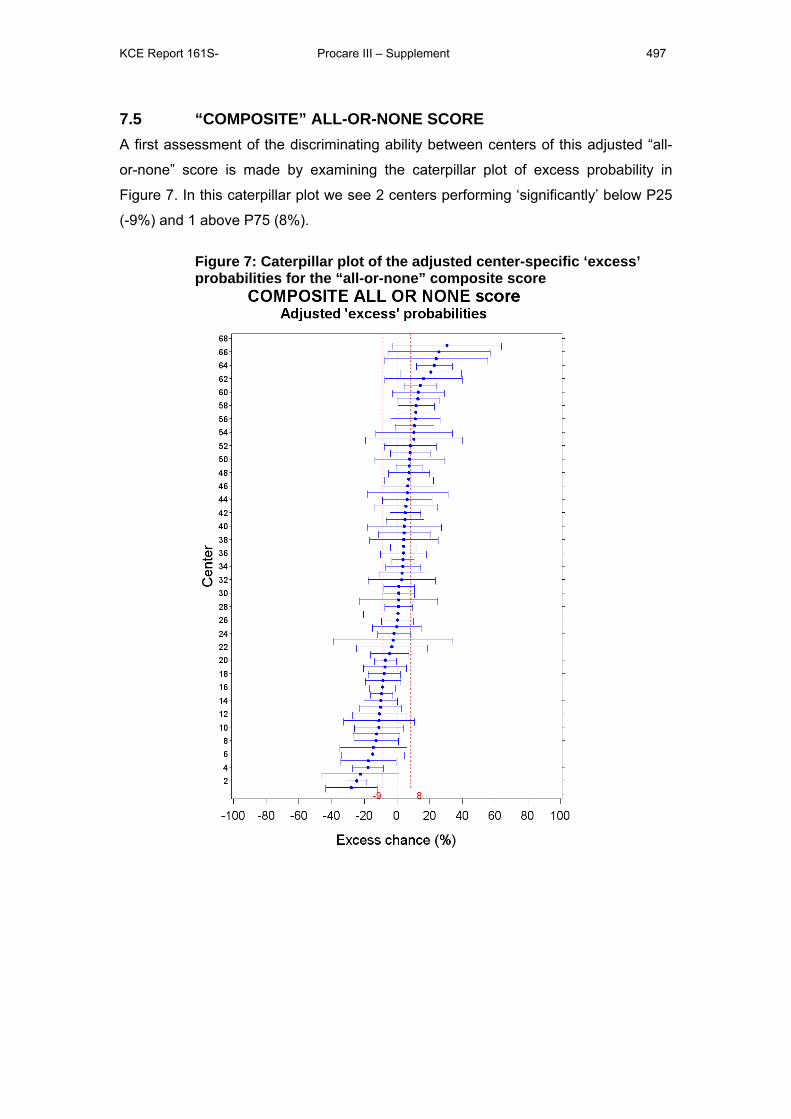
KCE Report 161S- Procare III – Supplement 497
7.5 “COMPOSITE” ALL-OR-NONE SCORE A first assessment of the discriminating ability between centers of this adjusted “all-
or-none” score is made by examining the caterpillar plot of excess probability in
Figure 7. In this caterpillar plot we see 2 centers performing ‘significantly’ below P25
(-9%) and 1 above P75 (8%).
Figure 7: Caterpillar plot of the adjusted center-specific ‘excess’ probabilities for the “all-or-none” composite score
KCE Report 161S- Procare III – Supplement 498
8 OUTCOME SCORE AGGREGATION 8.1 CALCULATING SCORES BASED ON A BINARY QI FOR QCIS
1111, 1231, 1234B The all-or-none scores for the OUTCOME QI is based on the probability to survive 3
years or longer (QCI 1111) and 2 other binary quality criteria (defined previously for
QCI’s 1231 and 1234b). To obtain a binary index -for (not) having survived longer
than 3 years- one needs to estimate the 3-year survival probability in patients who
did not have follow-up for at least 3 years. To this end, a Cox proportional hazard
model is used which is built as done previously for outcome aggregation (see
deliverable 6).
We calculate the scores based on the aggregated binary indices. For the survival
index one uses an imputation procedure. The procedure is repeated 10 times to
obtain averaged estimates of the excess center-specific probabilities.
8.2 ADJUSTMENT WITH MAIN EFFECTS: One needs to adjust the logistic regression model for each imputed score outcome.
8.2.1 Main effects based on ”imputed” score 1 The most significant factor in a model corrected for confounding by age and gender
is cStage (p<0.0001). Next in order, the factors ASA (p<0.0001), cT4 (p<0.0001), and
Mode of Surgery (p=0.00014) enter the model. No other factors enter the model
(smallest p-value is 0.29).
Here we decide to take identical adjustments with main effects cStage, ASA, cT4 and
Mode of surgery.
8.3 INTERACTIONS BETWEEN MAIN EFFECTS Subsequently, interactions are added to the model with main effects for age (with a
different slope before and after the breakpoint of 70 years), cStage, ASA, cT4 and
Mode of surgery.
KCE Report 161S- Procare III – Supplement 499
Table 10: Candidate Interactions for the composite model age[cont.] - ASA[ref=I]
age[cont.] - cStage[ref=I] age[cont.] - cT4[ref=No]
age[cont.] - gender[ref=male] age[cont.] - modeofsurgery[ref=Sched.]
ASA[ref=I] - cStage[ref=I] ASA[ref=I] - cT4[ref=No]
ASA[ref=I] - gender[ref=male] ASA[ref=I] - modeofsurgery[ref=Sched.]
cStage[ref=I] - cT4[ref=No] cStage[ref=I] - gender[ref=male]
cStage[ref=I] - modeofsurgery[ref=Sched.]
cT4[ref=No] - gender[ref=male] cT4[ref=No] - modeofsurgery[ref=Sched.]
gender[ref=male] - modeofsurgery[ref=Sched.]
Now we add interaction terms starting from the most significant interaction “age by
ASA” (p=0.022). Next,. “cStage by Mode-of-surgery” enters the model. Some
interaction effects could not be estimated, i.c. ASA missing by all cstage levels (II, III,
IV and missing levels).
No further interactions are found to contribute significantly (smallest p-value is
0.060).
Hence, our final model adjusts for age (with a different slope before and after the
breakpoint of 70 years), gender, cStage, ASA score, cT4, Mode of surgery and
“Age by ASA” and “cStage by Mode-of-Surgery”.
We will apply the adjustments determined here to predict all-or-none scores “1” (first
imputed score dataset) also to the other score dataset, i.e. one calculates the
adjusted centre-specific excess probabilities based on an average of 10 “imputed”
score models.
8.4 ADJUSTED “OUTCOME” ALL-OR-NONE SCORE A first assessment of the discriminating ability between centers of this adjusted “all-
or-none” score is made by examining the caterpillar plot of excess probability in
Figure 7. In this caterpillar plot we see 1 center performing ‘significantly’ below P25 (-
9%) and 3 above P75 (8%).
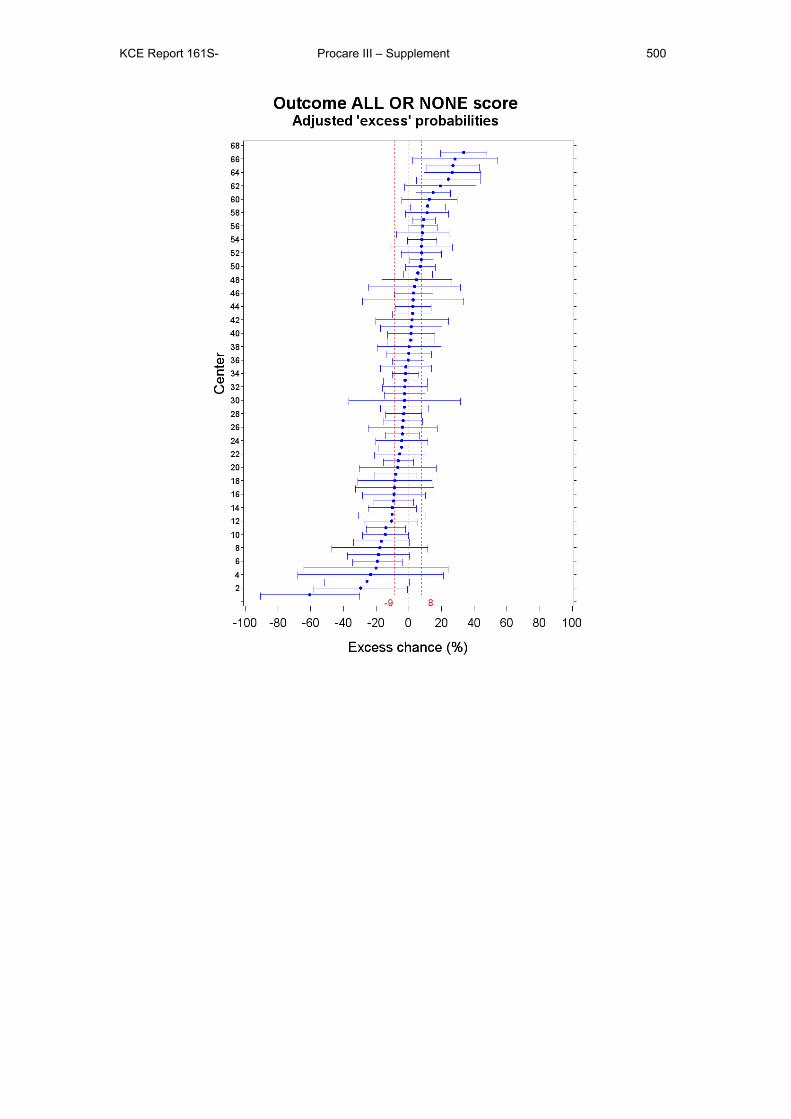
KCE Report 161S- Procare III – Supplement 500

This page is left intentionally blank.

Legal depot : D/2010/10.273/42
KCE reports
33 Effects and costs of pneumococcal conjugate vaccination of Belgian children. D/2006/10.273/54. 34 Trastuzumab in Early Stage Breast Cancer. D/2006/10.273/25. 36 Pharmacological and surgical treatment of obesity. Residential care for severely obese children
in Belgium. D/2006/10.273/30. 37 Magnetic Resonance Imaging. D/2006/10.273/34. 38 Cervical Cancer Screening and Human Papillomavirus (HPV) Testing D/2006/10.273/37. 40 Functional status of the patient: a potential tool for the reimbursement of physiotherapy in
Belgium? D/2006/10.273/53. 47 Medication use in rest and nursing homes in Belgium. D/2006/10.273/70. 48 Chronic low back pain. D/2006/10.273.71. 49 Antiviral agents in seasonal and pandemic influenza. Literature study and development of
practice guidelines. D/2006/10.273/67. 54 Cost-effectiveness analysis of rotavirus vaccination of Belgian infants D/2007/10.273/11. 59 Laboratory tests in general practice D/2007/10.273/26. 60 Pulmonary Function Tests in Adults D/2007/10.273/29. 64 HPV Vaccination for the Prevention of Cervical Cancer in Belgium: Health Technology
Assessment. D/2007/10.273/43. 65 Organisation and financing of genetic testing in Belgium. D/2007/10.273/46. 66. Health Technology Assessment: Drug-Eluting Stents in Belgium. D/2007/10.273/49. 70. Comparative study of hospital accreditation programs in Europe. D/2008/10.273/03 71. Guidance for the use of ophthalmic tests in clinical practice. D/200810.273/06. 72. Physician workforce supply in Belgium. Current situation and challenges. D/2008/10.273/09. 74 Hyperbaric Oxygen Therapy: a Rapid Assessment. D/2008/10.273/15. 76. Quality improvement in general practice in Belgium: status quo or quo vadis?
D/2008/10.273/20 82. 64-Slice computed tomography imaging of coronary arteries in patients suspected for coronary
artery disease. D/2008/10.273/42 83. International comparison of reimbursement principles and legal aspects of plastic surgery.
D/200810.273/45 87. Consumption of physiotherapy and physical and rehabilitation medicine in Belgium.
D/2008/10.273/56 90. Making general practice attractive: encouraging GP attraction and retention D/2008/10.273/66. 91 Hearing aids in Belgium: health technology assessment. D/2008/10.273/69. 92. Nosocomial Infections in Belgium, part I: national prevalence study. D/2008/10.273/72. 93. Detection of adverse events in administrative databases. D/2008/10.273/75. 95. Percutaneous heart valve implantation in congenital and degenerative valve disease. A rapid
Health Technology Assessment. D/2008/10.273/81 100. Threshold values for cost-effectiveness in health care. D/2008/10.273/96 102. Nosocomial Infections in Belgium: Part II, Impact on Mortality and Costs. D/2009/10.273/03 103 Mental health care reforms: evaluation research of ‘therapeutic projects’ - first intermediate
report. D/2009/10.273/06. 104. Robot-assisted surgery: health technology assessment. D/2009/10.273/09 108. Tiotropium in the Treatment of Chronic Obstructive Pulmonary Disease: Health Technology
Assessment. D/2009/10.273/20 109. The value of EEG and evoked potentials in clinical practice. D/2009/10.273/23 111. Pharmaceutical and non-pharmaceutical interventions for Alzheimer’s Disease, a rapid
assessment. D/2009/10.273/29 112. Policies for Orphan Diseases and Orphan Drugs. D/2009/10.273/32. 113. The volume of surgical interventions and its impact on the outcome: feasibility study based on
Belgian data 114. Endobronchial valves in the treatment of severe pulmonary emphysema. A rapid Health
Technology Assessment. D/2009/10.273/39 115. Organisation of palliative care in Belgium. D/2009/10.273/42 116. Interspinous implants and pedicle screws for dynamic stabilization of lumbar spine: Rapid
assessment. D/2009/10.273/46
117. Use of point-of care devices in patients with oral anticoagulation: a Health Technology Assessment. D/2009/10.273/49.
118. Advantages, disadvantages and feasibility of the introduction of ‘Pay for Quality’ programmes in Belgium. D/2009/10.273/52.
119. Non-specific neck pain: diagnosis and treatment. D/2009/10.273/56. 121. Feasibility study of the introduction of an all-inclusive case-based hospital financing system in
Belgium. D/2010/10.273/03 122. Financing of home nursing in Belgium. D/2010/10.273/07 123. Mental health care reforms: evaluation research of ‘therapeutic projects’ - second intermediate
report. D/2010/10.273/10 124. Organisation and financing of chronic dialysis in Belgium. D/2010/10.273/13 125. Impact of academic detailing on primary care physicians. D/2010/10.273/16 126. The reference price system and socioeconomic differences in the use of low cost drugs.
D/2010/10.273/20. 127. Cost-effectiveness of antiviral treatment of chronic hepatitis B in Belgium. Part 1: Literature
review and results of a national study. D/2010/10.273/24. 128. A first step towards measuring the performance of the Belgian healthcare system.
D/2010/10.273/27. 129. Breast cancer screening with mammography for women in the agegroup of 40-49 years.
D/2010/10.273/30. 130. Quality criteria for training settings in postgraduate medical education. D/2010/10.273/35. 131. Seamless care with regard to medications between hospital and home. D/2010/10.273/39. 132. Is neonatal screening for cystic fibrosis recommended in Belgium? D/2010/10.273/43. 133. Optimisation of the operational processes of the Special Solidarity Fund. D/2010/10.273/46. 135. Emergency psychiatric care for children and adolescents. D/2010/10.273/51. 136. Remote monitoring for patients with implanted defibrillator. Technology evaluation and
broader regulatory framework. D/2010/10.273/55. 137. Pacemaker therapy for bradycardia in Belgium. D/2010/10.273/58. 138. The Belgian health system in 2010. D/2010/10.273/61. 139. Guideline relative to low risk birth. D/2010/10.273/64. 140. Cardiac rehabilitation: clinical effectiveness and utilisation in Belgium. d/2010/10.273/67. 141. Statins in Belgium: utilization trends and impact of reimbursement policies. D/2010/10.273/71. 142. Quality of care in oncology: Testicular cancer guidelines. D/2010/10.273/74 143. Quality of care in oncology: Breast cancer guidelines. D/2010/10.273/77. 144. Organization of mental health care for persons with severe and persistent mental illness. What
is the evidence? D/2010/10.273/80. 145. Cardiac resynchronisation therapy. A Health technology Assessment. D/2010/10.273/84. 146. Mental health care reforms: evaluation research of ‘therapeutic projects’. D/2010/10.273/87 147. Drug reimbursement systems: international comparison and policy recommendations.
D/2010/10.273/90 149. Quality indicators in oncology: testis cancer. D/2010/10.273/98. 150. Quality indicators in oncology: breast cancer. D/2010/10.273/101. 153. Acupuncture: State of affairs in Belgium. D/2011/10.273/06. 154. Homeopathy: State of affairs in Belgium. D/2011/10.273/14. 155. Cost-effectiveness of 10- and 13-valent pneumococcal conjugate vaccines in childhood.
D/2011/10.273/21. 156. Home Oxygen Therapy. D/2011/10.273/25. 158. The pre-market clinical evaluation of innovative high-risk medical devices. D/2011/10.273/31 159. Pharmacological prevention of fragility fractures in Belgium. D/2011/10.273/34. 160. Dementia: which non-pharmacological interventions? D/2011/10.273/37 161. Quality Insurance of rectal cancer – phase 3: statistical methods to benchmark centers on a set
of quality indicators. D/2011/10.273/40. This list only includes those KCE reports for which a full English version is available. However, all KCE reports are available with a French or Dutch executive summary and often contain a scientific summary in English.