Quality Assurance Project Plan Statewide Seagrass ...
114
Revision 1.1 June 19, 2012 Page 1 of 114 Quality Assurance Project Plan Statewide Seagrass Monitoring Protocol Development Phase 2 June 19, 2012 Texas Parks and Wildlife Department 4200 Smith School Road Austin, Texas 78744-3291 Effective Period: This Quality Assurance Project Plan (QAPP) is effective upon signature through August 31, 2013 A portion of this work to be performed for the Texas Commission on Environmental Quality under contract #582-12-22128 Questions concerning this quality assurance project plan should be directed to: Patricia L. Radloff, Ph.D. Water Quality Program Leader Texas Parks and Wildlife Department 4200 Smith School Road Austin, Texas 78744 (512) 389-8730 [email protected]
Transcript of Quality Assurance Project Plan Statewide Seagrass ...

Revision 1.1 June 19, 2012 Page 1 of 114
Quality Assurance Project Plan
Statewide Seagrass Monitoring Protocol Development Phase 2
June 19, 2012
Texas Parks and Wildlife Department 4200 Smith School Road Austin, Texas 78744-3291
Effective Period: This Quality Assurance Project Plan (QAPP) is effective upon signature through August 31, 2013
A portion of this work to be performed for
the Texas Commission on Environmental Quality under contract #582-12-22128
Questions concerning this quality assurance project plan should be directed to:
Patricia L. Radloff, Ph.D. Water Quality Program Leader
Texas Parks and Wildlife Department 4200 Smith School Road
Austin, Texas 78744 (512) 389-8730


Revision 1.1 June 19, 2012 Page 3 of 114
Texas Commission on Environmental Quality Office of Water Water Quality Planning Division Monitoring & Assessment Section ___________________________________________________________ Laurie Curra, Manager Date Monitoring & Assessment Section ___________________________________________________________ Andrew Sullivan, SWQM Team Lead Date Surface Water Quality Monitoring Program ___________________________________________________________ Pat Bohannon, Project Manager Date Surface Water Quality Monitoring Program ___________________________________________________________ Robin Cypher, SWQM Project Quality Assurance Specialist Date Surface Water Quality Monitoring Program Office of Compliance and Enforcement Field Operations Support Division ___________________________________________________________ Stephen Stubbs, TCEQ Quality Assurance Manager Date Laboratory and Quality Assurance Section ___________________________________________________________ Daniel Burke, SWQM Program Quality Assurance Specialist Date Quality Assurance Section

Revision 1.1 June 19, 2012 Page 4 of 114
U.S. Environmental Protection Agency (EPA) – Region VI ___________________________________________________________ Curry Jones, M.P.H., Section Chief Date State and Tribal Programs Section Assistance Programs Branch ___________________________________________________________ Teresita Mendiola, Project Officer Date State and Tribal Programs Section Assistance Programs Branch The TPWD Water Quality Program will secure written documentation from each project participant within 30 days, e.g. subcontractors, other units of government, contract laboratories, stating the organization’s awareness of and commitment to requirements contained in this quality assurance project plan and any amendments or revisions of this plan. The Project Manager will maintain this documentation as part of the project’s quality assurance records.

Revision 1.1 June 19, 2012 Page 5 of 114
A2. Table of Contents A1. Approval Sheet ........................................................................................................................ 2 A2. Table of Contents .................................................................................................................... 5
List of Tables .............................................................................................................................. 7 List of Figures ............................................................................................................................. 7 List of Acronyms ........................................................................................................................ 9
A3. Distribution List .................................................................................................................... 10 A4. Project/Task Organization ..................................................................................................... 11
Texas Parks and Wildlife Department ...................................................................................... 13 Lower Colorado River Authority .............................................................................................. 14
A5. Problem Definition/Background ........................................................................................... 15 A6. Project/Task Description ....................................................................................................... 16
Amendments to the QAPP ........................................................................................................ 20 A7. Quality Objectives and Criteria ............................................................................................. 20
Field Measurements .................................................................................................................. 24 Water and Sediment Quality Indicators .................................................................................... 24 Seagrass Condition and Stressor Indicators .............................................................................. 26
A8. Special Training/Certification ............................................................................................... 29 A9. Documents and Records........................................................................................................ 30 B1. Sampling Process Design ...................................................................................................... 31
Site Selection ............................................................................................................................ 31 Tier 2 Coastwide Sampling ................................................................................................... 32 Tier 2 Bay Sampling ............................................................................................................. 40 Tier 3 Sampling..................................................................................................................... 40
Sample Frequency ..................................................................................................................... 40 Field Sampling Design .............................................................................................................. 40
B2. Sampling Methods................................................................................................................. 53 Tier 2 ......................................................................................................................................... 53 Tier 3 ......................................................................................................................................... 53
Tier 3 Field Sampling Procedures for Water and Sediment Quality Indicators ................... 53 Processes to Prevent Contamination ..................................................................................... 56
Documentation of Field Sampling Activities ........................................................................... 61 Recording Data ......................................................................................................................... 61 Deviations from Sampling Method Requirements or Sample Design, and Corrective Action 61
B3. Sample Handling and Custody .............................................................................................. 62 Water and Sediment Quality Indicators and Seagrass and Stressor Condition Indicators ....... 62
Chain-of-Custody .................................................................................................................. 62 Sample Labeling ................................................................................................................... 62 Sample Handling ................................................................................................................... 62 Failures in Chain-of-Custody and Corrective Action ........................................................... 62
B4. Analytical Methods ............................................................................................................... 63 Water and Sediment Quality Indicators .................................................................................... 63
Standards Traceability .......................................................................................................... 63 Analytical Method Modification ........................................................................................... 63 Failures or Deviations in Analytical Method Requirements and Corrective Actions .......... 63

Revision 1.1 June 19, 2012 Page 6 of 114
Seagrass Condition and Stressor Indicators .............................................................................. 63
Analytical Method Modification ........................................................................................... 67 B5. Quality Control ...................................................................................................................... 67
Water and Sediment Quality Indicators .................................................................................... 67 Field Measurement Quality Control Requirements and Acceptability Criteria .................... 67 Laboratory Measurement Quality Control Requirements and Acceptability Criteria .......... 68 Failures in Field and Laboratory Quality Control and Corrective Action ............................ 70
Seagrass Condition and Stressor Indicators .............................................................................. 70 B6. Instrument/Equipment Testing, Inspection and Maintenance ............................................... 70
Field Equipment ........................................................................................................................ 70 LCRA Laboratory ..................................................................................................................... 70 TPWD Laboratory .................................................................................................................... 70
B7. Instrument Calibration and Frequency .................................................................................. 71 Field Equipment ........................................................................................................................ 71 LCRA Laboratory ..................................................................................................................... 71 TPWD Laboratory .................................................................................................................... 71
B8. Inspection/Acceptance of Supplies and Consumables .......................................................... 71 B9. Non-Direct Measurements .................................................................................................... 71 B10. Data Management ............................................................................................................... 71
Data Flow .................................................................................................................................. 72 Water and Sediment Quality Indicators and Seagrass Condition and Stressor Indicators ... 72
Data Errors and Loss ................................................................................................................. 72 Record Keeping and Data Storage ............................................................................................ 72 Data Handling, Hardware, and Software Requirements ........................................................... 72
C1. Assessment and Response Actions ....................................................................................... 72 C2. Reports to Management ........................................................................................................ 73 D1. Data Review Verification and Validation ............................................................................. 73 D2. Verification and Validation Methods .................................................................................... 73 D3. Reconciliation with User Requirements ............................................................................... 75 References ..................................................................................................................................... 76 Appendix A – Sample Size Analysis for Statewide Seagrass Monitoring ................................... 78 Appendix B – Tier 2 Sampling Standard Operating Procedures .................................................. 88 Introduction ................................................................................................................................... 90 Sample period ............................................................................................................................... 90 Sample sites .................................................................................................................................. 90 Sampling design ............................................................................................................................ 90 Field work preparations ................................................................................................................ 90
Establish seagrass monitoring teams ........................................................................................ 90 Prioritize pre-selected coordinates ............................................................................................ 91 Additional pre-field work preparations ..................................................................................... 91
Field work steps ............................................................................................................................ 91 Establish permanent sampling stations ..................................................................................... 91
Navigate to pre-selected coordinates .................................................................................... 91 Validate pre-selected coordinates ......................................................................................... 92 Identify an alternative coordinate set .................................................................................... 92 Establish a permanent sampling station ................................................................................ 93

Revision 1.1 June 19, 2012 Page 7 of 114
Estimate seagrass percent coverage .......................................................................................... 93 Measure seagrass canopy height ............................................................................................... 95 Data collection completion ....................................................................................................... 96
Tier 2 seagrass sampling stations .................................................................................................. 96 Tier 2 seagrass monitoring equipment list .................................................................................. 110 Seagrass percent coverage photo guide ...................................................................................... 111 Field data form ............................................................................................................................ 113 List of Tables Table 1. A6.1. Definition of a Tier 2 station. ................................................................................ 16 Table 2. A6.2. Definition of a Tier 3 station. ................................................................................ 17 Table 3. A7.1. Field, water and sediment quality parameter measurement performance specifications................................................................................................................................. 21 Table 4. A7.2. Seagrass condition and stressor indicator measurement performance specifications................................................................................................................................. 28 Table 5. A9.1. Project documents and records. ............................................................................ 30 Table 6. B1.3. Tier 2 coastwide sample locations evenly distributed among the major bays. ..... 35 Table 7. B1.7. Tier 2 sampling locations for Redfish Bay system based on seagrass abundance. 43 Table 8. B1.8. Tier 2 sampling locations for San Antonio Bay system based on seagrass abundance. .................................................................................................................................... 47 Table 9. B1.9. Sample design for a Tier 2 station, whether part of coastwide or bay-scale monitoring. .................................................................................................................................... 51 Table 10. B.1.10. Sample design for a Tier 3 station in a bay. ..................................................... 52 Table 11. B2.3. Typical water and sediment chemistry sample storage, preservation and handling requirements. ................................................................................................................................. 54 Table 12. C1.1. Assessments and response requirements. ............................................................ 73 Table 13. D2.1. Data review, verification, and validation tasks. .................................................. 75 List of Figures Figure 1. A4.1. Key organizations and personnel. ........................................................................ 11 Figure 2. A4.2. Project organization chart. ................................................................................... 12 Figure 3. A6.3. Phase 1 Seagrass Monitoring project sample sites. ............................................. 19 Figure 4. B1.1. Tier 2 coastwide sample locations based on seagrass abundance. ...................... 33 Figure 5. B1.2. Tier 2 coastwide sample locations evenly distributed among the major bays. .... 34 Figure 6. B1.5. Tier 2 sampling locations for Redfish Bay system based on seagrass abundance........................................................................................................................................................ 41 Figure 7. B1.6. Tier 2 sampling locations for San Antonio Bay system based on seagrass abundance. .................................................................................................................................... 42 Figure 8. B2.4. Schematic of field sampling design. .................................................................... 57 Figure 9. B2.5. Close-up of field sampling design showing quadrat. ........................................... 58 Figure 10. B2.6. Seagrass corer (15 cm inner diameter) used for sampling Thalassia. ............... 59 Figure 11. B2.7. Seagrass corer (9 cm inner diameter) used for sampling Halodule, Syringodium, Ruppia and Halophila. .................................................................................................................. 60

Revision 1.1 June 19, 2012 Page 8 of 114
Figure 12. B4.1. Close-up view of cleaned macroalgae in lab sorting tray. ................................. 64 Figure 13. B4.2. Processing seagrass core samples in lab. ........................................................... 65 Figure 14. B4.3. Diagram illustrating typical seagrass plant morphology (University of Florida, 2011). ............................................................................................................................................ 66 Figure 15. B4.4. Seagrass core sample in lab sorting tray prepared for cleaning and counting shoots. ........................................................................................................................................... 66

Revision 1.1 June 19, 2012 Page 9 of 114
List of Acronyms AWRL Ambient Water Reporting Limit CMPSEA Coastal Management Program seagrass study performed by TPWD COC Chain-of-Custody DO Dissolved Oxygen EPA U.S. Environmental Protection Agency GPS Global Positioning System LCRA Lower Colorado River Authority LCS Laboratory Control Standard LOQ Limit of Quantitation MDL Method Detection Limit OP ortho-Phosphate-phosphorus PAR Photosynthetically Active Radiation QA Quality Assurance QAM Quality Assurance Manual QAO Quality Assurance Officer QAPO Quality Assurance Project Officer QAPP Quality Assurance Project Plan QC Quality Control RL Reporting Level RPD Relative Percent Difference SE Standard Error SI Surface Irradiance SOP Standard Operating Procedure SWQM Surface Water Quality Monitoring TDS Total Dissolved Solids TOC Total Organic Carbon TSS Total Suspended Solids TCEQ Texas Commission on Environmental Quality TPWD Texas Parks and Wildlife Department VSS Volatile Suspended Solids

Revision 1.1 June 19, 2012 Page 10 of 114
A3. Distribution List
Texas Parks and Wildlife Department 4200 Smith School Road Austin, TX 78744 Patricia L. Radloff, Ph.D., Project Manager Angela Schrift, Quality Assurance Project Officer Cindy Hobson, TPWD Quality Assurance Officer Adam Whisenant, Regional Biologist Jennifer Bronson, Regional Biologist Lower Colorado River Authority Environmental Laboratory Services P.O. Box 220, Austin, TX 78767 Gary Franklin Hollis Pantalion Texas Commission on Environmental Quality P.O. Box 13087 Austin, TX 78711-3087 Andrew Sullivan, Team Leader, Surface Water Quality Monitoring Program (MC-234) Pat Bohannon, Project Manager, Surface Water Quality Monitoring Program (MC-234) Robin Cypher, SWQM Project Quality Assurance Specialist, Surface Water Quality Monitoring Program (MC-234) Daniel Burke, SWQM Program Quality Assurance Specialist, Quality Assurance Team (MC-165) EPA Region VI 1445 Ross Avenue Suite 1200 Dallas, TX 75202-2733 Curry Jones, MPH, Chief, State and Tribal Programs Section (6WQ) Teresita Mendiola, Project Officer, State and Tribal Programs Section (6WQ)

Revision 1.1 June 19, 2012 Page 11 of 114
A4. Project/Task Organization This seagrass monitoring study is funded by the Texas Commission on Environmental Quality (TCEQ) through a contract with Texas Parks and Wildlife Department (TPWD). The project will test a coastwide seagrass monitoring program design using monitoring of seagrass condition and water quality indicators. Field work will be conducted by TPWD Principal Project Staff and Other Project Staff that have been trained by or are under the direct supervision of Principal Project Staff. Water and sediment chemistry analyses will be conducted by the Lower Colorado River Authority (LCRA). Seagrass, epiphyte and macroalgae biomass laboratory work will be conducted by TPWD Principal Project Staff or under their direct supervision. Key organizations and personnel are identified in Figure 1. Figure 2 depicts project organization and lines of communication. TPWD Water Quality Program staff (Radloff, Hobson, Whisenant, Bronson) will manage the contract and are primarily responsible for deliverables. TPWD Coastal Fisheries Division staff will assist with the project. TPWD may invite individuals from interested organizations to participate in field work under the direct supervision of TPWD staff. Note that the TPWD Quality Assurance Officer (QA Officer) is a position that rotates annually among participating TPWD Divisions (Coastal Fisheries, Inland Fisheries, Wildlife and State Parks). For fiscal year 2012, the TPWD QA Officer is a member of the Water Quality Program staff (Hobson) and a principal staff member for this project.
Figure 1. A4.1. Key organizations and personnel.
Lower Colorado River Authority Environmental Lab LCRA Project Manager (Gary Franklin)
Other Project Staff (May include Coastal Fisheries Division staff and/or personnel from other organizations.
Principal Project Staff (Patricia L. Radloff, Cindy Hobson, Adam Whisenant, Jennifer Bronson, Angela Schrift, and a technician to be hired for the project)
Project Manager / Data Manager (Patricia L. Radloff, Ph.D.)
QA Officer

Revision 1.1 June 19, 2012 Page 12 of 114
= TCEQ staff
= TPWD Principal Project staff with direct responsibility for monitoring activities = TPWD staff without direct involvement in monitoring activities
= Other Project Staff and contractors/vendors Figure 2. A4.2. Project organization chart.
TCEQ Project Manager
TPWD Principal Project Staff
TPWD QAPO/ Assistant Data Manager
TPWD Branch Chief
TPWD QA Officer
TPWD Project Manager/ Data Manager
Other Project Staff
Contractors / Vendors

Revision 1.1 June 19, 2012 Page 13 of 114
Texas Parks and Wildlife Department Patricia L. Radloff, Ph.D. TPWD Water Quality Program Leader - Project Manager Principal Project Staff The Project Manager is responsible for ensuring that all project activities are performed, including planning, documenting project goals, preparation and approval of a Quality Assurance Project Plan (QAPP), and adherence to a QAPP, to ensure that data of known quality are collected. The project manager submits an annual project report to the TPWD QA Officer at an annual meeting of Project Managers, QAPOs, and relevant program managers and supervisory staff. The project manager coordinates assessments and confirms the implementation and effectiveness of corrective actions and documents such actions. The project manager and/or QAPO submit data to the Texas Commission on Environmental Quality in an approved format. Angela Schrift Quality Assurance Project Officer Principal Project Staff The primary duty of the Quality Assurance Project Officer (QAPO) is to assist the Project Manager in the development and implementation of the QAPP and in the performance and review of project quality assurance assessments. The QAPO is also responsible for recommending to the appropriate staff any modifications that may be needed to improve the effectiveness and efficiency of the TPWD quality system as a whole and for his or her assigned projects. The QAPO is required to attend the annual meeting of Project Managers and QAPOs. The QAPO also may conduct field monitoring and collect data for TPWD Water Quality Program activities, following procedures outlined in QAPP and any referenced Standard Operating Procedures (SOPs) and performing necessary field calibrations and other quality assurance measures as specified. Adam Whisenant TPWD Water Quality Program Regional Biologist Principal Project Staff Conducts field monitoring and collects data. Follows procedures outlined in QAPP and any referenced SOPs. Performs necessary field calibrations and other quality assurance measures as specified. Jennifer Bronson TPWD Water Quality Program Regional Biologist Principal Project Staff Conducts field monitoring and collects data. Follows procedures outlined in QAPP and any referenced SOPs. Performs necessary field calibrations and other quality assurance measures as specified. Cindy Hobson TPWD Quality Assurance Officer, FY 2012 TPWD Water Quality Program Coordinator

Revision 1.1 June 19, 2012 Page 14 of 114
Principal Project Staff The Quality Assurance Officer is responsible for review and approval of QAPPs. Relies on each Project Manager to be responsible for project quality assurance efforts. The QA Officer has authority to reject any environmental data that does not meet quality assurance standards, and reports directly to the Deputy Executive Director for Operations, or his or her designee, on quality assurance matters. Convenes an annual quality planning and assessment meeting involving project managers, QAPOs and other staff as appropriate. Conducts field monitoring and collects data. Follows procedures outlined in QAPP and any referenced SOPs. Performs necessary field calibrations and other quality assurance measures as specified. Texas Commission on Environmental Quality Daniel Burke SWQM Program Quality Assurance Specialist Assists the TCEQ SWQM QAS, Program Manager, and Project Manager on QA-related issues. Coordinates reviews and approves QAPPs and amendments or revisions. Prepares and distributes annual audit plans. Conveys QA problems to appropriate TCEQ management. Monitors implementation of corrective actions. Coordinates and conducts audits. Ensures maintenance of QAPPs and audit records for the SWQM program. Robin Cypher SWQM Project Quality Assurance Specialist Serves as liaison between SWQM management and TCEQ QA management. Participates in the development, approval, implementation, and maintenance of written quality assurance standards (e.g., Program Guidance, SOPs, QAPPs, QMP). Serves on planning team for SWQM special projects and reviews QAPPs in coordination with other SWQM staff. Coordinates documentation and implementation of corrective action for SWQM. Pat Bohannon TCEQ Project Manager The SWQM Project Manager is responsible for ensuring that the project delivers data of known quality, quantity, and type on schedule to achieve project objectives. Provides the primary point of contact between TPWD and the TCEQ; tracks and reviews deliverables to ensure that tasks in the work plan are completed as specified in the contract; reviews and approves the QAPP and any amendments or revisions and ensures distribution of approved/revised QAPPs to TCEQ participants; and responsible for verifying that the QAPP is followed by the TPWD. Lower Colorado River Authority Alicia Gill LCRA Environmental Laboratory Services Manager Responsible for overall performance, administration, and reporting of analyses performed by LCRA's Environmental Laboratory Services.

Revision 1.1 June 19, 2012 Page 15 of 114
Hollis Pantalion LCRA Environmental Laboratory Services QA Officer Responsible for the overall quality control and quality assurance of analyses performed by LCRA's Environmental Laboratory Services. Monitors the implementation of the Quality Assurance Manual (QAM)/QAPP within the laboratory to ensure complete compliance with QA data quality objectives.
Gary Franklin LCRA Environmental Laboratory Services Project Manager Responsible for quality assurance of analyses performed by LCRA’s Environmental Laboratory Services. Responsible for laboratory and field staff corrective action communication with the LCRA QAO. Oversees analysis of water and sediment samples. Reports results to TPWD on a regular basis. A5. Problem Definition/Background Seagrass beds serve as critical nursery habitat for estuarine fisheries and wildlife. Seagrasses provide food for fish, waterfowl and sea turtles. Seagrasses also contribute organic material to estuarine and marine food webs, cycle nutrients, and stabilize sediments. They are economically important based on their function in maintaining Gulf fisheries. Increasing coastal development threatens seagrasses. Three state agencies signed the Seagrass Conservation Plan for Texas in 1999 (TPWD 1999), the Texas Commission on Environmental Quality (at that time the TNRCC), the Texas General Land Office, and the Texas Parks and Wildlife Department. The plan outlined needs in the area of seagrass research, management, and monitoring. In the 2000 Water Quality Standards revision, TCEQ adopted a seagrass propagation use, affording protection to seagrass statewide (30 TAC §307.5, TCEQ 2010). However, no monitoring protocol or procedure existed to determine whether the use was supported. Shortly after publication of the Seagrass Conservation Plan, a Seagrass Monitoring Work Group began to meet regularly to develop a seagrass monitoring program for the state. The group continues to meet and is composed of academic, government and non-profit representatives. TPWD staff led development of a Strategic Plan for seagrass monitoring in Texas (TPWD 2003). An initial step toward developing a field protocol was an EPA-funded Regional Environmental Monitoring and Assessment Program (REMAP) study conducted by Dunton, Kopecky and Maidment (Dunton et al 2005). As follow-up to that work, the Coastal Bend Bays and Estuaries Program funded a project that led to a recommended framework for seagrass monitoring in Texas (Dunton and Pulich 2007; Dunton, Pulich et al. 2011). The recommended protocols were implemented in East Flats and Port Bay in a study a conducted by TPWD in collaboration with Dunton, Pulich and others (TPWD 2010). This project is a sequel to the Phase 1 Seagrass Monitoring Protocol Development project led by TCEQ in 2010-2011 (TCEQ 2011). In Phase 1, several sites up and down the coast were monitored for a variety of environmental and biological parameters. For Phase 2, it is proposed

Revision 1.1 June 19, 2012 Page 16 of 114
that sampling be expanded to include many more sites under a tiered approach as used in other parts of the United States (Fourqurean, Durako et al. 2002; Neckles, Kopp et al. 2011) and as recommended by Dunton and Pulich (2007) and Dunton, Pulich et al. (2011). A6. Project/Task Description This project will incorporate a tiered sampling approach and probabilistic selection of permanent sampling stations. Tiered sampling allows resource managers to detect change in seagrass over a large area of interest, and collect sufficient information to infer cause-effect relationships for seagrass change (Neckles, Kopp et al. 2011). Tier 2 sampling represents the collection of a short list of basic seagrass condition parameters over a large area (bay scale, coastwide; Table 1). Probabilistic design allows the results to be extrapolated to the entire area of interest. Establishing permanent sampling stations that are returned to in subsequent years allows the use of powerful repeated-measures statistics, which in turn allows the detection of change in the area of interest with a limited number of samples. More intensive Tier 3 sampling measures environmental parameters and seagrass condition indicators in a much smaller area to identify causes for changes observed in Tier 2 in seagrass sampling (Table 2). Tier 1, coastwide seagrass mapping every 5-10 years, is a recommended component of seagrass monitoring in most programs, but is not a component of this project. Table 1. A6.1. Definition of a Tier 2 station.
Description Parameters – replicates Info Derived
Rapid assessment
One-time survey occurring in late
summer/ early fall 2012
Seagrass percent coverage by species – 4 Seagrass canopy height – 4
Seagrass coverage over area of interest
(coastwide, bay scale,
other)

Revision 1.1 June 19, 2012 Page 17 of 114
Table 2. A6.2. Definition of a Tier 3 station.
Description Parameters – replicates Info Derived
Intensive
monitoring at an “index site” to
evaluate factors affecting seagrass
conditions
A single Tier 3 station consists of
three transects. Some
measurements are made off-transect
and others are made at 10
randomly selected quadrats along each transect.
One-time survey occurring in late
summer/early fall 2012
Datasonde (temperature, specific conductance, salinity, pH and dissolved oxygen (DO)) – 3 Secchi depth – 3 Photosynthetically-active radiation – 3 Water chemistry (ammonia-nitrogen, chloride, chlorophyll-a, total Kjeldahl nitrogen, nitrate-nitrogen, nitrite-nitrogen, sulfate, total phosphorus, total suspended solids, volatile suspended solids, ortho-phosphate-phosphorus, and pheophytin-a) – 3 Sediment (TOC, grain size) – 3 Sediment pore water ammonia-nitrogen – 30 Seagrass percent coverage by species – 30 Macroalgae biomass – 30 Seagrass biomass (above- and below-ground) – 9 Seagrass average number of leaves per shoot – 9 Seagrass shoot density – 9 Seagrass average leaf length and width – 9 Epiphyte load – 9
Seagrass
condition and response to
environmental factors
Nutrient response indicators
(macroalgae and epiphyte
growth)
TPWD conducted a power analysis using seagrass data available from Phase 1 and other seagrass projects (Appendix A). Variance of the data for longest leaf length (as a surrogate for canopy height) and percent coverage by species suggests that 50 stations within an area of interest would suffice to detect 15% change. TPWD will conduct Tier 2 monitoring, sampling seagrass coverage by species and canopy height at two scales: coastwide and bay scale. Coastwide Tier 2 monitoring at 50 randomly selected stations, if conducted annually or at regular intervals, would answer the question, “Is seagrass coverage increasing or decreasing over the entire Texas coast?” with ability to detect 15% or greater changes. For this project, the entire portion of the Texas coast which supports seagrass growth will be sampled using Tier 2 methodology. In addition to the 50 probabilistically-

Revision 1.1 June 19, 2012 Page 18 of 114
selected stations, staff will also sample the 14 fixed sites that were monitored as part of the Phase 1 Seagrass Monitoring project (Figure 3). Tier 2 sampling in the bays, if conducted annually or at regular intervals, would answer the question, “Is seagrass coverage increasing or decreasing in this bay?” with ability to detect 15% or greater changes. Tier 2 monitoring at 50 stations will be conducted in one Texas bay. If TPWD resources permit, a second bay will also be sampled. This QAPP is written to include both bays, with the understanding that TPWD has a contractual obligation to sample only one bay. Tier 3 sampling will be conducted at a representative site within one bay. If TPWD resources permit, a second bay will also be sampled. This QAPP is written to include both bays, with the understanding that TPWD has a contractual obligation to sample only one bay. If TPWD conducts Tier 3 sampling in a second bay, it is possible that not all Tier 3 parameters will be sampled, due to resource constraints. Tier 3 sampling design is based on three transects which encompass the deep edge of the seagrass bed. Transects extend along the depth gradient to integrate differences in parameters that may be influenced by water depth. Water quality data that will be collected include ammonia-nitrogen, chloride, chlorophyll-a, total Kjeldahl nitrogen, nitrate-nitrogen, nitrite-nitrogen, sulfate, total phosphorus, total suspended solids, volatile suspended solids, ortho-phosphate-phosphorus, and pheophytin-a. Physicochemical measurements that will be collected include Secchi depth, photosynthetically-active radiation, specific conductance, salinity, dissolved oxygen, pH, and temperature. Sediment samples will be analyzed for total organic carbon, grain size, and sediment pore water ammonia-nitrogen. Seagrass condition indicators that will be studied include shoot density, above- and below-ground biomass, root-to-shoot ratio (ratio of below-ground biomass to above-ground biomass), number of leaves per shoot, leaf width, leaf length and leaf area index (product of shoot density, average leaf length, and average leaf width). Seagrass stressor indicators including macroalgal biomass and epiphyte biomass will also be measured. All sampling will be conducted during the period August 1 – October 31, 2012, with most of the sampling occurring between August 1 and September 15.

Revision 1.1 June 19, 2012 Page 19 of 114
Figure 3. A6.3. Phase 1 Seagrass Monitoring project sample sites.
Seagrass area (from Dunton and Pulich
2007) Site ID Site
1 – Galveston Bay SM1.1 Christmas Bay SM1.2 West Bay at Galveston Island State Park SM1.3 West end of Galveston Island 2 – Matagorda Bay SM2.1 Matagorda Peninsula 3 – San Antonio Bay SM3.1 San Antonio Bay near Welder WMA SM3.2 Matagorda Island bay shore 4 – Mission Aransas SM4.1 St. Charles Bay SM4.3 Mud Island SM4.4 Port Bay 5 – Corpus Christi Bay 6 – Upper Laguna Madre SM6.1 ULM north of JFK Causeway SM6.2 Nighthawk Bay 7 – Lower Laguna Madre SM7.1 LLM near mouth of Arroyo Colorado SM7.2 Bay shore of South Padre Island SM7.3 South Bay

Revision 1.1 June 19, 2012 Page 20 of 114
Amendments to the QAPP Revisions to the QAPP may be necessary to reflect changes in project organization, tasks, schedules, objectives, and methods; to improve operational efficiency; and to accommodate unique or unanticipated circumstances. The TPWD Project Manager will prepare amendments to the QAPP as needed. Amendments are effective upon approval by both the TPWD and the TCEQ Project Managers, the LCRA Lab, and EPA. Amendments will be incorporated into the QAPP as attachments and distributed to personnel on the QAPP Distribution List. Revisions to the Tier 2 SOP may be necessary to to improve operational efficiency or to accommodate unique or unanticipated circumstances. Changes to the Tier 2 SOP will take effect when the document is revised. A7. Quality Objectives and Criteria Performance specifications for field measurements, water and sediment quality parameters are outlined in Table 3.

Revision 1.1 June 19, 2012 Page 21 of 114
Table 3. A7.1. Field, water and sediment quality parameter measurement performance specifications.
Parameter Matrix Units Parameter code
Analytical method
Precision of LCS/LCSD
(%RPD)
Bias of LCS
(% Rec) AWRL
Limit of Quantitation
(LOQ)1
LOQ Check
Sample % Rec.2
LCRA Lab
MDL3
Field Parameters
pH water standard units 00400 EPA 150.1 and TCEQ SWQM Manual, vol. 1
NA NA NA NA NA NA
DO water mg L-1 00300 EPA 360.1 and TCEQ SWQM Manual, vol. 1
NA NA NA NA NA NA
Specific conductance water μS cm-1 00094 EPA 120.1 and TCEQ SWQM Manual, vol. 1
NA NA NA NA NA NA
Salinity water ppt 00480 SM 2520 and
TCEQ SWQM Manual, vol. 1
NA NA NA NA NA NA
Water temperature water ºC 00010 EPA 170.1 and TCEQ SWQM Manual, vol. 1
NA NA NA NA NA NA
Secchi depth water meters 00078 TCEQ SWQM Manual, vol. 1 NA NA NA NA NA NA
Surface irradiance water % NA Calculation NA NA NA NA NA NA
Light attenuation coefficient (k) water meters-1 NA Calculation NA NA NA NA NA NA
Photosynthetically-active radiation (PAR) water μmol photons
sec-1 meter-2 NA QAPP 5% NA NA NA NA NA
Days since last significant rainfall NA days 72053 TCEQ SWQM
Manual, vol. 1 NA NA NA NA NA NA
1 Limit of Quantitation (LOQ), formerly known by the term “Reporting Level (RL)” 2 Limit of Quantitation Check Sample Percent Recovery, formerly known by the term “Accuracy of RL (% Rec)” 3 The MDL is a measure of method sensitivity and it is defined at 40 CFR Part 136 Appendix B as "the minimum concentration of a substance that can be reported with 99% confidence that the analyte concentration is greater than zero." MDLs can be operator, method, laboratory, and matrix specific. Due to normal day-to-day and run-to-run analytical variability, MDLs may not be reproducible within a laboratory or between laboratories. The regulatory significance of the MDL is that EPA uses the MDL to determine when a contaminant is deemed to be detected and it can be used to calculate a PQL for that contaminant. Where an MDL is specified, LCRA will report values observed at or above the MDL and accompanying quality assurance information.

Revision 1.1 June 19, 2012 Page 22 of 114
Parameter Matrix Units Parameter code
Analytical method
Precision of LCS/LCSD
(%RPD)
Bias of LCS
(% Rec) AWRL
Limit of Quantitation
(LOQ)1
LOQ Check
Sample % Rec.2
LCRA Lab
MDL3
Depth of measurement water meters 13850 TCEQ SWQM Manual, vol. 1 NA NA NA NA NA NA
Total water depth water meters 82903 TCEQ SWQM Manual, vol. 1 NA NA NA NA NA NA
Tide stage water
1=Low 2= Falling 3=Slack 4=Rising 5=High
89972 TCEQ SWQM Manual, vol. 1 NA NA NA NA NA NA
Conventional Parameters
Ammonia-nitrogen
water
mg L-1 00610 EPA 350.1 20 80-120 0.1 0.024 70-130 0.0048
Chloride
water
mg L-1
00940
EPA 300.0
20
80-120
5
54
70-130
NA
Chlorophyll-a water μg L-1 70953 - fluor EPA 445.0 20 80-120 3 24 NA 0.04
Total Kjeldahl nitrogen
water
mg L-1
00625
EPA 351.2
20
80-120
0.2
0.24
70-130
NA
Nitrate-nitrogen water mg L-1 00620 EPA 300.0 Rev. 2.1 (1993) 20 80-120 0.05 0.024 70-130 0.003
Nitrite-nitrogen water mg L-1 00615 EPA 300.0 Rev. 2.1 (1993) 20 80-120 0.05 0.024 70-130 0.003
Nitrate/nitrite-nitrogen
water
mg L-1
00630
SM 4500-NO3-H
20
80-120
0.05
0.024
70-130
NA
Sulfate
water
mg L-1
00945
EPA 300.0
20
80-120
5
54
70-130
NA
Total phosphorus water mg L-1 00665 EPA 365.4 20 80-120 0.06 0.02 70-130 0.00249
4 Limit of Quantitation is based upon an aqueous sample where no dilution is required due to matrix or sample quantity.

Revision 1.1 June 19, 2012 Page 23 of 114
Parameter Matrix Units Parameter code
Analytical method
Precision of LCS/LCSD
(%RPD)
Bias of LCS
(% Rec) AWRL
Limit of Quantitation
(LOQ)1
LOQ Check
Sample % Rec.2
LCRA Lab
MDL3
Total suspended solids water mg L-1 00530 SM 2540 D 20 NA 43 1 NA 0.5
Volatile suspended solids water mg L-1 00535 EPA 160.4 20 NA 43 1 NA 0.5
ortho-Phosphate-phosphorus
water
water
mg L-1
mg L-1
00671 (fld filt <15 min)
70507 (lab
filt >15 min)
EPA 365.1 EPA 300.0
EPA 365.1 EPA 300.0
20
20
80-120
80-120
0.04
0.04
0.044
0.044
70-130
70-130
0.00249
0.00249
Pheophytin-a water μg L-1 32213 - fluor EPA 445.0 NA NA 3 24 NA 0.04
Sediment Parameters
Pore water ammonia-nitrogen
sediment pore water
mg L-1 P1004 EPA 350.1 20 80-120 0.1 0.024 70-130 0.0048
Grain size (clay, <0.002 mm) sediment % dry wt 49900 EPA 600/2-78-054 20 NA NA 0 NA NA
Grain size (silt, 0.002 to 0.05 mm) sediment % dry wt 49906 EPA 600/2-78-054 20 NA NA 0 NA NA
Grain size (sand, 0.05 to 2.0 mm)
sediment % dry wt 49925 EPA 600/2-78-054 20 NA NA 0 NA NA
Grain size (gravel, > 2.0 mm) sediment % dry wt 80256 EPA 600/2-78-054 20 NA NA 0 NA NA
Total organic carbon sediment mg kg-1 81951 EPA 9060 30 65-135 1500 1500 65-135 NA
REFERENCES AND NOTES: EPA = U.S. EPA. Methods for Chemical Analysis of Water and Waste, revised March 1983, Manual #EPA-600/4-79-020. Washington, DC.; U.S. EPA. TCEQ SWQM Manual, vol. 1 – Surface Water Quality Monitoring Procedures, Volume 1: Physical and Chemical Monitoring Methods for Water, Sediment, and Tissue, 2008. TCEQ SWQM Manual, vol. 2 – Surface Water Quality Monitoring Procedures, Volume 2: Methods for Collecting and Analyzing Biological Assemblage and Habitat Data, 2007 SM = American Public Health Association, et al. 1998. Standard Methods for the Examination of Water and Wastewater, 20th Edition. Washington, DC (Note: The 21st edition may be cited if it becomes available). Methods listed are the preferred method of analysis. Other methods may be employed and the data will be accepted as long as the methods used: (1) meet the sensitivity requirements of the AWRLs, and (2) are contained in 40 CFR 136, the most current version of Standard Methods, or are another reliable procedure as described in this QAPP.
Revision 1.1 June 19, 2012 Page 24 of 114
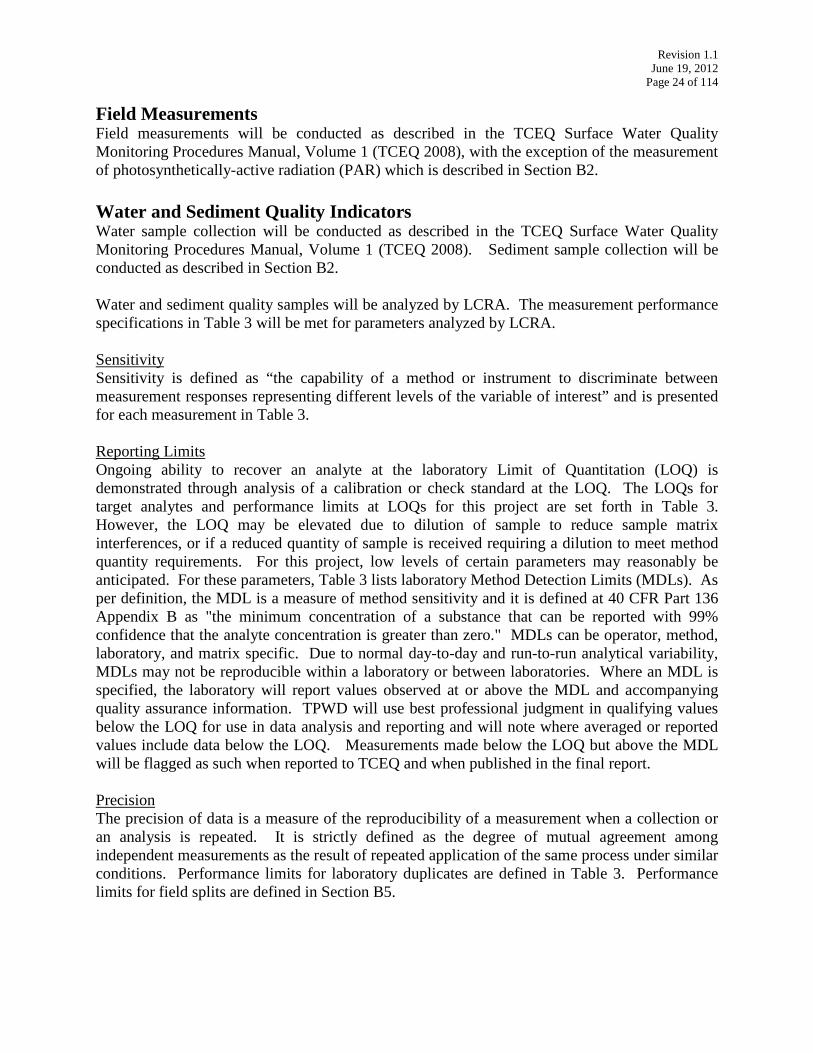
Field Measurements Field measurements will be conducted as described in the TCEQ Surface Water Quality Monitoring Procedures Manual, Volume 1 (TCEQ 2008), with the exception of the measurement of photosynthetically-active radiation (PAR) which is described in Section B2. Water and Sediment Quality Indicators Water sample collection will be conducted as described in the TCEQ Surface Water Quality Monitoring Procedures Manual, Volume 1 (TCEQ 2008). Sediment sample collection will be conducted as described in Section B2. Water and sediment quality samples will be analyzed by LCRA. The measurement performance specifications in Table 3 will be met for parameters analyzed by LCRA. Sensitivity Sensitivity is defined as “the capability of a method or instrument to discriminate between measurement responses representing different levels of the variable of interest” and is presented for each measurement in Table 3. Reporting Limits Ongoing ability to recover an analyte at the laboratory Limit of Quantitation (LOQ) is demonstrated through analysis of a calibration or check standard at the LOQ. The LOQs for target analytes and performance limits at LOQs for this project are set forth in Table 3. However, the LOQ may be elevated due to dilution of sample to reduce sample matrix interferences, or if a reduced quantity of sample is received requiring a dilution to meet method quantity requirements. For this project, low levels of certain parameters may reasonably be anticipated. For these parameters, Table 3 lists laboratory Method Detection Limits (MDLs). As per definition, the MDL is a measure of method sensitivity and it is defined at 40 CFR Part 136 Appendix B as "the minimum concentration of a substance that can be reported with 99% confidence that the analyte concentration is greater than zero." MDLs can be operator, method, laboratory, and matrix specific. Due to normal day-to-day and run-to-run analytical variability, MDLs may not be reproducible within a laboratory or between laboratories. Where an MDL is specified, the laboratory will report values observed at or above the MDL and accompanying quality assurance information. TPWD will use best professional judgment in qualifying values below the LOQ for use in data analysis and reporting and will note where averaged or reported values include data below the LOQ. Measurements made below the LOQ but above the MDL will be flagged as such when reported to TCEQ and when published in the final report. Precision The precision of data is a measure of the reproducibility of a measurement when a collection or an analysis is repeated. It is strictly defined as the degree of mutual agreement among independent measurements as the result of repeated application of the same process under similar conditions. Performance limits for laboratory duplicates are defined in Table 3. Performance limits for field splits are defined in Section B5.

Revision 1.1 June 19, 2012 Page 25 of 114
Bias Bias is a statistical measurement of correctness and includes multiple components of systematic error. A measurement is considered unbiased when the value reported does not differ from the true value. Bias is verified through the analysis of laboratory control standards (LCS) prepared with certified reference materials and by calculating percent recovery. Results are plotted on quality control charts, which are calculated based on historical data and used during evaluation of analytical performance. Program-defined measurement performance specifications for LCS are specified in Table 3. Accuracy Accuracy is a measure of the overall agreement of a measurement to a known value; accuracy includes a combination of random error (precision error) and systematic error (bias). A measurement is considered accurate when the value reported does not differ from the true value. Accuracy is verified through the analysis of laboratory spikes and calibration control standards. Performance limits for laboratory spikes and calibration control standards for RLs are specified in Table 3. Field parameters measured under this QAPP are collected utilizing multiparameter probe instruments, following TCEQ Surface Water Quality Monitoring Procedures Manual, Volume 1 (TCEQ 2008). These instruments are calibrated prior to sampling utilizing standards of known values for pH, conductivity, and dissolved oxygen. The instruments are also checked against these standards following sampling, allowing for an assessment of accuracy. Accuracy of the temperature probe component of the instruments is checked periodically against a NIST traceable thermometer. Representativeness Site selection, the appropriate sampling regime, the sampling of all pertinent media according to TCEQ Surface Water Quality Monitoring Procedures Manual, Volume 1 (TCEQ 2008), and use of only approved analytical methods will assure that the measurement data represents the conditions at the site. See section B1 for a discussion of site selection criteria. TPWD understands that it may contribute data to TCEQ for use in the assessment process, without providing all the samples required for assessment. Comparability Confidence in the comparability of data sets for this project is based on the commitment of project staff to use only approved sampling and analysis methods and QA/QC protocols in accordance with quality system requirements and as described in this QAPP and in TCEQ Surface Water Quality Monitoring Procedures Manual, Volume 1 (TCEQ 2008). Comparability is also guaranteed by reporting data in standard units, by using accepted rules for rounding figures, and by reporting data in a standard format. Completeness The completeness of the data is basically a relationship of how much of the data is available for use compared to the total potential data. Ideally, 100% of the data should be available. However, the possibility of unavailable data due to accidents, insufficient sample volume, broken or lost samples, etc. is to be expected. Therefore, it will be a general goal of the project that 90% data completion is achieved.

Revision 1.1 June 19, 2012 Page 26 of 114
Seagrass Condition and Stressor Indicators Seagrass samples will be collected as described in Sections B1 and B2. Samples will be analyzed according to the specifications given in Table 4. Sensitivity and expected ranges for biological parameters were developed based on data from previous seagrass studies (Table 4; TCEQ 2011; TPWD 2010). Reliable estimates of precision have not been developed for most of these biological parameters. For purposes of this study, precision for each biological parameter was estimated by first identifying potential sources of measurement error. Percentage error was identified for equipment and instruments used in processing samples, for example, the uncertainty associated with weighing samples was estimated using the limit of quantitation of the analytical balance. Percentage error for other potential sources was estimated based on best professional judgment. Precision was estimated by propagating all component sources of error that were identified for each biological parameter:
Potential sources of error for the precision estimates (Table 4) are described below. Percent coverage by species is defined as the percent of the total quadrat area that is obscured by a particular seagrass species when viewed from directly above. The sum of percent coverage for each species plus the percent of the total quadrat area that is bare is 100%. Two potential sources of error are difference in estimating percent coverage between observers, and difference in how well the quadrat area is cleared of macroalgae and debris before making the observation. Shoot density is calculated by counting the number of shoots within a seagrass core, then dividing that number by the cross-sectional area of the corer to express density in number of shoots per square meter. Potential sources of error include differences in handling, cleaning and counting the sample between analysts, and uncertainty in exact corer dimensions. Seagrass biomass is measured from analysis of seagrass cores collected in the field. Above-ground and below-ground material are separated in the lab and dried. Epiphyte growth (filamentous algae, diatoms, and other living organisms that attach to seagrass leaves) is removed from above-ground samples before drying. Weights are divided by the cross-sectional area of the corer to obtain biomass in grams per square meter. Potential sources of error include differences between analysts in cleaning samples, removing epiphyte growth and separating above-ground from below-ground material, not allowing sufficient drying time, uncertainty in weight measurements, and uncertainty in exact corer dimensions. Leaf length, or canopy height, and leaf width are measured from shoots obtained in the same core samples used for biomass estimation. The longest leaf in each of five shoots is measured using a metric ruler with millimeter divisions. Along with shoot density, the leaf length and width are used to calculate a leaf area index. Potential sources of error include measurement differences between analysts, epiphyte growth on leaves, leaf tips broken off during handling, and uncertainty in length measurements. Another biological parameter derived from these five shoots in each core sample is the number of leaves per shoot. Potential sources of error include

Revision 1.1 June 19, 2012 Page 27 of 114
differences between analysts in counting leaves, leaves broken off during handling, and leaves pressed against and hidden by larger leaves. Epiphyte biomass is measured by scraping material from seagrass shoots collected in the field. Epiphytes are scraped from both sides of seagrass leaves, and the area scraped is measured to allow epiphyte biomass to be expressed in milligrams per square centimeters. Epiphytes are scraped onto a pre-weighed glass fiber filter, on which they are dried and weighed to obtain epiphyte biomass. The scraped seagrass leaves are also dried and weighed to allow epiphyte biomass to be expressed in milligrams per gram of seagrass leaf. Potential sources of error include differences between analysts in efficiency of scraping epiphytes from the leaves, not letting material dry thoroughly in the oven, small pieces of the filter flaking off, and uncertainty in weight measurements. For expressing epiphyte biomass per unit leaf area, additional sources of error are those associated with measuring leaf length and width as described above. For expressing epiphyte biomass per unit leaf weight, for species other than Thalassia, there is an error associated with losing small pieces of thin seagrass leaves during weighing. Macroalgal biomass is measured from algae samples collected from a square quadrat (0.25m on a side). Macroalgae is cleaned of epiphytes in the lab, dried and weighed, and the dry weight expressed in grams per square meter. Potential sources of error include not letting the macroalgae dry thoroughly, differences between staff in cleaning epiphytes from the macroalgae, uncertainty in exact quadrat dimensions, and uncertainty in weight measurements.

Revision 1.1 June 19, 2012 Page 28 of 114
Table 4. A7.2. Seagrass condition and stressor indicator measurement performance specifications.
Analysis Units Parameter Code
Analytical method
Sensitivity Precision Expected range
Percent coverage by species % N/A QAPP 1%5 10% 0-100%
Shoot density - 9 cm corer shoots/m2 N/A QAPP 150 5% 150 - 22,000
Shoot density - 15 cm corer shoots/m2 N/A QAPP 50 5% 50 - 6,000
Biomass (above-ground or below-ground) - 9 cm corer g/m2 N/A QAPP 0.15 10% 0.5 - 400
Biomass (above-ground or below-ground) - 15 cm corer g/m2 N/A QAPP 0.05 10% 0.5 - 400
Biomass - total - 9 cm corer g/m2 N/A QAPP 0.3 10% 1 - 2,000
Biomass - total - 15 cm corer g/m2 N/A QAPP 0.1 10% 1 - 2,000
RSR N/A N/A QAPP N/A 10% 0.5 - 25.0 Canopy height - Thalassia cm N/A QAPP 0.1 5% 2 - 90 Canopy height - other than Thalassia cm N/A QAPP 0.1 5% 2 - 60
Leaf length - Thalassia cm N/A QAPP 0.1 5% 2 - 90
Leaf length - other than Thalassia cm N/A QAPP 0.1 5% 2 - 60
Leaf width - Thalassia mm N/A QAPP 0.5 25% 2 - 15
Leaf width - other than Thalassia mm N/A QAPP 0.5 30% 1 - 3
LAI - Thalassia m2/m2 N/A QAPP 0.001 25% 0.02 - 5
5 One shoot is the smallest quantity that can be detected by an observer, and will be assigned a percent coverage of 1%

Revision 1.1 June 19, 2012 Page 29 of 114
Analysis Units Parameter
Code Analytical
method Sensitivity Precision Expected range
LAI - other than Thalassia m2/m2 N/A QAPP 0.001 35% 0.02 - 5
Number of leaves per shoot integer N/A QAPP 1 5% 1 - 4 Epiphyte load - other than Thalassia mg/cm2 N/A QAPP 0.01 50% 0 - 5
Epiphyte load - Thalassia mg/cm2 N/A QAPP 0.01 30% 0 - 7 Epiphyte load - other than Thalassia mg/g N/A QAPP 3 30% 0 - 300
Epiphyte load - Thalassia mg/g N/A QAPP 3 10% N/A
Macroalgal biomass g/m2 N/A QAPP 0.002 10% 0 - 225 A8. Special Training/Certification Personnel unfamiliar with sampling, field analysis, and/or laboratory methods will receive training. New field personnel will receive field training, which requires them to thoroughly review all sampling and field analysis procedures. During the training, experienced personnel will demonstrate procedures. Before actual sampling or field analysis occurs, new field personnel will demonstrate to the Project Manager (or designee) their ability to properly calibrate field equipment and perform field sampling and analysis procedures. New TPWD laboratory personnel will undergo on-the-job training, which requires them to thoroughly review all methodologies and safety procedures prior to performing any lab work. During the training, personnel will be shown each laboratory procedure by an experienced staff member. New personnel will practice laboratory procedures under supervision of experienced staff prior to independent analysis of project samples.

Revision 1.1 June 19, 2012 Page 30 of 114
A9. Documents and Records In the field, data collected on site will be entered onto preprinted waterproof forms. Notes will be taken regarding date, time, personnel involved, weather conditions, samples collected and unique sample identification numbers. Deviations from standard sampling procedures or unusual occurrences will be noted. Pertinent project documents and records will be retained as described in Table 5. Table 5. A9.1. Project documents and records.
Document/Record
Location
Retention (yrs)
Format
QAPPs, amendments and appendices
TPWD Project Manager office/ Austin
5 years
Paper, electronic
QAPP distribution documentation
TPWD Project Manager office/ Austin
5 years
Paper, electronic
Field SOPs
TPWD Project Manager office/ Austin
5 years
Paper, electronic if available
Field equipment calibration/maintenance logs
TPWD Project Manager office/ Austin
5 years Paper
Field instrument printouts
TPWD Project Manager office/ Austin
5 years Paper, electronic
Field data sheets
TPWD Project Manager office/ Austin
5 years Paper
Bench data sheets
TPWD Project Manager office/ Austin
5 years Paper
Annual Project Report TPWD Project Manager office/ Austin
5 years
Paper, electronic
Laboratory QA Manuals
Laboratory
5 years
Paper, electronic
Laboratory SOPs
Laboratory
5 years
Paper, electronic
Laboratory calibration records
Laboratory
5 years
Paper, electronic

Revision 1.1 June 19, 2012 Page 31 of 114
Document/Record
Location
Retention (yrs)
Format
Laboratory instrument printouts
Laboratory
5 years
Paper, electronic
Laboratory data reports/results
Laboratory
5 years
Paper, electronic
Laboratory equipment maintenance logs
Laboratory
5 years
Paper, electronic
Corrective action documentation for laboratory
Laboratory
5 years
Paper, electronic
Laboratory Data Reports Data reports from laboratories will report the test results clearly and accurately. The test report will include the information necessary for the interpretation and validation of data and will include the following:
• name and address of the laboratory • name and address of the client • a clear identification of the sample(s) analyzed • identification of samples that did not meet QA requirements and why (e.g., holding times
exceeded) • date of sample receipt • sample results • field split results (as applicable) • clearly identified subcontract laboratory results (as applicable) • a name and title of person accepting responsibility for the report • project-specific quality control results to include LCS sample results (% recovery), LCS
duplicate results (%RPD), equipment, trip, and field blank results (as applicable), and RL confirmation (% recovery)
• narrative information on QC failures or deviations from requirements that may affect the quality of results
Laboratory Electronic Data Data will be submitted electronically to TPWD as Microsoft Excel files in the format required by TPWD for acceptance into the project database. B1. Sampling Process Design Site Selection Primary consideration is given to accessibility and safety for all project sampling sites.

Revision 1.1 June 19, 2012 Page 32 of 114
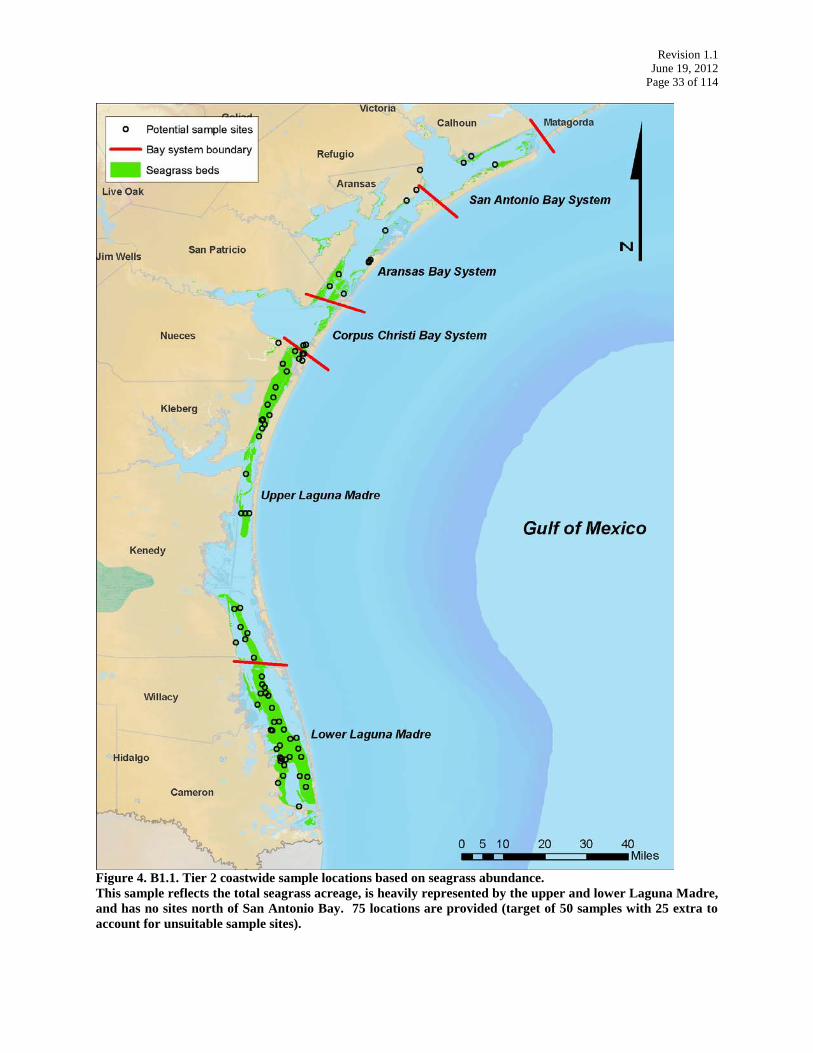
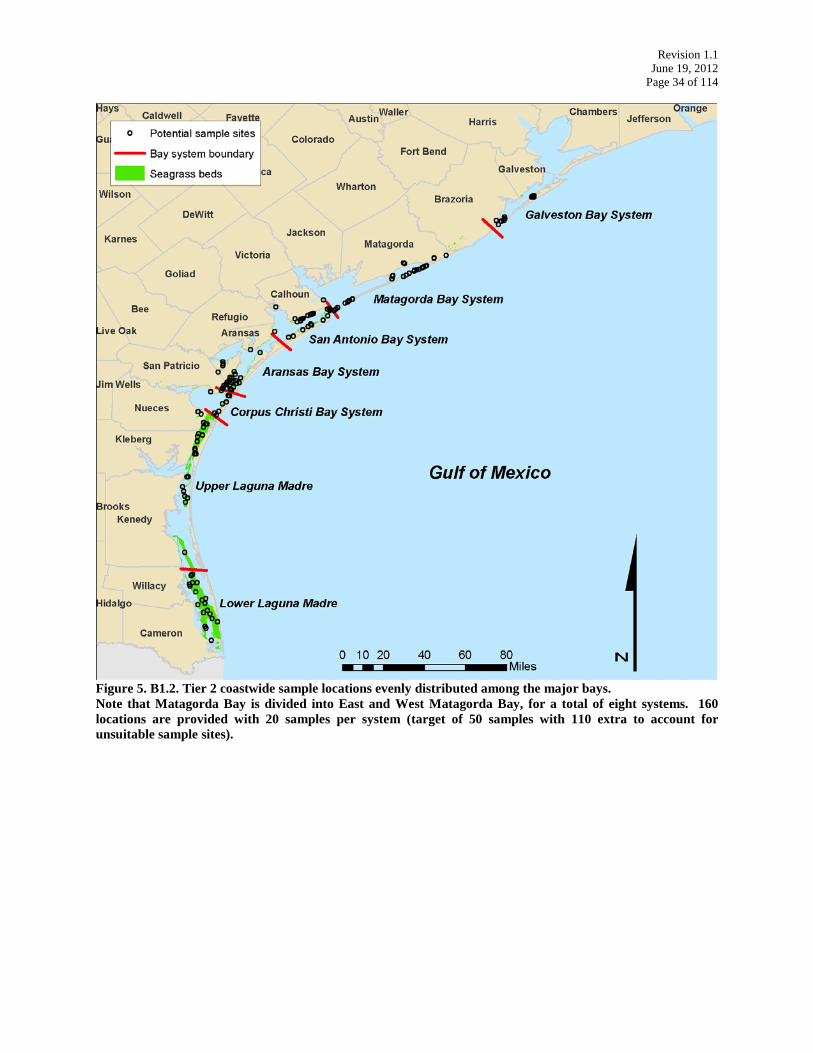
Tier 2 Coastwide Sampling Sets of coordinates have been generated probabilistically in order to obtain 50 suitable monitoring sites, along with extra sets of coordinates to take into account that some locations may not be suitable for Tier 2 monitoring. This is mostly due to the limitations of the seagrass coverage maps that are currently available, and that were used to generate the sampling coordinates. A decision point was whether to select coordinates based solely on the known seagrass abundance along the Texas coast (Figure 4) or to distribute coordinates more evenly along the coast (Figure 5). The former approach would result in almost all of the sampling points being located in the Laguna Madre and no sites north of San Antonio Bay. The latter approach distributes sampling sites throughout the seven major bay systems that support seagrass growth and would allow some points to be located as far north as the Galveston Bay system, which contains small but significant stands of seagrasses in West Bay and Christmas Bay. TPWD chose to use the latter approach so that the coastwide Tier 2 monitoring would not ignore upper coast areas like the Galveston Bay system, which historically sustained a higher acreage of seagrasses than is currently present. For the probabilistic draw, the seven major bay systems that sustain seagrass were divided into eight sections and 20 sets of coordinates were generated for each of the eight sections (Table 6). In addition to the 50 probabilistically-selected stations, staff will also sample the 14 fixed sites that were monitored as part of the Phase 1 Seagrass Monitoring project (Figure 3).
Revision 1.1 June 19, 2012 Page 33 of 114
Figure 4. B1.1. Tier 2 coastwide sample locations based on seagrass abundance. This sample reflects the total seagrass acreage, is heavily represented by the upper and lower Laguna Madre, and has no sites north of San Antonio Bay. 75 locations are provided (target of 50 samples with 25 extra to account for unsuitable sample sites).
Revision 1.1 June 19, 2012 Page 34 of 114
Figure 5. B1.2. Tier 2 coastwide sample locations evenly distributed among the major bays. Note that Matagorda Bay is divided into East and West Matagorda Bay, for a total of eight systems. 160 locations are provided with 20 samples per system (target of 50 samples with 110 extra to account for unsuitable sample sites).

Revision 1.1 June 19, 2012 Page 35 of 114
Table 6. B1.3. Tier 2 coastwide sample locations evenly distributed among the major bays. Note that Matagorda Bay is divided into East and West Matagorda Bay, for a total of eight systems. 160 locations are provided with 10 samples per system (target of 50 samples with 110 extra to account for unsuitable sample sites). TPWD grids are one minute latitude by one minute longitude in size. They are sequentially numbered from west to east and north to south in each bay system and the Texas Territorial Sea. Each grid is identified by the latitude –longitude coordinates at the center. Each sample grid is divided into 144 sample gridlets that are five seconds latitude by five seconds longitude in size. Gridlets are sequentially numbered from west to east and north to south such that gridlet 1 is located in the upper left corner of the grid; gridlet 12 is located in the upper right corner of the grid, and gridlet 144 is located in the lower right corner of the grid.
Bay TPWD
grid TPWD gridlet Longitude Latitude
Selection probability
Sampling weight
Galveston Bay 715 56 -95.2229 29.0438 0.03401 29.4 Galveston Bay 718 44 -95.1729 29.0451 0.03401 29.4 Galveston Bay 717 93 -95.1882 29.0396 0.03401 29.4 Galveston Bay 723 138 -95.2090 29.0174 0.03401 29.4 Galveston Bay 602 126 -94.9590 29.2188 0.03401 29.4 Galveston Bay 619 34 -94.9701 29.2132 0.03401 29.4 Galveston Bay 620 17 -94.9604 29.2146 0.03401 29.4 Galveston Bay 602 127 -94.9576 29.2188 0.03401 29.4 Galveston Bay 602 136 -94.9618 29.2174 0.03401 29.4 Galveston Bay 620 40 -94.9618 29.2118 0.03401 29.4 Galveston Bay 602 140 -94.9563 29.2174 0.03741 26.7 Galveston Bay 619 44 -94.9729 29.2118 0.03741 26.7 Galveston Bay 619 55 -94.9743 29.2104 0.03741 26.7 Galveston Bay 620 18 -94.9590 29.2146 0.03741 26.7 Galveston Bay 620 29 -94.9604 29.2132 0.03741 26.7 Galveston Bay 620 55 -94.9576 29.2104 0.03741 26.7 Galveston Bay 704 121 -95.1660 29.0688 0.03741 26.7 Galveston Bay 711 86 -95.1646 29.0563 0.03741 26.7 Galveston Bay 718 23 -95.1688 29.0479 0.03741 26.7 Galveston Bay 718 43 -95.1743 29.0451 0.03741 26.7 East Matagorda Bay 13 27 -95.6632 28.7799 0.03861 25.9 East Matagorda Bay 13 38 -95.6646 28.7785 0.03861 25.9 East Matagorda Bay 52 103 -95.7243 28.7215 0.03861 25.9 East Matagorda Bay 65 143 -95.7688 28.7007 0.03861 25.9 East Matagorda Bay 67 9 -95.7382 28.7160 0.03861 25.9 East Matagorda Bay 76 84 -95.8007 28.6910 0.03861 25.9 East Matagorda Bay 87 105 -95.8382 28.6715 0.03861 25.9 East Matagorda Bay 90 129 -95.9549 28.6521 0.03861 25.9 East Matagorda Bay 104 3 -95.9632 28.6326 0.03861 25.9 East Matagorda Bay 109 16 -95.5785 28.7979 0.03861 25.9 East Matagorda Bay 27 40 -95.8785 28.7451 0.04247 23.5 East Matagorda Bay 27 80 -95.8729 28.7410 0.04247 23.5

Revision 1.1 June 19, 2012 Page 36 of 114
Bay TPWD
grid TPWD gridlet Longitude Latitude
Selection probability
Sampling weight
East Matagorda Bay 52 84 -95.7174 28.7243 0.04247 23.5 East Matagorda Bay 67 50 -95.7479 28.7104 0.04247 23.5 East Matagorda Bay 76 118 -95.8035 28.6868 0.04247 23.5 East Matagorda Bay 77 35 -95.7854 28.6965 0.04247 23.5 East Matagorda Bay 78 9 -95.7715 28.6993 0.04247 23.5 East Matagorda Bay 96 66 -95.8590 28.6590 0.04247 23.5 East Matagorda Bay 103 3 -95.8799 28.6493 0.04247 23.5 East Matagorda Bay 104 17 -95.9604 28.6313 0.04247 23.5 West Matagorda Bay 134 128 -95.9563 28.6521 0.11628 8.6 West Matagorda Bay 134 129 -95.9549 28.6521 0.11628 8.6 West Matagorda Bay 450 91 -96.2410 28.4896 0.11628 8.6 West Matagorda Bay 450 92 -96.2396 28.4896 0.11628 8.6 West Matagorda Bay 457 4 -96.4451 28.4826 0.11628 8.6 West Matagorda Bay 468 27 -96.2632 28.4799 0.11628 8.6 West Matagorda Bay 477 43 -96.2910 28.4618 0.11628 8.6 West Matagorda Bay 491 71 -96.4021 28.4090 0.11628 8.6 West Matagorda Bay 493 71 -96.3688 28.4090 0.11628 8.6 West Matagorda Bay 498 98 -96.4146 28.3715 0.11628 8.6 West Matagorda Bay 134 117 -95.9549 28.6535 0.12791 7.8 West Matagorda Bay 450 93 -96.2382 28.4896 0.12791 7.8 West Matagorda Bay 467 128 -96.2729 28.4688 0.12791 7.8 West Matagorda Bay 468 28 -96.2618 28.4799 0.12791 7.8 West Matagorda Bay 485 119 -96.4021 28.4201 0.12791 7.8 West Matagorda Bay 485 132 -96.4007 28.4188 0.12791 7.8 West Matagorda Bay 485 133 -96.4160 28.4174 0.12791 7.8 West Matagorda Bay 485 134 -96.4146 28.4174 0.12791 7.8 West Matagorda Bay 488 128 -96.3563 28.4188 0.12791 7.8 West Matagorda Bay 489 40 -96.3451 28.4285 0.12791 7.8 San Antonio Bay 115 35 -96.5521 28.2965 0.00500 199.9 San Antonio Bay 131 92 -96.5896 28.2729 0.00500 199.9 San Antonio Bay 135 56 -96.7896 28.2604 0.00500 199.9 San Antonio Bay 222 115 -96.5243 28.3868 0.00500 199.9 San Antonio Bay 223 98 -96.5146 28.3882 0.00500 199.9 San Antonio Bay 245 117 -96.5882 28.3535 0.00500 199.9 San Antonio Bay 258 128 -96.6063 28.3354 0.00500 199.9 San Antonio Bay 259 5 -96.5938 28.3493 0.00500 199.9 San Antonio Bay 270 39 -96.6299 28.3285 0.00500 199.9 San Antonio Bay 285 36 -96.5340 28.3132 0.00500 199.9 San Antonio Bay 18 134 -96.7813 28.4340 0.00550 181.7 San Antonio Bay 171 127 -96.6910 28.2188 0.00550 181.7

Revision 1.1 June 19, 2012 Page 37 of 114
Bay TPWD
grid TPWD gridlet Longitude Latitude
Selection probability
Sampling weight
San Antonio Bay 173 42 -96.6590 28.2285 0.00550 181.7 San Antonio Bay 231 93 -96.5549 28.3729 0.00550 181.7 San Antonio Bay 232 45 -96.5382 28.3785 0.00550 181.7 San Antonio Bay 233 27 -96.5299 28.3799 0.00550 181.7 San Antonio Bay 242 135 -96.6465 28.3507 0.00550 181.7 San Antonio Bay 258 22 -96.6035 28.3479 0.00550 181.7 San Antonio Bay 268 86 -96.4479 28.3396 0.00550 181.7 San Antonio Bay 286 88 -96.5285 28.3063 0.00550 181.7 Aransas Bay 154 42 -96.8924 28.1118 0.00283 353.1 Aransas Bay 232 32 -97.1563 28.0465 0.00283 353.1 Aransas Bay 282 93 -97.1882 27.9729 0.00283 353.1 Aransas Bay 295 71 -97.0688 27.9590 0.00283 353.1 Aransas Bay 307 135 -97.0299 27.9340 0.00283 353.1 Aransas Bay 320 27 -97.1132 27.9132 0.00283 353.1 Aransas Bay 321 138 -97.0924 27.9007 0.00283 353.1 Aransas Bay 323 13 -97.0660 27.9146 0.00283 353.1 Aransas Bay 328 97 -97.1326 27.8882 0.00283 353.1 Aransas Bay 332 55 -97.0576 27.8938 0.00283 353.1 Aransas Bay 124 18 -96.9590 28.1313 0.00312 321.0 Aransas Bay 246 11 -97.1521 28.0326 0.00312 321.0 Aransas Bay 246 116 -97.1563 28.0201 0.00312 321.0 Aransas Bay 285 54 -97.0757 27.9771 0.00312 321.0 Aransas Bay 302 128 -97.1063 27.9354 0.00312 321.0 Aransas Bay 303 137 -97.0938 27.9340 0.00312 321.0 Aransas Bay 319 138 -97.1257 27.9007 0.00312 321.0 Aransas Bay 322 74 -97.0813 27.9076 0.00312 321.0 Aransas Bay 333 8 -97.0396 27.8993 0.00312 321.0 Aransas Bay 338 122 -97.0813 27.8688 0.00312 321.0 Corpus Christi Bay 55 136 -97.1285 27.8840 0.00369 270.8 Corpus Christi Bay 97 4 -97.0951 27.8493 0.00369 270.8 Corpus Christi Bay 97 17 -97.0938 27.8479 0.00369 270.8 Corpus Christi Bay 136 83 -97.1188 27.8076 0.00369 270.8 Corpus Christi Bay 137 90 -97.1090 27.8063 0.00369 270.8 Corpus Christi Bay 191 138 -97.1590 27.7507 0.00369 270.8 Corpus Christi Bay 235 38 -97.3313 27.6951 0.00369 270.8 Corpus Christi Bay 241 135 -97.2132 27.6840 0.00369 270.8 Corpus Christi Bay 242 36 -97.1840 27.6965 0.00369 270.8 Corpus Christi Bay 247 54 -97.3090 27.6771 0.00369 270.8 Corpus Christi Bay 55 7 -97.1243 27.8993 0.00406 246.2 Corpus Christi Bay 64 38 -97.1479 27.8785 0.00406 246.2

Revision 1.1 June 19, 2012 Page 38 of 114
Bay TPWD
grid TPWD gridlet Longitude Latitude
Selection probability
Sampling weight
Corpus Christi Bay 77 58 -97.1535 27.8604 0.00406 246.2 Corpus Christi Bay 77 79 -97.1576 27.8576 0.00406 246.2 Corpus Christi Bay 80 107 -97.1021 27.8549 0.00406 246.2 Corpus Christi Bay 81 136 -97.0951 27.8507 0.00406 246.2 Corpus Christi Bay 90 126 -97.2424 27.8354 0.00406 246.2 Corpus Christi Bay 93 50 -97.1646 27.8438 0.00406 246.2 Corpus Christi Bay 193 39 -97.1299 27.7618 0.00406 246.2 Corpus Christi Bay 235 51 -97.3299 27.6938 0.00406 246.2 Upper Laguna Madre 33 7 -97.2910 27.6160 0.00089 1123.2 Upper Laguna Madre 34 77 -97.2771 27.6076 0.00089 1123.2 Upper Laguna Madre 34 84 -97.2674 27.6076 0.00089 1123.2 Upper Laguna Madre 40 127 -97.2910 27.5854 0.00089 1123.2 Upper Laguna Madre 84 144 -97.3507 27.4340 0.00089 1123.2 Upper Laguna Madre 88 95 -97.3521 27.4229 0.00089 1123.2 Upper Laguna Madre 97 29 -97.3438 27.3965 0.00089 1123.2 Upper Laguna Madre 255 133 -97.3993 27.2340 0.00089 1123.2 Upper Laguna Madre 258 18 -97.4090 27.2313 0.00089 1123.2 Upper Laguna Madre 275 20 -97.4396 27.1646 0.00089 1123.2 Upper Laguna Madre 10 131 -97.2021 27.6688 0.00098 1021.1 Upper Laguna Madre 57 102 -97.3257 27.5382 0.00098 1021.1 Upper Laguna Madre 61 119 -97.3354 27.5201 0.00098 1021.1 Upper Laguna Madre 64 37 -97.2993 27.5285 0.00098 1021.1 Upper Laguna Madre 76 10 -97.3368 27.4826 0.00098 1021.1 Upper Laguna Madre 96 45 -97.3549 27.3951 0.00098 1021.1 Upper Laguna Madre 283 13 -97.4326 27.1313 0.00098 1021.1 Upper Laguna Madre 290 30 -97.4257 27.0965 0.00098 1021.1 Upper Laguna Madre 291 142 -97.4035 27.0840 0.00098 1021.1 Upper Laguna Madre 298 118 -97.4201 27.0535 0.00098 1021.1 Lower Laguna Madre 100 124 -97.3785 26.5354 0.00045 2230.8 Lower Laguna Madre 121 119 -97.3688 26.4868 0.00045 2230.8 Lower Laguna Madre 123 118 -97.3368 26.4868 0.00045 2230.8 Lower Laguna Madre 136 58 -97.3868 26.4604 0.00045 2230.8 Lower Laguna Madre 189 36 -97.3007 26.3632 0.00045 2230.8 Lower Laguna Madre 206 26 -97.3313 26.3299 0.00045 2230.8 Lower Laguna Madre 227 87 -97.2632 26.2896 0.00045 2230.8 Lower Laguna Madre 245 16 -97.2451 26.2646 0.00045 2230.8 Lower Laguna Madre 284 50 -97.2813 26.1771 0.00045 2230.8 Lower Laguna Madre 344 35 -97.2354 26.0799 0.00045 2230.8 Lower Laguna Madre 39 7 -97.4243 26.6993 0.00049 2028.0 Lower Laguna Madre 100 58 -97.3701 26.5438 0.00049 2028.0

Revision 1.1 June 19, 2012 Page 39 of 114
Bay TPWD
grid TPWD gridlet Longitude Latitude
Selection probability
Sampling weight
Lower Laguna Madre 128 90 -97.3924 26.4729 0.00049 2028.0 Lower Laguna Madre 155 111 -97.3465 26.4201 0.00049 2028.0 Lower Laguna Madre 181 78 -97.2757 26.3743 0.00049 2028.0 Lower Laguna Madre 201 74 -97.2813 26.3410 0.00049 2028.0 Lower Laguna Madre 234 78 -97.2924 26.2743 0.00049 2028.0 Lower Laguna Madre 264 2 -97.2313 26.2326 0.00049 2028.0 Lower Laguna Madre 274 53 -97.1938 26.2104 0.00049 2028.0 Lower Laguna Madre 293 19 -97.2743 26.1646 0.00049 2028.0

Revision 1.1 June 19, 2012 Page 40 of 114
Tier 2 Bay Sampling Since seagrass is known to be impacted by factors associated with human activity, one bay was identified that is less impacted by development pressure, San Antonio Bay, and one bay that has experienced impacts, Redfish Bay. Tier 2 bay sampling will be conducted in a similar manner to the coastwide Tier 2 monitoring. Fifty permanent stations will be established and monitored from a list of about 150 potential stations. TPWD will conduct bay-scale Tier 2 sampling at 50 stations in Redfish Bay (Figure 6 and Table 7). As resources permit, bay-scale Tier 2 sampling will be conducted at 50 stations in San Antonio Bay (Figure 7 and Table 8). Tier 3 Sampling Tier 3 sampling will be conducted in Redfish Bay, and as resources permit, in San Antonio Bay. Transect locations for Tier 3 sampling will be selected based on reconnaissance of the areas early in the project. Sample Frequency Sampling for each component of this project (coastwide Tier 2, bay-level Tier 2, and bay-level Tier 3) will occur only once during the project, in late summer/early fall 2012. Field Sampling Design Tier 2 sample design is a set of discrete locations, determined as described above. Sample type and number are described in Table 9. Tier 3 sample design is based on three 50 m transects that encompass the deep edge of the seagrass bed and extend across any depth gradient which may exist in seagrass beds that occur near shore. Seagrass condition and stressor indicators may be influenced by water depth, so using a transect-based design allows depth-related characteristics to be distinguished. Sample type and number are described in Table 10.

Revision 1.1 June 19, 2012 Page 41 of 114
Figure 6. B1.5. Tier 2 sampling locations for Redfish Bay system based on seagrass abundance. 147 locations are provided (target of 50 samples with 97 extra to account for unsuitable sample sites).

Revision 1.1 June 19, 2012 Page 42 of 114
Figure 7. B1.6. Tier 2 sampling locations for San Antonio Bay system based on seagrass abundance. 150 locations are provided (target of 50 samples with 100 extra to account for unsuitable sample sites).

Revision 1.1 June 19, 2012 Page 43 of 114
Table 7. B1.7. Tier 2 sampling locations for Redfish Bay system based on seagrass abundance. 147 locations are provided (target of 50 samples with 97 extra to account for unsuitable sample sites). TPWD grids are one minute latitude by one minute longitude in size. They are sequentially numbered from west to east and north to south in each bay system and the Texas Territorial Sea. Each grid is identified by the latitude –longitude coordinates at the center. Each sample grid is divided into 144 sample gridlets that are five seconds latitude by five seconds longitude in size. Gridlets are sequentially numbered from west to east and north to south such that gridlet 1 is located in the upper left corner of the grid; gridlet 12 is located in the upper right corner of the grid, and gridlet 144 is located in the lower right corner of the grid.
Bay TPWD
grid TPWD gridlet Longitude Latitude
Selection probability
Sampling weight
Aransas Bay 274 135 -97.0799 27.9840 0.02124 47.1 Aransas Bay 294 95 -97.0854 27.9563 0.02124 47.1 Aransas Bay 294 138 -97.0924 27.9507 0.02124 47.1 Aransas Bay 295 80 -97.0729 27.9576 0.02124 47.1 Aransas Bay 303 61 -97.0993 27.9424 0.02124 47.1 Aransas Bay 303 76 -97.0951 27.9410 0.02124 47.1 Aransas Bay 303 97 -97.0993 27.9382 0.02124 47.1 Aransas Bay 304 17 -97.0771 27.9479 0.02124 47.1 Aransas Bay 310 120 -97.1174 27.9201 0.02124 47.1 Aransas Bay 311 143 -97.1021 27.9174 0.02124 47.1 Aransas Bay 312 128 -97.0896 27.9188 0.02124 47.1 Aransas Bay 312 144 -97.0840 27.9174 0.02124 47.1 Aransas Bay 313 51 -97.0799 27.9271 0.02124 47.1 Aransas Bay 313 123 -97.0799 27.9188 0.02124 47.1 Aransas Bay 319 20 -97.1229 27.9146 0.02124 47.1 Aransas Bay 319 69 -97.1215 27.9090 0.02124 47.1 Aransas Bay 319 116 -97.1229 27.9035 0.02124 47.1 Aransas Bay 319 138 -97.1257 27.9007 0.02124 47.1 Aransas Bay 320 11 -97.1021 27.9160 0.02124 47.1 Aransas Bay 320 25 -97.1160 27.9132 0.02124 47.1 Aransas Bay 320 28 -97.1118 27.9132 0.02124 47.1 Aransas Bay 320 30 -97.1090 27.9132 0.02124 47.1 Aransas Bay 321 17 -97.0938 27.9146 0.02124 47.1 Aransas Bay 321 26 -97.0979 27.9132 0.02124 47.1 Aransas Bay 321 94 -97.0868 27.9063 0.02124 47.1 Aransas Bay 322 81 -97.0715 27.9076 0.02124 47.1 Aransas Bay 322 117 -97.0715 27.9035 0.02124 47.1 Aransas Bay 322 121 -97.0826 27.9021 0.02124 47.1 Aransas Bay 327 142 -97.1368 27.8840 0.02124 47.1 Aransas Bay 328 2 -97.1313 27.8993 0.02124 47.1 Aransas Bay 328 134 -97.1313 27.8840 0.02124 47.1 Aransas Bay 330 16 -97.0951 27.8979 0.02124 47.1 Aransas Bay 330 119 -97.0854 27.8868 0.02124 47.1 Aransas Bay 331 106 -97.0701 27.8882 0.02124 47.1
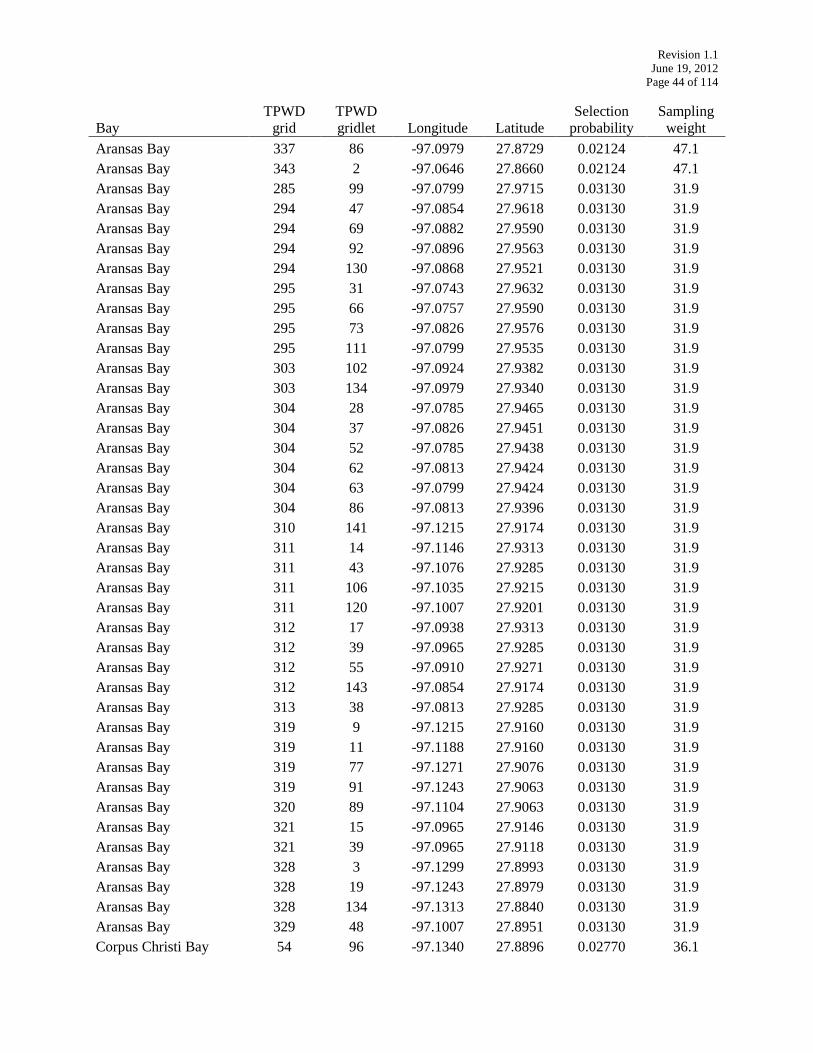
Revision 1.1 June 19, 2012 Page 44 of 114
Bay TPWD
grid TPWD gridlet Longitude Latitude
Selection probability
Sampling weight
Aransas Bay 337 86 -97.0979 27.8729 0.02124 47.1 Aransas Bay 343 2 -97.0646 27.8660 0.02124 47.1 Aransas Bay 285 99 -97.0799 27.9715 0.03130 31.9 Aransas Bay 294 47 -97.0854 27.9618 0.03130 31.9 Aransas Bay 294 69 -97.0882 27.9590 0.03130 31.9 Aransas Bay 294 92 -97.0896 27.9563 0.03130 31.9 Aransas Bay 294 130 -97.0868 27.9521 0.03130 31.9 Aransas Bay 295 31 -97.0743 27.9632 0.03130 31.9 Aransas Bay 295 66 -97.0757 27.9590 0.03130 31.9 Aransas Bay 295 73 -97.0826 27.9576 0.03130 31.9 Aransas Bay 295 111 -97.0799 27.9535 0.03130 31.9 Aransas Bay 303 102 -97.0924 27.9382 0.03130 31.9 Aransas Bay 303 134 -97.0979 27.9340 0.03130 31.9 Aransas Bay 304 28 -97.0785 27.9465 0.03130 31.9 Aransas Bay 304 37 -97.0826 27.9451 0.03130 31.9 Aransas Bay 304 52 -97.0785 27.9438 0.03130 31.9 Aransas Bay 304 62 -97.0813 27.9424 0.03130 31.9 Aransas Bay 304 63 -97.0799 27.9424 0.03130 31.9 Aransas Bay 304 86 -97.0813 27.9396 0.03130 31.9 Aransas Bay 310 141 -97.1215 27.9174 0.03130 31.9 Aransas Bay 311 14 -97.1146 27.9313 0.03130 31.9 Aransas Bay 311 43 -97.1076 27.9285 0.03130 31.9 Aransas Bay 311 106 -97.1035 27.9215 0.03130 31.9 Aransas Bay 311 120 -97.1007 27.9201 0.03130 31.9 Aransas Bay 312 17 -97.0938 27.9313 0.03130 31.9 Aransas Bay 312 39 -97.0965 27.9285 0.03130 31.9 Aransas Bay 312 55 -97.0910 27.9271 0.03130 31.9 Aransas Bay 312 143 -97.0854 27.9174 0.03130 31.9 Aransas Bay 313 38 -97.0813 27.9285 0.03130 31.9 Aransas Bay 319 9 -97.1215 27.9160 0.03130 31.9 Aransas Bay 319 11 -97.1188 27.9160 0.03130 31.9 Aransas Bay 319 77 -97.1271 27.9076 0.03130 31.9 Aransas Bay 319 91 -97.1243 27.9063 0.03130 31.9 Aransas Bay 320 89 -97.1104 27.9063 0.03130 31.9 Aransas Bay 321 15 -97.0965 27.9146 0.03130 31.9 Aransas Bay 321 39 -97.0965 27.9118 0.03130 31.9 Aransas Bay 328 3 -97.1299 27.8993 0.03130 31.9 Aransas Bay 328 19 -97.1243 27.8979 0.03130 31.9 Aransas Bay 328 134 -97.1313 27.8840 0.03130 31.9 Aransas Bay 329 48 -97.1007 27.8951 0.03130 31.9 Corpus Christi Bay 54 96 -97.1340 27.8896 0.02770 36.1
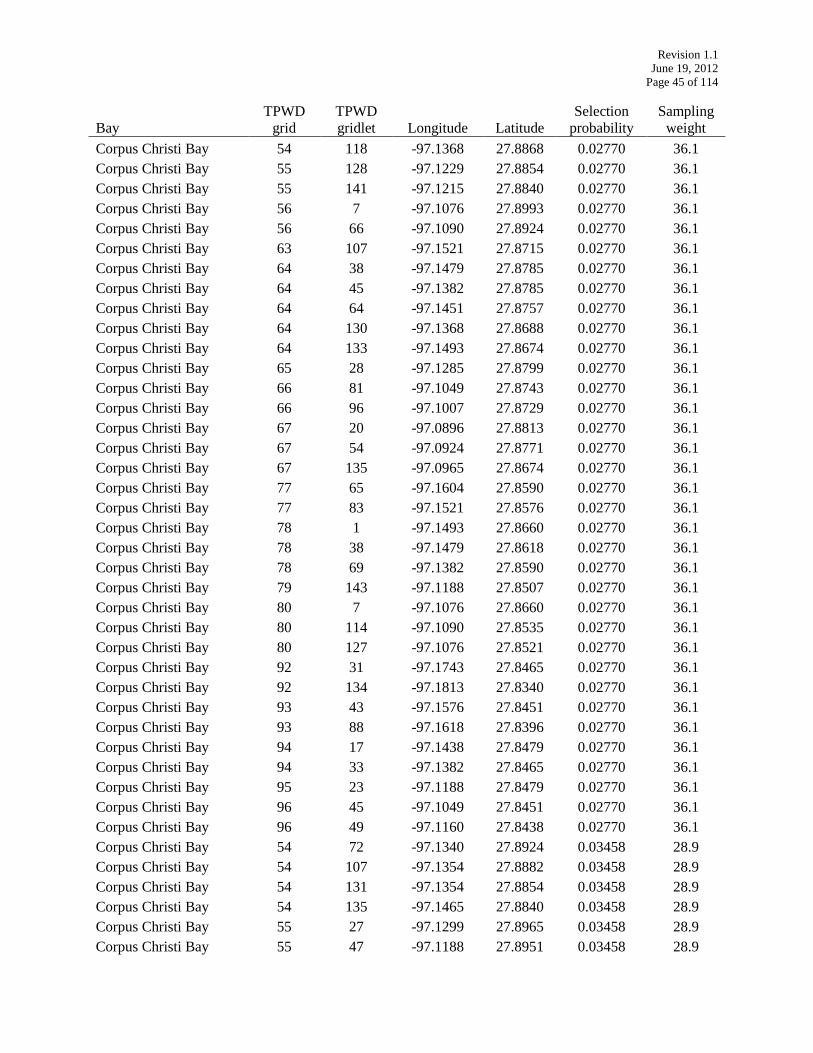
Revision 1.1 June 19, 2012 Page 45 of 114
Bay TPWD
grid TPWD gridlet Longitude Latitude
Selection probability
Sampling weight
Corpus Christi Bay 54 118 -97.1368 27.8868 0.02770 36.1 Corpus Christi Bay 55 128 -97.1229 27.8854 0.02770 36.1 Corpus Christi Bay 55 141 -97.1215 27.8840 0.02770 36.1 Corpus Christi Bay 56 7 -97.1076 27.8993 0.02770 36.1 Corpus Christi Bay 56 66 -97.1090 27.8924 0.02770 36.1 Corpus Christi Bay 63 107 -97.1521 27.8715 0.02770 36.1 Corpus Christi Bay 64 38 -97.1479 27.8785 0.02770 36.1 Corpus Christi Bay 64 45 -97.1382 27.8785 0.02770 36.1 Corpus Christi Bay 64 64 -97.1451 27.8757 0.02770 36.1 Corpus Christi Bay 64 130 -97.1368 27.8688 0.02770 36.1 Corpus Christi Bay 64 133 -97.1493 27.8674 0.02770 36.1 Corpus Christi Bay 65 28 -97.1285 27.8799 0.02770 36.1 Corpus Christi Bay 66 81 -97.1049 27.8743 0.02770 36.1 Corpus Christi Bay 66 96 -97.1007 27.8729 0.02770 36.1 Corpus Christi Bay 67 20 -97.0896 27.8813 0.02770 36.1 Corpus Christi Bay 67 54 -97.0924 27.8771 0.02770 36.1 Corpus Christi Bay 67 135 -97.0965 27.8674 0.02770 36.1 Corpus Christi Bay 77 65 -97.1604 27.8590 0.02770 36.1 Corpus Christi Bay 77 83 -97.1521 27.8576 0.02770 36.1 Corpus Christi Bay 78 1 -97.1493 27.8660 0.02770 36.1 Corpus Christi Bay 78 38 -97.1479 27.8618 0.02770 36.1 Corpus Christi Bay 78 69 -97.1382 27.8590 0.02770 36.1 Corpus Christi Bay 79 143 -97.1188 27.8507 0.02770 36.1 Corpus Christi Bay 80 7 -97.1076 27.8660 0.02770 36.1 Corpus Christi Bay 80 114 -97.1090 27.8535 0.02770 36.1 Corpus Christi Bay 80 127 -97.1076 27.8521 0.02770 36.1 Corpus Christi Bay 92 31 -97.1743 27.8465 0.02770 36.1 Corpus Christi Bay 92 134 -97.1813 27.8340 0.02770 36.1 Corpus Christi Bay 93 43 -97.1576 27.8451 0.02770 36.1 Corpus Christi Bay 93 88 -97.1618 27.8396 0.02770 36.1 Corpus Christi Bay 94 17 -97.1438 27.8479 0.02770 36.1 Corpus Christi Bay 94 33 -97.1382 27.8465 0.02770 36.1 Corpus Christi Bay 95 23 -97.1188 27.8479 0.02770 36.1 Corpus Christi Bay 96 45 -97.1049 27.8451 0.02770 36.1 Corpus Christi Bay 96 49 -97.1160 27.8438 0.02770 36.1 Corpus Christi Bay 54 72 -97.1340 27.8924 0.03458 28.9 Corpus Christi Bay 54 107 -97.1354 27.8882 0.03458 28.9 Corpus Christi Bay 54 131 -97.1354 27.8854 0.03458 28.9 Corpus Christi Bay 54 135 -97.1465 27.8840 0.03458 28.9 Corpus Christi Bay 55 27 -97.1299 27.8965 0.03458 28.9 Corpus Christi Bay 55 47 -97.1188 27.8951 0.03458 28.9

Revision 1.1 June 19, 2012 Page 46 of 114
Bay TPWD
grid TPWD gridlet Longitude Latitude
Selection probability
Sampling weight
Corpus Christi Bay 55 92 -97.1229 27.8896 0.03458 28.9 Corpus Christi Bay 55 93 -97.1215 27.8896 0.03458 28.9 Corpus Christi Bay 56 110 -97.1146 27.8868 0.03458 28.9 Corpus Christi Bay 56 114 -97.1090 27.8868 0.03458 28.9 Corpus Christi Bay 56 137 -97.1104 27.8840 0.03458 28.9 Corpus Christi Bay 63 125 -97.1604 27.8688 0.03458 28.9 Corpus Christi Bay 64 63 -97.1465 27.8757 0.03458 28.9 Corpus Christi Bay 64 77 -97.1438 27.8743 0.03458 28.9 Corpus Christi Bay 64 131 -97.1354 27.8688 0.03458 28.9 Corpus Christi Bay 64 137 -97.1438 27.8674 0.03458 28.9 Corpus Christi Bay 64 141 -97.1382 27.8674 0.03458 28.9 Corpus Christi Bay 65 6 -97.1257 27.8826 0.03458 28.9 Corpus Christi Bay 65 61 -97.1326 27.8757 0.03458 28.9 Corpus Christi Bay 66 130 -97.1035 27.8688 0.03458 28.9 Corpus Christi Bay 66 143 -97.1021 27.8674 0.03458 28.9 Corpus Christi Bay 67 33 -97.0882 27.8799 0.03458 28.9 Corpus Christi Bay 77 91 -97.1576 27.8563 0.03458 28.9 Corpus Christi Bay 77 110 -97.1646 27.8535 0.03458 28.9 Corpus Christi Bay 77 121 -97.1660 27.8521 0.03458 28.9 Corpus Christi Bay 77 128 -97.1563 27.8521 0.03458 28.9 Corpus Christi Bay 78 86 -97.1479 27.8563 0.03458 28.9 Corpus Christi Bay 80 31 -97.1076 27.8632 0.03458 28.9 Corpus Christi Bay 80 61 -97.1160 27.8590 0.03458 28.9 Corpus Christi Bay 80 134 -97.1146 27.8507 0.03458 28.9 Corpus Christi Bay 92 44 -97.1729 27.8451 0.03458 28.9 Corpus Christi Bay 92 101 -97.1771 27.8382 0.03458 28.9 Corpus Christi Bay 93 7 -97.1576 27.8493 0.03458 28.9 Corpus Christi Bay 93 20 -97.1563 27.8479 0.03458 28.9 Corpus Christi Bay 93 52 -97.1618 27.8438 0.03458 28.9 Corpus Christi Bay 95 32 -97.1229 27.8465 0.03458 28.9 Corpus Christi Bay 95 54 -97.1257 27.8438 0.03458 28.9

Revision 1.1 June 19, 2012 Page 47 of 114
Table 8. B1.8. Tier 2 sampling locations for San Antonio Bay system based on seagrass abundance. 150 locations are provided (target of 50 samples with 100 extra to account for unsuitable sample sites). TPWD grids are one minute latitude by one minute longitude in size. They are sequentially numbered from west to east and north to south in each bay system and the Texas Territorial Sea. Each grid is identified by the latitude –longitude coordinates at the center. Each sample grid is divided into 144 sample gridlets that are five seconds latitude by five seconds longitude in size. Gridlets are sequentially numbered from west to east and north to south such that gridlet 1 is located in the upper left corner of the grid; gridlet 12 is located in the upper right corner of the grid, and gridlet 144 is located in the lower right corner of the grid.
Bay TPWD
grid TPWD gridlet Longitude Latitude
Selection probability
Sampling weight
San Antonio Bay 11 100 -96.7951 28.4549 0.03752 26.7 San Antonio Bay 16 11 -96.8021 28.4493 0.03752 26.7 San Antonio Bay 17 27 -96.7965 28.4465 0.03752 26.7 San Antonio Bay 34 50 -96.7813 28.4104 0.03752 26.7 San Antonio Bay 36 81 -96.7382 28.4076 0.03752 26.7 San Antonio Bay 76 2 -96.6479 28.3493 0.03752 26.7 San Antonio Bay 85 96 -96.6674 28.3229 0.03752 26.7 San Antonio Bay 85 107 -96.6688 28.3215 0.03752 26.7 San Antonio Bay 86 131 -96.6521 28.3188 0.03752 26.7 San Antonio Bay 100 79 -96.8076 28.2910 0.03752 26.7 San Antonio Bay 114 47 -96.5688 28.2951 0.03752 26.7 San Antonio Bay 114 48 -96.5674 28.2951 0.03752 26.7 San Antonio Bay 114 68 -96.5729 28.2924 0.03752 26.7 San Antonio Bay 115 3 -96.5632 28.2993 0.03752 26.7 San Antonio Bay 115 28 -96.5618 28.2965 0.03752 26.7 San Antonio Bay 115 55 -96.5576 28.2938 0.03752 26.7 San Antonio Bay 116 10 -96.5368 28.2993 0.03752 26.7 San Antonio Bay 129 72 -96.6174 28.2757 0.03752 26.7 San Antonio Bay 129 135 -96.6299 28.2674 0.03752 26.7 San Antonio Bay 130 70 -96.6035 28.2757 0.03752 26.7 San Antonio Bay 160 54 -96.6424 28.2438 0.03752 26.7 San Antonio Bay 171 118 -96.6868 28.2201 0.03752 26.7 San Antonio Bay 172 70 -96.6701 28.2257 0.03752 26.7 San Antonio Bay 173 38 -96.6646 28.2285 0.03752 26.7 San Antonio Bay 184 20 -96.6896 28.2146 0.03752 26.7 San Antonio Bay 184 39 -96.6965 28.2118 0.03752 26.7 San Antonio Bay 191 132 -96.7507 28.1854 0.03752 26.7 San Antonio Bay 192 96 -96.7340 28.1896 0.03752 26.7 San Antonio Bay 200 39 -96.7799 28.1785 0.03752 26.7 San Antonio Bay 212 109 -96.4326 28.4201 0.03752 26.7 San Antonio Bay 213 124 -96.4118 28.4188 0.03752 26.7 San Antonio Bay 213 144 -96.4007 28.4174 0.03752 26.7 San Antonio Bay 219 59 -96.4188 28.4104 0.03752 26.7

Revision 1.1 June 19, 2012 Page 48 of 114
Bay TPWD
grid TPWD gridlet Longitude Latitude
Selection probability
Sampling weight
San Antonio Bay 223 69 -96.5049 28.3924 0.03752 26.7 San Antonio Bay 227 106 -96.4368 28.3882 0.03752 26.7 San Antonio Bay 227 121 -96.4493 28.3854 0.03752 26.7 San Antonio Bay 227 123 -96.4465 28.3854 0.03752 26.7 San Antonio Bay 228 121 -96.4326 28.3854 0.03752 26.7 San Antonio Bay 231 115 -96.5576 28.3701 0.03752 26.7 San Antonio Bay 232 46 -96.5368 28.3785 0.03752 26.7 San Antonio Bay 232 100 -96.5451 28.3715 0.03752 26.7 San Antonio Bay 237 91 -96.4576 28.3729 0.03752 26.7 San Antonio Bay 237 101 -96.4604 28.3715 0.03752 26.7 San Antonio Bay 238 67 -96.4410 28.3757 0.03752 26.7 San Antonio Bay 238 132 -96.4340 28.3688 0.03752 26.7 San Antonio Bay 239 72 -96.4174 28.3757 0.03752 26.7 San Antonio Bay 254 103 -96.4410 28.3549 0.03752 26.7 San Antonio Bay 254 144 -96.4340 28.3507 0.03752 26.7 San Antonio Bay 257 64 -96.6285 28.3424 0.03752 26.7 San Antonio Bay 258 74 -96.6146 28.3410 0.03752 26.7 San Antonio Bay 258 92 -96.6063 28.3396 0.03752 26.7 San Antonio Bay 258 102 -96.6090 28.3382 0.03752 26.7 San Antonio Bay 258 104 -96.6063 28.3382 0.03752 26.7 San Antonio Bay 258 115 -96.6076 28.3368 0.03752 26.7 San Antonio Bay 259 13 -96.5993 28.3479 0.03752 26.7 San Antonio Bay 259 50 -96.5979 28.3438 0.03752 26.7 San Antonio Bay 268 44 -96.4396 28.3451 0.03752 26.7 San Antonio Bay 270 18 -96.6257 28.3313 0.03752 26.7 San Antonio Bay 270 60 -96.6174 28.3271 0.03752 26.7 San Antonio Bay 270 61 -96.6326 28.3257 0.03752 26.7 San Antonio Bay 270 85 -96.6326 28.3229 0.03752 26.7 San Antonio Bay 276 88 -96.5285 28.3229 0.03752 26.7 San Antonio Bay 276 104 -96.5229 28.3215 0.03752 26.7 San Antonio Bay 276 129 -96.5215 28.3188 0.03752 26.7 San Antonio Bay 277 100 -96.5118 28.3215 0.03752 26.7 San Antonio Bay 277 133 -96.5160 28.3174 0.03752 26.7 San Antonio Bay 277 140 -96.5063 28.3174 0.03752 26.7 San Antonio Bay 279 22 -96.4701 28.3313 0.03752 26.7 San Antonio Bay 279 25 -96.4826 28.3299 0.03752 26.7 San Antonio Bay 285 44 -96.5396 28.3118 0.03752 26.7 San Antonio Bay 285 107 -96.5354 28.3049 0.03752 26.7 San Antonio Bay 286 61 -96.5326 28.3090 0.03752 26.7 San Antonio Bay 287 34 -96.5035 28.3132 0.03752 26.7
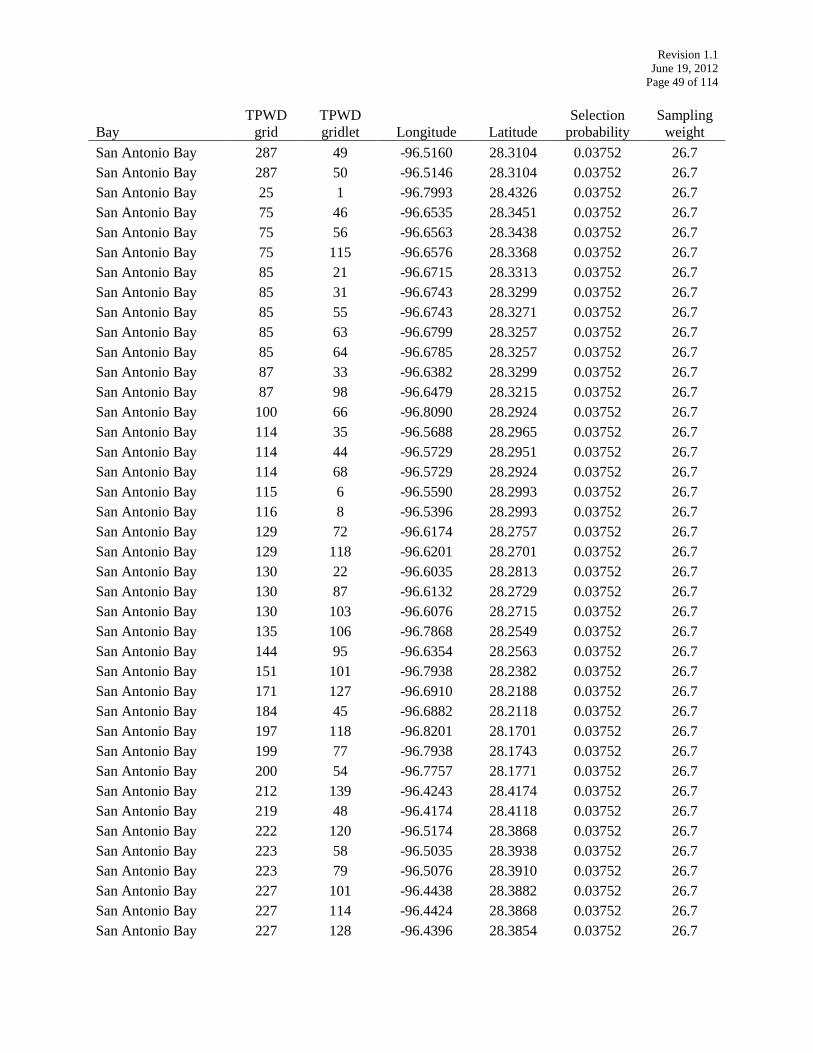
Revision 1.1 June 19, 2012 Page 49 of 114
Bay TPWD
grid TPWD gridlet Longitude Latitude
Selection probability
Sampling weight
San Antonio Bay 287 49 -96.5160 28.3104 0.03752 26.7 San Antonio Bay 287 50 -96.5146 28.3104 0.03752 26.7 San Antonio Bay 25 1 -96.7993 28.4326 0.03752 26.7 San Antonio Bay 75 46 -96.6535 28.3451 0.03752 26.7 San Antonio Bay 75 56 -96.6563 28.3438 0.03752 26.7 San Antonio Bay 75 115 -96.6576 28.3368 0.03752 26.7 San Antonio Bay 85 21 -96.6715 28.3313 0.03752 26.7 San Antonio Bay 85 31 -96.6743 28.3299 0.03752 26.7 San Antonio Bay 85 55 -96.6743 28.3271 0.03752 26.7 San Antonio Bay 85 63 -96.6799 28.3257 0.03752 26.7 San Antonio Bay 85 64 -96.6785 28.3257 0.03752 26.7 San Antonio Bay 87 33 -96.6382 28.3299 0.03752 26.7 San Antonio Bay 87 98 -96.6479 28.3215 0.03752 26.7 San Antonio Bay 100 66 -96.8090 28.2924 0.03752 26.7 San Antonio Bay 114 35 -96.5688 28.2965 0.03752 26.7 San Antonio Bay 114 44 -96.5729 28.2951 0.03752 26.7 San Antonio Bay 114 68 -96.5729 28.2924 0.03752 26.7 San Antonio Bay 115 6 -96.5590 28.2993 0.03752 26.7 San Antonio Bay 116 8 -96.5396 28.2993 0.03752 26.7 San Antonio Bay 129 72 -96.6174 28.2757 0.03752 26.7 San Antonio Bay 129 118 -96.6201 28.2701 0.03752 26.7 San Antonio Bay 130 22 -96.6035 28.2813 0.03752 26.7 San Antonio Bay 130 87 -96.6132 28.2729 0.03752 26.7 San Antonio Bay 130 103 -96.6076 28.2715 0.03752 26.7 San Antonio Bay 135 106 -96.7868 28.2549 0.03752 26.7 San Antonio Bay 144 95 -96.6354 28.2563 0.03752 26.7 San Antonio Bay 151 101 -96.7938 28.2382 0.03752 26.7 San Antonio Bay 171 127 -96.6910 28.2188 0.03752 26.7 San Antonio Bay 184 45 -96.6882 28.2118 0.03752 26.7 San Antonio Bay 197 118 -96.8201 28.1701 0.03752 26.7 San Antonio Bay 199 77 -96.7938 28.1743 0.03752 26.7 San Antonio Bay 200 54 -96.7757 28.1771 0.03752 26.7 San Antonio Bay 212 139 -96.4243 28.4174 0.03752 26.7 San Antonio Bay 219 48 -96.4174 28.4118 0.03752 26.7 San Antonio Bay 222 120 -96.5174 28.3868 0.03752 26.7 San Antonio Bay 223 58 -96.5035 28.3938 0.03752 26.7 San Antonio Bay 223 79 -96.5076 28.3910 0.03752 26.7 San Antonio Bay 227 101 -96.4438 28.3882 0.03752 26.7 San Antonio Bay 227 114 -96.4424 28.3868 0.03752 26.7 San Antonio Bay 227 128 -96.4396 28.3854 0.03752 26.7

Revision 1.1 June 19, 2012 Page 50 of 114
Bay TPWD
grid TPWD gridlet Longitude Latitude
Selection probability
Sampling weight
San Antonio Bay 227 129 -96.4382 28.3854 0.03752 26.7 San Antonio Bay 227 139 -96.4410 28.3840 0.03752 26.7 San Antonio Bay 228 111 -96.4299 28.3868 0.03752 26.7 San Antonio Bay 228 122 -96.4313 28.3854 0.03752 26.7 San Antonio Bay 232 65 -96.5438 28.3757 0.03752 26.7 San Antonio Bay 238 8 -96.4396 28.3826 0.03752 26.7 San Antonio Bay 239 10 -96.4201 28.3826 0.03752 26.7 San Antonio Bay 239 96 -96.4174 28.3729 0.03752 26.7 San Antonio Bay 240 61 -96.4160 28.3757 0.03752 26.7 San Antonio Bay 240 87 -96.4132 28.3729 0.03752 26.7 San Antonio Bay 245 115 -96.5910 28.3535 0.03752 26.7 San Antonio Bay 246 53 -96.5771 28.3604 0.03752 26.7 San Antonio Bay 253 23 -96.4521 28.3646 0.03752 26.7 San Antonio Bay 254 1 -96.4493 28.3660 0.03752 26.7 San Antonio Bay 257 44 -96.6229 28.3451 0.03752 26.7 San Antonio Bay 257 63 -96.6299 28.3424 0.03752 26.7 San Antonio Bay 257 132 -96.6174 28.3354 0.03752 26.7 San Antonio Bay 258 23 -96.6021 28.3479 0.03752 26.7 San Antonio Bay 258 55 -96.6076 28.3438 0.03752 26.7 San Antonio Bay 258 139 -96.6076 28.3340 0.03752 26.7 San Antonio Bay 259 7 -96.5910 28.3493 0.03752 26.7 San Antonio Bay 259 14 -96.5979 28.3479 0.03752 26.7 San Antonio Bay 259 18 -96.5924 28.3479 0.03752 26.7 San Antonio Bay 259 29 -96.5938 28.3465 0.03752 26.7 San Antonio Bay 268 76 -96.4451 28.3410 0.03752 26.7 San Antonio Bay 270 59 -96.6188 28.3271 0.03752 26.7 San Antonio Bay 277 120 -96.5007 28.3201 0.03752 26.7 San Antonio Bay 277 129 -96.5049 28.3188 0.03752 26.7 San Antonio Bay 277 136 -96.5118 28.3174 0.03752 26.7 San Antonio Bay 277 137 -96.5104 28.3174 0.03752 26.7 San Antonio Bay 277 140 -96.5063 28.3174 0.03752 26.7 San Antonio Bay 278 68 -96.4896 28.3257 0.03752 26.7 San Antonio Bay 278 97 -96.4993 28.3215 0.03752 26.7 San Antonio Bay 278 133 -96.4993 28.3174 0.03752 26.7 San Antonio Bay 279 49 -96.4826 28.3271 0.03752 26.7 San Antonio Bay 286 42 -96.5257 28.3118 0.03752 26.7 San Antonio Bay 286 107 -96.5188 28.3049 0.03752 26.7

Revision 1.1 June 19, 2012 Page 51 of 114
Table 9. B1.9. Sample design for a Tier 2 station, whether part of coastwide or bay-scale monitoring.
Parameter Indicator Analyzed by Data Flow Replicates
Seagrass coverage and species Coverage estimated and species identified within a 0.25 m2 quadrat
TPWD TPWD retains original field sheets
4
Seagrass canopy height Average of the longest leaf measured from five random shoots, by species. This is measured near the seagrass coverage quadrat for any seagrass species that has at least 20% coverage at that quadrat
TPWD TPWD retains original field sheets
4
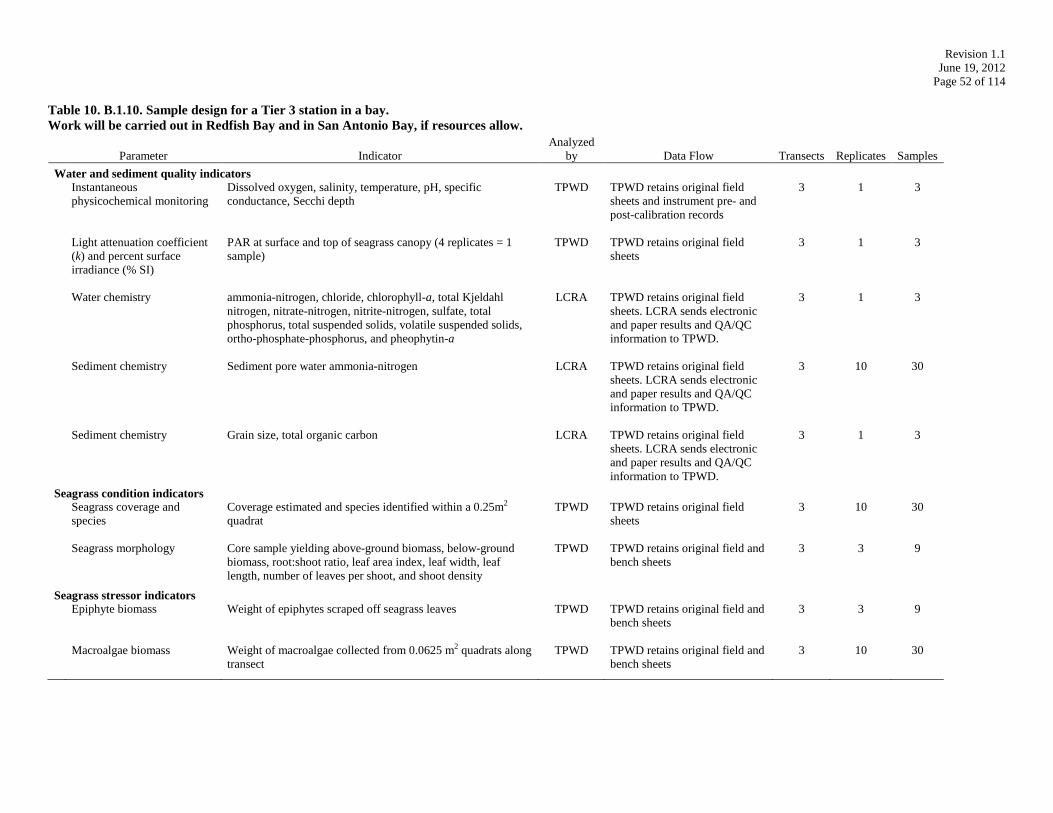
Revision 1.1 June 19, 2012 Page 52 of 114
Table 10. B.1.10. Sample design for a Tier 3 station in a bay. Work will be carried out in Redfish Bay and in San Antonio Bay, if resources allow.
Parameter Indicator Analyzed
by Data Flow Transects Replicates Samples Water and sediment quality indicators
Instantaneous physicochemical monitoring
Dissolved oxygen, salinity, temperature, pH, specific conductance, Secchi depth
TPWD TPWD retains original field sheets and instrument pre- and post-calibration records
3 1 3
Light attenuation coefficient (k) and percent surface irradiance (% SI)
PAR at surface and top of seagrass canopy (4 replicates = 1 sample)
TPWD TPWD retains original field sheets
3 1 3
Water chemistry ammonia-nitrogen, chloride, chlorophyll-a, total Kjeldahl nitrogen, nitrate-nitrogen, nitrite-nitrogen, sulfate, total phosphorus, total suspended solids, volatile suspended solids, ortho-phosphate-phosphorus, and pheophytin-a
LCRA TPWD retains original field sheets. LCRA sends electronic and paper results and QA/QC information to TPWD.
3 1 3
Sediment chemistry Sediment pore water ammonia-nitrogen LCRA TPWD retains original field sheets. LCRA sends electronic and paper results and QA/QC information to TPWD.
3 10 30
Sediment chemistry Grain size, total organic carbon LCRA TPWD retains original field sheets. LCRA sends electronic and paper results and QA/QC information to TPWD.
3 1 3
Seagrass condition indicators
Seagrass coverage and species
Coverage estimated and species identified within a 0.25m2 quadrat
TPWD TPWD retains original field sheets
3 10 30
Seagrass morphology Core sample yielding above-ground biomass, below-ground biomass, root:shoot ratio, leaf area index, leaf width, leaf length, number of leaves per shoot, and shoot density
TPWD TPWD retains original field and bench sheets
3 3 9
Seagrass stressor indicators
Epiphyte biomass Weight of epiphytes scraped off seagrass leaves TPWD TPWD retains original field and bench sheets
3 3 9
Macroalgae biomass Weight of macroalgae collected from 0.0625 m2 quadrats along transect
TPWD TPWD retains original field and bench sheets
3 10 30

Revision 1.1 June 19, 2012 Page 53 of 114
B2. Sampling Methods Tier 2 Tier 2 sampling will include measurement of seagrass coverage and canopy height. Procedures for conducting Tier 2 sampling are described in Tier 2 Sampling Standard Operating Procedures (Appendix B). Tier 3 Tier 3 sampling will include physicochemical, water chemistry, sediment chemistry, and seagrass condition and stressor indicators. Measurements and sample collection will occur near or on three 50 m transects which run through the seagrass bed in the area of interest. Transects encompass the deep edge of the seagrass bed, and identical measurements and sample collection will occur at each transect as detailed below. For each type of measurement, field staff will ensure that the site is not disturbed prior to sample collection. Measurements and sample collection for water chemistry, instantaneous physicochemical parameters, light, and Secchi depth will be made from the boat, near the deep end of each transect, before commencing biological and sediment measurements and sample collection (Figure 8, Figure 9). Tier 3 Field Sampling Procedures for Water and Sediment Quality Indicators Field sampling for water chemistry, Secchi depth, and physicochemical measurements will be conducted according to methods described in the TCEQ Surface Water Quality Monitoring Procedures Manual (Volume 1) (TCEQ 2008). A water sample will be collected at each transect (Figure 8) to be analyzed for the following parameters: ammonia-nitrogen, chloride, chlorophyll-a, total Kjeldahl nitrogen, nitrate-nitrogen, nitrite-nitrogen, sulfate, total phosphorus, total suspended solids, volatile suspended solids, ortho-phosphate-phosphorus, and pheophytin-a. High density polyethylene containers will be used to collect water for analysis. When acidification is required, the containers will be acidified with concentrated sulfuric acid in the field or a pre-acidified container will be used to reduce the pH to less than 2. The acidified container will be marked with an “X” on the cap, designating that it is chemically preserved. Each container will be labeled per TCEQ SWQM labeling guidelines and chain of custody (COC). All samples will be placed in coolers immediately for preservation at 4°C ±2° and transport to the analytical laboratories within holding times. Coolers will be kept at least half full of ice. Minimum sample volume, container types, preservation requirements, and holding time requirements may vary, depending on laboratory and field QA/QC measures. Typical requirements are given in Table 11.

Revision 1.1 June 19, 2012 Page 54 of 114
Table 11. B2.3. Typical water and sediment chemistry sample storage, preservation and handling requirements.
Dissolved oxygen, conductivity, salinity, pH and temperature will be measured in the field using pre- and post-calibrated datasondes. Secchi depth and total water depth will be measured at each transect. Photosynthetically-active radiation (PAR) will be measured at each transect in order to calculate percent surface irradiance (% SI) and light attenuation coefficient (k). Measurements will be made in air and in water using an LI-193SA spherical quantum sensor (LI-COR Inc., Lincoln, Nebraska, USA) according to a procedure modified from Dunton and Jackson (TPWD 2010). The measurement in air will be made first. The sensor (inspected to insure it is dry) will be
Parameter
Matrix
Container
Preservation
Minimum Volume
Holding Time
TSS/VSS
water
high density polyethylene
<6º C
1000 mL
7 days
ortho-Phosphate-phosphorus water high density
polyethylene
<6º C 100 mL
field filter <15 mins
after collection;
analyze within 48 hrs
Nitrate-nitrogen
water
high density polyethylene
<6º C
100mL
48 hrs
Nitrite- nitrogen
water
high density polyethylene
<6º C
100 mL
48 hrs
Ammonia-nitrogen, total
Kjeldahl nitrogen (TKN), total phosphorus, nitrate-nitrogen
plus nitrite-nitrogen
water high density polyethylene
<6º C, pH<2 with H2SO4
100 mL 28 days
Chlorophyll-a, pheophytin-a
water
high density polyethylene
<6º C, dark
500 mL
filter at lab < 48 hrs; filter
may be stored frozen up to
21 days
TOC
sediment Whirlpak
<6º C
100 g
28 days Grain size (texture) sediment Whirlpak <6º C 100 g 28 days
Pore water ammonia-nitrogen
sediment Whirlpak <6º C 60 mL 30 days frozen

Revision 1.1 June 19, 2012 Page 55 of 114
plugged into the LI-1400 data logger port programmed and labeled for “dry” (in air) measurement and positioned just above the water surface. Four PAR measurements will be sequentially read and recorded on the field form. Wet measurements will be made after completion of the dry measurements. The sensor will be moved to the data logger port programmed and labeled for “wet” (in water) measurement and lowered just below the surface. Four sequential measurements will be read and recorded. Then the sensor will be lowered until reaching the top of the seagrass canopy. Four sequential measurements will be read and recorded. Finally depth measurements will be made and recorded for each of the following: total water depth, distance from the surface of the water to the top of the seagrass canopy, and distance from the top of the seagrass canopy to the bay bottom. Potential sources of error in the measurement arise from taking data sequentially, rather than simultaneously, and from extraneous sources of reflected light, such as boats or clothing. Care will be taken to observe conditions such as clouds passing over the sun during the collection of PAR data, so that all measurements are taken under similar conditions. Care will be taken to avoid holding the sensor near sources of reflected light. Light attenuation coefficient (k) will be calculated using the transformed Beer Lambert equation: k = -[ln(Iz/I0)]/z where k is the attenuation coefficient (m-1) and Iz and I0 are irradiance (μmol photons m-2 s-1) at depth z (m) and at the surface, respectively. Percent surface irradiance available at the seagrass canopy will be calculated as follows: % SI = (Iz/I0) x 100 where Iz and I0 are irradiance (μmol photons m s-1) at depth z (m) and at the surface, respectively. Sediment will be collected at each transect for sediment pore water ammonia-nitrogen, grain size, and total organic carbon. One sample will be collected at each transect for grain size and total organic carbon. For sediment pore water ammonia-nitrogen, ten samples will be taken along, but about 5 m away from each transect line, to avoid disturbing the area where percent coverage is assessed. Each sediment pore water ammonia-nitrogen sample will be collected at the same pre-determined random distance along the transect line where the 0.25 m2 quadrats are placed for estimating seagrass percent cover. Samples will be collected separately using a 60 mL plastic syringe barrel. The syringe barrel is inserted straight down into the sediment with a twisting motion. Once the top of the barrel is within 1-3 cm of the bottom, the diver will seal the barrel with the palm of the hand to avoid loss of sample, and pull the corer up out of the bottom. The sediment core will then be dropped into a Whirlpak bag and placed on ice for transport to the lab. A single sediment sample for grain size analysis will be collected and preserved in the same manner, at the approximate mid-point of the transect line. In this case, two cores will be collected in order to have enough material for the lab to process the sample (>100 mL). A single

Revision 1.1 June 19, 2012 Page 56 of 114
sediment sample (one core) for total organic carbon will be collected and preserved in the same manner. Processes to Prevent Contamination Procedures outlined in the TCEQ Surface Water Quality Procedures Manual (Volume 1) describe the necessary steps to prevent contamination of samples. This includes direct collection into sample containers. Field QC samples (identified in Section B5) are collected to verify that contamination has not occurred. Tier 3 Field Procedures for Seagrass Condition and Stressor Indicators Seagrass condition and stressor indicators will be collected using protocols modified from those developed by Dunton and Jackson as cited in a previous seagrass study (TPWD 2010). Seagrass condition indicators include seagrass percent coverage by species, seagrass biomass (total, above-ground, and below-ground), root-to-shoot ratio, shoot density, number of leaves per shoot, leaf length, leaf width, and leaf area index. Seagrass stressor indicators include macroalgae biomass and epiphytic algal biomass. Tier 3 sample design consists of three 50 m transects which encompass the deep edge of the seagrass bed. Transects extend along the depth gradient to integrate differences in parameters that may be influenced by water depth. The transects will be temporarily marked with a PVC pole at each end, and a sinking meter tape stretched along the bottom between the two poles (the zero meter mark at the end nearest to shore). A floating line will be stretched between the two poles to assist in visualizing the location of the transect during sampling activities. The three transects will be located at least 50 m apart and will be selected to be representative of the seagrass bed in the area of interest. Ten pre-determined random locations along the transect line will be marked before beginning (Figure 8). At each of the ten locations, a 0.0625 m2 quadrat will be placed on the bottom along the sinking meter tape (Figure 9), and all macroalgal material within the quadrat will be collected, placed in a pre-labeled plastic bag, sealed, and then stored on ice for transport to the laboratory. Next, seagrass percent coverage by species will be estimated using a 0.25 m2 quadrat placed at each of the ten locations along the transect line. The 0.25 m2 quadrat area will be carefully cleared of macroalgae or other material which might obscure the view of the seagrass. A diver will examine the quadrat underwater to estimate percent coverage. Percent coverage is defined as the percent of the total quadrat area that is obscured by a particular species when viewed from directly above. The sum of percent coverage of all seagrass species, plus the percent of the quadrat that is bare, is 100%.

Revision 1.1 June 19, 2012 Page 57 of 114
Figure 8. B2.4. Schematic of field sampling design.

Revision 1.1 June 19, 2012 Page 58 of 114
Figure 9. B2.5. Close-up of field sampling design showing quadrat.
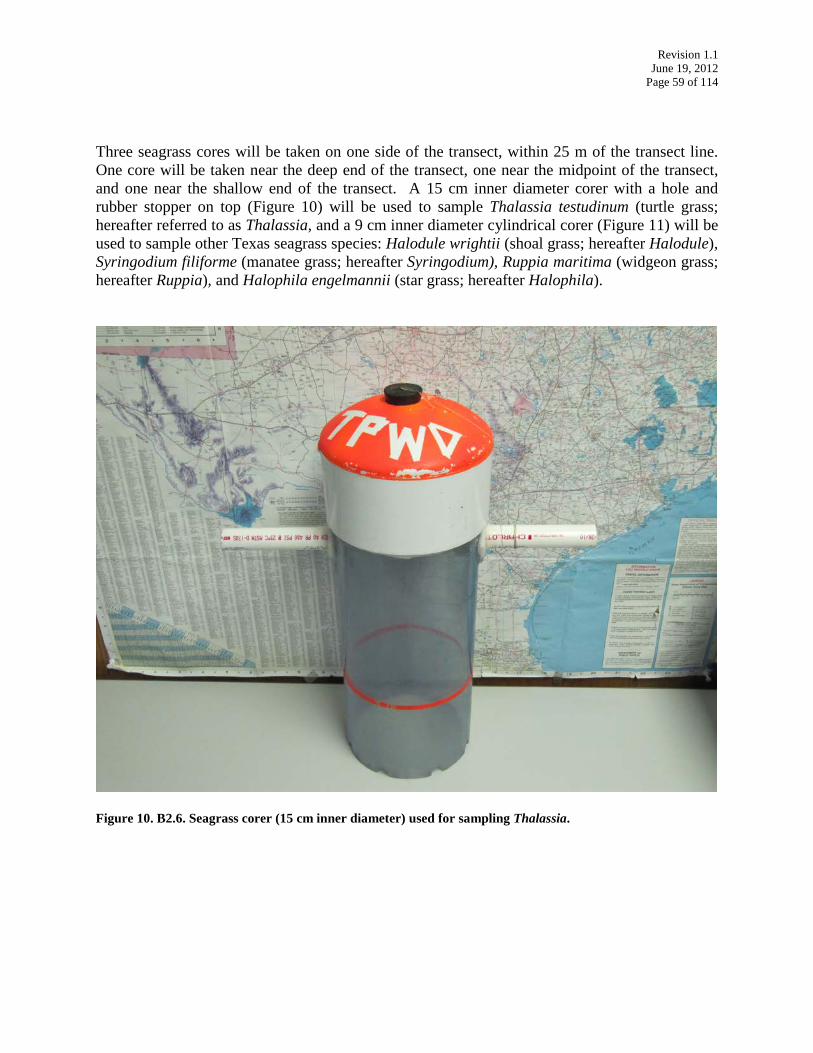
Revision 1.1 June 19, 2012 Page 59 of 114
Three seagrass cores will be taken on one side of the transect, within 25 m of the transect line. One core will be taken near the deep end of the transect, one near the midpoint of the transect, and one near the shallow end of the transect. A 15 cm inner diameter corer with a hole and rubber stopper on top (Figure 10) will be used to sample Thalassia testudinum (turtle grass; hereafter referred to as Thalassia, and a 9 cm inner diameter cylindrical corer (Figure 11) will be used to sample other Texas seagrass species: Halodule wrightii (shoal grass; hereafter Halodule), Syringodium filiforme (manatee grass; hereafter Syringodium), Ruppia maritima (widgeon grass; hereafter Ruppia), and Halophila engelmannii (star grass; hereafter Halophila).
Figure 10. B2.6. Seagrass corer (15 cm inner diameter) used for sampling Thalassia.

Revision 1.1 June 19, 2012 Page 60 of 114
Figure 11. B2.7. Seagrass corer (9 cm inner diameter) used for sampling Halodule, Syringodium, Ruppia and Halophila. For all species, the corer will be placed on the seabed. For Thalassia only, following placement of the large 15 cm corer on the seabed, the rubber stopper will be removed from the top of the corer. For all species, before pressing the corer into the sediment, the diver will feel carefully around the bottom of the corer to ensure that only seagrass belonging inside the radius of the corer is contained within. If seagrass from outside has been pulled under the corer, it will be removed. The diver will then press and twist the corer down into the sediment 10 to 15 cm. The stopper will be re-installed (15 cm corer only), and the corer rocked back and forth. The diver will then work one hand under the corer and remove it from the grass bed, making sure to keep a hand under the bottom to prevent loss of sample. After emptying material from the corer into the sieve, broken shoots will be removed since these will likely be exterior shoots cut by the corer tube. Samples will be placed in pre-labeled Ziploc bags on ice for transport to the lab. Seagrass shoot samples will be collected near the deep end, mid-point, and shallow end of each transect, within 25 m of the transect line, for measuring epiphyte biomass. Rhizomes will be gently uprooted and the number of shoots counted to ensure that sufficient material will be
Revision 1.1 June 19, 2012 Page 61 of 114
available in the lab. For Thalassia, at least ten shoots will be needed; for other seagrass species, at least 20 shoots will be needed. Documentation of Field Sampling Activities Field sampling activities are documented on field data sheets. The following will be recorded for all visits:
1. Station location (latitude and longitude in decimal degrees) 2. Location 3. Sampling time 4. Sampling date 5. Sampling depth 6. Field personnel names 7. Values for all measured field parameters 8. Detailed observational data, including:
a) water appearance b) weather c) days since last significant rainfall d) tide stage
9. Other observational data (as applicable), including: a) pertinent observations related to water quality or stream uses (e.g., exceptionally poor
water quality conditions/standards not met; uses such as swimming, boating, fishing, etc.)
b) unusual odors c) specific sample information (number of sediment grabs, type/number of fish in a
tissue sample, etc.) d) missing parameters (i.e., when a scheduled parameter or group of parameters is not
collected) e) algal blooms, fish kills, or pollution complaints
Recording Data For the purposes of this section and subsequent sections, all field and laboratory personnel follow the basic rules for recording information as documented below:
1. Legible writing in indelible ink with no modifications, write-overs or cross-outs; 2. Correction of errors with a single line followed by an initial and date; 3. Close-out on incomplete pages with an initialed and dated diagonal line.
Deviations from Sampling Method Requirements or Sample Design, and Corrective Action Examples of deviations from sampling method requirements or sample design include but are not limited to such things as inadequate sample volume due to spillage or container leaks, failure to preserve samples appropriately, contamination of a sample bottle during collection, storage temperature and holding time exceedance, sampling at the wrong site, etc. Any deviations will invalidate resulting data. Corrective action may include samples being discarded and if possible, re-collected.

Revision 1.1 June 19, 2012 Page 62 of 114
B3. Sample Handling and Custody
Water and Sediment Quality Indicators and Seagrass and Stressor Condition Indicators Chain-of-Custody Proper sample handling and custody procedures ensure the custody and integrity of samples beginning at the time of sampling and continuing through transport, sample receipt, preparation, and analysis. A sample is in custody if it is in actual physical possession or in a secured area that is restricted to authorized personnel. The chain-of-custody form is used to document sample handling during transfer from the field to the laboratory and among subcontract laboratories. The following information concerning the sample is recorded on the chain-of-custody form.
1. Date and time of collection 2. Site identification 3. Sample matrix 4. Number of containers 5. Preservative used or if the sample was filtered 6. Analyses required 7. Name of collector 8. Custody transfer signatures and dates and time of transfer 9. Bill of lading (if applicable)
Sample Labeling Samples are labeled on the container with an indelible marker. Label information includes:
1. Site identification 2. Date and time of sampling 3. Replicate number (if applicable) 4. Preservative added, if applicable 5. Designation of field-filtered, if applicable 6. Sample type
Sample Handling The samples will be transported or shipped to the designated laboratory within the required holding times for the various parameters being analyzed. The sample custody will be transferred to the laboratory custodian and the samples left there for analyses. Failures in Chain-of-Custody and Corrective Action Failures associated with chain-of-custody procedures are immediately reported to the TPWD Project Manager. These may include delays in transfer, resulting in holding time violations; violations of sample preservation requirements; incomplete documentation, including signatures; possible tampering of samples; broken or spilled samples, etc. The TPWD Project Manager, in consultation with the QAPO, will determine if the procedural violation may have compromised the validity of the resulting data and how the issue will be resolved based on best professional judgment. Possible courses of action include, document and proceed; redo the entire sampling

Revision 1.1 June 19, 2012 Page 63 of 114
event; or selectively analyze the samples. Corrective action documentation is maintained by the TPWD. B4. Analytical Methods
Water and Sediment Quality Indicators Laboratory analysis techniques will be in accordance with the most recently published edition of Standard Methods for the Examination of Water and Wastewater, 40 CFR 136, or other reliable procedures as described in this QAPP. Water and sediment chemistry samples will be analyzed by LCRA using methods described in Table 3. Standards Traceability All standards used in the field and laboratory are traceable to certified reference materials. Standards preparation is fully documented and maintained in a standards log book. Each documentation includes information concerning the standard identification, starting materials, including concentration, amount used and lot number; date prepared, expiration date and preparer’s initials/signature. The reagent bottle is labeled in a way that will trace the reagent back to preparation. Analytical Method Modification Only data generated using approved analytical methodologies as specified in this QAPP will be submitted to the TCEQ. Failures or Deviations in Analytical Method Requirements and Corrective Actions Failures in field and laboratory measurement systems involve, but are not limited to, instrument malfunctions, failures in calibration, blank contamination, QC sample problems (i.e., poor spike recoveries), etc. In many cases, the field technician or lab analyst will be able to correct the problem (i.e., via re-calibration or re-analysis). If the problem is resolvable by the field technician or lab analyst, then they will document the problem on the field data sheet or laboratory record and complete the analysis. If the problem is not resolvable, then it is conveyed to the respective supervisor, who will make the determination. If the analytical system failure compromises the sample results, the data will not be reported to the TCEQ as part of this study. The nature and disposition of the problem is documented on the data report which is sent to the TPWD Project Manager. Corrective action documentation is maintained by the TPWD. Seagrass Condition and Stressor Indicators Seagrass and macroalgae samples will be analyzed in the laboratory for shoot density, above- and below-ground biomass, root-to-shoot ratio (ratio of below-ground biomass to above-ground biomass), number of leaves per shoot, leaf width, leaf length leaf area index (product of shoot density, average leaf length, and average leaf width), epiphyte biomass, and macroalgae biomass as described below, following procedures developed by Dunton and Jackson as cited in a previous seagrass study (TPWD 2010).

Revision 1.1 June 19, 2012 Page 64 of 114
Macroalgae samples from each quadrat will be rinsed gently with tap water to clean. Rinsed samples will be placed into white lab sorting trays, and non-macroalgae material (seagrass, shells, sediment, etc.) will be removed (Figure 12). Samples will then be placed into a device designed to spin excess water from salad greens (Salad Spinner) and spun to drive off as much water as possible from the material. Samples will next be placed into pre-labeled aluminum foil envelopes for drying in the oven at 60°C. The top of the envelope will be left open to allow water vapor to escape.
Figure 12. B4.1. Close-up view of cleaned macroalgae in lab sorting tray. Seagrass core samples will be rinsed gently with tap water to clean. Samples will be placed into white lab sorting trays, and non-seagrass material and dead plant material will be removed (Figure 13). Individual shoots will be counted using tally counters to maintain accuracy (Figure 14, Figure 15). Five shoots selected at random will be further examined for the calculation of leaf area index. For each shoot the number of leaves per shoot will be recorded. The length (to the nearest 0.1 cm) and width (to the nearest 0.5 mm) of the longest leaf of each shoot will be recorded. Leaf width will be measured at the midpoint of the leaf (halfway between the base and the top). Shoots will then be processed along with the rest of the sample. Above-ground tissue (leaves, sheaths, any floral parts) will be separated from below-ground tissue (roots and rhizomes) by cutting the leaf at the point where the green color fades to white. Above-ground tissue will be carefully cleaned of attached biota (such as epiphytes, hydrozoans, and polychaete worms) by scraping with a wet cloth, forceps, scalpel, or razor blade. Above-ground tissue and below-ground tissue will then be placed in separate pre-labeled and pre-weighed aluminum foil

Revision 1.1 June 19, 2012 Page 65 of 114
envelopes for drying in the oven at 60°C. The top of the envelope will be left open to allow water vapor to escape.
Figure 13. B4.2. Processing seagrass core samples in lab.

Revision 1.1 June 19, 2012 Page 66 of 114
Figure 14. B4.3. Diagram illustrating typical seagrass plant morphology (University of Florida, 2011). For purposes of this project, the area labeled “blade” on the diagram will be consistently referred to as “leaf.”
Figure 15. B4.4. Seagrass core sample in lab sorting tray prepared for cleaning and counting shoots.

Revision 1.1 June 19, 2012 Page 67 of 114
For epiphyte biomass determinations, seagrass shoots must be processed within three days of collection. Epiphytes will be separated from the leaf surface by scraping with a scalpel, forceps, or razor blade. For Halodule, Syringodium, Ruppia or Halophila, at least twenty leaves of each sample (both sides of the leaf) will be scraped in this way. For Thalassia, a minimum of five leaves will be scraped. The same length is scraped on each leaf (e.g., 10 cm or 15 cm of each leaf is scraped). The length and width of the area scraped and the total number of leaves scraped will be recorded. Scraped material is collected on pre-weighed glass fiber filters. The collected epiphyte biomass sample and scraped seagrass leaves are then dried in separate pre-labeled aluminum foil envelopes in the oven at 60 °C. The top of the envelope will be left open to allow water vapor to escape. Analytical Method Modification Only data generated using approved analytical methodologies as specified in this QAPP will be submitted to the TCEQ. B5. Quality Control Water and Sediment Quality Indicators Field Measurement Quality Control Requirements and Acceptability Criteria The minimum Field QC Requirements are outlined in the TCEQ Surface Water Quality Monitoring Procedures Manual (Volume 1) (TCEQ 2008). Field instruments (for example, multi-parameter datasondes) will be calibrated against known standards, following the specified procedures, within 24-hours prior to sampling. Standards will not be used if they have expired (exceeded shelf life clearly labeled on standards container). If a field instrument does not pass pre-sampling calibration, it will not be used to collect data. Within 24 hours following sampling, field instruments will be checked against calibration standards to ensure that measurements are within required limits as specified in the TCEQ Surface Water Quality Monitoring Procedures Manual (Volume 1; TCEQ 2008). Data collected by instruments which do not meet the post-calibration check requirements will be flagged. Pre-sampling and post-sampling calibrations will be recorded. Irradiance values will be compared with other sensors calibrated against a National Bureau of Standards (NBS) standard. Mean values of irradiance measurements will be provided from replicate sample measurements. Field Split - A field split is a single sample subdivided by field staff immediately following collection and submitted to the laboratory as two separately identified samples according to procedures specified in the TCEQ Surface Water Quality Monitoring Procedures Manual (Volume 1) (TCEQ 2008). Split samples are preserved, handled, shipped, and analyzed identically and are used to assess variability in all of these processes. Field splits apply to conventional samples only and are collected on a 10% basis or one per batch, whichever is greater. The precision of field split results is calculated by relative percent difference (RPD) using the following equation:

Revision 1.1 June 19, 2012 Page 68 of 114
RPD = (X1-X2)/((X1+X2)/2))*100
A 30% RPD criteria will be used to screen field split results as a possible indicator of excessive variability in the collection and analytical system. If it is determined that meaningful quantities of constituent were measured and analytical variability can be eliminated as a factor, than variability in field split results will primarily be used as a trigger for discussion with field staff to ensure samples are being handled in the field correctly. Some sample results or batches of samples may be invalidated based on the examination of all extenuating information. Professional judgment during data validation will be relied upon to interpret the results and take appropriate action. Laboratory Measurement Quality Control Requirements and Acceptability Criteria Detailed laboratory QC requirements and corrective action procedures are contained within the individual laboratory procedures. Minimum requirements are stated below. Lab QC sample results are submitted with the laboratory data report. Limit of Quantitation (LOQ) - The laboratory will analyze a calibration standard (where applicable) at the LOQ concentration on each day samples are analyzed. All calibrations must meet the requirements of the analytical method or corrective action shall be implemented. LOQ Check Sample – An LOQ check sample consists of a sample matrix (e.g. deionized water, sand, commercially available tissue) free from the analytes of interest spiked with verified known amounts of analytes or a material containing known and verified amounts of analytes. It is used to establish intra-laboratory bias to assess the performance of the measurement system at the lower limits of analysis. The LOQ check sample is spiked into the sample matrix at a level less than or near the LoQ for each analyte for each batch of samples analyzed. The LOQ check sample is carried through the complete preparation and analytical process. LOQ check samples are run at a rate of one per analytical batch. The percent recovery of the check standard is calculated using the following equation in which %R is percent recovery, SR is the sample result, and SA is the reference concentration for the check standard:
%R = SR/SA * 100
Control limits are used to determine the acceptability of LOQ check sample analyses as specified in Table 3. LCS - A LCS consists of analyte-free water spiked with the analyte of interest prepared from standardized reference material. The LCS is spiked into laboratory-pure water at a level less than or equal to the mid-point of the calibration curve for each analyte. The LCS is carried through the complete preparation and analytical process. The LCS is used to document the bias of the analytical process. LCSs are run at a rate of one per batch. Results of LCSs are calculated by percent recovery (%R), which is defined as 100 times the measured concentration, divided by the true concentration of the spiked sample.

Revision 1.1 June 19, 2012 Page 69 of 114
The following formula is used to calculate percent recovery, where %R is percent recovery; SR is the measured result; SA is the true result
%R = SR/SA * 100
Performance limits and control charts are used to determine the acceptability of LCS analyses. Project control limits are specified in Table 3. Laboratory Duplicates - A laboratory duplicate is prepared in the laboratory by splitting aliquots of an LCS. Both samples are carried through the entire preparation and analytical process. LCS duplicates are used to assess precision and are performed at a rate of one per batch. For most parameters, precision is calculated by the relative percent difference (RPD) of LCS duplicate results as defined by 100 times the difference (range) of each duplicate set, divided by the average value (mean) of the set. For duplicate results, X1 and X2, the RPD is calculated from the following equation:
RPD = (X1 - X2)/{(X1+X2)/2} * 100
Matrix spike (MS) - A matrix spike is an aliquot of sample spiked with a known concentration of the analyte of interest. Percent recovery of the known concentration of added analyte is used to assess accuracy of the analytical process. The spiking occurs prior to sample preparation and analysis. Spiked samples are routinely prepared and analyzed at a rate of 10% of samples processed, or one per batch whichever is greater. The MS is spiked at a level less than or equal to the midpoint of the calibration or analysis range for each analyte. Percent recovery (%R) is defined as 100 times the observed concentration, minus the sample concentration, divided by the true concentration of the spike. The percent recovery of the matrix spike is calculated using the following equation in which %R is percent recovery, SSR is the observed spiked sample concentration, SR is the sample result, and SA is the reference concentration of the spike added:
%R = (SSR - SR)/SA * 100
MS recoveries are plotted on control charts and used to control analytical performance. Measurement performance specifications for matrix spikes are not specified in this document. Method blank - A method blank is an analyte-free matrix to which all reagents are added in the same volumes or proportions as used in the sample processing and analyzed with each batch. The method blank is carried through the complete sample preparation and analytical procedure. The method blank is used to document contamination from the analytical process. The analysis of method blanks should yield values less than the reporting limit. For very high-level analyses, the blank value should be less then 5% of the lowest value of the batch, or corrective action will be implemented.

Revision 1.1 June 19, 2012 Page 70 of 114
Additional method-specific QC requirements - Additional QC samples are run (e.g., sample duplicates, surrogates, internal standards, continuing calibration samples, interference check samples) as specified in the methods. The requirements for these samples, their acceptance criteria, and corrective actions are method-specific.
Failures in Field and Laboratory Quality Control and Corrective Action Sampling QC excursions are evaluated by the TPWD Project Manager, in consultation with the QAPO. Since differences in field duplicate sample results are used to assess the entire sampling process, including environmental variability, the automatic rejection of results based on control chart limits is not practical. Therefore, some professional judgment will be relied upon in evaluating results. Rejecting sample results based on wide variability is a possibility. Blank data are scrutinized very closely. Blank values exceeding the acceptability criteria may automatically invalidate the sample, especially in cases where high blank values may be indicative of contamination which may be causal in putting a value above the standard. Laboratory measurement quality control failures are evaluated by the laboratory staff. The disposition of such failures is discussed in Section B4 under “Failures or Deviations in Analytical Methods and Corrective Actions.” Corrective action documentation is maintained by the TPWD. Seagrass Condition and Stressor Indicators Mean values of seagrass condition (above- and below-ground biomass, shoot density, leaf width, leaf length, number of leaves per shoot), epiphyte biomass and macroalgae biomass measurements will be provided from replicate sample measurements. B6. Instrument/Equipment Testing, Inspection and Maintenance Field Equipment All sampling equipment testing and maintenance requirements are detailed in the TCEQ Surface Water Quality Monitoring Procedures Manual (Volume 1) (TCEQ 2008). Sampling equipment is inspected and tested upon receipt and is assured appropriate for use. Equipment is maintained in working condition. LCRA Laboratory All laboratory tools, gauges, instruments, and equipment testing and maintenance requirements are contained within laboratory QAM(s). Testing and maintenance records are maintained and are available for inspection. Instruments requiring daily or in-use testing include, but are not limited to, water baths, ovens, autoclaves, incubators, refrigerators, and laboratory pure water. Critical spare parts for essential equipment are maintained to prevent downtime. TPWD Laboratory Analytical balances will be calibrated annually using standard weights. Oven thermometers will be checked annually using a NIST traceable thermometer.

Revision 1.1 June 19, 2012 Page 71 of 114
B7. Instrument Calibration and Frequency Field Equipment Field equipment calibration requirements are contained in the TCEQ Surface Water Quality Monitoring Procedures Manual (Volume 1) (TCEQ 2008). Instruments not meeting post-calibration error limit requirements invalidate associated data. LI-COR light sensors are re-calibrated periodically to within ± 5% of NBS standards by LI-COR, Inc. LCRA Laboratory Detailed laboratory calibrations are contained within the QAM(s). The laboratory QAM identifies all tools, gauges, instruments, and other sampling, measuring, and test equipment used for data collection activities affecting quality that must be controlled and, at specified periods, calibrated to maintain bias within specified limits. Calibration records are maintained, are traceable to the instrument, and are available for inspection. Equipment requiring periodic calibrations include, but are not limited to, thermometers, pH meters, balances, incubators, turbidity meters, and analytical instruments. Calibration records are available for review. TPWD Laboratory Analytical balances are calibrated periodically using standard weights. B8. Inspection/Acceptance of Supplies and Consumables TPWD evaluates items and services received from suppliers upon delivery. These evaluations are based on defined acceptance criteria such as task specifications, product specifications, technical requirements, and quality requirements. The Project Manager or designee determines whether a product or service meets the established acceptance criteria. TPWD will not use items or services that do not meet acceptance criteria. Corrective actions may range from repair or replacement of defective deliverables to re-award of procurements. State statutes, contract provisions, and TPWD Procurement procedures are the basis for initiating corrective actions. B9. Non-Direct Measurements
No non-direct measurement sources will be required for this project. B10. Data Management Data collected by field staff will be recorded on field data sheets. Field data sheets will be scanned and stored electronically on the TPWD network, and backed up on a second drive on or other electronic medium such as a compact disk or DVD. Laboratory bench sheets will be scanned and stored in the same manner as field data sheets. Electronic data provided by LCRA

Revision 1.1 June 19, 2012 Page 72 of 114
will be stored on the TPWD network and backed up on a second drive or other electronic medium. Original data sheet and electronic files will be maintained at the office of the Project Manager in Austin. The TPWD QAPO will validate data and verify that it meets quality requirements as set forth in this QAPP. Any data deemed unacceptable as set forth in this QAPP will not be used. The TPWD Project Manager/Data Manager will maintain data in a Microsoft Access database in Austin, and will report data to TCEQ at the end of the project in Microsoft Excel format, or other format agreed upon between the TPWD Project Manager and the TCEQ Project Manager. TPWD will upload data to EPA’s Water Quality Exchange as resources allow. Data Flow Water and Sediment Quality Indicators and Seagrass Condition and Stressor Indicators LCRA or Project Staff TPWD Project Manager/Data Manager and QAPO Data Manager (data entry) QAPO (data entry QA review) TPWD Project ManagerTCEQ Project Manager Data Errors and Loss Data collectors have primary responsibility for ensuring that any errors in data are corrected or reported as a non-compliance or deficiency at the time of collection. Screening of data for completeness occurs at each step in the data flow process, and incomplete data (such as a date, or time, collector’s name) is recovered as quickly as possible. If error or loss renders data unsuitable for use, a record will be made of the non-compliance or deficiency and the circumstances surrounding this occurrence. Record Keeping and Data Storage Original TPWD data sheets, laboratory bench sheets, and hard-copy printouts, as well as back-up electronic files, will be maintained in the office of the Project Manager in Austin. The Project Manager will enter data into a Microsoft Access database. Electronic files will be backed up on CDs, DVDs, flash drives, or a common network drive. All records will be maintained for a minimum of 5 years from date of collection. Data Handling, Hardware, and Software Requirements All specifications for computer hardware and software selected for TPWD’s environmental programs are consistent with agency standards for performing all functions required to calculate, handle and otherwise manipulate data and produce reports, through time-tested applications. C1. Assessment and Response Actions
The following table presents the types of assessments and response actions for data collection activities applicable to the QAPP.

Revision 1.1 June 19, 2012 Page 73 of 114
Table 12. C1.1. Assessments and response requirements.
Assessment Activity
Approximate
Schedule
Responsible
Party
Scope
Response
Requirements Status Monitoring Oversight, etc.
Continuous
TPWD—all project staff
Monitoring of the project status and records to ensure requirements are being fulfilled
Update project group periodically
Annual Project Report
Once per year TPWD Project manager
Brief description of pertinent aspects of the project including status, quality assessments performed, and any quality problems encountered.
Together with other annual quality meeting participants, determine what, if any, response actions are necessary
Corrective Action The TPWD Project Manager is responsible for implementing and tracking corrective action procedures as a result of audit findings. C2. Reports to Management
The Project Manager will submit the QAPP, including any revisions of the QAPP, to the TCEQ Project Manager. The Project Manager will also submit quarterly progress reports and a final report to the TCEQ Project Manager, as required by contract. D1. Data Review Verification and Validation All field and laboratory data will be reviewed and verified for integrity and continuity, reasonableness, and conformance to project requirements, and then validated against the data quality objectives, which are listed in Section A7. Only those data, which are supported by appropriate quality control data and meet the data quality objectives defined for this project, will be considered acceptable. D2. Verification and Validation Methods
Data will be reviewed, verified and validated to ensure they conform to project specifications and meet the conditions of end use as described in Section A7 of this document. Data review, verification, and validation will be performed using self-assessments and peer and management review as appropriate to the project task. The information to be reviewed, verified,

Revision 1.1 June 19, 2012 Page 74 of 114
and validated as appropriate (listed by task and responsible party in Table 13) is evaluated against technical and project specifications and checked for errors, especially errors in calculations, data reduction, and transcription. Potential errors are identified by examination of documentation and by manual or computer-assisted examination of corollary or unreasonable data. If a question arises or an error is identified, the manager of the task responsible for generating the data is contacted to resolve the issue. Issues which can be corrected are corrected and documented. If an issue cannot be corrected, the task manager consults with higher-level project management to establish the appropriate course of action, or the data associated with the issue are rejected. Reviews, verifications, and validations will be documented. Data validation tasks to be addressed by project staff include, but are not limited to, the confirmation of data review, evaluation of field QC results, additional evaluation of anomalies and outliers, analysis of sampling and analytical gaps, and confirmation that all parameters and sampling sites are included in the QAPP. Any suspected errors or anomalous data must be addressed by the manager of the task associated with the data before data validation can be completed. The TPWD Project Manager validates that the data meet the data quality objectives of the project.

Revision 1.1 June 19, 2012 Page 75 of 114
Table 13. D2.1. Data review, verification, and validation tasks. Data to be Verified
Field Task
Vendor or Lab Task
Project Manager
and/or QAPO Field documentation complete √
Instrument calibration data complete √ √
Holding times not exceeded √ √
Sample preservation and handling acceptable √ √
Standards and reagents traceable √ √
Analytical sensitivity consistent with QAPP
√ √
Laboratory bench-level review performed
√
QC samples analyzed at required frequencies √ √ √ QC results meet performance and program specifications
√ √ √
Collection, preparation and analysis techniques consistent with SOPs and QAPP
√ √ √
Valid parameter codes
√
Results, calculations, transcriptions checked
√ √
Corollary data agree √ √ √ Nonconforming occurrences documented √ √ √ Reasonableness check performed
√
Completeness and accuracy of the data sets will be verified
√
D3. Reconciliation with User Requirements Data produced in this project will be analyzed and reconciled with project data quality requirements. Data meeting project requirements will be used by the TPWD for resource management and protection purposes and submitted to the TCEQ.

Revision 1.1 June 19, 2012 Page 76 of 114
References Dunton, K., W. Pulich, et al. 2011. A seagrass monitoring program for Texas coastal waters:
multiscale integration of landscape features with plant and water quality indicators. Draft report delivered under contract #0627 to the Coastal Bend Bays and Estuaries Program. Corpus Christi, Texas.
Dunton, K.H., A.L. Kopecky, and D. Maidment. 2005. Monitoring Design Criteria and
Biological Indicators for Seagrass Conservation in Texas Coastal Waters. Environmental Protection Agency Regional Environmental Monitoring and Assessment Program. Draft Final Report for Contract No. 829513010.
Dunton, K.H. and W. M. Pulich, Jr. 2007. Landscape Monitoring and Biological Indicators for
Seagrass Conservation in Texas Coastal Waters. Draft final report for contract #0627, Coastal Bend Bays and Estuaries Program, Corpus Christi, Texas.
Fourqurean, J. W., M. J. Durako, et al. 2002. Seagrass distribution in South Florida: a multi-
agency coordinated monitoring program. In The Everglades, Florida Bay, and Coral Reefs of the Florida Keys: An Ecosystem Sourcebook. J. W. Porter and K. G. Porter, eds. Boca Raton, CRC Press: 497-522.
Neckles, H. A., B. S. Kopp, et al. 2012. Integrating Scales of Seagrass Monitoring to Meet
Conservation Needs. Estuaries and Coasts 35:23-46. TCEQ. 2008. Surface Water Quality Monitoring Procedures, Volume 1: Physical and Chemical
Monitoring Methods for Water, Sediment, and Tissue. Surface Water Quality Monitoring Program, Monitoring and Operations Division, Texas Commission on Environmental Quality, Austin, Texas. Report #RG-415.
TCEQ. 2010. Texas Surface Water Quality Standards, 30 TAC 307. Texas Commission on
Environmental Quality. Austin, Texas. TCEQ. 2011. Texas Seagrass Monitoring Protocol Development Quality Assurance Plan. Texas
Commission on Environmental Quality. Austin, Texas. TPWD. 1999. Seagrass Conservation Plan for Texas. Texas Parks and Wildlife Department,
Austin, Texas. TPWD. 2003. Texas Seagrass Monitoring Program Strategic Plan. Texas Parks and Wildlife
Department, Austin, Texas. Accessed on 22 Jun 2012 at http://www.tpwd.state.tx.us/landwater/water/habitats/seagrass/monitoring.phtml.
TPWD. 2010. Seagrass Response to Wastewater Inputs: Implementation of a Seagrass
Monitoring Program in Two Texas Estuaries, Quality Assurance Project Plan. Texas Parks and Wildlife Department, Austin, Texas. Accessed on 6 Jan 2012 at

Revision 1.1 June 19, 2012 Page 77 of 114
http://www.tpwd.state.tx.us/landwater/water/environconcerns/water_quality/QualityAssurance/QAPP%20rev%202%202010.pdf.
University of Florida. 2011. Diagram of Seagrass Parts. Florida Medical Entomology
Laboratory, University of Florida, Gainesville. Accessed 27 Jan 2011 at http://fmel.ifas.ufl.edu/habitat/seagrass_parts.shtml.

Revision 1.1 June 19, 2012 Page 78 of 114
Appendix A – Sample Size Analysis for Statewide Seagrass Monitoring

Revision 1.1 June 19, 2012 Page 79 of 114
Sample Size Analysis for Statewide Seagrass Monitoring
Mark Fisher, Ph.D. Tier-2 seagrass monitoring, as recommended in Dunton et al. (2011), utilizes fixed stations to be sampled annually as a single-factor repeated-measures design. Seagrass parameters are measured and recorded as the dependent variable, with time as the treatment. Each station will be sampled a repeated number of times during the course of the project, currently recommended at once per year at the same time each year. Data will be statistically analyzed to monitor change over time. The advantage of this design is in its statistical power and efficiency. The number of stations required is a fraction of the number that would be required for a simple one-way design with randomly-selected stations (Vickers 2003). Specifically, this is because the within-station variance of repeated measures is typically lower than the between-station variance of a simple one-way design. The error variance associated with the treatment is smaller in the cast of repeated measures than that expected in a design using independent samples. Lower variance requires fewer samples to detect a treatment effect. The disadvantage of this design is that it complicates the analysis of the data. Repeated-measures designs are more sensitive to violations in the model assumptions (e.g., normality, homogeneity of variance between transects and covariance within transects) (Littell 2006). Also, the repeated-measures design must be accounted for in the analysis in order to use the appropriate error term and degrees of freedom. If these data are analyzed as if they were from a simple one-way design, for example, then the probability of a Type II error (falsely accepting there has been no change in the measured parameters) is increased. Sample size analysis is essential to ensure good study design. Too few samples diminish the usefulness of the results, while too many samples are a waste of resources. This can be a difficult decision, as there is often not enough information to determine the optimum number of samples. Also, different parameters may have different optimal samples sizes, and their conflicting requirements will need to be reconciled and compromised (Kish 1965). Sample size requirements are dependent upon 4 factors: 1) variance of the parameters of interest, 2) effect size, 3) power, and 4) significance level (Quinn and Keough 2002). Of these, effect size, power and significance level are within direct control of the researcher, while variance is a property of the parameter of interest and is not directly controlled. However, a good study design can reduce the variability of samples.
Sample sizes are proportional to the variance between samples, where a population that is highly variable will require more samples than one that exhibits less variability to achieve the same level of precision. Precision is always dependent upon the sample size, with a large sample size producing estimates with greater precision than one with a smaller number of samples (Cohen 1988).

Revision 1.1 June 19, 2012 Page 80 of 114
The effect size, or how large of a change we wish to detect, can be the most difficult step in a sample size analysis (Quinn and Keough 2002). The effect size is selected based on biological significance, where we want the study to identify a change in the seagrass population that is important to assess their overall condition. Often, there are no clear criteria for specifying a significant biological effect. A large effect requires fewer samples to detect than a small effect.
Power is the probability to detect a significant difference, if it exists. Power can be used a priori to design a sampling program in two ways—to determine a sample size with a given effect size, or to determine the effect size with a given sample size. By convention, power is set to a value of 1 - β = 0.8 (Cohen 1988). Low power increases the probability of rejecting a false null hypothesis, i.e., a Type II error or a false negative. Power increases with an increase in sample size.
Finally, significance level, set by convention to α = 0.05, is the probability of rejecting a true null hypothesis, i.e., a Type I error or a false positive. If α is set to a smaller value, then power will decrease, unless the sample size is increased. Similarly, if the significance level is set to a low value and power is increased, then the required sample size becomes very large. The convention of α = 0.05 and 1 - β = 0.8 is a balance between Type I errors and Type II errors, where Type I errors (false positives) are more serious and should be more stringently guarded against than Type II errors (false negatives) (Cohen 1988).
I based sample size requirements for tier-2 monitoring on the 2010 statewide Phase 1 seagrass survey results conducted by TCEQ and the TPWD CMPSEA seagrass survey in Port Bay and East Flats conducted by Contreras et al. (2011). Summary results for number of blades/plant, blade width and length of longest blade are presented in Table 1. The coefficient of variation (CV), which is the standard deviation as a percentage of the mean, allows comparison of the standard deviations from different species and surveys with different mean values.
The efficiency of the repeated-measures design is dependent upon the within-station correlation between successive measurements; a high correlation results in a small within-station variance, where a zero correlation results in a within-station variance that is equal to the between station variance with no efficiency gain (Keppel 1973). Neither the statewide nor the CMPSEA survey results could provide information on the annual within-station correlation of seagrass parameters.
A plot of power versus sample size for the number of blades/plant is shown in Figure 1. I used the CMPSEA values for Halodule, as the CV was among the highest observed; I discounted the values for Ruppia because of the extreme differences between the two surveys and the low number of observations. I also discounted values for Syringodium, as blades counts were either 1’s or 2’s. For correlation, I assumed a range of 0.4—0.7 and calculated the sample size needed for a paired t-test (same result as a single-factor repeated-measures design with only 2 measurements, i.e., a before/after design). Mean differences of 0.12, 0.25, 0.50 and 0.75 correspond to 5%, 10%, 20% and 30% changes. A sample size of n = 50 would be adequate to detect a 10% change in the number of blades/plant. A plot of power versus sample size for mean blade width is shown in Figure 2. I used the statewide value for Thalassia, as the CV was this highest observed. All values for Ruppia were

Revision 1.1 June 19, 2012 Page 81 of 114
1 mm and exhibited zero variability in both surveys. For correlation, I assumed a range of 0.4—0.7 and calculated the sample size needed for a paired t-test (same result as a single-factor repeated-measures design with only 2 measurements, i.e., a before/after design). Mean differences of 0.29, 0.58, 1.16 and 1.74 correspond to 5%, 10%, 20% and 30% changes. A sample size of n = 40 would be sufficient to detect a 10% change in the mean blade width. A plot of power versus sample size for longest blade length is shown in Figure 3. I used the statewide value for Thalassia, as the CV was the second-highest observed. Ruppia exhibited the highest CV, but I discounted this result because of the low number of observations (n=8). For correlation, I assumed a range of 0.4—0.7 and calculated the sample size needed for a paired t-test (same result as a single-factor repeated-measures design with only 2 measurements, i.e., a before/after design). Mean differences of 0.6, 1.2, 2.4 and 3.6 correspond to 5%, 10%, 15% and 20% changes. A sample size of n = 50 would be sufficient to detect a 20% change in the longest blade length.
A plot of power versus sample size for species composition is shown in Figure 4. Variances for proportions are dependent upon the mean and is highest at p=0.5 (Cochran 1977). I used this value for sample size estimates. For correlation, I assumed a range of 0.4—0.7 and calculated the sample size needed for McNemar’s correlated proportions (same result as a single-factor repeated-measures design with only 2 measurements, i.e., a before/after design). A sample size of n = 50 would be sufficient to detect a 20% change in the species composition.
A sample size of 50 coastwide stations would be adequate to detect a 10% change in blades/plant and mean blade width, and a 20% change in the longest blade length and in species composition. References Cochran, W. 1977. Sampling Techniques. John Wiley and Sons, New York. 3rd edition. 428
pp. Cohen, J. 1988. Statistical Power Analysis for the Behavioral Sciences. LEA Publishers,
Hillsdale NJ. 2nd edition. 567 pp. Contreras, C., A. Whisenant, J.M. Bronson, and P.R. Radloff. 2011. Seagrass Response to
Wastewater Inputs: Implementation of a Seagrass Monitoring Program in Two Texas Estuaries, Final Report. Texas Parks and Wildlife Department, Austin, Texas. Accessed on 2/13/2012 at http://www.tpwd.state.tx.us/publications/pwdpubs/media/pwd_rp_v3400_1690.pdf
Dunton, K, W. Pulich and T. Mutchler. 2011. A seagrass monitoring program for Texas waters.
Final Report, Contract 0627. Coastal Bend Bays and Estuaries Program, Corpus Christi TX. 39 pp.
Keppel, G. 1973. Design and Analysis: A Researcher’s Handbook. Prentice-Hall, Inc.,
Englewood Cliffs NJ. 719 pp.

Revision 1.1 June 19, 2012 Page 82 of 114
Kish, L. 1965. Survey Sampling. John Wiley and Sons, New York. 643 pp. Littell, R.C., G. Milliken, W. Stroup, R. Wolfinger and O. Schabenberger. 20066. SAS System
for Mixed Models, Second Edition. SAS Institute, Cary NC. 814 pp. Quinn, G. and M. Keough. 2002. Experimental Design and Data Analysis for Biologists.
Cambridge University Press, New York. 537 pp. Vickers, A.J. 2003. How many repeated measures in repeated measures designs? Statistical
issues for comparative trials. BMC Medical Record Methodology 3:22-30.
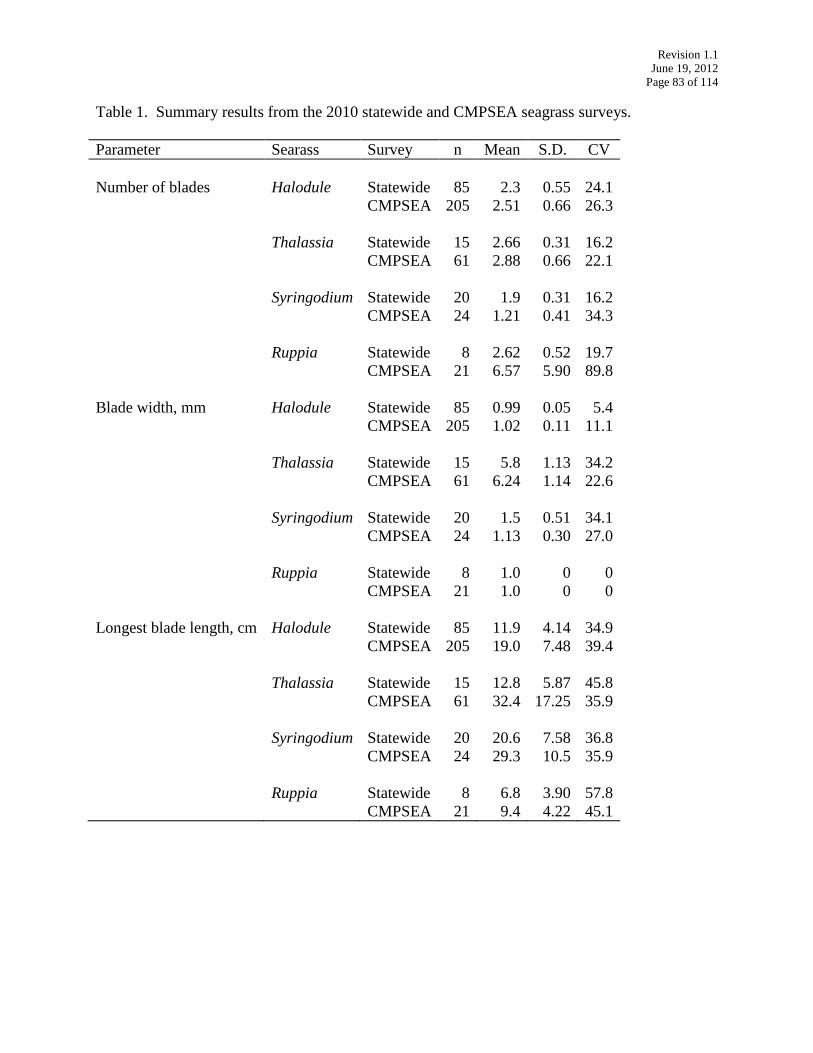
Revision 1.1 June 19, 2012 Page 83 of 114
Table 1. Summary results from the 2010 statewide and CMPSEA seagrass surveys. Parameter Searass Survey n Mean S.D. CV Number of blades Halodule Statewide 85 2.3 0.55 24.1 CMPSEA 205 2.51 0.66 26.3 Thalassia Statewide 15 2.66 0.31 16.2 CMPSEA 61 2.88 0.66 22.1 Syringodium Statewide 20 1.9 0.31 16.2 CMPSEA 24 1.21 0.41 34.3 Ruppia Statewide 8 2.62 0.52 19.7 CMPSEA 21 6.57 5.90 89.8 Blade width, mm Halodule Statewide 85 0.99 0.05 5.4 CMPSEA 205 1.02 0.11 11.1 Thalassia Statewide 15 5.8 1.13 34.2 CMPSEA 61 6.24 1.14 22.6 Syringodium Statewide 20 1.5 0.51 34.1 CMPSEA 24 1.13 0.30 27.0 Ruppia Statewide 8 1.0 0 0 CMPSEA 21 1.0 0 0 Longest blade length, cm Halodule Statewide 85 11.9 4.14 34.9 CMPSEA 205 19.0 7.48 39.4 Thalassia Statewide 15 12.8 5.87 45.8 CMPSEA 61 32.4 17.25 35.9 Syringodium Statewide 20 20.6 7.58 36.8 CMPSEA 24 29.3 10.5 35.9 Ruppia Statewide 8 6.8 3.90 57.8 CMPSEA 21 9.4 4.22 45.1

Revision 1.1 June 19, 2012 Page 84 of 114
Figure 1. Sample size vs power for mean differences in the number of blades/plant of 0.14 (5%), 0.28 (10%), 0.56 (20%) and 0.84 (30%). The reference line of power = 0.8 is the convention used.
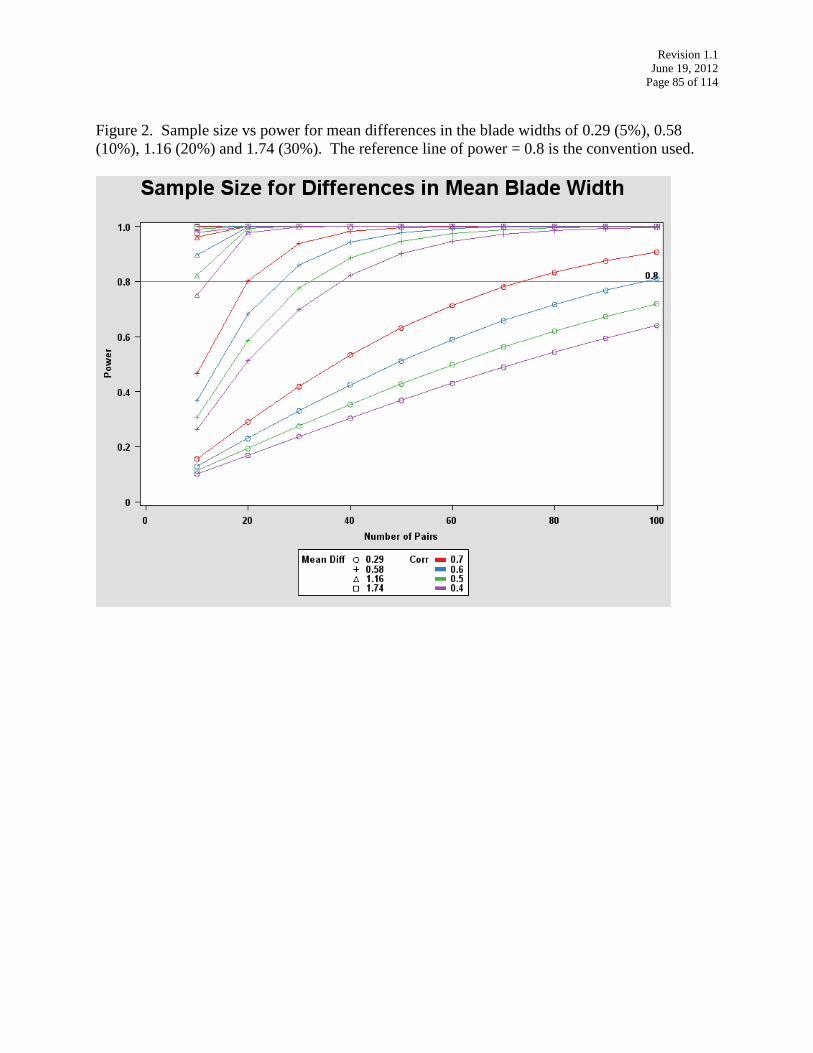
Revision 1.1 June 19, 2012 Page 85 of 114
Figure 2. Sample size vs power for mean differences in the blade widths of 0.29 (5%), 0.58 (10%), 1.16 (20%) and 1.74 (30%). The reference line of power = 0.8 is the convention used.

Revision 1.1 June 19, 2012 Page 86 of 114
Figure 3. Sample size vs power for mean differences in the longest blade length of 0.6 (5%), 1.2 (10%), 2.4 (20%) and 3.6 (30%). The reference line of power = 0.8 is the convention used.

Revision 1.1 June 19, 2012 Page 87 of 114
Figure 4. Sample size vs power for mean differences in the percent composition of seagrasses. The reference line of power = 0.8 is the convention used.

Revision 1.1 June 19, 2012 Page 88 of 114
Appendix B – Tier 2 Sampling Standard Operating Procedures

Revision 1.1 June 19, 2012 Page 89 of 114
Statewide Seagrass Monitoring Protocol Development Phase 2
Tier 2 Sampling Standard Operating Procedures
June 2012
Version 1.1

Revision 1.1 June 19, 2012 Page 90 of 114
Introduction The Statewide Seagrass Monitoring Protocol Development project uses a tiered approach to collecting seagrass condition information. Tier 2 seagrass sampling involves a short list of basic seagrass condition parameters collected over a specified area. This project will conduct Tier 2 sampling in Redfish Bay and along the Texas coast where seagrass is known to grow. If resources allow, sampling will also be conducted in San Antonio Bay. This document describes how to complete the required measures for Tier 2 sampling. Additional details for the tiered approach, project design, principal staff, sampling period and sample sites can be found in the project’s Quality Assurance Project Plan (QAPP). Sample period Tier 2 sampling period is August 1 – October 31, with most of the sampling occurring between August 1 and September 15. Sample sites Two areas will be sampled:
1. Coastwide - area in Texas where seagrass is known to occur 2. Redfish Bay
An additional area may be sampled: 1. San Antonio Bay
Sampling design Each area has 50 randomly-selected coordinate sets (Appendix B - Table 1, Appendix B - Table 2, and Appendix B - Table 3) including extra sets of coordinates to use if some locations are unsuitable for monitoring. This is due to the limitations of the seagrass coverage maps that are currently available and that were used to generate the sampling coordinates. For each area, 50 coordinate sets will be established as permanent stations and be sampled for percent seagrass coverage by species and canopy height. The coastwide sampling includes an additional 14 stations (Appendix B - Table 4) previously monitored by TCEQ and TPWD for a total of 64 stations. The pre-selected coordinates were generated using the TPWD Coastal Fisheries sampling grid system and the grid system will also be used to help establish permanent sampling stations. Each pre-selected coordinate set has been assigned a unique ID and is coupled with the TPWD grid and gridlet numbers. Field work preparations Prior to conducting field work, establish seagrass monitoring teams, prioritize coordinate sets, and prepare field equipment. Establish seagrass monitoring teams Seagrass monitoring teams should be established at least one month before sampling.

Revision 1.1 June 19, 2012 Page 91 of 114
1. Coastwide Team(s) – Responsible for monitoring 50 permanent stations and 14 previously sampled stations. Coordination between teams working different areas will facilitate sampling efficiency.
2. Redfish Bay Team – Responsible for monitoring 50 permanent stations. May be able to sample the additional Coastwide stations that fall within Redfish Bay.
3. San Antonio Bay Team - Responsible for monitoring 50 permanent stations. May be able to sample the additional Coastwide stations that fall within San Antonio Bay.
Prioritize pre-selected coordinates Permanent sampling stations will be established from the list of coordinate sets. To aid in establishing permanent sampling stations, seagrass monitoring teams will need to prioritize the pre-selected coordinates by presence of seagrass near the coordinates, ability to navigate by boat to the coordinates, and ability to safely sample near the coordinates. At least one month prior to sampling, conduct a table top exercise with staff knowledgeable of each area to prioritize pre-selected sampling coordinates and eliminate coordinates that are known to be absent of seagrass, inaccessible by boat or unsafe. The first 50 coordinates will be given priority, and be designated as “priority coordinate sets.” Remaining coordinates that have not been eliminated for reasons just described will be designated as “alternative coordinate sets.” The alternative coordinate sets will be used when priority coordinate sets cannot be sampled. Additional pre-field work preparations Seagrass monitoring teams are responsible for preparing the field equipment and coordinating field work activities:
• Plan boat route to priority coordinate sets with priority given to navigation efficiency, time, and safety
• Use the grid system to identify priority and alternative coordinates that are in close proximity
• Prepare a list of priority coordinates – sorted by TPWD grid • Prepare a list of alternative coordinates – sorted by TPWD grid • Prepare maps with pre-selected coordinates labeled as priority or alternative • Load pre-selected coordinates in handheld GPS units • Identify boats for each team • Assemble equipment - see equipment list • Monitor weather
Field work steps Establish permanent sampling stations Navigate to pre-selected coordinates Navigate to a priority coordinate set using a handheld GPS and maps with coordinate locations. Use the navigation function on the GPS to give the distance and direction to the selected coordinate set. Navigate to within 4 m (approximate accuracy for GPS) of the selected

Revision 1.1 June 19, 2012 Page 92 of 114
coordinate set. If you cannot get to within 4 m due to a safety hazard or errors associated with the GPS, navigating to within 10 m of the coordinate set is allowed. Validate pre-selected coordinates Each priority coordinate set must first be validated before establishing a permanent sampling station. This process is intended to ensure that the permanent sampling stations are located within seagrass beds, accessible by boat and are safe to sample. Validate priority coordinate sets by conducting a preliminary survey. Coordinates are valid if:
• Visual observation suggests that seagrass coverage is relatively uniform in the sampling area, defined as a circle of radius 10 m around the boat (Appendix B - Figure 1).
• Visual observation indicates that seagrass is present at 50% coverage or more in the sampling area.
• There are no safety hazards or other considerations that would prohibit safe, effective seagrass sampling around the coordinates; for example, the coordinate set would be unsafe if it was within a narrow boat lane.
To ensure that the area contains 50% seagrass coverage or more and that seagrass coverage is relatively uniform within the sampling area, you may use a rake to sample the bottom, a viewing scope, or any other method as required by the location conditions (water depth and clarity). If the priority coordinate set is validated using the criteria above, proceed to establish a permanent sampling station as described below. If the priority coordinate set does not meet the validation criteria, note the reasons why on the field data form and identify an alternative coordinate set as described in the next section. Note: the 14 previously sampled stations (Appendix B - Table 4) have already been validated. Identify an alternative coordinate set If a priority coordinate set does not meet the validation criteria, navigate to an alternative coordinate set in the TPWD grid you are in or one nearby. Determine if the alternative coordinate set meets the validation criteria described above. If the alternative coordinate set meets the validation criteria, make note of it on the field data form and establish a permanent sampling station to replace the invalid priority coordinate set. If no nearby alternative coordinate set can be validated, proceed to the next priority coordinate set. While navigating to the next priority coordinate set, continue to look for additional alternative coordinate sets. This process may have to be repeated several times until all of the invalid priority coordinate sets are replaced with alternative coordinate sets. In some circumstances, this may also require backtracking to areas already sampled to identify alternative coordinate sets.

Revision 1.1 June 19, 2012 Page 93 of 114
Establish a permanent sampling station After a coordinate set is validated or when you arrive at one of the 14 existing stations, secure the location by anchoring (anchor, power pole, push pole, etc.) the boat (Appendix B - Figure 1). Maintain the boat in a single location and record the GPS position and Coordinate ID on the field data sheet and create a waypoint in the handheld GPS using the Coordinate ID. Use GPS map datum WGS 84 and record in decimal degrees (N00º.00000, W000º.00000). GPS waypoint name format is the two digit year, four digit Coordinate ID or Station ID (as given in Appendix B - Table 1 and Appendix B - Table 2). For example, a 2012 Redfish Bay sample at coordinate set 70 would be 12RF70. Since we are establishing permanent stations, the GPS coordinates collected in the field this year will serve as the permanent sampling station coordinates, effectively replacing the pre-selected coordinates. This accounts for the up to 10 m difference that is allowed when validating coordinate sets. Using the first year permanent sampling station coordinates collected in the field will aid in returning to the stations if this work is repeated. Record total water depth from boat to the nearest 0.01 m. Record other site information requested on the field form, including the unique ID (serial number, for example) of the GPS unit being used, the waypoint name stored in the GPS, latitude and longitude in decimal degrees, weather, water conditions, human use, and tide stage. Estimate seagrass percent coverage Once a permanent sampling station has been established, one team member will estimate the percent seagrass coverage by species. This is done by placing the 0.25 m2 quadrat on the bay floor once each near the bow, starboard, stern and port sides of the boat within the 10 m sampling area (4 replicates, Appendix B - Figure 1). Depending on water depth and clarity, this may require the team member to use a viewing scope and/or snorkeling mask, or estimate coverage by feel within the quadrat. At a given station, use the method that allows the best view of the substrate within the quadrat. If wading is necessary, try to limit the amount the sea floor is disturbed so to maintain maximum visibility. Once the quadrat is in place (Appendix B - Figure 2), estimate percent coverage by species. Percent coverage is defined as the percent of the quadrat area that is obscured by seagrass when viewed from directly overhead. Record to the nearest 1% on the field data form. Percent coverage categories are Halodule, Thalassia, Syringodium, Ruppia, Halophila and Bare. Total of all species plus percent of the quadrat area that is bare should equal 100%. Before leaving the quadrat, collect seagrass shoots for measuring seagrass canopy height as described in the next section.

Revision 1.1 June 19, 2012 Page 94 of 114
Appendix B - Figure 1. Sampling station area and quadrat placement for estimating seagrass coverage and measuring canopy height.

Revision 1.1 June 19, 2012 Page 95 of 114
Appendix B - Figure 2. Quadrat for determination of percent coverage by seagrass species. Quadrat is 0.50 m by 0.50 m (0.25 m2) and constructed of white PVC. Measure seagrass canopy height After estimating percent coverage by species in a quadrat, collect seagrass shoots from the quadrat location for measuring seagrass canopy height. The seagrass shoots can be given to the team members on the boat for measuring while the team member in the water moves to the next quadrat location. To collect seagrass shoots, gently uproot one or more rhizomes of seagrass. Bring the seagrass shoots to the boat and measure the total length of the longest leaf from five representative shoots, to the nearest 0.1 cm. A seagrass leaf is defined as the portion of the seagrass shoot that is green and above the sediment line (Appendix B - Figure 3). Do this for each quadrat location and record the measurements on the field data form in cm. IMPORTANT: If more than one seagrass species is present in a quadrat, record leaf lengths as described above for each species that is at least 20% of the seagrass coverage.

Revision 1.1 June 19, 2012 Page 96 of 114
Appendix B - Figure 3. Typical seagrass morphology. For purposes of this project, the area labeled “blade” on this illustration is referred to as the “leaf.” Diagram found at website of the Florida Medical Entomology Laboratory, University of Florida, Gainesville. Accessed 27 Jan 2011 at http://fmel.ifas.ufl.edu/habitat/seagrass_parts.shtml. Data collection completion For Redfish Bay, data collection is complete when 50 permanent sampling stations have been established and the associated seagrass percent coverage and canopy height data recorded. Coastwide data collection is complete when 50 permanent sampling stations have been established and the associated seagrass percent coverage and canopy height data have been recorded for the 50 permanent sampling stations and the 14 existing stations. Tier 2 seagrass sampling stations Appendix B - Table 1. Tier 2 coastwide coordinate sets evenly distributed among the major bays. 160 locations are provided with 20 samples per bay system (target of 50 samples with 110 extra to account for unsuitable sample sites). Coordinate ID Bay TPWD grid TPWD gridlet Longitude Latitude CW01 Galveston Bay 715 56 -95.2229 29.0438 CW02 Galveston Bay 718 44 -95.1729 29.0451 CW03 Galveston Bay 717 93 -95.1882 29.0396 CW04 Galveston Bay 723 138 -95.2090 29.0174 CW05 Galveston Bay 602 126 -94.9590 29.2188 CW06 Galveston Bay 619 34 -94.9701 29.2132 CW07 Galveston Bay 620 17 -94.9604 29.2146 CW08 Galveston Bay 602 127 -94.9576 29.2188 CW09 Galveston Bay 602 136 -94.9618 29.2174

Revision 1.1 June 19, 2012 Page 97 of 114
Coordinate ID Bay TPWD grid TPWD gridlet Longitude Latitude CW10 Galveston Bay 620 40 -94.9618 29.2118 CW81 Galveston Bay 602 140 -94.9563 29.2174 CW82 Galveston Bay 619 44 -94.9729 29.2118 CW83 Galveston Bay 619 55 -94.9743 29.2104 CW84 Galveston Bay 620 18 -94.9590 29.2146 CW85 Galveston Bay 620 29 -94.9604 29.2132 CW86 Galveston Bay 620 55 -94.9576 29.2104 CW87 Galveston Bay 704 121 -95.1660 29.0688 CW88 Galveston Bay 711 86 -95.1646 29.0563 CW89 Galveston Bay 718 23 -95.1688 29.0479 CW90 Galveston Bay 718 43 -95.1743 29.0451 CW11 East Matagorda Bay 13 27 -95.6632 28.7799 CW12 East Matagorda Bay 13 38 -95.6646 28.7785 CW13 East Matagorda Bay 52 103 -95.7243 28.7215 CW14 East Matagorda Bay 65 143 -95.7688 28.7007 CW15 East Matagorda Bay 67 9 -95.7382 28.7160 CW16 East Matagorda Bay 76 84 -95.8007 28.6910 CW17 East Matagorda Bay 87 105 -95.8382 28.6715 CW18 East Matagorda Bay 90 129 -95.9549 28.6521 CW19 East Matagorda Bay 104 3 -95.9632 28.6326 CW20 East Matagorda Bay 109 16 -95.5785 28.7979 CW151 East Matagorda Bay 27 40 -95.8785 28.7451 CW152 East Matagorda Bay 27 80 -95.8729 28.7410 CW153 East Matagorda Bay 52 84 -95.7174 28.7243 CW154 East Matagorda Bay 67 50 -95.7479 28.7104 CW155 East Matagorda Bay 76 118 -95.8035 28.6868 CW156 East Matagorda Bay 77 35 -95.7854 28.6965 CW157 East Matagorda Bay 78 9 -95.7715 28.6993 CW158 East Matagorda Bay 96 66 -95.8590 28.6590 CW159 East Matagorda Bay 103 3 -95.8799 28.6493 CW160 East Matagorda Bay 104 17 -95.9604 28.6313 CW21 West Matagorda Bay 134 128 -95.9563 28.6521 CW22 West Matagorda Bay 134 129 -95.9549 28.6521 CW23 West Matagorda Bay 450 91 -96.2410 28.4896 CW24 West Matagorda Bay 450 92 -96.2396 28.4896 CW25 West Matagorda Bay 457 4 -96.4451 28.4826 CW26 West Matagorda Bay 468 27 -96.2632 28.4799 CW27 West Matagorda Bay 477 43 -96.2910 28.4618 CW28 West Matagorda Bay 491 71 -96.4021 28.4090 CW29 West Matagorda Bay 493 71 -96.3688 28.4090

Revision 1.1 June 19, 2012 Page 98 of 114
Coordinate ID Bay TPWD grid TPWD gridlet Longitude Latitude CW30 West Matagorda Bay 498 98 -96.4146 28.3715 CW91 West Matagorda Bay 134 117 -95.9549 28.6535 CW92 West Matagorda Bay 450 93 -96.2382 28.4896 CW93 West Matagorda Bay 467 128 -96.2729 28.4688 CW94 West Matagorda Bay 468 28 -96.2618 28.4799 CW95 West Matagorda Bay 485 119 -96.4021 28.4201 CW96 West Matagorda Bay 485 132 -96.4007 28.4188 CW97 West Matagorda Bay 485 133 -96.4160 28.4174 CW98 West Matagorda Bay 485 134 -96.4146 28.4174 CW99 West Matagorda Bay 488 128 -96.3563 28.4188 CW100 West Matagorda Bay 489 40 -96.3451 28.4285 CW31 San Antonio Bay 115 35 -96.5521 28.2965 CW32 San Antonio Bay 131 92 -96.5896 28.2729 CW33 San Antonio Bay 135 56 -96.7896 28.2604 CW34 San Antonio Bay 222 115 -96.5243 28.3868 CW35 San Antonio Bay 223 98 -96.5146 28.3882 CW36 San Antonio Bay 245 117 -96.5882 28.3535 CW37 San Antonio Bay 258 128 -96.6063 28.3354 CW38 San Antonio Bay 259 5 -96.5938 28.3493 CW39 San Antonio Bay 270 39 -96.6299 28.3285 CW40 San Antonio Bay 285 36 -96.5340 28.3132 CW101 San Antonio Bay 18 134 -96.7813 28.4340 CW102 San Antonio Bay 171 127 -96.6910 28.2188 CW103 San Antonio Bay 173 42 -96.6590 28.2285 CW104 San Antonio Bay 231 93 -96.5549 28.3729 CW105 San Antonio Bay 232 45 -96.5382 28.3785 CW106 San Antonio Bay 233 27 -96.5299 28.3799 CW107 San Antonio Bay 242 135 -96.6465 28.3507 CW108 San Antonio Bay 258 22 -96.6035 28.3479 CW109 San Antonio Bay 268 86 -96.4479 28.3396 CW110 San Antonio Bay 286 88 -96.5285 28.3063 CW41 Aransas Bay 154 42 -96.8924 28.1118 CW42 Aransas Bay 232 32 -97.1563 28.0465 CW43 Aransas Bay 282 93 -97.1882 27.9729 CW44 Aransas Bay 295 71 -97.0688 27.9590 CW45 Aransas Bay 307 135 -97.0299 27.9340 CW46 Aransas Bay 320 27 -97.1132 27.9132 CW47 Aransas Bay 321 138 -97.0924 27.9007 CW48 Aransas Bay 323 13 -97.0660 27.9146 CW49 Aransas Bay 328 97 -97.1326 27.8882

Revision 1.1 June 19, 2012 Page 99 of 114
Coordinate ID Bay TPWD grid TPWD gridlet Longitude Latitude CW50 Aransas Bay 332 55 -97.0576 27.8938 CW111 Aransas Bay 124 18 -96.9590 28.1313 CW112 Aransas Bay 246 11 -97.1521 28.0326 CW113 Aransas Bay 246 116 -97.1563 28.0201 CW114 Aransas Bay 285 54 -97.0757 27.9771 CW115 Aransas Bay 302 128 -97.1063 27.9354 CW116 Aransas Bay 303 137 -97.0938 27.9340 CW117 Aransas Bay 319 138 -97.1257 27.9007 CW118 Aransas Bay 322 74 -97.0813 27.9076 CW119 Aransas Bay 333 8 -97.0396 27.8993 CW120 Aransas Bay 338 122 -97.0813 27.8688 CW51 Corpus Christi Bay 55 136 -97.1285 27.8840 CW52 Corpus Christi Bay 97 4 -97.0951 27.8493 CW53 Corpus Christi Bay 97 17 -97.0938 27.8479 CW54 Corpus Christi Bay 136 83 -97.1188 27.8076 CW55 Corpus Christi Bay 137 90 -97.1090 27.8063 CW56 Corpus Christi Bay 191 138 -97.1590 27.7507 CW57 Corpus Christi Bay 235 38 -97.3313 27.6951 CW58 Corpus Christi Bay 241 135 -97.2132 27.6840 CW59 Corpus Christi Bay 242 36 -97.1840 27.6965 CW60 Corpus Christi Bay 247 54 -97.3090 27.6771 CW121 Corpus Christi Bay 55 7 -97.1243 27.8993 CW122 Corpus Christi Bay 64 38 -97.1479 27.8785 CW123 Corpus Christi Bay 77 58 -97.1535 27.8604 CW124 Corpus Christi Bay 77 79 -97.1576 27.8576 CW125 Corpus Christi Bay 80 107 -97.1021 27.8549 CW126 Corpus Christi Bay 81 136 -97.0951 27.8507 CW127 Corpus Christi Bay 90 126 -97.2424 27.8354 CW128 Corpus Christi Bay 93 50 -97.1646 27.8438 CW129 Corpus Christi Bay 193 39 -97.1299 27.7618 CW130 Corpus Christi Bay 235 51 -97.3299 27.6938 CW61 Upper Laguna Madre 33 7 -97.2910 27.6160 CW62 Upper Laguna Madre 34 77 -97.2771 27.6076 CW63 Upper Laguna Madre 34 84 -97.2674 27.6076 CW64 Upper Laguna Madre 40 127 -97.2910 27.5854 CW65 Upper Laguna Madre 84 144 -97.3507 27.4340 CW66 Upper Laguna Madre 88 95 -97.3521 27.4229 CW67 Upper Laguna Madre 97 29 -97.3438 27.3965 CW68 Upper Laguna Madre 255 133 -97.3993 27.2340 CW69 Upper Laguna Madre 258 18 -97.4090 27.2313

Revision 1.1 June 19, 2012 Page 100 of 114
Coordinate ID Bay TPWD grid TPWD gridlet Longitude Latitude CW70 Upper Laguna Madre 275 20 -97.4396 27.1646 CW131 Upper Laguna Madre 10 131 -97.2021 27.6688 CW132 Upper Laguna Madre 57 102 -97.3257 27.5382 CW133 Upper Laguna Madre 61 119 -97.3354 27.5201 CW134 Upper Laguna Madre 64 37 -97.2993 27.5285 CW135 Upper Laguna Madre 76 10 -97.3368 27.4826 CW136 Upper Laguna Madre 96 45 -97.3549 27.3951 CW137 Upper Laguna Madre 283 13 -97.4326 27.1313 CW138 Upper Laguna Madre 290 30 -97.4257 27.0965 CW139 Upper Laguna Madre 291 142 -97.4035 27.0840 CW140 Upper Laguna Madre 298 118 -97.4201 27.0535 CW71 Lower Laguna Madre 100 124 -97.3785 26.5354 CW72 Lower Laguna Madre 121 119 -97.3688 26.4868 CW73 Lower Laguna Madre 123 118 -97.3368 26.4868 CW74 Lower Laguna Madre 136 58 -97.3868 26.4604 CW75 Lower Laguna Madre 189 36 -97.3007 26.3632 CW76 Lower Laguna Madre 206 26 -97.3313 26.3299
CW77 Lower Laguna Madre 227 87 -97.2632 26.2896
CW78 Lower Laguna Madre 245 16 -97.2451 26.2646
CW79 Lower Laguna Madre 284 50 -97.2813 26.1771
CW80 Lower Laguna Madre 344 35 -97.2354 26.0799 CW141 Lower Laguna Madre 39 7 -97.4243 26.6993 CW142 Lower Laguna Madre 100 58 -97.3701 26.5438 CW143 Lower Laguna Madre 128 90 -97.3924 26.4729 CW144 Lower Laguna Madre 155 111 -97.3465 26.4201 CW145 Lower Laguna Madre 181 78 -97.2757 26.3743 CW146 Lower Laguna Madre 201 74 -97.2813 26.3410 CW147 Lower Laguna Madre 234 78 -97.2924 26.2743 CW148 Lower Laguna Madre 264 2 -97.2313 26.2326 CW149 Lower Laguna Madre 274 53 -97.1938 26.2104 CW150 Lower Laguna Madre 293 19 -97.2743 26.1646

Revision 1.1 June 19, 2012 Page 101 of 114
Appendix B - Table 2. Tier 2 coordinate sets for Redfish Bay system based on seagrass abundance. 147 locations are provided (target of 50 samples with 97 extra to account for unsuitable sample sites).
Coordinate ID Bay TPWD grid TPWD gridlet Longitude Latitude RF01 Aransas Bay 274 135 -97.0799 27.9840 RF02 Aransas Bay 294 95 -97.0854 27.9563 RF03 Aransas Bay 294 138 -97.0924 27.9507 RF04 Aransas Bay 295 80 -97.0729 27.9576 RF05 Aransas Bay 303 61 -97.0993 27.9424 RF06 Aransas Bay 303 76 -97.0951 27.9410 RF07 Aransas Bay 303 97 -97.0993 27.9382 RF08 Aransas Bay 304 17 -97.0771 27.9479 RF09 Aransas Bay 310 120 -97.1174 27.9201 RF10 Aransas Bay 311 143 -97.1021 27.9174 RF11 Aransas Bay 312 128 -97.0896 27.9188 RF12 Aransas Bay 312 144 -97.0840 27.9174 RF13 Aransas Bay 313 51 -97.0799 27.9271 RF14 Aransas Bay 313 123 -97.0799 27.9188 RF15 Aransas Bay 319 20 -97.1229 27.9146 RF16 Aransas Bay 319 69 -97.1215 27.9090 RF17 Aransas Bay 319 116 -97.1229 27.9035 RF18 Aransas Bay 319 138 -97.1257 27.9007 RF19 Aransas Bay 320 11 -97.1021 27.9160 RF20 Aransas Bay 320 25 -97.1160 27.9132 RF21 Aransas Bay 320 28 -97.1118 27.9132 RF22 Aransas Bay 320 30 -97.1090 27.9132 RF23 Aransas Bay 321 17 -97.0938 27.9146 RF24 Aransas Bay 321 26 -97.0979 27.9132 RF25 Aransas Bay 321 94 -97.0868 27.9063 RF26 Aransas Bay 322 81 -97.0715 27.9076 RF27 Aransas Bay 322 117 -97.0715 27.9035 RF28 Aransas Bay 322 121 -97.0826 27.9021 RF29 Aransas Bay 327 142 -97.1368 27.8840 RF30 Aransas Bay 328 2 -97.1313 27.8993 RF31 Aransas Bay 328 134 -97.1313 27.8840 RF32 Aransas Bay 330 16 -97.0951 27.8979 RF33 Aransas Bay 330 119 -97.0854 27.8868 RF34 Aransas Bay 331 106 -97.0701 27.8882 RF35 Aransas Bay 337 86 -97.0979 27.8729 RF36 Aransas Bay 343 2 -97.0646 27.8660 RF73 Aransas Bay 285 99 -97.0799 27.9715
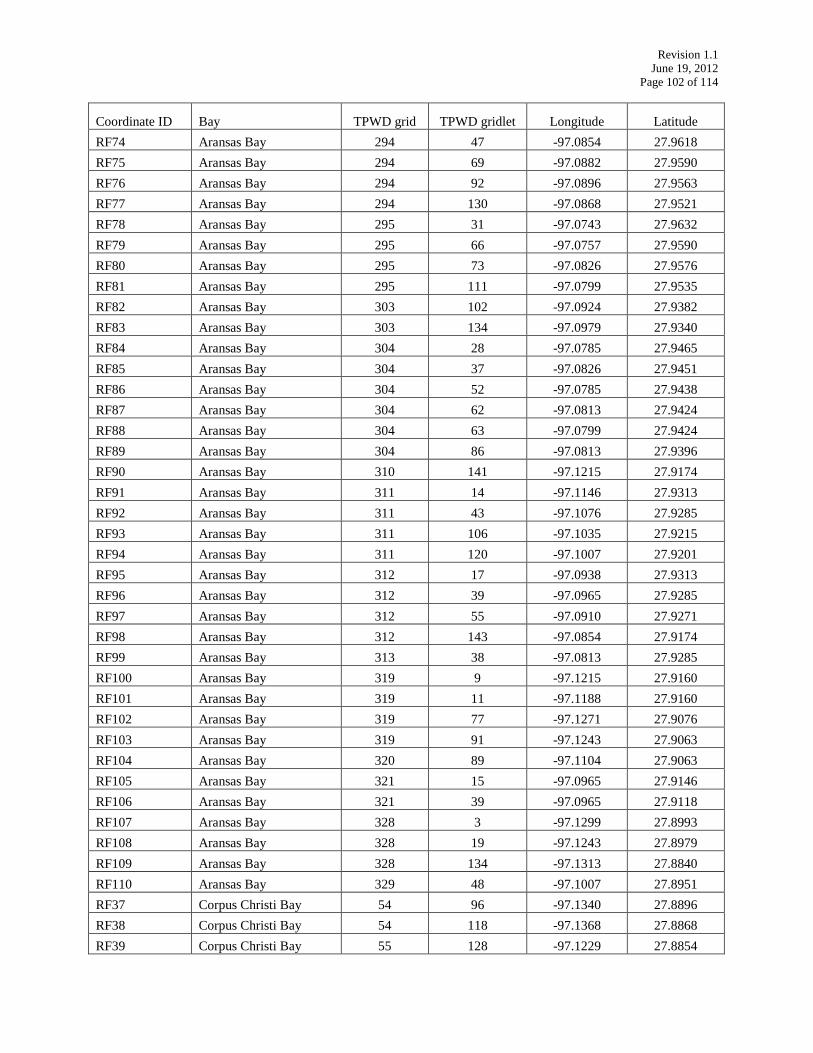
Revision 1.1 June 19, 2012 Page 102 of 114
Coordinate ID Bay TPWD grid TPWD gridlet Longitude Latitude RF74 Aransas Bay 294 47 -97.0854 27.9618 RF75 Aransas Bay 294 69 -97.0882 27.9590 RF76 Aransas Bay 294 92 -97.0896 27.9563 RF77 Aransas Bay 294 130 -97.0868 27.9521 RF78 Aransas Bay 295 31 -97.0743 27.9632 RF79 Aransas Bay 295 66 -97.0757 27.9590 RF80 Aransas Bay 295 73 -97.0826 27.9576 RF81 Aransas Bay 295 111 -97.0799 27.9535 RF82 Aransas Bay 303 102 -97.0924 27.9382 RF83 Aransas Bay 303 134 -97.0979 27.9340 RF84 Aransas Bay 304 28 -97.0785 27.9465 RF85 Aransas Bay 304 37 -97.0826 27.9451 RF86 Aransas Bay 304 52 -97.0785 27.9438 RF87 Aransas Bay 304 62 -97.0813 27.9424 RF88 Aransas Bay 304 63 -97.0799 27.9424 RF89 Aransas Bay 304 86 -97.0813 27.9396 RF90 Aransas Bay 310 141 -97.1215 27.9174 RF91 Aransas Bay 311 14 -97.1146 27.9313 RF92 Aransas Bay 311 43 -97.1076 27.9285 RF93 Aransas Bay 311 106 -97.1035 27.9215 RF94 Aransas Bay 311 120 -97.1007 27.9201 RF95 Aransas Bay 312 17 -97.0938 27.9313 RF96 Aransas Bay 312 39 -97.0965 27.9285 RF97 Aransas Bay 312 55 -97.0910 27.9271 RF98 Aransas Bay 312 143 -97.0854 27.9174 RF99 Aransas Bay 313 38 -97.0813 27.9285 RF100 Aransas Bay 319 9 -97.1215 27.9160 RF101 Aransas Bay 319 11 -97.1188 27.9160 RF102 Aransas Bay 319 77 -97.1271 27.9076 RF103 Aransas Bay 319 91 -97.1243 27.9063 RF104 Aransas Bay 320 89 -97.1104 27.9063 RF105 Aransas Bay 321 15 -97.0965 27.9146 RF106 Aransas Bay 321 39 -97.0965 27.9118 RF107 Aransas Bay 328 3 -97.1299 27.8993 RF108 Aransas Bay 328 19 -97.1243 27.8979 RF109 Aransas Bay 328 134 -97.1313 27.8840 RF110 Aransas Bay 329 48 -97.1007 27.8951 RF37 Corpus Christi Bay 54 96 -97.1340 27.8896 RF38 Corpus Christi Bay 54 118 -97.1368 27.8868 RF39 Corpus Christi Bay 55 128 -97.1229 27.8854
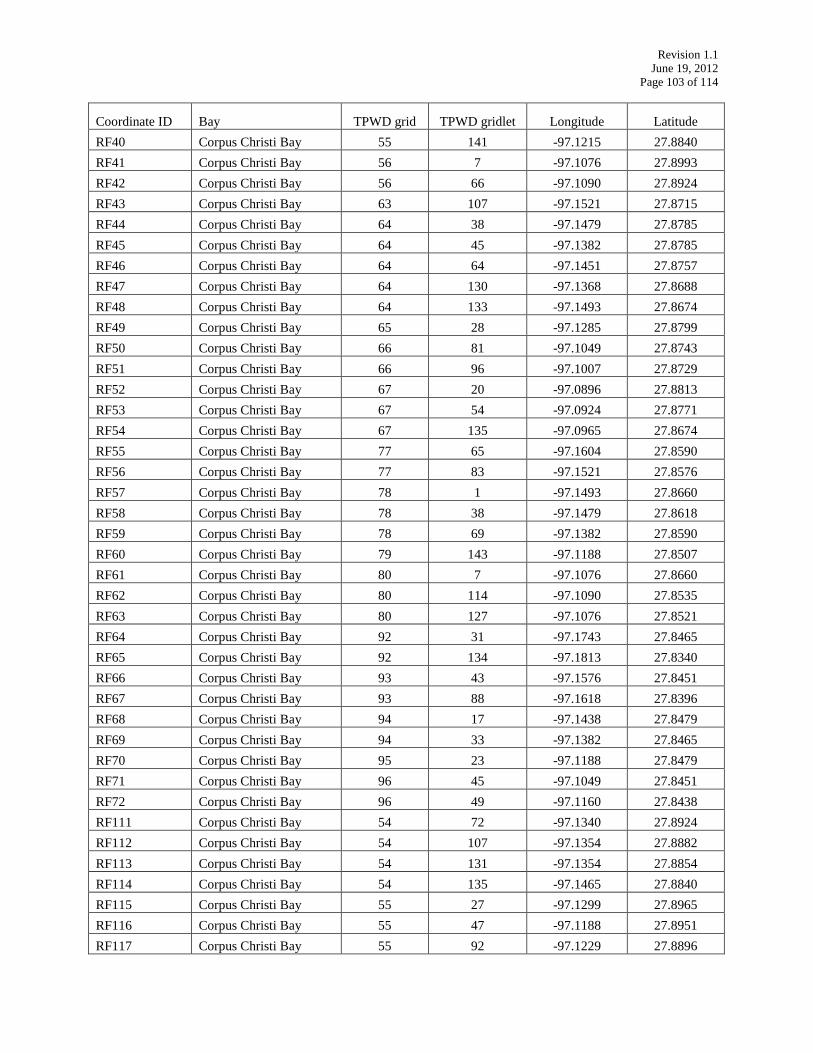
Revision 1.1 June 19, 2012 Page 103 of 114
Coordinate ID Bay TPWD grid TPWD gridlet Longitude Latitude RF40 Corpus Christi Bay 55 141 -97.1215 27.8840 RF41 Corpus Christi Bay 56 7 -97.1076 27.8993 RF42 Corpus Christi Bay 56 66 -97.1090 27.8924 RF43 Corpus Christi Bay 63 107 -97.1521 27.8715 RF44 Corpus Christi Bay 64 38 -97.1479 27.8785 RF45 Corpus Christi Bay 64 45 -97.1382 27.8785 RF46 Corpus Christi Bay 64 64 -97.1451 27.8757 RF47 Corpus Christi Bay 64 130 -97.1368 27.8688 RF48 Corpus Christi Bay 64 133 -97.1493 27.8674 RF49 Corpus Christi Bay 65 28 -97.1285 27.8799 RF50 Corpus Christi Bay 66 81 -97.1049 27.8743 RF51 Corpus Christi Bay 66 96 -97.1007 27.8729 RF52 Corpus Christi Bay 67 20 -97.0896 27.8813 RF53 Corpus Christi Bay 67 54 -97.0924 27.8771 RF54 Corpus Christi Bay 67 135 -97.0965 27.8674 RF55 Corpus Christi Bay 77 65 -97.1604 27.8590 RF56 Corpus Christi Bay 77 83 -97.1521 27.8576 RF57 Corpus Christi Bay 78 1 -97.1493 27.8660 RF58 Corpus Christi Bay 78 38 -97.1479 27.8618 RF59 Corpus Christi Bay 78 69 -97.1382 27.8590 RF60 Corpus Christi Bay 79 143 -97.1188 27.8507 RF61 Corpus Christi Bay 80 7 -97.1076 27.8660 RF62 Corpus Christi Bay 80 114 -97.1090 27.8535 RF63 Corpus Christi Bay 80 127 -97.1076 27.8521 RF64 Corpus Christi Bay 92 31 -97.1743 27.8465 RF65 Corpus Christi Bay 92 134 -97.1813 27.8340 RF66 Corpus Christi Bay 93 43 -97.1576 27.8451 RF67 Corpus Christi Bay 93 88 -97.1618 27.8396 RF68 Corpus Christi Bay 94 17 -97.1438 27.8479 RF69 Corpus Christi Bay 94 33 -97.1382 27.8465 RF70 Corpus Christi Bay 95 23 -97.1188 27.8479 RF71 Corpus Christi Bay 96 45 -97.1049 27.8451 RF72 Corpus Christi Bay 96 49 -97.1160 27.8438 RF111 Corpus Christi Bay 54 72 -97.1340 27.8924 RF112 Corpus Christi Bay 54 107 -97.1354 27.8882 RF113 Corpus Christi Bay 54 131 -97.1354 27.8854 RF114 Corpus Christi Bay 54 135 -97.1465 27.8840 RF115 Corpus Christi Bay 55 27 -97.1299 27.8965 RF116 Corpus Christi Bay 55 47 -97.1188 27.8951 RF117 Corpus Christi Bay 55 92 -97.1229 27.8896
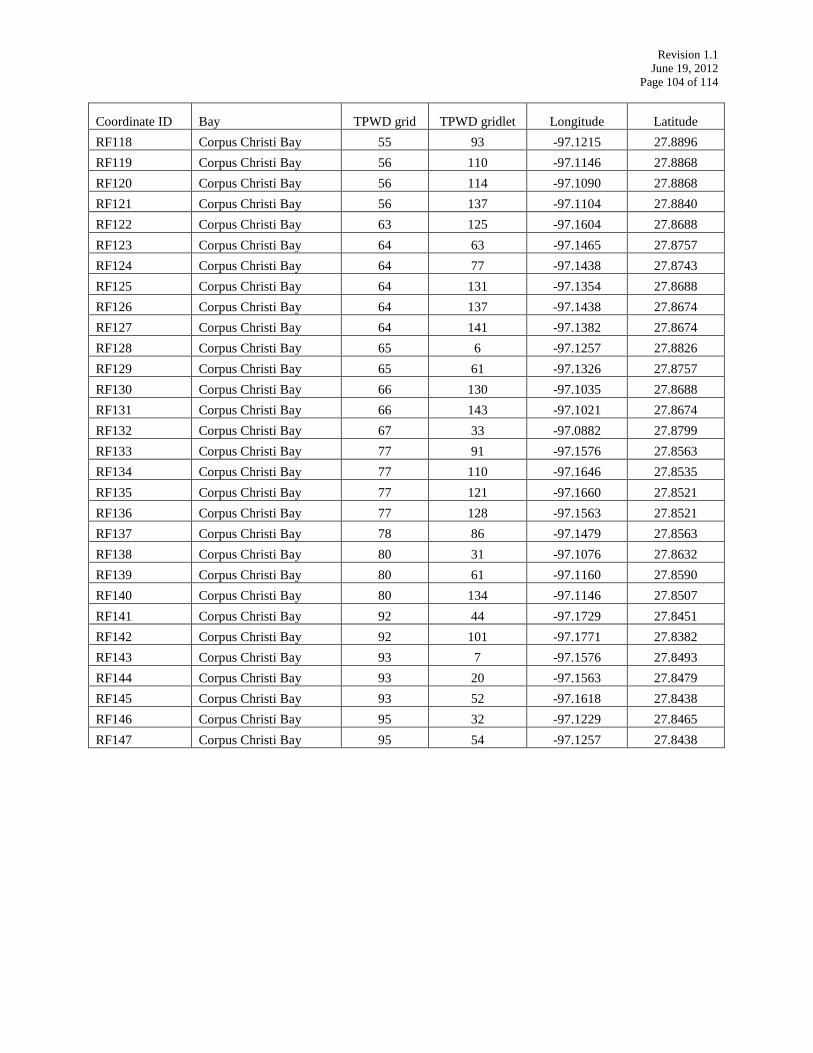
Revision 1.1 June 19, 2012 Page 104 of 114
Coordinate ID Bay TPWD grid TPWD gridlet Longitude Latitude RF118 Corpus Christi Bay 55 93 -97.1215 27.8896 RF119 Corpus Christi Bay 56 110 -97.1146 27.8868 RF120 Corpus Christi Bay 56 114 -97.1090 27.8868 RF121 Corpus Christi Bay 56 137 -97.1104 27.8840 RF122 Corpus Christi Bay 63 125 -97.1604 27.8688 RF123 Corpus Christi Bay 64 63 -97.1465 27.8757 RF124 Corpus Christi Bay 64 77 -97.1438 27.8743 RF125 Corpus Christi Bay 64 131 -97.1354 27.8688 RF126 Corpus Christi Bay 64 137 -97.1438 27.8674 RF127 Corpus Christi Bay 64 141 -97.1382 27.8674 RF128 Corpus Christi Bay 65 6 -97.1257 27.8826 RF129 Corpus Christi Bay 65 61 -97.1326 27.8757 RF130 Corpus Christi Bay 66 130 -97.1035 27.8688 RF131 Corpus Christi Bay 66 143 -97.1021 27.8674 RF132 Corpus Christi Bay 67 33 -97.0882 27.8799 RF133 Corpus Christi Bay 77 91 -97.1576 27.8563 RF134 Corpus Christi Bay 77 110 -97.1646 27.8535 RF135 Corpus Christi Bay 77 121 -97.1660 27.8521 RF136 Corpus Christi Bay 77 128 -97.1563 27.8521 RF137 Corpus Christi Bay 78 86 -97.1479 27.8563 RF138 Corpus Christi Bay 80 31 -97.1076 27.8632 RF139 Corpus Christi Bay 80 61 -97.1160 27.8590 RF140 Corpus Christi Bay 80 134 -97.1146 27.8507 RF141 Corpus Christi Bay 92 44 -97.1729 27.8451 RF142 Corpus Christi Bay 92 101 -97.1771 27.8382 RF143 Corpus Christi Bay 93 7 -97.1576 27.8493 RF144 Corpus Christi Bay 93 20 -97.1563 27.8479 RF145 Corpus Christi Bay 93 52 -97.1618 27.8438 RF146 Corpus Christi Bay 95 32 -97.1229 27.8465 RF147 Corpus Christi Bay 95 54 -97.1257 27.8438

Revision 1.1 June 19, 2012 Page 105 of 114
Appendix B - Table 3. Tier 2 coordinate sets for San Antonio Bay system based on seagrass abundance. 150 locations are provided (target of 50 samples with 100 extra to account for unsuitable sample sites).
Coordinate ID Bay TPWD grid TPWD gridlet Longitude Latitude SA01 San Antonio Bay 11 100 -96.7951 28.4549 SA02 San Antonio Bay 16 11 -96.8021 28.4493 SA03 San Antonio Bay 17 27 -96.7965 28.4465 SA04 San Antonio Bay 34 50 -96.7813 28.4104 SA05 San Antonio Bay 36 81 -96.7382 28.4076 SA06 San Antonio Bay 76 2 -96.6479 28.3493 SA07 San Antonio Bay 85 96 -96.6674 28.3229 SA08 San Antonio Bay 85 107 -96.6688 28.3215 SA09 San Antonio Bay 86 131 -96.6521 28.3188 SA10 San Antonio Bay 100 79 -96.8076 28.2910 SA11 San Antonio Bay 114 47 -96.5688 28.2951 SA12 San Antonio Bay 114 48 -96.5674 28.2951 SA13 San Antonio Bay 114 68 -96.5729 28.2924 SA14 San Antonio Bay 115 3 -96.5632 28.2993 SA15 San Antonio Bay 115 28 -96.5618 28.2965 SA16 San Antonio Bay 115 55 -96.5576 28.2938 SA17 San Antonio Bay 116 10 -96.5368 28.2993 SA18 San Antonio Bay 129 72 -96.6174 28.2757 SA19 San Antonio Bay 129 135 -96.6299 28.2674 SA20 San Antonio Bay 130 70 -96.6035 28.2757 SA21 San Antonio Bay 160 54 -96.6424 28.2438 SA22 San Antonio Bay 171 118 -96.6868 28.2201 SA23 San Antonio Bay 172 70 -96.6701 28.2257 SA24 San Antonio Bay 173 38 -96.6646 28.2285 SA25 San Antonio Bay 184 20 -96.6896 28.2146 SA26 San Antonio Bay 184 39 -96.6965 28.2118 SA27 San Antonio Bay 191 132 -96.7507 28.1854 SA28 San Antonio Bay 192 96 -96.7340 28.1896 SA29 San Antonio Bay 200 39 -96.7799 28.1785 SA30 San Antonio Bay 212 109 -96.4326 28.4201 SA31 San Antonio Bay 213 124 -96.4118 28.4188 SA32 San Antonio Bay 213 144 -96.4007 28.4174 SA33 San Antonio Bay 219 59 -96.4188 28.4104 SA34 San Antonio Bay 223 69 -96.5049 28.3924 SA35 San Antonio Bay 227 106 -96.4368 28.3882 SA36 San Antonio Bay 227 121 -96.4493 28.3854 SA37 San Antonio Bay 227 123 -96.4465 28.3854

Revision 1.1 June 19, 2012 Page 106 of 114
Coordinate ID Bay TPWD grid TPWD gridlet Longitude Latitude SA38 San Antonio Bay 228 121 -96.4326 28.3854 SA39 San Antonio Bay 231 115 -96.5576 28.3701 SA40 San Antonio Bay 232 46 -96.5368 28.3785 SA41 San Antonio Bay 232 100 -96.5451 28.3715 SA42 San Antonio Bay 237 91 -96.4576 28.3729 SA43 San Antonio Bay 237 101 -96.4604 28.3715 SA44 San Antonio Bay 238 67 -96.4410 28.3757 SA45 San Antonio Bay 238 132 -96.4340 28.3688 SA46 San Antonio Bay 239 72 -96.4174 28.3757 SA47 San Antonio Bay 254 103 -96.4410 28.3549 SA48 San Antonio Bay 254 144 -96.4340 28.3507 SA49 San Antonio Bay 257 64 -96.6285 28.3424 SA50 San Antonio Bay 258 74 -96.6146 28.3410 SA51 San Antonio Bay 258 92 -96.6063 28.3396 SA52 San Antonio Bay 258 102 -96.6090 28.3382 SA53 San Antonio Bay 258 104 -96.6063 28.3382 SA54 San Antonio Bay 258 115 -96.6076 28.3368 SA55 San Antonio Bay 259 13 -96.5993 28.3479 SA56 San Antonio Bay 259 50 -96.5979 28.3438 SA57 San Antonio Bay 268 44 -96.4396 28.3451 SA58 San Antonio Bay 270 18 -96.6257 28.3313 SA59 San Antonio Bay 270 60 -96.6174 28.3271 SA60 San Antonio Bay 270 61 -96.6326 28.3257 SA61 San Antonio Bay 270 85 -96.6326 28.3229 SA62 San Antonio Bay 276 88 -96.5285 28.3229 SA63 San Antonio Bay 276 104 -96.5229 28.3215 SA64 San Antonio Bay 276 129 -96.5215 28.3188 SA65 San Antonio Bay 277 100 -96.5118 28.3215 SA66 San Antonio Bay 277 133 -96.5160 28.3174 SA67 San Antonio Bay 277 140 -96.5063 28.3174 SA68 San Antonio Bay 279 22 -96.4701 28.3313 SA69 San Antonio Bay 279 25 -96.4826 28.3299 SA70 San Antonio Bay 285 44 -96.5396 28.3118 SA71 San Antonio Bay 285 107 -96.5354 28.3049 SA72 San Antonio Bay 286 61 -96.5326 28.3090 SA73 San Antonio Bay 287 34 -96.5035 28.3132 SA74 San Antonio Bay 287 49 -96.5160 28.3104 SA75 San Antonio Bay 287 50 -96.5146 28.3104 SA76 San Antonio Bay 25 1 -96.7993 28.4326

Revision 1.1 June 19, 2012 Page 107 of 114
Coordinate ID Bay TPWD grid TPWD gridlet Longitude Latitude SA77 San Antonio Bay 75 46 -96.6535 28.3451 SA78 San Antonio Bay 75 56 -96.6563 28.3438 SA79 San Antonio Bay 75 115 -96.6576 28.3368 SA80 San Antonio Bay 85 21 -96.6715 28.3313 SA81 San Antonio Bay 85 31 -96.6743 28.3299 SA82 San Antonio Bay 85 55 -96.6743 28.3271 SA83 San Antonio Bay 85 63 -96.6799 28.3257 SA84 San Antonio Bay 85 64 -96.6785 28.3257 SA85 San Antonio Bay 87 33 -96.6382 28.3299 SA86 San Antonio Bay 87 98 -96.6479 28.3215 SA87 San Antonio Bay 100 66 -96.8090 28.2924 SA88 San Antonio Bay 114 35 -96.5688 28.2965 SA89 San Antonio Bay 114 44 -96.5729 28.2951 SA90 San Antonio Bay 114 68 -96.5729 28.2924 SA91 San Antonio Bay 115 6 -96.5590 28.2993 SA92 San Antonio Bay 116 8 -96.5396 28.2993 SA93 San Antonio Bay 129 72 -96.6174 28.2757 SA94 San Antonio Bay 129 118 -96.6201 28.2701 SA95 San Antonio Bay 130 22 -96.6035 28.2813 SA96 San Antonio Bay 130 87 -96.6132 28.2729 SA97 San Antonio Bay 130 103 -96.6076 28.2715 SA98 San Antonio Bay 135 106 -96.7868 28.2549 SA99 San Antonio Bay 144 95 -96.6354 28.2563 SA100 San Antonio Bay 151 101 -96.7938 28.2382 SA101 San Antonio Bay 171 127 -96.6910 28.2188 SA102 San Antonio Bay 184 45 -96.6882 28.2118 SA103 San Antonio Bay 197 118 -96.8201 28.1701 SA104 San Antonio Bay 199 77 -96.7938 28.1743 SA105 San Antonio Bay 200 54 -96.7757 28.1771 SA106 San Antonio Bay 212 139 -96.4243 28.4174 SA107 San Antonio Bay 219 48 -96.4174 28.4118 SA108 San Antonio Bay 222 120 -96.5174 28.3868 SA109 San Antonio Bay 223 58 -96.5035 28.3938 SA110 San Antonio Bay 223 79 -96.5076 28.3910 SA111 San Antonio Bay 227 101 -96.4438 28.3882 SA112 San Antonio Bay 227 114 -96.4424 28.3868 SA113 San Antonio Bay 227 128 -96.4396 28.3854 SA114 San Antonio Bay 227 129 -96.4382 28.3854 SA115 San Antonio Bay 227 139 -96.4410 28.3840
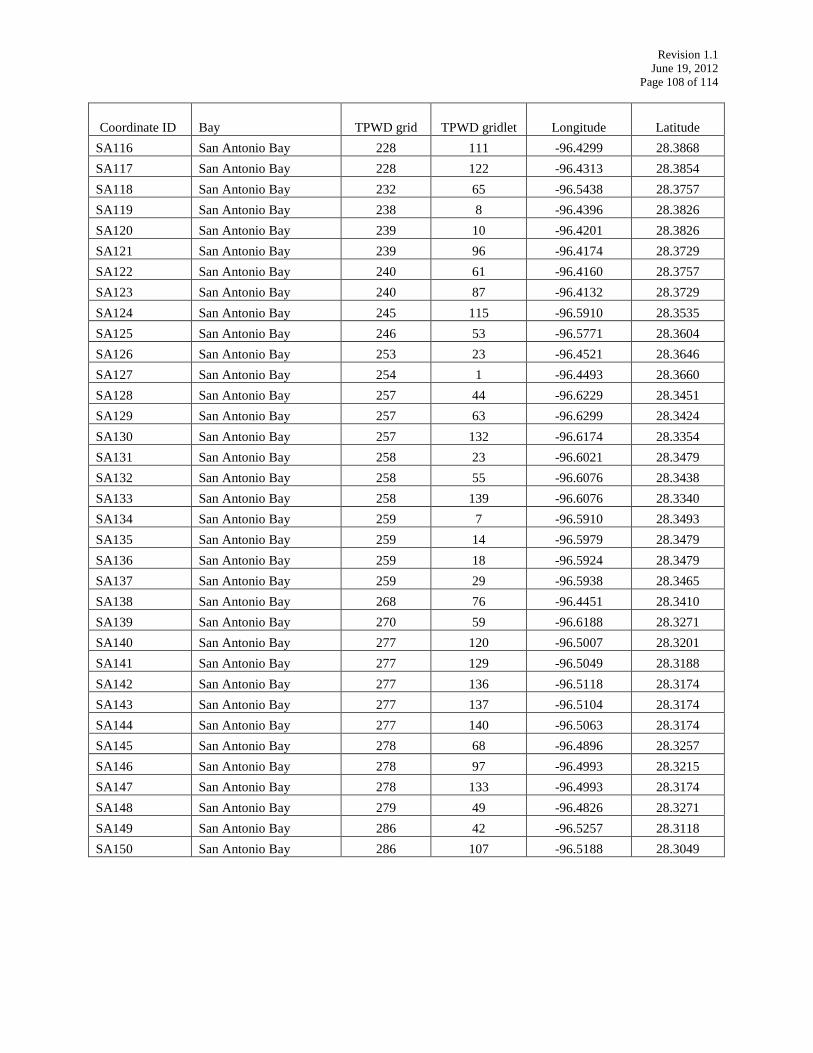
Revision 1.1 June 19, 2012 Page 108 of 114
Coordinate ID Bay TPWD grid TPWD gridlet Longitude Latitude SA116 San Antonio Bay 228 111 -96.4299 28.3868 SA117 San Antonio Bay 228 122 -96.4313 28.3854 SA118 San Antonio Bay 232 65 -96.5438 28.3757 SA119 San Antonio Bay 238 8 -96.4396 28.3826 SA120 San Antonio Bay 239 10 -96.4201 28.3826 SA121 San Antonio Bay 239 96 -96.4174 28.3729 SA122 San Antonio Bay 240 61 -96.4160 28.3757 SA123 San Antonio Bay 240 87 -96.4132 28.3729 SA124 San Antonio Bay 245 115 -96.5910 28.3535 SA125 San Antonio Bay 246 53 -96.5771 28.3604 SA126 San Antonio Bay 253 23 -96.4521 28.3646 SA127 San Antonio Bay 254 1 -96.4493 28.3660 SA128 San Antonio Bay 257 44 -96.6229 28.3451 SA129 San Antonio Bay 257 63 -96.6299 28.3424 SA130 San Antonio Bay 257 132 -96.6174 28.3354 SA131 San Antonio Bay 258 23 -96.6021 28.3479 SA132 San Antonio Bay 258 55 -96.6076 28.3438 SA133 San Antonio Bay 258 139 -96.6076 28.3340 SA134 San Antonio Bay 259 7 -96.5910 28.3493 SA135 San Antonio Bay 259 14 -96.5979 28.3479 SA136 San Antonio Bay 259 18 -96.5924 28.3479 SA137 San Antonio Bay 259 29 -96.5938 28.3465 SA138 San Antonio Bay 268 76 -96.4451 28.3410 SA139 San Antonio Bay 270 59 -96.6188 28.3271 SA140 San Antonio Bay 277 120 -96.5007 28.3201 SA141 San Antonio Bay 277 129 -96.5049 28.3188 SA142 San Antonio Bay 277 136 -96.5118 28.3174 SA143 San Antonio Bay 277 137 -96.5104 28.3174 SA144 San Antonio Bay 277 140 -96.5063 28.3174 SA145 San Antonio Bay 278 68 -96.4896 28.3257 SA146 San Antonio Bay 278 97 -96.4993 28.3215 SA147 San Antonio Bay 278 133 -96.4993 28.3174 SA148 San Antonio Bay 279 49 -96.4826 28.3271 SA149 San Antonio Bay 286 42 -96.5257 28.3118 SA150 San Antonio Bay 286 107 -96.5188 28.3049

Revision 1.1 June 19, 2012 Page 109 of 114
Appendix B - Table 4. Tier 2 sampling locations for the 14 existing seagrass monitoring stations. Station ID Bay/Site TPWD Grid Closest TPWD gridlet Longitude Latitude EX01 West Bay at GISP 620 31 -94.95810 29.21352 EX02 West end Galveston Island 684 114 -95.10922 29.10275 EX03 Christmas Bay 717 105 -95.18800 29.03849 EX04 Matagorda Peninsula 450 52 -96.24503 28.49303
EX05 San Antonio Bay near Welder WMA 270 76 -96.62881 28.32407
EX06 Matagorda Island bayshore 129 118 -96.61948 28.27019 EX07 St Charles Bay 99 37 -96.94905 28.14567 EX08 Mud Island 307 93 -97.02179 27.93940 EX09 Port Bay 247 77 -97.14429 28.02558 EX10 ULM north of JFK Causeway 7 113 -97.26089 27.66989 EX11 Nighthawk Bay 49 26 -97.26403 27.57942
EX12 Lower Laguna Madre near mouth of Arroyo Colorado 189 110 -97.31420 26.35368
EX13 Laguna Madre - bay shore of South Padre Island 306 79 -97.19077 26.14057
EX14 South Bay 374 125 -97.17722 26.03505

Revision 1.1 June 19, 2012 Page 110 of 114
Tier 2 seagrass monitoring equipment list Copy of QAPP Copy of Tier 2 SOP Seagrass percent coverage photo guide Seagrass species ID guide Field data forms on waterproof paper Pens Table of priority coordinate sets Table of alternative coordinate sets Maps Handheld GPS – preloaded with priority and alternative coordinate sets Digital camera Rake Aquaview scope Push pole, power pole or anchor 6 ft PVC poles for permanent markers (coastwide and existing stations only) PVC saw PVC cutter Rubber mallet Depth measuring rod PVC quadrat – 0.25 m2 Meter stick for measuring canopy height to the nearest 0.1 cm Mask and snorkel Dive booties Fins Weight belt Wet suit Dive flags First aid kit Sunscreen Life jackets
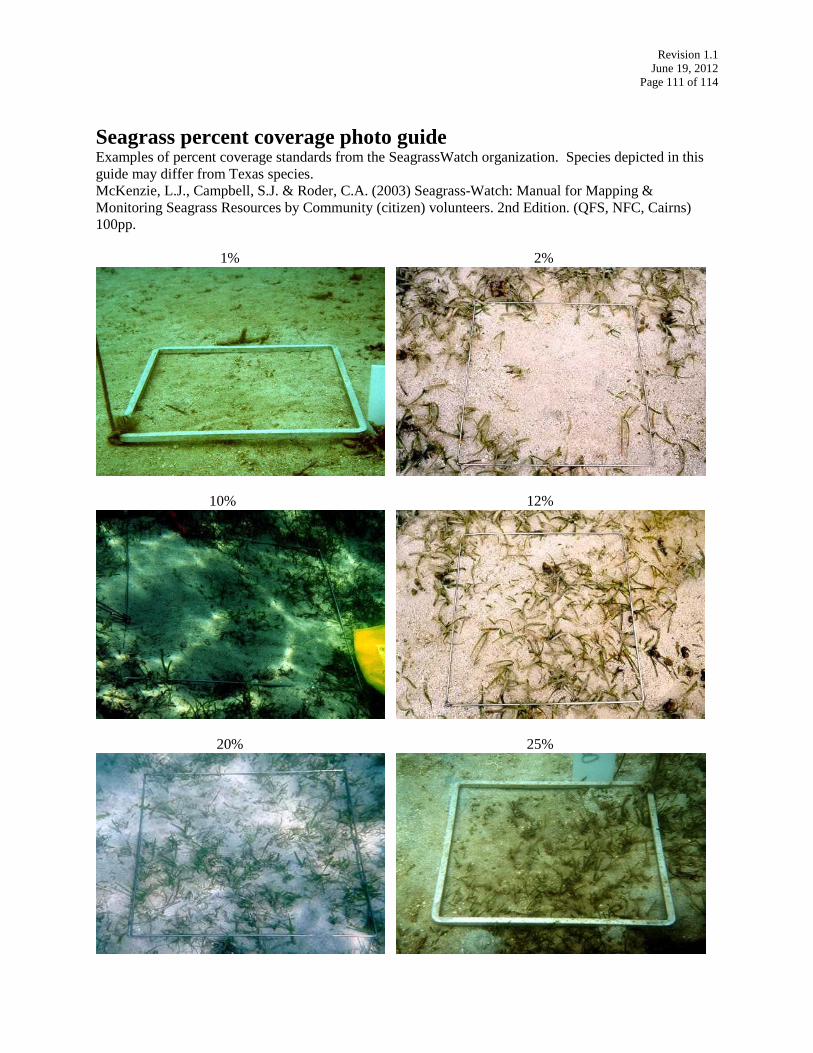
Revision 1.1 June 19, 2012 Page 111 of 114
Seagrass percent coverage photo guide Examples of percent coverage standards from the SeagrassWatch organization. Species depicted in this guide may differ from Texas species. McKenzie, L.J., Campbell, S.J. & Roder, C.A. (2003) Seagrass-Watch: Manual for Mapping & Monitoring Seagrass Resources by Community (citizen) volunteers. 2nd Edition. (QFS, NFC, Cairns) 100pp. 1% 2%
10% 12%
20% 25%

Revision 1.1 June 19, 2012 Page 112 of 114
30% 35%
55% 75%
85% 100%

Revision 1.1 June 19, 2012 Page 113 of 114
Field data form
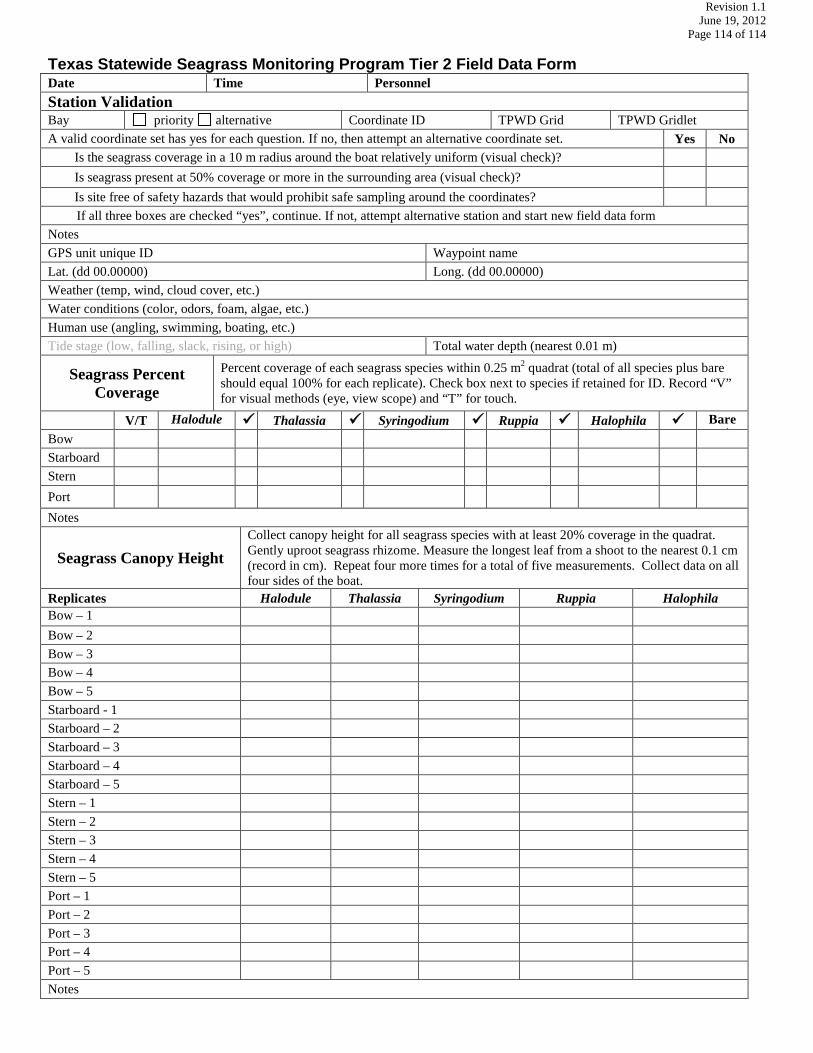
Revision 1.1 June 19, 2012 Page 114 of 114
Texas Statewide Seagrass Monitoring Program Tier 2 Field Data Form Date Time Personnel Station Validation Bay priority alternative Coordinate ID TPWD Grid TPWD Gridlet A valid coordinate set has yes for each question. If no, then attempt an alternative coordinate set. Yes No Is the seagrass coverage in a 10 m radius around the boat relatively uniform (visual check)? Is seagrass present at 50% coverage or more in the surrounding area (visual check)? Is site free of safety hazards that would prohibit safe sampling around the coordinates?
If all three boxes are checked “yes”, continue. If not, attempt alternative station and start new field data form Notes GPS unit unique ID Waypoint name Lat. (dd 00.00000) Long. (dd 00.00000) Weather (temp, wind, cloud cover, etc.) Water conditions (color, odors, foam, algae, etc.) Human use (angling, swimming, boating, etc.) Tide stage (low, falling, slack, rising, or high) Total water depth (nearest 0.01 m)
Seagrass Percent Coverage
Percent coverage of each seagrass species within 0.25 m2 quadrat (total of all species plus bare should equal 100% for each replicate). Check box next to species if retained for ID. Record “V” for visual methods (eye, view scope) and “T” for touch.
V/T Halodule Thalassia Syringodium Ruppia Halophila Bare Bow
Starboard Stern Port Notes
Seagrass Canopy Height Collect canopy height for all seagrass species with at least 20% coverage in the quadrat. Gently uproot seagrass rhizome. Measure the longest leaf from a shoot to the nearest 0.1 cm (record in cm). Repeat four more times for a total of five measurements. Collect data on all four sides of the boat.
Replicates Halodule Thalassia Syringodium Ruppia Halophila Bow – 1
Bow – 2 Bow – 3 Bow – 4 Bow – 5 Starboard - 1 Starboard – 2 Starboard – 3 Starboard – 4 Starboard – 5 Stern – 1 Stern – 2 Stern – 3 Stern – 4 Stern – 5 Port – 1 Port – 2 Port – 3 Port – 4 Port – 5 Notes