
Quality Assessment of Local and Franchise Beef and Chicken Burgers
10
PertanikaJ. Trap. Agric. Sci. 23(2): 103 - 112 (2000) ISSN: 1511-3701 © Universiti Putra Malaysia Press Quality Assessment of Local and Franchise Beef and Chicken Burgers A.S. BABJI, M.N. NURI, J. SUHERMAN and M.Y. SERI CHEMPAKA Department of Food Science and Nutrition, Faculty of Life Sciences Universiti Kebangsaan Malaysia 43600 Bangi, Selangor Keywords: burger, local, franchise, microbiology, composition, meat content ABSTRAK Enam jenama burger lembu dan ayam, tiga jenama burger lembu francais dan dua jenama burger ayam francais telah dinilai dari segi kandungan proksimat, kandungan daging dan mioglobin, warna (nilai L, a, b) dan kandungan mikrobiologi iaitu Kiraan Jumlah Plat (CFU/gm), Kiraan Koliform dan Escherichia coli (MPN/ gm), Kiraan Staphylococus aureus (CFU/gm) dan kehadiran Salmonella sp. Kesemua burger lembu francais mempunyai kandungan protein dan kelembapan yang lebih tinggi (kecuali burger C) dan kandungan karbohidrat yang lebih rendah dari jenama tempatan. Didapati tiada perbezaan yang nyata (p > 0.05) dalam kandungan abu, lemak dan serabut kasar antara burger lembu francais dan jenama tempatan. Kebanyakan burger ayam jenama tempatan mempunyai kandungan protein dan kelembapan yang lebih rendah dan kandungan lemak, serabut dan karbohidrat yang lebih tinggi berbanding dengan burger ayam francais. Didapati tiada perbezaan yang nyata (p > 0.05) dalam kandungan abu antara burger ayam jenama tempatan dan francais. Kesemua burger lembu mempunyai kandungan mioglobin dan daging yang rendah « 65%) kecuali burger AI, FI dan GI. Burger ayam EI, Fidan burger francais B mempunyai kandungan daging yang lebih tinggi (> 65 %) berbanding dengan yang lain. Kesemua burger ayam dan lembu mempunyai nilai 'L' yang lebih tinggi iaitu an tara 45.13 % hingga 53.68 % dan 62. 75% hingga 72.48 % masing-masing kecuali F1 yang lebih gelap. Burger lembu jenama tempatan mempunyai nilai 'a' lebih tinggi berbanding dengan francais dan kesemua burger ayam mempunyai nilai 'a' yang rendah kecuali FI yang lebih merah. Kiraan Jumlah Plat, Kiraan Koliform dan E. coli yang rendah didapati di dalam semua sampel burger. Kiraan S. aureus dalam sampel burger lembu dan ayam berjenama tempatan adalah lebih tinggi daripada francais iaitu antara 2 hingga 11 CFU/gm sampel dan antara 6 hingga 22 CFU/gm sampel masing-masing. Tiada kehadiran Salmonella sp dapat dikesan dalam semua sampel burger. ABSTRACT Six brands of local beef and chicken burgers, three brands of franchise beef and two brands of franchise chicken burgers were evaluated for proximate composition, myoglobin and meat content, colour (L, a, b values) and microbiology composition i.e. Total Plate Count (CFU/gm), Coliform and Escherichia coli Counts (MPN/gm), Staphylococus aureus Count (CFU/gm) and presence of Salmonella sp. All franchise beef burgers had higher protein and moisture contents (except burger C) and lower carbohydrate content than the local brands. No significant differences (p > 0.05) in fat, ash and crude fibre contents were observed between local brands and franchise beef burgers. Most local brands of chicken burgers had lower levels of protein and moisture and higher levels of fat, fibre and carbohydrate than the franchises. No significant differences (p > 0.05) in ash content was observed between the local brands and franchise chicken burgers. All beef burgers had low myoglobin and meat contents «65%) with the exception of AI, FI and GI burgers. Chicken burgers, EI, FI and franchise burger B had higher meat content (>65%) than the others. All beef and chicken burgers had higher 'L' values which ranged between 45.13 % to 53.68% and 62.75 % to 72.48% respectively except FI which was darker. Local brands of beef burgers had a higher 'a' value compared to the franchises and all chicken burgers had a low 'a" value except FI which was redder. Low Total Plate Count, Coliform and E. coli counts were detected in all burger samples. S. aureus counts in most local brands of beef and chicken burger samples were higher than the franchises which ranged from 2 to 11 CFU/gm sample and 6 to 22 CFU/gm sample respectively. Salmonella sp was not present in all burger samples.
Transcript of Quality Assessment of Local and Franchise Beef and Chicken Burgers

PertanikaJ. Trap. Agric. Sci. 23(2): 103 - 112 (2000) ISSN: 1511-3701© Universiti Putra Malaysia Press
Quality Assessment of Local and Franchise Beef and Chicken Burgers
A.S. BABJI, M.N. NURI, J. SUHERMAN and M.Y. SERI CHEMPAKADepartment ofFood Science and Nutrition, Faculty of Life Sciences
Universiti Kebangsaan Malaysia 43600 Bangi, Selangor
Keywords: burger, local, franchise, microbiology, composition, meat content
ABSTRAKEnam jenama burger lembu dan ayam, tiga jenama burger lembu francais dan dua jenama burger ayam francaistelah dinilai dari segi kandungan proksimat, kandungan daging dan mioglobin, warna (nilai L, a, b) dankandungan mikrobiologi iaitu Kiraan Jumlah Plat (CFU/gm), Kiraan Koliform dan Escherichia coli (MPN/gm), Kiraan Staphylococus aureus (CFU/gm) dan kehadiran Salmonella sp. Kesemua burger lembu francaismempunyai kandungan protein dan kelembapan yang lebih tinggi (kecuali burger C) dan kandungankarbohidrat yang lebih rendah dari jenama tempatan. Didapati tiada perbezaan yang nyata (p > 0.05) dalamkandungan abu, lemak dan serabut kasar antara burger lembu francais dan jenama tempatan. Kebanyakanburger ayam jenama tempatan mempunyai kandungan protein dan kelembapan yang lebih rendah dankandungan lemak, serabut dan karbohidrat yang lebih tinggi berbanding dengan burger ayam francais. Didapatitiada perbezaan yang nyata (p > 0.05) dalam kandungan abu antara burger ayam jenama tempatan danfrancais. Kesemua burger lembu mempunyai kandungan mioglobin dan daging yang rendah « 65%) kecualiburger AI, FI dan GI. Burger ayam EI, Fidan burger francais B mempunyai kandungan daging yang lebihtinggi (> 65 %) berbanding dengan yang lain. Kesemua burger ayam dan lembu mempunyai nilai 'L' yang lebihtinggi iaitu antara 45.13 % hingga 53.68 % dan 62. 75% hingga 72.48 % masing-masing kecuali F1 yanglebih gelap. Burger lembu jenama tempatan mempunyai nilai 'a' lebih tinggi berbanding dengan francais dankesemua burger ayam mempunyai nilai 'a' yang rendah kecuali FI yang lebih merah. Kiraan Jumlah Plat,Kiraan Koliform dan E. coli yang rendah didapati di dalam semua sampel burger. Kiraan S. aureus dalamsampel burger lembu dan ayam berjenama tempatan adalah lebih tinggi daripada francais iaitu antara 2 hingga11 CFU/gm sampel dan antara 6 hingga 22 CFU/gm sampel masing-masing. Tiada kehadiran Salmonella spdapat dikesan dalam semua sampel burger.
ABSTRACTSix brands of local beef and chicken burgers, three brands offranchise beef and two brands offranchise chickenburgers were evaluated for proximate composition, myoglobin and meat content, colour (L, a, b values) andmicrobiology composition i.e. Total Plate Count (CFU/gm), Coliform and Escherichia coli Counts (MPN/gm),Staphylococus aureus Count (CFU/gm) and presence ofSalmonella sp. All franchise beef burgers had higherprotein and moisture contents (except burger C) and lower carbohydrate content than the local brands. Nosignificant differences (p > 0.05) in fat, ash and crude fibre contents were observed between local brands andfranchise beef burgers. Most local brands of chicken burgers had lower levels of protein and moisture and higherlevels offat, fibre and carbohydrate than the franchises. No significant differences (p > 0.05) in ash content wasobserved between the local brands and franchise chicken burgers. All beef burgers had low myoglobin and meatcontents «65%) with the exception of AI, FI and GI burgers. Chicken burgers, EI, FI and franchise burgerB had higher meat content (>65%) than the others. All beef and chicken burgers had higher 'L' values whichranged between 45.13 % to 53.68% and 62.75 % to 72.48% respectively except FI which was darker. Localbrands of beef burgers had a higher 'a' value compared to the franchises and all chicken burgers had a low 'a"value except FI which was redder. Low Total Plate Count, Coliform and E. coli counts were detected in all burgersamples. S. aureus counts in most local brands of beef and chicken burger samples were higher than the franchiseswhich ranged from 2 to 11 CFU/gm sample and 6 to 22 CFU/gm sample respectively. Salmonella sp was notpresent in all burger samples.

A.S. BABJI, M.N. NURI, J. SUHERMAN and M.Y. SERI CHEMPAKA
INTRODUCTION
An increase in the demand for fast food inMalaysia is due to the changing habits of theconsumers in the 90's; it is convenient, easy toserve and eat, and suitable for those always 'onthe run'. The western type of meat productswhich are currently adopted and manufacturedin Malaysia are mostly beef and chicken burgersand frankfurters. Burgers have became one ofthe most popular fast food in Malaysia and therehas been a rapid growth in local production ofburgers in the past few years. In 1985, the giantforeign franchises were MacDonald's, Wendy'sand the A&W chain of restaurants (Babji andLetchumanan 1989). This trend was followed bylocal producers and many franchise companieswere formed such as Ramly, Yeo Hiap Seng,Purnama and Saudi. However, there are majordifferences between local burgers and thosefranchised. Differences include organolepticproperties, chemical composition, formulations,nutritional composition and overall acceptanceof these burgers by consumers.
The inherent high price for premium quality animal protein have induced local producersto manufacture meat products of a lower qualityfor the mass consumption by the local population. Various unconventional raw materials andnon-meat ingredients were utilized for furtherprocessing with only a low percentage of meat asthe raw material being blended into the formulation. In processed meat production, premiummeat cuts are seldom used. The utilization ofunconventional raw materials and plant proteinin meat products affects the chemical and nutritional composition and also the microbiologicalquality of the products. Under the Food Regulation of Malaysia 1985, burgers are classified asmanufactured meat which must contain not lessthan 65% meat, 1.7% nitrogen and not morethan 30% fat in organic combination. Babji et al(1984, 1985) and Babji (1988) have reportedvarious aspects of nutritional composition, useof food binders and additives, and the processing and quality control standards in the manufacturing of local beef burgers in Malaysia. Manyof the local manufacturers paid little attentionto the nutritional as well as quality aspects of theproducts. Quality control in the processed meatindustry is still unsatisfactory. There are alsoproblems encountered in the establishment ofminimum standards and specifications for suchnew products (Babji 1988). Information on theraw material composition, microbiological status
and quality control aspects, particularly more soon the non-conventional raw materials from thelivestock industry is poorly documented. Thequality of locally produced and franchise burgers should be monitored from time to time toensure that the products the minimum requirements of the standards and specifications, andare of acceptable quality to the consumers.
This study was carried out to observe thequality of the local and franchise beef andchicken burgers by determining the proximatecomposition, myoglobin and meat content andmicrobiological aspects. It is necessary to ascertain the quality of products consumed by theconsumer. This study also provides informationto satisfy the needs of consumers who demandmeat products that are nutritions, well-balancedand safe from toxic and microbial contaminations.
MATERIALS
The analyses were carried out on six local brandsof beef burgers i.e. Angus, Biffi, Fika, Ramly,Purnama and Saudi, and six local brand chickenburgers i.e. Ramly, Ayamas, Ayam Dinding, Fika,Purnama and Saudi. Most of which are availablein the local supermarkets. The three types offranchise beef burgers were obtained from MacFood Services, A&W and MBF Food Divisionand two types of franchise chicken burgers wereobtained from Mac Food Services and MBF FoodDivision. The franchise burgers (beef andchicken) were labelled A, Band C and localburgers (beef and chicken) were labelled AI,Bl, C1, D1, E1, F1, G1, HI to fulfill the companies requirement for product anonymity.
The burger samples were analysed (duplicate) for proximate composition, colour in termsof lightness ('L'), redness ('a') and yellowness('b'), myoglobin and meat content. The microbiology quality of the burger were tested bydeterminating Total Plate Count (CFU/gm),Coliform and E. coli counts (MPN/gm) S. aureuscount (CFU/gm) and the presence / absence ofSalmonella sp.
METHODS
Proximate Analysis
Proximate analyses were carried out using AOAC(1984) methods which included protein determination using Iijeldahl method, fat extractionvia Soxhlet method, crude fibre determinationusing digestion with sulphuric acid, moisturedetermination by drying the sample for 16 - 18
104 PERTANIKAJ. TROP. AGRIC. SCI. VOL. 23 NO.2, 2000
QUALIlY ASSESSMENT OF LOCAL AND FRANCHISE BEEF AND CHICKEN BURGERS
hours at 100 - 102°C in oven and the ash byashing the sample at 550°C for 9 hours in furnace oven. Carbohydrate content was determinedby substracting the value from the total (100%)minus the percentages of other contents.
Physiarchemical Analysis
The lightness ('L'), redness ('a') and yellowness('b') values for colour determination were measured using a chromameter (MinoltaChromameter Model CR - A70).
The myoglobin content was determined byusing Poel Cyano Method (Topel, 1949). A 10g sample was homogenized for 2 minutes incold water mixed with X ml 1 H 2SO4 in awaring blender. (X = (pH sample - 5) x0.35). The pH of meat samples was determinedusing the AOAC method (1980). The homogenate was centrifuged at 3000 rpm for 2 minutesin a polyethylene tube (50 ml) using the MSEDesk centrifuge. The supernatant obtained wastransferred to a 50 ml tube and heated slowly toreach a temperature of 54°C after which it wassoaked in a water bath to reach 25°C. Thehomogenate was placed in a 100 ml beaker andthe pH brought to 7.2 using Na2C03• The homogenate was transferred back to a 50 ml tubeand centrifuged for 10 minutes at 2500 rpm.The supernatant was fIltered into a 50 ml Erlenmeyer flask and 2-3 small crystals of potassiumferricyanide was added. Absorbance was read at540 nm using the Spectronic 20. Calculation ofmyoglobin (Mb) was derived by Poel-Cyano(Topel, 1949):mg Mb / g wet tissue = absorbance x 7.50
Meat Content
The meat content for the burger samples wasdetermined by using the myoglobin contentsobtained earlier using the Poel Cyano Method(1949). A standard curve was constructed usingmyoglobin content of beef : soy protein orchicken : soy protein mixtures with standardizedpercentage of meat i.e. beef / chicken: soy;100/0,80/20,60/40,40/60,20/80,0/100. Thebeef used in the mixtures was Indian beef as itis commonly used in the burger industry. Thechicken meat used in chicken soy protein mixture was from the defatted breast meat. The soyprotein used was soy protein isolate 500 E obtained from local suppliers. The meat content ofthe burger samples were obtained from thesestandard curves using their myoglobin contentswhich had been determined earlier.
Microbiological analysis
The following analyses were carried out usingprocedures described by Oxoid (1979); TotalPlate Count (TPC) , Coliform count (MP ),E. coli (MPN) , S. aureus count and presence/absence of Salmonella sF. A 10 gm sample ofeach material (frozen) was homogenized aseptically in a stomacher bag with 90 ml sterileRinger solution using a stomacher (ModelSeward BA 7021). The homogenous sample solution was used for the determination of TotalPlate Count, Coliform, E. coli and S. aureus count.Total Plate Count was carried out using thepour plate technique, with Plate Count Agar(PCA, Oxoid) and incubated at 37°C for 48hours. For the Coliform count, MacConkey brothmedia containing Neutral Red as an indicatorwas used. The number of presumptive positivetubes (5 tubes) were counted and refered to theMPN Table. For E. coli count (MPN) , positivetubes from Coliform count were tested in pairs,using Eijkman test (Mac Conkey broth) andIndole test (Tryptone water). Only tubes showing positive results for both tests are consideredpresumptive positive for E. coli. For S. aureuscount, Baird Parker Agar (Oxoid) was used whichwas enriched with Egg Yolk Tellurite Emulsion(Oxoid). The innoculum was spread on thesurface of the agar and incubated at 37°C for 24- 48 hours. Salmonella sp (25 gram sample) wasisolated using pre-enriched buffered peptonewater, followed by selective enrichment inSelenite Cystine Broth (SCB, Oxoid) andTetrathionate Broth (TTB, Merck) and fInallyselective agar medium, Brilliant Green Agar(BGA, Oxoid) and Bismuth Sulphite Agar (BSA,Difco). The presence of Salmonella sp was confIrmed with Triple Sugar Iron Agar (TSI, Oxoid)and Lysine Iron Agar (LIA, Oxoid).
RESULTS AND DISCUSSION
Table 1 showed the proximate composition oflocal brands and franchise beef burgers. Fromthe statistical analysis, there were signilicant differences (p < 0.05) in protein, moisture andcarbohydrate contents between the local brandsand franchise beef burgers. However, there wereno signilicant difference (p > 0.05) in fat, ash,and crude fIbre contents. From Table 2, therewere signilicant differences (p < 0.05) betweenthe local brands and franchise chicken burgersin moisture, fat, protein, carbohydrate and crudefIbre contents except in the ash.
PERTANIKAJ. TRap. AGRIC. SCI. VOL. 23 o. 2, 2000 105

A.S. BABJI, M.N. NURI, J. SUHERMAN and M.Y. SERI CHEMPAKA
TABLE 1Proximate composition of local and franchise beef burgers
Samples * Percentage ( % )Protein Fat Moisture CHO Ash Fiber
Local:Al 15.51 ± 0.96 12.36 ± 1.15 57.41 ± 0.82 12.76 ± 0.03 1.63 ± 0.29 0.33 ± 0.01B1 10.00 ± 0.71 25.74 ± 0.62 45.26 ± 0.97 16.45 ± 0.25 2.02 ± 0.12 0.53 ± 0.02C1 11.71 ± 0.67 21.83 ± 0.84 47.16 ± 1.34 16.54 ± 0.62 2.18 ± 0.15 0.58 ± 0.02F1 15.26 ± 2.41 17.47 ± 0.99 49.10 ± 0.72 14.78 ± 0.51 2.85 ± 0.03 0.54 ± 0.01G1 12.70 ± 0.65 19.05 ± 0.08 55.06 ± 0.73 10.80 ± 0.63 2.08 ± 0.13 0.31 ± 0.01HI 14.42 ± 0.84 23.38 ± 0.19 45.32 ± 0.38 14.16 ± 0.13 2.18 ± 0.17 0.54 ± 0.02
Mean 13.27 ± 1.04 19.97 ± 0.65 49.89 ± 0.69 14.25 ± 0.36 2.16 ± 0.15 0.47 ± 0.01
Franchise:A 18.07 ± 0.61 15.23 ± 0.36 61.61 ± 0.32 2.77 ± 0.02 1.53 ± 0.16 0.79 ± 0.02B 21.26 ± 0.16 19.27 ± 0.42 56.89 ± 0.49 1.05 ± 0.03 0.83 ± 0.13 0.70 ± 0.02C 20.76 ± 0.34 20.19 ± 0.17 56.42 ± 0.44 0.11 ± 0.02 2.07 ± 0.08 0.45 ± 0.01
Mean 20.03 ± 0.37 18.23 ± 0.32 58.31 ± 0.42 1.31 ± 0.02 1.48 ± 0.12 0.65 ± 0.02
* Mean of two samples/treatment
TABLE 2Proximate composition of local and franchise chicken burgers
Samples * Percentage ( % )Protein Fat Moisture CHO Ash Fiber
Local:Al 12.67 ± 0.69 23.05 ± 0.66 50.81 ± 0.25 10.16 ± 0.88 1.54 ± 0.03 1.77 ± 0.09D1 13.96 ± 1.53 12.72 ± 0.54 68.00 ± 0.34 2.06 ± 0.05 1.52 ± 0.19 1.74 ± 0.18E1 14.38 ± 0.66 15.26 ± 0.71 64.89 ± 0.46 1.97 ± 0.32 1.94 ± 0.17 1.56 ± 0.03F1 15.66 ± 1.25 21.02 ± 0.94 48.01 ± 1.35 11.50 ± 0.61 2.04 ± 0.05 1.77 ± 0.09G1 13.33 ± 1.54 16.27 ± 1.00 57.82 ± 1.54 9.09 ± 0.63 1.85 ± 0.11 1.64 ± 0.06HI 15.54 ± 0.55 23.55 ± 0.41 44.57 ± 0.61 12.53 ± 0.13 2.08 ± 0.09 1.73 ± 0.04
Mean 14.26 ± 1.04 18.65 ± 0.71 55.68 ± 0.76 7.89 ± 0.44 1.83 ± 0.11 1.70 ± 0.08
Franchise:A 22.74 ± 0.88 5.86 ± 0.25 68.40 ± 0.43 1.27 ± 0.03 1.32 ± 0.28 0.41 ± 0.02B 18.20 ± 0.32 7.63 ± 0.63 66.44 ± 1.08 5.69 ± 0.03 1.69 ± 0.15 0.35 ± 0.02
Mean 20.47 ± 0.60 6.75 ± 0.44 67.42 ± 0.76 3.48 ± 0.03 1.51 ± 0.22 0.38 ± 0.02
* Mean of two samples/treatment
Franchise beef burgers had higher proteincontent, ranging between 18.07% to 21.26%,compared to local brands which ranged from10.00% to 15.51%. For chicken burgers, theprotein level in franchise burgers was higherthan the local brands which were 22.74% and18.20% for franchise burger A and B respectively. Some local beef burgers were found tocontain high fat, (more than 21 %) and carbohydrate (more than 14%) contents but lower inprotein content. In local burgers with proteincontents ranging from 11 % to 16%, it is obvious
that some of the meat protein have been replaced by binders and fillers such as rusk,breadcrumbs, cereal, legumes and soy protein.This is reflected in the higher carbohydratecontents in local burgers. This was similar withthe HI, Al and Fl chicken burgers where thefat and carbohydrate contents were more than21 % and 10% respectively and low in proteincontent. Babji et al. (1989) reported that manufacturers in their efforts to cut cost, often usedmeat substitutes such as cereals, soy proteins,ground nuts and lately mechanically debonedmeat to formulate hamburgers.
106 PERTANlKAJ. TROP. AGRIC. SCI. VOL. 23 0.2,2000
QUALIlY ASSESSMENT OF LOCAL AND FRANCHISE BEEF AND CHICKEN BURGERS
% beef (beef: $Oy protein Isolate mixtures)
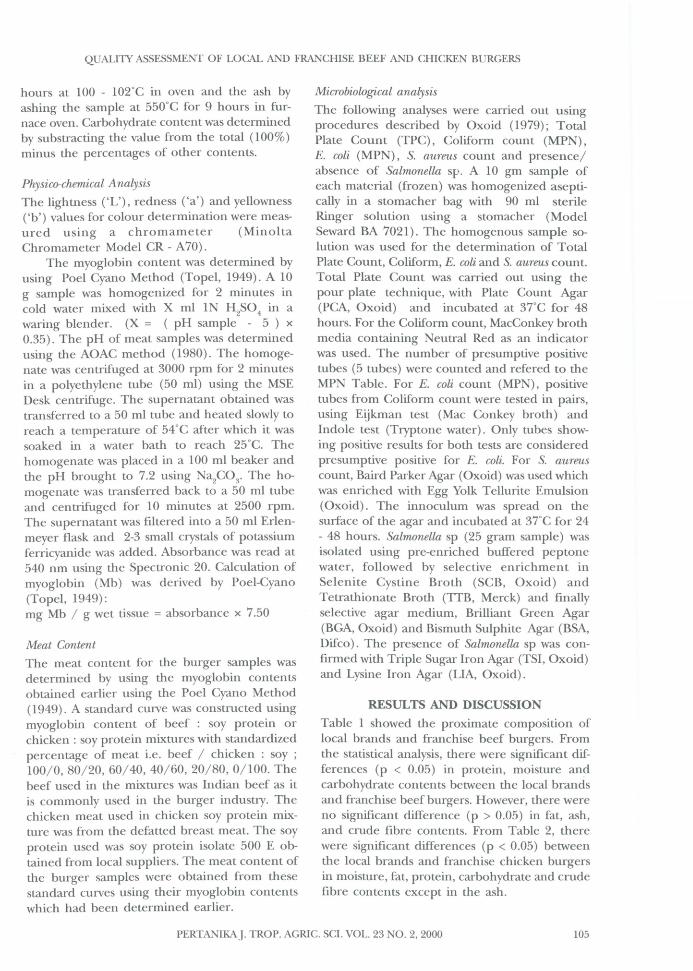
Fig. 1. Standard curve for beef burgers using beef :soy protein isolate mixture
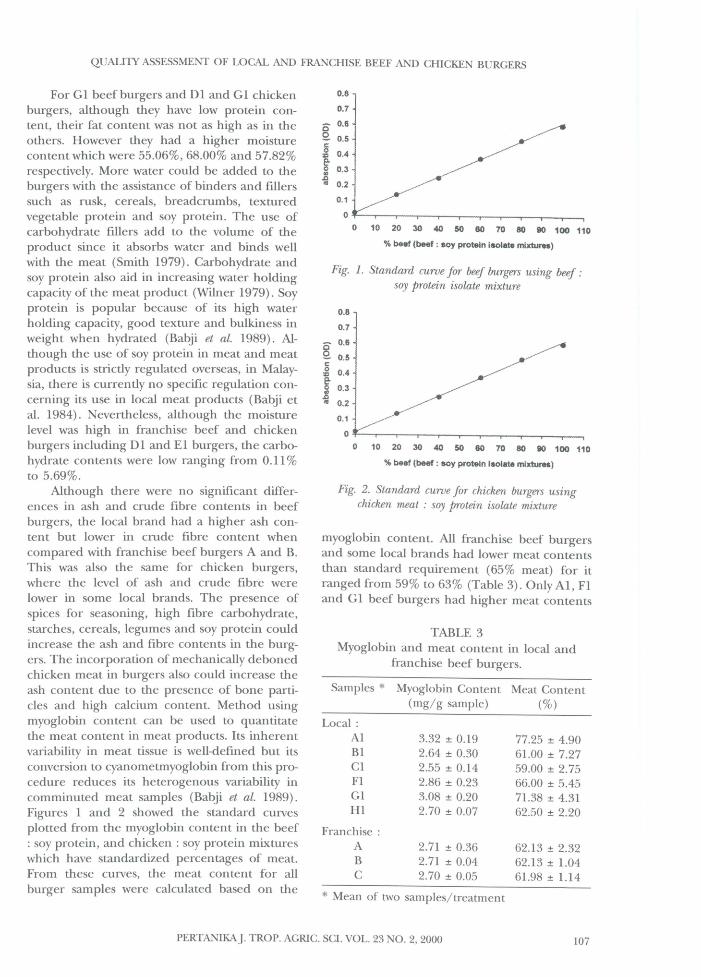
Fig. 2. Standard curve for chicken burgers usingchicken meat : soy protein isolate mixture
62.13 ± 2.3262.13 ± 1.0461.98 ± 1.14
77.25 ± 4.9061.00 ± 7.2759.00 ± 2.7566.00 ± 5.4571.38 ± 4.3162.50 ± 2.20
50 60 70 80 90 100 110
3.32 ± 0.192.64 ± 0.302.55 ± 0.142.86 ± 0.233.08 ± 0.202.70 ± 0.07
2.71 ± 0.362.71 ± 0.042.70 ± 0.05
10 20 30 40 50 60 70 80 90 100 110
% beef (beef ; 80y protein isolate milCtl.ns)
0.1
0 .....-.,.-.,---.,....--,--.---.,...-....-........_...---....___
o
0.8
Franchise:ABC
* Mean of two samples/treatment
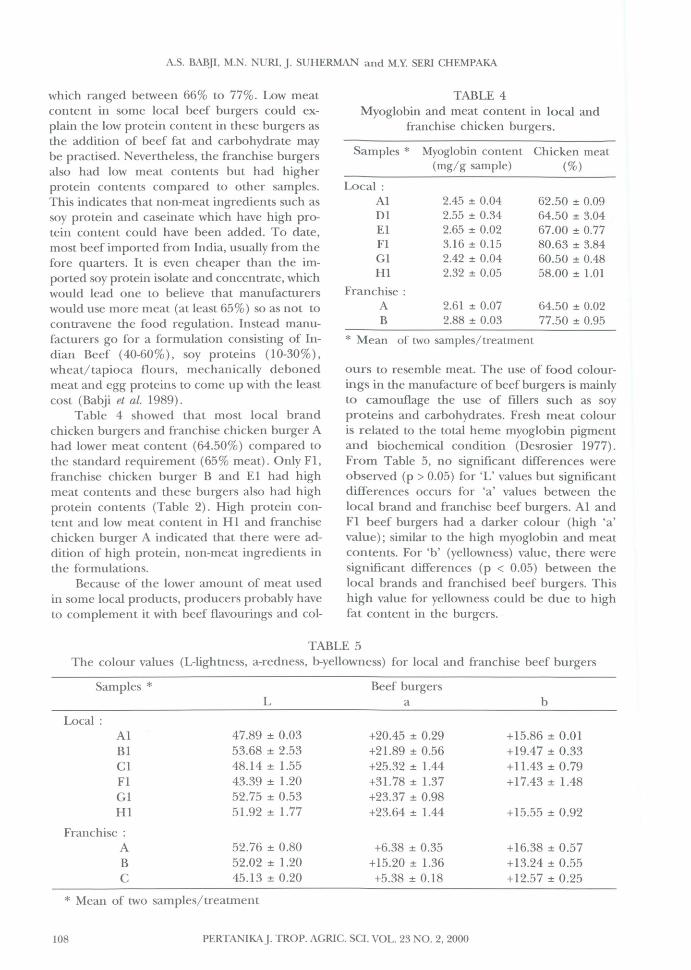
TABLE 3Myoglobin and meat content in local and
franchise beef burgers.
Local:AlB1C1F1GlHI
Samples * Myoglobin Content Meat Content(mg/g sample) (%)
0.8
0.7
0" 0.6
e. 0.5c:g 0.4e-~ 0.3~
III 0.2
myoglobin content. All franchise beef burgersand some local brands had lower meat contentsthan standard requirement (65% meat) for itranged from 59% to 63% (Table 3). Only AI, F1and G1 beef burgers had higher meat contents
0.7
8_ 0.60.5
c::o 0.4I 0.3
III 0.2 ~/
0.1L:://~O~i J
o 10 20 30 40
For G1 beefburgers and D1 and G1 chickenburgers, although they have low protein content, their fat content was not as high as in theothers. However they had a higher moisturecontent which were 55.06%, 68.00% and 57.82%respectively. More water could be added to theburgers with the assistance of binders and fillerssuch as rusk, cereals, breadcrumbs, texturedvegetable protein and soy protein. The use ofcarbohydrate fillers add to the volume of theproduct since it absorbs water and binds wellwith the meat (Smith 1979). Carbohydrate andsoy protein also aid in increasing water holdingcapacity of the meat product (Wilner 1979). Soyprotein is popular because of its high waterholding capacity, good texture and bulkiness inweight when hydrated (Babji et at. 1989). Although the use of soy protein in meat and meatproducts is strictly regulated overseas, in Malaysia, there is currently no specific regulation concerning its use in local meat products (Babji etal. 1984). Nevertheless, although the moisturelevel was high in franchise beef and chickenburgers including D1 and E1 burgers, the carbohydrate contents were low ranging from 0.11 %to 5.69%.
Although there were no significant differences in ash and crude fibre contents in beefburgers, the local brand had a higher ash content but lower in crude fibre content whencompared with franchise beef burgers A and B.This was also the same for chicken burgers,where the level of ash and crude fibre werelower in some local brands. The presence ofspices for seasoning, high fibre carbohydrate,starches, cereals, legumes and soy protein couldincrease the ash and fibre contents in the burgers. The incorporation of mechanically debonedchicken meat in burgers also could increase theash content due to the presence of bone particles and high calcium content. Method usingmyoglobin content can be used to quantitatethe meat content in meat products. Its inherentvariability in meat tissue is well-defmed but itsconversion to cyanometmyoglobin from this procedure reduces its heterogenous variability incomminuted meat samples (Babji et at. 1989).Figures 1 and 2 showed the standard curvesplotted from the myoglobin content in the beef: soy protein, and chicken: soy protein mixtureswhich have standardized percentages of meat.From these curves, the meat content for allburger samples were calculated based on the
PERTANIKAJ. TRap. AGRIC. SCI. VOL. 23 0.2,2000 107
A.S. BABJI, M. . URI, J. SUHERMAN and M.Y. SERI CHEMPAKA
Samples * Myoglobin content Chicken meat(mg/g sample) (%)
TABLE 4Myoglobin and meat content in local and
franchise chicken burgers.
ours to resemble meat. The use of food colourings in the manufacture of beef burgers is mainlyto camouflage the use of fillers such as soyproteins and carbohydrates. Fresh meat colouris related to the total heme myoglobin pigmentand biochemical condition (Desrosier 1977).From Table 5, no significant differences wereobserved (p > 0.05) for 'L' values but significantdifferences occurs for 'a' values between thelocal brand and franchise beef burgers. Al andFl beef burgers had a darker colour (high 'a'value); similar to the high myoglobin and meatcontents. For 'b' (yellowness) value, there weresignificant differences (p < 0.05) between thelocal brands and franchised beef burgers. Thishigh value for yellowness could be due to highfat content in the burgers.
* Mean of two samples/treatment
64.50 ± 0.0277.50 ± 0.95
62.50 ± 0.0964.50 ± 3.0467.00 ± 0.7780.63 ± 3.8460.50 ± 0.4858.00 ± 1.01
2.61 ± 0.072.88 ± 0.03
2.45 ± 0.042.55 ± 0.342.65 ± 0.023.16 ± 0.152.42 ± 0.042.32 ± 0.05
Franchise:AB
Local:AlD1E1F1G1HI
which ranged between 66% to 77%. Low meatcontent in some local beef burgers could explain the low protein content in these burgers asthe addition of beef fat and carbohydrate maybe practised. Nevertheless, the franchise burgersalso had low meat contents but had higherprotein contents compared to other samples.This indicates that non-meat ingredients such assoy protein and caseinate which have high protein content could have been added. To date,most beef imported from India, usually from thefore quarters. It is even cheaper than the imported soy protein isolate and concentrate, whichwould lead one to believe that manufacturerswould use more meat (at least 65%) so as not tocontravene the food regulation. Instead manufacturers go for a formulation consisting of Indian Beef (40-60%), soy proteins (10-30%),wheat/tapioca flours, mechanically debonedmeat and egg proteins to come up with the leastcost (Babji et al. 1989).
Table 4 showed that most local brandchicken burgers and franchise chicken burger Ahad lower meat content (64.50%) compared tothe standard requirement (65% meat). Only F1,franchise chicken burger Band E1 had highmeat contents and these burgers also had highprotein contents (Table 2). High protein content and low meat content in HI and franchisechicken burger A indicated that there were addition of high protein, non-meat ingredients inthe formulations.
Because of the lower amount of meat usedin some local products, producers probably haveto complement it with beef flavourings and col-
TABLE 5The colour values (L-lightness, a-redness, b-yellowness) for local and franchise beef burgers
Samples *
Local:AlB1C1F1G1HI
Franchise:ABC
Beef burgersL a b
47.89 ± 0.03 +20.45 ± 0.29 +15.86 ± 0.0153.68 ± 2.53 +21.89 ± 0.56 +19.47 ± 0.3348.14 ± 1.55 +25.32 ± 1.44 +11.43 ± 0.7943.39 ± 1.20 +31.78 ± 1.37 +17.43 ± 1.4852.75 ± 0.53 +23.37 ± 0.9851.92 ± 1.77 +23.64 ± 1.44 +15.55 ± 0.92
52.76 ± 0.80 +6.38 ± 0.35 +16.38 ± 0.5752.02 ± 1.20 +15.20 ± 1.36 +13.24 ± 0.5545.13 ± 0.20 +5.38 ± 0.18 +12.57 ± 0.25
* Mean of two samples/treatment
108 PERTANIKAJ. TRap. AGRIC. SCI. VOL. 23 NO.2, 2000

QUALITY ASSESSMENT OF LOCAL AND FRANCHISE BEEF AND CHICKEN BURGERS
Most of the chicken burgers had high 'L'values which ranged between 62.75 to 72.48except for F1 chicken burgers (Table 6). F1chicken burger was observed to have a reddercolour (a higher 'a' value) compared to theother burgers. Generally there was no significant differences (p > 0.05) between the localbrands and franchise chicken burgers for 'L', 'a'and 'b' values. Chicken meat is lighter and lessred in colour than beef or Indian beef especiallythe breast meat. The thigh meat is redder anddarker because of the muscles and high contentof myoglobin.
Tables 7 and 8 showed the Total Plate Count(TPC), Coliform, E coli and S. aureus counts forall burger samples. TPC showed that the burgersamples meet the standards stipulated by theFood Regulation of Malaysia (1985) which statedthat the number of microorganisms in meat andmeat products must not exceed 106 per gramsample. TPC for local brand beef burgers wasvery low, in the range of 1 x 101 to 8 X 101 pergm sample. Higher TPC was found for franchisebeef burgers ranging 2 x 10² to 2 x 10³ per gmsample. Similarly with the chicken burgers, thefranchise burgers had higher counts (9 x 10² to2 X 103 per gm sample) than the local brands (1x 101 to 4 X 101 per gm sample). Higher countsin the beef and chicken franchise burgers couldbe due to packaging and storage condition. Thelocal brand burgers were packed in small quantities i.e. 8 to 10 pieces per pack and storedfrozen. In the case of franchise burgers, largequantities were packed in a container, storedfrozen and sent to the outlets or restaurants.
Storing products in large quantities in containers had lower penetration of cold air to theinternal part of the containers which takes alonger time to freeze. Babji et al. (1983) statedthat the time lapse between processing, handling, transportation, storage and packagingwould definitely increase chances of bacterialmultiplication.
The coliform and Ecoli counts were low forall burger samples. However, some of the franchise beef and chicken burgers had highercounts for coliform, which were 17 (MPN) / gmsample for franchise beef burgers B and C, and27 (MPN) / gm sample for franchise chickenburger B. The Food Regulation of Malaysia(1985) stated that meat and meat product mustnot contained more than 50 Coliform countsper gram sample. Raw meat usually had highercoliform and Ecoli counts, which ranged between 103 to 104 (MPN)/100 gm in Indian beef(Babji and Seri Chempaka 1994) and between102 to 103 (MPN)/100 gm in chicken meat (SeriChempaka and Babji 1995). Low counts in theseburger samples indicated that inclusion of otheringredients and frozen storage conditions reduced the number of bacteria and retardedtheir growth. Chuah and Yeoh (1984) statedthat Ecoli is quite sensitive to low temperature,and freezing reduced the E. coli present. Thegrowth of mesophilic bacteria like E coli is retarded at low temperatures, and no growth wasobserved below 5°C (Barnes 1976). Mandokhotand Garg (1985) informed that coliform indexhas found wide use in assessing the sanitaryquality of food including meats. Presence of E
Chicken BurgerL a b
62.75 ± 0.76 +5.17 ± 0.35 +17.13 ± 0.8272.48 ± 0.47 +2.40 ± 0.25 +12.29 ± 0.4163.83 ± 1.21 +5.62 ± 0.35 +13.73 ± 0.8243.78 ± 1.54 +35.41 ± 0.76 +20.79 ± 0.5868.61 ± 1.20 +4.52 ± 0.28 +16.96 ± 0.2365.35 ± 1.11 +2.88 ± 0.35 +17.65 ± 0.26
72.47 ± 0.77 +2.03 ± 0.25 +13.94 ± 0.3969.53 ± 0.47 +5.55 ± 0.25 +14.13 ± 0.41
Franchise:AB
TABLE 6The colour values (L-lightness, a-redness, b-yellowness) for local and franchise chicken burgers
Samples *
AlD1E1F1G1HI
Local:
* Mean of two samples/treatment
PERTANIKAJ. TRap. AGRIC. SCI. VOL. 23 NO.2, 2000 109

A.S. BABJI, M.N. NURI, J. SUHERMAN and M.Y. SERI CHEMPAKA
TABLE 7Total plate count (TPC), coliform, E. coli (MPN/g sample) and S. aureus (CFU/g sample)
counts on local and franchise beef burgers.
Samples * Total plate count Colifonn count MP /g S. aureus countCFU/ g sample saITlple (E.coli) CFU/g sample
Local:Al 3 x 101 1«1) 11Bl 8 x 101 1«1) 7Cl 4 x 101 2«1) 6Fl 1 x 101 1«1) 2Gl 3 x 101 3«1) 6HI 3 x 101 1(0) 3
Franchise:A 2 x 10³ 1(0) 2B 2 X 10² 17(0)C 2 x 10² 17(<1) 2
* Mean of two samples/treatment
TABLE 8Total plate count (TPC), coliform, E. coli (MPN/g sample) and S. aureus (CFU/g sample)
counts on local and franchise chicken burgers
Samples * Total plate count Coliform count MP /gCFU/g sample sample (E.coli)
Local :Al 4 x 101 8 «1)Dl 3 x 101 2 «1)El 1 x 101 o (0)Fl 3 x 101 1 (0)Gl 4 x 101 7 «1)HI 3 x 101 12 «1)
Franchise:A 2 x 10³ 1 (0)B 9 X 10² 27 «1)
* Mean of two samples/treatment
S. aureus countCFU/g sample
13969622
28
coli (enterococci) is employed as an indicator offaecal pollution in food.
S. aureus counts in most local brand beefand chicken burgers were varied and higherthan the franchise burgers which ranged berween2 to 11 CFU/ gm sample and 6 to 22 CFU/ gramsample respectively. DHSS United Kingdom(1989) stated that S. aureus in food should notexceed 102 per sample respectively. Fennema,Powrie and Marth (1973) reported that althoughfreezing killed some microorganisms in food,many survived the freezing process and microorganisms that survived will grow and cause undesirable changes when the thawed food reaches a
suitable temperature. The processed meat product producers must be aware of the criticalcontrol points during processing and maintainlow temperature and clean sanitation duringmanual handling by the workers especially during processing, forming and packing the burgers. Most S. aureus biotype from human couldproduce enterotoxin (Brown 1982). S. aureus isa good hygienic indicator of meat base food andits presence is linked and heavy use of equipment and food handling (Shelton et al. 1962).In humans, the main reservoir for S. aureus isthe nose cavity and it spreads to the skin orwound directly or indirectly aay 1986).
110 PERTANlKAJ. TROP. AGRIe. SCI. VOL. 23 NO.2, 2000

QUALIlY ASSESSMENT OF LOCAL AND FRANCHISE BEEF AND CHICKE BURGERS
The results obtained in the study showedthat there was no Salmonella sp present in allburger samples this meets the standards stipulated by the United Kingdom DHSS (1989) i.e.no Salrrwnella must be detected in 25 gram samples. Low temperature at 5°C (Alcock 1987) orlower at 4.4°C (Nickerson and Ronsivalli, 1980)could retart the growth of Salrrwnella. Principalsources of Salmonella are dust, food handlers,pets, insects, rodents, birds, live-haul trucks andthe air. In the processing area, dust should beeliminated from the environment and equipment kept clean during the processing day.Clean-up procedures should include a sanitationprogramme aimed towards eliminating Salmonella, and should include spot bacterial checksprior to start up (Wabeck 1987). Microorganisms may pass from one raw food to another andfrom raw to cooked or processed foods by meansof equipment, cloths and surfaces and also viapeople handling raw and cooked food togetherwithout realising the fact and significance ofcontaminated raw materials. There is muchemphasis on the spread of infection from human faecal excreters to foods but little attentionhas been paid to the human hands passingSalmonella from one food to another (Hobbsand Gilbert 1970).
CONCLUSION
Results showed that there were some differencesin proximate and microbiology compositionbetween the local brand and the franchise burgers. Most franchise burgers had lower fat andcarbohydrate contents and higher protein andmoisture contents compared to the local brands.High fat and carbohydrate contents and lowprotein and meat contents in the local brandburgera showed the utilization of carbohydratefillers/binders and addition of fat. Thus affectedthe colour of the product. In some local brandsand franchise burgers, the utilization of nonmeat protein ingredients and addition of highamount of water may have occured based theanalysis of which showed high protein and moisture contents but low in fat, carbohydrate andmeat contents. Absence of Salmonella sp, lowTotal Plate Count (TPC) , Coliform, E. coli and S.aureus counts in the burger samples showed thatthe manufacturers had paid due attention toquality especially in microbiology compositionby maintaining the sanitation and cleanliness ofthe equipment, storage facilities and workers in
the processing plant. Such a study should becarried out from time to time to monitor thequality of the products in terms of nutritionalvalue and microbiological safety.
REFERENCES
ALCOCK, SJ. 1987. Growth Characteristics of FoodPoisoning Organism at Sub-optimal T emperatures. Campden Food Preservation ResearchAssociation Technical Memorandum No. 440.
AOAC. 1980. Official Methods of Analysis, 13th.edn. Assn. of Official Analytical Chemists,Washington. D.C.
AOAC. 1984. Official Methods ofAnalysis. Association of Official Analytical Chemists, Inc,p.16, 574. 14th ed. USA: Arlington, Virginia.
BABJI, A.S., A. SAYUWA and A. AMI AH. 1985. Theneed for standards and specifications ofprocessed meats in Malaysia. Paper presentedat ASAIHL Conference, 8-10 July 1985,Yokyakarta, Indonesia.
BABJI, A.S. 1988. Quality control of meat andnon-meat components in local hamburgers.34th International Congress ofMeat Science andTechnology. Congress Proceedings, Part B. 29August-2 September 1988. Australia: Brisbane. p. 387-390.
BABJI, A.S., L. CHAN and M.Y. HAMID. 1983.Quality control and microbiological contamination of poultry in Malaysia markets.Mal. Vet. J 7: 234-240.
BABJI, A.S., A. AnNAN and A. AMINAH. 1984. Addedsoy proteins in processed meats in Malaysia. Pertanika 7(3): 1- 4.
BABJI, A.S and S. LETCHUMANAN. 1989. Evaluationof nutritive value of local and soy-beef hamburgers. In AOCS Vegetable Protein Utilizationin Human Foods and Animal Feedstuffs. ed.T.H. Applewhite, p. 237-242. U.SA.: AOCSChemists Society.
BABJI, A.S., P.H. 001 and A. ABDULLAH. 1989.Determination of meat content in processedmeats using currently available methods.Pertanika 12(1): 33 - 4l.
BABJI, A.S and M.Y. SERI CHEMPAKA. 1994. Microbiological status of Indian beef, importedbeef and local beef and meat products.In International Congress on Quality Veterinary
PERTANIKAJ. TRap. AGRIC. SCI. VOL. 23 NO.2, 2000 III
A.S. BABJI, M.N. NURI, J. SUHERMAN and M.Y. SERI CHEMPAKA
Services for the 21st Century. 15-17 Nov, KualaLumpur.
BARNES, E.M. 1976. Microbiological problems ofpoultry at refrigerated temperature -A review. J Sci. Fd. Agric. 27: 777-782.
BROWN, M.H. 1982. Meat Microbiology. New York:Applied Science Publishers Ltd.
CHUAH, E.C and C.L. YEOH. 1984. Microbiological quality of fresh, chilled and frozenmeat. MARDI Research Bulletin 12(3): 380389.
DESROSIER, N.W. and J.N. DESROSIER. 1977. TheTechnology ofFood Preservation. Wesport, Connecticut: AVI Publishing Company Inc.
FEN EMA, R, W.D. POWRIE and E.H. MARTH. 1973.Low Temperature Preservation ofFoods and Living Matter. New Westport: Marcel DekkerInc. p. 399.
HOBBS, B.C and RJ. GILBERT. 1970. Microbiological standards for food; Public health aspects. Chemistry and Industry 7: 215-219.
JAY, J. M. 1986. Modern Food Microbiology. NewYork: Van Nostrand Reinhold Company.
MANnoKHoT, U.v. and S.R GARG. 1985. Microbiological quality of fresh and processed meatsand their quality control. Indian Food Packer.39(6): 45 - 49.
NICKERSON, J.T.R and LJ. Ro SIVALLI. 1980. Elementary Food Science. 2nd edn AV!. Wesport,Connecticut: Publishing Company, Inc.
SERI CHEMPAKA, M.Yand A.S. BABJI. 1995. Chemical and mirobiological composition of poultry meat and by-products. Malaysian J Ani.Sci. 45 - 51.
SHELTON, L.R, H.V. LEININGER, B.F. SURKIEWICZ,E.F. BAER, RP. ELLIOT, J.B. HYNDMAN and N.KRAMER. 1962. A Bacteriological Survey of theFrozen Pre-cooked Food Industry. Washington:Dept. of Health, USFDA.
SMITH, P.S. 1979. Starch derivatives and their usein foods. In Food Carbohydrate, ed. D.RLineback. p. 237-262.
TOP~L, D.G. 1949. Determination of myoglobinill pork muscle, adapted from Poel-CyanoMethod. Am. J Physiol. 156: 44-51.
WABECK, CJ. 1987. Increasing importance ofmicrobial control. Poultry International,p. 82-90.
WILNER, P. 1979. Economic advantage of usingvegetable protein products in Scandinavia.J Am. Oil Chem. Soc. 56: 188-19l.
Received: 19 September 1998Accepud: 20 June 2000
112 PERTANlKAJ. TROP. AGRIC. SCI. VOL. 23 NO.2, 2000