Qualitative assessment of performance of ULBs in Rourkela ...
8
Qualitative assessment of performance of ULBs in Rourkela Town Debadutta Parida &V.Devadas Page 435 International Journal of Research (IJR) Vol-1, Issue-5, June 2014 ISSN 2348-6848 Qualitative assessment of performance of ULBs in Rourkela Town DebaduttaParida 1 &V.Devadas 2 ___________________________________________________________________________ Abstract Rourkela is one of few industrial towns established in the Post-Colonial era as part of industrialization during the 1950s. This paper attempts to access the performance of the Urban Local Body (Rourkela Municipality) in carrying out developmental works in Rourkela Municipal areas through qualitative analysis. In doing so, it also aims at identifying issues and providing possible and plausible solutions and strategies to deal with the same. Keywords Industrial town, Post-Colonial, Qualitative Analysis, Urban Local Body 1 Final Year, Master of Urban and Rural Planning, Department of Architecture and Planning, IIT Roorkee, India 2 Professor, Department of Architecture and Planning, IIT Roorkee, Idnia
Transcript of Qualitative assessment of performance of ULBs in Rourkela ...

Qualitative assessment of performance of ULBs in Rourkela Town Debadutta Parida &V.Devadas Page 435
International Journal of Research (IJR) Vol-1, Issue-5, June 2014 ISSN 2348-6848
Qualitative assessment of performance of ULBs in
Rourkela Town
DebaduttaParida1&V.Devadas2
___________________________________________________________________________
Abstract Rourkela is one of few industrial towns established in the Post-Colonial era as part of
industrialization during the 1950s. This paper attempts to access the performance of the
Urban Local Body (Rourkela Municipality) in carrying out developmental works in Rourkela
Municipal areas through qualitative analysis. In doing so, it also aims at identifying issues
and providing possible and plausible solutions and strategies to deal with the same.
Keywords Industrial town, Post-Colonial, Qualitative Analysis, Urban Local Body
1 Final Year, Master of Urban and Rural Planning, Department of Architecture and Planning, IIT Roorkee, India
2Professor, Department of Architecture and Planning, IIT Roorkee, Idnia
Qualitative assessment of performance of ULBs in Rourkela Town
International Journal of Research (IJR) Vol
Introduction When India obtained independence, one of
the main priorities of the government
was the industrialization of the country.
Various towns were identified for setting
up of large scale industries viz. Rourkela,
Durgapur, Bokaro, Bhilai etc.
was established in the late 1950s
help of the then German government and
the companies Krupp &Demag and
Siemens. It was a highly ambitious vision
to achieve a fine balance between
modernity, cosmopolitan character and
contribution to economic growth of the
country in the long run. Over the years,
Rourkela has evolved from an industrial
township into an Urban Agglomeration.
However, currently itis characterized by
tension between planned development
the Steel Township areas and recently
developed unplanned and organic growth
in the Municipal Town. The paper is
divided into two sections. Firstly, it aims
to document issues identified in the study
area. Secondly, it aims to qualitatively
analyse public opinion regarding the
current performance of the Municipality as
well as their choice regarding future
decisions related to developmental works
in the town.
Figure 1.2 Map showing wards and residential
Qualitative assessment of performance of ULBs in Rourkela Town Debadutta
International Journal of Research (IJR) Vol-1, Issue-5, June 2014 ISSN 2348
When India obtained independence, one of
the main priorities of the government then
was the industrialization of the country.
Various towns were identified for setting
up of large scale industries viz. Rourkela,
Bhilai etc. Rourkela
in the late 1950s with the
erman government and
Krupp &Demag and
Siemens. It was a highly ambitious vision
to achieve a fine balance between
modernity, cosmopolitan character and
tion to economic growth of the
country in the long run. Over the years,
Rourkela has evolved from an industrial
township into an Urban Agglomeration.
However, currently itis characterized by
development in
the Steel Township areas and recently
developed unplanned and organic growth
The paper is
divided into two sections. Firstly, it aims
to document issues identified in the study
area. Secondly, it aims to qualitatively
regarding the
current performance of the Municipality as
well as their choice regarding future
decisions related to developmental works
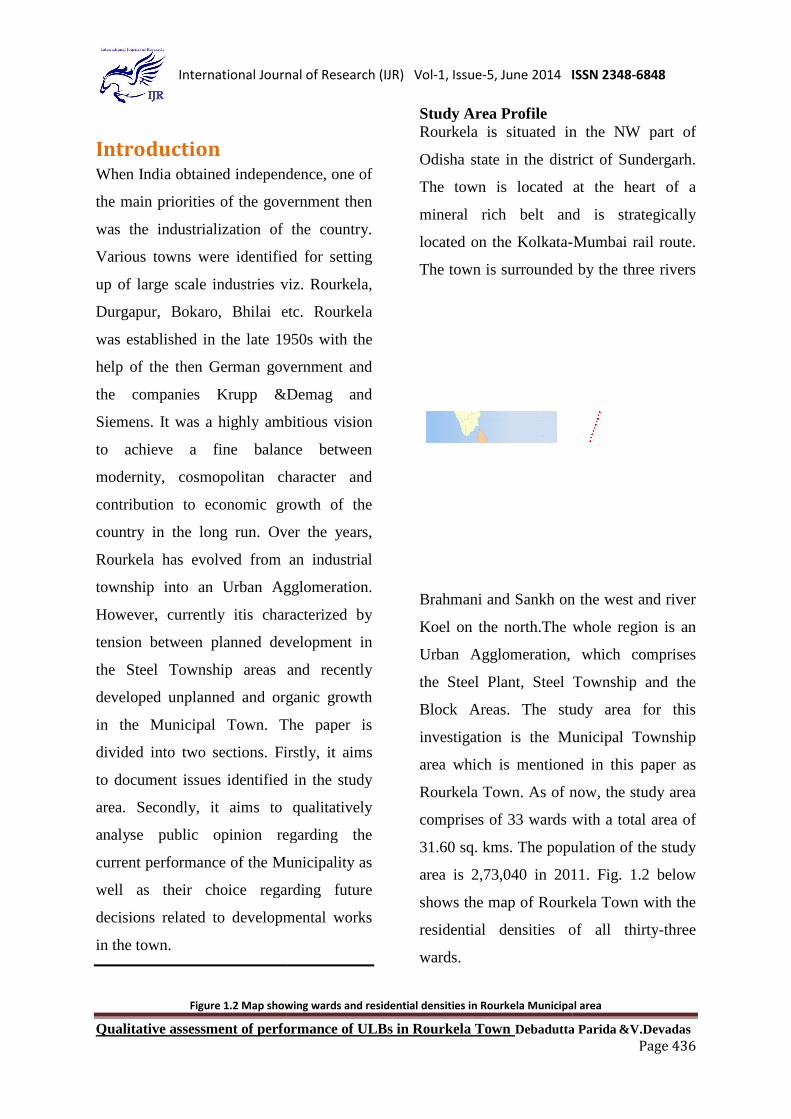
Study Area Profile Rourkela is situated in the NW part of
Odisha state in the district of Sundergarh
The town is located at the heart of a
mineral rich belt and is strategically
located on the Kolkata-
The town is surrounded by the three rivers
Brahmani and Sankh on the west and river
Koel on the north.The whole region is an
Urban Agglomeration, which comprises
the Steel Plant, Steel Township and the
Block Areas. The study area for this
investigation is the Municipal Township
area which is mentioned in
Rourkela Town. As of now, the study area
comprises of 33 wards with a t
31.60 sq. kms. The population of the study
area is 2,73,040 in 2011.
shows the map of Rourkela Town with the
residential densities of all thirty
wards.
.2 Map showing wards and residential densities in Rourkela Municipal area
Debadutta Parida &V.DevadasPage 436
ISSN 2348-6848
Rourkela is situated in the NW part of
Odisha state in the district of Sundergarh.
The town is located at the heart of a
mineral rich belt and is strategically
-Mumbai rail route.
The town is surrounded by the three rivers
Brahmani and Sankh on the west and river
Koel on the north.The whole region is an
, which comprises
the Steel Plant, Steel Township and the
Block Areas. The study area for this
is the Municipal Township
area which is mentioned in this paper as
Rourkela Town. As of now, the study area
comprises of 33 wards with a total area of
31.60 sq. kms. The population of the study
area is 2,73,040 in 2011. Fig. 1.2 below
shows the map of Rourkela Town with the
residential densities of all thirty-three
densities in Rourkela Municipal area

Qualitative assessment of performance of ULBs in Rourkela Town Debadutta Parida &V.Devadas Page 437
International Journal of Research (IJR) Vol-1, Issue-5, June 2014 ISSN 2348-6848
Key Issues
Some of the issues currently affecting the
study area are:
• Obsolete Master Plan and Development
Control rules and regulations not up to
date.
• Increase in slums(according to Census
report in 2011, around 43% of the
population in Municipal Areas was in
slums)
• Tension between Steel Township areas
and Municipal areas in terms of
infrastructure level.
• Increasing water and atmospheric pollution
Figure 1.1 Location Map of Rourkela Town
Figure 3Planned Steel Township area
Figure 2 Encroachments near newly constructed
Basanti Colony over bridge in Municipal area

Qualitative assessment of performance of ULBs in Rourkela Town Debadutta Parida &V.Devadas Page 438
International Journal of Research (IJR) Vol-1, Issue-5, June 2014 ISSN 2348-6848
• Lack of quality healthcare facilities
• Lack of open spaces in the high density residential colonies
Methodology Survey Research methodology was
adopted for this qualitative assessment of
performance of the Municipality through
preparation of an online questionnaire
mailed to potential respondents. Ten
indicators were identified after much
discussions with the local authorities after
which questions were asked regarding the
present performance of the Municipality
and public opinion regarding future growth
of the town. The online questionnaire was
mailed to 150 respondents between
November 2013 and March 2014. Results
and discussions are done based on
statistical analysis of the responses of the
primary survey.
Sample Size Adequacy
One of the most significant steps in a
survey researchis to collect data which is
representative of a population. Various
scholars have put forward methods to
calculate the adequate sample size required
to generalize findings within the limits of a
random error. It was imperative for this
investigation that the sample size is
considered judiciously.This study involves
the determination of sample size for a
research survey whose population size is
large. The population looked at during the
course of this study includes population in
the Municipal Town of 2,73,040
comprising 33 wards.(Cochran, 1963)
developed an equation to yield a
representative sample for proportions,
illustrated as below:
where no is the sample size, Z2 is the
abscissa of the normal curve that cuts an
area α at the tails, e is the desired level of
precision, p is the estimated proportion of
an attribute that is present in the
population and q is 1-p.
(Yamane, 1967) provides a simplified
formula to calculate sample sizes. A 95%
confidence level and P = .5 are assumed.
The use of the level of maximum
variability (P=.5) in the calculation of the
sample size for the proportion generally
will produce a more conservative sample
size (i.e., a larger one) than will be
calculated by the sample size of the mean.
where n is the

Qualitative assessment of performance of ULBs in Rourkela Town Debadutta Parida &V.Devadas Page 439
International Journal of Research (IJR) Vol-1, Issue-5, June 2014 ISSN 2348-6848
sample size, N is the population size, and e
is the level of precision.
For the course of this research work and
the dissertation, the formula employed for
determining the sample size is that one
proposed by (Yamane, 1967)
where n is the
sample size, N is the population size, and e
is the level of precision.
For this study, the adequacy of the sample
size is determined as follows:
Confidence Interval = 95%
Degree of Variability = 0.5
The population size, according to Census
2011 of the Municipal Town is 2,73,040,
which is used for the study. Therefore,
Population Size, N = 2,73,040
The next criterion to be established is the
required level of precision, e. The usual
values of the level of precision range from
0.05 to 0.1 depend on the study concerned.
For a research study at the academic level,
lower values of precision are generally
tolerable, if it is difficult to obtain higher
levels of precision(Bartlett, Kotrlik, &
Higgins, 2001). For this study, the value of
the level of precision is taken as 0.09,
which is found to be within the specified
ranges.
Thus,
Level of Precision, e = 0.09
According to the formula designed by
(Yamane, 1967), the optimal number of
samples required for the study will be
Thus, n = 123 responses
The formulation above suggests that the
optimum sample size necessary is 123
responses. The current survey conducted
as part of the study for the dissertation
obtained 134 responses, which is more
than 123 as suggested.
Rating Scheme
In order to get to know about the public
opinion regarding the existing conditions
in the town as well as performance of the
Municipality and other authorities,
respondents were asked to rate on a scale
of 1 to 5 various attributes according to
their satisfaction levels and personal
opinions.
For analysis, weightage was given to each
response(5 to most satisfied and 1 to very
poor), and a cumulative weighted mean
was calculated for each attribute using the
formula as below:
Z Score = ∑(�×�)
�,

Qualitative assessment of performance of ULBs in Rourkela Town
International Journal of Research (IJR) Vol
Where, Z = weighted mean
N = Number of responses for a category
W = Weight assigned to each category
S = Total number of responses
Table below shows the grading scheme adopted for this analysis.
Table
Results and DiscussionThe results of the analysis are shown below:
Table 2 LOS and Z-Scores showing Existing Situation and Performance of Municipality
Qualitative assessment of performance of ULBs in Rourkela Town Debadutta
International Journal of Research (IJR) Vol-1, Issue-5, June 2014 ISSN 2348
N = Number of responses for a
W = Weight assigned to each
S = Total number of responses
After calculation, the mean of the da
was calculated as 3.189, while the standard
deviation was 0.38. Based on this the
grading scheme was prepared linking the Z
scores with Level of Service(LOS) for
qualitative analysis of the data.
below shows the grading scheme adopted for this analysis.
Table 1 Grading Scheme showing Level of Service
Results and Discussion The results of the analysis are shown below:
Scores showing Existing Situation and Performance of Municipality
Debadutta Parida &V.DevadasPage 440
ISSN 2348-6848
After calculation, the mean of the dataset
was calculated as 3.189, while the standard
deviation was 0.38. Based on this the
grading scheme was prepared linking the Z
scores with Level of Service(LOS) for
qualitative analysis of the data.

Qualitative assessment of performance of ULBs in Rourkela Town
International Journal of Research (IJR) Vol
The results show that peoples’ opinion
regarding existing conditions of most of
the attributes are fairly poor, especially in
case of Parks and playgrounds which was
assigned LOS E which is really poor. At
the same time, the public opinion
regarding performance of the Municipality
in tackling these issues currently is fairly
better, with opinion showing better
performance levels especially in terms of
Educational facilities, Street
Shopping facilities. Also, the respondents
were queried about what should be the
priority of the Municipality in the future
works undertaken by it, in which the
highest Z score was shown in slum
upgradation followed by fairly equal
scores for road infrastructure and safety,
health and parks and playgrounds.
Table 3 Future Priority of Municipality according to Peoples' opinion
Qualitative assessment of performance of ULBs in Rourkela Town Debadutta
International Journal of Research (IJR) Vol-1, Issue-5, June 2014 ISSN 2348
The results show that peoples’ opinion
regarding existing conditions of most of
the attributes are fairly poor, especially in
case of Parks and playgrounds which was
E which is really poor. At
the same time, the public opinion
regarding performance of the Municipality
in tackling these issues currently is fairly
better, with opinion showing better
performance levels especially in terms of
lighting and
Shopping facilities. Also, the respondents
were queried about what should be the
priority of the Municipality in the future
works undertaken by it, in which the
highest Z score was shown in slum
wed by fairly equal
road infrastructure and safety,
parks and playgrounds.
Findings Some of the findings of this research are:
• There is an urgent n
schemes for slum upgradation works in
the study area to tackle the problem of
such a high slum population.
• There is also need to improve the
conditions of existing parks and
playgrounds in the residential areas like
Chhend Colony, Basanti Colony,
Bondamunda etc where these are lying
in neglect since almost
• There is an increased awareness
regarding lack of green and ope
in the study area, there needs to be a
proposal for a green corridor to balance
the high density future
the Municipal colonies.
• The access to pedestrians and cyclists is
‘not satisfactory’, and hence needs to be
augmented in the future.
Future Priority of Municipality according to Peoples' opinion
Debadutta Parida &V.DevadasPage 441
ISSN 2348-6848
Some of the findings of this research are:
There is an urgent need for better
schemes for slum upgradation works in
the study area to tackle the problem of
such a high slum population.
need to improve the
conditions of existing parks and
playgrounds in the residential areas like
Chhend Colony, Basanti Colony,
a etc where these are lying
almost a decade.
There is an increased awareness
regarding lack of green and open areas
there needs to be a
proposal for a green corridor to balance
future development in
Municipal colonies.
The access to pedestrians and cyclists is
‘not satisfactory’, and hence needs to be
augmented in the future.

Qualitative assessment of performance of ULBs in Rourkela Town Debadutta Parida &V.Devadas Page 442
International Journal of Research (IJR) Vol-1, Issue-5, June 2014 ISSN 2348-6848
Recommendations
The Municipality should aim at more
efficient co-ordination with other
authorities in the town such as Rourkela
Development Authority, PWD Department
and the Rourkela Steel Plant. In high
density residential developments, green
belts need to be proposed to make the
green and open space areas close to 10%
of the whole areas. Apart from this, road
widening schemes need to be carried out in
the commercial areas near the Railway
Station and Traffic chowk area. In new
developments, it is essential to increase the
F.A.R. in order to increase the height of
the built form, thus resulting in wider
roads and more open areas for future
growth.
Conclusions and Directions
for further research The present investigation was an attempt
to identify issues in the Municipal areas
and adopt a qualitative methodology for
assessment of the performance levels of
the Municipality as well as opinion of the
public in Rourkela Town. Further research
work can be done by taking up a larger
sample size through cluster sampling and
identifying and finding the Level of
Service of the Municipality and other
Authorties at Ward level. In the end, the Z-
scores can be mapped and analysed in
relation to other thematic maps such as
residential density map, land use map etc.
to arrive at more plausible conclusions.
I am grateful to Prof. Markus Neppl, Institute for Landscape and Urbanism, Karlsruhe Institute of Technology, Karlsruhe,
Germanyfor giving his valuable suggestions on the theme. The usual disclaimers apply
References
Bartlett, J. E., Kotrlik, J. W., & Higgins, C. C. (2001). Organizational Research : Determining Appropriate Sample Size in Survey Research, 19(1), 43–50.
Cochran, W. G. (1963). Sampling Techniques (2nd ed.). New York.
Roy, S. (2007). Urban Imageries : Locating the Modern City. (T. Çınar, Alev and Bender, Ed.) (pp. 209–234).
Yamane. (1967). Statistics: An Introductory Analysis (2nd ed.). New York: Harper and Row.
Feldt, R. S. H. & L. S. (n.d.). The Selection of Variables in Multiple Regression Analysis. Journal of Educational Measurement, 7(3), 151–157.
Israel, G. D. (2013). Determining Sample Size 1, (April 2009), 1–5.
Menon N. (2012).Exploring the prospect of operating low cost and legacy carriers from the same main airport terminal, (Master Dissertation Unpublished Report, MIT Portugal Program, Lisbon, Portugal)