
Qt Quiz Final
223
STATISTICS QUIZ
-
Upload
parikhprateek063784 -
Category
Documents
-
view
163 -
download
2
Transcript of Qt Quiz Final

STATISTICS QUIZ

• Rishabh Srivastava• Anoop Shet• Rahul Hedau• Kanika Gautam• Prateek Parekh• Sujit Kumar Jha
Coordinated by:
• Every correct answer carries 1 mark
• No negative marking
• Time limit of each question is 1 minute
• No question will be passed on to the next team
RULES AND REGULATIONS
Open ended distributions have no range because of highest and lowest value exists in open ended class.
(a) TRUE(b) FALSE
Open ended distributions have no range because of highest and lowest value exists in open ended class.
(a) TRUE(b) FALSE

The coefficient of variation is absolute measure of dispersion.
The coefficient of variation is absolute measure of dispersion.
(a) TRUE(B) FALSE
The coefficient of variation is absolute measure of dispersion.
(a) TRUE(B) FALSE
A fractile is a location in a frequency distribution that a given proportion of the data lies at or above.
(a)TRUE(a)FALSE
A fractile is a location in a frequency distribution that a given proportion of the data lies at or above.
(a) TRUE(a) FALSE
Assume that the population has µ = 100 and σ = 10. If the particular observation has standard score of 1, it can be concluded that?
(a) Its value is 110.(b) It lies between 90 and 110, its exact value cannot be determined.(c) Its value is greater than 110.(d) Nothing can be determined without knowing N.
How does the computation of a sample variance differ from the computation of a population variance?
(a) µ is replaced by X bar(b) N is replaced by n-1(c) N is replaced by n(d) (a) and (c), but not (b)(e) (a) and (b), but not (c)
How does the computation of a sample variance differ from the computation of a population variance?
(a) µ is replaced by X bar(b) N is replaced by n-1(c) N is replaced by n(d) (a) and (c), but not (b)(e) (a) and (b), but not (c)
The dispersion of data set gives insight into the reliability of the measure of central tendency
(a) TRUE(b) FALSE
The dispersion of data set gives insight into the reliability of the measure of central tendency
(a) TRUE(b) FALSE
One advantage of using the range to measure dispersion is that it ignores the nature of the variations among most of the observations
(a) TRUE(b) FALSE
One advantage of using the range to measure dispersion is that it ignores the nature of the variations among most of the observations
(a)TRUE(b) FALSE
_____________say no matter the shape of distribution at least 75% of the value lie in ±2 standard deviation and 89% lie within ±3 standard deviation.
CHEBYSHEV THEOREM say no matter the shape of distribution at least 75% of the value lie in ±2 standard deviation and 89% lie within ±3 standard deviation.
The ________________relates the standard deviation and the mean by expressing the standard deviation as a percentage of the mean.
The COEFFICIENT OF VARIATIONS relates the standard deviation and the mean by expressing the standard deviation as a percentage of the mean.
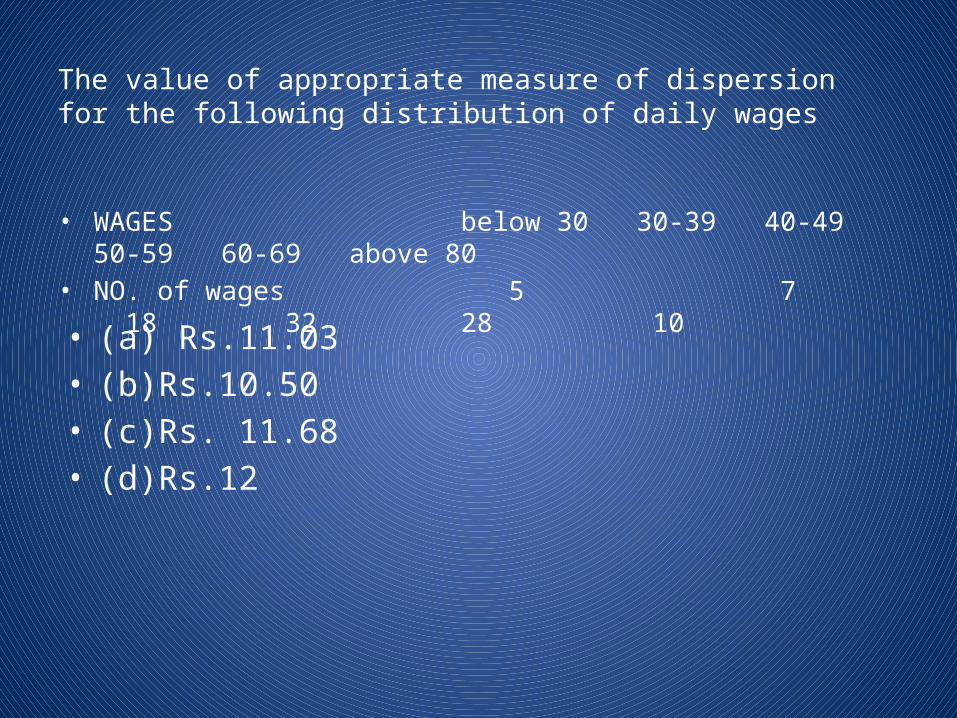
The value of appropriate measure of dispersion for the following distribution of daily wages
• WAGES below 30 30-39 40-49 50-59 60-69 above 80 • NO. of wages 5 7 18 32 28 10
• (a) Rs.11.03• (b)Rs.10.50• (c)Rs. 11.68• (d)Rs.12
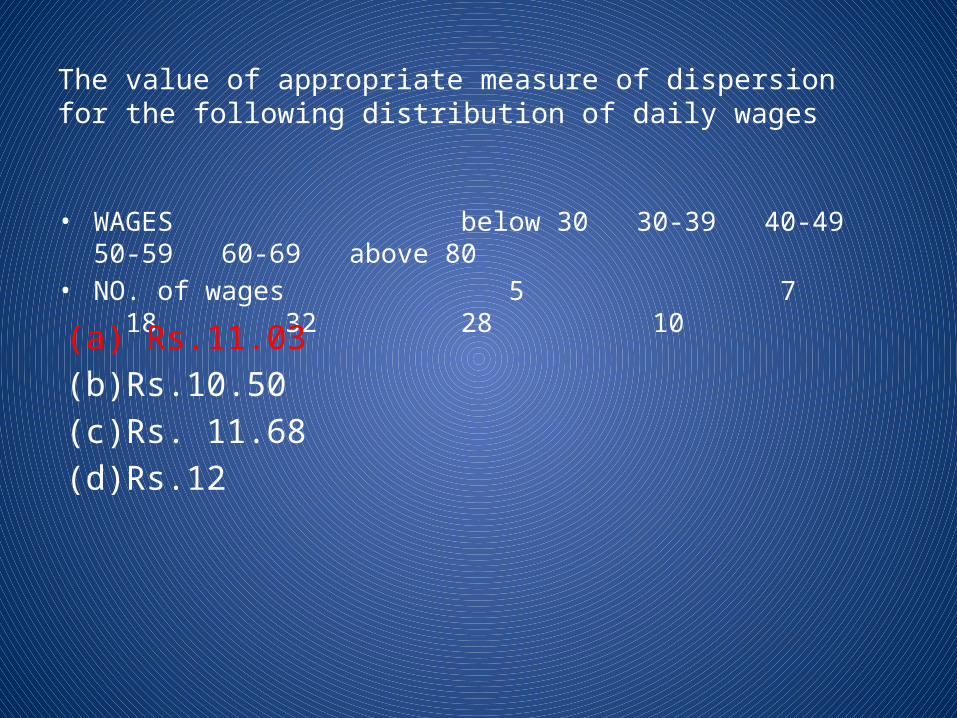
The value of appropriate measure of dispersion for the following distribution of daily wages
• WAGES below 30 30-39 40-49 50-59 60-69 above 80 • NO. of wages 5 7 18 32 28 10
(a) Rs.11.03(b)Rs.10.50(c)Rs. 11.68(d)Rs.12
The distribution for which the coefficient of variation is less is ____________ consistent.
• (a) Less• (b) More• (c) Moderate• (d) None
The distribution for which the coefficient of variation is less is ____________ consistent.
(a) Less(b) More(c) Moderate(d) None
If the variables are increased or decreased by the same proportion the standar deviation changes by
(a) Same proportion (b) Different proportion(c) Both(d) None
If the variables are increased or decreased by the same proportion the standar deviation changes by
(a) Same proportion (b) Different proportion(c) Both(d) None

Relative measure of dispersion makes deviation in similar unit comparable.(a) TRUE(B) FALSE(C) Both (D) None

Relative measure of dispersion makes deviation in similar unit comparable.
(a) TRUE(B) FALSE(C) Both (D) None
Standard Deviation is less than mean Deviation
(a) TRUE(B) FALSE
Standard Deviation is less than mean Deviation
(a) TRUE(B) FALSE

Karl Pearson’s measure gives
(a) Coefficient of mean variation(b) Coefficient of Standard deviation(c) Coefficient of Variation(d) None

Karl Pearson’s measure gives
(a) Coefficient of mean variation(b) Coefficient of Standard deviation(c) Coefficient of Variation(d) None

Semi Quartile range is one fourth of the range in the normal symmetrical distribution
(a) Yes(b) NO(c) Both (d) None
Semi Quartile range is one fourth of the range in the normal symmetrical distribution
(a) Yes(b) NO(c) Both (d) None
Which measures of dispersion is considered for finding a pooled measure of dispersion after combining several groups?
(a) Mean Deviation(b) Standard Deviation(c) Quartile Deviation(d) Any of these
Which measures of dispersion is considered for finding a pooled measure of dispersion after combining several groups?
(a) Mean Deviation(b) Standard Deviation(c) Quartile Deviation(d) Any of these

Decision makers make decisions on the appropriate significances level by examining the cost of :
(a) Performing the test (b) A type I error(c) A type II error(d) (a) and (b)(e) (a) and (c)
Decision makers make decisions on the appropriate significances level by examining the cost of :
(a) Performing the test (b) A type I error(c) A type II error(d) (a) and (b)(e) (a) and (c)
With a lower significance level, the probability of rejecting a null hypothesis that is actually true.
(a) Decreases(b) Remains the same(c) Increases(d) All the above
With a lower significance level, the probability of rejecting a null hypothesis that is actually true.
(a) Decreases(b) Remains the same(c) Increases(d) All the above
For the two tailed test of hypothesis at α = 0.10, the acceptance region is the entire region
(a) To the right of the negative critical value(b) Between the two critical values(c) Outside the two critical values(d) To the left of the positive critical value
For the two tailed test of hypothesis at α = 0.10, the acceptance region is the entire region
(a) To the right of the negative critical value(b) Between the two critical values(c) Outside the two critical values(d) To the left of the positive critical value
The power of Hypothesis test is appropriate only for use with one tailed test
(a) TRUE(B) FALSE(C) Both (D) None
The power of Hypothesis test is appropriate only for use with one tailed test
(a) TRUE(B) FALSE(C) Both (D) None
Hypothesis testing helps us draw conclusions about estimated parameters.
(a) TRUE(B) FALSE(C) Both (D) None
Hypothesis testing helps us draw conclusions about estimated parameters.
(a) TRUE(B) FALSE(C) Both (D) None
• Coefficient of standard deviation is equal to• (a) S.D/A.M (b) A.M/S.D• (c) S.D/G.M (d) None
• Coefficient of standard deviation is equal to• (a) S.D/A.M (b) A.M/S.D• (c) S.D/G.M (d) None
• Arithemetic mean is never less than Geometric mean
• (a) true (b) false• (c) both (d) none
• Arithemetic mean is never less than Geometric mean
• (a) true (b) false• (c) both (d) none
• The algebraic sum of deviation of observation from their A.M is
• (a) 2 (b) -1• (c) 1 (d) 0
• The algebraic sum of deviation of observation from their A.M is
• (a) 2 (b) -1• (c) 1 (d) 0
• The average of a,b,c is equal to the median of a, band c. If o<a<b<c , which of the following must be equal to b?
• (a) (a+c)/2 (b) (a+c)/3• (c) (c-a)/2 (d) (c-a)/3• (e) root of ac
• The average of a,b,c is equal to the median of a, band c. If o<a<b<c , which of the following must be equal to b?
• (a) (a+c)/2 (b) (a+c)/3• (c) (c-a)/2 (d) (c-a)/3• (e) root of ac
• The average of nine numbers is 9 . When a tenth number is added , the average of the ten numbers is also 9. what is the tenth number?
• (a) 0 (b) 9/10• (c) 10/9 (d) 9• (e) 10
• The average of nine numbers is 9 . When a tenth number is added , the average of the ten numbers is also 9. what is the tenth number?
• (a) 0 (b) 9/10• (c) 10/9 (d) 9• (e) 10
• If the average of three different positive intgers is 70, what is the greatest possible of one of the integers?
• (a) 208 (b) 210• (c) 209 (d) none
• If the average of three different positive intgers is 70, what is the greatest possible of one of the integers?
• (a) 208 (b) 210• (c) 209 (d) none
• ___________ is not much affected by fluctuation of sampling.
• (a) A.M (b) G.M (c) H.M (d) none
• ___________ is not much affected by fluctuation of sampling.
• (a) A.M (b) G.M (c) H.M (d) none
• __________ is used when rate of growth or • decline is required• (a) mode (b) A.M• (c) G.M (d) none
• __________ is used when rate of growth or • decline is required• (a) mode (b) A.M• (c) G.M (d) none
• ___________ is used when most frequently• occuring value is required• (a) mode (b) mean• (c) median (d) none
• ___________ is used when most frequently• occuring value is required• (a) mode (b) mean• (c) median (d) none
• __________ is used when representation • Value is required and distribution is
asymmetric• (a) mode (b) mean• (c) median (d) none
• __________ is used when representation • Value is required and distribution is
asymmetric• (a) mode (b) mean• (c) median (d) none
• For an even no. of values the median is the• (a) average of two middle values• (b) middle value• (c) both• (d) none
• For an even no. of values the median is the• (a) average of two middle values• (b) middle value• (c) both• (d) none
• The value of extreme items do not influence the average in case of
• (a) median (b) mean• (c) mode (d) none
• The value of extreme items do not influence the average in case of
• (a) median (b) mean• (c) mode (d) none

• __________ can be calculated from a frequency distribution with open end intervals
• (a) median (b) mean• (c) mode (d) none
• __________ can be calculated from a frequency distribution with open end intervals
• (a) median (b) mean• (c) mode (d) none
• S.D is less than mean deviation• (a) true (b) false• (c) both (d) none
• S.D is less than mean deviation• (a) true (b) false• (c) both (d) none
• For determination of mode , the class intervals should be
• (a) overlapping (b) maximum• (c) minimum (d) none
• For determination of mode , the class intervals should be
• (a) overlapping (b) maximum• (c) minimum (d) none
• If the same amount is added or subtracted from all the values , the mean shall increase or decrease by ___________ amount.
• (a) big (b) small• (c) same (d) none
• If the same amount is added or subtracted from all the values , the mean shall increase or decrease by ___________ amount.
• (a) big (b) small• (c) same (d) none
• If the variables are increased or decreased by the same proportion , the standard deviation changes by
• (a) same proportion • (b) different proportion• (c) both• (d) none
• If the variables are increased or decreased by the same proportion , the standard deviation changes by
• (a) same proportion • (b) different proportion• (c) both• (d) none
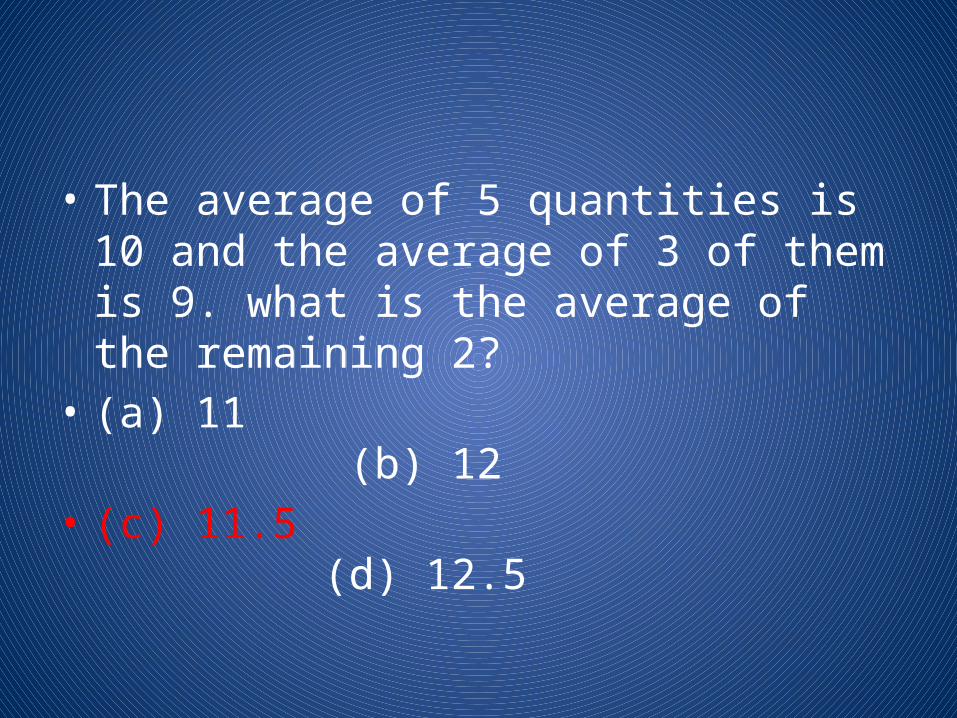
• The average of 5 quantities is 10 and the average of 3 of them is 9. what is the average of the remaining 2?
• (a) 11 (b) 12• (c) 11.5 (d) 12.5
• The average of 5 quantities is 10 and the average of 3 of them is 9. what is the average of the remaining 2?
• (a) 11 (b) 12• (c) 11.5 (d) 12.5
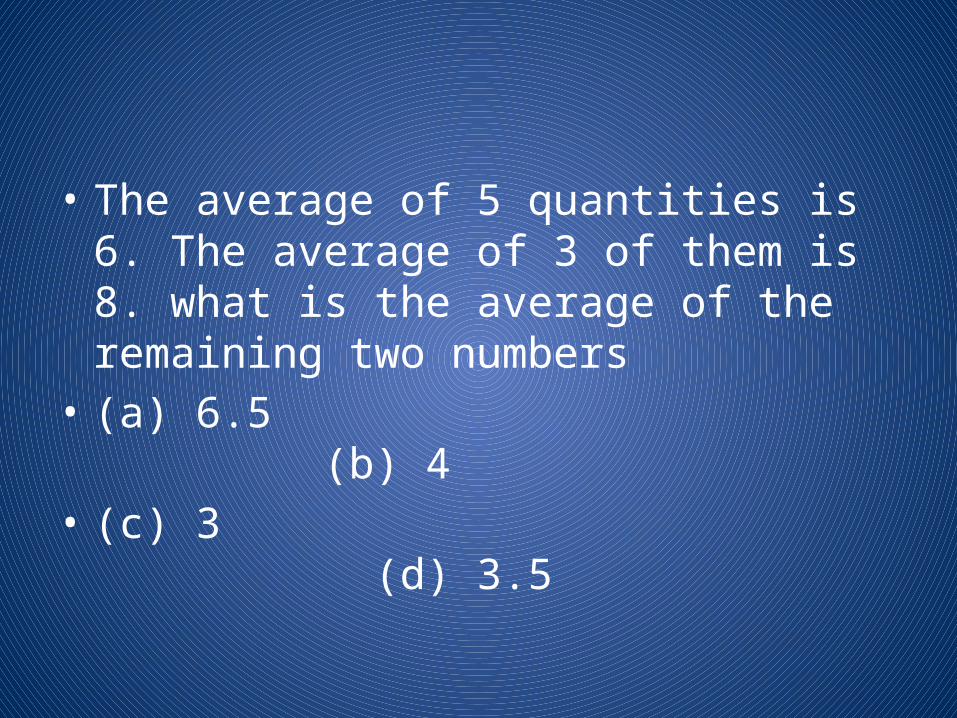
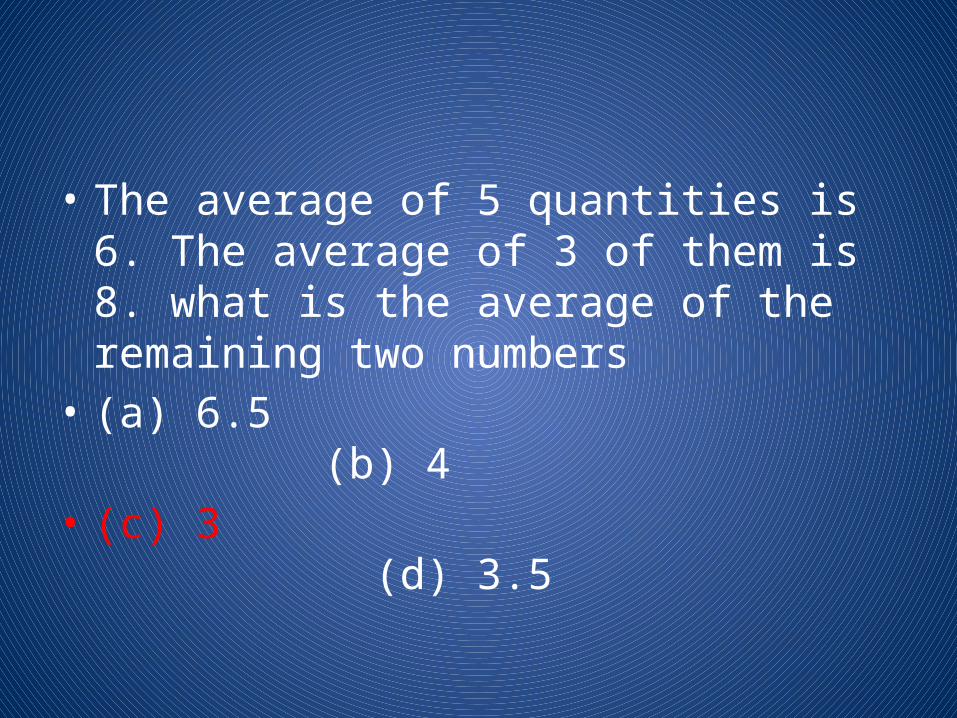
• The average of 5 quantities is 6. The average of 3 of them is 8. what is the average of the remaining two numbers
• (a) 6.5 (b) 4• (c) 3 (d) 3.5
• The average of 5 quantities is 6. The average of 3 of them is 8. what is the average of the remaining two numbers
• (a) 6.5 (b) 4• (c) 3 (d) 3.5
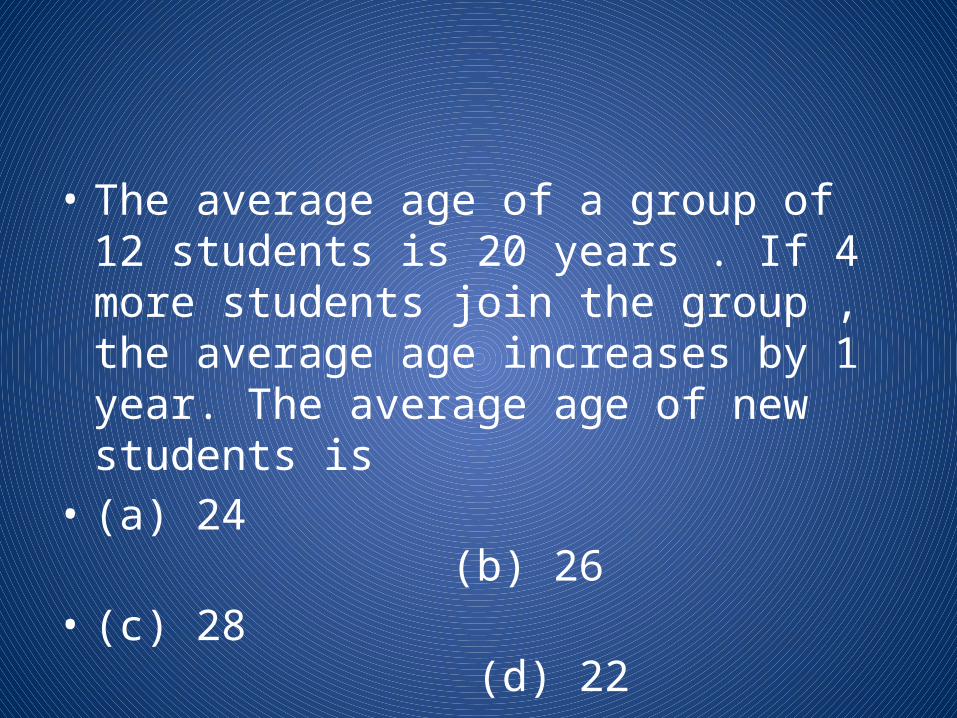
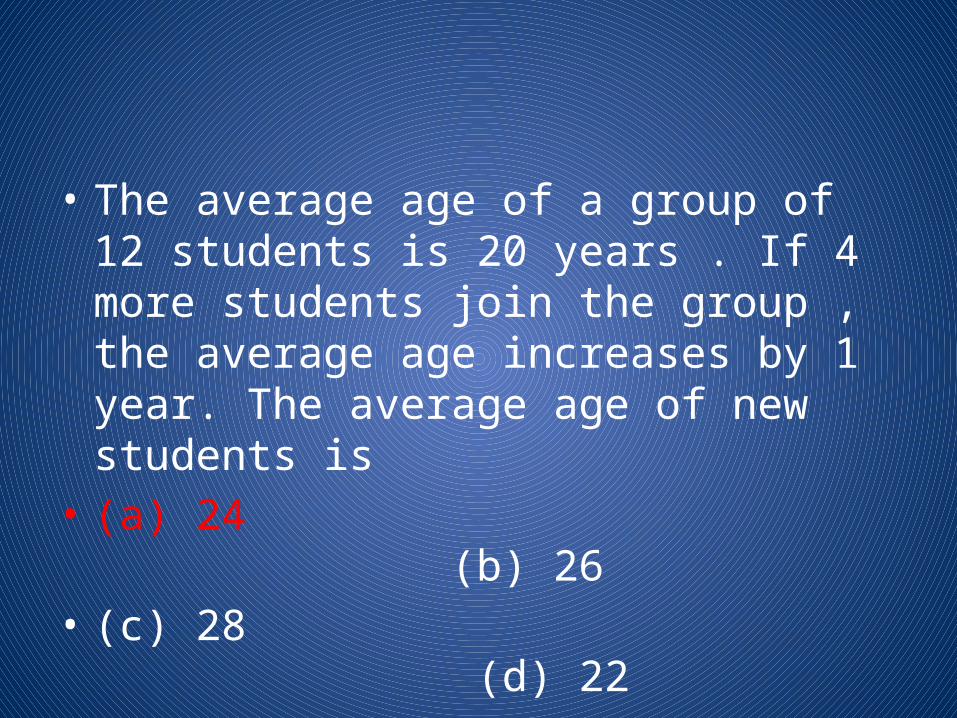
• The average age of a group of 12 students is 20 years . If 4 more students join the group , the average age increases by 1 year. The average age of new students is
• (a) 24 (b) 26• (c) 28 (d) 22
• The average age of a group of 12 students is 20 years . If 4 more students join the group , the average age increases by 1 year. The average age of new students is
• (a) 24 (b) 26• (c) 28 (d) 22
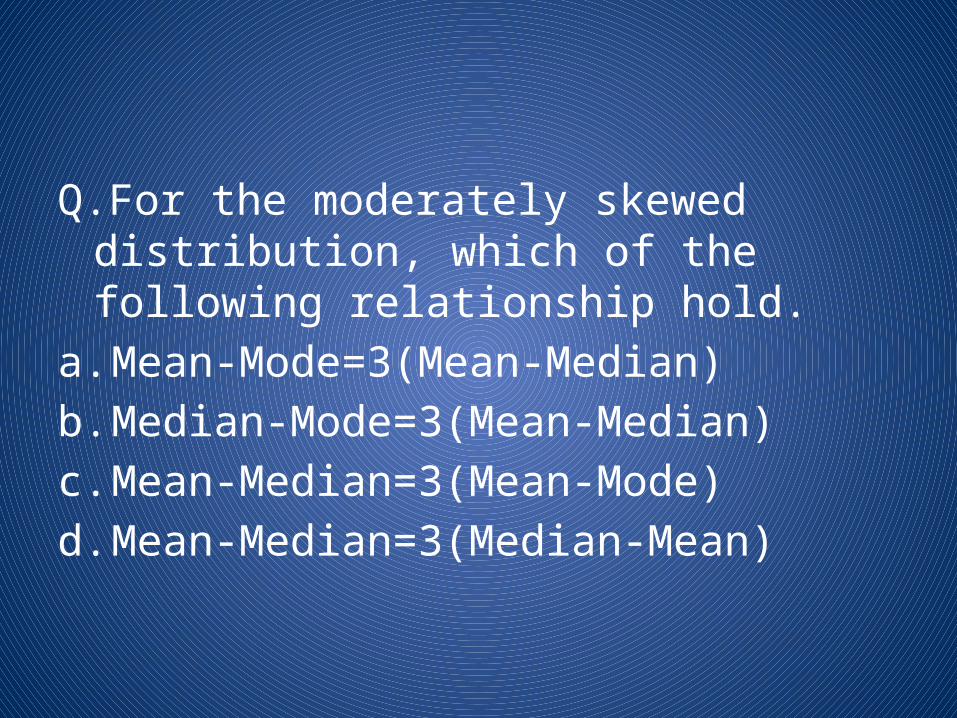
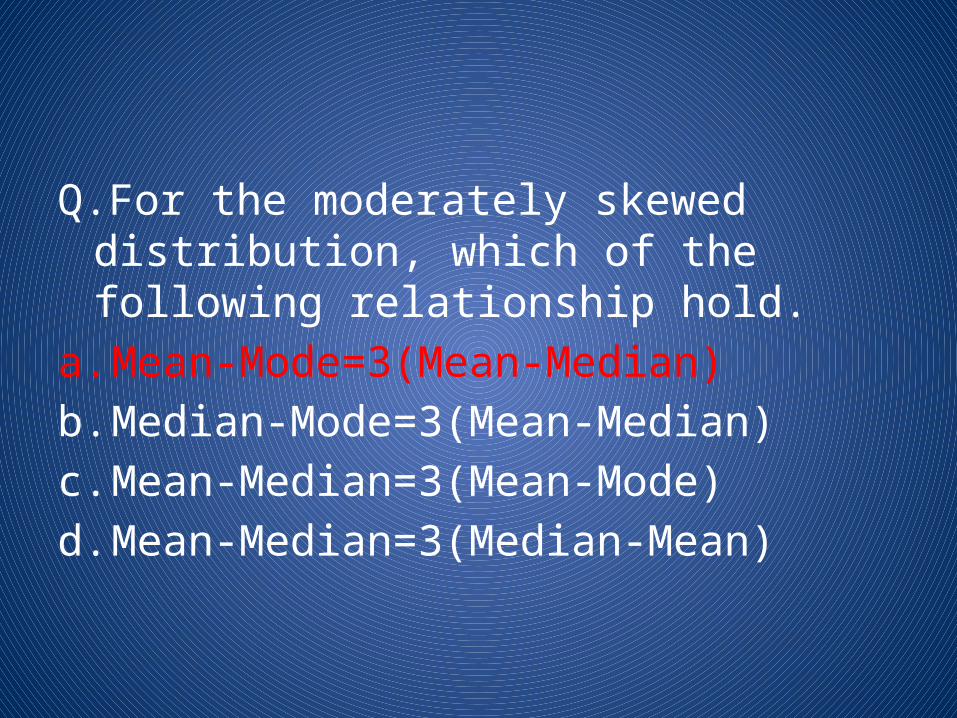
Q.For the moderately skewed distribution, which of the following relationship hold.
a. Mean-Mode=3(Mean-Median)b. Median-Mode=3(Mean-Median)c. Mean-Median=3(Mean-Mode)d. Mean-Median=3(Median-Mean)
Q.For the moderately skewed distribution, which of the following relationship hold.
a. Mean-Mode=3(Mean-Median)b. Median-Mode=3(Mean-Median)c. Mean-Median=3(Mean-Mode)d. Mean-Median=3(Median-Mean)
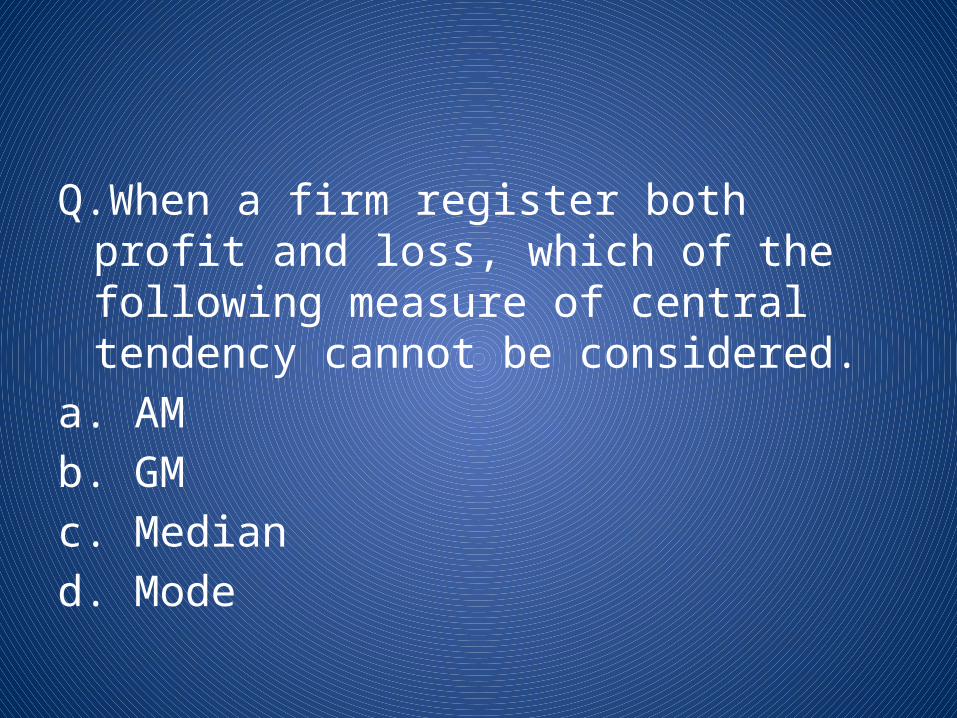
Q.When a firm register both profit and loss, which of the following measure of central tendency cannot be considered.
a. AMb. GMc. Mediand. Mode
Q.When a firm register both profit and loss, which of the following measure of central tendency cannot be considered.
a. AMb. GMc. Mediand. Mode
Q.Which of the following holds for a set of distinct posture observation?
a. AM ≥ GM ≥ HMb. HM ≥ GM ≥ AMc. AM > GM > HMd. GM > AM > HM
Q.Which of the following holds for a set of distinct posture observation?
a. AM ≥ GM ≥ HMb. HM ≥ GM ≥ AMc. AM > GM > HMd. GM > AM > HM
Q.When all observations occurred with equal frequency _______ loss not exit.
a. Medianb. Modec. Meand. None
Q.When all observations occurred with equal frequency _______ loss not exit.
a. Medianb. Modec. Meand. None
Q.Mean of first natural number isa. Frequencyb. (n-1)/2c. (n+1)/2d. None
Q.Mean of first natural number isa. Frequencyb. (n-1)/2c. (n+1)/2d. None
Q. In zoology ________ is used.a. Meanb. Modec. Mediand. None
Q. In zoology ________ is used.a. Meanb. Modec. Mediand. None
Q. Which one is truea. AM=Assumed mean + arithmetic mean of
deviation of termb. GM=Assumed mean + arithmetic mean of
deviation of termc. Bothd. None
Q. Which one is truea. AM=Assumed mean + arithmetic mean of
deviation of termb. GM=Assumed mean + arithmetic mean of
deviation of termc. Bothd. None
Q. For finding AM in step deviation the class interval should be
a. Equal lengthb. Unequal lengthc. Minimumd. None
Q. For finding AM in step deviation the class interval should be
a. Equal lengthb. Unequal lengthc. Minimumd. None
Q. The abscissa of the maximum frequency in the frequency curve is the
a. Meanb. Medianc. Moded. None
Q. The abscissa of the maximum frequency in the frequency curve is the
a. Meanb. Medianc. Moded. None
Q. Mean is the absolute measure and standard deviation is based upon it. Therefore standard deviation is relative measure.
a. Trueb. Falsec. Bothd. None
Q. Mean is the absolute measure and standard deviation is based upon it. Therefore standard deviation is relative measure.
a. Trueb. Falsec. Bothd. None
Q.The mean of the standard deviation is known as
a. Varianceb. Standard deviationc. Mean deviationd. None
Q.The mean of the standard deviation is known as
a. Varianceb. Standard deviationc. Mean deviationd. None

Q.The mean wage of two companies are equal. It signifies that the workers of both companies are well off.
a. Trueb. Falsec. Bothd. None

Q.The mean wage of two companies are equal. It signifies that the workers of both companies are well off.
a. Trueb. Falsec. Bothd. None
Q.”In a moderately asymmetric distribution mean can be found out from the given value of median & mode”----- Prove
a. Trueb. Falsec. Bothd. None
Q.”In a moderately asymmetric distribution mean can be found out from the given value of median & mode”----- Prove
a. Trueb. Falsec. Bothd. None
Q.”The mean of two samples can be combined”– Prove the mathematical properties of mean
a. Trueb. Falsec. Bothd. None
Q.”The mean of two samples can be combined”– Prove the mathematical properties of mean
a. Trueb. Falsec. Bothd. None
Q. ________ is used when sampling variability should be least
a. Modeb. Medianc. Meand. None
Q. ________ is used when sampling variability should be least
a. Modeb. Medianc. Meand. None
Q. ________ is used when sum of deviation from average should be least.
a. Meanb. Modec. Mediand. None
Q. ________ is used when sum of deviation from average should be least.
a. Meanb. Modec. Mediand. None
Q._____ used when variability has to be calculated.
a. AMb. GMc. HMd. None
Q._____ used when variability has to be calculated.
a. AMb. GMc. HMd. None
Q. In _______ the distribution has wide range of variants.
a. Medianb. Modec. Meand. None
Q. In _______ the distribution has wide range of variants.
a. Medianb. Modec. Meand. None
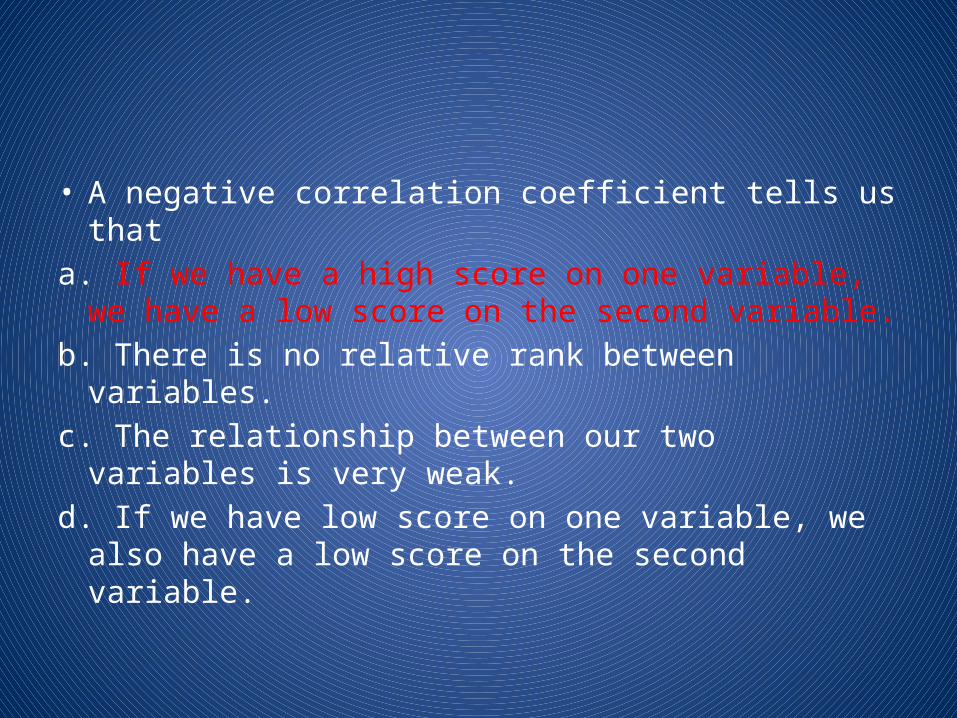
• A negative correlation coefficient tells us thata. If we have a high score on one variable, we have a
low score on the second variable.b. There is no relative rank between variables.c. The relationship between our two variables is very
weak.d. If we have low score on one variable, we also have a
low score on the second variable.
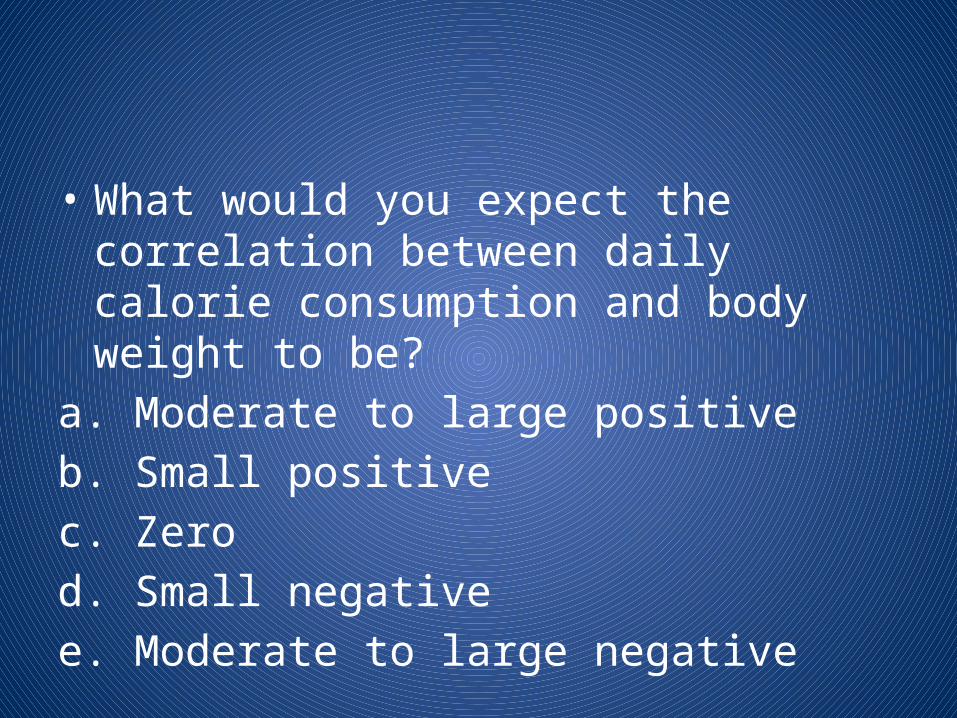
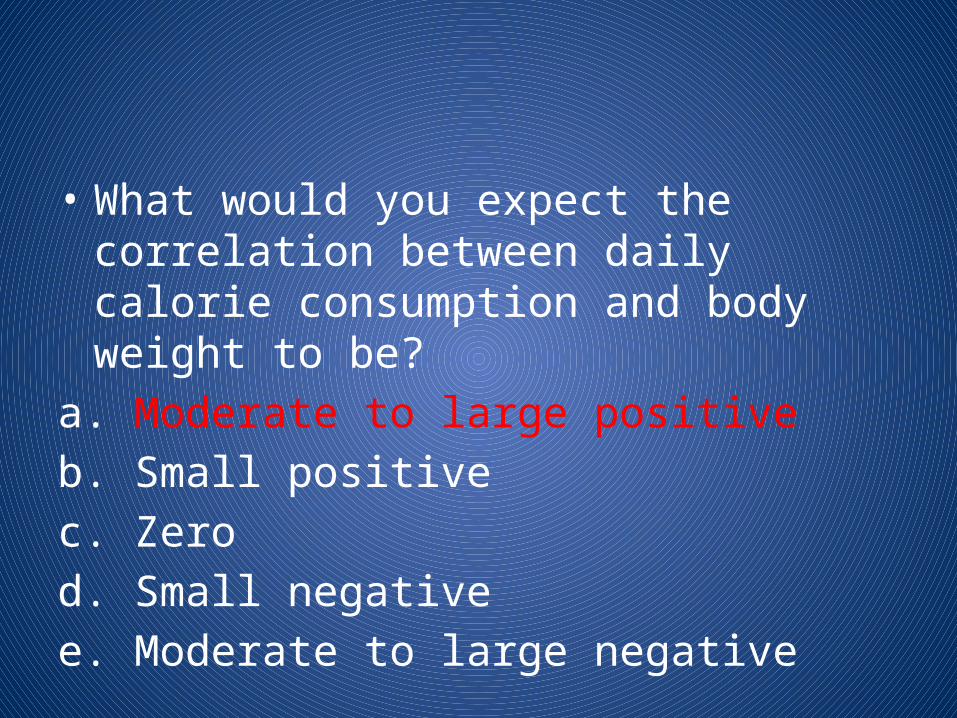
• What would you expect the correlation between daily calorie consumption and body weight to be?
a. Moderate to large positiveb. Small positivec. Zerod. Small negativee. Moderate to large negative
• What would you expect the correlation between daily calorie consumption and body weight to be?
a. Moderate to large positiveb. Small positivec. Zerod. Small negativee. Moderate to large negative
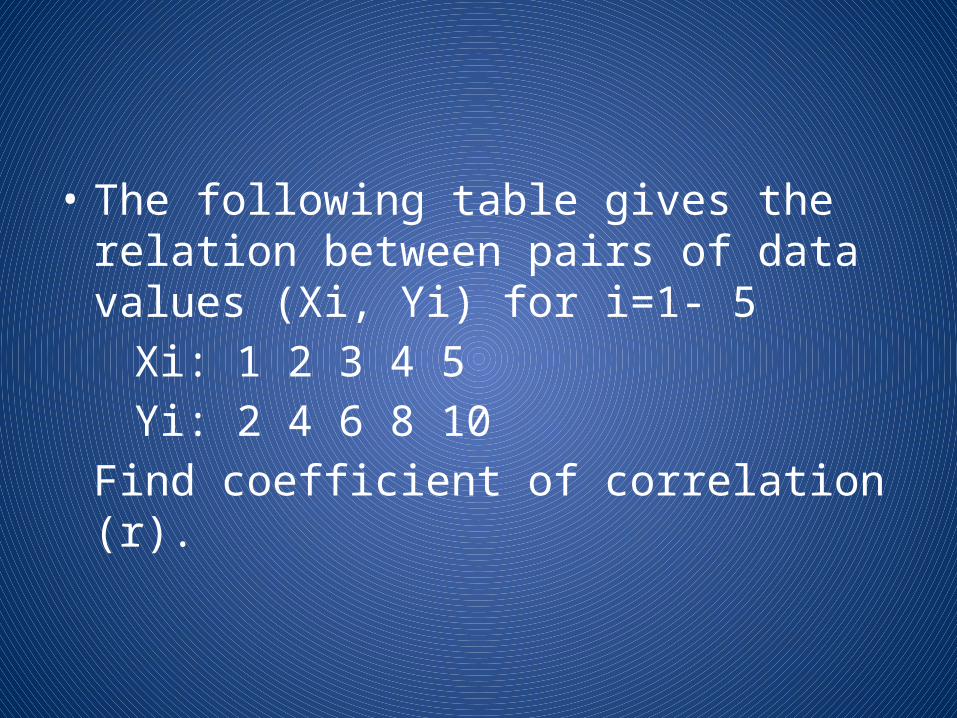
• The following table gives the relation between pairs of data values (Xi, Yi) for i=1- 5
Xi: 1 2 3 4 5 Yi: 2 4 6 8 10
Find coefficient of correlation (r).
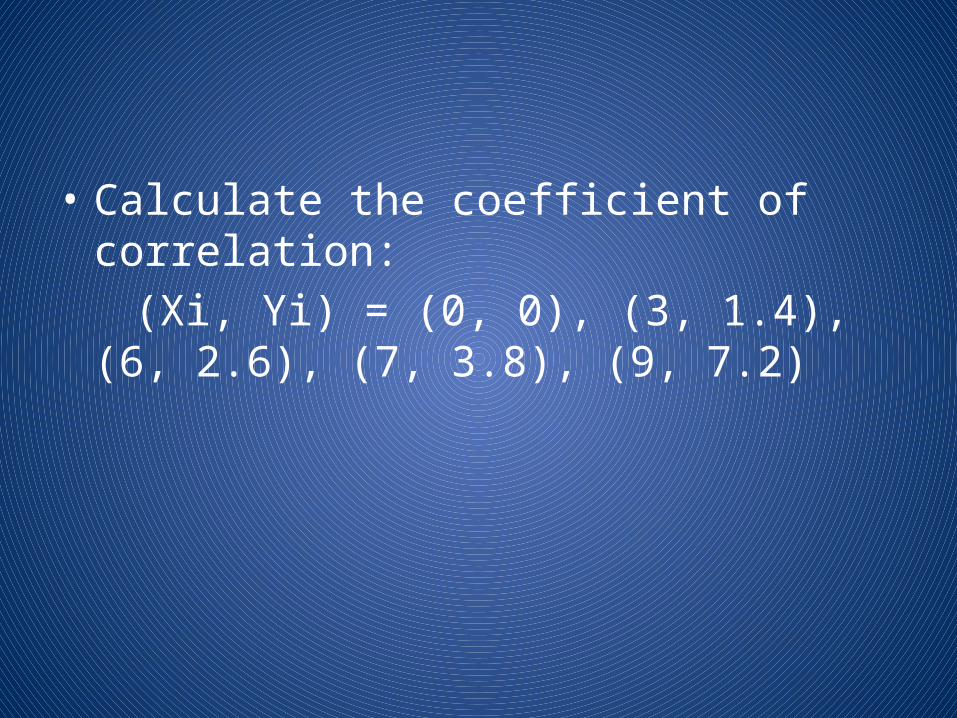
• Calculate the coefficient of correlation: (Xi, Yi) = (0, 0), (3, 1.4), (6, 2.6), (7, 3.8), (9, 7.2)
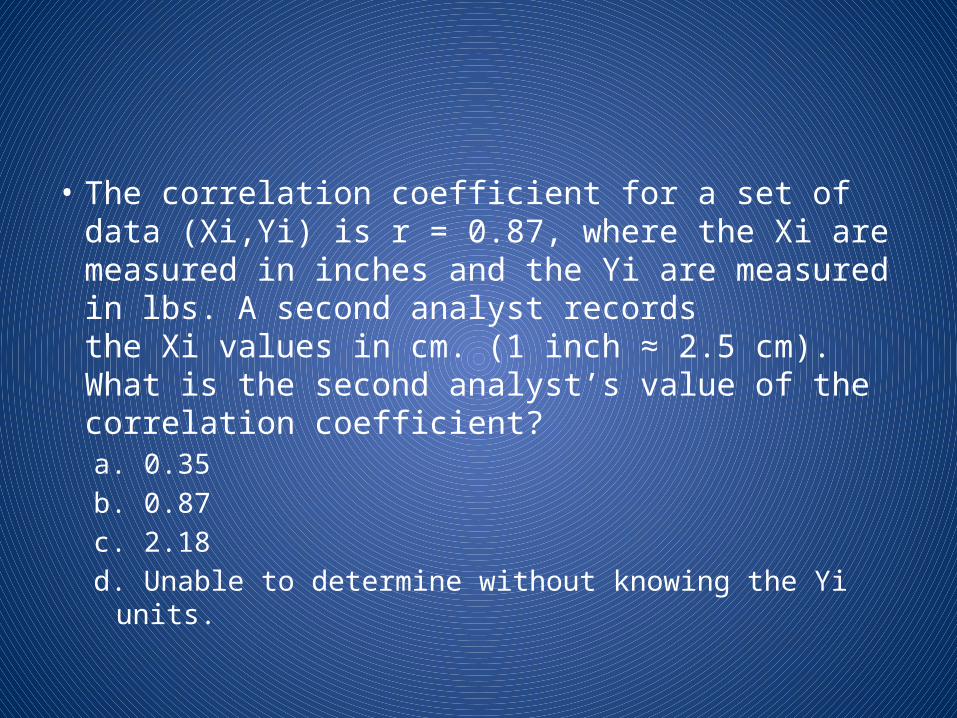
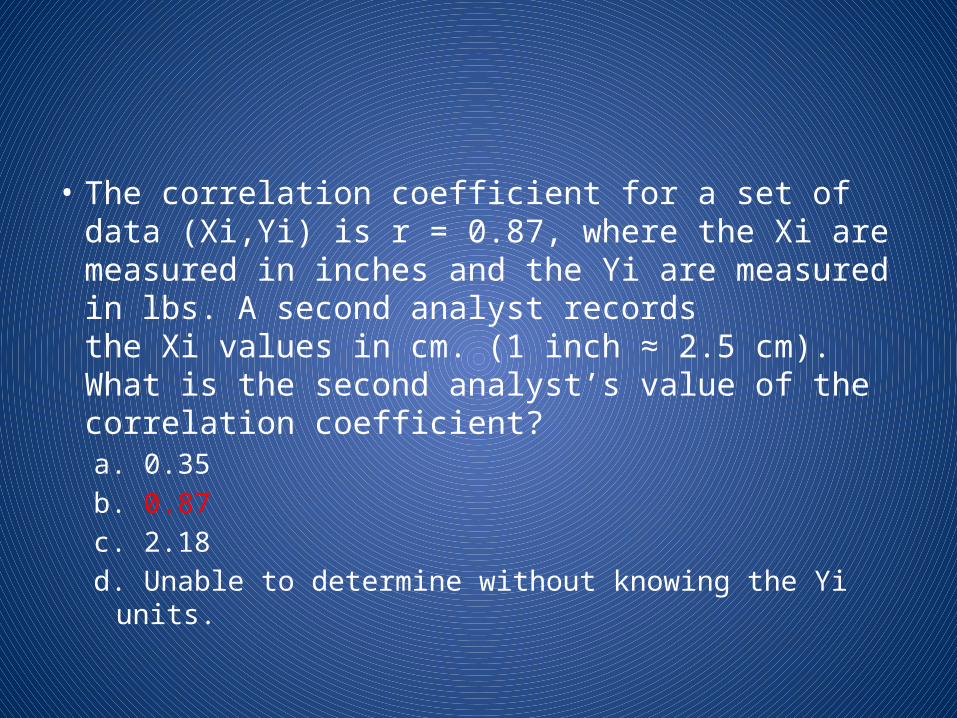
• The correlation coefficient for a set of data (Xi,Yi) is r = 0.87, where the Xi are measured in inches and the Yi are measured in lbs. A second analyst records the Xi values in cm. (1 inch ≈ 2.5 cm). What is the second analyst’s value of the correlation coefficient?a. 0.35b. 0.87c. 2.18d. Unable to determine without knowing the Yi units.
• The correlation coefficient for a set of data (Xi,Yi) is r = 0.87, where the Xi are measured in inches and the Yi are measured in lbs. A second analyst records the Xi values in cm. (1 inch ≈ 2.5 cm). What is the second analyst’s value of the correlation coefficient?a. 0.35b. 0.87c. 2.18d. Unable to determine without knowing the Yi units.
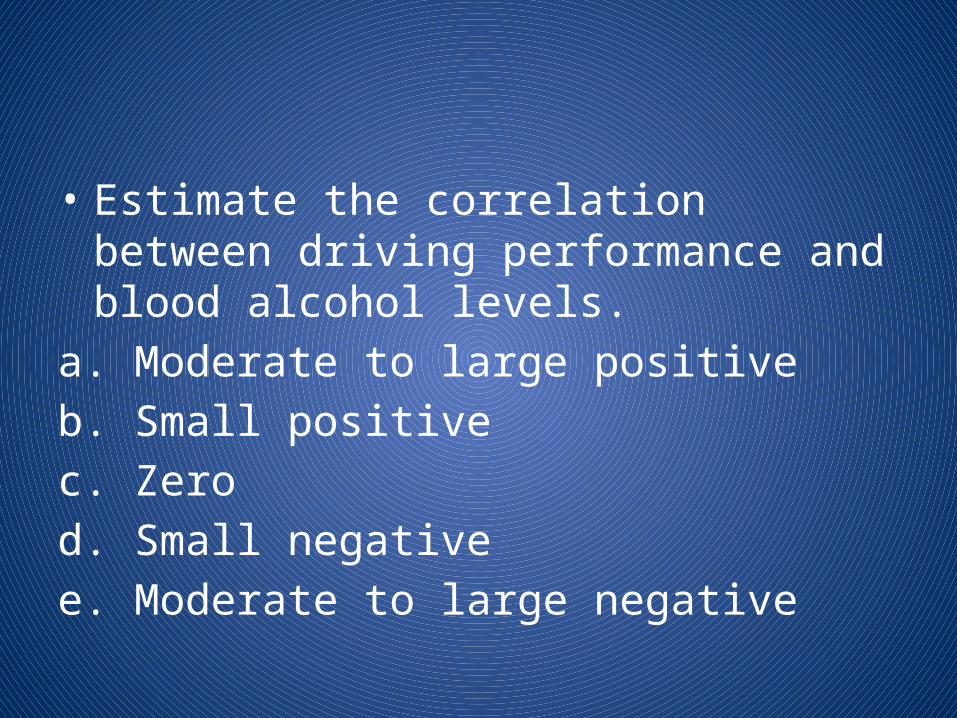
• Estimate the correlation between driving performance and blood alcohol levels.
a. Moderate to large positiveb. Small positivec. Zerod. Small negativee. Moderate to large negative
• Estimate the correlation between driving performance and blood alcohol levels.
a. Moderate to large positiveb. Small positivec. Zerod. Small negativee. Moderate to large negative
• A correlation near +1 means:– The two variables are increasing together.– The two variables are decreasing together– The relationship is extremely strong– All of the above.
• A correlation near +1 means:– The two variables are increasing together.– The two variables are decreasing together– The relationship is extremely strong– All of the above.
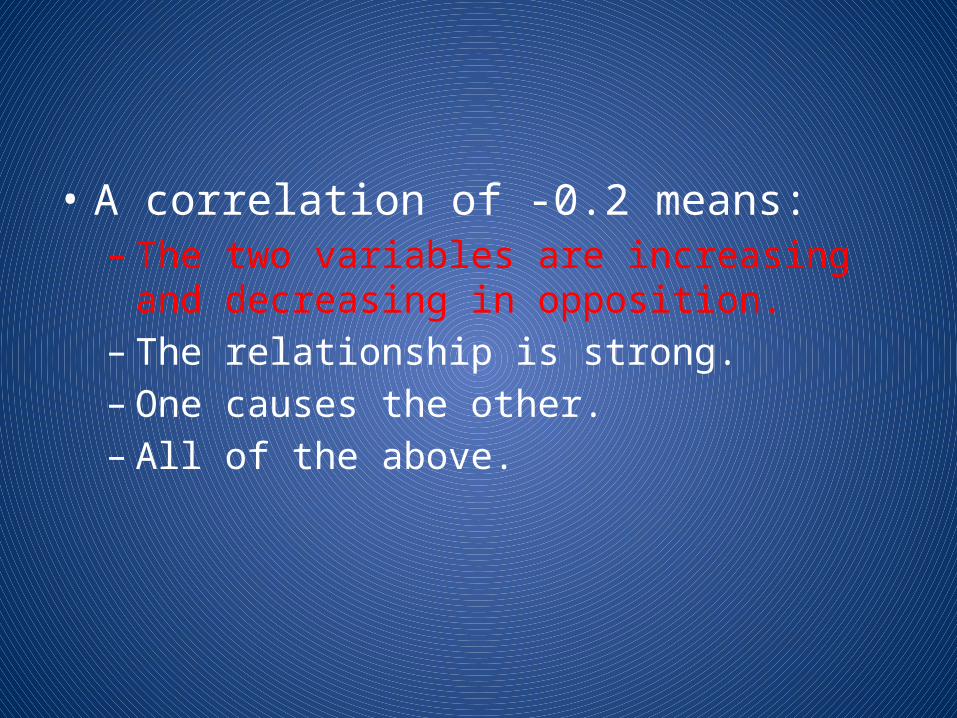
• A correlation of -0.2 means:– The two variables are increasing and decreasing in
opposition.– The relationship is strong.– One causes the other.– All of the above.
• A correlation of -0.2 means:– The two variables are increasing and decreasing in
opposition.– The relationship is strong.– One causes the other.– All of the above.

• Our research found that high Procedural Justice was associated with low stress. Is it accurate to say if you have high Procedural Justice you will have no stress?– True.– False.

• Our research found that high Procedural Justice was associated with low stress. Is it accurate to say if you have high Procedural Justice you will have no stress?– True.– False.

• Our research found that high Procedural Justice was associated increased commitment. Is it accurate to say if you increase your Procedural Justice score you will have a corresponding increase in commitment?– True.– False.

• Our research found that high Procedural Justice was associated increased commitment. Is it accurate to say if you increase your Procedural Justice score you will have a corresponding increase in commitment?– True.– False.

• Our research found that high Procedural Justice was associated with low turnover rates. Is it accurate to say if you have high Procedural Justice you are more likely to have low turnover?– True.– False.

• Our research found that high Procedural Justice was associated with low turnover rates. Is it accurate to say if you have high Procedural Justice you are more likely to have low turnover?– True.– False.
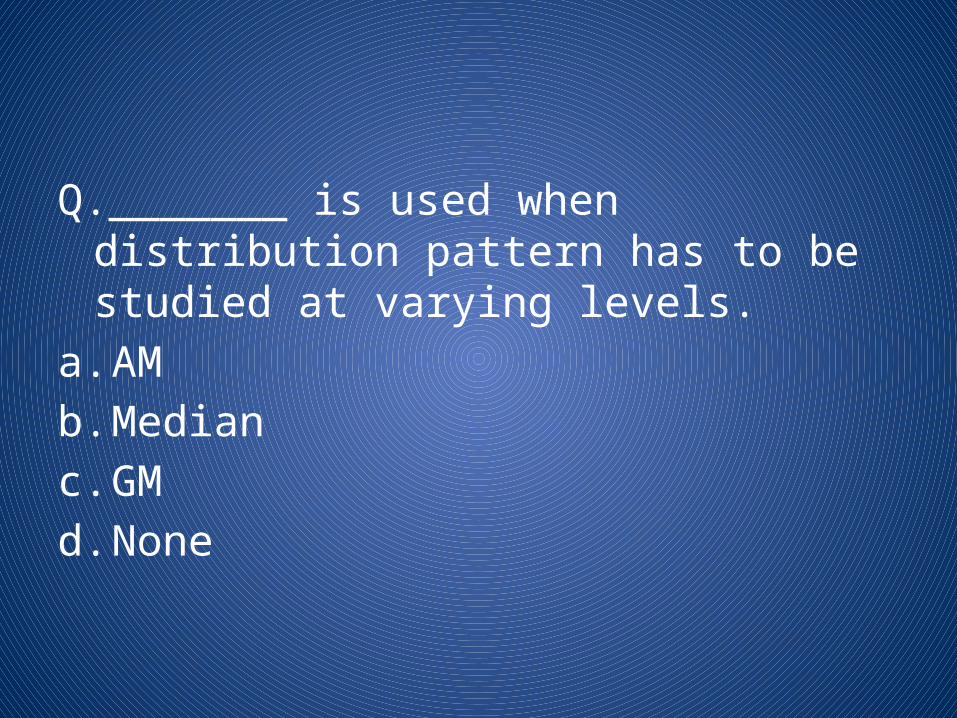
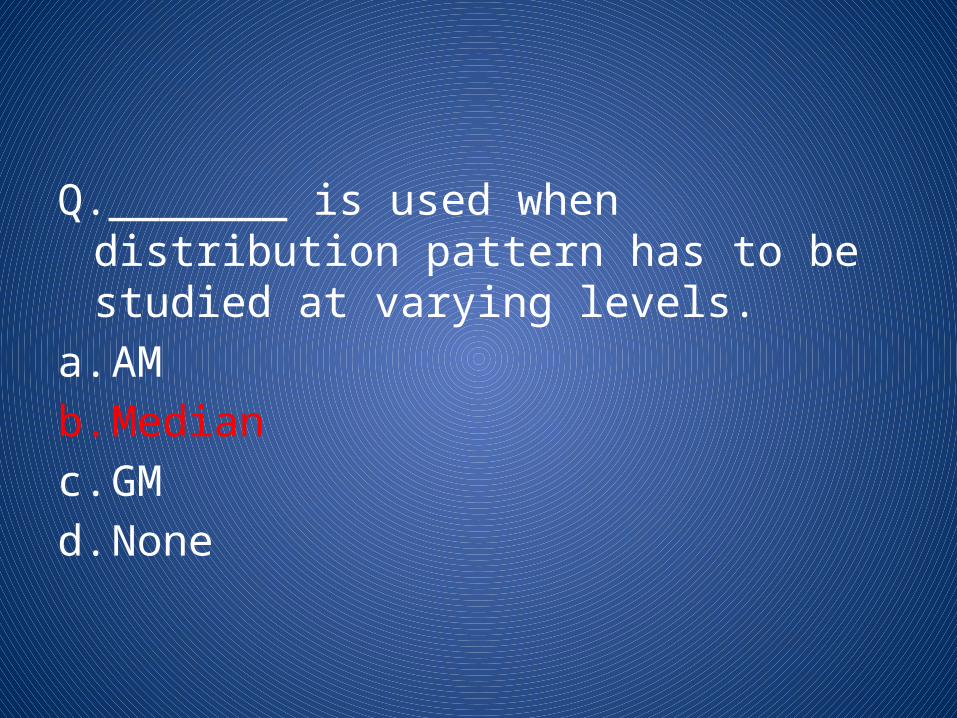
Q._______ is used when distribution pattern has to be studied at varying levels.
a. AMb. Medianc. GMd. None
Q._______ is used when distribution pattern has to be studied at varying levels.
a. AMb. Medianc. GMd. None
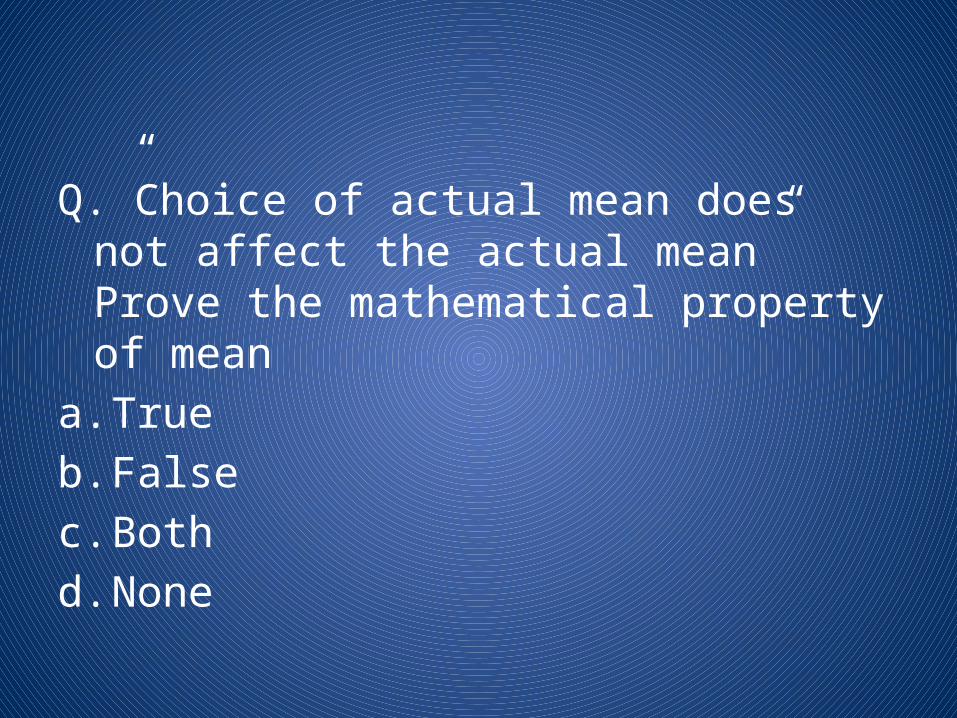
Q.”Choice of actual mean does not affect the actual mean” Prove the mathematical property of mean
a. Trueb. Falsec. Bothd. None
Q.”Choice of actual mean does not affect the actual mean” Prove the mathematical property of mean
a. Trueb. Falsec. Bothd. None
Q. Pooled mean is called.a. (n+1)/2b. (n+1)/4c. 3(n+1)/4d. None
Q. Pooled mean is called.a. (n+1)/2b. (n+1)/4c. 3(n+1)/4d. None
Q.For calculation of _______ we have to construct group frequency distribution
a. Modeb. Meanc. Mediand. None
Q.For calculation of _______ we have to construct group frequency distribution
a. Modeb. Meanc. Mediand. None
Q. _______ is the value of the variable corresponding to highest frequency.
a. Modeb. Medianc. Meand. None
Q. _______ is the value of the variable corresponding to highest frequency.
a. Modeb. Medianc. Meand. None
Q. ________ cannot be treated algebricaly.a. Modeb. Medianc. Meand. None
Q. ________ cannot be treated algebricaly.a. Modeb. Medianc. Meand. None
Q.”Mean has the least sampling variability”a. Trueb. Falsec. Bothd. None
Q.”Mean has the least sampling variability”a. Trueb. Falsec. Bothd. None
Q -A shift of origin has no impact on :
(A) Range(B) Mean Deviation(C) Standard Deviation(D) All these and Quartile Deviation
ANSWER
(A) Range(B) Mean Deviation(C) Standard Deviation(D) All these and Quartile Deviation
Q –For any two numbers Standard Deviation is always :
(A) 2 x Range(B) Half of range(C) Square of range(D) None of these
ANSWER
(A) 2 x Range(B) Half of range(C) Square of range(D) None of these
Q –If all observations are multiplied by 2 then :
(A) New SD would also be multiplied by 2(B) New SD would be half of previous SD(C) New SD would be increased by 2(D) New SD would be decreased by 2Where SD= Standard Deviation
ANSWER
(A) New SD would also be multiplied by 2(B) New SD would be half of previous SD(C) New SD would be increased by 2(D) New SD would be decreased by 2Where SD= Standard Deviation
Q –If the pofits of a company remains the same for the last ten months, then SD of profits for these ten months
would be :
(A) Positive(B) Negetive(C) Zero(D) option a or option c
ANSWER
(A) Positive(B) Negetive(C) Zero(D) option a or option c
Q -When it comes to comparing two or more distributions we consider :
(A) Absolute measure of dispersion(B) Relative measures of dispersion(C) Both option A and option B(D) Either opton A or option B
ANSWER
(A) Absolute measure of dispersion(B) Relative measures of dispersion(C) Both option A and option B(D) Either opton A or option B
Q -If the mean & SD of x are a & b respectively, hen the SD f x-a/b is :
(A) -1(B) 1(C) ab(D) a/b
ANSWER
(A) -1(B) 1(C) ab(D) a/b
Q -The mean & and SD for a,b and 2 are 3 & 1 respectively, value of ab would be:
(A) 5(B) 6(C) 12(D) 3
ANSWER
(A) 5(B) 6(C) 12(D) 3
I. the probability of Y falling in the critical region when the null hypothesis is true is ALPHA
II. the probability of Y falling in the critical region when the alternative hypothesis is true is greater than it not falling in the critical region.
III. the sample size is large
Q-In testing a hypothesis using statistic Y, a critical region is chosen to meet which of the following conditions :
(A) I, II, and III
(B) I and II only(C) I only(D) II only
Q-In testing a hypothesis using statistic Y, a critical region is chosen to meet which of the following
conditions :
(A) I, II, and III
(B) I and II only(C) I only(D) II only
ANSWER
Q- The critical value of a test statistics is determined from:
(A)Calculations from the data(B)Calculations based on many
actual repetitions of the same experiment
(C)The sampling distribution of the statistic assuming H(A)
(D)The sampling distribution of the statistic assuming H(0)
ANSWER
(A)Calculations from the data(B)Calculations based on many
actual repetitions of the same experiment
(C)The sampling distribution of the statistic assuming H(A)
(D)The sampling distribution of the statistic assuming H(0)
•Q: The reasoning in rejecting a null hypothesis is __________.
• (A)That a significant result usually occurs when the null hypothesis is false.
• (B) that a significant result seldom occurs when the null hypothesis is true.
• (C)some reason other than (a) or (b).
• (D)both (a) and (b)
ANSWER
• (A)That a significant result usually occurs when the null hypothesis is false.
• (B) that a significant result seldom occurs when the null hypothesis is true.
• (C)some reason other than (a) or (b).
• (D)both (a) and (b)
•Q: A result was said to be statistically significant at the 5%
level.This means:• (A) the null hypothesis is probably
wrong
• (B)the result would be unexpected if the null hypothesis were true
• (C)the null hypothesis is probably true
• (D) none of the above
•Q: The level of significance is (check all that apply):
• (A) the probability of rejecting the null hypothesis when the null hypothesis is true.
• (B)the magnitude of the sample size.
• (C)symbolized by the greek letter ALPHA.
• (D)none of the above
ANSWER
• (A) the probability of rejecting the null hypothesis when the null hypothesis is true.
• (B)the magnitude of the sample size.
• (C)symbolized by the greek letter ALPHA.
• (D)none of the above
Q: A type I error is always made when:
• (A). the null hypothesis is rejected when it is true
• (B). the null hypothesis is not rejected when it is false
• (C). the research hypothesis is rejected when it is true
• (D). the research hypothesis is not rejected when it is false
Answer:
• (A). the null hypothesis is rejected when it is true
• (B). the null hypothesis is not rejected when it is false
• (C). the research hypothesis is rejected when it is true
• (D). the research hypothesis is not rejected when it is false
• Hidden trend, if any, the data can be noticed in
a. Textual presentationb. Tabulation c. Diagrammatic representationd. All of these
• Hidden trend, if any, the data can be noticed in
a. Textual presentationb. Tabulation c. Diagrammatic representationd. All of these
• The accuracy and consistency of data can be verified by
a. Internal Checkingb. External Checkingc. Scrutinyd. Both a & b
• The accuracy and consistency of data can be verified by
a. Internal Checkingb. External Checkingc. Scrutinyd. Both a & b
Q- The average age of a family of 5 members is 20 years. If the age of the youngest member be 10 yrs then what was the average age at the time of
the birth of the youngest member?
(A) 13.5(B) 14(C) 15(D) 12.5
ANSWER
(A) 13.5(B) 14(C) 15(D) 12.5
Q- Average cost of 5 apples and 4 mangoes is rs. 36. The average cost of 7 apples and 8 mangoes is rs. 48. Find the total cost of 24 apples and 24
mangoes?
(A) 1044(B) 2088(C) 720(D)324
ANSWER
(A) 1044(B) 2088(C) 720(D)324
• Diagrammatic representation of the cumulative frequency distribution is
a. Frequency polygonb. Ogivec. Histogramd. None
• Diagrammatic representation of the cumulative frequency distribution is
a. Frequency polygonb. Ogivec. Histogramd. None
• Curves representing data point in the data set is called
a. Dispersion b. Central Tendencyc. Skewness d. Kurtosis
• Curves representing data point in the data set is called
a. Dispersion b. Central Tendencyc. Skewness d. Kurtosis

• Which of these is not a test for usability of data
a. Sources b. Contradiction of other evidencec. Missing evidenced. None of these

• Which of these is not a test for usability of data
a. Sources b. Contradiction of other evidencec. Missing evidenced. None of these
• As the no. of observations and class increases the shape of a frequency polygon
a. Tend to become increasingly smooth b. Tend to become jaggedc. Stay the samed. Varies only if data become more reliable
• As the no. of observations and class increases the shape of a frequency polygon
a. Tend to become increasingly smooth b. Tend to become jaggedc. Stay the samed. Varies only if data become more reliable
• What are the two subdivision of statistic
• What are the two subdivision of statistic
- Descriptive- Inferential
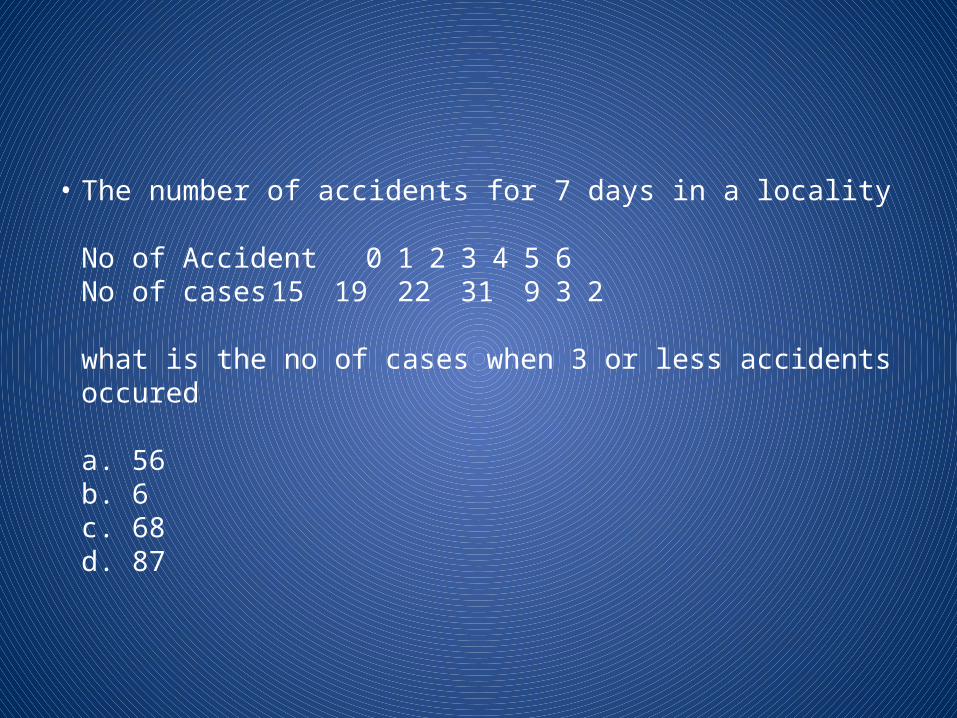
• The number of accidents for 7 days in a locality
No of Accident 0 1 2 3 4 5 6No of cases 15 19 22 31 9 3 2
what is the no of cases when 3 or less accidents occured
a. 56b. 6c. 68d. 87
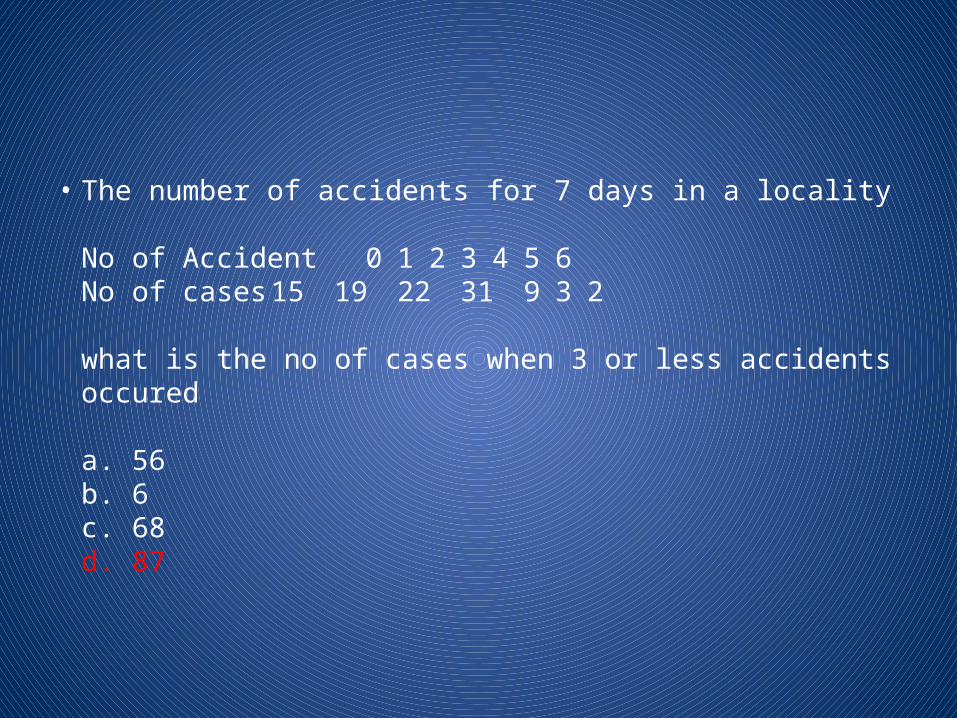
• The number of accidents for 7 days in a locality
No of Accident 0 1 2 3 4 5 6No of cases 15 19 22 31 9 3 2
what is the no of cases when 3 or less accidents occured
a. 56b. 6c. 68d. 87
• Unequal width of classes in frequency distribution do not cause any diffeculty in construction of
a. Ogiveb. Frequency Poligonc. Histogramd. None
• Unequal width of classes in frequency distribution do not cause any diffeculty in construction of
a. Ogiveb. Frequency Poligonc. Histogramd. None
• Consecutive rectangle in a histogram have no space in between
a. Trueb. Falsec. Both d. None
• Consecutive rectangle in a histogram have no space in between
a. Trueb. Falsec. Both d. None

• If we were to connect he midpoint of the consecutive bars of the freq histogram with a series of lines, we would be graphing a frequency polygon
a. Trueb. False

• If we were to connect he midpoint of the consecutive bars of the freq histogram with a series of lines, we would be graphing a frequency polygon
a. Trueb. False

• The breadth of the rectangle is equal to the length of the class interval in
a. Ogiveb. Histogramc. Frequency Polygond. Frequency curve
• The breadth of the rectangle is equal to the length of the class interval in
a. Ogiveb. Histogramc. Frequency Polygond. Frequency curve
• Relative frequency for a particular class
a. Lies between 0 & 1, both inclusiveb. Lies between 0 & 1c. Lies between -1 & 0d. Lies between -1 & 1
• Relative frequency for a particular class
a. Lies between 0 & 1, both inclusiveb. Lies between 0 & 1c. Lies between -1 & 0d. Lies between -1 & 1
• The co. efficient of correlation between two variables
a. Can have any unitb. Is expressed as the product of unit of two variablec. Is a unit of free variabled. None
• The co. efficient of correlation between two variables
a. Can have any unitb. Is expressed as the product of unit of two variablec. Is a unit of free variabled. None
• What are the limits of co eff of concurrent deviation
a. No Limitb. Between -1 & 0 including the limiting valuesc. Between 0 & 1 including the limiting valuesd. Between -1 & 1 the limiting value inclusive
• What are the limits of co eff of concurrent deviation
a. No Limitb. Between -1 & 0 including the limiting valuesc. Between 0 & 1 including the limiting valuesd. Between -1 & 1 the limiting value inclusive

• 16. When we are not concerned with the magnitude of the variable under discuss we consider
a. Rank Correlation co efficientb. Product moment co.relation co effc. Co eff of concurrent deviationd. a or b but not c
• 16. When we are not concerned with the magnitude of the variable under discuss we consider
a. Rank Correlation co efficientb. Product moment co.relation co effc. Co eff of concurrent deviationd. a or b but not c
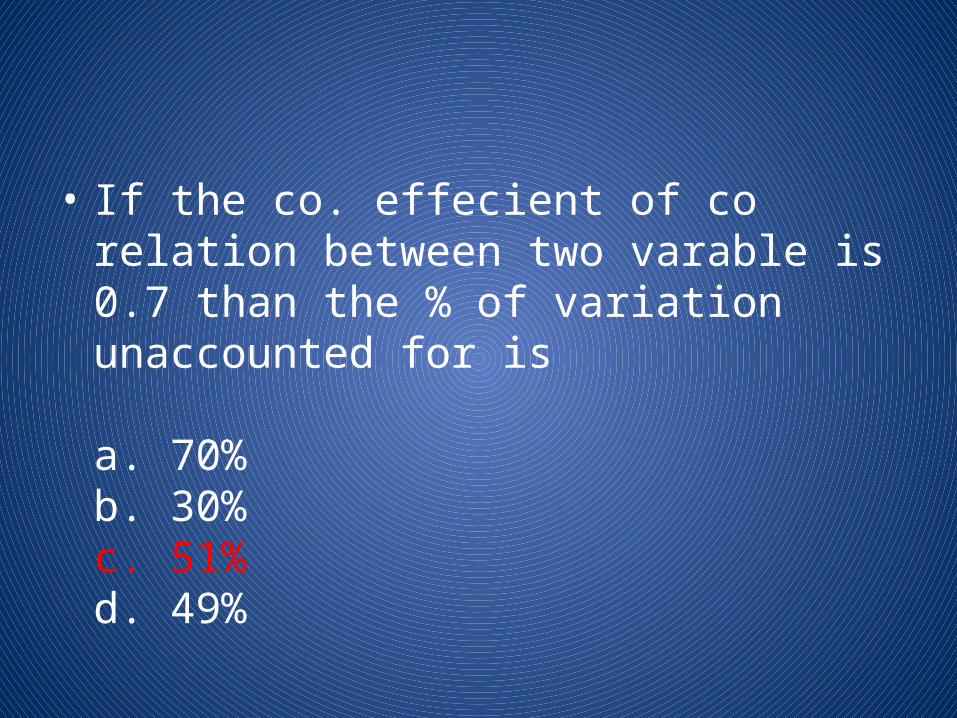
• If the co. effecient of co relation between two varable is 0.7 than the % of variation unaccounted for is
a. 70%b. 30%c. 51%d. 49%
• If the co. effecient of co relation between two varable is 0.7 than the % of variation unaccounted for is
a. 70%b. 30%c. 51%d. 49%
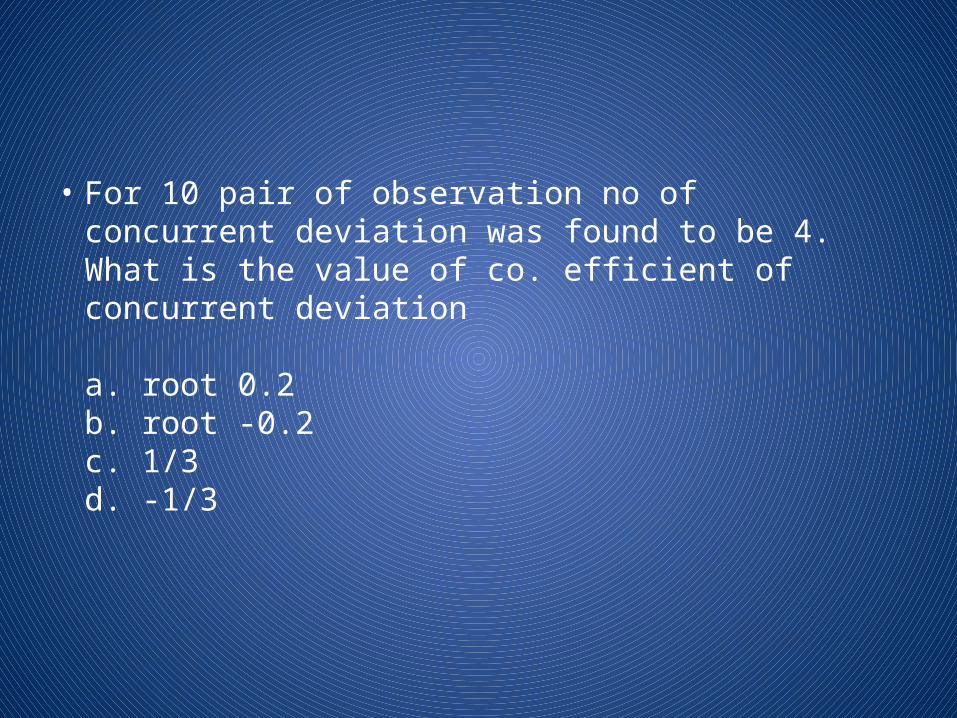
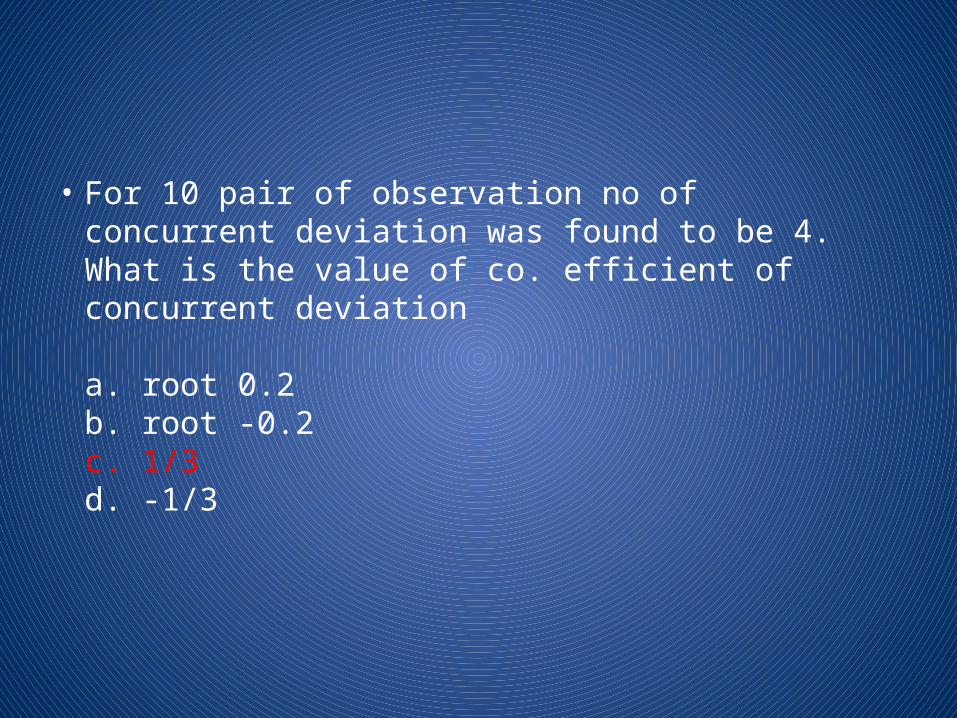
• For 10 pair of observation no of concurrent deviation was found to be 4. What is the value of co. efficient of concurrent deviation
a. root 0.2b. root -0.2c. 1/3d. -1/3
• For 10 pair of observation no of concurrent deviation was found to be 4. What is the value of co. efficient of concurrent deviation
a. root 0.2b. root -0.2c. 1/3d. -1/3