QLD 2006 REDISTRIBUTION STATISTICS the enrolment at close of business on the day the Australian...
215
REDISTRIBUTION STATISTICS Enrolment Projections 2006 REDISTRIBUTION OF QUEENSLAND The statistics in this volume are provided by the Australian Electoral Commission (AEC). They have been prepared for the information of persons or organisations interested in the 2006 redistribution of electoral boundaries for 29 House of Representatives Electoral Divisions in Queensland. The tables in this volume show the electoral enrolment figures as at 2 December 2005 and the projected enrolment figures at 30 November 2007 (the projection time for equality of enrolments for the purposes of Section 63A of the Commonwealth Electoral Act 1918) 1 . The figures are given at the following levels: • Census Collection District (CCD) • Statistical Local Area (SLA) • Electoral Division • State Following a recommendation by the Joint Standing Committee on Electoral Matters (JSCEM) that the AEC and the Australian Bureau of Statistics (ABS) work together on enrolment projections, the ABS has supplied enrolment projections to the AEC using AEC enrolment data as the base. The ABS used a cohort-component method to project the enrolment of each CCD to 30 November 2007. Divisional Returning Officers (DROs) were asked to examine the ABS projections in the light of their local knowledge and experience, and to substitute their own projections where appropriate. DROs made use of information supplied by relevant local authority planning and statistical groups, as well as their own resources in undertaking this task. The Australian Electoral Officer for Queensland also reviewed the projections and any changes made by DROs to ensure a consistent approach. Statistics are given at the CCD level, as this level is the smallest commonly used geographic building block. The CCD figures are aggregated to show the totals for SLAs, which are comprised of a number of CCDs. Being somewhat larger than CCDs, SLAs may be more manageable for those who are interested in less detailed analysis. In most cases, the SLA is equivalent to the Local Government Area (LGA). Totals for each Division and the State are also given. The type of SLA is denoted by a suffix. This is described in detail in the ABS publication Australian Standard Geographical Classification (ASGC), 2001. Briefly, the SLA types are: (B) Borough (C) City (CGC) Community Government Council (DC) District Council 1 On 2 December 2005, in accordance with Section 63A of the Commonwealth Electoral Act 1918, the Australian Electoral Commission determined the projection time for the redistribution of Queensland to be 30 November 2007. This date is the mid point between the expected completion of this current redistribution (end November 2006) and the time when the Electoral Commission believes that the representation entitlement of the State of Queensland is likely to change (November 2008). That Determination was published in Special Gazette S227 on 2 December 2005. i
Transcript of QLD 2006 REDISTRIBUTION STATISTICS the enrolment at close of business on the day the Australian...
REDISTRIBUTION STATISTICS
Enrolment Projections
2006 REDISTRIBUTION OF QUEENSLAND
The statistics in this volume are provided by the Australian Electoral Commission (AEC). They have been prepared for the information of persons or organisations interested in the 2006 redistribution of electoral boundaries for 29 House of Representatives Electoral Divisions in Queensland.
The tables in this volume show the electoral enrolment figures as at 2 December 2005 and the projected enrolment figures at 30 November 2007 (the projection time for equality of enrolments for the purposes of Section 63A of the Commonwealth Electoral Act 1918)1. The figures are given at the following levels:
• Census Collection District (CCD) • Statistical Local Area (SLA) • Electoral Division • State
Following a recommendation by the Joint Standing Committee on Electoral Matters (JSCEM) that the AEC and the Australian Bureau of Statistics (ABS) work together on enrolment projections, the ABS has supplied enrolment projections to the AEC using AEC enrolment data as the base. The ABS used a cohort-component method to project the enrolment of each CCD to 30 November 2007.
Divisional Returning Officers (DROs) were asked to examine the ABS projections in the light of their local knowledge and experience, and to substitute their own projections where appropriate. DROs made use of information supplied by relevant local authority planning and statistical groups, as well as their own resources in undertaking this task. The Australian Electoral Officer for Queensland also reviewed the projections and any changes made by DROs to ensure a consistent approach.
Statistics are given at the CCD level, as this level is the smallest commonly used geographic building block. The CCD figures are aggregated to show the totals for SLAs, which are comprised of a number of CCDs. Being somewhat larger than CCDs, SLAs may be more manageable for those who are interested in less detailed analysis. In most cases, the SLA is equivalent to the Local Government Area (LGA). Totals for each Division and the State are also given.
The type of SLA is denoted by a suffix. This is described in detail in the ABS publication Australian Standard Geographical Classification (ASGC), 2001. Briefly, the SLA types are:
(B) Borough (C) City (CGC) Community Government Council (DC) District Council
1 On 2 December 2005, in accordance with Section 63A of the Commonwealth Electoral Act 1918, the Australian Electoral Commission determined the projection time for the redistribution of Queensland to be 30 November 2007. This date is the mid point between the expected completion of this current redistribution (end November 2006) and the time when the Electoral Commission believes that the representation entitlement of the State of Queensland is likely to change (November 2008). That Determination was published in Special Gazette S227 on 2 December 2005.
i
(M) Municipality (RC) Rural City (S) Shire (T) Town
The statistics shown are broken down according to Electoral Division. Where a CCD or SLA crosses Divisional boundaries, the CCD or SLA concerned will be listed in each Division in which electors are enrolled. Only those electors resident in that Division are included in the figures for such CCDs or SLAs. To calculate the total number of electors shown in a split CCD or SLA, the component parts of the CCD or SLA from each relevant Division must be added together.
Two sets of enrolment statistics are shown. Figures are provided for 2 December 2005, which is the enrolment at close of business on the day the Australian Electoral Commission directed the commencement of the redistribution, and are the figures used for the Electoral Commissioner’s determination of the enrolment quota under Section 65 of the Commonwealth Electoral Act 1918. The Table on page iii sets out the enrolment quota information to apply for this redistribution. Projected enrolment at 30 November 2007 is also given.
A Growth (%) is also given. This is the estimated growth rate for the period December 2005 to November2007. The growth rate shown for each CCD is calculated by subtracting the actual enrolment from the projected enrolment, then dividing by the actual enrolment. The result is expressed as a percentage.
The first page of this volume shows total numbers of CCDs, and the total enrolments and growth rates for each existing Electoral Division in Queensland, as well as a total for the State. The subsequent pages show, for each existing Electoral Division, the name of each SLA in the Division, the identifier number of each CCD in the Division, the two sets of enrolment figures and the growth rates applicable to each CCD and SLA, with totals for the Division.
Maps of existing Electoral Division boundaries are available from the Australian Electoral Officer for Queensland, 7th Floor, 488 Queen Street Brisbane (Telephone 07 3834 3400). Maps of census collection districts can be obtained from the Australian Bureau of Statistics. DATA – CSV FILE A CSV file QLD_CCD.csv is included as a separate link on the AEC website. This file includes enrolment and projected enrolment for each CCD. The file is sorted by electoral division and contains the following information: Division Name;SLA Name;CCD Number;Actual Enrolment;Projected Enrolment If technical difficulties are experienced in accessing this data, please telephone the Federal Redistribution Secretariat in Canberra (02) 6271 4468 or e-mail: [email protected] Access to a personal computer with the software program, Electoral Boundary Mapping System (EBMS), which runs within the commercial software program MapInfo, will be made available for interested persons, at the office of the Redistribution Committee for Queensland. Bookings will be required for half-day sessions and can be made by telephoning (07) 3834 3431 during business hours (9.00 am to 5.00 pm). Some knowledge of the systems will be assumed and only a brief introduction can be offered. Access to this system will be available during the periods allowed for suggestions, comments on suggestions, objections and comments on objections.
ii
Redistribution 2006 – Queensland
Quota Information
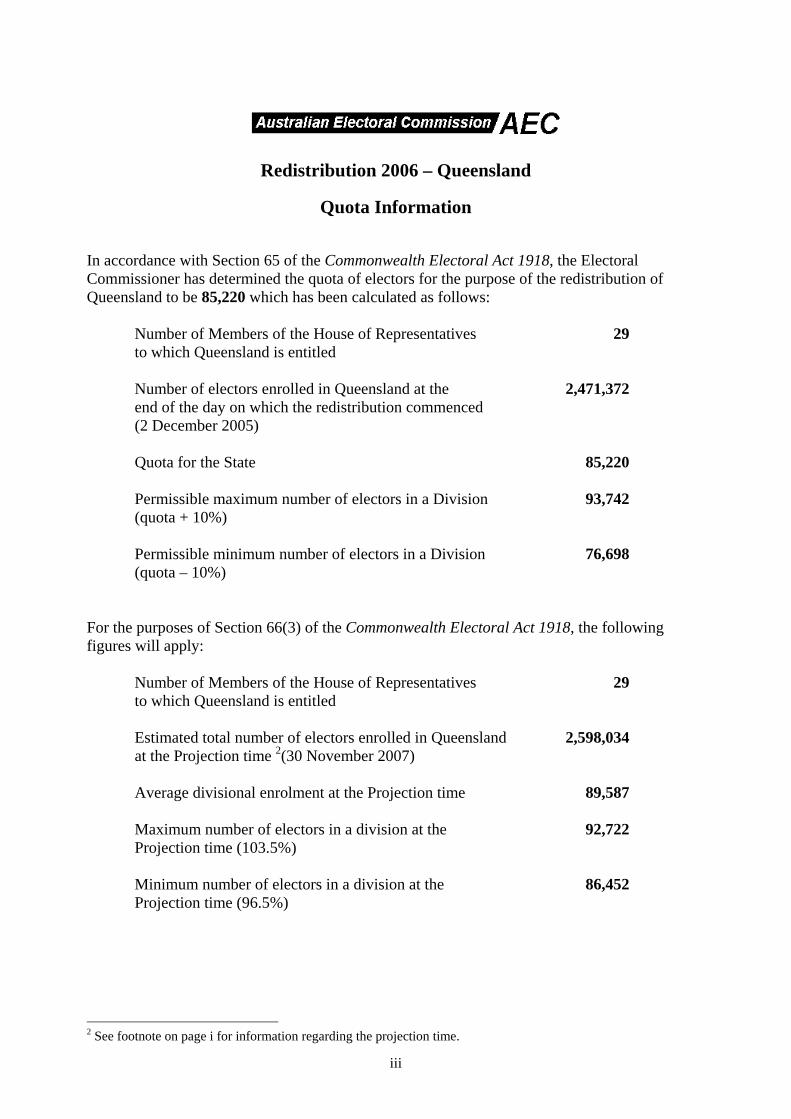
In accordance with Section 65 of the Commonwealth Electoral Act 1918, the Electoral Commissioner has determined the quota of electors for the purpose of the redistribution of Queensland to be 85,220 which has been calculated as follows:
Number of Members of the House of Representatives 29 to which Queensland is entitled Number of electors enrolled in Queensland at the 2,471,372 end of the day on which the redistribution commenced (2 December 2005) Quota for the State 85,220 Permissible maximum number of electors in a Division 93,742 (quota + 10%) Permissible minimum number of electors in a Division 76,698 (quota – 10%)
For the purposes of Section 66(3) of the Commonwealth Electoral Act 1918, the following figures will apply:
Number of Members of the House of Representatives 29 to which Queensland is entitled Estimated total number of electors enrolled in Queensland 2,598,034 at the Projection time 2(30 November 2007) Average divisional enrolment at the Projection time 89,587 Maximum number of electors in a division at the 92,722 Projection time (103.5%) Minimum number of electors in a division at the 86,452 Projection time (96.5%)
2 See footnote on page i for information regarding the projection time.
iii

The Queensland Small Area Population Projections (ABS) This report outlines the method used for producing population and enrolment projections for all Census Collection Districts (CDs) in Queensland, spanning from June 2004 to November 2007. Projection Method The main technique employed for the projections was the cohort-component method, widely accepted as the best way of producing age/sex population projections. It involved applying annual fertility and mortality rates and internal migration and overseas migration by age and sex to the base population to produce a projected population, which then became the base for projecting the next year. This cycle was repeated until the projection horizon was reached. A four-tiered approach was taken in projecting resident population aged 18 years and over for all Statistical Local Areas (SLAs) and CDs in the Queensland. 1. The Queensland population was projected by age and sex. 2. Brisbane/Balance of Qld populations were projected by age and sex (constrained to 1). 3. The population of all Queensland SLAs was projected by age and sex (constrained to 2). 4. The SLA projections were split into CDs. Finally, the projections were grouped into persons aged 18 years and over, and aligned with enrolment data to produce projected enrolments. 1. State/Territory Projections The base population for the Queensland cohort-component projections was revised age/sex Estimated Resident Population (ERP) as at 30 June 2004. Assumptions for the projections were based on both short and long-term trends for each component of population change. These fertility, mortality, overseas migration and interstate migration assumptions were from Series B (the medium scenario) in the latest Population Projections, Australia, 2004-2101 (ABS Cat. No. 3222.0). All States and Territories were in fact independently projected, then constrained to sum to the Australian-level projection. 2. Capital City/Balance of State Projections As per the State/Territory level, the capital city and balance of state projections were taken from Series B in the Population Projections publication. A revised 30 June 2004 ERP base was used, with assumptions reflecting historically observed region-specific patterns of fertility, mortality, overseas migration and internal migration. The Queensland projections acted as control totals. 3. SLA Projections The base population for the SLA cohort-component projections was revised 30 June 2004 SLA age/sex ERP. The fertility, mortality and migration assumptions were based on SLA-specific levels observed during the past decade, constrained to the assumed capital city/balance of state levels and trends. The net migration assumptions also included some adjustments to prevent excessive deviation from State Government population projections for Local Government Areas. SLA age/sex migration profiles were derived from 2001 Census data on place of usual residence one year ago. The ABS regularly collects demographic information down to the SLA level, which means that SLA projections (in contrast to smaller areas) are firmly based on series of known data. At each yearly cycle in this process, the resulting SLA projections were constrained to sum to the capital city/balance of state projections, helping to produce more reliable SLA figures. SLAs with ERP under 500 persons were generally held constant for the projection duration, as assumptions for the accompanying tiny age/sex cells are too unreliable. 4. CD Projections CD projections were formed using extrapolations from 2001-2004 CD ERP constrained to the SLA projections. CD ERP is derived using 2001 Census CD-to-SLA usual residence population proportions updated for post-censal growth using CD building approvals. This approach allows for sub-SLA differential growth while retaining consistency with the SLA projections. The final process adjusts the CD projections for persons aged 18 and over to reflect projected enrolments as at 30 November 2007 using the November 2005 relationship between each CD's
iv

enrolments and its ERP. The lack of demographic data collected regularly at CD level makes it necessary to use such a conversion method as outlined above. While the process is quite complex, it should be reiterated that the basic concept of splitting SLAs to CD level cannot be expected to give projections as reliable as those for SLAs. However, as the end product will be aggregates of large numbers of CDs there is a high likelihood that any random errors or inconsistencies will be statistically offset in the aggregation process. Boundaries CD boundaries are from the Australian Standard Geographical Classification (ASGC), 2001 Edition (ABS Cat. 1216.0), corresponding to those used for the 2001 Census. SLA boundaries are from a subsequent ASGC version, the 2004 Edition. Disclaimer It is important to recognise that the projection results given in this report essentially reflect the assumptions made about future fertility, mortality and migration trends. While these assumptions are formulated on the basis of an objective assessment of historical demographic trends and their likely future dynamics, there can be no certainty that they will be realised. ABS takes responsibility for the method employed, however in accordance with ABS policy regarding small area population projections, the assumptions used are the final responsibility of the client, and the projections are not official ABS population statistics. The projections may be referred to as "...projections prepared by the ABS according to assumptions reflecting prevailing trends agreed to by the Australian Electoral Commission...". No liability will be accepted by the ABS for any damages arising from decisions or actions based upon this population projection consultancy service.
v

Projection methods for the Queensland, Capital City/Balance of State, Statistical Local Areas (SLAs) and Census Collection Districts (CDs) - more details The four-tiered approach outlined in Appendix I has been further disaggregated in this accompanying paper. Apart from the births formulae all equations apply to both sexes, so sex has not been denoted. "State" and "state-level" may refer to either State or Territory. Step 1 - State/Territory/Australia Projections This involved projecting the Queensland population by age and sex, 2004 - 2008. The cohort component method used can be summarised in the formulae below:
x -> age max -> highest age projected (100+ for state; 85+ for sub-state) t -> base year P -> population F -> fertility rate f -> females B -> births Q -> death probability OM -> net overseas migration IM -> net interstate (or internal) migration NM -> net migration (SLA projections only)
In Step 1 the following refer to interstate migration; Step 2 they refer to internal migration; Step 3 they refer to overseas + inter-SLA migration.
DEP -> departures ARR -> arrivals DEPRATE -> per capita departure rate (donor state or capital city-balance or SLA) ARRRATE -> per capita arrival rate (receiving states)
For ages 0 to maximum age - 1: (i) Px+1(t+1) = Px(t) * [1-Qx(t)] + (0.5 * OMx(t)) * (1-(0.5 * Qx(t))) + (0.5 * OMx+1(t)) * (1-(0.5 * Qx+1(t))) (ii) Pmax(t+1) = Pmax(t) * [1-Qmax(t)] + Pmax-1(t) * [1-Qmax-1(t)] + OMmax(t) * (1-(0.5 * Qmax(t))) + (0.5 * OMmax-1(t)) * (1-(0.5 * Qmax-1(t))) Births were then calculated: 49 49
(iii) B(t) = 0.5*[ Σ (Fx(t)*Pf,x(t))+ Σ (Fx(t+1)*Pf,x(t+1))] vi

x=15 x=15 After constraining to projected Australian-level births, these were then used to calculate age 0 in the projected year: (iv) P0(t+1)= B(t)*(1-Qb(t)) + (0.5*OM0(t)) * (1-(0.5*Q0(t))) Interstate migration was calculated by applying departure rates to the Queensland population and arrival rates to the population of the remaining States and Territories (to obtain numbers departing other States to reside in the Queensland). These rates were derived from 1991, 1996 and 2001 Census data and were held constant for the duration of the projection. (v) DEPx(t+1) = Px(t+1) * DEPRATEx (vi) ARRx(t+1) = Px(t+1)
Non-Qld * ARRRATEx The resulting total arrivals and departures were then scaled to a predetermined total net interstate migration assumption. Finally, the arrivals and departures by age and sex were scaled to the new arrival and departure totals, then combined to give net age/sex interstate migration. (vii) IMx(t+1) = ARRx(t+1) - DEPx(t+1) Then add the interstate migration: (viii) Px(t+1) = Px(t+1) + IMx(t+1) To achieve coherent interstate migration figures, projections are concurrently run for all States, Territories and Australia. After constraining of State age/sex population sum to the Australian-level (method described in Step 2), year t+1 then became the base for projecting the next year and the cycle was repeated until the final projection year was reached. Step 2 - Brisbane / Balance of Qld Projections This employs the cohort component method to project Brisbane Statistical Division and the Balance of Qld. The formulae in Step 1 generally apply to these projections, except that the upper age is 85+, fertility rates are by 5yr age of mother and migration arrival levels are used instead of rates. For ages 0 to maximum age - 1: (ix) Px+1(t+1) = Px(t) * [1-Qx(t)] + (0.5 * OMx(t)) * (1-(0.5 * Qx(t))) + (0.5 * OMx+1(t)) * (1-(0.5 * Qx+1(t))) (x) Pmax(t+1) = Pmax(t) * [1-Qmax(t)] + Pmax-1(t) * [1-Qmax-1(t)] + OMmax(t) * (1-(0.5 * Qmax(t))) + (0.5 * OMmax-1(t)) * (1-(0.5 * Qmax-1(t))) Births were then calculated:
vii

45-49 45-49
(xi) B(t) = 0.5*[ Σ (Fx(t)*Pf,x(t))+ Σ (Fx(t+1)*Pf,x(t+1))] x=15-19 x=15-19 After constraining to projected State-level births, these were then used to calculate age 0 in the projected year: (xii) P0(t+1)= B(t)*(1-Qb(t)) + (0.5*OM0(t)) * (1-(0.5*Q0(t))) Capital city-balance of state migration departures were calculated by applying 2001 Census-derived departure rates to the population: (xiii) DEPx(t+1) = Px(t+1) * DEPRATEx Total capital city-balance of state arrivals were then derived using the pre-set net migration assumptions: x=max
(xiv) ARR(t+1) = NM(t+1) - Σ DEPx(t+1)
x=0 (xv) The assumed age-specific arrival levels were derived from 2001 Census data. Together with
departures from (xiii) these were simultaneously constrained (via IPF - see xvii - xix) to: (a) Capital city-balance of state arrival and departure totals (b) State age-specific net migration Then the arrivals and departures were applied to the population projected so far: (xvi) Px(t+1) = Px(t+1) + ARRx(t+1) - DEPx(t+1) Year t+1 then became the base for projecting the next year and the cycle was repeated until the final projection year was reached. However, before Px(t+1) became the new base, the projected capital city-balance of state were constrained to sum to the State projection. This involved a final 2-way iterative proportional fitting (IPF) process; the year is t+1:
CC-Bal -> Capital City or Balance of State region Qld -> Queensland a -> first region z -> last region r -> region number
Scale the regional (capital city-balance of state) totals to the State total: r=z
(xvii) PCC-Bal = PCC-Bal * (PQld / Σ PrCC-Bal)
r=a For each region scale ages to sum to the new region total: x=max
(xviii) PxCC-Bal = Px
CC-Bal * (PCC-Bal / Σ PxrCC-Bal)
x=0
viii

For each age, scale both regions to sum to the State total: r=z
(xix) PxCC-Bal = Px
CC-Bal * (PxQld / Σ Pxr
CC-Bal)
r=a Stages (xviii) and (xix) were then iterated several times before the resulting matrix was rounded. Step 3 - Statistical Local Area Projections This used the cohort component method to project all Queensland SLAs. The formulae in Step 1 generally apply to the SLA projections, except that the upper age is 85+, fertility rates are by 5yr age of mother, migration arrival rates are not used and Net Migration (overseas + inter-SLA) was used instead of overseas and inter-SLA separately. This slightly simpler approach to migration was warranted as the overseas component is negligible in most SLAs in comparison with inter-SLA migration. Furthermore as an annual historical time-series only exists at the SLA level for net migration, any overseas/inter-SLA split can only be approximated using past Census data. For ages 0 to maximum age - 1: (xx) Px+1(t+1) = Px(t) * [1-Qx(t)] (xxi) Pmax(t+1) = Pmax(t) * [1-Qmax(t)] + Pmax-1(t) * [1-Qmax-1(t)] Births were then calculated: 45-49 45-49
(xxii) B(t) = 0.5*(Σ[Fx(t)*Pf,x(t)] + Σ[Fx(t+1) * Pf,x(t+1)]) x=15-19 x=15-19 After constraining to projected capital city/balance of state births, these were then used to calculate age 0 in the projected year: (xxiii) P0(t+1) = B(t) * (1-Qb(t)) SLA migration departures were calculated by applying 2001 Census-derived departure rates to the population: (xxiv) DEPx(t+1) = Px(t+1) * DEPRATEx Total SLA arrivals were then derived using the pre-set net migration assumptions: x=max
(xxv) ARR(t+1) = NM(t+1) - Σ DEPx(t+1)
x=0 (xxvi) The assumed age-specific arrival levels were derived from 2001 Census data. Together with
departures from (xxiv) these were simultaneously constrained (via IPF - see xvii - xix) to: (a) SLA arrival and departure totals (from the previous 2 steps) (b) capital city/balance of state age-specific net internal migration
ix

Then the arrivals and departures were applied to the population projected so far: (xxvii) Px(t+1) = Px(t+1) + ARRx(t+1) - DEPx(t+1) After constraining the SLA age/sex populations to sum to the capital city/balance of state projections using iterative proportional fitting (method described in Step 2), year t+1 then became the base for projecting the next year and the cycle was repeated until the projection horizon was reached. Step 4 - Census Collection District Projections This involved splitting the completed SLA population projections into Census Collection Districts. (xxviii) Each CD's ERP aged 18 and over was extrapolated linearly to November 2007, based on
June 2001 - June 2004 data. (xxix) Results were then aligned so they summed to the SLA projections. Two approaches were
used for this: (a) If extrapolated CDs sum to less than projected SLAs (or both projection &
extrapolation falling) then scale all CDs in the SLA prorata. (b) If the extrapolation was growing faster than the projection, scale down only the
growth CDs according to their share of the growing CDs. This dual approach improved the results for CDs in SLAs where there was widely divergent CD growth. Note: CD ERP uses building approval data by dwelling-type to incorporate differential growth of CDs when disaggregating post-censal SLA ERP. This affects total CD growth rather than targetting age/sex population change. By constraining to SLA ERP it indirectly 'ages' individual cohorts but resulting CD ERP will tend to reflect the 2001 Census age/sex profiles more than would actually be the case in subsequent years. Sometimes more recent building approvals by CD becomes available that has not been included in CD ERP. For CDs showing many new approvals but their extrapolation/projection was not showing growth, extra growth was phased in over the following 3 financial years (to allow for occupancy lags).
x

Conversion of Australian Bureau of Statistics (ABS) Population Projections to Enrolment Projections The Australian Bureau of Statistics (ABS) have calculated projections of the population of Australian residents aged 18 years and over for each Census Collection District (CD) starting with a base at 30 June 2004 annually through to 30 June 2008. To allow baseline comparison with latest electoral roll counts, interpolation was used to derive 15 November 2005 population. The 30 November 2007 population projections were also calculated by interpolating between 30 June figures. For most CDs it was assumed that the proportional relationship between electoral enrolments and resident population aged 18+ will continue. Accordingly, the population projections were converted to enrolment projections as follows: P2005 = ABS projection of residents aged 18+ at 15 November 2005 P2007 = ABS projection of residents aged 18+ at 30 November 2007 E2005 = Enrolled persons at 15 November 2005 E2007 = Projected enrolled persons at 30 November 2007 E2007 = (E2005 / P2005) * P2007 For example, a Census Collection District's figures may be: P2005 = 471 P2007 = 498 E2005 = 411 E2007 = (411 / 471) * 498 = 435 Some CDs with very high growth have low enrolment : population ratios due to lags in occupancy and/or change in enrolment address. These ratios were adjusted upwards as the lags work out over time, adjusting to the degree necessary to maintain the overall State enrolment ratio. In a minority of CDs where enrolments were greater than the baseline population projection, it was assumed that electoral enrolments will grow by the same amount as the population of Australian residents aged 18+, ie: E2007 = E2005 + (P2007 - P2005) For example, a Census Collection District's figures may be: P2005 = 146 P2007 = 228 E2005 = 150 E2007 = 150 + (228-146) = 232 Thereafter the Australian Electoral Commission may amend the enrolment projections for certain CDs based on specific local knowledge of the area.
xi

Queensland
Redistribution Statistics 2006
Enrolment Projections by Division
Division
No of CCDs
Enrolment 2/12/2005
Estimate 30/11/2007
Growth (%)
----------------------------------------------------------------------------------------------------------------------
1
Blair 272 91044 94655 3.97 Bonner 206 86819 89939 3.59 Bowman 196 86435 91374 5.71 Brisbane 272 87660 92073 5.03 Capricornia 319 90614 92797 2.41 Dawson 294 91834 95703 4.21 Dickson 182 84427 89956 6.55 Fadden 218 83917 91109 8.57 Fairfax 255 84338 89597 6.24 Fisher 229 87133 96267 10.48 Forde 222 88410 95205 7.69 Griffith 287 90362 93765 3.77 Groom 255 89131 93381 4.77 Herbert 240 87273 93433 7.06 Hinkler 288 93064 97025 4.26 Kennedy 384 90586 93262 2.95 Leichhardt 330 89611 94049 4.95 Lilley 270 90246 92197 2.16 Longman 209 88064 94242 7.02 McPherson 228 83031 87977 5.96 Maranoa 404 86387 87681 1.50 Moncrieff 277 83369 86831 4.15 Moreton 220 88096 92010 4.44 Oxley 235 91116 98426 8.02 Petrie 206 88684 93708 5.67 Rankin 230 91047 94726 4.04 Ryan 213 86774 90202 3.95 Wide Bay 266 91900 96444 4.94 Queensland 7207 2471372 2598034 5.13

Queensland Redistribution Statistics 2006
Enrolment Projections
----------------------------------------------------------------------------------------------------------------------
2
Blair
---------------------------------------------------------------------------------------------------------------------- SLA Name CCD Number Actual
Enrolment 2/12/2005
Estimate 30/11/2007
Growth (%)
---------------------------------------------------------------------------------------------------------------------- Crow's Nest (S) - Pt B 3-14-21-01 145 145 0.00 Crow's Nest (S) - Pt B 3-14-21-02 106 105 -0.94 Crow's Nest (S) - Pt B 3-14-21-03 82 85 3.66 Crow's Nest (S) - Pt B 3-14-21-04 235 237 0.85 Crow's Nest (S) - Pt B 3-14-21-05 172 185 7.56 Crow's Nest (S) - Pt B 3-14-21-06 444 462 4.05 Crow's Nest (S) - Pt B 3-14-21-07 577 587 1.73 Crow's Nest (S) - Pt B 3-14-22-01 191 198 3.66 Crow's Nest (S) - Pt B 3-14-22-02 387 424 9.56 Crow's Nest (S) - Pt B 3-14-22-03 150 152 1.33 Crow's Nest (S) - Pt B 10 2489 2580 3.66 Esk (S) 3-13-01-01 30 30 0.00 Esk (S) 3-13-01-02 41 42 2.44 Esk (S) 3-13-01-03 119 123 3.36 Esk (S) 3-13-01-04 73 74 1.37 Esk (S) 3-13-01-05 119 121 1.68 Esk (S) 3-13-01-06 334 352 5.39 Esk (S) 3-13-01-07 350 365 4.29 Esk (S) 3-13-01-08 317 325 2.52 Esk (S) 3-13-01-09 367 382 4.09 Esk (S) 3-13-01-10 162 167 3.09 Esk (S) 3-13-01-11 95 101 6.32 Esk (S) 3-13-02-01 258 270 4.65 Esk (S) 3-13-02-02 283 286 1.06 Esk (S) 3-13-02-03 321 328 2.18 Esk (S) 3-13-02-04 405 413 1.98 Esk (S) 3-13-02-05 101 103 1.98 Esk (S) 3-13-02-06 389 404 3.86 Esk (S) 3-13-02-07 310 323 4.19 Esk (S) 3-13-02-08 497 528 6.24 Esk (S) 3-13-02-09 348 360 3.45 Esk (S) 3-13-06-01 432 447 3.47 Esk (S) 3-13-06-03 329 344 4.56 Esk (S) 3-13-06-08 663 705 6.33 Esk (S) 3-13-06-11 191 193 1.05 Esk (S) 3-13-11-01 309 316 2.27 Esk (S) 3-13-11-02 246 277 12.60 Esk (S) 3-13-11-03 436 441 1.15 Esk (S) 3-13-11-04 483 502 3.93 Esk (S) 3-13-11-05 608 624 2.63 Esk (S) 3-13-11-06 440 456 3.64 Esk (S) 3-13-11-07 306 318 3.92 Esk (S) 3-13-11-08 317 322 1.58 Esk (S) 3-13-11-10 138 143 3.62 Esk (S) 3-13-11-11 208 234 12.50
Queensland Redistribution Statistics 2006
Enrolment Projections
----------------------------------------------------------------------------------------------------------------------
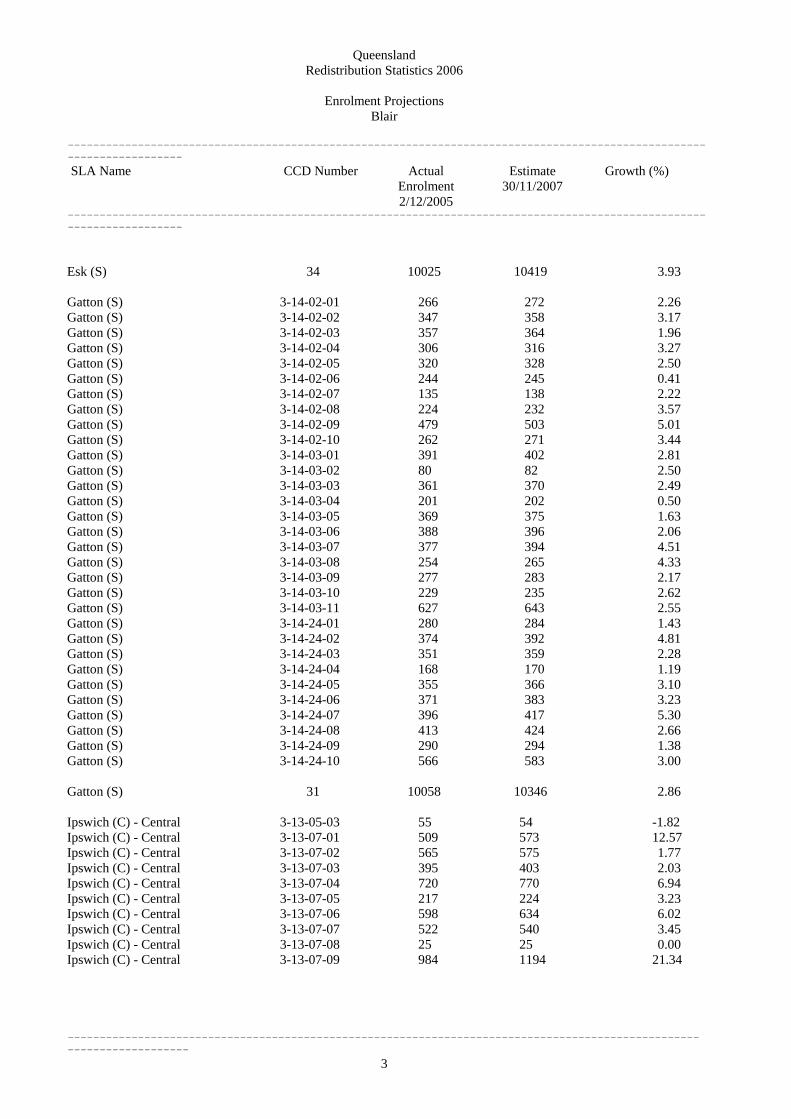
3
Blair
---------------------------------------------------------------------------------------------------------------------- SLA Name CCD Number Actual
Enrolment 2/12/2005
Estimate 30/11/2007
Growth (%)
---------------------------------------------------------------------------------------------------------------------- Esk (S) 34 10025 10419 3.93 Gatton (S) 3-14-02-01 266 272 2.26 Gatton (S) 3-14-02-02 347 358 3.17 Gatton (S) 3-14-02-03 357 364 1.96 Gatton (S) 3-14-02-04 306 316 3.27 Gatton (S) 3-14-02-05 320 328 2.50 Gatton (S) 3-14-02-06 244 245 0.41 Gatton (S) 3-14-02-07 135 138 2.22 Gatton (S) 3-14-02-08 224 232 3.57 Gatton (S) 3-14-02-09 479 503 5.01 Gatton (S) 3-14-02-10 262 271 3.44 Gatton (S) 3-14-03-01 391 402 2.81 Gatton (S) 3-14-03-02 80 82 2.50 Gatton (S) 3-14-03-03 361 370 2.49 Gatton (S) 3-14-03-04 201 202 0.50 Gatton (S) 3-14-03-05 369 375 1.63 Gatton (S) 3-14-03-06 388 396 2.06 Gatton (S) 3-14-03-07 377 394 4.51 Gatton (S) 3-14-03-08 254 265 4.33 Gatton (S) 3-14-03-09 277 283 2.17 Gatton (S) 3-14-03-10 229 235 2.62 Gatton (S) 3-14-03-11 627 643 2.55 Gatton (S) 3-14-24-01 280 284 1.43 Gatton (S) 3-14-24-02 374 392 4.81 Gatton (S) 3-14-24-03 351 359 2.28 Gatton (S) 3-14-24-04 168 170 1.19 Gatton (S) 3-14-24-05 355 366 3.10 Gatton (S) 3-14-24-06 371 383 3.23 Gatton (S) 3-14-24-07 396 417 5.30 Gatton (S) 3-14-24-08 413 424 2.66 Gatton (S) 3-14-24-09 290 294 1.38 Gatton (S) 3-14-24-10 566 583 3.00 Gatton (S) 31 10058 10346 2.86 Ipswich (C) - Central 3-13-05-03 55 54 -1.82 Ipswich (C) - Central 3-13-07-01 509 573 12.57 Ipswich (C) - Central 3-13-07-02 565 575 1.77 Ipswich (C) - Central 3-13-07-03 395 403 2.03 Ipswich (C) - Central 3-13-07-04 720 770 6.94 Ipswich (C) - Central 3-13-07-05 217 224 3.23 Ipswich (C) - Central 3-13-07-06 598 634 6.02 Ipswich (C) - Central 3-13-07-07 522 540 3.45 Ipswich (C) - Central 3-13-07-08 25 25 0.00 Ipswich (C) - Central 3-13-07-09 984 1194 21.34

Queensland Redistribution Statistics 2006
Enrolment Projections
----------------------------------------------------------------------------------------------------------------------
4
Blair
---------------------------------------------------------------------------------------------------------------------- SLA Name CCD Number Actual
Enrolment 2/12/2005
Estimate 30/11/2007
Growth (%)
---------------------------------------------------------------------------------------------------------------------- Ipswich (C) - Central 3-13-07-10 410 426 3.90 Ipswich (C) - Central 3-13-07-11 543 555 2.21 Ipswich (C) - Central 3-13-07-12 743 766 3.10 Ipswich (C) - Central 3-13-07-13 561 586 4.46 Ipswich (C) - Central 3-13-07-14 178 176 -1.12 Ipswich (C) - Central 3-13-18-01 327 358 9.48 Ipswich (C) - Central 3-13-18-02 411 424 3.16 Ipswich (C) - Central 3-13-18-03 222 222 0.00 Ipswich (C) - Central 3-13-18-04 447 458 2.46 Ipswich (C) - Central 3-13-18-05 323 330 2.17 Ipswich (C) - Central 3-13-18-06 587 618 5.28 Ipswich (C) - Central 3-13-18-07 444 448 0.90 Ipswich (C) - Central 3-13-18-08 524 536 2.29 Ipswich (C) - Central 3-13-18-09 655 723 10.38 Ipswich (C) - Central 3-13-18-10 680 708 4.12 Ipswich (C) - Central 3-13-18-11 362 373 3.04 Ipswich (C) - Central 3-13-18-12 557 569 2.15 Ipswich (C) - Central 3-13-18-13 338 347 2.66 Ipswich (C) - Central 3-13-18-14 363 372 2.48 Ipswich (C) - Central 3-13-18-15 211 214 1.42 Ipswich (C) - Central 3-13-19-01 176 182 3.41 Ipswich (C) - Central 3-13-19-02 173 181 4.62 Ipswich (C) - Central 3-13-19-03 137 145 5.84 Ipswich (C) - Central 3-13-19-04 80 81 1.25 Ipswich (C) - Central 3-13-19-05 315 324 2.86 Ipswich (C) - Central 3-13-19-06 99 101 2.02 Ipswich (C) - Central 3-13-19-07 153 159 3.92 Ipswich (C) - Central 3-13-19-08 275 282 2.55 Ipswich (C) - Central 3-13-19-09 308 310 0.65 Ipswich (C) - Central 3-13-20-01 631 642 1.74 Ipswich (C) - Central 3-13-20-02 265 265 0.00 Ipswich (C) - Central 3-13-20-03 291 294 1.03 Ipswich (C) - Central 3-13-20-04 271 275 1.48 Ipswich (C) - Central 3-13-20-05 117 117 0.00 Ipswich (C) - Central 3-13-20-06 195 197 1.03 Ipswich (C) - Central 3-13-20-07 380 388 2.11 Ipswich (C) - Central 3-13-20-08 315 319 1.27 Ipswich (C) - Central 3-13-21-02 365 367 0.55 Ipswich (C) - Central 3-13-21-03 271 274 1.11 Ipswich (C) - Central 3-13-21-04 202 203 0.50 Ipswich (C) - Central 3-13-21-05 357 362 1.40 Ipswich (C) - Central 3-13-21-06 433 437 0.92 Ipswich (C) - Central 3-13-21-07 209 212 1.44 Ipswich (C) - Central 3-13-21-08 112 115 2.68 Ipswich (C) - Central 3-13-21-09 262 268 2.29 Ipswich (C) - Central 3-13-21-10 174 178 2.30 Ipswich (C) - Central 3-13-21-11 278 348 25.18

Queensland Redistribution Statistics 2006
Enrolment Projections
----------------------------------------------------------------------------------------------------------------------
5
Blair
---------------------------------------------------------------------------------------------------------------------- SLA Name CCD Number Actual
Enrolment 2/12/2005
Estimate 30/11/2007
Growth (%)
---------------------------------------------------------------------------------------------------------------------- Ipswich (C) - Central 3-13-21-12 433 433 0.00 Ipswich (C) - Central 3-13-21-13 379 383 1.06 Ipswich (C) - Central 3-13-22-01 135 137 1.48 Ipswich (C) - Central 3-13-22-02 510 523 2.55 Ipswich (C) - Central 3-13-22-03 165 170 3.03 Ipswich (C) - Central 3-13-22-04 417 427 2.40 Ipswich (C) - Central 3-13-22-05 168 229 36.31 Ipswich (C) - Central 3-13-22-06 566 595 5.12 Ipswich (C) - Central 3-13-22-07 255 343 34.51 Ipswich (C) - Central 3-13-22-08 282 289 2.48 Ipswich (C) - Central 3-13-22-09 289 301 4.15 Ipswich (C) - Central 3-13-22-10 249 257 3.21 Ipswich (C) - Central 3-13-22-11 400 415 3.75 Ipswich (C) - Central 3-13-22-12 756 830 9.79 Ipswich (C) - Central 3-13-22-13 535 552 3.18 Ipswich (C) - Central 3-13-22-14 297 306 3.03 Ipswich (C) - Central 3-13-22-15 144 146 1.39 Ipswich (C) - Central 3-13-22-16 364 375 3.02 Ipswich (C) - Central 3-13-22-17 390 409 4.87 Ipswich (C) - Central 3-13-23-01 68 75 10.29 Ipswich (C) - Central 3-13-23-02 351 354 0.85 Ipswich (C) - Central 3-13-23-03 252 259 2.78 Ipswich (C) - Central 3-13-23-04 255 258 1.18 Ipswich (C) - Central 3-13-23-05 205 215 4.88 Ipswich (C) - Central 3-13-23-06 438 466 6.39 Ipswich (C) - Central 3-13-23-07 463 481 3.89 Ipswich (C) - Central 3-13-23-08 259 267 3.09 Ipswich (C) - Central 3-13-23-09 177 178 0.56 Ipswich (C) - Central 3-13-23-10 114 114 0.00 Ipswich (C) - Central 86 29636 31014 4.65 Ipswich (C) - North 3-13-05-01 653 675 3.37 Ipswich (C) - North 3-13-05-02 635 653 2.83 Ipswich (C) - North 3-13-05-05 363 380 4.68 Ipswich (C) - North 3-13-05-06 711 804 13.08 Ipswich (C) - North 3-13-05-07 790 813 2.91 Ipswich (C) - North 3-13-06-04 609 628 3.12 Ipswich (C) - North 3-13-06-05 465 483 3.87 Ipswich (C) - North 3-13-06-09 385 399 3.64 Ipswich (C) - North 3-13-06-12 155 159 2.58 Ipswich (C) - North 3-13-21-01 253 262 3.56 Ipswich (C) - North 10 5019 5256 4.72 Ipswich (C) - South-West 3-13-04-01 206 212 2.91 Ipswich (C) - South-West 3-13-04-03 0 0 0.00

Queensland Redistribution Statistics 2006
Enrolment Projections
----------------------------------------------------------------------------------------------------------------------
6
Blair
---------------------------------------------------------------------------------------------------------------------- SLA Name CCD Number Actual
Enrolment 2/12/2005
Estimate 30/11/2007
Growth (%)
---------------------------------------------------------------------------------------------------------------------- Ipswich (C) - South-West 3-13-04-05 236 247 4.66 Ipswich (C) - South-West 3-13-04-06 289 304 5.19 Ipswich (C) - South-West 3-13-04-07 336 354 5.36 Ipswich (C) - South-West 3-13-04-08 252 260 3.17 Ipswich (C) - South-West 3-13-04-09 117 124 5.98 Ipswich (C) - South-West 3-13-04-10 404 425 5.20 Ipswich (C) - South-West 3-13-04-11 708 751 6.07 Ipswich (C) - South-West 3-13-04-12 167 170 1.80 Ipswich (C) - South-West 10 2715 2847 4.86 Ipswich (C) - West 3-13-03-01 676 704 4.14 Ipswich (C) - West 3-13-03-02 529 541 2.27 Ipswich (C) - West 3-13-03-03 345 360 4.35 Ipswich (C) - West 3-13-03-04 138 141 2.17 Ipswich (C) - West 3-13-03-05 415 427 2.89 Ipswich (C) - West 3-13-03-06 393 400 1.78 Ipswich (C) - West 3-13-03-07 286 296 3.50 Ipswich (C) - West 3-13-03-08 143 146 2.10 Ipswich (C) - West 3-13-03-09 688 698 1.45 Ipswich (C) - West 3-13-03-10 140 142 1.43 Ipswich (C) - West 3-13-03-11 494 506 2.43 Ipswich (C) - West 3-13-03-12 487 506 3.90 Ipswich (C) - West 3-13-03-13 251 258 2.79 Ipswich (C) - West 3-13-03-14 0 0 0.00 Ipswich (C) - West 14 4985 5125 2.81 Kilcoy (S) 3-12-01-01 27 27 0.00 Kilcoy (S) 3-12-01-02 371 384 3.50 Kilcoy (S) 3-12-01-03 59 60 1.69 Kilcoy (S) 3-12-01-04 81 85 4.94 Kilcoy (S) 3-12-01-05 178 188 5.62 Kilcoy (S) 3-12-01-06 408 429 5.15 Kilcoy (S) 3-12-01-07 220 240 9.09 Kilcoy (S) 3-12-01-08 631 656 3.96 Kilcoy (S) 3-12-01-09 280 289 3.21 Kilcoy (S) 9 2255 2358 4.57 Kingaroy (S) 3-10-18-01 434 442 1.84 Kingaroy (S) 3-10-18-02 642 696 8.41 Kingaroy (S) 3-10-18-03 214 212 -0.93 Kingaroy (S) 3-10-18-04 340 355 4.41 Kingaroy (S) 3-10-18-05 640 664 3.75 Kingaroy (S) 3-10-18-06 363 369 1.65 Kingaroy (S) 3-10-18-07 415 429 3.37

Queensland Redistribution Statistics 2006
Enrolment Projections
----------------------------------------------------------------------------------------------------------------------
7
Blair
---------------------------------------------------------------------------------------------------------------------- SLA Name CCD Number Actual
Enrolment 2/12/2005
Estimate 30/11/2007
Growth (%)
---------------------------------------------------------------------------------------------------------------------- Kingaroy (S) 3-10-18-08 145 145 0.00 Kingaroy (S) 3-10-18-09 394 399 1.27 Kingaroy (S) 3-10-18-10 292 301 3.08 Kingaroy (S) 3-10-18-11 515 529 2.72 Kingaroy (S) 3-10-18-12 493 508 3.04 Kingaroy (S) 3-10-19-01 435 449 3.22 Kingaroy (S) 3-10-19-02 643 648 0.78 Kingaroy (S) 3-10-19-03 255 257 0.78 Kingaroy (S) 3-10-19-04 101 104 2.97 Kingaroy (S) 3-10-19-05 111 113 1.80 Kingaroy (S) 3-10-19-06 102 105 2.94 Kingaroy (S) 3-10-19-07 121 123 1.65 Kingaroy (S) 3-10-19-08 350 349 -0.29 Kingaroy (S) 3-10-19-09 346 350 1.16 Kingaroy (S) 3-10-19-10 645 678 5.12 Kingaroy (S) 22 7996 8225 2.86 Laidley (S) 3-14-01-01 212 212 0.00 Laidley (S) 3-14-01-02 647 689 6.49 Laidley (S) 3-14-01-03 377 395 4.77 Laidley (S) 3-14-01-04 440 459 4.32 Laidley (S) 3-14-01-05 436 461 5.73 Laidley (S) 3-14-01-06 415 428 3.13 Laidley (S) 3-14-01-07 260 264 1.54 Laidley (S) 3-14-01-08 409 425 3.91 Laidley (S) 3-14-01-09 285 298 4.56 Laidley (S) 3-14-01-10 422 443 4.98 Laidley (S) 3-14-01-11 319 337 5.64 Laidley (S) 3-14-01-12 288 301 4.51 Laidley (S) 3-14-23-01 293 312 6.48 Laidley (S) 3-14-23-02 500 524 4.80 Laidley (S) 3-14-23-03 109 116 6.42 Laidley (S) 3-14-23-04 263 275 4.56 Laidley (S) 3-14-23-05 249 254 2.01 Laidley (S) 3-14-23-06 281 291 3.56 Laidley (S) 3-14-23-07 563 576 2.31 Laidley (S) 3-14-23-08 462 501 8.44 Laidley (S) 3-14-23-09 553 574 3.80 Laidley (S) 3-14-23-10 686 753 9.77 Laidley (S) 3-14-23-11 340 357 5.00 Laidley (S) 23 8809 9245 4.95 Nanango (S) 3-10-15-01 382 396 3.66 Nanango (S) 3-10-15-02 328 338 3.05 Nanango (S) 3-10-15-03 527 554 5.12

Queensland Redistribution Statistics 2006
Enrolment Projections
----------------------------------------------------------------------------------------------------------------------
8
Blair
---------------------------------------------------------------------------------------------------------------------- SLA Name CCD Number Actual
Enrolment 2/12/2005
Estimate 30/11/2007
Growth (%)
---------------------------------------------------------------------------------------------------------------------- Nanango (S) 3-10-15-04 451 464 2.88 Nanango (S) 3-10-15-05 213 217 1.88 Nanango (S) 3-10-15-06 307 312 1.63 Nanango (S) 3-10-15-07 212 214 0.94 Nanango (S) 3-10-15-08 279 284 1.79 Nanango (S) 3-10-15-09 337 354 5.04 Nanango (S) 3-10-15-10 406 408 0.49 Nanango (S) 3-10-15-11 313 334 6.71 Nanango (S) 3-10-15-12 393 406 3.31 Nanango (S) 3-10-15-13 332 339 2.11 Nanango (S) 3-10-15-14 437 443 1.37 Nanango (S) 3-10-15-15 269 272 1.12 Nanango (S) 3-10-15-16 101 103 1.98 Nanango (S) 3-10-15-17 272 286 5.15 Nanango (S) 3-10-15-18 242 248 2.48 Nanango (S) 3-10-15-19 157 159 1.27 Nanango (S) 19 5958 6131 2.90 Rosalie (S) - Pt B 3-14-20-01 289 292 1.04 Rosalie (S) - Pt B 3-14-20-02 311 313 0.64 Rosalie (S) - Pt B 3-14-20-03 188 188 0.00 Rosalie (S) - Pt B 3-14-20-09 311 316 1.61 Rosalie (S) - Pt B 4 1099 1109 0.91 Blair 272 91044 94655 3.97

Queensland Redistribution Statistics 2006
Enrolment Projections
----------------------------------------------------------------------------------------------------------------------
9
Bonner
---------------------------------------------------------------------------------------------------------------------- SLA Name CCD Number Actual
Enrolment 2/12/2005
Estimate 30/11/2007
Growth (%)
---------------------------------------------------------------------------------------------------------------------- Belmont-Mackenzie 3-20-07-11 625 646 3.36 Belmont-Mackenzie 3-20-07-12 375 453 20.80 Belmont-Mackenzie 3-20-07-16 205 208 1.46 Belmont-Mackenzie 3-20-07-17 454 479 5.51 Belmont-Mackenzie 3-20-15-01 39 40 2.56 Belmont-Mackenzie 3-20-15-02 336 352 4.76 Belmont-Mackenzie 3-20-16-01 506 569 12.45 Belmont-Mackenzie 3-20-16-02 564 592 4.96 Belmont-Mackenzie 8 3104 3339 7.57 Burbank 3-20-18-01 229 236 3.06 Burbank 3-20-18-02 190 188 -1.05 Burbank 3-20-18-03 428 430 0.47 Burbank 3 847 854 0.83 Cannon Hill 3-21-21-06 109 109 0.00 Cannon Hill 1 109 109 0.00 Capalaba West 3-20-19-01 78 78 0.00 Capalaba West 3-20-19-02 140 140 0.00 Capalaba West 2 218 218 0.00 Carina 3-21-18-04 317 319 0.63 Carina 3-21-18-12 351 348 -0.85 Carina 3-21-18-14 748 813 8.69 Carina 3-21-18-15 308 309 0.32 Carina 4 1724 1789 3.77 Carindale 3-21-20-01 450 460 2.22 Carindale 3-21-20-02 614 628 2.28 Carindale 3-21-20-03 553 564 1.99 Carindale 3-21-20-04 496 506 2.02 Carindale 3-21-20-05 351 364 3.70 Carindale 3-21-20-06 591 606 2.54 Carindale 3-21-20-07 361 366 1.39 Carindale 3-21-20-08 491 500 1.83 Carindale 3-21-20-09 523 545 4.21 Carindale 3-21-20-10 718 787 9.61 Carindale 3-21-20-11 445 458 2.92 Carindale 3-21-20-12 526 534 1.52 Carindale 3-21-20-13 472 482 2.12 Carindale 3-21-20-14 721 738 2.36

Queensland Redistribution Statistics 2006
Enrolment Projections
----------------------------------------------------------------------------------------------------------------------
10
Bonner
---------------------------------------------------------------------------------------------------------------------- SLA Name CCD Number Actual
Enrolment 2/12/2005
Estimate 30/11/2007
Growth (%)
---------------------------------------------------------------------------------------------------------------------- Carindale 3-21-20-15 384 412 7.29 Carindale 3-21-20-16 441 481 9.07 Carindale 3-21-20-17 737 752 2.04 Carindale 3-21-20-18 355 365 2.82 Carindale 18 9229 9548 3.46 Chandler 3-20-14-01 100 101 1.00 Chandler 3-20-14-02 276 280 1.45 Chandler 3-20-14-03 383 399 4.18 Chandler 3 759 780 2.77 Eight Mile Plains 3-26-04-09 492 497 1.02 Eight Mile Plains 3-26-04-10 369 384 4.07 Eight Mile Plains 3-26-04-11 904 932 3.10 Eight Mile Plains 3 1765 1813 2.72 Gumdale 3-20-13-01 508 525 3.35 Gumdale 3-20-13-02 157 163 3.82 Gumdale 2 665 688 3.46 Hemmant-Lytton 3-20-02-01 8 9 12.50 Hemmant-Lytton 3-20-06-01 523 535 2.29 Hemmant-Lytton 3-20-06-02 627 660 5.26 Hemmant-Lytton 3-20-06-03 521 577 10.75 Hemmant-Lytton 4 1679 1781 6.08 Holland Park West 3-24-13-05 434 429 -1.15 Holland Park West 3-24-13-06 577 573 -0.69 Holland Park West 3-24-13-07 590 586 -0.68 Holland Park West 3-24-13-08 600 615 2.50 Holland Park West 3-24-13-09 381 380 -0.26 Holland Park West 5 2582 2583 0.04 Lota 3-20-10-01 250 259 3.60 Lota 3-20-10-02 272 272 0.00 Lota 3-20-10-03 432 436 0.93 Lota 3-20-10-04 567 581 2.47 Lota 3-20-10-05 414 442 6.76 Lota 5 1935 1990 2.84

Queensland Redistribution Statistics 2006
Enrolment Projections
----------------------------------------------------------------------------------------------------------------------
11
Bonner
---------------------------------------------------------------------------------------------------------------------- SLA Name CCD Number Actual
Enrolment 2/12/2005
Estimate 30/11/2007
Growth (%)
---------------------------------------------------------------------------------------------------------------------- Manly 3-20-09-01 255 262 2.75 Manly 3-20-09-02 515 534 3.69 Manly 3-20-09-03 476 496 4.20 Manly 3-20-09-04 341 352 3.23 Manly 3-20-09-05 557 563 1.08 Manly 3-20-09-06 545 559 2.57 Manly 6 2689 2766 2.86 Manly West 3-20-08-01 486 512 5.35 Manly West 3-20-08-02 661 773 16.94 Manly West 3-20-08-03 548 578 5.47 Manly West 3-20-08-04 586 604 3.07 Manly West 3-20-08-05 149 149 0.00 Manly West 3-20-08-06 352 368 4.55 Manly West 3-20-08-07 536 539 0.56 Manly West 3-20-08-08 462 467 1.08 Manly West 3-20-08-09 237 256 8.02 Manly West 3-20-08-10 328 331 0.91 Manly West 3-20-08-11 344 347 0.87 Manly West 3-20-08-12 338 340 0.59 Manly West 3-20-08-13 677 690 1.92 Manly West 3-20-08-14 399 403 1.00 Manly West 3-20-08-15 486 575 18.31 Manly West 3-20-08-16 237 243 2.53 Manly West 16 6826 7175 5.11 Mansfield 3-24-10-01 541 548 1.29 Mansfield 3-24-10-02 817 900 10.16 Mansfield 3-24-10-03 604 613 1.49 Mansfield 3-24-10-04 285 289 1.40 Mansfield 3-24-10-05 245 248 1.22 Mansfield 3-24-10-06 668 677 1.35 Mansfield 3-24-10-07 375 379 1.07 Mansfield 3-24-10-08 314 319 1.59 Mansfield 3-24-10-09 513 519 1.17 Mansfield 3-24-10-10 438 442 0.91 Mansfield 3-24-10-11 615 620 0.81 Mansfield 3-24-10-12 475 477 0.42 Mansfield 3-24-10-13 587 635 8.18 Mansfield 3-24-10-14 518 528 1.93 Mansfield 14 6995 7194 2.84 Moreton Island 3-20-01-01 51 51 0.00 Moreton Island 3-20-01-02 93 92 -1.08
Queensland Redistribution Statistics 2006
Enrolment Projections
----------------------------------------------------------------------------------------------------------------------
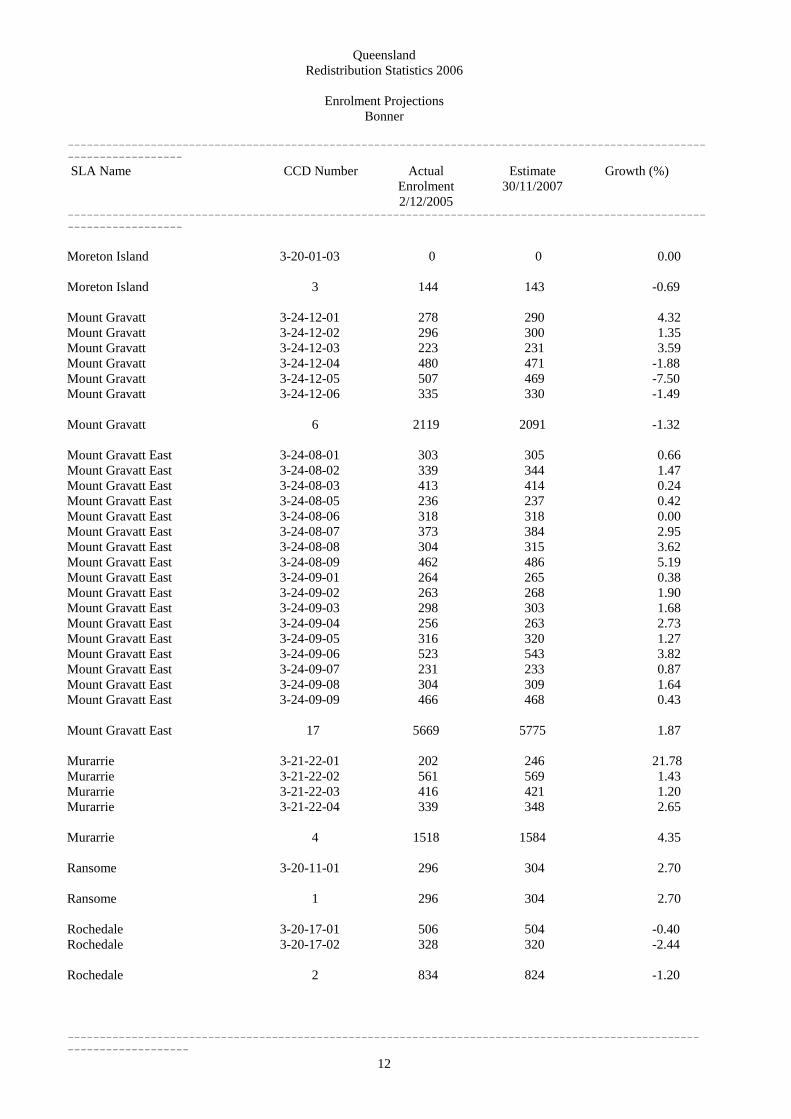
12
Bonner
---------------------------------------------------------------------------------------------------------------------- SLA Name CCD Number Actual
Enrolment 2/12/2005
Estimate 30/11/2007
Growth (%)
---------------------------------------------------------------------------------------------------------------------- Moreton Island 3-20-01-03 0 0 0.00 Moreton Island 3 144 143 -0.69 Mount Gravatt 3-24-12-01 278 290 4.32 Mount Gravatt 3-24-12-02 296 300 1.35 Mount Gravatt 3-24-12-03 223 231 3.59 Mount Gravatt 3-24-12-04 480 471 -1.88 Mount Gravatt 3-24-12-05 507 469 -7.50 Mount Gravatt 3-24-12-06 335 330 -1.49 Mount Gravatt 6 2119 2091 -1.32 Mount Gravatt East 3-24-08-01 303 305 0.66 Mount Gravatt East 3-24-08-02 339 344 1.47 Mount Gravatt East 3-24-08-03 413 414 0.24 Mount Gravatt East 3-24-08-05 236 237 0.42 Mount Gravatt East 3-24-08-06 318 318 0.00 Mount Gravatt East 3-24-08-07 373 384 2.95 Mount Gravatt East 3-24-08-08 304 315 3.62 Mount Gravatt East 3-24-08-09 462 486 5.19 Mount Gravatt East 3-24-09-01 264 265 0.38 Mount Gravatt East 3-24-09-02 263 268 1.90 Mount Gravatt East 3-24-09-03 298 303 1.68 Mount Gravatt East 3-24-09-04 256 263 2.73 Mount Gravatt East 3-24-09-05 316 320 1.27 Mount Gravatt East 3-24-09-06 523 543 3.82 Mount Gravatt East 3-24-09-07 231 233 0.87 Mount Gravatt East 3-24-09-08 304 309 1.64 Mount Gravatt East 3-24-09-09 466 468 0.43 Mount Gravatt East 17 5669 5775 1.87 Murarrie 3-21-22-01 202 246 21.78 Murarrie 3-21-22-02 561 569 1.43 Murarrie 3-21-22-03 416 421 1.20 Murarrie 3-21-22-04 339 348 2.65 Murarrie 4 1518 1584 4.35 Ransome 3-20-11-01 296 304 2.70 Ransome 1 296 304 2.70 Rochedale 3-20-17-01 506 504 -0.40 Rochedale 3-20-17-02 328 320 -2.44 Rochedale 2 834 824 -1.20
Queensland Redistribution Statistics 2006
Enrolment Projections
----------------------------------------------------------------------------------------------------------------------
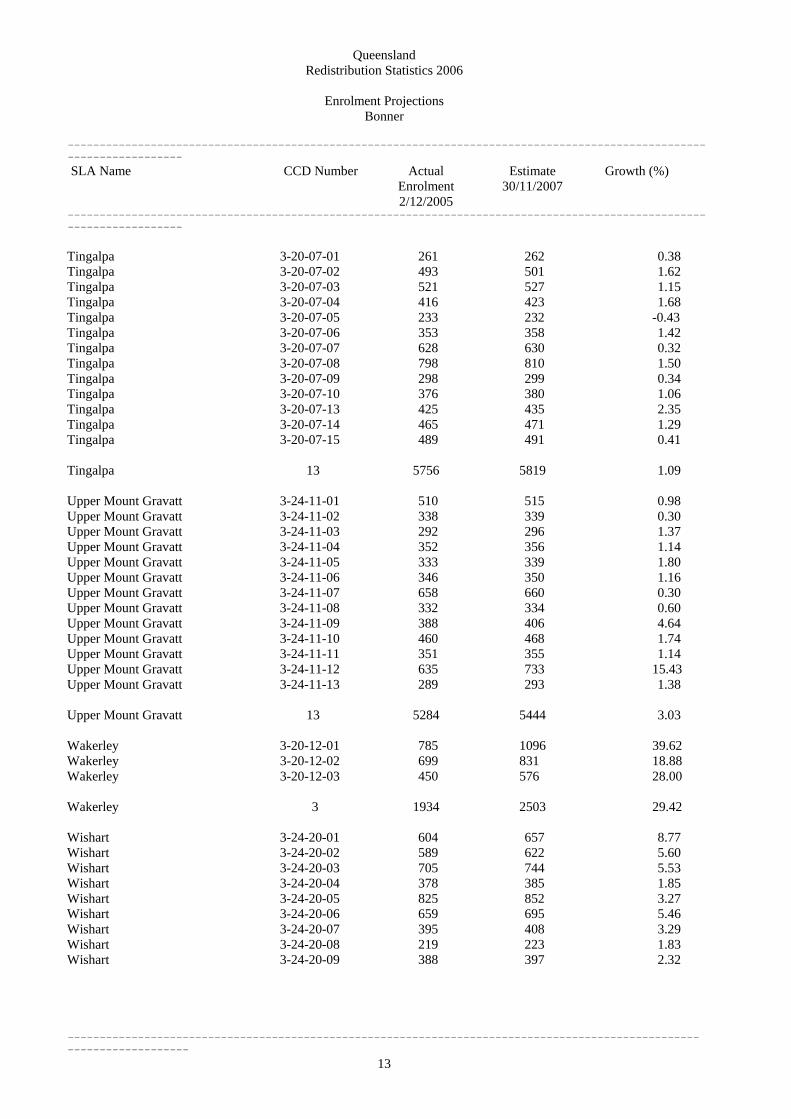
13
Bonner
---------------------------------------------------------------------------------------------------------------------- SLA Name CCD Number Actual
Enrolment 2/12/2005
Estimate 30/11/2007
Growth (%)
---------------------------------------------------------------------------------------------------------------------- Tingalpa 3-20-07-01 261 262 0.38 Tingalpa 3-20-07-02 493 501 1.62 Tingalpa 3-20-07-03 521 527 1.15 Tingalpa 3-20-07-04 416 423 1.68 Tingalpa 3-20-07-05 233 232 -0.43 Tingalpa 3-20-07-06 353 358 1.42 Tingalpa 3-20-07-07 628 630 0.32 Tingalpa 3-20-07-08 798 810 1.50 Tingalpa 3-20-07-09 298 299 0.34 Tingalpa 3-20-07-10 376 380 1.06 Tingalpa 3-20-07-13 425 435 2.35 Tingalpa 3-20-07-14 465 471 1.29 Tingalpa 3-20-07-15 489 491 0.41 Tingalpa 13 5756 5819 1.09 Upper Mount Gravatt 3-24-11-01 510 515 0.98 Upper Mount Gravatt 3-24-11-02 338 339 0.30 Upper Mount Gravatt 3-24-11-03 292 296 1.37 Upper Mount Gravatt 3-24-11-04 352 356 1.14 Upper Mount Gravatt 3-24-11-05 333 339 1.80 Upper Mount Gravatt 3-24-11-06 346 350 1.16 Upper Mount Gravatt 3-24-11-07 658 660 0.30 Upper Mount Gravatt 3-24-11-08 332 334 0.60 Upper Mount Gravatt 3-24-11-09 388 406 4.64 Upper Mount Gravatt 3-24-11-10 460 468 1.74 Upper Mount Gravatt 3-24-11-11 351 355 1.14 Upper Mount Gravatt 3-24-11-12 635 733 15.43 Upper Mount Gravatt 3-24-11-13 289 293 1.38 Upper Mount Gravatt 13 5284 5444 3.03 Wakerley 3-20-12-01 785 1096 39.62 Wakerley 3-20-12-02 699 831 18.88 Wakerley 3-20-12-03 450 576 28.00 Wakerley 3 1934 2503 29.42 Wishart 3-24-20-01 604 657 8.77 Wishart 3-24-20-02 589 622 5.60 Wishart 3-24-20-03 705 744 5.53 Wishart 3-24-20-04 378 385 1.85 Wishart 3-24-20-05 825 852 3.27 Wishart 3-24-20-06 659 695 5.46 Wishart 3-24-20-07 395 408 3.29 Wishart 3-24-20-08 219 223 1.83 Wishart 3-24-20-09 388 397 2.32

Queensland Redistribution Statistics 2006
Enrolment Projections
----------------------------------------------------------------------------------------------------------------------
14
Bonner
---------------------------------------------------------------------------------------------------------------------- SLA Name CCD Number Actual
Enrolment 2/12/2005
Estimate 30/11/2007
Growth (%)
---------------------------------------------------------------------------------------------------------------------- Wishart 3-24-20-10 541 549 1.48 Wishart 3-24-20-11 477 498 4.40 Wishart 3-24-20-12 707 725 2.55 Wishart 3-24-20-13 533 549 3.00 Wishart 13 7020 7304 4.05 Wynnum 3-20-03-01 434 437 0.69 Wynnum 3-20-03-02 402 400 -0.50 Wynnum 3-20-03-03 360 383 6.39 Wynnum 3-20-03-04 519 533 2.70 Wynnum 3-20-03-05 338 344 1.78 Wynnum 3-20-03-06 250 250 0.00 Wynnum 3-20-03-07 372 371 -0.27 Wynnum 3-20-03-08 176 178 1.14 Wynnum 3-20-03-09 343 348 1.46 Wynnum 3-20-03-10 235 238 1.28 Wynnum 3-20-03-13 419 422 0.72 Wynnum 3-20-04-01 371 377 1.62 Wynnum 3-20-04-02 283 286 1.06 Wynnum 3-20-04-03 436 458 5.05 Wynnum 3-20-04-04 209 210 0.48 Wynnum 3-20-04-05 570 608 6.67 Wynnum 3-20-04-06 265 275 3.77 Wynnum 3-20-04-07 437 449 2.75 Wynnum 3-20-04-08 443 450 1.58 Wynnum 3-20-04-09 572 581 1.57 Wynnum 3-20-04-10 390 399 2.31 Wynnum 21 7824 7997 2.21 Wynnum West 3-20-03-11 289 297 2.77 Wynnum West 3-20-03-12 224 230 2.68 Wynnum West 3-20-05-01 465 471 1.29 Wynnum West 3-20-05-02 482 482 0.00 Wynnum West 3-20-05-03 500 510 2.00 Wynnum West 3-20-05-04 690 721 4.49 Wynnum West 3-20-05-05 505 511 1.19 Wynnum West 3-20-05-06 840 926 10.24 Wynnum West 3-20-05-07 627 627 0.00 Wynnum West 3-20-05-08 190 193 1.58 Wynnum West 3-20-05-09 386 390 1.04 Wynnum West 3-20-05-10 492 495 0.61 Wynnum West 3-20-05-11 480 492 2.50 Wynnum West 3-20-05-12 423 425 0.47 Wynnum West 3-20-05-13 462 502 8.66 Wynnum West 3-20-05-14 240 252 5.00

Queensland Redistribution Statistics 2006
Enrolment Projections
----------------------------------------------------------------------------------------------------------------------
15
Bonner
---------------------------------------------------------------------------------------------------------------------- SLA Name CCD Number Actual
Enrolment 2/12/2005
Estimate 30/11/2007
Growth (%)
---------------------------------------------------------------------------------------------------------------------- Wynnum West 16 7295 7524 3.14 Bonner 206 86819 89939 3.59
Queensland Redistribution Statistics 2006
Enrolment Projections
----------------------------------------------------------------------------------------------------------------------
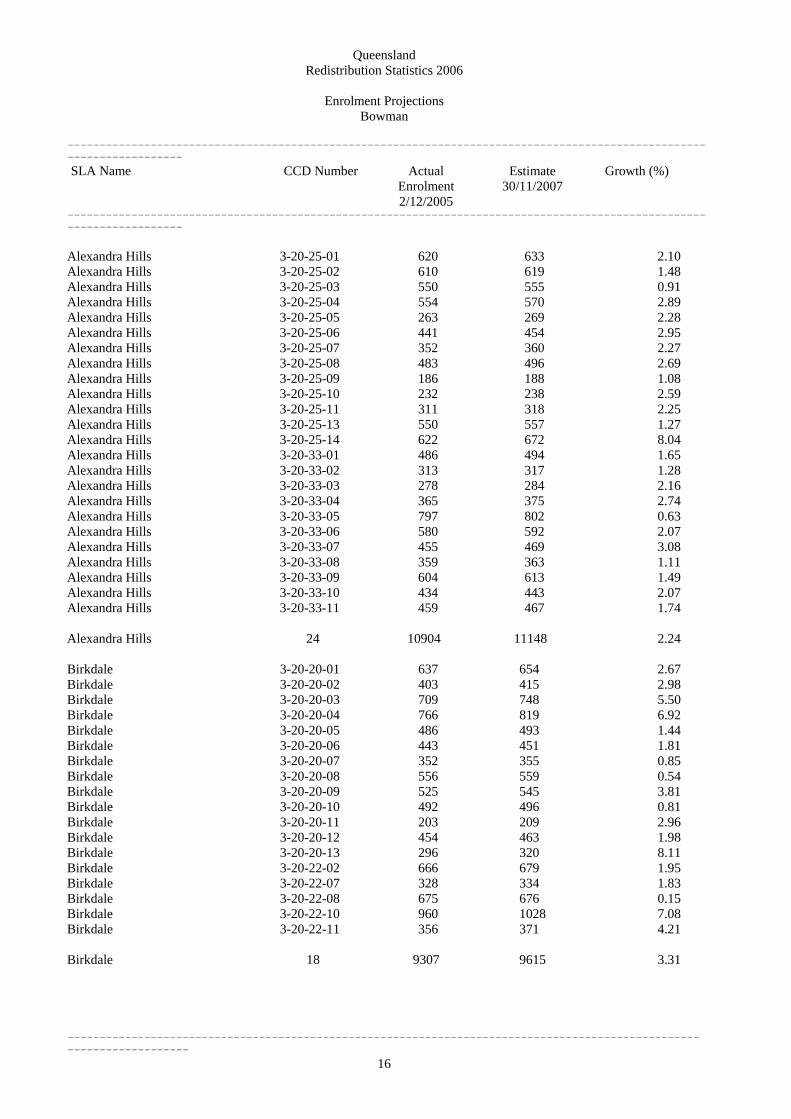
16
Bowman
---------------------------------------------------------------------------------------------------------------------- SLA Name CCD Number Actual
Enrolment 2/12/2005
Estimate 30/11/2007
Growth (%)
---------------------------------------------------------------------------------------------------------------------- Alexandra Hills 3-20-25-01 620 633 2.10 Alexandra Hills 3-20-25-02 610 619 1.48 Alexandra Hills 3-20-25-03 550 555 0.91 Alexandra Hills 3-20-25-04 554 570 2.89 Alexandra Hills 3-20-25-05 263 269 2.28 Alexandra Hills 3-20-25-06 441 454 2.95 Alexandra Hills 3-20-25-07 352 360 2.27 Alexandra Hills 3-20-25-08 483 496 2.69 Alexandra Hills 3-20-25-09 186 188 1.08 Alexandra Hills 3-20-25-10 232 238 2.59 Alexandra Hills 3-20-25-11 311 318 2.25 Alexandra Hills 3-20-25-13 550 557 1.27 Alexandra Hills 3-20-25-14 622 672 8.04 Alexandra Hills 3-20-33-01 486 494 1.65 Alexandra Hills 3-20-33-02 313 317 1.28 Alexandra Hills 3-20-33-03 278 284 2.16 Alexandra Hills 3-20-33-04 365 375 2.74 Alexandra Hills 3-20-33-05 797 802 0.63 Alexandra Hills 3-20-33-06 580 592 2.07 Alexandra Hills 3-20-33-07 455 469 3.08 Alexandra Hills 3-20-33-08 359 363 1.11 Alexandra Hills 3-20-33-09 604 613 1.49 Alexandra Hills 3-20-33-10 434 443 2.07 Alexandra Hills 3-20-33-11 459 467 1.74 Alexandra Hills 24 10904 11148 2.24 Birkdale 3-20-20-01 637 654 2.67 Birkdale 3-20-20-02 403 415 2.98 Birkdale 3-20-20-03 709 748 5.50 Birkdale 3-20-20-04 766 819 6.92 Birkdale 3-20-20-05 486 493 1.44 Birkdale 3-20-20-06 443 451 1.81 Birkdale 3-20-20-07 352 355 0.85 Birkdale 3-20-20-08 556 559 0.54 Birkdale 3-20-20-09 525 545 3.81 Birkdale 3-20-20-10 492 496 0.81 Birkdale 3-20-20-11 203 209 2.96 Birkdale 3-20-20-12 454 463 1.98 Birkdale 3-20-20-13 296 320 8.11 Birkdale 3-20-22-02 666 679 1.95 Birkdale 3-20-22-07 328 334 1.83 Birkdale 3-20-22-08 675 676 0.15 Birkdale 3-20-22-10 960 1028 7.08 Birkdale 3-20-22-11 356 371 4.21 Birkdale 18 9307 9615 3.31

Queensland Redistribution Statistics 2006
Enrolment Projections
----------------------------------------------------------------------------------------------------------------------
17
Bowman
---------------------------------------------------------------------------------------------------------------------- SLA Name CCD Number Actual
Enrolment 2/12/2005
Estimate 30/11/2007
Growth (%)
---------------------------------------------------------------------------------------------------------------------- Capalaba 3-20-26-01 172 176 2.33 Capalaba 3-20-26-02 513 524 2.14 Capalaba 3-20-26-03 432 445 3.01 Capalaba 3-20-26-04 615 616 0.16 Capalaba 3-20-26-05 84 88 4.76 Capalaba 3-20-26-06 491 500 1.83 Capalaba 3-20-26-07 307 324 5.54 Capalaba 3-20-26-08 318 330 3.77 Capalaba 3-20-26-09 409 428 4.65 Capalaba 3-20-26-10 482 485 0.62 Capalaba 3-20-26-11 431 440 2.09 Capalaba 3-20-26-12 295 295 0.00 Capalaba 3-20-26-13 414 415 0.24 Capalaba 3-20-32-01 506 511 0.99 Capalaba 3-20-32-02 481 489 1.66 Capalaba 3-20-32-03 679 686 1.03 Capalaba 3-20-32-04 463 464 0.22 Capalaba 3-20-32-05 457 461 0.88 Capalaba 3-20-32-06 308 313 1.62 Capalaba 3-20-32-07 585 593 1.37 Capalaba 3-20-32-08 789 794 0.63 Capalaba 3-20-32-09 354 359 1.41 Capalaba 3-20-32-10 225 229 1.78 Capalaba 3-20-32-11 724 739 2.07 Capalaba 3-20-32-12 450 460 2.22 Capalaba 3-20-32-13 374 418 11.76 Capalaba 26 11358 11582 1.97 Carbrook-Cornubia 3-25-08-01 333 355 6.61 Carbrook-Cornubia 3-25-08-02 842 864 2.61 Carbrook-Cornubia 3-25-08-03 626 648 3.51 Carbrook-Cornubia 3-25-08-04 491 506 3.05 Carbrook-Cornubia 4 2292 2373 3.53 Cleveland 3-20-23-06 634 646 1.89 Cleveland 3-20-23-07 758 795 4.88 Cleveland 3-20-23-08 210 213 1.43 Cleveland 3-20-23-09 558 578 3.58 Cleveland 3-20-23-10 440 465 5.68 Cleveland 3-20-23-15 339 343 1.18 Cleveland 3-20-24-01 584 594 1.71 Cleveland 3-20-24-02 240 243 1.25 Cleveland 3-20-24-03 327 331 1.22 Cleveland 3-20-24-04 449 488 8.69 Cleveland 3-20-24-05 446 453 1.57

Queensland Redistribution Statistics 2006
Enrolment Projections
----------------------------------------------------------------------------------------------------------------------
18
Bowman
---------------------------------------------------------------------------------------------------------------------- SLA Name CCD Number Actual
Enrolment 2/12/2005
Estimate 30/11/2007
Growth (%)
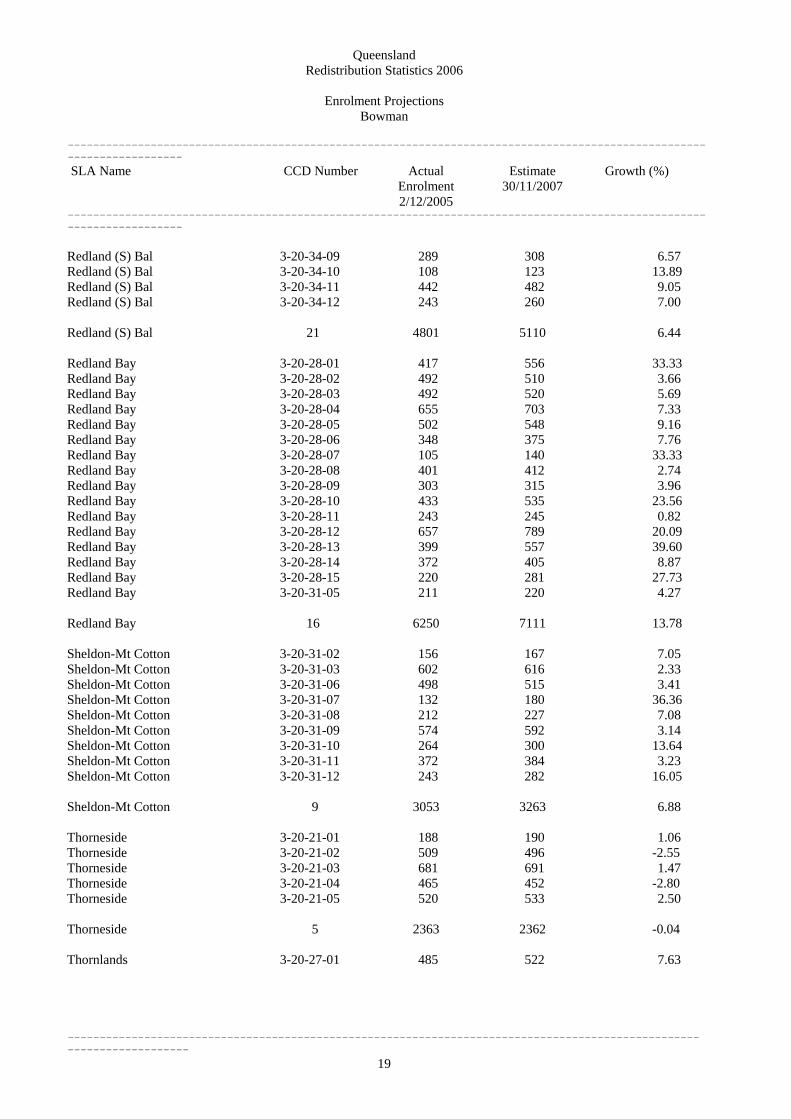
---------------------------------------------------------------------------------------------------------------------- Cleveland 3-20-24-06 434 443 2.07 Cleveland 3-20-24-07 385 395 2.60 Cleveland 3-20-24-08 432 460 6.48 Cleveland 3-20-24-09 345 350 1.45 Cleveland 3-20-24-10 464 477 2.80 Cleveland 3-20-24-11 633 653 3.16 Cleveland 3-20-24-12 476 492 3.36 Cleveland 3-20-24-13 305 311 1.97 Cleveland 3-20-24-14 306 313 2.29 Cleveland 3-20-24-15 310 315 1.61 Cleveland 3-20-24-16 400 420 5.00 Cleveland 22 9475 9778 3.20 Loganholme 3-25-09-01 677 703 3.84 Loganholme 3-25-09-08 794 847 6.68 Loganholme 2 1471 1550 5.37 Ormiston 3-20-23-01 358 410 14.53 Ormiston 3-20-23-02 488 527 7.99 Ormiston 3-20-23-03 952 1002 5.25 Ormiston 3-20-23-04 452 465 2.88 Ormiston 3-20-23-11 311 329 5.79 Ormiston 3-20-23-12 285 290 1.75 Ormiston 3-20-23-13 417 434 4.08 Ormiston 3-20-23-14 353 364 3.12 Ormiston 8 3616 3821 5.67 Redland (S) Bal 3-20-23-05 0 0 0.00 Redland (S) Bal 3-20-29-01 75 73 -2.67 Redland (S) Bal 3-20-29-02 168 179 6.55 Redland (S) Bal 3-20-29-03 298 296 -0.67 Redland (S) Bal 3-20-29-04 320 324 1.25 Redland (S) Bal 3-20-29-05 0 0 0.00 Redland (S) Bal 3-20-29-06 232 231 -0.43 Redland (S) Bal 3-20-29-07 193 203 5.18 Redland (S) Bal 3-20-29-08 208 215 3.37 Redland (S) Bal 3-20-34-01 0 0 0.00 Redland (S) Bal 3-20-34-02 197 214 8.63 Redland (S) Bal 3-20-34-03 473 519 9.73 Redland (S) Bal 3-20-34-04 315 350 11.11 Redland (S) Bal 3-20-34-05 268 287 7.09 Redland (S) Bal 3-20-34-06 287 311 8.36 Redland (S) Bal 3-20-34-07 325 349 7.38 Redland (S) Bal 3-20-34-08 360 386 7.22
Queensland Redistribution Statistics 2006
Enrolment Projections
----------------------------------------------------------------------------------------------------------------------
19
Bowman
---------------------------------------------------------------------------------------------------------------------- SLA Name CCD Number Actual
Enrolment 2/12/2005
Estimate 30/11/2007
Growth (%)
---------------------------------------------------------------------------------------------------------------------- Redland (S) Bal 3-20-34-09 289 308 6.57 Redland (S) Bal 3-20-34-10 108 123 13.89 Redland (S) Bal 3-20-34-11 442 482 9.05 Redland (S) Bal 3-20-34-12 243 260 7.00 Redland (S) Bal 21 4801 5110 6.44 Redland Bay 3-20-28-01 417 556 33.33 Redland Bay 3-20-28-02 492 510 3.66 Redland Bay 3-20-28-03 492 520 5.69 Redland Bay 3-20-28-04 655 703 7.33 Redland Bay 3-20-28-05 502 548 9.16 Redland Bay 3-20-28-06 348 375 7.76 Redland Bay 3-20-28-07 105 140 33.33 Redland Bay 3-20-28-08 401 412 2.74 Redland Bay 3-20-28-09 303 315 3.96 Redland Bay 3-20-28-10 433 535 23.56 Redland Bay 3-20-28-11 243 245 0.82 Redland Bay 3-20-28-12 657 789 20.09 Redland Bay 3-20-28-13 399 557 39.60 Redland Bay 3-20-28-14 372 405 8.87 Redland Bay 3-20-28-15 220 281 27.73 Redland Bay 3-20-31-05 211 220 4.27 Redland Bay 16 6250 7111 13.78 Sheldon-Mt Cotton 3-20-31-02 156 167 7.05 Sheldon-Mt Cotton 3-20-31-03 602 616 2.33 Sheldon-Mt Cotton 3-20-31-06 498 515 3.41 Sheldon-Mt Cotton 3-20-31-07 132 180 36.36 Sheldon-Mt Cotton 3-20-31-08 212 227 7.08 Sheldon-Mt Cotton 3-20-31-09 574 592 3.14 Sheldon-Mt Cotton 3-20-31-10 264 300 13.64 Sheldon-Mt Cotton 3-20-31-11 372 384 3.23 Sheldon-Mt Cotton 3-20-31-12 243 282 16.05 Sheldon-Mt Cotton 9 3053 3263 6.88 Thorneside 3-20-21-01 188 190 1.06 Thorneside 3-20-21-02 509 496 -2.55 Thorneside 3-20-21-03 681 691 1.47 Thorneside 3-20-21-04 465 452 -2.80 Thorneside 3-20-21-05 520 533 2.50 Thorneside 5 2363 2362 -0.04 Thornlands 3-20-27-01 485 522 7.63

Queensland Redistribution Statistics 2006
Enrolment Projections
----------------------------------------------------------------------------------------------------------------------
20
Bowman
---------------------------------------------------------------------------------------------------------------------- SLA Name CCD Number Actual
Enrolment 2/12/2005
Estimate 30/11/2007
Growth (%)
---------------------------------------------------------------------------------------------------------------------- Thornlands 3-20-27-02 531 848 59.70 Thornlands 3-20-27-03 616 686 11.36 Thornlands 3-20-27-04 420 448 6.67 Thornlands 3-20-27-05 648 704 8.64 Thornlands 3-20-27-06 373 397 6.43 Thornlands 3-20-27-07 334 350 4.79 Thornlands 3-20-27-08 688 720 4.65 Thornlands 3-20-27-09 383 402 4.96 Thornlands 3-20-27-10 415 437 5.30 Thornlands 3-20-27-11 628 857 36.46 Thornlands 3-20-31-01 663 725 9.35 Thornlands 12 6184 7096 14.75 Victoria Point 3-20-30-01 831 851 2.41 Victoria Point 3-20-30-02 702 712 1.42 Victoria Point 3-20-30-03 616 630 2.27 Victoria Point 3-20-30-04 648 661 2.01 Victoria Point 3-20-30-05 391 395 1.02 Victoria Point 3-20-30-06 375 409 9.07 Victoria Point 3-20-30-07 611 665 8.84 Victoria Point 3-20-30-08 418 430 2.87 Victoria Point 3-20-30-09 483 496 2.69 Victoria Point 3-20-30-10 531 534 0.56 Victoria Point 3-20-30-11 373 389 4.29 Victoria Point 3-20-30-12 393 448 13.99 Victoria Point 3-20-30-13 217 229 5.53 Victoria Point 3-20-30-14 315 322 2.22 Victoria Point 3-20-30-15 488 546 11.89 Victoria Point 3-20-31-04 1473 1898 28.85 Victoria Point 16 8865 9615 8.46 Wellington Point 3-20-22-01 129 134 3.88 Wellington Point 3-20-22-03 477 498 4.40 Wellington Point 3-20-22-04 303 311 2.64 Wellington Point 3-20-22-05 418 433 3.59 Wellington Point 3-20-22-06 955 1122 17.49 Wellington Point 3-20-22-09 397 426 7.30 Wellington Point 3-20-22-12 471 492 4.46 Wellington Point 3-20-22-13 385 393 2.08 Wellington Point 3-20-22-14 793 806 1.64 Wellington Point 3-20-22-15 629 685 8.90 Wellington Point 3-20-22-16 536 593 10.63 Wellington Point 3-20-22-17 381 419 9.97 Wellington Point 3-20-25-12 622 638 2.57 Wellington Point 13 6496 6950 6.99

Queensland Redistribution Statistics 2006
Enrolment Projections
----------------------------------------------------------------------------------------------------------------------
21
Bowman
---------------------------------------------------------------------------------------------------------------------- SLA Name CCD Number Actual
Enrolment 2/12/2005
Estimate 30/11/2007
Growth (%)
---------------------------------------------------------------------------------------------------------------------- Bowman 196 86435 91374 5.71

Queensland Redistribution Statistics 2006
Enrolment Projections
----------------------------------------------------------------------------------------------------------------------
22
Brisbane
---------------------------------------------------------------------------------------------------------------------- SLA Name CCD Number Actual
Enrolment 2/12/2005
Estimate 30/11/2007
Growth (%)
---------------------------------------------------------------------------------------------------------------------- Alderley 3-22-10-01 143 143 0.00 Alderley 3-22-10-02 455 455 0.00 Alderley 3-22-10-03 199 203 2.01 Alderley 3-22-10-04 82 84 2.44 Alderley 3-22-10-05 442 457 3.39 Alderley 3-22-10-06 312 320 2.56 Alderley 3-22-10-07 85 87 2.35 Alderley 3-22-10-08 201 220 9.45 Alderley 3-22-10-09 208 220 5.77 Alderley 3-22-10-10 395 412 4.30 Alderley 3-22-10-11 323 331 2.48 Alderley 3-22-10-12 403 422 4.71 Alderley 3-22-10-13 442 445 0.68 Alderley 13 3690 3799 2.95 Ashgrove 3-23-06-01 302 312 3.31 Ashgrove 3-23-06-02 353 366 3.68 Ashgrove 3-23-06-03 468 475 1.50 Ashgrove 3-23-06-04 284 290 2.11 Ashgrove 3-23-06-05 472 487 3.18 Ashgrove 3-23-06-06 288 293 1.74 Ashgrove 3-23-06-07 342 358 4.68 Ashgrove 3-23-06-08 457 470 2.84 Ashgrove 3-23-06-09 425 427 0.47 Ashgrove 3-23-06-10 331 338 2.11 Ashgrove 3-23-06-11 356 363 1.97 Ashgrove 3-23-07-01 386 399 3.37 Ashgrove 3-23-07-02 198 199 0.51 Ashgrove 3-23-07-03 229 233 1.75 Ashgrove 3-23-07-04 339 343 1.18 Ashgrove 3-23-07-05 215 219 1.86 Ashgrove 3-23-07-06 362 369 1.93 Ashgrove 3-23-07-07 314 316 0.64 Ashgrove 3-23-07-08 283 284 0.35 Ashgrove 3-23-07-09 180 183 1.67 Ashgrove 3-23-07-10 273 279 2.20 Ashgrove 3-23-07-11 274 287 4.74 Ashgrove 3-23-07-12 247 254 2.83 Ashgrove 3-23-07-13 198 207 4.55 Ashgrove 3-23-07-14 315 333 5.71 Ashgrove 25 7891 8084 2.45 Bardon 3-23-08-01 530 539 1.70 Bardon 3-23-08-02 589 597 1.36 Bardon 3-23-08-03 389 403 3.60

Queensland Redistribution Statistics 2006
Enrolment Projections
----------------------------------------------------------------------------------------------------------------------
23
Brisbane
---------------------------------------------------------------------------------------------------------------------- SLA Name CCD Number Actual
Enrolment 2/12/2005
Estimate 30/11/2007
Growth (%)
---------------------------------------------------------------------------------------------------------------------- Bardon 3-23-08-04 485 497 2.47 Bardon 3-23-08-05 519 538 3.66 Bardon 3-23-08-06 458 471 2.84 Bardon 3-23-08-07 422 436 3.32 Bardon 3-23-08-08 377 388 2.92 Bardon 3-23-08-09 483 500 3.52 Bardon 3-23-08-10 296 308 4.05 Bardon 3-23-08-13 171 175 2.34 Bardon 11 4719 4852 2.82 Bowen Hills 3-19-10-01 30 51 70.00 Bowen Hills 3-19-10-02 576 596 3.47 Bowen Hills 3-19-10-03 179 194 8.38 Bowen Hills 3 785 841 7.13 City - Inner 3-19-19-01 33 48 45.45 City - Inner 3-19-19-02 53 91 71.70 City - Inner 3-19-19-03 5 4 -20.00 City - Inner 3-19-19-04 377 559 48.28 City - Inner 3-19-19-08 482 399 -17.22 City - Inner 5 950 1101 15.89 Enoggera 3-23-05-01 514 527 2.53 Enoggera 3-23-05-02 583 615 5.49 Enoggera 3-23-05-03 581 602 3.61 Enoggera 3-23-05-04 147 149 1.36 Enoggera 3-23-05-05 151 158 4.64 Enoggera 3-23-05-06 405 427 5.43 Enoggera 3-23-05-07 160 162 1.25 Enoggera 3-23-05-08 255 266 4.31 Enoggera 3-23-05-09 391 412 5.37 Enoggera 3-23-05-10 312 368 17.95 Enoggera 3-23-05-11 266 276 3.76 Enoggera 3-23-05-12 422 437 3.55 Enoggera 3-23-05-13 304 308 1.32 Enoggera 13 4491 4707 4.81 Everton Park 3-22-08-01 462 468 1.30 Everton Park 3-22-08-03 291 293 0.69 Everton Park 3-22-08-04 360 368 2.22 Everton Park 3-22-08-05 282 282 0.00 Everton Park 3-22-08-06 224 224 0.00 Everton Park 3-22-08-07 545 552 1.28

Queensland Redistribution Statistics 2006
Enrolment Projections
----------------------------------------------------------------------------------------------------------------------
24
Brisbane
---------------------------------------------------------------------------------------------------------------------- SLA Name CCD Number Actual
Enrolment 2/12/2005
Estimate 30/11/2007
Growth (%)
---------------------------------------------------------------------------------------------------------------------- Everton Park 3-22-08-08 311 312 0.32 Everton Park 3-22-08-09 300 308 2.67 Everton Park 3-22-08-13 450 463 2.89 Everton Park 3-22-08-14 369 366 -0.81 Everton Park 3-22-08-15 264 274 3.79 Everton Park 3-22-08-16 340 351 3.24 Everton Park 12 4198 4261 1.50 Ferny Grove 3-23-02-02 705 759 7.66 Ferny Grove 3-23-02-03 121 125 3.31 Ferny Grove 3-23-02-04 318 325 2.20 Ferny Grove 3-23-02-05 539 551 2.23 Ferny Grove 3-23-02-06 429 443 3.26 Ferny Grove 3-23-02-07 582 600 3.09 Ferny Grove 3-23-02-08 802 835 4.11 Ferny Grove 3-23-02-11 414 427 3.14 Ferny Grove 8 3910 4065 3.96 Fortitude Valley - Inner 3-19-15-01 275 329 19.64 Fortitude Valley - Inner 3-19-15-02 103 109 5.83 Fortitude Valley - Inner 3-19-15-08 314 316 0.64 Fortitude Valley - Inner 3 692 754 8.96 Grange 3-22-14-06 181 183 1.10 Grange 3-22-14-07 485 488 0.62 Grange 3-22-14-08 365 377 3.29 Grange 3-22-14-09 415 417 0.48 Grange 3-22-14-10 383 392 2.35 Grange 3-22-14-11 203 210 3.45 Grange 3-22-14-12 360 365 1.39 Grange 3-22-14-13 235 244 3.83 Grange 8 2627 2676 1.87 Herston 3-19-17-01 264 268 1.52 Herston 3-19-17-02 441 444 0.68 Herston 3-19-17-03 341 352 3.23 Herston 3 1046 1064 1.72 Kelvin Grove 3-19-17-04 444 476 7.21 Kelvin Grove 3-19-17-05 235 256 8.94 Kelvin Grove 3-19-17-06 270 299 10.74 Kelvin Grove 3-19-17-07 100 116 16.00

Queensland Redistribution Statistics 2006
Enrolment Projections
----------------------------------------------------------------------------------------------------------------------
25
Brisbane
---------------------------------------------------------------------------------------------------------------------- SLA Name CCD Number Actual
Enrolment 2/12/2005
Estimate 30/11/2007
Growth (%)
---------------------------------------------------------------------------------------------------------------------- Kelvin Grove 3-19-17-08 495 549 10.91 Kelvin Grove 3-19-17-09 76 102 34.21 Kelvin Grove 3-19-17-10 179 189 5.59 Kelvin Grove 3-19-17-11 138 146 5.80 Kelvin Grove 3-19-17-12 498 542 8.84 Kelvin Grove 3-19-17-13 337 364 8.01 Kelvin Grove 10 2772 3039 9.63 Keperra 3-23-03-01 467 467 0.00 Keperra 3-23-03-02 215 217 0.93 Keperra 3-23-03-03 619 617 -0.32 Keperra 3-23-03-04 267 266 -0.37 Keperra 3-23-03-05 245 248 1.22 Keperra 3-23-03-06 450 449 -0.22 Keperra 3-23-03-07 353 354 0.28 Keperra 3-23-03-08 315 318 0.95 Keperra 3-23-03-09 678 670 -1.18 Keperra 3-23-03-10 752 727 -3.32 Keperra 3-23-03-11 360 359 -0.28 Keperra 3-23-03-12 419 417 -0.48 Keperra 12 5140 5109 -0.60 Milton 3-19-06-01 221 233 5.43 Milton 3-19-06-02 97 100 3.09 Milton 3-19-06-03 252 266 5.56 Milton 3-19-06-04 146 153 4.79 Milton 3-19-06-05 151 162 7.28 Milton 3-19-06-06 174 177 1.72 Milton 6 1041 1091 4.80 Mitchelton 3-23-04-01 284 285 0.35 Mitchelton 3-23-04-02 295 317 7.46 Mitchelton 3-23-04-03 367 377 2.72 Mitchelton 3-23-04-04 510 521 2.16 Mitchelton 3-23-04-05 557 562 0.90 Mitchelton 3-23-04-06 277 284 2.53 Mitchelton 3-23-04-07 320 326 1.88 Mitchelton 3-23-04-08 514 526 2.33 Mitchelton 3-23-04-09 912 1084 18.86 Mitchelton 3-23-04-10 417 423 1.44 Mitchelton 3-23-04-11 313 322 2.88 Mitchelton 11 4766 5027 5.48
Queensland Redistribution Statistics 2006
Enrolment Projections
----------------------------------------------------------------------------------------------------------------------
26
Brisbane
---------------------------------------------------------------------------------------------------------------------- SLA Name CCD Number Actual
Enrolment 2/12/2005
Estimate 30/11/2007
Growth (%)
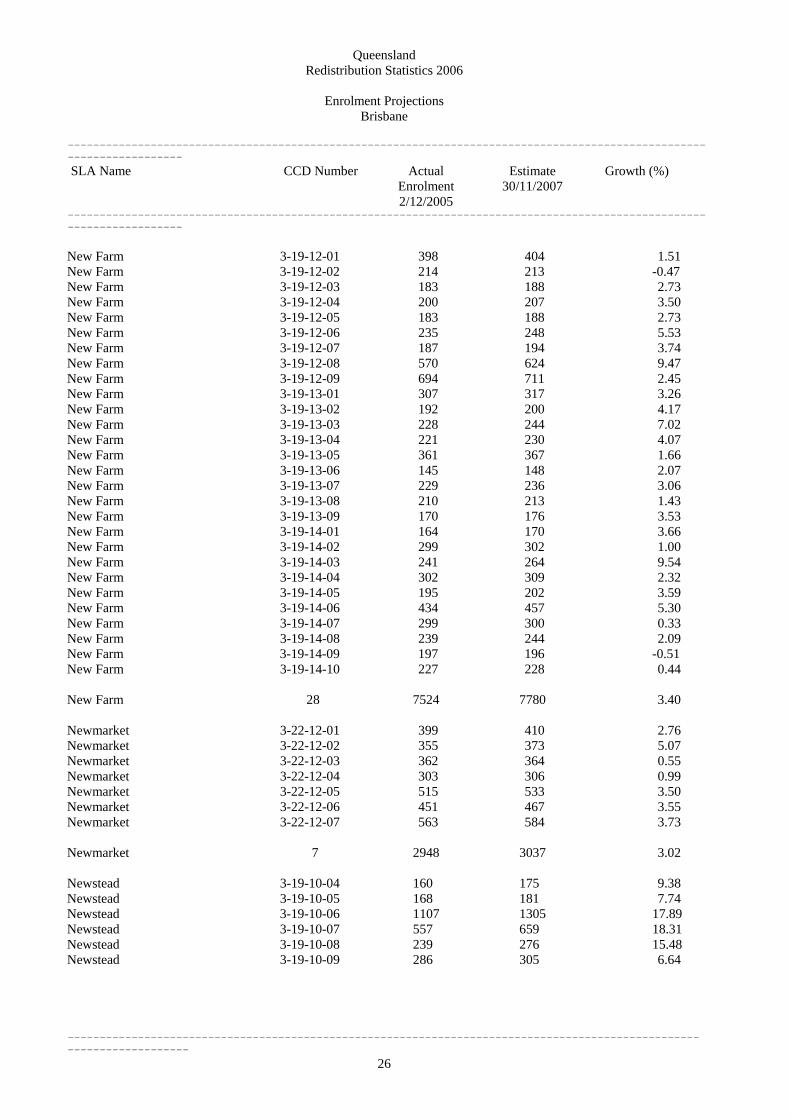
---------------------------------------------------------------------------------------------------------------------- New Farm 3-19-12-01 398 404 1.51 New Farm 3-19-12-02 214 213 -0.47 New Farm 3-19-12-03 183 188 2.73 New Farm 3-19-12-04 200 207 3.50 New Farm 3-19-12-05 183 188 2.73 New Farm 3-19-12-06 235 248 5.53 New Farm 3-19-12-07 187 194 3.74 New Farm 3-19-12-08 570 624 9.47 New Farm 3-19-12-09 694 711 2.45 New Farm 3-19-13-01 307 317 3.26 New Farm 3-19-13-02 192 200 4.17 New Farm 3-19-13-03 228 244 7.02 New Farm 3-19-13-04 221 230 4.07 New Farm 3-19-13-05 361 367 1.66 New Farm 3-19-13-06 145 148 2.07 New Farm 3-19-13-07 229 236 3.06 New Farm 3-19-13-08 210 213 1.43 New Farm 3-19-13-09 170 176 3.53 New Farm 3-19-14-01 164 170 3.66 New Farm 3-19-14-02 299 302 1.00 New Farm 3-19-14-03 241 264 9.54 New Farm 3-19-14-04 302 309 2.32 New Farm 3-19-14-05 195 202 3.59 New Farm 3-19-14-06 434 457 5.30 New Farm 3-19-14-07 299 300 0.33 New Farm 3-19-14-08 239 244 2.09 New Farm 3-19-14-09 197 196 -0.51 New Farm 3-19-14-10 227 228 0.44 New Farm 28 7524 7780 3.40 Newmarket 3-22-12-01 399 410 2.76 Newmarket 3-22-12-02 355 373 5.07 Newmarket 3-22-12-03 362 364 0.55 Newmarket 3-22-12-04 303 306 0.99 Newmarket 3-22-12-05 515 533 3.50 Newmarket 3-22-12-06 451 467 3.55 Newmarket 3-22-12-07 563 584 3.73 Newmarket 7 2948 3037 3.02 Newstead 3-19-10-04 160 175 9.38 Newstead 3-19-10-05 168 181 7.74 Newstead 3-19-10-06 1107 1305 17.89 Newstead 3-19-10-07 557 659 18.31 Newstead 3-19-10-08 239 276 15.48 Newstead 3-19-10-09 286 305 6.64
Queensland Redistribution Statistics 2006
Enrolment Projections
----------------------------------------------------------------------------------------------------------------------
27
Brisbane
---------------------------------------------------------------------------------------------------------------------- SLA Name CCD Number Actual
Enrolment 2/12/2005
Estimate 30/11/2007
Growth (%)
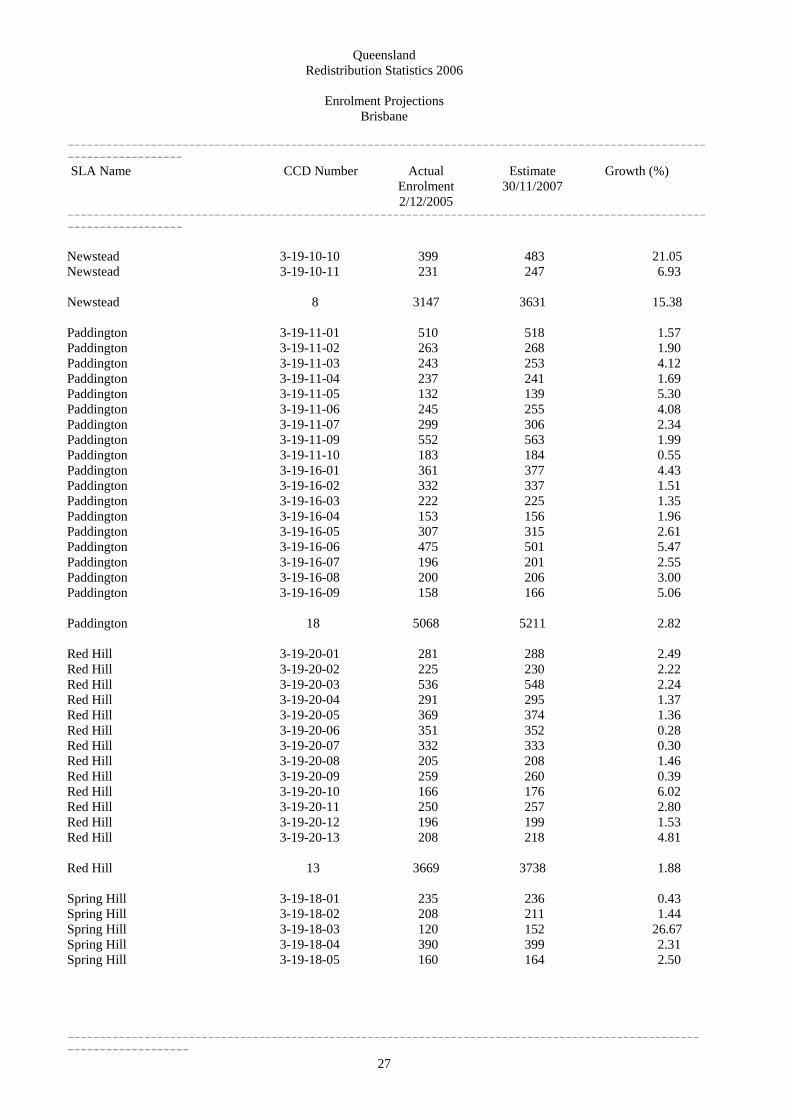
---------------------------------------------------------------------------------------------------------------------- Newstead 3-19-10-10 399 483 21.05 Newstead 3-19-10-11 231 247 6.93 Newstead 8 3147 3631 15.38 Paddington 3-19-11-01 510 518 1.57 Paddington 3-19-11-02 263 268 1.90 Paddington 3-19-11-03 243 253 4.12 Paddington 3-19-11-04 237 241 1.69 Paddington 3-19-11-05 132 139 5.30 Paddington 3-19-11-06 245 255 4.08 Paddington 3-19-11-07 299 306 2.34 Paddington 3-19-11-09 552 563 1.99 Paddington 3-19-11-10 183 184 0.55 Paddington 3-19-16-01 361 377 4.43 Paddington 3-19-16-02 332 337 1.51 Paddington 3-19-16-03 222 225 1.35 Paddington 3-19-16-04 153 156 1.96 Paddington 3-19-16-05 307 315 2.61 Paddington 3-19-16-06 475 501 5.47 Paddington 3-19-16-07 196 201 2.55 Paddington 3-19-16-08 200 206 3.00 Paddington 3-19-16-09 158 166 5.06 Paddington 18 5068 5211 2.82 Red Hill 3-19-20-01 281 288 2.49 Red Hill 3-19-20-02 225 230 2.22 Red Hill 3-19-20-03 536 548 2.24 Red Hill 3-19-20-04 291 295 1.37 Red Hill 3-19-20-05 369 374 1.36 Red Hill 3-19-20-06 351 352 0.28 Red Hill 3-19-20-07 332 333 0.30 Red Hill 3-19-20-08 205 208 1.46 Red Hill 3-19-20-09 259 260 0.39 Red Hill 3-19-20-10 166 176 6.02 Red Hill 3-19-20-11 250 257 2.80 Red Hill 3-19-20-12 196 199 1.53 Red Hill 3-19-20-13 208 218 4.81 Red Hill 13 3669 3738 1.88 Spring Hill 3-19-18-01 235 236 0.43 Spring Hill 3-19-18-02 208 211 1.44 Spring Hill 3-19-18-03 120 152 26.67 Spring Hill 3-19-18-04 390 399 2.31 Spring Hill 3-19-18-05 160 164 2.50

Queensland Redistribution Statistics 2006
Enrolment Projections
----------------------------------------------------------------------------------------------------------------------
28
Brisbane
---------------------------------------------------------------------------------------------------------------------- SLA Name CCD Number Actual
Enrolment 2/12/2005
Estimate 30/11/2007
Growth (%)
---------------------------------------------------------------------------------------------------------------------- Spring Hill 3-19-18-06 154 156 1.30 Spring Hill 3-19-18-07 224 227 1.34 Spring Hill 3-19-18-08 215 281 30.70 Spring Hill 3-19-18-09 395 492 24.56 Spring Hill 9 2101 2318 10.33 Stafford 3-22-11-01 443 450 1.58 Stafford 3-22-11-02 321 319 -0.62 Stafford 3-22-11-03 449 450 0.22 Stafford 3-22-11-04 340 348 2.35 Stafford 3-22-11-05 375 375 0.00 Stafford 3-22-11-06 304 308 1.32 Stafford 3-22-11-07 232 234 0.86 Stafford 3-22-11-11 159 163 2.52 Stafford 3-22-11-12 444 454 2.25 Stafford 9 3067 3101 1.11 Upper Kedron 3-23-02-01 328 413 25.91 Upper Kedron 3-23-02-09 531 664 25.05 Upper Kedron 3-23-02-10 670 782 16.72 Upper Kedron 3 1529 1859 21.58 Wilston 3-22-16-01 364 371 1.92 Wilston 3-22-16-02 470 482 2.55 Wilston 3-22-16-03 339 355 4.72 Wilston 3-22-16-04 385 394 2.34 Wilston 3-22-16-05 281 286 1.78 Wilston 3-22-16-06 328 332 1.22 Wilston 3-22-16-07 256 256 0.00 Wilston 7 2423 2476 2.19 Windsor 3-22-13-01 224 229 2.23 Windsor 3-22-13-02 380 384 1.05 Windsor 3-22-13-03 467 470 0.64 Windsor 3-22-13-04 145 148 2.07 Windsor 3-22-13-05 286 292 2.10 Windsor 3-22-13-06 309 315 1.94 Windsor 3-22-13-07 200 202 1.00 Windsor 3-22-13-08 166 166 0.00 Windsor 3-22-13-09 455 462 1.54 Windsor 3-22-13-10 271 282 4.06 Windsor 3-22-13-11 381 398 4.46 Windsor 3-22-13-12 312 342 9.62

Queensland Redistribution Statistics 2006
Enrolment Projections
----------------------------------------------------------------------------------------------------------------------
29
Brisbane
---------------------------------------------------------------------------------------------------------------------- SLA Name CCD Number Actual
Enrolment 2/12/2005
Estimate 30/11/2007
Growth (%)
---------------------------------------------------------------------------------------------------------------------- Windsor 3-22-13-13 229 231 0.87 Windsor 3-22-13-14 180 191 6.11 Windsor 3-22-13-15 221 225 1.81 Windsor 15 4226 4337 2.63 City - Remainder 3-19-06-07 336 317 -5.65 City - Remainder 3-19-06-08 251 220 -12.35 City - Remainder 3-19-06-09 143 200 39.86 City - Remainder 3-19-06-10 133 117 -12.03 City - Remainder 3-19-19-05 112 195 74.11 City - Remainder 3-19-19-06 289 452 56.40 City - Remainder 3-19-19-07 143 266 86.01 City - Remainder 7 1407 1767 25.59 Fortitude Valley - Remainder 3-19-15-03 528 771 46.02 Fortitude Valley - Remainder 3-19-15-04 195 192 -1.54 Fortitude Valley - Remainder 3-19-15-05 78 79 1.28 Fortitude Valley - Remainder 3-19-15-06 385 456 18.44 Fortitude Valley - Remainder 3-19-15-07 647 850 31.38 Fortitude Valley - Remainder 5 1833 2348 28.10 Brisbane 272 87660 92073 5.03

Queensland Redistribution Statistics 2006
Enrolment Projections
----------------------------------------------------------------------------------------------------------------------
30
Capricornia
---------------------------------------------------------------------------------------------------------------------- SLA Name CCD Number Actual
Enrolment 2/12/2005
Estimate 30/11/2007
Growth (%)
---------------------------------------------------------------------------------------------------------------------- Banana (S) 3-06-17-01 184 183 -0.54 Banana (S) 3-06-17-02 150 150 0.00 Banana (S) 3-06-17-03 217 217 0.00 Banana (S) 3-06-17-04 171 172 0.58 Banana (S) 3-06-17-05 92 93 1.09 Banana (S) 3-06-17-06 198 200 1.01 Banana (S) 3-06-17-07 237 240 1.27 Banana (S) 3-06-17-08 223 225 0.90 Banana (S) 3-06-18-01 109 110 0.92 Banana (S) 3-06-18-02 27 27 0.00 Banana (S) 3-06-18-03 279 275 -1.43 Banana (S) 3-06-18-04 326 332 1.84 Banana (S) 3-06-18-05 171 173 1.17 Banana (S) 3-06-18-06 234 233 -0.43 Banana (S) 3-06-18-07 159 160 0.63 Banana (S) 3-06-18-08 299 304 1.67 Banana (S) 3-06-18-09 524 532 1.53 Banana (S) 3-06-18-10 21 20 -4.76 Banana (S) 3-06-18-11 249 251 0.80 Banana (S) 3-06-18-12 271 271 0.00 Banana (S) 3-06-19-01 243 251 3.29 Banana (S) 3-06-19-02 306 309 0.98 Banana (S) 3-06-19-03 334 338 1.20 Banana (S) 3-06-19-04 89 90 1.12 Banana (S) 3-06-19-05 528 536 1.52 Banana (S) 3-06-19-06 666 669 0.45 Banana (S) 3-06-19-07 463 461 -0.43 Banana (S) 3-06-19-08 323 324 0.31 Banana (S) 3-06-19-09 413 416 0.73 Banana (S) 3-06-19-10 276 278 0.72 Banana (S) 3-06-19-11 445 459 3.15 Banana (S) 3-06-19-12 96 97 1.04 Banana (S) 3-06-19-13 109 108 -0.92 Banana (S) 3-06-19-14 195 195 0.00 Banana (S) 34 8627 8699 0.83 Belyando (S) 3-03-15-01 78 80 2.56 Belyando (S) 3-03-15-02 144 145 0.69 Belyando (S) 3-03-15-03 213 215 0.94 Belyando (S) 3-03-15-04 62 63 1.61 Belyando (S) 3-03-15-05 224 228 1.79 Belyando (S) 3-03-15-06 282 286 1.42 Belyando (S) 3-03-15-07 427 432 1.17 Belyando (S) 3-03-15-08 279 285 2.15 Belyando (S) 3-03-15-09 159 161 1.26 Belyando (S) 3-03-16-01 531 539 1.51

Queensland Redistribution Statistics 2006
Enrolment Projections
----------------------------------------------------------------------------------------------------------------------
31
Capricornia
---------------------------------------------------------------------------------------------------------------------- SLA Name CCD Number Actual
Enrolment 2/12/2005
Estimate 30/11/2007
Growth (%)
---------------------------------------------------------------------------------------------------------------------- Belyando (S) 3-03-16-02 81 82 1.23 Belyando (S) 3-03-16-03 188 189 0.53 Belyando (S) 3-03-16-04 98 103 5.10 Belyando (S) 3-03-16-05 283 288 1.77 Belyando (S) 3-03-16-06 317 319 0.63 Belyando (S) 3-03-16-07 466 476 2.15 Belyando (S) 3-03-16-08 401 405 1.00 Belyando (S) 3-03-16-09 432 443 2.55 Belyando (S) 3-03-16-10 312 325 4.17 Belyando (S) 3-03-16-11 387 390 0.78 Belyando (S) 3-03-16-12 370 377 1.89 Belyando (S) 3-03-16-13 299 303 1.34 Belyando (S) 22 6033 6134 1.67 Bowen (S) 3-05-04-01 15 13 -13.33 Bowen (S) 3-05-06-01 46 46 0.00 Bowen (S) 3-05-06-02 365 365 0.00 Bowen (S) 3-05-06-03 186 189 1.61 Bowen (S) 3-05-06-04 252 255 1.19 Bowen (S) 3-05-06-05 76 80 5.26 Bowen (S) 3-05-06-06 303 307 1.32 Bowen (S) 3-05-06-07 242 243 0.41 Bowen (S) 3-05-06-08 26 26 0.00 Bowen (S) 3-05-06-09 52 52 0.00 Bowen (S) 10 1563 1576 0.83 Broadsound (S) 3-05-21-03 12 12 0.00 Broadsound (S) 3-05-21-04 33 33 0.00 Broadsound (S) 3-05-21-05 106 106 0.00 Broadsound (S) 3-05-21-06 104 105 0.96 Broadsound (S) 3-05-21-07 46 46 0.00 Broadsound (S) 3-05-21-08 32 32 0.00 Broadsound (S) 3-05-23-01 235 237 0.85 Broadsound (S) 3-05-23-02 277 281 1.44 Broadsound (S) 3-05-23-03 225 215 -4.44 Broadsound (S) 3-05-23-04 394 400 1.52 Broadsound (S) 3-05-23-05 338 334 -1.18 Broadsound (S) 3-05-23-06 132 132 0.00 Broadsound (S) 3-05-23-07 82 83 1.22 Broadsound (S) 3-05-23-08 190 189 -0.53 Broadsound (S) 3-05-23-09 409 409 0.00 Broadsound (S) 3-05-23-10 389 387 -0.51 Broadsound (S) 3-05-23-11 284 284 0.00 Broadsound (S) 17 3288 3285 -0.09

Queensland Redistribution Statistics 2006
Enrolment Projections
----------------------------------------------------------------------------------------------------------------------
32
Capricornia
---------------------------------------------------------------------------------------------------------------------- SLA Name CCD Number Actual
Enrolment 2/12/2005
Estimate 30/11/2007
Growth (%)
---------------------------------------------------------------------------------------------------------------------- Duaringa (S) 3-08-04-01 91 86 -5.49 Duaringa (S) 3-08-04-02 210 212 0.95 Duaringa (S) 3-08-04-03 288 289 0.35 Duaringa (S) 3-08-04-04 245 250 2.04 Duaringa (S) 3-08-04-05 324 327 0.93 Duaringa (S) 3-08-04-06 439 442 0.68 Duaringa (S) 3-08-04-07 106 110 3.77 Duaringa (S) 3-08-04-08 283 291 2.83 Duaringa (S) 3-08-04-09 290 292 0.69 Duaringa (S) 3-08-04-10 398 391 -1.76 Duaringa (S) 3-08-04-11 97 99 2.06 Duaringa (S) 3-08-05-01 68 71 4.41 Duaringa (S) 3-08-05-02 243 238 -2.06 Duaringa (S) 3-08-05-03 91 85 -6.59 Duaringa (S) 3-08-05-04 85 76 -10.59 Duaringa (S) 3-08-05-05 66 66 0.00 Duaringa (S) 3-08-05-06 70 62 -11.43 Duaringa (S) 3-08-05-07 156 157 0.64 Duaringa (S) 3-08-05-08 83 79 -4.82 Duaringa (S) 3-08-05-09 358 369 3.07 Duaringa (S) 3-08-05-10 116 122 5.17 Duaringa (S) 3-08-05-11 34 37 8.82 Duaringa (S) 3-08-05-12 75 69 -8.00 Duaringa (S) 23 4216 4220 0.09 Fitzroy (S) - Pt A 3-06-13-01 668 723 8.23 Fitzroy (S) - Pt A 3-06-13-02 731 761 4.10 Fitzroy (S) - Pt A 3-06-13-03 539 551 2.23 Fitzroy (S) - Pt A 3-06-13-04 385 386 0.26 Fitzroy (S) - Pt A 3-06-13-05 288 325 12.85 Fitzroy (S) - Pt A 3-06-13-06 487 516 5.95 Fitzroy (S) - Pt A 6 3098 3262 5.29 Fitzroy (S) - Pt B 3-06-14-01 278 286 2.88 Fitzroy (S) - Pt B 3-06-14-02 139 142 2.16 Fitzroy (S) - Pt B 3-06-14-03 190 194 2.11 Fitzroy (S) - Pt B 3-06-14-04 183 183 0.00 Fitzroy (S) - Pt B 3-06-14-05 71 72 1.41 Fitzroy (S) - Pt B 3-06-14-06 42 43 2.38 Fitzroy (S) - Pt B 3-06-14-07 78 80 2.56 Fitzroy (S) - Pt B 3-06-14-08 212 215 1.42 Fitzroy (S) - Pt B 3-06-14-09 464 472 1.72 Fitzroy (S) - Pt B 3-06-15-01 28 31 10.71 Fitzroy (S) - Pt B 3-06-15-02 58 60 3.45 Fitzroy (S) - Pt B 3-06-15-03 392 401 2.30
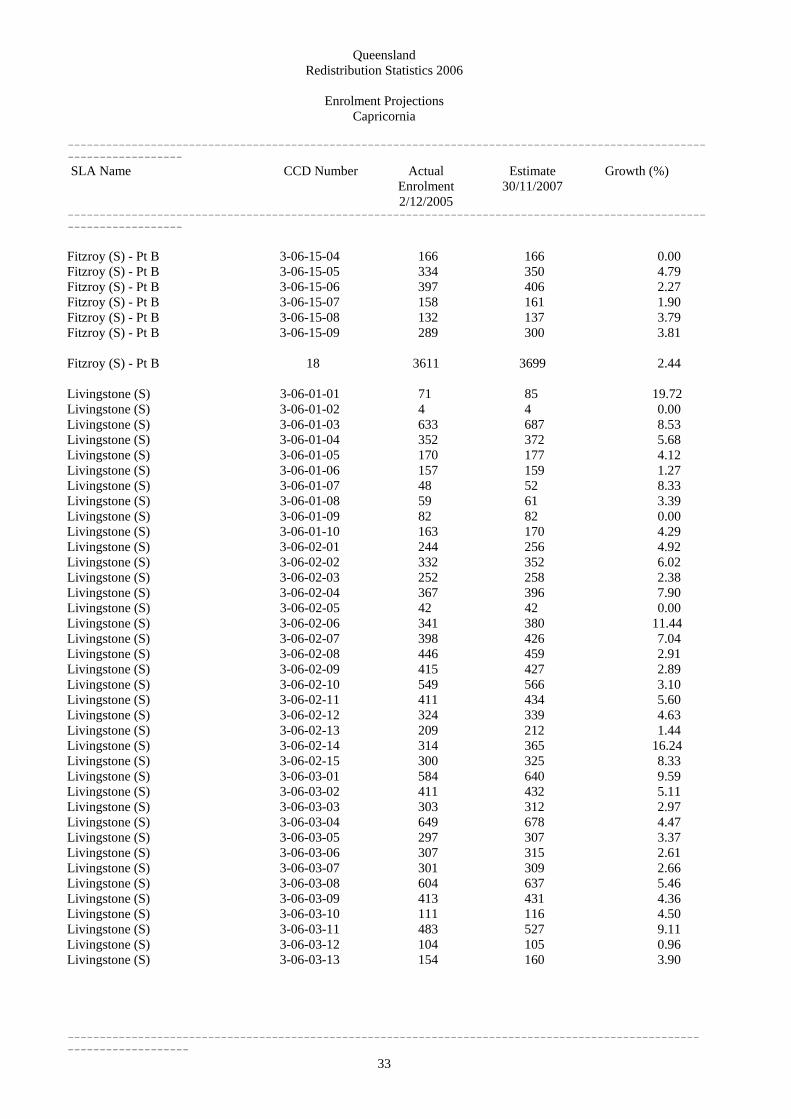
Queensland Redistribution Statistics 2006
Enrolment Projections
----------------------------------------------------------------------------------------------------------------------
33
Capricornia
---------------------------------------------------------------------------------------------------------------------- SLA Name CCD Number Actual
Enrolment 2/12/2005
Estimate 30/11/2007
Growth (%)
---------------------------------------------------------------------------------------------------------------------- Fitzroy (S) - Pt B 3-06-15-04 166 166 0.00 Fitzroy (S) - Pt B 3-06-15-05 334 350 4.79 Fitzroy (S) - Pt B 3-06-15-06 397 406 2.27 Fitzroy (S) - Pt B 3-06-15-07 158 161 1.90 Fitzroy (S) - Pt B 3-06-15-08 132 137 3.79 Fitzroy (S) - Pt B 3-06-15-09 289 300 3.81 Fitzroy (S) - Pt B 18 3611 3699 2.44 Livingstone (S) 3-06-01-01 71 85 19.72 Livingstone (S) 3-06-01-02 4 4 0.00 Livingstone (S) 3-06-01-03 633 687 8.53 Livingstone (S) 3-06-01-04 352 372 5.68 Livingstone (S) 3-06-01-05 170 177 4.12 Livingstone (S) 3-06-01-06 157 159 1.27 Livingstone (S) 3-06-01-07 48 52 8.33 Livingstone (S) 3-06-01-08 59 61 3.39 Livingstone (S) 3-06-01-09 82 82 0.00 Livingstone (S) 3-06-01-10 163 170 4.29 Livingstone (S) 3-06-02-01 244 256 4.92 Livingstone (S) 3-06-02-02 332 352 6.02 Livingstone (S) 3-06-02-03 252 258 2.38 Livingstone (S) 3-06-02-04 367 396 7.90 Livingstone (S) 3-06-02-05 42 42 0.00 Livingstone (S) 3-06-02-06 341 380 11.44 Livingstone (S) 3-06-02-07 398 426 7.04 Livingstone (S) 3-06-02-08 446 459 2.91 Livingstone (S) 3-06-02-09 415 427 2.89 Livingstone (S) 3-06-02-10 549 566 3.10 Livingstone (S) 3-06-02-11 411 434 5.60 Livingstone (S) 3-06-02-12 324 339 4.63 Livingstone (S) 3-06-02-13 209 212 1.44 Livingstone (S) 3-06-02-14 314 365 16.24 Livingstone (S) 3-06-02-15 300 325 8.33 Livingstone (S) 3-06-03-01 584 640 9.59 Livingstone (S) 3-06-03-02 411 432 5.11 Livingstone (S) 3-06-03-03 303 312 2.97 Livingstone (S) 3-06-03-04 649 678 4.47 Livingstone (S) 3-06-03-05 297 307 3.37 Livingstone (S) 3-06-03-06 307 315 2.61 Livingstone (S) 3-06-03-07 301 309 2.66 Livingstone (S) 3-06-03-08 604 637 5.46 Livingstone (S) 3-06-03-09 413 431 4.36 Livingstone (S) 3-06-03-10 111 116 4.50 Livingstone (S) 3-06-03-11 483 527 9.11 Livingstone (S) 3-06-03-12 104 105 0.96 Livingstone (S) 3-06-03-13 154 160 3.90

Queensland Redistribution Statistics 2006
Enrolment Projections
----------------------------------------------------------------------------------------------------------------------
34
Capricornia
---------------------------------------------------------------------------------------------------------------------- SLA Name CCD Number Actual
Enrolment 2/12/2005
Estimate 30/11/2007
Growth (%)
---------------------------------------------------------------------------------------------------------------------- Livingstone (S) 3-06-03-14 665 701 5.41 Livingstone (S) 3-06-03-15 488 515 5.53 Livingstone (S) 3-06-03-16 345 368 6.67 Livingstone (S) 3-06-03-17 219 276 26.03 Livingstone (S) 3-06-03-18 235 247 5.11 Livingstone (S) 3-06-20-01 331 340 2.72 Livingstone (S) 3-06-20-02 484 505 4.34 Livingstone (S) 3-06-20-03 348 371 6.61 Livingstone (S) 3-06-20-04 634 680 7.26 Livingstone (S) 3-06-20-05 403 431 6.95 Livingstone (S) 3-06-20-06 295 307 4.07 Livingstone (S) 3-06-20-07 533 560 5.07 Livingstone (S) 3-06-20-08 467 492 5.35 Livingstone (S) 3-06-20-09 570 609 6.84 Livingstone (S) 3-06-20-10 500 544 8.80 Livingstone (S) 3-06-20-11 437 463 5.95 Livingstone (S) 3-06-20-12 6 6 0.00 Livingstone (S) 55 18364 19470 6.02 Mount Morgan (S) 3-06-16-01 94 96 2.13 Mount Morgan (S) 3-06-16-02 198 196 -1.01 Mount Morgan (S) 3-06-16-03 318 312 -1.89 Mount Morgan (S) 3-06-16-04 223 223 0.00 Mount Morgan (S) 3-06-16-05 240 237 -1.25 Mount Morgan (S) 3-06-16-06 163 163 0.00 Mount Morgan (S) 3-06-16-07 478 476 -0.42 Mount Morgan (S) 3-06-16-08 247 242 -2.02 Mount Morgan (S) 3-06-16-09 120 119 -0.83 Mount Morgan (S) 9 2081 2064 -0.82 Nebo (S) 3-05-20-01 279 278 -0.36 Nebo (S) 3-05-20-02 92 95 3.26 Nebo (S) 3-05-20-03 160 167 4.38 Nebo (S) 3-05-20-04 248 249 0.40 Nebo (S) 3-05-20-05 156 155 -0.64 Nebo (S) 3-05-20-06 249 250 0.40 Nebo (S) 6 1184 1194 0.84 Rockhampton (C) 3-06-04-01 61 63 3.28 Rockhampton (C) 3-06-04-02 132 132 0.00 Rockhampton (C) 3-06-04-03 111 111 0.00 Rockhampton (C) 3-06-04-04 317 323 1.89 Rockhampton (C) 3-06-04-05 445 458 2.92 Rockhampton (C) 3-06-04-06 307 312 1.63

Queensland Redistribution Statistics 2006
Enrolment Projections
----------------------------------------------------------------------------------------------------------------------
35
Capricornia
---------------------------------------------------------------------------------------------------------------------- SLA Name CCD Number Actual
Enrolment 2/12/2005
Estimate 30/11/2007
Growth (%)
---------------------------------------------------------------------------------------------------------------------- Rockhampton (C) 3-06-04-07 193 189 -2.07 Rockhampton (C) 3-06-04-08 236 240 1.69 Rockhampton (C) 3-06-04-09 380 377 -0.79 Rockhampton (C) 3-06-04-10 612 627 2.45 Rockhampton (C) 3-06-04-11 330 336 1.82 Rockhampton (C) 3-06-04-12 484 497 2.69 Rockhampton (C) 3-06-04-13 465 479 3.01 Rockhampton (C) 3-06-04-14 151 158 4.64 Rockhampton (C) 3-06-04-15 534 547 2.43 Rockhampton (C) 3-06-04-16 572 600 4.90 Rockhampton (C) 3-06-04-17 489 535 9.41 Rockhampton (C) 3-06-04-18 687 707 2.91 Rockhampton (C) 3-06-04-19 537 639 18.99 Rockhampton (C) 3-06-04-20 62 62 0.00 Rockhampton (C) 3-06-05-01 617 619 0.32 Rockhampton (C) 3-06-05-02 450 451 0.22 Rockhampton (C) 3-06-05-03 545 551 1.10 Rockhampton (C) 3-06-05-04 344 350 1.74 Rockhampton (C) 3-06-05-05 543 549 1.10 Rockhampton (C) 3-06-05-06 515 517 0.39 Rockhampton (C) 3-06-05-07 313 310 -0.96 Rockhampton (C) 3-06-05-08 340 343 0.88 Rockhampton (C) 3-06-05-09 296 295 -0.34 Rockhampton (C) 3-06-05-10 470 511 8.72 Rockhampton (C) 3-06-05-11 266 268 0.75 Rockhampton (C) 3-06-05-12 197 195 -1.02 Rockhampton (C) 3-06-06-01 349 357 2.29 Rockhampton (C) 3-06-06-02 469 473 0.85 Rockhampton (C) 3-06-06-03 476 479 0.63 Rockhampton (C) 3-06-06-04 386 389 0.78 Rockhampton (C) 3-06-06-05 390 402 3.08 Rockhampton (C) 3-06-06-06 300 301 0.33 Rockhampton (C) 3-06-06-07 445 447 0.45 Rockhampton (C) 3-06-06-08 256 260 1.56 Rockhampton (C) 3-06-06-09 367 365 -0.54 Rockhampton (C) 3-06-06-10 389 395 1.54 Rockhampton (C) 3-06-07-01 320 321 0.31 Rockhampton (C) 3-06-07-02 26 26 0.00 Rockhampton (C) 3-06-07-03 381 386 1.31 Rockhampton (C) 3-06-07-04 526 527 0.19 Rockhampton (C) 3-06-07-05 534 534 0.00 Rockhampton (C) 3-06-07-06 408 414 1.47 Rockhampton (C) 3-06-07-07 357 358 0.28 Rockhampton (C) 3-06-07-08 329 327 -0.61 Rockhampton (C) 3-06-07-09 580 594 2.41 Rockhampton (C) 3-06-07-10 402 417 3.73 Rockhampton (C) 3-06-07-11 511 511 0.00

Queensland Redistribution Statistics 2006
Enrolment Projections
----------------------------------------------------------------------------------------------------------------------
36
Capricornia
---------------------------------------------------------------------------------------------------------------------- SLA Name CCD Number Actual
Enrolment 2/12/2005
Estimate 30/11/2007
Growth (%)
---------------------------------------------------------------------------------------------------------------------- Rockhampton (C) 3-06-07-12 568 573 0.88 Rockhampton (C) 3-06-07-13 330 332 0.61 Rockhampton (C) 3-06-07-14 238 241 1.26 Rockhampton (C) 3-06-07-15 290 292 0.69 Rockhampton (C) 3-06-07-16 242 252 4.13 Rockhampton (C) 3-06-08-01 271 281 3.69 Rockhampton (C) 3-06-08-02 274 275 0.36 Rockhampton (C) 3-06-08-03 308 315 2.27 Rockhampton (C) 3-06-08-04 364 371 1.92 Rockhampton (C) 3-06-08-05 545 546 0.18 Rockhampton (C) 3-06-08-06 372 385 3.49 Rockhampton (C) 3-06-08-07 413 416 0.73 Rockhampton (C) 3-06-08-08 150 150 0.00 Rockhampton (C) 3-06-08-09 188 190 1.06 Rockhampton (C) 3-06-08-10 308 308 0.00 Rockhampton (C) 3-06-08-11 187 190 1.60 Rockhampton (C) 3-06-08-12 323 320 -0.93 Rockhampton (C) 3-06-08-13 672 688 2.38 Rockhampton (C) 3-06-08-14 371 387 4.31 Rockhampton (C) 3-06-08-15 14 14 0.00 Rockhampton (C) 3-06-09-01 351 361 2.85 Rockhampton (C) 3-06-09-02 469 473 0.85 Rockhampton (C) 3-06-09-03 434 437 0.69 Rockhampton (C) 3-06-09-04 447 465 4.03 Rockhampton (C) 3-06-09-05 414 415 0.24 Rockhampton (C) 3-06-09-06 397 397 0.00 Rockhampton (C) 3-06-09-07 305 306 0.33 Rockhampton (C) 3-06-09-08 231 231 0.00 Rockhampton (C) 3-06-09-09 335 343 2.39 Rockhampton (C) 3-06-10-01 79 79 0.00 Rockhampton (C) 3-06-10-02 51 55 7.84 Rockhampton (C) 3-06-10-03 15 15 0.00 Rockhampton (C) 3-06-10-04 56 56 0.00 Rockhampton (C) 3-06-10-05 84 87 3.57 Rockhampton (C) 3-06-10-06 269 272 1.12 Rockhampton (C) 3-06-10-07 180 183 1.67 Rockhampton (C) 3-06-10-08 300 299 -0.33 Rockhampton (C) 3-06-10-09 202 203 0.50 Rockhampton (C) 3-06-10-10 371 374 0.81 Rockhampton (C) 3-06-10-11 122 123 0.82 Rockhampton (C) 3-06-10-12 88 86 -2.27 Rockhampton (C) 3-06-10-13 106 105 -0.94 Rockhampton (C) 3-06-11-01 251 256 1.99 Rockhampton (C) 3-06-11-02 250 247 -1.20 Rockhampton (C) 3-06-11-03 161 164 1.86 Rockhampton (C) 3-06-11-04 174 173 -0.57 Rockhampton (C) 3-06-11-05 324 326 0.62
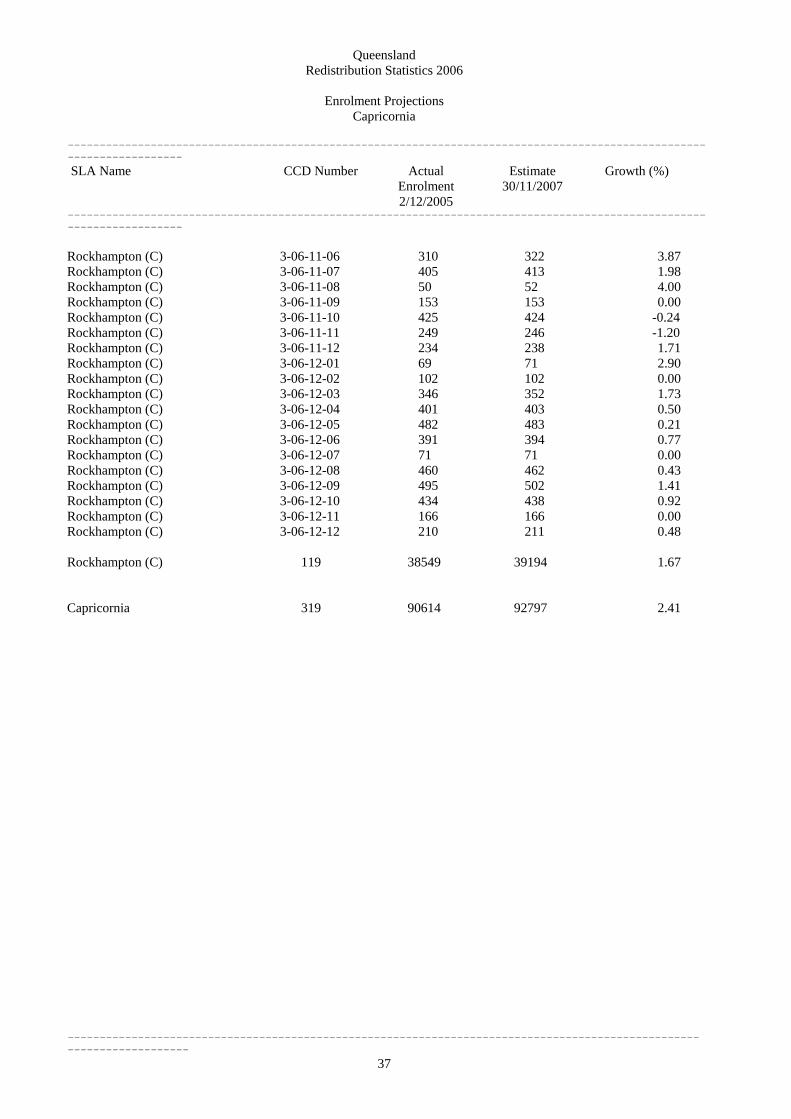
Queensland Redistribution Statistics 2006
Enrolment Projections
----------------------------------------------------------------------------------------------------------------------
37
Rockhampton (C) 3-06-12-03 346 352 1.73
Capricornia
---------------------------------------------------------------------------------------------------------------------- SLA Name CCD Number Actual
Enrolment 2/12/2005
Estimate 30/11/2007
Growth (%)
---------------------------------------------------------------------------------------------------------------------- Rockhampton (C) 3-06-11-06 310 322 3.87 Rockhampton (C) 3-06-11-07 405 413 1.98 Rockhampton (C) 3-06-11-08 50 52 4.00 Rockhampton (C) 3-06-11-09 153 153 0.00 Rockhampton (C) 3-06-11-10 425 424 -0.24 Rockhampton (C) 3-06-11-11 249 246 -1.20 Rockhampton (C) 3-06-11-12 234 238 1.71 Rockhampton (C) 3-06-12-01 69 71 2.90 Rockhampton (C) 3-06-12-02 102 102 0.00
Rockhampton (C) 3-06-12-04 401 403 0.50 Rockhampton (C) 3-06-12-05 482 483 0.21 Rockhampton (C) 3-06-12-06 391 394 0.77 Rockhampton (C) 3-06-12-07 71 71 0.00 Rockhampton (C) 3-06-12-08 460 462 0.43 Rockhampton (C) 3-06-12-09 495 502 1.41 Rockhampton (C) 3-06-12-10 434 438 0.92 Rockhampton (C) 3-06-12-11 166 166 0.00 Rockhampton (C) 3-06-12-12 210 211 0.48 Rockhampton (C) 119 38549 39194 1.67 Capricornia 319 90614 92797 2.41
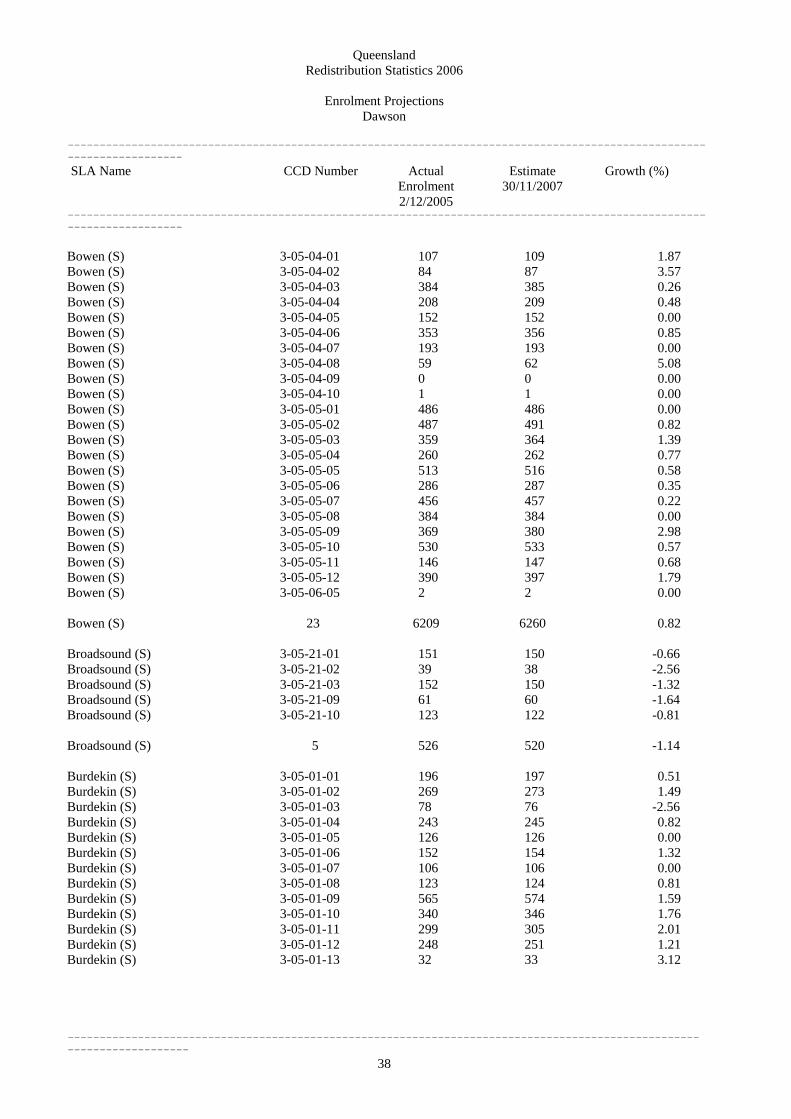
Queensland Redistribution Statistics 2006
Enrolment Projections
----------------------------------------------------------------------------------------------------------------------
38
Dawson
---------------------------------------------------------------------------------------------------------------------- SLA Name CCD Number Actual
Enrolment 2/12/2005
Estimate 30/11/2007
Growth (%)
---------------------------------------------------------------------------------------------------------------------- Bowen (S) 3-05-04-01 107 109 1.87 Bowen (S) 3-05-04-02 84 87 3.57 Bowen (S) 3-05-04-03 384 385 0.26 Bowen (S) 3-05-04-04 208 209 0.48 Bowen (S) 3-05-04-05 152 152 0.00 Bowen (S) 3-05-04-06 353 356 0.85 Bowen (S) 3-05-04-07 193 193 0.00 Bowen (S) 3-05-04-08 59 62 5.08 Bowen (S) 3-05-04-09 0 0 0.00 Bowen (S) 3-05-04-10 1 1 0.00 Bowen (S) 3-05-05-01 486 486 0.00 Bowen (S) 3-05-05-02 487 491 0.82 Bowen (S) 3-05-05-03 359 364 1.39 Bowen (S) 3-05-05-04 260 262 0.77 Bowen (S) 3-05-05-05 513 516 0.58 Bowen (S) 3-05-05-06 286 287 0.35 Bowen (S) 3-05-05-07 456 457 0.22 Bowen (S) 3-05-05-08 384 384 0.00 Bowen (S) 3-05-05-09 369 380 2.98 Bowen (S) 3-05-05-10 530 533 0.57 Bowen (S) 3-05-05-11 146 147 0.68 Bowen (S) 3-05-05-12 390 397 1.79 Bowen (S) 3-05-06-05 2 2 0.00 Bowen (S) 23 6209 6260 0.82 Broadsound (S) 3-05-21-01 151 150 -0.66 Broadsound (S) 3-05-21-02 39 38 -2.56 Broadsound (S) 3-05-21-03 152 150 -1.32 Broadsound (S) 3-05-21-09 61 60 -1.64 Broadsound (S) 3-05-21-10 123 122 -0.81 Broadsound (S) 5 526 520 -1.14 Burdekin (S) 3-05-01-01 196 197 0.51 Burdekin (S) 3-05-01-02 269 273 1.49 Burdekin (S) 3-05-01-03 78 76 -2.56 Burdekin (S) 3-05-01-04 243 245 0.82 Burdekin (S) 3-05-01-05 126 126 0.00 Burdekin (S) 3-05-01-06 152 154 1.32 Burdekin (S) 3-05-01-07 106 106 0.00 Burdekin (S) 3-05-01-08 123 124 0.81 Burdekin (S) 3-05-01-09 565 574 1.59 Burdekin (S) 3-05-01-10 340 346 1.76 Burdekin (S) 3-05-01-11 299 305 2.01 Burdekin (S) 3-05-01-12 248 251 1.21 Burdekin (S) 3-05-01-13 32 33 3.12
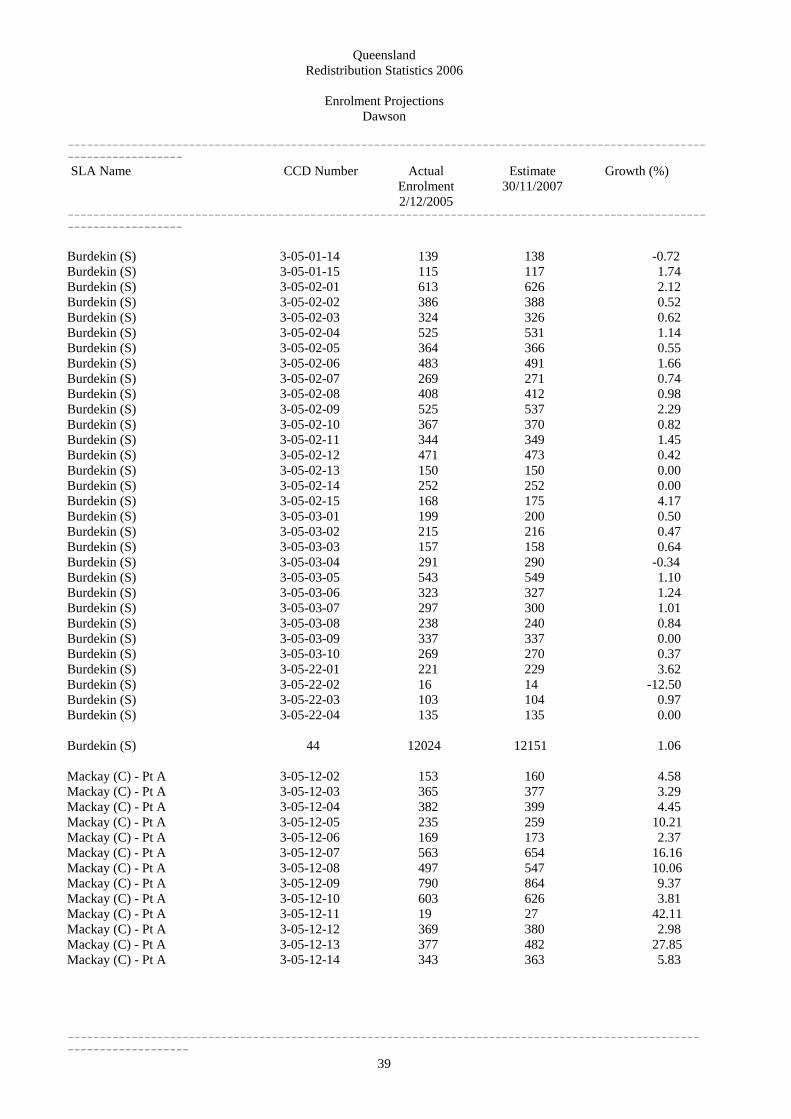
Queensland Redistribution Statistics 2006
Enrolment Projections
----------------------------------------------------------------------------------------------------------------------
39
Dawson
---------------------------------------------------------------------------------------------------------------------- SLA Name CCD Number Actual
Enrolment 2/12/2005
Estimate 30/11/2007
Growth (%)
---------------------------------------------------------------------------------------------------------------------- Burdekin (S) 3-05-01-14 139 138 -0.72 Burdekin (S) 3-05-01-15 115 117 1.74 Burdekin (S) 3-05-02-01 613 626 2.12 Burdekin (S) 3-05-02-02 386 388 0.52 Burdekin (S) 3-05-02-03 324 326 0.62 Burdekin (S) 3-05-02-04 525 531 1.14 Burdekin (S) 3-05-02-05 364 366 0.55 Burdekin (S) 3-05-02-06 483 491 1.66 Burdekin (S) 3-05-02-07 269 271 0.74 Burdekin (S) 3-05-02-08 408 412 0.98 Burdekin (S) 3-05-02-09 525 537 2.29 Burdekin (S) 3-05-02-10 367 370 0.82 Burdekin (S) 3-05-02-11 344 349 1.45 Burdekin (S) 3-05-02-12 471 473 0.42 Burdekin (S) 3-05-02-13 150 150 0.00 Burdekin (S) 3-05-02-14 252 252 0.00 Burdekin (S) 3-05-02-15 168 175 4.17 Burdekin (S) 3-05-03-01 199 200 0.50 Burdekin (S) 3-05-03-02 215 216 0.47 Burdekin (S) 3-05-03-03 157 158 0.64 Burdekin (S) 3-05-03-04 291 290 -0.34 Burdekin (S) 3-05-03-05 543 549 1.10 Burdekin (S) 3-05-03-06 323 327 1.24 Burdekin (S) 3-05-03-07 297 300 1.01 Burdekin (S) 3-05-03-08 238 240 0.84 Burdekin (S) 3-05-03-09 337 337 0.00 Burdekin (S) 3-05-03-10 269 270 0.37 Burdekin (S) 3-05-22-01 221 229 3.62 Burdekin (S) 3-05-22-02 16 14 -12.50 Burdekin (S) 3-05-22-03 103 104 0.97 Burdekin (S) 3-05-22-04 135 135 0.00 Burdekin (S) 44 12024 12151 1.06 Mackay (C) - Pt A 3-05-12-02 153 160 4.58 Mackay (C) - Pt A 3-05-12-03 365 377 3.29 Mackay (C) - Pt A 3-05-12-04 382 399 4.45 Mackay (C) - Pt A 3-05-12-05 235 259 10.21 Mackay (C) - Pt A 3-05-12-06 169 173 2.37 Mackay (C) - Pt A 3-05-12-07 563 654 16.16 Mackay (C) - Pt A 3-05-12-08 497 547 10.06 Mackay (C) - Pt A 3-05-12-09 790 864 9.37 Mackay (C) - Pt A 3-05-12-10 603 626 3.81 Mackay (C) - Pt A 3-05-12-11 19 27 42.11 Mackay (C) - Pt A 3-05-12-12 369 380 2.98 Mackay (C) - Pt A 3-05-12-13 377 482 27.85 Mackay (C) - Pt A 3-05-12-14 343 363 5.83
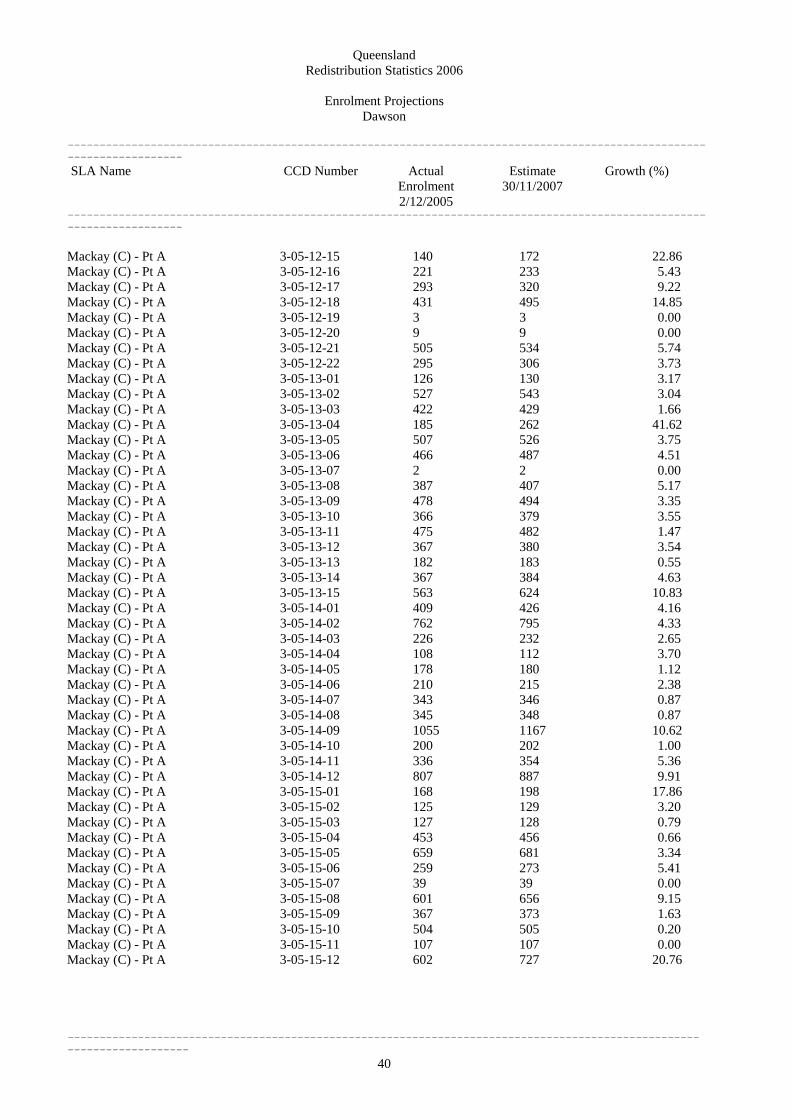
Queensland Redistribution Statistics 2006
Enrolment Projections
----------------------------------------------------------------------------------------------------------------------
40
Dawson
---------------------------------------------------------------------------------------------------------------------- SLA Name CCD Number Actual
Enrolment 2/12/2005
Estimate 30/11/2007
Growth (%)
---------------------------------------------------------------------------------------------------------------------- Mackay (C) - Pt A 3-05-12-15 140 172 22.86 Mackay (C) - Pt A 3-05-12-16 221 233 5.43 Mackay (C) - Pt A 3-05-12-17 293 320 9.22 Mackay (C) - Pt A 3-05-12-18 431 495 14.85 Mackay (C) - Pt A 3-05-12-19 3 3 0.00 Mackay (C) - Pt A 3-05-12-20 9 9 0.00 Mackay (C) - Pt A 3-05-12-21 505 534 5.74 Mackay (C) - Pt A 3-05-12-22 295 306 3.73 Mackay (C) - Pt A 3-05-13-01 126 130 3.17 Mackay (C) - Pt A 3-05-13-02 527 543 3.04 Mackay (C) - Pt A 3-05-13-03 422 429 1.66 Mackay (C) - Pt A 3-05-13-04 185 262 41.62 Mackay (C) - Pt A 3-05-13-05 507 526 3.75 Mackay (C) - Pt A 3-05-13-06 466 487 4.51 Mackay (C) - Pt A 3-05-13-07 2 2 0.00 Mackay (C) - Pt A 3-05-13-08 387 407 5.17 Mackay (C) - Pt A 3-05-13-09 478 494 3.35 Mackay (C) - Pt A 3-05-13-10 366 379 3.55 Mackay (C) - Pt A 3-05-13-11 475 482 1.47 Mackay (C) - Pt A 3-05-13-12 367 380 3.54 Mackay (C) - Pt A 3-05-13-13 182 183 0.55 Mackay (C) - Pt A 3-05-13-14 367 384 4.63 Mackay (C) - Pt A 3-05-13-15 563 624 10.83 Mackay (C) - Pt A 3-05-14-01 409 426 4.16 Mackay (C) - Pt A 3-05-14-02 762 795 4.33 Mackay (C) - Pt A 3-05-14-03 226 232 2.65 Mackay (C) - Pt A 3-05-14-04 108 112 3.70 Mackay (C) - Pt A 3-05-14-05 178 180 1.12 Mackay (C) - Pt A 3-05-14-06 210 215 2.38 Mackay (C) - Pt A 3-05-14-07 343 346 0.87 Mackay (C) - Pt A 3-05-14-08 345 348 0.87 Mackay (C) - Pt A 3-05-14-09 1055 1167 10.62 Mackay (C) - Pt A 3-05-14-10 200 202 1.00 Mackay (C) - Pt A 3-05-14-11 336 354 5.36 Mackay (C) - Pt A 3-05-14-12 807 887 9.91 Mackay (C) - Pt A 3-05-15-01 168 198 17.86 Mackay (C) - Pt A 3-05-15-02 125 129 3.20 Mackay (C) - Pt A 3-05-15-03 127 128 0.79 Mackay (C) - Pt A 3-05-15-04 453 456 0.66 Mackay (C) - Pt A 3-05-15-05 659 681 3.34 Mackay (C) - Pt A 3-05-15-06 259 273 5.41 Mackay (C) - Pt A 3-05-15-07 39 39 0.00 Mackay (C) - Pt A 3-05-15-08 601 656 9.15 Mackay (C) - Pt A 3-05-15-09 367 373 1.63 Mackay (C) - Pt A 3-05-15-10 504 505 0.20 Mackay (C) - Pt A 3-05-15-11 107 107 0.00 Mackay (C) - Pt A 3-05-15-12 602 727 20.76

Queensland Redistribution Statistics 2006
Enrolment Projections
----------------------------------------------------------------------------------------------------------------------
41
Dawson
---------------------------------------------------------------------------------------------------------------------- SLA Name CCD Number Actual
Enrolment 2/12/2005
Estimate 30/11/2007
Growth (%)
---------------------------------------------------------------------------------------------------------------------- Mackay (C) - Pt A 3-05-15-13 542 551 1.66 Mackay (C) - Pt A 3-05-15-14 383 392 2.35 Mackay (C) - Pt A 3-05-15-15 154 157 1.95 Mackay (C) - Pt A 3-05-15-16 244 266 9.02 Mackay (C) - Pt A 3-05-15-17 258 335 29.84 Mackay (C) - Pt A 3-05-15-18 499 636 27.45 Mackay (C) - Pt A 3-05-15-19 285 287 0.70 Mackay (C) - Pt A 3-05-15-20 579 603 4.15 Mackay (C) - Pt A 3-05-16-01 518 528 1.93 Mackay (C) - Pt A 3-05-16-02 81 80 -1.23 Mackay (C) - Pt A 3-05-16-03 298 301 1.01 Mackay (C) - Pt A 3-05-16-04 464 485 4.53 Mackay (C) - Pt A 3-05-16-05 454 460 1.32 Mackay (C) - Pt A 3-05-16-06 556 569 2.34 Mackay (C) - Pt A 3-05-16-07 250 253 1.20 Mackay (C) - Pt A 3-05-16-08 496 501 1.01 Mackay (C) - Pt A 3-05-16-09 360 366 1.67 Mackay (C) - Pt A 3-05-16-10 200 205 2.50 Mackay (C) - Pt A 3-05-16-11 299 309 3.34 Mackay (C) - Pt A 3-05-16-12 252 265 5.16 Mackay (C) - Pt A 3-05-16-13 607 629 3.62 Mackay (C) - Pt A 3-05-16-14 314 325 3.50 Mackay (C) - Pt A 3-05-17-01 251 256 1.99 Mackay (C) - Pt A 3-05-17-02 168 169 0.60 Mackay (C) - Pt A 3-05-17-03 242 240 -0.83 Mackay (C) - Pt A 3-05-17-04 324 325 0.31 Mackay (C) - Pt A 3-05-17-05 251 262 4.38 Mackay (C) - Pt A 3-05-17-06 212 211 -0.47 Mackay (C) - Pt A 3-05-17-07 412 420 1.94 Mackay (C) - Pt A 3-05-17-08 496 504 1.61 Mackay (C) - Pt A 3-05-17-09 554 566 2.17 Mackay (C) - Pt A 3-05-17-10 414 421 1.69 Mackay (C) - Pt A 3-05-17-11 252 258 2.38 Mackay (C) - Pt A 3-05-17-12 185 185 0.00 Mackay (C) - Pt A 3-05-17-13 128 129 0.78 Mackay (C) - Pt A 3-05-17-14 70 68 -2.86 Mackay (C) - Pt A 3-05-18-01 288 293 1.74 Mackay (C) - Pt A 3-05-18-02 502 514 2.39 Mackay (C) - Pt A 3-05-18-03 135 138 2.22 Mackay (C) - Pt A 3-05-18-04 220 226 2.73 Mackay (C) - Pt A 3-05-18-05 750 776 3.47 Mackay (C) - Pt A 3-05-18-06 488 535 9.63 Mackay (C) - Pt A 3-05-18-07 373 391 4.83 Mackay (C) - Pt A 3-05-18-08 202 201 -0.50 Mackay (C) - Pt A 3-05-18-09 441 447 1.36 Mackay (C) - Pt A 3-05-18-10 509 588 15.52 Mackay (C) - Pt A 3-05-18-11 535 577 7.85

Queensland Redistribution Statistics 2006
Enrolment Projections
----------------------------------------------------------------------------------------------------------------------
42
Dawson
---------------------------------------------------------------------------------------------------------------------- SLA Name CCD Number Actual
Enrolment 2/12/2005
Estimate 30/11/2007
Growth (%)
---------------------------------------------------------------------------------------------------------------------- Mackay (C) - Pt A 3-05-18-12 486 495 1.85 Mackay (C) - Pt A 3-05-18-13 347 349 0.58 Mackay (C) - Pt A 3-05-18-14 248 249 0.40 Mackay (C) - Pt A 3-05-18-15 470 483 2.77 Mackay (C) - Pt A 3-05-18-16 215 216 0.47 Mackay (C) - Pt A 3-05-18-17 154 153 -0.65 Mackay (C) - Pt A 3-05-24-01 321 318 -0.93 Mackay (C) - Pt A 3-05-24-02 571 584 2.28 Mackay (C) - Pt A 3-05-24-03 762 774 1.57 Mackay (C) - Pt A 3-05-24-04 158 160 1.27 Mackay (C) - Pt A 3-05-24-05 465 478 2.80 Mackay (C) - Pt A 3-05-24-06 614 623 1.47 Mackay (C) - Pt A 3-05-24-07 630 647 2.70 Mackay (C) - Pt A 3-05-24-08 873 918 5.15 Mackay (C) - Pt A 3-05-24-09 424 432 1.89 Mackay (C) - Pt A 3-05-24-10 395 412 4.30 Mackay (C) - Pt A 3-05-24-11 305 326 6.89 Mackay (C) - Pt A 3-05-24-12 253 283 11.86 Mackay (C) - Pt A 3-05-24-13 386 392 1.55 Mackay (C) - Pt A 3-27-02-10 6 6 0.00 Mackay (C) - Pt A 127 45750 48132 5.21 Mackay (C) - Pt B 3-05-10-01 93 95 2.15 Mackay (C) - Pt B 3-05-10-02 196 207 5.61 Mackay (C) - Pt B 3-05-10-03 228 235 3.07 Mackay (C) - Pt B 3-05-10-04 168 174 3.57 Mackay (C) - Pt B 3-05-10-05 72 75 4.17 Mackay (C) - Pt B 3-05-10-06 164 171 4.27 Mackay (C) - Pt B 3-05-10-07 143 144 0.70 Mackay (C) - Pt B 3-05-10-08 317 325 2.52 Mackay (C) - Pt B 3-05-10-09 313 321 2.56 Mackay (C) - Pt B 3-05-10-10 225 229 1.78 Mackay (C) - Pt B 3-05-10-11 45 46 2.22 Mackay (C) - Pt B 3-05-10-12 25 26 4.00 Mackay (C) - Pt B 3-05-10-13 258 262 1.55 Mackay (C) - Pt B 3-05-10-14 187 199 6.42 Mackay (C) - Pt B 3-05-10-15 119 124 4.20 Mackay (C) - Pt B 3-05-11-01 410 426 3.90 Mackay (C) - Pt B 3-05-11-02 314 323 2.87 Mackay (C) - Pt B 3-05-11-03 238 240 0.84 Mackay (C) - Pt B 3-05-11-04 451 463 2.66 Mackay (C) - Pt B 3-05-11-05 223 230 3.14 Mackay (C) - Pt B 3-05-11-06 422 435 3.08 Mackay (C) - Pt B 3-05-11-07 265 274 3.40 Mackay (C) - Pt B 3-05-11-08 213 222 4.23 Mackay (C) - Pt B 3-05-11-09 311 324 4.18

Queensland Redistribution Statistics 2006
Enrolment Projections
----------------------------------------------------------------------------------------------------------------------
43
Dawson
---------------------------------------------------------------------------------------------------------------------- SLA Name CCD Number Actual
Enrolment 2/12/2005
Estimate 30/11/2007
Growth (%)
---------------------------------------------------------------------------------------------------------------------- Mackay (C) - Pt B 3-05-11-10 513 525 2.34 Mackay (C) - Pt B 3-05-11-11 450 463 2.89 Mackay (C) - Pt B 3-05-11-12 261 270 3.45 Mackay (C) - Pt B 3-05-11-13 273 287 5.13 Mackay (C) - Pt B 3-05-12-01 480 497 3.54 Mackay (C) - Pt B 3-05-12-23 95 96 1.05 Mackay (C) - Pt B 30 7472 7708 3.16 Mirani (S) 3-05-09-01 184 191 3.80 Mirani (S) 3-05-09-02 158 160 1.27 Mirani (S) 3-05-09-03 260 267 2.69 Mirani (S) 3-05-09-04 455 472 3.74 Mirani (S) 3-05-09-05 461 472 2.39 Mirani (S) 3-05-09-06 490 507 3.47 Mirani (S) 3-05-09-07 535 557 4.11 Mirani (S) 3-05-09-08 138 138 0.00 Mirani (S) 3-05-09-09 294 301 2.38 Mirani (S) 3-05-09-10 157 164 4.46 Mirani (S) 3-05-09-11 186 196 5.38 Mirani (S) 3-05-09-12 51 53 3.92 Mirani (S) 12 3369 3478 3.24 Sarina (S) 3-05-19-01 405 425 4.94 Sarina (S) 3-05-19-02 374 398 6.42 Sarina (S) 3-05-19-03 362 374 3.31 Sarina (S) 3-05-19-04 145 154 6.21 Sarina (S) 3-05-19-05 607 618 1.81 Sarina (S) 3-05-19-06 332 345 3.92 Sarina (S) 3-05-19-07 317 330 4.10 Sarina (S) 3-05-19-08 114 122 7.02 Sarina (S) 3-05-19-09 204 212 3.92 Sarina (S) 3-05-19-10 473 478 1.06 Sarina (S) 3-05-19-11 138 135 -2.17 Sarina (S) 3-05-19-12 321 330 2.80 Sarina (S) 3-05-25-01 280 288 2.86 Sarina (S) 3-05-25-02 99 99 0.00 Sarina (S) 3-05-25-03 311 326 4.82 Sarina (S) 3-05-25-04 476 487 2.31 Sarina (S) 3-05-25-05 124 122 -1.61 Sarina (S) 3-05-25-06 563 575 2.13 Sarina (S) 3-05-25-07 377 386 2.39 Sarina (S) 3-05-25-08 323 329 1.86 Sarina (S) 3-05-25-09 91 93 2.20 Sarina (S) 3-05-25-10 96 96 0.00 Sarina (S) 3-05-25-11 313 322 2.88

Queensland Redistribution Statistics 2006
Enrolment Projections
----------------------------------------------------------------------------------------------------------------------
44
Dawson
---------------------------------------------------------------------------------------------------------------------- SLA Name CCD Number Actual
Enrolment 2/12/2005
Estimate 30/11/2007
Growth (%)
---------------------------------------------------------------------------------------------------------------------- Sarina (S) 23 6845 7044 2.91 Whitsunday (S) 3-05-07-01 554 570 2.89 Whitsunday (S) 3-05-07-02 128 132 3.12 Whitsunday (S) 3-05-07-03 448 472 5.36 Whitsunday (S) 3-05-07-04 168 180 7.14 Whitsunday (S) 3-05-07-05 692 733 5.92 Whitsunday (S) 3-05-07-06 327 336 2.75 Whitsunday (S) 3-05-07-07 36 38 5.56 Whitsunday (S) 3-05-07-08 266 274 3.01 Whitsunday (S) 3-05-07-09 474 504 6.33 Whitsunday (S) 3-05-07-10 411 431 4.87 Whitsunday (S) 3-05-07-11 452 488 7.96 Whitsunday (S) 3-05-07-12 231 244 5.63 Whitsunday (S) 3-05-07-13 245 279 13.88 Whitsunday (S) 3-05-08-01 220 225 2.27 Whitsunday (S) 3-05-08-02 0 0 0.00 Whitsunday (S) 3-05-08-03 404 428 5.94 Whitsunday (S) 3-05-08-04 303 342 12.87 Whitsunday (S) 3-05-08-05 374 410 9.63 Whitsunday (S) 3-05-08-06 215 234 8.84 Whitsunday (S) 3-05-08-07 386 424 9.84 Whitsunday (S) 3-05-08-08 119 132 10.92 Whitsunday (S) 3-05-08-09 418 494 18.18 Whitsunday (S) 3-05-08-10 486 554 13.99 Whitsunday (S) 3-05-08-11 458 503 9.83 Whitsunday (S) 3-05-08-12 307 332 8.14 Whitsunday (S) 3-05-08-13 378 407 7.67 Whitsunday (S) 3-05-08-14 230 237 3.04 Whitsunday (S) 3-05-08-15 423 470 11.11 Whitsunday (S) 3-05-08-16 224 240 7.14 Whitsunday (S) 3-05-08-17 262 297 13.36 Whitsunday (S) 30 9639 10410 8.00 Dawson 294 91834 95703 4.21

Queensland Redistribution Statistics 2006
Enrolment Projections
----------------------------------------------------------------------------------------------------------------------
45
Dickson
---------------------------------------------------------------------------------------------------------------------- SLA Name CCD Number Actual
Enrolment 2/12/2005
Estimate 30/11/2007
Growth (%)
---------------------------------------------------------------------------------------------------------------------- Albany Creek 3-18-09-01 532 558 4.89 Albany Creek 3-18-09-02 520 548 5.38 Albany Creek 3-18-09-03 453 467 3.09 Albany Creek 3-18-09-04 523 547 4.59 Albany Creek 3-18-09-05 397 414 4.28 Albany Creek 3-18-09-06 497 511 2.82 Albany Creek 3-18-09-07 647 666 2.94 Albany Creek 3-18-09-08 653 720 10.26 Albany Creek 3-18-09-09 654 677 3.52 Albany Creek 3-18-09-10 568 596 4.93 Albany Creek 3-18-09-11 399 415 4.01 Albany Creek 3-18-09-12 456 472 3.51 Albany Creek 3-18-09-13 532 545 2.44 Albany Creek 3-18-09-14 703 732 4.13 Albany Creek 3-18-09-15 440 473 7.50 Albany Creek 3-18-09-16 490 536 9.39 Albany Creek 3-18-09-17 496 553 11.49 Albany Creek 3-18-09-18 471 499 5.94 Albany Creek 3-18-09-19 921 993 7.82 Albany Creek 19 10352 10922 5.51 Bray Park 3-18-07-01 559 597 6.80 Bray Park 3-18-07-02 567 573 1.06 Bray Park 3-18-07-03 667 681 2.10 Bray Park 3-18-07-04 519 531 2.31 Bray Park 3-18-07-06 547 560 2.38 Bray Park 3-18-07-07 209 209 0.00 Bray Park 3-18-07-08 196 199 1.53 Bray Park 3-18-07-09 481 484 0.62 Bray Park 3-18-07-10 557 568 1.97 Bray Park 3-18-07-11 606 628 3.63 Bray Park 3-18-07-12 544 548 0.74 Bray Park 3-18-07-14 400 405 1.25 Bray Park 12 5852 5983 2.24 Central Pine West 3-18-03-01 555 657 18.38 Central Pine West 3-18-03-02 574 651 13.41 Central Pine West 3-18-03-06 906 981 8.28 Central Pine West 3-18-03-08 691 865 25.18 Central Pine West 3-18-03-09 709 780 10.01 Central Pine West 3-18-03-10 363 392 7.99 Central Pine West 3-18-03-11 178 239 34.27 Central Pine West 3-18-03-12 488 519 6.35 Central Pine West 3-18-03-13 304 361 18.75 Central Pine West 3-18-03-15 545 584 7.16
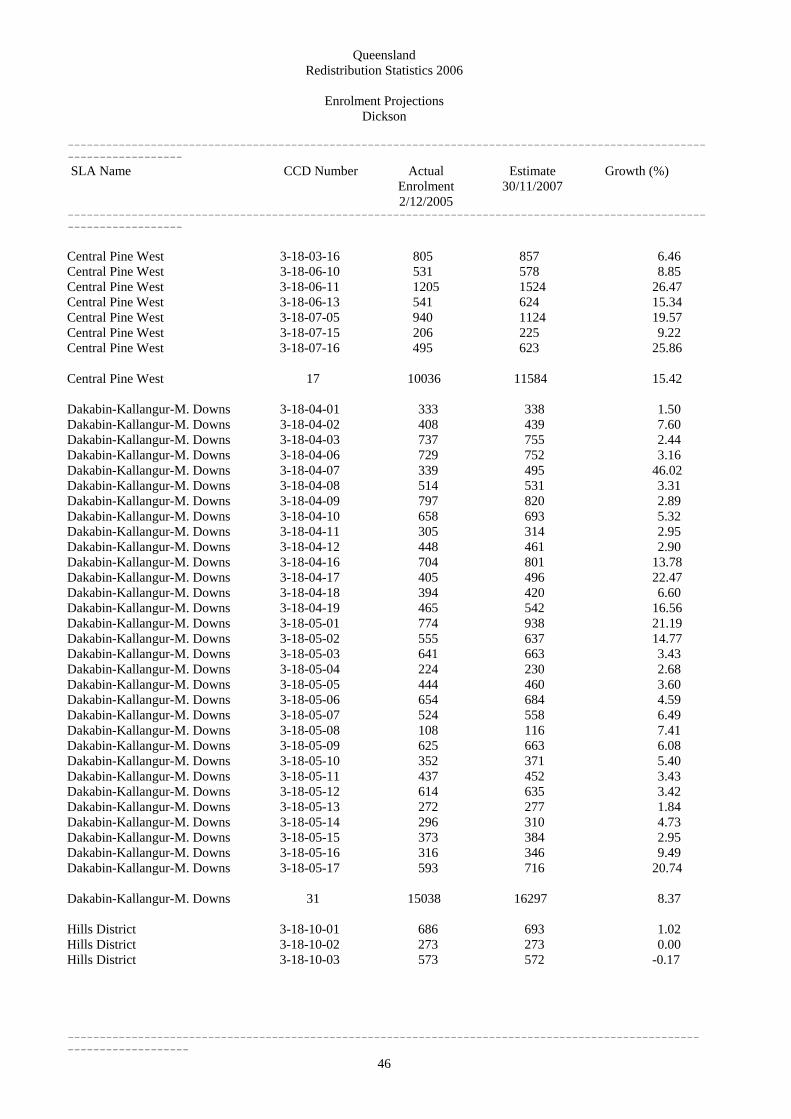
Queensland Redistribution Statistics 2006
Enrolment Projections
----------------------------------------------------------------------------------------------------------------------
46
Dickson
---------------------------------------------------------------------------------------------------------------------- SLA Name CCD Number Actual
Enrolment 2/12/2005
Estimate 30/11/2007
Growth (%)
---------------------------------------------------------------------------------------------------------------------- Central Pine West 3-18-03-16 805 857 6.46 Central Pine West 3-18-06-10 531 578 8.85 Central Pine West 3-18-06-11 1205 1524 26.47 Central Pine West 3-18-06-13 541 624 15.34 Central Pine West 3-18-07-05 940 1124 19.57 Central Pine West 3-18-07-15 206 225 9.22 Central Pine West 3-18-07-16 495 623 25.86 Central Pine West 17 10036 11584 15.42 Dakabin-Kallangur-M. Downs 3-18-04-01 333 338 1.50 Dakabin-Kallangur-M. Downs 3-18-04-02 408 439 7.60 Dakabin-Kallangur-M. Downs 3-18-04-03 737 755 2.44 Dakabin-Kallangur-M. Downs 3-18-04-06 729 752 3.16 Dakabin-Kallangur-M. Downs 3-18-04-07 339 495 46.02 Dakabin-Kallangur-M. Downs 3-18-04-08 514 531 3.31 Dakabin-Kallangur-M. Downs 3-18-04-09 797 820 2.89 Dakabin-Kallangur-M. Downs 3-18-04-10 658 693 5.32 Dakabin-Kallangur-M. Downs 3-18-04-11 305 314 2.95 Dakabin-Kallangur-M. Downs 3-18-04-12 448 461 2.90 Dakabin-Kallangur-M. Downs 3-18-04-16 704 801 13.78 Dakabin-Kallangur-M. Downs 3-18-04-17 405 496 22.47 Dakabin-Kallangur-M. Downs 3-18-04-18 394 420 6.60 Dakabin-Kallangur-M. Downs 3-18-04-19 465 542 16.56 Dakabin-Kallangur-M. Downs 3-18-05-01 774 938 21.19 Dakabin-Kallangur-M. Downs 3-18-05-02 555 637 14.77 Dakabin-Kallangur-M. Downs 3-18-05-03 641 663 3.43 Dakabin-Kallangur-M. Downs 3-18-05-04 224 230 2.68 Dakabin-Kallangur-M. Downs 3-18-05-05 444 460 3.60 Dakabin-Kallangur-M. Downs 3-18-05-06 654 684 4.59 Dakabin-Kallangur-M. Downs 3-18-05-07 524 558 6.49 Dakabin-Kallangur-M. Downs 3-18-05-08 108 116 7.41 Dakabin-Kallangur-M. Downs 3-18-05-09 625 663 6.08 Dakabin-Kallangur-M. Downs 3-18-05-10 352 371 5.40 Dakabin-Kallangur-M. Downs 3-18-05-11 437 452 3.43 Dakabin-Kallangur-M. Downs 3-18-05-12 614 635 3.42 Dakabin-Kallangur-M. Downs 3-18-05-13 272 277 1.84 Dakabin-Kallangur-M. Downs 3-18-05-14 296 310 4.73 Dakabin-Kallangur-M. Downs 3-18-05-15 373 384 2.95 Dakabin-Kallangur-M. Downs 3-18-05-16 316 346 9.49 Dakabin-Kallangur-M. Downs 3-18-05-17 593 716 20.74 Dakabin-Kallangur-M. Downs 31 15038 16297 8.37 Hills District 3-18-10-01 686 693 1.02 Hills District 3-18-10-02 273 273 0.00 Hills District 3-18-10-03 573 572 -0.17

Queensland Redistribution Statistics 2006
Enrolment Projections
----------------------------------------------------------------------------------------------------------------------
47
Dickson
---------------------------------------------------------------------------------------------------------------------- SLA Name CCD Number Actual
Enrolment 2/12/2005
Estimate 30/11/2007
Growth (%)
---------------------------------------------------------------------------------------------------------------------- Hills District 3-18-10-04 474 479 1.05 Hills District 3-18-10-05 571 577 1.05 Hills District 3-18-10-06 516 520 0.78 Hills District 3-18-10-07 622 626 0.64 Hills District 3-18-10-08 310 314 1.29 Hills District 3-18-10-10 43 45 4.65 Hills District 3-18-10-11 561 569 1.43 Hills District 3-18-10-12 794 827 4.16 Hills District 3-18-10-13 329 334 1.52 Hills District 3-18-10-14 480 495 3.12 Hills District 3-18-10-15 578 590 2.08 Hills District 3-18-10-16 154 159 3.25 Hills District 3-18-10-19 362 363 0.28 Hills District 3-18-10-20 576 639 10.94 Hills District 3-18-12-01 554 558 0.72 Hills District 3-18-12-02 451 457 1.33 Hills District 3-18-12-03 501 511 2.00 Hills District 3-18-12-04 455 461 1.32 Hills District 3-18-12-05 554 558 0.72 Hills District 3-18-12-06 262 265 1.15 Hills District 3-18-12-07 350 357 2.00 Hills District 3-18-12-08 529 567 7.18 Hills District 3-18-12-09 574 577 0.52 Hills District 3-18-12-10 383 400 4.44 Hills District 3-18-12-11 542 553 2.03 Hills District 3-18-12-12 480 489 1.88 Hills District 3-18-12-13 521 530 1.73 Hills District 3-18-12-14 360 368 2.22 Hills District 31 14418 14726 2.14 Lawnton 3-18-06-01 618 629 1.78 Lawnton 3-18-06-02 408 408 0.00 Lawnton 3-18-06-03 401 415 3.49 Lawnton 3-18-06-04 698 690 -1.15 Lawnton 3-18-06-05 135 139 2.96 Lawnton 3-18-06-06 438 438 0.00 Lawnton 3-18-06-07 10 12 20.00 Lawnton 3-18-06-08 317 314 -0.95 Lawnton 3-18-06-09 469 471 0.43 Lawnton 3-18-06-14 200 252 26.00 Lawnton 10 3694 3768 2.00 Petrie 3-18-11-01 582 594 2.06 Petrie 3-18-11-03 481 494 2.70 Petrie 3-18-11-04 194 205 5.67
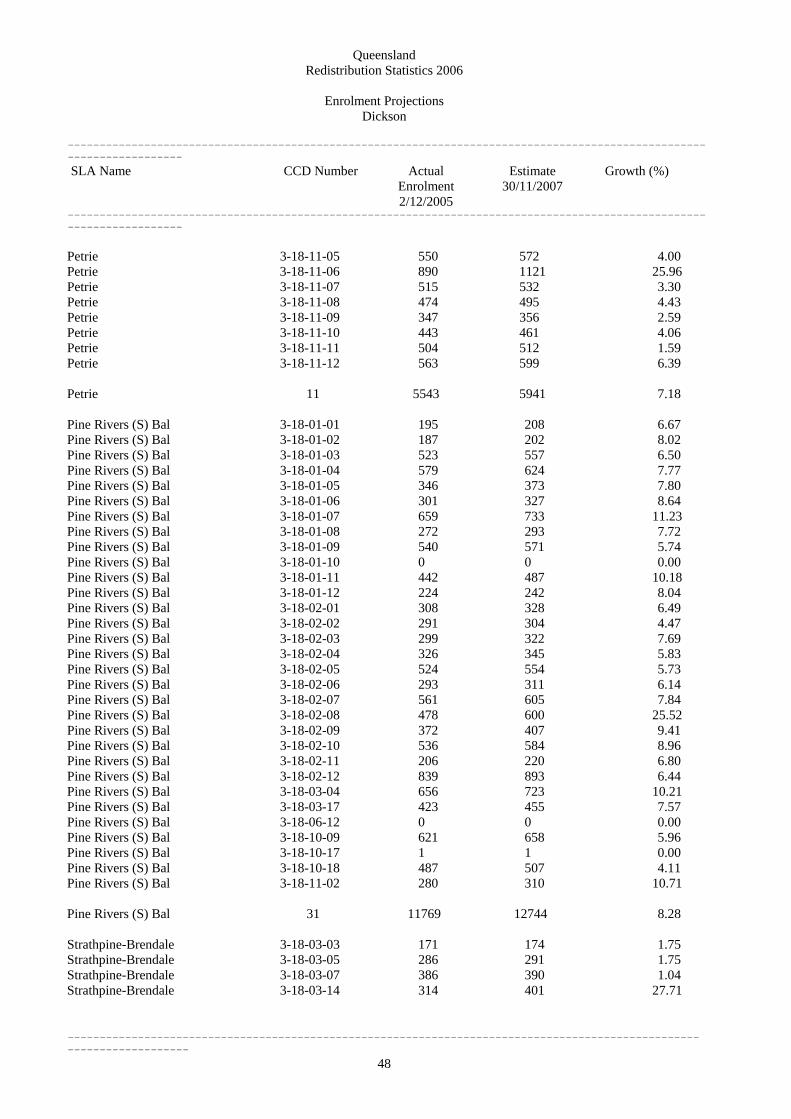
Queensland Redistribution Statistics 2006
Enrolment Projections
----------------------------------------------------------------------------------------------------------------------
48
Dickson
---------------------------------------------------------------------------------------------------------------------- SLA Name CCD Number Actual
Enrolment 2/12/2005
Estimate 30/11/2007
Growth (%)
---------------------------------------------------------------------------------------------------------------------- Petrie 3-18-11-05 550 572 4.00 Petrie 3-18-11-06 890 1121 25.96 Petrie 3-18-11-07 515 532 3.30 Petrie 3-18-11-08 474 495 4.43 Petrie 3-18-11-09 347 356 2.59 Petrie 3-18-11-10 443 461 4.06 Petrie 3-18-11-11 504 512 1.59 Petrie 3-18-11-12 563 599 6.39 Petrie 11 5543 5941 7.18 Pine Rivers (S) Bal 3-18-01-01 195 208 6.67 Pine Rivers (S) Bal 3-18-01-02 187 202 8.02 Pine Rivers (S) Bal 3-18-01-03 523 557 6.50 Pine Rivers (S) Bal 3-18-01-04 579 624 7.77 Pine Rivers (S) Bal 3-18-01-05 346 373 7.80 Pine Rivers (S) Bal 3-18-01-06 301 327 8.64 Pine Rivers (S) Bal 3-18-01-07 659 733 11.23 Pine Rivers (S) Bal 3-18-01-08 272 293 7.72 Pine Rivers (S) Bal 3-18-01-09 540 571 5.74 Pine Rivers (S) Bal 3-18-01-10 0 0 0.00 Pine Rivers (S) Bal 3-18-01-11 442 487 10.18 Pine Rivers (S) Bal 3-18-01-12 224 242 8.04 Pine Rivers (S) Bal 3-18-02-01 308 328 6.49 Pine Rivers (S) Bal 3-18-02-02 291 304 4.47 Pine Rivers (S) Bal 3-18-02-03 299 322 7.69 Pine Rivers (S) Bal 3-18-02-04 326 345 5.83 Pine Rivers (S) Bal 3-18-02-05 524 554 5.73 Pine Rivers (S) Bal 3-18-02-06 293 311 6.14 Pine Rivers (S) Bal 3-18-02-07 561 605 7.84 Pine Rivers (S) Bal 3-18-02-08 478 600 25.52 Pine Rivers (S) Bal 3-18-02-09 372 407 9.41 Pine Rivers (S) Bal 3-18-02-10 536 584 8.96 Pine Rivers (S) Bal 3-18-02-11 206 220 6.80 Pine Rivers (S) Bal 3-18-02-12 839 893 6.44 Pine Rivers (S) Bal 3-18-03-04 656 723 10.21 Pine Rivers (S) Bal 3-18-03-17 423 455 7.57 Pine Rivers (S) Bal 3-18-06-12 0 0 0.00 Pine Rivers (S) Bal 3-18-10-09 621 658 5.96 Pine Rivers (S) Bal 3-18-10-17 1 1 0.00 Pine Rivers (S) Bal 3-18-10-18 487 507 4.11 Pine Rivers (S) Bal 3-18-11-02 280 310 10.71 Pine Rivers (S) Bal 31 11769 12744 8.28 Strathpine-Brendale 3-18-03-03 171 174 1.75 Strathpine-Brendale 3-18-03-05 286 291 1.75 Strathpine-Brendale 3-18-03-07 386 390 1.04 Strathpine-Brendale 3-18-03-14 314 401 27.71

Queensland Redistribution Statistics 2006
Enrolment Projections
----------------------------------------------------------------------------------------------------------------------
49
Dickson
---------------------------------------------------------------------------------------------------------------------- SLA Name CCD Number Actual
Enrolment 2/12/2005
Estimate 30/11/2007
Growth (%)
---------------------------------------------------------------------------------------------------------------------- Strathpine-Brendale 3-18-07-13 517 528 2.13 Strathpine-Brendale 3-18-08-01 559 565 1.07 Strathpine-Brendale 3-18-08-02 756 797 5.42 Strathpine-Brendale 3-18-08-03 450 466 3.56 Strathpine-Brendale 3-18-08-04 278 291 4.68 Strathpine-Brendale 3-18-08-05 292 299 2.40 Strathpine-Brendale 3-18-08-06 338 343 1.48 Strathpine-Brendale 3-18-08-07 364 375 3.02 Strathpine-Brendale 3-18-08-08 272 284 4.41 Strathpine-Brendale 3-18-08-09 346 352 1.73 Strathpine-Brendale 3-18-08-10 191 197 3.14 Strathpine-Brendale 3-18-08-11 378 388 2.65 Strathpine-Brendale 3-18-08-12 509 516 1.38 Strathpine-Brendale 3-18-08-13 309 314 1.62 Strathpine-Brendale 3-18-08-14 215 214 -0.47 Strathpine-Brendale 3-18-08-15 794 806 1.51 Strathpine-Brendale 20 7725 7991 3.44 Dickson 182 84427 89956 6.55

Queensland Redistribution Statistics 2006
Enrolment Projections
----------------------------------------------------------------------------------------------------------------------
50
Fadden
---------------------------------------------------------------------------------------------------------------------- SLA Name CCD Number Actual
Enrolment 2/12/2005
Estimate 30/11/2007
Growth (%)
---------------------------------------------------------------------------------------------------------------------- Arundel 3-16-17-02 274 279 1.82 Arundel 3-16-17-03 625 648 3.68 Arundel 3-16-17-04 649 666 2.62 Arundel 3-16-17-05 313 326 4.15 Arundel 3-16-17-06 398 473 18.84 Arundel 3-16-17-07 215 222 3.26 Arundel 3-16-17-11 623 730 17.17 Arundel 3-16-17-12 302 313 3.64 Arundel 3-16-17-13 388 415 6.96 Arundel 3-16-17-14 242 264 9.09 Arundel 3-16-17-15 295 305 3.39 Arundel 3-16-17-16 421 475 12.83 Arundel 3-16-17-17 556 692 24.46 Arundel 13 5301 5808 9.56 Ashmore 3-16-20-09 4 4 0.00 Ashmore 3-16-20-11 0 0 0.00 Ashmore 2 4 4 0.00 Biggera Waters 3-16-14-01 760 773 1.71 Biggera Waters 3-16-14-02 379 388 2.37 Biggera Waters 3-16-14-03 363 380 4.68 Biggera Waters 3-16-14-04 316 332 5.06 Biggera Waters 3-16-14-05 158 163 3.16 Biggera Waters 3-16-14-06 432 501 15.97 Biggera Waters 3-16-14-07 319 379 18.81 Biggera Waters 3-16-14-08 384 398 3.65 Biggera Waters 3-16-14-09 182 193 6.04 Biggera Waters 3-16-14-10 169 172 1.78 Biggera Waters 10 3462 3679 6.27 Coombabah 3-16-09-01 273 281 2.93 Coombabah 3-16-09-02 186 197 5.91 Coombabah 3-16-09-03 859 872 1.51 Coombabah 3-16-09-04 558 568 1.79 Coombabah 3-16-09-05 372 387 4.03 Coombabah 3-16-09-06 406 412 1.48 Coombabah 3-16-09-07 533 536 0.56 Coombabah 3-16-09-08 316 326 3.16 Coombabah 3-16-09-09 1049 1080 2.96 Coombabah 3-16-09-14 490 500 2.04 Coombabah 3-16-09-15 214 216 0.93 Coombabah 3-16-09-16 410 431 5.12 Coombabah 3-16-09-17 332 343 3.31

Queensland Redistribution Statistics 2006
Enrolment Projections
----------------------------------------------------------------------------------------------------------------------
51
Fadden
---------------------------------------------------------------------------------------------------------------------- SLA Name CCD Number Actual
Enrolment 2/12/2005
Estimate 30/11/2007
Growth (%)
---------------------------------------------------------------------------------------------------------------------- Coombabah 3-16-09-18 0 0 0.00 Coombabah 3-16-09-19 131 167 27.48 Coombabah 15 6129 6316 3.05 Coomera-Cedar Creek 3-16-01-09 492 642 30.49 Coomera-Cedar Creek 3-16-01-12 492 615 25.00 Coomera-Cedar Creek 3-16-02-11 600 661 10.17 Coomera-Cedar Creek 3-16-03-01 14 19 35.71 Coomera-Cedar Creek 3-16-03-04 184 226 22.83 Coomera-Cedar Creek 3-16-03-06 0 0 0.00 Coomera-Cedar Creek 3-16-03-10 123 187 52.03 Coomera-Cedar Creek 3-16-03-13 831 1173 41.16 Coomera-Cedar Creek 3-16-03-21 175 207 18.29 Coomera-Cedar Creek 3-16-03-22 286 336 17.48 Coomera-Cedar Creek 3-16-03-23 506 598 18.18 Coomera-Cedar Creek 11 3703 4664 25.95 Ernest-Molendinar 3-16-07-10 337 348 3.26 Ernest-Molendinar 3-16-07-11 405 414 2.22 Ernest-Molendinar 3-16-07-12 237 304 28.27 Ernest-Molendinar 3-16-07-13 483 650 34.58 Ernest-Molendinar 3-16-07-15 405 491 21.23 Ernest-Molendinar 3-16-07-16 577 591 2.43 Ernest-Molendinar 3-16-07-17 323 403 24.77 Ernest-Molendinar 7 2767 3201 15.68 Gold Coast (C) Bal in BSD 3-16-02-01 338 358 5.92 Gold Coast (C) Bal in BSD 3-16-02-02 51 52 1.96 Gold Coast (C) Bal in BSD 3-16-02-03 0 0 0.00 Gold Coast (C) Bal in BSD 3-16-02-04 626 683 9.11 Gold Coast (C) Bal in BSD 3-16-02-05 814 1026 26.04 Gold Coast (C) Bal in BSD 3-16-02-06 167 175 4.79 Gold Coast (C) Bal in BSD 3-16-02-08 425 449 5.65 Gold Coast (C) Bal in BSD 3-16-02-12 331 361 9.06 Gold Coast (C) Bal in BSD 3-16-02-13 486 573 17.90 Gold Coast (C) Bal in BSD 9 3238 3677 13.56 Guanaba-Currumbin Valley 3-16-01-02 155 165 6.45 Guanaba-Currumbin Valley 3-16-01-04 376 421 11.97 Guanaba-Currumbin Valley 3-16-01-10 326 343 5.21 Guanaba-Currumbin Valley 3-16-04-01 511 605 18.40 Guanaba-Currumbin Valley 3-16-04-02 926 1082 16.85 Guanaba-Currumbin Valley 3-16-04-03 1300 1852 42.46
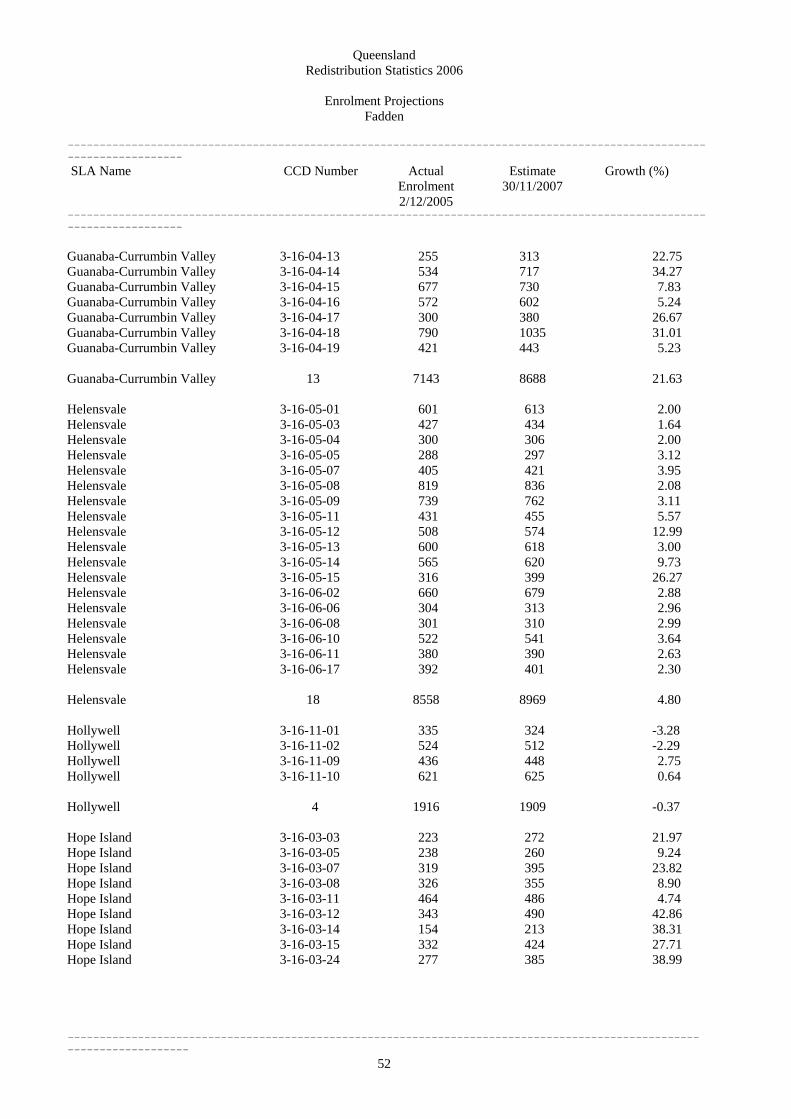
Queensland Redistribution Statistics 2006
Enrolment Projections
----------------------------------------------------------------------------------------------------------------------
52
Fadden
---------------------------------------------------------------------------------------------------------------------- SLA Name CCD Number Actual
Enrolment 2/12/2005
Estimate 30/11/2007
Growth (%)
---------------------------------------------------------------------------------------------------------------------- Guanaba-Currumbin Valley 3-16-04-13 255 313 22.75 Guanaba-Currumbin Valley 3-16-04-14 534 717 34.27 Guanaba-Currumbin Valley 3-16-04-15 677 730 7.83 Guanaba-Currumbin Valley 3-16-04-16 572 602 5.24 Guanaba-Currumbin Valley 3-16-04-17 300 380 26.67 Guanaba-Currumbin Valley 3-16-04-18 790 1035 31.01 Guanaba-Currumbin Valley 3-16-04-19 421 443 5.23 Guanaba-Currumbin Valley 13 7143 8688 21.63 Helensvale 3-16-05-01 601 613 2.00 Helensvale 3-16-05-03 427 434 1.64 Helensvale 3-16-05-04 300 306 2.00 Helensvale 3-16-05-05 288 297 3.12 Helensvale 3-16-05-07 405 421 3.95 Helensvale 3-16-05-08 819 836 2.08 Helensvale 3-16-05-09 739 762 3.11 Helensvale 3-16-05-11 431 455 5.57 Helensvale 3-16-05-12 508 574 12.99 Helensvale 3-16-05-13 600 618 3.00 Helensvale 3-16-05-14 565 620 9.73 Helensvale 3-16-05-15 316 399 26.27 Helensvale 3-16-06-02 660 679 2.88 Helensvale 3-16-06-06 304 313 2.96 Helensvale 3-16-06-08 301 310 2.99 Helensvale 3-16-06-10 522 541 3.64 Helensvale 3-16-06-11 380 390 2.63 Helensvale 3-16-06-17 392 401 2.30 Helensvale 18 8558 8969 4.80 Hollywell 3-16-11-01 335 324 -3.28 Hollywell 3-16-11-02 524 512 -2.29 Hollywell 3-16-11-09 436 448 2.75 Hollywell 3-16-11-10 621 625 0.64 Hollywell 4 1916 1909 -0.37 Hope Island 3-16-03-03 223 272 21.97 Hope Island 3-16-03-05 238 260 9.24 Hope Island 3-16-03-07 319 395 23.82 Hope Island 3-16-03-08 326 355 8.90 Hope Island 3-16-03-11 464 486 4.74 Hope Island 3-16-03-12 343 490 42.86 Hope Island 3-16-03-14 154 213 38.31 Hope Island 3-16-03-15 332 424 27.71 Hope Island 3-16-03-24 277 385 38.99

Queensland Redistribution Statistics 2006
Enrolment Projections
----------------------------------------------------------------------------------------------------------------------
53
Fadden
---------------------------------------------------------------------------------------------------------------------- SLA Name CCD Number Actual
Enrolment 2/12/2005
Estimate 30/11/2007
Growth (%)
---------------------------------------------------------------------------------------------------------------------- Hope Island 3-16-03-25 428 446 4.21 Hope Island 10 3104 3726 20.04 Labrador 3-16-15-01 270 276 2.22 Labrador 3-16-15-02 385 392 1.82 Labrador 3-16-15-03 340 350 2.94 Labrador 3-16-15-04 124 127 2.42 Labrador 3-16-15-05 292 302 3.42 Labrador 3-16-15-06 515 682 32.43 Labrador 3-16-15-07 322 324 0.62 Labrador 3-16-15-08 319 319 0.00 Labrador 3-16-15-09 389 394 1.29 Labrador 3-16-15-10 176 180 2.27 Labrador 3-16-15-11 348 350 0.57 Labrador 3-16-15-12 264 269 1.89 Labrador 3-16-15-13 40 39 -2.50 Labrador 3-16-15-14 193 198 2.59 Labrador 3-16-16-01 359 362 0.84 Labrador 3-16-16-02 246 250 1.63 Labrador 3-16-16-03 146 149 2.05 Labrador 3-16-16-04 415 424 2.17 Labrador 3-16-16-05 176 177 0.57 Labrador 3-16-16-06 323 340 5.26 Labrador 3-16-16-07 382 379 -0.79 Labrador 3-16-16-08 413 423 2.42 Labrador 3-16-16-09 183 192 4.92 Labrador 3-16-16-10 258 262 1.55 Labrador 3-16-16-11 241 241 0.00 Labrador 3-16-16-12 305 362 18.69 Labrador 3-16-16-13 285 297 4.21 Labrador 3-16-17-01 481 486 1.04 Labrador 3-16-17-08 403 404 0.25 Labrador 3-16-17-09 303 304 0.33 Labrador 3-16-17-10 295 302 2.37 Labrador 3-16-17-18 333 331 -0.60 Labrador 32 9524 9887 3.81 Main Beach-Broadwater 3-16-23-01 43 42 -2.33 Main Beach-Broadwater 3-16-23-02 419 566 35.08 Main Beach-Broadwater 2 462 608 31.60 Nerang 3-16-04-05 704 721 2.41 Nerang 3-16-04-06 200 210 5.00 Nerang 3-16-04-09 434 447 3.00
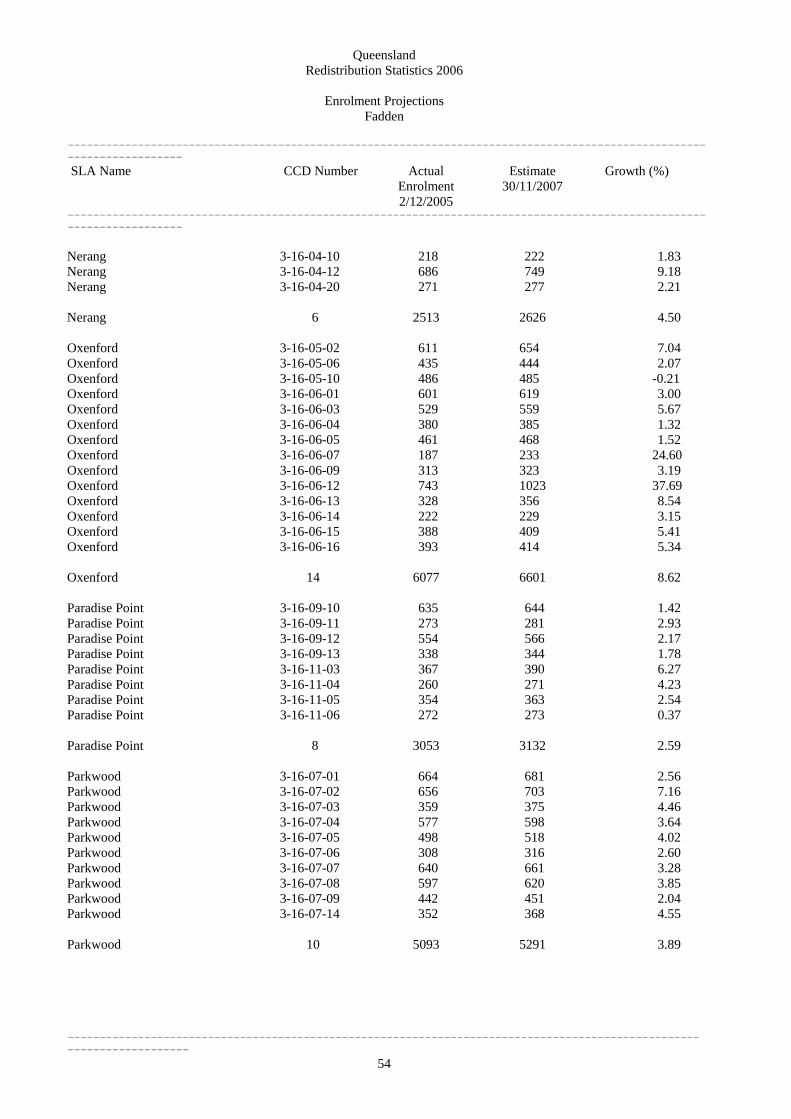
Queensland Redistribution Statistics 2006
Enrolment Projections
----------------------------------------------------------------------------------------------------------------------
54
Fadden
---------------------------------------------------------------------------------------------------------------------- SLA Name CCD Number Actual
Enrolment 2/12/2005
Estimate 30/11/2007
Growth (%)
---------------------------------------------------------------------------------------------------------------------- Nerang 3-16-04-10 218 222 1.83 Nerang 3-16-04-12 686 749 9.18 Nerang 3-16-04-20 271 277 2.21 Nerang 6 2513 2626 4.50 Oxenford 3-16-05-02 611 654 7.04 Oxenford 3-16-05-06 435 444 2.07 Oxenford 3-16-05-10 486 485 -0.21 Oxenford 3-16-06-01 601 619 3.00 Oxenford 3-16-06-03 529 559 5.67 Oxenford 3-16-06-04 380 385 1.32 Oxenford 3-16-06-05 461 468 1.52 Oxenford 3-16-06-07 187 233 24.60 Oxenford 3-16-06-09 313 323 3.19 Oxenford 3-16-06-12 743 1023 37.69 Oxenford 3-16-06-13 328 356 8.54 Oxenford 3-16-06-14 222 229 3.15 Oxenford 3-16-06-15 388 409 5.41 Oxenford 3-16-06-16 393 414 5.34 Oxenford 14 6077 6601 8.62 Paradise Point 3-16-09-10 635 644 1.42 Paradise Point 3-16-09-11 273 281 2.93 Paradise Point 3-16-09-12 554 566 2.17 Paradise Point 3-16-09-13 338 344 1.78 Paradise Point 3-16-11-03 367 390 6.27 Paradise Point 3-16-11-04 260 271 4.23 Paradise Point 3-16-11-05 354 363 2.54 Paradise Point 3-16-11-06 272 273 0.37 Paradise Point 8 3053 3132 2.59 Parkwood 3-16-07-01 664 681 2.56 Parkwood 3-16-07-02 656 703 7.16 Parkwood 3-16-07-03 359 375 4.46 Parkwood 3-16-07-04 577 598 3.64 Parkwood 3-16-07-05 498 518 4.02 Parkwood 3-16-07-06 308 316 2.60 Parkwood 3-16-07-07 640 661 3.28 Parkwood 3-16-07-08 597 620 3.85 Parkwood 3-16-07-09 442 451 2.04 Parkwood 3-16-07-14 352 368 4.55 Parkwood 10 5093 5291 3.89

Queensland Redistribution Statistics 2006
Enrolment Projections
----------------------------------------------------------------------------------------------------------------------
55
Fadden
---------------------------------------------------------------------------------------------------------------------- SLA Name CCD Number Actual
Enrolment 2/12/2005
Estimate 30/11/2007
Growth (%)
---------------------------------------------------------------------------------------------------------------------- Runaway Bay 3-16-11-07 421 429 1.90 Runaway Bay 3-16-11-08 347 356 2.59 Runaway Bay 3-16-11-11 283 285 0.71 Runaway Bay 3-16-13-01 618 630 1.94 Runaway Bay 3-16-13-02 190 188 -1.05 Runaway Bay 3-16-13-03 297 298 0.34 Runaway Bay 3-16-13-04 508 514 1.18 Runaway Bay 3-16-13-05 323 334 3.41 Runaway Bay 3-16-13-06 399 406 1.75 Runaway Bay 3-16-13-07 101 104 2.97 Runaway Bay 3-16-13-08 133 138 3.76 Runaway Bay 3-16-13-09 422 428 1.42 Runaway Bay 3-16-13-10 292 301 3.08 Runaway Bay 3-16-13-11 642 661 2.96 Runaway Bay 3-16-13-12 696 701 0.72 Runaway Bay 3-16-13-13 468 479 2.35 Runaway Bay 16 6140 6252 1.82 Southport 3-16-18-01 195 197 1.03 Southport 3-16-18-02 401 410 2.24 Southport 3-16-18-03 306 320 4.58 Southport 3-16-18-04 482 494 2.49 Southport 3-16-18-05 240 242 0.83 Southport 3-16-18-06 308 333 8.12 Southport 3-16-18-07 328 403 22.87 Southport 3-16-18-08 65 68 4.62 Southport 3-16-18-09 362 456 25.97 Southport 3-16-18-10 291 300 3.09 Southport 3-16-18-11 522 540 3.45 Southport 3-16-18-12 324 339 4.63 Southport 3-16-18-13 183 195 6.56 Southport 3-16-18-14 215 219 1.86 Southport 3-16-19-01 603 611 1.33 Southport 3-16-19-02 345 345 0.00 Southport 3-16-19-03 556 595 7.01 Southport 3-16-19-07 4 4 0.00 Southport 18 5730 6071 5.95 Fadden 218 83917 91109 8.57

Queensland Redistribution Statistics 2006
Enrolment Projections
----------------------------------------------------------------------------------------------------------------------
56
Fairfax
---------------------------------------------------------------------------------------------------------------------- SLA Name CCD Number Actual
Enrolment 2/12/2005
Estimate 30/11/2007
Growth (%)
---------------------------------------------------------------------------------------------------------------------- Maroochy (S) - Buderim 3-11-06-22 5 5 0.00 Maroochy (S) - Buderim 1 5 5 0.00 Maroochy (S) - Coastal North 3-11-08-01 252 259 2.78 Maroochy (S) - Coastal North 3-11-08-02 713 758 6.31 Maroochy (S) - Coastal North 3-11-08-03 607 628 3.46 Maroochy (S) - Coastal North 3-11-08-04 313 456 45.69 Maroochy (S) - Coastal North 3-11-08-05 192 204 6.25 Maroochy (S) - Coastal North 3-11-08-06 373 396 6.17 Maroochy (S) - Coastal North 3-11-08-07 465 506 8.82 Maroochy (S) - Coastal North 3-11-08-08 117 126 7.69 Maroochy (S) - Coastal North 3-11-08-09 367 380 3.54 Maroochy (S) - Coastal North 3-11-08-10 389 436 12.08 Maroochy (S) - Coastal North 3-11-08-11 177 182 2.82 Maroochy (S) - Coastal North 3-11-08-12 282 290 2.84 Maroochy (S) - Coastal North 3-11-08-13 374 383 2.41 Maroochy (S) - Coastal North 3-11-08-14 130 139 6.92 Maroochy (S) - Coastal North 3-11-08-15 158 172 8.86 Maroochy (S) - Coastal North 3-11-08-16 269 310 15.24 Maroochy (S) - Coastal North 3-11-08-17 346 373 7.80 Maroochy (S) - Coastal North 3-11-19-01 298 314 5.37 Maroochy (S) - Coastal North 3-11-19-02 0 0 0.00 Maroochy (S) - Coastal North 3-11-19-03 196 215 9.69 Maroochy (S) - Coastal North 3-11-19-04 108 211 95.37 Maroochy (S) - Coastal North 3-11-19-05 367 385 4.90 Maroochy (S) - Coastal North 3-11-19-06 397 434 9.32 Maroochy (S) - Coastal North 3-11-19-07 424 441 4.01 Maroochy (S) - Coastal North 3-11-19-08 296 309 4.39 Maroochy (S) - Coastal North 3-11-19-09 299 312 4.35 Maroochy (S) - Coastal North 3-11-19-10 25 26 4.00 Maroochy (S) - Coastal North 3-11-19-11 416 443 6.49 Maroochy (S) - Coastal North 3-11-19-12 473 492 4.02 Maroochy (S) - Coastal North 3-11-19-13 439 476 8.43 Maroochy (S) - Coastal North 3-11-19-14 210 224 6.67 Maroochy (S) - Coastal North 3-11-19-15 441 454 2.95 Maroochy (S) - Coastal North 3-11-19-16 331 346 4.53 Maroochy (S) - Coastal North 3-11-19-17 355 414 16.62 Maroochy (S) - Coastal North 3-11-19-18 587 678 15.50 Maroochy (S) - Coastal North 3-11-19-19 315 329 4.44 Maroochy (S) - Coastal North 3-11-19-20 322 413 28.26 Maroochy (S) - Coastal North 3-11-19-21 322 432 34.16 Maroochy (S) - Coastal North 3-11-19-22 301 328 8.97 Maroochy (S) - Coastal North 3-11-19-23 226 234 3.54 Maroochy (S) - Coastal North 3-11-19-24 381 493 29.40 Maroochy (S) - Coastal North 3-11-24-01 63 76 20.63 Maroochy (S) - Coastal North 3-11-24-12 616 877 42.37

Queensland Redistribution Statistics 2006
Enrolment Projections
----------------------------------------------------------------------------------------------------------------------
57
Fairfax
---------------------------------------------------------------------------------------------------------------------- SLA Name CCD Number Actual
Enrolment 2/12/2005
Estimate 30/11/2007
Growth (%)
---------------------------------------------------------------------------------------------------------------------- Maroochy (S) - Coastal North 3-11-24-13 183 192 4.92 Maroochy (S) - Coastal North 44 13915 15546 11.72 Maroochy (S) - Maroochydore 3-11-06-15 226 225 -0.44 Maroochy (S) - Maroochydore 3-11-11-06 610 623 2.13 Maroochy (S) - Maroochydore 3-11-11-11 469 497 5.97 Maroochy (S) - Maroochydore 3-11-20-01 286 312 9.09 Maroochy (S) - Maroochydore 3-11-20-02 463 614 32.61 Maroochy (S) - Maroochydore 3-11-20-03 532 528 -0.75 Maroochy (S) - Maroochydore 3-11-20-04 567 557 -1.76 Maroochy (S) - Maroochydore 3-11-20-05 613 624 1.79 Maroochy (S) - Maroochydore 3-11-20-06 281 276 -1.78 Maroochy (S) - Maroochydore 3-11-20-07 278 277 -0.36 Maroochy (S) - Maroochydore 3-11-20-08 242 239 -1.24 Maroochy (S) - Maroochydore 3-11-20-09 254 262 3.15 Maroochy (S) - Maroochydore 3-11-20-10 238 242 1.68 Maroochy (S) - Maroochydore 3-11-20-11 274 269 -1.82 Maroochy (S) - Maroochydore 3-11-20-12 276 284 2.90 Maroochy (S) - Maroochydore 3-11-20-13 445 443 -0.45 Maroochy (S) - Maroochydore 3-11-20-14 132 136 3.03 Maroochy (S) - Maroochydore 3-11-26-01 0 0 0.00 Maroochy (S) - Maroochydore 3-11-26-09 256 264 3.12 Maroochy (S) - Maroochydore 3-11-26-11 47 49 4.26 Maroochy (S) - Maroochydore 3-11-26-13 453 445 -1.77 Maroochy (S) - Maroochydore 3-11-26-14 777 909 16.99 Maroochy (S) - Maroochydore 3-11-26-16 389 414 6.43 Maroochy (S) - Maroochydore 23 8108 8489 4.70 Maroochy (S) - Nambour 3-11-07-01 621 632 1.77 Maroochy (S) - Nambour 3-11-07-02 560 599 6.96 Maroochy (S) - Nambour 3-11-07-03 626 635 1.44 Maroochy (S) - Nambour 3-11-07-04 555 570 2.70 Maroochy (S) - Nambour 3-11-07-05 592 608 2.70 Maroochy (S) - Nambour 3-11-07-06 342 346 1.17 Maroochy (S) - Nambour 3-11-07-07 590 599 1.53 Maroochy (S) - Nambour 3-11-07-08 244 248 1.64 Maroochy (S) - Nambour 3-11-07-09 405 406 0.25 Maroochy (S) - Nambour 3-11-07-10 522 569 9.00 Maroochy (S) - Nambour 3-11-07-11 122 127 4.10 Maroochy (S) - Nambour 3-11-07-12 154 159 3.25 Maroochy (S) - Nambour 3-11-07-13 669 678 1.35 Maroochy (S) - Nambour 3-11-07-14 430 434 0.93 Maroochy (S) - Nambour 3-11-07-15 312 315 0.96 Maroochy (S) - Nambour 3-11-07-16 186 203 9.14 Maroochy (S) - Nambour 3-11-07-17 409 414 1.22

Queensland Redistribution Statistics 2006
Enrolment Projections
----------------------------------------------------------------------------------------------------------------------
58
Fairfax
---------------------------------------------------------------------------------------------------------------------- SLA Name CCD Number Actual
Enrolment 2/12/2005
Estimate 30/11/2007
Growth (%)
---------------------------------------------------------------------------------------------------------------------- Maroochy (S) - Nambour 3-11-25-07 844 905 7.23 Maroochy (S) - Nambour 18 8183 8447 3.23 Maroochy (S) Bal 3-11-04-01 379 400 5.54 Maroochy (S) Bal 3-11-04-02 106 113 6.60 Maroochy (S) Bal 3-11-04-03 268 296 10.45 Maroochy (S) Bal 3-11-04-04 244 261 6.97 Maroochy (S) Bal 3-11-04-05 708 762 7.63 Maroochy (S) Bal 3-11-04-06 462 498 7.79 Maroochy (S) Bal 3-11-04-07 291 306 5.15 Maroochy (S) Bal 3-11-04-08 297 339 14.14 Maroochy (S) Bal 3-11-04-09 331 349 5.44 Maroochy (S) Bal 3-11-04-10 282 306 8.51 Maroochy (S) Bal 3-11-04-11 349 343 -1.72 Maroochy (S) Bal 3-11-05-01 500 534 6.80 Maroochy (S) Bal 3-11-05-02 177 187 5.65 Maroochy (S) Bal 3-11-05-03 399 412 3.26 Maroochy (S) Bal 3-11-05-04 360 380 5.56 Maroochy (S) Bal 3-11-05-05 305 330 8.20 Maroochy (S) Bal 3-11-05-06 281 319 13.52 Maroochy (S) Bal 3-11-05-07 421 446 5.94 Maroochy (S) Bal 3-11-05-08 34 37 8.82 Maroochy (S) Bal 3-11-05-09 203 220 8.37 Maroochy (S) Bal 3-11-05-10 488 529 8.40 Maroochy (S) Bal 3-11-05-11 337 357 5.93 Maroochy (S) Bal 3-11-05-13 211 227 7.58 Maroochy (S) Bal 3-11-05-14 161 191 18.63 Maroochy (S) Bal 3-11-05-15 234 252 7.69 Maroochy (S) Bal 3-11-05-16 387 418 8.01 Maroochy (S) Bal 3-11-05-17 263 291 10.65 Maroochy (S) Bal 3-11-24-02 582 637 9.45 Maroochy (S) Bal 3-11-24-03 405 477 17.78 Maroochy (S) Bal 3-11-24-04 647 713 10.20 Maroochy (S) Bal 3-11-24-05 446 516 15.70 Maroochy (S) Bal 3-11-24-06 319 347 8.78 Maroochy (S) Bal 3-11-24-07 625 665 6.40 Maroochy (S) Bal 3-11-24-08 29 31 6.90 Maroochy (S) Bal 3-11-24-09 600 649 8.17 Maroochy (S) Bal 3-11-24-10 732 780 6.56 Maroochy (S) Bal 3-11-24-11 572 624 9.09 Maroochy (S) Bal 3-11-24-14 143 170 18.88 Maroochy (S) Bal 3-11-24-15 238 266 11.76 Maroochy (S) Bal 3-11-24-16 309 330 6.80 Maroochy (S) Bal 40 14125 15308 8.38

Queensland Redistribution Statistics 2006
Enrolment Projections
----------------------------------------------------------------------------------------------------------------------
59
Fairfax
---------------------------------------------------------------------------------------------------------------------- SLA Name CCD Number Actual
Enrolment 2/12/2005
Estimate 30/11/2007
Growth (%)
---------------------------------------------------------------------------------------------------------------------- Maroochy (S) Bal in S C'st SSD 3-11-06-01 118 121 2.54 Maroochy (S) Bal in S C'st SSD 3-11-06-02 427 428 0.23 Maroochy (S) Bal in S C'st SSD 3-11-06-03 563 572 1.60 Maroochy (S) Bal in S C'st SSD 3-11-06-05 430 441 2.56 Maroochy (S) Bal in S C'st SSD 3-11-06-06 316 322 1.90 Maroochy (S) Bal in S C'st SSD 3-11-06-07 495 512 3.43 Maroochy (S) Bal in S C'st SSD 3-11-06-08 339 350 3.24 Maroochy (S) Bal in S C'st SSD 3-11-06-09 301 321 6.64 Maroochy (S) Bal in S C'st SSD 3-11-06-10 495 506 2.22 Maroochy (S) Bal in S C'st SSD 3-11-06-11 178 181 1.69 Maroochy (S) Bal in S C'st SSD 3-11-06-13 378 400 5.82 Maroochy (S) Bal in S C'st SSD 3-11-06-14 350 361 3.14 Maroochy (S) Bal in S C'st SSD 3-11-06-16 264 269 1.89 Maroochy (S) Bal in S C'st SSD 3-11-06-18 307 312 1.63 Maroochy (S) Bal in S C'st SSD 3-11-06-19 93 97 4.30 Maroochy (S) Bal in S C'st SSD 3-11-06-20 415 434 4.58 Maroochy (S) Bal in S C'st SSD 3-11-06-21 280 340 21.43 Maroochy (S) Bal in S C'st SSD 3-11-25-02 436 460 5.50 Maroochy (S) Bal in S C'st SSD 3-11-25-03 551 593 7.62 Maroochy (S) Bal in S C'st SSD 3-11-25-08 252 260 3.17 Maroochy (S) Bal in S C'st SSD 3-11-25-09 538 548 1.86 Maroochy (S) Bal in S C'st SSD 3-11-25-10 432 445 3.01 Maroochy (S) Bal in S C'st SSD 3-11-25-11 545 564 3.49 Maroochy (S) Bal in S C'st SSD 3-11-25-14 347 378 8.93 Maroochy (S) Bal in S C'st SSD 3-11-25-16 512 522 1.95 Maroochy (S) Bal in S C'st SSD 25 9362 9737 4.01 Noosa (S) - Noosa-Noosaville 3-11-21-01 127 134 5.51 Noosa (S) - Noosa-Noosaville 3-11-21-02 77 81 5.19 Noosa (S) - Noosa-Noosaville 3-11-21-03 96 102 6.25 Noosa (S) - Noosa-Noosaville 3-11-21-04 303 308 1.65 Noosa (S) - Noosa-Noosaville 3-11-21-05 336 359 6.85 Noosa (S) - Noosa-Noosaville 3-11-21-06 225 230 2.22 Noosa (S) - Noosa-Noosaville 3-11-21-07 136 140 2.94 Noosa (S) - Noosa-Noosaville 3-11-21-08 159 172 8.18 Noosa (S) - Noosa-Noosaville 3-11-21-09 97 100 3.09 Noosa (S) - Noosa-Noosaville 3-11-21-10 21 21 0.00 Noosa (S) - Noosa-Noosaville 3-11-21-11 119 118 -0.84 Noosa (S) - Noosa-Noosaville 3-11-21-12 136 137 0.74 Noosa (S) - Noosa-Noosaville 3-11-21-13 67 68 1.49 Noosa (S) - Noosa-Noosaville 3-11-21-14 96 101 5.21 Noosa (S) - Noosa-Noosaville 3-11-21-15 214 229 7.01 Noosa (S) - Noosa-Noosaville 3-11-21-16 658 706 7.29 Noosa (S) - Noosa-Noosaville 3-11-21-17 235 237 0.85 Noosa (S) - Noosa-Noosaville 3-11-21-18 104 105 0.96 Noosa (S) - Noosa-Noosaville 3-11-21-19 494 512 3.64

Queensland Redistribution Statistics 2006
Enrolment Projections
----------------------------------------------------------------------------------------------------------------------
60
Fairfax
---------------------------------------------------------------------------------------------------------------------- SLA Name CCD Number Actual
Enrolment 2/12/2005
Estimate 30/11/2007
Growth (%)
---------------------------------------------------------------------------------------------------------------------- Noosa (S) - Noosa-Noosaville 3-11-21-20 305 313 2.62 Noosa (S) - Noosa-Noosaville 3-11-21-21 350 391 11.71 Noosa (S) - Noosa-Noosaville 3-11-23-01 16 16 0.00 Noosa (S) - Noosa-Noosaville 3-11-23-02 106 109 2.83 Noosa (S) - Noosa-Noosaville 3-11-23-03 150 152 1.33 Noosa (S) - Noosa-Noosaville 3-11-23-06 345 365 5.80 Noosa (S) - Noosa-Noosaville 3-11-23-07 557 564 1.26 Noosa (S) - Noosa-Noosaville 3-11-23-09 214 219 2.34 Noosa (S) - Noosa-Noosaville 3-11-23-10 410 415 1.22 Noosa (S) - Noosa-Noosaville 3-11-23-12 28 29 3.57 Noosa (S) - Noosa-Noosaville 3-11-23-13 220 223 1.36 Noosa (S) - Noosa-Noosaville 30 6401 6656 3.98 Noosa (S) - Sunshine-Peregian 3-11-03-01 473 483 2.11 Noosa (S) - Sunshine-Peregian 3-11-03-02 124 129 4.03 Noosa (S) - Sunshine-Peregian 3-11-03-03 352 356 1.14 Noosa (S) - Sunshine-Peregian 3-11-03-04 437 444 1.60 Noosa (S) - Sunshine-Peregian 3-11-03-05 200 210 5.00 Noosa (S) - Sunshine-Peregian 3-11-03-06 97 97 0.00 Noosa (S) - Sunshine-Peregian 3-11-03-07 364 360 -1.10 Noosa (S) - Sunshine-Peregian 3-11-03-08 424 435 2.59 Noosa (S) - Sunshine-Peregian 3-11-03-09 293 297 1.37 Noosa (S) - Sunshine-Peregian 3-11-03-10 569 575 1.05 Noosa (S) - Sunshine-Peregian 3-11-03-11 0 0 0.00 Noosa (S) - Sunshine-Peregian 3-11-03-12 333 340 2.10 Noosa (S) - Sunshine-Peregian 3-11-03-13 13 14 7.69 Noosa (S) - Sunshine-Peregian 3-11-03-14 155 155 0.00 Noosa (S) - Sunshine-Peregian 3-11-03-15 96 97 1.04 Noosa (S) - Sunshine-Peregian 3-11-03-16 144 145 0.69 Noosa (S) - Sunshine-Peregian 3-11-03-17 414 417 0.72 Noosa (S) - Sunshine-Peregian 3-11-03-18 176 181 2.84 Noosa (S) - Sunshine-Peregian 3-11-03-19 299 304 1.67 Noosa (S) - Sunshine-Peregian 3-11-23-04 284 282 -0.70 Noosa (S) - Sunshine-Peregian 3-11-23-05 321 324 0.93 Noosa (S) - Sunshine-Peregian 3-11-23-08 238 244 2.52 Noosa (S) - Sunshine-Peregian 3-11-23-11 212 219 3.30 Noosa (S) - Sunshine-Peregian 3-11-23-14 77 78 1.30 Noosa (S) - Sunshine-Peregian 24 6095 6186 1.49 Noosa (S) - Tewantin 3-11-02-01 231 242 4.76 Noosa (S) - Tewantin 3-11-02-02 524 561 7.06 Noosa (S) - Tewantin 3-11-02-03 514 534 3.89 Noosa (S) - Tewantin 3-11-02-04 307 322 4.89 Noosa (S) - Tewantin 3-11-02-05 236 245 3.81 Noosa (S) - Tewantin 3-11-02-06 570 610 7.02

Queensland Redistribution Statistics 2006
Enrolment Projections
----------------------------------------------------------------------------------------------------------------------
61
Fairfax
---------------------------------------------------------------------------------------------------------------------- SLA Name CCD Number Actual
Enrolment 2/12/2005
Estimate 30/11/2007
Growth (%)
---------------------------------------------------------------------------------------------------------------------- Noosa (S) - Tewantin 3-11-02-07 473 487 2.96 Noosa (S) - Tewantin 3-11-02-08 404 416 2.97 Noosa (S) - Tewantin 3-11-02-09 401 409 2.00 Noosa (S) - Tewantin 3-11-02-10 303 312 2.97 Noosa (S) - Tewantin 3-11-02-11 395 422 6.84 Noosa (S) - Tewantin 3-11-02-12 490 497 1.43 Noosa (S) - Tewantin 3-11-02-13 703 726 3.27 Noosa (S) - Tewantin 3-11-02-14 360 374 3.89 Noosa (S) - Tewantin 3-11-02-15 431 442 2.55 Noosa (S) - Tewantin 3-11-02-16 567 581 2.47 Noosa (S) - Tewantin 3-11-02-17 187 194 3.74 Noosa (S) - Tewantin 3-11-02-18 340 365 7.35 Noosa (S) - Tewantin 18 7436 7739 4.07 Noosa (S) Bal 3-11-01-01 114 121 6.14 Noosa (S) Bal 3-11-01-02 556 595 7.01 Noosa (S) Bal 3-11-01-03 291 305 4.81 Noosa (S) Bal 3-11-01-04 690 760 10.14 Noosa (S) Bal 3-11-01-05 418 481 15.07 Noosa (S) Bal 3-11-01-06 168 174 3.57 Noosa (S) Bal 3-11-01-07 398 425 6.78 Noosa (S) Bal 3-11-01-08 297 309 4.04 Noosa (S) Bal 3-11-01-09 192 205 6.77 Noosa (S) Bal 3-11-01-10 395 421 6.58 Noosa (S) Bal 3-11-01-11 93 97 4.30 Noosa (S) Bal 3-11-01-12 175 193 10.29 Noosa (S) Bal 3-11-01-13 147 155 5.44 Noosa (S) Bal 3-11-01-14 111 151 36.04 Noosa (S) Bal 3-11-01-15 52 55 5.77 Noosa (S) Bal 3-11-01-16 192 198 3.12 Noosa (S) Bal 3-11-22-01 234 243 3.85 Noosa (S) Bal 3-11-22-02 423 432 2.13 Noosa (S) Bal 3-11-22-03 392 441 12.50 Noosa (S) Bal 3-11-22-04 709 739 4.23 Noosa (S) Bal 3-11-22-05 416 439 5.53 Noosa (S) Bal 3-11-22-06 456 491 7.68 Noosa (S) Bal 3-11-22-07 640 697 8.91 Noosa (S) Bal 3-11-22-08 551 603 9.44 Noosa (S) Bal 3-11-22-09 340 358 5.29 Noosa (S) Bal 3-11-22-10 424 464 9.43 Noosa (S) Bal 3-11-22-11 347 352 1.44 Noosa (S) Bal 3-11-22-12 391 410 4.86 Noosa (S) Bal 3-11-22-13 383 392 2.35 Noosa (S) Bal 3-11-22-14 383 439 14.62 Noosa (S) Bal 3-11-22-15 132 135 2.27 Noosa (S) Bal 3-11-22-16 198 204 3.03

Queensland Redistribution Statistics 2006
Enrolment Projections
----------------------------------------------------------------------------------------------------------------------
62
Fairfax
---------------------------------------------------------------------------------------------------------------------- SLA Name CCD Number Actual
Enrolment 2/12/2005
Estimate 30/11/2007
Growth (%)
---------------------------------------------------------------------------------------------------------------------- Noosa (S) Bal 32 10708 11484 7.25 Fairfax 255 84338 89597 6.24

Queensland Redistribution Statistics 2006
Enrolment Projections
----------------------------------------------------------------------------------------------------------------------
63
Fisher
---------------------------------------------------------------------------------------------------------------------- SLA Name CCD Number Actual
Enrolment 2/12/2005
Estimate 30/11/2007
Growth (%)
---------------------------------------------------------------------------------------------------------------------- Caloundra (C) - Caloundra N. 3-11-13-15 192 400 108.33 Caloundra (C) - Caloundra N. 3-11-13-22 797 1600 100.75 Caloundra (C) - Caloundra N. 3-11-13-23 660 900 36.36 Caloundra (C) - Caloundra N. 3-11-13-24 567 680 19.93 Caloundra (C) - Caloundra N. 3-11-15-01 389 401 3.08 Caloundra (C) - Caloundra N. 3-11-15-02 403 423 4.96 Caloundra (C) - Caloundra N. 3-11-15-03 476 490 2.94 Caloundra (C) - Caloundra N. 3-11-15-04 406 414 1.97 Caloundra (C) - Caloundra N. 3-11-15-05 255 261 2.35 Caloundra (C) - Caloundra N. 3-11-15-06 224 260 16.07 Caloundra (C) - Caloundra N. 3-11-15-07 527 550 4.36 Caloundra (C) - Caloundra N. 3-11-15-08 547 560 2.38 Caloundra (C) - Caloundra N. 3-11-15-09 202 210 3.96 Caloundra (C) - Caloundra N. 3-11-15-10 410 415 1.22 Caloundra (C) - Caloundra N. 3-11-15-11 332 338 1.81 Caloundra (C) - Caloundra N. 3-11-15-12 197 209 6.09 Caloundra (C) - Caloundra N. 3-11-15-13 366 367 0.27 Caloundra (C) - Caloundra N. 3-11-15-14 727 750 3.16 Caloundra (C) - Caloundra N. 3-11-15-15 491 502 2.24 Caloundra (C) - Caloundra N. 3-11-15-16 327 335 2.45 Caloundra (C) - Caloundra N. 3-11-16-01 342 345 0.88 Caloundra (C) - Caloundra N. 3-11-16-03 161 166 3.11 Caloundra (C) - Caloundra N. 3-11-16-04 260 300 15.38 Caloundra (C) - Caloundra N. 3-11-16-05 322 335 4.04 Caloundra (C) - Caloundra N. 3-11-16-06 345 360 4.35 Caloundra (C) - Caloundra N. 3-11-16-07 258 266 3.10 Caloundra (C) - Caloundra N. 3-11-16-08 320 333 4.06 Caloundra (C) - Caloundra N. 3-11-16-09 524 533 1.72 Caloundra (C) - Caloundra N. 3-11-16-11 416 424 1.92 Caloundra (C) - Caloundra N. 3-11-16-12 240 255 6.25 Caloundra (C) - Caloundra N. 3-11-16-13 155 180 16.13 Caloundra (C) - Caloundra N. 3-11-16-14 666 675 1.35 Caloundra (C) - Caloundra N. 3-11-16-16 276 360 30.43 Caloundra (C) - Caloundra N. 3-11-16-17 247 260 5.26 Caloundra (C) - Caloundra N. 3-11-16-18 311 384 23.47 Caloundra (C) - Caloundra N. 3-11-16-19 343 474 38.19 Caloundra (C) - Caloundra N. 36 13681 15715 14.87 Caloundra (C) - Caloundra S. 3-11-13-01 651 691 6.14 Caloundra (C) - Caloundra S. 3-11-13-03 638 650 1.88 Caloundra (C) - Caloundra S. 3-11-13-04 533 543 1.88 Caloundra (C) - Caloundra S. 3-11-13-05 274 280 2.19 Caloundra (C) - Caloundra S. 3-11-13-06 405 416 2.72 Caloundra (C) - Caloundra S. 3-11-13-07 245 272 11.02 Caloundra (C) - Caloundra S. 3-11-13-08 439 451 2.73 Caloundra (C) - Caloundra S. 3-11-13-09 478 486 1.67

Queensland Redistribution Statistics 2006
Enrolment Projections
----------------------------------------------------------------------------------------------------------------------
64
Fisher
---------------------------------------------------------------------------------------------------------------------- SLA Name CCD Number Actual
Enrolment 2/12/2005
Estimate 30/11/2007
Growth (%)
---------------------------------------------------------------------------------------------------------------------- Caloundra (C) - Caloundra S. 3-11-13-10 470 476 1.28 Caloundra (C) - Caloundra S. 3-11-13-11 361 368 1.94 Caloundra (C) - Caloundra S. 3-11-13-12 288 292 1.39 Caloundra (C) - Caloundra S. 3-11-13-13 553 574 3.80 Caloundra (C) - Caloundra S. 3-11-13-14 31 35 12.90 Caloundra (C) - Caloundra S. 3-11-13-16 576 666 15.62 Caloundra (C) - Caloundra S. 3-11-13-20 332 349 5.12 Caloundra (C) - Caloundra S. 3-11-13-21 179 203 13.41 Caloundra (C) - Caloundra S. 3-11-13-25 427 750 75.64 Caloundra (C) - Caloundra S. 3-11-13-26 182 192 5.49 Caloundra (C) - Caloundra S. 3-11-13-27 333 364 9.31 Caloundra (C) - Caloundra S. 3-11-13-28 526 730 38.78 Caloundra (C) - Caloundra S. 3-11-13-29 692 1200 73.41 Caloundra (C) - Caloundra S. 3-11-16-02 479 494 3.13 Caloundra (C) - Caloundra S. 3-11-16-10 189 195 3.17 Caloundra (C) - Caloundra S. 3-11-16-15 525 571 8.76 Caloundra (C) - Caloundra S. 3-11-16-20 968 1060 9.50 Caloundra (C) - Caloundra S. 3-11-18-01 175 220 25.71 Caloundra (C) - Caloundra S. 3-11-18-02 238 300 26.05 Caloundra (C) - Caloundra S. 3-11-18-03 288 296 2.78 Caloundra (C) - Caloundra S. 3-11-18-04 283 308 8.83 Caloundra (C) - Caloundra S. 3-11-18-05 288 295 2.43 Caloundra (C) - Caloundra S. 3-11-18-06 377 440 16.71 Caloundra (C) - Caloundra S. 3-11-18-07 70 77 10.00 Caloundra (C) - Caloundra S. 3-11-18-08 293 294 0.34 Caloundra (C) - Caloundra S. 3-11-18-09 203 207 1.97 Caloundra (C) - Caloundra S. 3-11-18-10 127 128 0.79 Caloundra (C) - Caloundra S. 3-11-18-11 199 202 1.51 Caloundra (C) - Caloundra S. 3-11-18-12 65 67 3.08 Caloundra (C) - Caloundra S. 3-11-18-13 35 36 2.86 Caloundra (C) - Caloundra S. 3-11-18-14 188 192 2.13 Caloundra (C) - Caloundra S. 39 13603 15370 12.99 Caloundra (C) - Hinterland 3-12-02-01 240 244 1.67 Caloundra (C) - Hinterland 3-12-02-02 285 300 5.26 Caloundra (C) - Hinterland 3-12-02-03 438 464 5.94 Caloundra (C) - Hinterland 3-12-02-04 362 382 5.52 Caloundra (C) - Hinterland 3-12-02-05 439 482 9.79 Caloundra (C) - Hinterland 3-12-02-06 206 215 4.37 Caloundra (C) - Hinterland 3-12-02-07 352 367 4.26 Caloundra (C) - Hinterland 3-12-02-08 564 593 5.14 Caloundra (C) - Hinterland 3-12-02-09 340 354 4.12 Caloundra (C) - Hinterland 3-12-02-10 376 387 2.93 Caloundra (C) - Hinterland 3-12-02-11 254 264 3.94 Caloundra (C) - Hinterland 3-12-02-12 274 284 3.65 Caloundra (C) - Hinterland 3-12-02-13 363 378 4.13

Queensland Redistribution Statistics 2006
Enrolment Projections
----------------------------------------------------------------------------------------------------------------------
65
Fisher
---------------------------------------------------------------------------------------------------------------------- SLA Name CCD Number Actual
Enrolment 2/12/2005
Estimate 30/11/2007
Growth (%)
---------------------------------------------------------------------------------------------------------------------- Caloundra (C) - Hinterland 3-12-20-06 436 453 3.90 Caloundra (C) - Hinterland 14 4929 5167 4.83 Caloundra (C) - Kawana 3-11-13-02 253 450 77.87 Caloundra (C) - Kawana 3-11-13-17 0 0 0.00 Caloundra (C) - Kawana 3-11-13-18 1262 1961 55.39 Caloundra (C) - Kawana 3-11-13-19 121 200 65.29 Caloundra (C) - Kawana 3-11-14-01 372 368 -1.08 Caloundra (C) - Kawana 3-11-14-02 377 383 1.59 Caloundra (C) - Kawana 3-11-14-03 353 351 -0.57 Caloundra (C) - Kawana 3-11-14-04 440 445 1.14 Caloundra (C) - Kawana 3-11-14-05 539 533 -1.11 Caloundra (C) - Kawana 3-11-14-06 466 473 1.50 Caloundra (C) - Kawana 3-11-14-07 399 395 -1.00 Caloundra (C) - Kawana 3-11-14-08 650 655 0.77 Caloundra (C) - Kawana 3-11-14-09 426 428 0.47 Caloundra (C) - Kawana 3-11-14-10 312 315 0.96 Caloundra (C) - Kawana 3-11-14-11 502 508 1.20 Caloundra (C) - Kawana 3-11-14-12 512 519 1.37 Caloundra (C) - Kawana 3-11-14-13 417 414 -0.72 Caloundra (C) - Kawana 3-11-14-14 138 147 6.52 Caloundra (C) - Kawana 3-11-14-15 444 466 4.95 Caloundra (C) - Kawana 3-11-17-01 508 523 2.95 Caloundra (C) - Kawana 3-11-17-02 423 426 0.71 Caloundra (C) - Kawana 3-11-17-03 251 254 1.20 Caloundra (C) - Kawana 3-11-17-04 462 464 0.43 Caloundra (C) - Kawana 3-11-17-05 445 451 1.35 Caloundra (C) - Kawana 3-11-17-06 516 516 0.00 Caloundra (C) - Kawana 3-11-17-07 305 315 3.28 Caloundra (C) - Kawana 3-11-17-08 358 390 8.94 Caloundra (C) - Kawana 3-11-17-09 445 452 1.57 Caloundra (C) - Kawana 3-11-17-10 296 289 -2.36 Caloundra (C) - Kawana 3-11-17-11 357 363 1.68 Caloundra (C) - Kawana 3-11-17-12 206 209 1.46 Caloundra (C) - Kawana 3-11-17-13 530 529 -0.19 Caloundra (C) - Kawana 3-11-17-14 229 231 0.87 Caloundra (C) - Kawana 3-11-17-15 323 321 -0.62 Caloundra (C) - Kawana 34 13637 14744 8.12 Caloundra (C) - Rail Corridor 3-12-03-01 246 272 10.57 Caloundra (C) - Rail Corridor 3-12-03-02 605 644 6.45 Caloundra (C) - Rail Corridor 3-12-03-03 236 244 3.39 Caloundra (C) - Rail Corridor 3-12-03-09 727 765 5.23 Caloundra (C) - Rail Corridor 3-12-03-10 513 553 7.80 Caloundra (C) - Rail Corridor 3-12-03-11 555 599 7.93

Queensland Redistribution Statistics 2006
Enrolment Projections
----------------------------------------------------------------------------------------------------------------------
66
Fisher
---------------------------------------------------------------------------------------------------------------------- SLA Name CCD Number Actual
Enrolment 2/12/2005
Estimate 30/11/2007
Growth (%)
---------------------------------------------------------------------------------------------------------------------- Caloundra (C) - Rail Corridor 6 2882 3077 6.77 Maroochy (S) - Buderim 3-11-06-12 698 757 8.45 Maroochy (S) - Buderim 3-11-06-17 593 637 7.42 Maroochy (S) - Buderim 3-11-06-22 20 21 5.00 Maroochy (S) - Buderim 3-11-09-01 0 0 0.00 Maroochy (S) - Buderim 3-11-09-02 976 1200 22.95 Maroochy (S) - Buderim 3-11-09-03 697 727 4.30 Maroochy (S) - Buderim 3-11-09-04 198 300 51.52 Maroochy (S) - Buderim 3-11-09-05 561 601 7.13 Maroochy (S) - Buderim 3-11-09-06 284 338 19.01 Maroochy (S) - Buderim 3-11-09-07 303 316 4.29 Maroochy (S) - Buderim 3-11-09-08 583 900 54.37 Maroochy (S) - Buderim 3-11-09-09 378 402 6.35 Maroochy (S) - Buderim 3-11-09-10 377 420 11.41 Maroochy (S) - Buderim 3-11-09-11 296 357 20.61 Maroochy (S) - Buderim 3-11-09-12 361 378 4.71 Maroochy (S) - Buderim 3-11-09-13 543 569 4.79 Maroochy (S) - Buderim 3-11-09-14 382 393 2.88 Maroochy (S) - Buderim 3-11-09-15 276 286 3.62 Maroochy (S) - Buderim 3-11-09-16 477 502 5.24 Maroochy (S) - Buderim 3-11-09-17 0 0 0.00 Maroochy (S) - Buderim 3-11-09-18 499 544 9.02 Maroochy (S) - Buderim 3-11-09-19 330 400 21.21 Maroochy (S) - Buderim 3-11-09-20 971 1300 33.88 Maroochy (S) - Buderim 3-11-09-21 506 715 41.30 Maroochy (S) - Buderim 3-11-09-22 1416 1600 12.99 Maroochy (S) - Buderim 3-11-09-23 722 761 5.40 Maroochy (S) - Buderim 3-11-11-01 267 276 3.37 Maroochy (S) - Buderim 3-11-11-02 724 798 10.22 Maroochy (S) - Buderim 3-11-11-03 432 441 2.08 Maroochy (S) - Buderim 3-11-11-04 538 566 5.20 Maroochy (S) - Buderim 3-11-11-05 525 573 9.14 Maroochy (S) - Buderim 3-11-11-07 326 341 4.60 Maroochy (S) - Buderim 3-11-11-08 331 346 4.53 Maroochy (S) - Buderim 3-11-11-09 356 377 5.90 Maroochy (S) - Buderim 3-11-11-10 536 551 2.80 Maroochy (S) - Buderim 3-11-11-12 475 482 1.47 Maroochy (S) - Buderim 3-11-27-01 656 714 8.84 Maroochy (S) - Buderim 3-11-27-02 295 308 4.41 Maroochy (S) - Buderim 3-11-27-03 349 371 6.30 Maroochy (S) - Buderim 3-11-27-04 317 333 5.05 Maroochy (S) - Buderim 3-11-27-05 524 537 2.48 Maroochy (S) - Buderim 3-11-27-06 239 252 5.44 Maroochy (S) - Buderim 3-11-27-07 709 771 8.74 Maroochy (S) - Buderim 3-11-27-08 625 651 4.16

Queensland Redistribution Statistics 2006
Enrolment Projections
----------------------------------------------------------------------------------------------------------------------
67
Fisher
---------------------------------------------------------------------------------------------------------------------- SLA Name CCD Number Actual
Enrolment 2/12/2005
Estimate 30/11/2007
Growth (%)
---------------------------------------------------------------------------------------------------------------------- Maroochy (S) - Buderim 3-11-27-09 519 629 21.19 Maroochy (S) - Buderim 3-11-27-10 495 535 8.08 Maroochy (S) - Buderim 3-11-27-11 759 801 5.53 Maroochy (S) - Buderim 3-11-27-12 262 269 2.67 Maroochy (S) - Buderim 3-11-27-13 479 515 7.52 Maroochy (S) - Buderim 3-11-27-14 590 613 3.90 Maroochy (S) - Buderim 3-11-27-15 433 463 6.93 Maroochy (S) - Buderim 3-11-27-16 222 235 5.86 Maroochy (S) - Buderim 3-11-27-17 359 427 18.94 Maroochy (S) - Buderim 3-11-27-18 552 699 26.63 Maroochy (S) - Buderim 54 25341 28298 11.67 Maroochy (S) - Maroochydore 3-11-26-01 227 223 -1.76 Maroochy (S) - Maroochydore 3-11-26-02 441 472 7.03 Maroochy (S) - Maroochydore 3-11-26-03 248 250 0.81 Maroochy (S) - Maroochydore 3-11-26-04 43 46 6.98 Maroochy (S) - Maroochydore 3-11-26-05 225 224 -0.44 Maroochy (S) - Maroochydore 3-11-26-06 189 200 5.82 Maroochy (S) - Maroochydore 3-11-26-07 254 261 2.76 Maroochy (S) - Maroochydore 3-11-26-08 307 368 19.87 Maroochy (S) - Maroochydore 3-11-26-09 0 0 0.00 Maroochy (S) - Maroochydore 3-11-26-10 397 420 5.79 Maroochy (S) - Maroochydore 3-11-26-11 0 0 0.00 Maroochy (S) - Maroochydore 3-11-26-12 249 249 0.00 Maroochy (S) - Maroochydore 3-11-26-15 186 245 31.72 Maroochy (S) - Maroochydore 3-11-26-17 184 182 -1.09 Maroochy (S) - Maroochydore 14 2950 3140 6.44 Maroochy (S) - Mooloolaba 3-11-10-01 467 475 1.71 Maroochy (S) - Mooloolaba 3-11-10-02 275 280 1.82 Maroochy (S) - Mooloolaba 3-11-10-03 609 623 2.30 Maroochy (S) - Mooloolaba 3-11-10-04 256 259 1.17 Maroochy (S) - Mooloolaba 3-11-10-05 384 450 17.19 Maroochy (S) - Mooloolaba 3-11-10-06 376 385 2.39 Maroochy (S) - Mooloolaba 3-11-10-07 184 189 2.72 Maroochy (S) - Mooloolaba 3-11-10-08 238 245 2.94 Maroochy (S) - Mooloolaba 3-11-10-09 205 227 10.73 Maroochy (S) - Mooloolaba 3-11-10-10 443 452 2.03 Maroochy (S) - Mooloolaba 3-11-10-11 228 234 2.63 Maroochy (S) - Mooloolaba 3-11-12-01 155 157 1.29 Maroochy (S) - Mooloolaba 3-11-12-02 390 393 0.77 Maroochy (S) - Mooloolaba 3-11-12-03 251 257 2.39 Maroochy (S) - Mooloolaba 3-11-12-04 374 490 31.02 Maroochy (S) - Mooloolaba 3-11-12-05 430 438 1.86 Maroochy (S) - Mooloolaba 3-11-12-06 360 372 3.33

Queensland Redistribution Statistics 2006
Enrolment Projections
----------------------------------------------------------------------------------------------------------------------
68
Fisher
---------------------------------------------------------------------------------------------------------------------- SLA Name CCD Number Actual
Enrolment 2/12/2005
Estimate 30/11/2007
Growth (%)
---------------------------------------------------------------------------------------------------------------------- Maroochy (S) - Mooloolaba 3-11-12-07 145 156 7.59 Maroochy (S) - Mooloolaba 3-11-12-08 341 347 1.76 Maroochy (S) - Mooloolaba 3-11-12-09 152 162 6.58 Maroochy (S) - Mooloolaba 3-11-12-10 215 231 7.44 Maroochy (S) - Mooloolaba 3-11-12-11 292 298 2.05 Maroochy (S) - Mooloolaba 3-11-12-12 91 96 5.49 Maroochy (S) - Mooloolaba 23 6861 7216 5.17 Maroochy (S) Bal 3-11-05-12 233 251 7.73 Maroochy (S) Bal 3-11-25-01 303 320 5.61 Maroochy (S) Bal 3-11-25-04 408 434 6.37 Maroochy (S) Bal 3-11-25-05 753 911 20.98 Maroochy (S) Bal 3-11-25-06 479 506 5.64 Maroochy (S) Bal 3-11-25-12 431 462 7.19 Maroochy (S) Bal 3-11-25-13 123 126 2.44 Maroochy (S) Bal 3-11-25-15 103 110 6.80 Maroochy (S) Bal 8 2833 3120 10.13 Maroochy (S) Bal in S C'st SSD 3-11-06-04 416 420 0.96 Maroochy (S) Bal in S C'st SSD 1 416 420 0.96 Fisher 229 87133 96267 10.48

Queensland Redistribution Statistics 2006
Enrolment Projections
----------------------------------------------------------------------------------------------------------------------
69
Forde
---------------------------------------------------------------------------------------------------------------------- SLA Name CCD Number Actual
Enrolment 2/12/2005
Estimate 30/11/2007
Growth (%)
---------------------------------------------------------------------------------------------------------------------- Beaudesert (S) - Pt A 3-15-13-03 689 746 8.27 Beaudesert (S) - Pt A 3-15-13-04 335 366 9.25 Beaudesert (S) - Pt A 3-15-13-05 317 330 4.10 Beaudesert (S) - Pt A 3-15-13-06 798 852 6.77 Beaudesert (S) - Pt A 3-15-13-07 256 326 27.34 Beaudesert (S) - Pt A 3-15-13-08 341 364 6.74 Beaudesert (S) - Pt A 3-15-13-09 375 393 4.80 Beaudesert (S) - Pt A 3-15-13-10 513 626 22.03 Beaudesert (S) - Pt A 3-15-13-14 242 264 9.09 Beaudesert (S) - Pt A 3-15-13-15 711 791 11.25 Beaudesert (S) - Pt A 3-15-13-16 853 998 17.00 Beaudesert (S) - Pt A 3-15-13-17 897 984 9.70 Beaudesert (S) - Pt A 3-15-13-18 707 801 13.30 Beaudesert (S) - Pt A 3-15-17-01 651 697 7.07 Beaudesert (S) - Pt A 3-15-17-02 451 484 7.32 Beaudesert (S) - Pt A 3-15-17-06 483 512 6.00 Beaudesert (S) - Pt A 3-15-17-07 419 440 5.01 Beaudesert (S) - Pt A 3-15-17-08 644 674 4.66 Beaudesert (S) - Pt A 3-15-17-09 388 453 16.75 Beaudesert (S) - Pt A 3-15-17-10 383 413 7.83 Beaudesert (S) - Pt A 3-15-17-11 232 250 7.76 Beaudesert (S) - Pt A 3-15-17-12 461 483 4.77 Beaudesert (S) - Pt A 3-15-17-13 407 429 5.41 Beaudesert (S) - Pt A 3-15-17-15 404 438 8.42 Beaudesert (S) - Pt A 3-15-17-16 246 256 4.07 Beaudesert (S) - Pt A 3-15-17-17 142 149 4.93 Beaudesert (S) - Pt A 3-15-17-18 158 167 5.70 Beaudesert (S) - Pt A 3-25-05-01 143 151 5.59 Beaudesert (S) - Pt A 3-25-05-02 506 537 6.13 Beaudesert (S) - Pt A 3-25-05-03 389 440 13.11 Beaudesert (S) - Pt A 3-25-05-04 316 330 4.43 Beaudesert (S) - Pt A 3-25-05-05 624 668 7.05 Beaudesert (S) - Pt A 3-25-05-06 326 350 7.36 Beaudesert (S) - Pt A 3-25-05-07 397 415 4.53 Beaudesert (S) - Pt A 3-25-05-08 378 405 7.14 Beaudesert (S) - Pt A 3-25-05-09 239 253 5.86 Beaudesert (S) - Pt A 3-25-05-10 399 428 7.27 Beaudesert (S) - Pt A 3-25-05-11 265 278 4.91 Beaudesert (S) - Pt A 3-25-24-01 389 414 6.43 Beaudesert (S) - Pt A 3-25-24-02 673 717 6.54 Beaudesert (S) - Pt A 3-25-24-03 318 326 2.52 Beaudesert (S) - Pt A 3-25-24-04 648 682 5.25 Beaudesert (S) - Pt A 3-25-24-05 279 295 5.73 Beaudesert (S) - Pt A 3-25-24-06 451 484 7.32 Beaudesert (S) - Pt A 3-25-24-07 297 310 4.38 Beaudesert (S) - Pt A 45 19540 21169 8.34

Queensland Redistribution Statistics 2006
Enrolment Projections
----------------------------------------------------------------------------------------------------------------------
70
Forde
---------------------------------------------------------------------------------------------------------------------- SLA Name CCD Number Actual
Enrolment 2/12/2005
Estimate 30/11/2007
Growth (%)
---------------------------------------------------------------------------------------------------------------------- Beaudesert (S) - Pt B 3-15-13-01 376 405 7.71 Beaudesert (S) - Pt B 3-15-13-02 696 721 3.59 Beaudesert (S) - Pt B 3-15-13-11 516 554 7.36 Beaudesert (S) - Pt B 3-15-13-12 39 40 2.56 Beaudesert (S) - Pt B 3-15-13-13 323 350 8.36 Beaudesert (S) - Pt B 3-15-13-19 757 814 7.53 Beaudesert (S) - Pt B 3-15-14-01 485 534 10.10 Beaudesert (S) - Pt B 3-15-14-02 470 513 9.15 Beaudesert (S) - Pt B 3-15-14-03 327 351 7.34 Beaudesert (S) - Pt B 3-15-14-04 528 567 7.39 Beaudesert (S) - Pt B 3-15-14-05 102 116 13.73 Beaudesert (S) - Pt B 3-15-14-06 472 510 8.05 Beaudesert (S) - Pt B 3-15-14-07 515 555 7.77 Beaudesert (S) - Pt B 3-15-14-08 496 535 7.86 Beaudesert (S) - Pt B 3-15-14-09 385 404 4.94 Beaudesert (S) - Pt B 3-15-14-10 257 277 7.78 Beaudesert (S) - Pt B 3-15-14-11 421 488 15.91 Beaudesert (S) - Pt B 3-15-14-12 388 420 8.25 Beaudesert (S) - Pt B 3-15-14-13 768 841 9.51 Beaudesert (S) - Pt B 3-15-14-14 126 133 5.56 Beaudesert (S) - Pt B 3-15-14-15 519 590 13.68 Beaudesert (S) - Pt B 3-15-15-01 433 517 19.40 Beaudesert (S) - Pt B 3-15-15-02 496 524 5.65 Beaudesert (S) - Pt B 3-15-15-03 100 100 0.00 Beaudesert (S) - Pt B 3-15-15-04 508 536 5.51 Beaudesert (S) - Pt B 3-15-15-05 197 199 1.02 Beaudesert (S) - Pt B 3-15-15-06 139 147 5.76 Beaudesert (S) - Pt B 3-15-15-07 277 284 0.74 Beaudesert (S) - Pt B 3-15-15-08 135 136 0.74 Beaudesert (S) - Pt B 3-15-15-09 223 231 3.59 Beaudesert (S) - Pt B 3-15-15-10 138 141 2.17 Beaudesert (S) - Pt B 3-15-15-11 90 91 1.11 Beaudesert (S) - Pt B 3-15-15-12 281 311 10.68 Beaudesert (S) - Pt B 3-15-15-13 225 232 3.11 Beaudesert (S) - Pt B 3-15-15-14 146 150 2.74 Beaudesert (S) - Pt B 3-15-15-15 192 204 6.25 Beaudesert (S) - Pt B 3-15-15-16 13 13 0.00 Beaudesert (S) - Pt B 3-15-16-01 574 611 6.45 Beaudesert (S) - Pt B 3-15-16-02 305 314 2.95 Beaudesert (S) - Pt B 3-15-16-03 496 500 0.81 Beaudesert (S) - Pt B 3-15-16-04 340 357 5.00 Beaudesert (S) - Pt B 3-15-16-05 299 306 2.34 Beaudesert (S) - Pt B 3-15-16-06 225 233 3.56 Beaudesert (S) - Pt B 3-15-16-07 90 97 7.78 Beaudesert (S) - Pt B 3-15-16-08 386 406 5.18 Beaudesert (S) - Pt B 3-15-16-09 583 610 4.63 Beaudesert (S) - Pt B 3-15-16-10 124 130 4.84
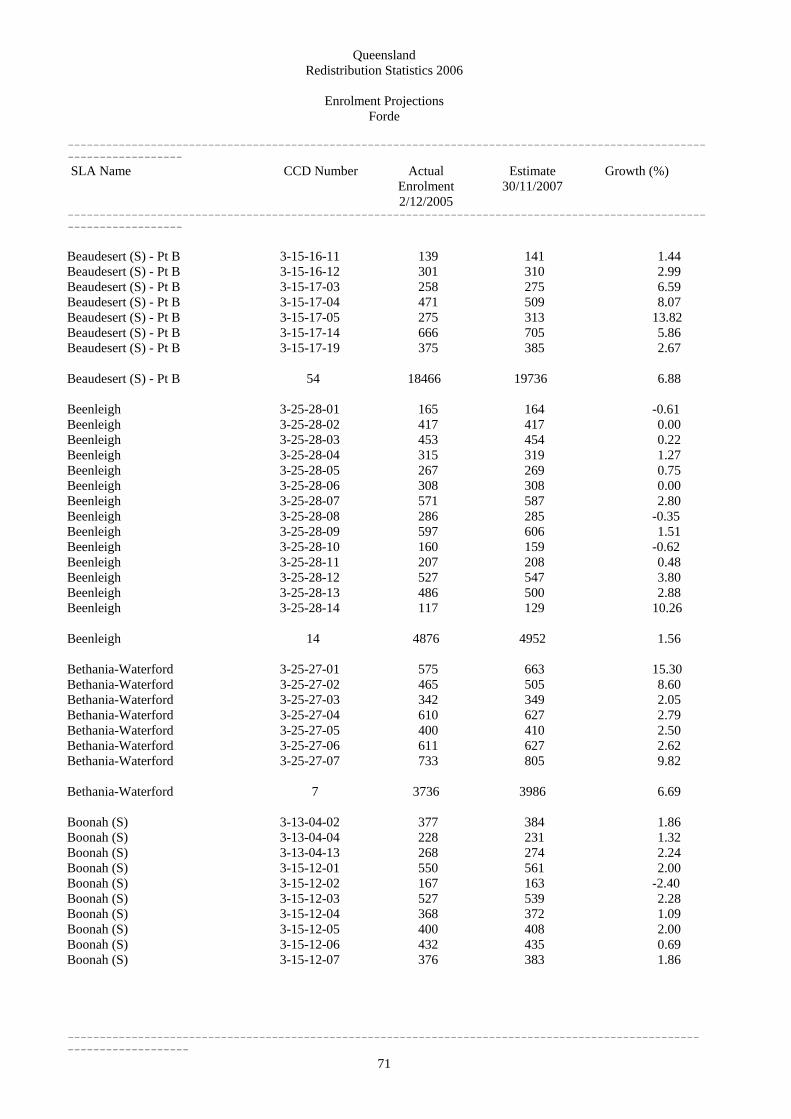
Queensland Redistribution Statistics 2006
Enrolment Projections
----------------------------------------------------------------------------------------------------------------------
71
Forde
---------------------------------------------------------------------------------------------------------------------- SLA Name CCD Number Actual
Enrolment 2/12/2005
Estimate 30/11/2007
Growth (%)
---------------------------------------------------------------------------------------------------------------------- Beaudesert (S) - Pt B 3-15-16-11 139 141 1.44 Beaudesert (S) - Pt B 3-15-16-12 301 310 2.99 Beaudesert (S) - Pt B 3-15-17-03 258 275 6.59 Beaudesert (S) - Pt B 3-15-17-04 471 509 8.07 Beaudesert (S) - Pt B 3-15-17-05 275 313 13.82 Beaudesert (S) - Pt B 3-15-17-14 666 705 5.86 Beaudesert (S) - Pt B 3-15-17-19 375 385 2.67 Beaudesert (S) - Pt B 54 18466 19736 6.88 Beenleigh 3-25-28-01 165 164 -0.61 Beenleigh 3-25-28-02 417 417 0.00 Beenleigh 3-25-28-03 453 454 0.22 Beenleigh 3-25-28-04 315 319 1.27 Beenleigh 3-25-28-05 267 269 0.75 Beenleigh 3-25-28-06 308 308 0.00 Beenleigh 3-25-28-07 571 587 2.80 Beenleigh 3-25-28-08 286 285 -0.35 Beenleigh 3-25-28-09 597 606 1.51 Beenleigh 3-25-28-10 160 159 -0.62 Beenleigh 3-25-28-11 207 208 0.48 Beenleigh 3-25-28-12 527 547 3.80 Beenleigh 3-25-28-13 486 500 2.88 Beenleigh 3-25-28-14 117 129 10.26 Beenleigh 14 4876 4952 1.56 Bethania-Waterford 3-25-27-01 575 663 15.30 Bethania-Waterford 3-25-27-02 465 505 8.60 Bethania-Waterford 3-25-27-03 342 349 2.05 Bethania-Waterford 3-25-27-04 610 627 2.79 Bethania-Waterford 3-25-27-05 400 410 2.50 Bethania-Waterford 3-25-27-06 611 627 2.62 Bethania-Waterford 3-25-27-07 733 805 9.82 Bethania-Waterford 7 3736 3986 6.69 Boonah (S) 3-13-04-02 377 384 1.86 Boonah (S) 3-13-04-04 228 231 1.32 Boonah (S) 3-13-04-13 268 274 2.24 Boonah (S) 3-15-12-01 550 561 2.00 Boonah (S) 3-15-12-02 167 163 -2.40 Boonah (S) 3-15-12-03 527 539 2.28 Boonah (S) 3-15-12-04 368 372 1.09 Boonah (S) 3-15-12-05 400 408 2.00 Boonah (S) 3-15-12-06 432 435 0.69 Boonah (S) 3-15-12-07 376 383 1.86

Queensland Redistribution Statistics 2006
Enrolment Projections
----------------------------------------------------------------------------------------------------------------------
72
Forde
---------------------------------------------------------------------------------------------------------------------- SLA Name CCD Number Actual
Enrolment 2/12/2005
Estimate 30/11/2007
Growth (%)
---------------------------------------------------------------------------------------------------------------------- Boonah (S) 3-15-12-08 472 480 1.69 Boonah (S) 3-15-12-09 375 386 2.93 Boonah (S) 3-15-12-10 115 117 1.74 Boonah (S) 3-15-12-11 359 366 1.95 Boonah (S) 3-15-12-12 372 381 2.42 Boonah (S) 3-15-12-13 236 247 4.66 Boonah (S) 3-15-12-14 142 145 2.11 Boonah (S) 3-15-12-15 287 288 0.35 Boonah (S) 18 6051 6160 1.80 Coomera-Cedar Creek 3-16-01-01 251 297 18.33 Coomera-Cedar Creek 3-16-01-03 760 931 22.50 Coomera-Cedar Creek 3-16-03-02 1384 2063 49.06 Coomera-Cedar Creek 3-16-03-09 369 497 34.69 Coomera-Cedar Creek 3-16-03-16 189 211 11.64 Coomera-Cedar Creek 3-16-03-17 159 188 18.24 Coomera-Cedar Creek 3-16-03-18 549 677 23.32 Coomera-Cedar Creek 3-16-03-19 321 404 25.86 Coomera-Cedar Creek 3-16-03-20 492 546 10.98 Coomera-Cedar Creek 9 4474 5814 29.95 Eagleby 3-25-26-01 253 259 2.37 Eagleby 3-25-26-02 153 158 3.27 Eagleby 3-25-26-03 258 264 2.33 Eagleby 3-25-26-04 427 438 2.58 Eagleby 3-25-26-05 387 391 1.03 Eagleby 3-25-26-06 849 1102 29.80 Eagleby 3-25-26-07 287 295 2.79 Eagleby 3-25-26-08 298 299 0.34 Eagleby 3-25-26-09 349 356 2.01 Eagleby 3-25-26-10 273 283 3.66 Eagleby 3-25-26-11 489 499 2.04 Eagleby 3-25-26-12 512 521 1.76 Eagleby 3-25-26-13 347 354 2.02 Eagleby 3-25-26-14 348 385 10.63 Eagleby 14 5230 5604 7.15 Edens Landing-Holmview 3-25-22-01 350 365 4.29 Edens Landing-Holmview 3-25-22-02 425 445 4.71 Edens Landing-Holmview 3-25-22-03 454 483 6.39 Edens Landing-Holmview 3-25-22-04 599 657 9.68 Edens Landing-Holmview 3-25-22-05 380 459 20.79 Edens Landing-Holmview 3-25-22-06 518 554 6.95 Edens Landing-Holmview 3-25-22-07 342 386 12.87

Queensland Redistribution Statistics 2006
Enrolment Projections
----------------------------------------------------------------------------------------------------------------------
73
Forde
---------------------------------------------------------------------------------------------------------------------- SLA Name CCD Number Actual
Enrolment 2/12/2005
Estimate 30/11/2007
Growth (%)
---------------------------------------------------------------------------------------------------------------------- Edens Landing-Holmview 7 3068 3349 9.16 Gold Coast (C) Bal in BSD 3-16-02-07 860 947 10.12 Gold Coast (C) Bal in BSD 3-16-02-09 240 271 12.92 Gold Coast (C) Bal in BSD 3-16-02-10 587 627 6.81 Gold Coast (C) Bal in BSD 3-16-02-14 417 513 23.02 Gold Coast (C) Bal in BSD 3-16-02-15 483 513 6.21 Gold Coast (C) Bal in BSD 3-16-02-16 384 402 4.69 Gold Coast (C) Bal in BSD 3-16-02-17 431 465 7.89 Gold Coast (C) Bal in BSD 3-16-02-18 855 1141 33.45 Gold Coast (C) Bal in BSD 3-25-29-01 157 167 6.37 Gold Coast (C) Bal in BSD 3-25-29-02 723 809 11.89 Gold Coast (C) Bal in BSD 3-25-29-14 251 265 5.58 Gold Coast (C) Bal in BSD 11 5388 6120 13.59 Guanaba-Currumbin Valley 3-16-01-05 220 232 5.45 Guanaba-Currumbin Valley 3-16-01-06 80 84 5.00 Guanaba-Currumbin Valley 3-16-01-13 202 215 6.44 Guanaba-Currumbin Valley 3-16-01-17 364 394 8.24 Guanaba-Currumbin Valley 4 866 925 6.81 Logan (C) Bal 3-25-25-02 363 400 10.19 Logan (C) Bal 1 363 400 10.19 Loganholme 3-25-09-04 314 323 2.87 Loganholme 3-25-09-06 422 433 2.61 Loganholme 3-25-09-07 543 564 3.87 Loganholme 3-25-09-09 488 528 8.20 Loganholme 3-25-09-10 409 416 1.71 Loganholme 3-25-09-11 382 396 3.66 Loganholme 3-25-09-12 375 397 5.87 Loganholme 3-25-09-15 547 565 3.29 Loganholme 8 3480 3622 4.08 Loganlea 3-25-11-02 414 422 1.93 Loganlea 3-25-11-03 335 332 -0.90 Loganlea 3-25-11-04 401 410 2.24 Loganlea 3-25-11-05 204 207 1.47 Loganlea 3-25-11-06 636 661 3.93 Loganlea 3-25-11-07 435 452 3.91 Loganlea 3-25-11-08 333 457 37.24 Loganlea 3-25-11-09 350 353 0.86

Queensland Redistribution Statistics 2006
Enrolment Projections
----------------------------------------------------------------------------------------------------------------------
74
Forde
---------------------------------------------------------------------------------------------------------------------- SLA Name CCD Number Actual
Enrolment 2/12/2005
Estimate 30/11/2007
Growth (%)
---------------------------------------------------------------------------------------------------------------------- Loganlea 3-25-11-10 476 504 5.88 Loganlea 3-25-11-11 455 454 -0.22 Loganlea 10 4039 4252 5.27 Mt Warren Park 3-25-29-03 599 618 3.17 Mt Warren Park 3-25-29-04 355 363 2.25 Mt Warren Park 3-25-29-05 484 488 0.83 Mt Warren Park 3-25-29-06 787 816 3.68 Mt Warren Park 3-25-29-07 500 509 1.80 Mt Warren Park 3-25-29-08 286 323 12.94 Mt Warren Park 3-25-29-09 208 213 2.40 Mt Warren Park 3-25-29-11 415 428 3.13 Mt Warren Park 8 3634 3758 3.41 Tanah Merah 3-25-11-01 3 3 0.00 Tanah Merah 1 3 3 0.00 Waterford West 3-25-25-01 349 361 3.44 Waterford West 3-25-25-03 355 361 1.69 Waterford West 3-25-25-04 474 484 2.11 Waterford West 3-25-25-05 418 433 3.59 Waterford West 3-25-25-06 450 457 1.56 Waterford West 3-25-25-07 469 476 1.49 Waterford West 3-25-25-08 250 258 3.20 Waterford West 3-25-25-09 625 643 2.88 Waterford West 8 3390 3473 2.45 Windaroo-Bannockburn 3-25-29-10 661 684 3.48 Windaroo-Bannockburn 3-25-29-12 326 330 1.23 Windaroo-Bannockburn 3-25-29-13 819 868 5.98 Windaroo-Bannockburn 3 1806 1882 4.21 Forde 222 88410 95205 7.69

Queensland Redistribution Statistics 2006
Enrolment Projections
----------------------------------------------------------------------------------------------------------------------
75
Griffith
---------------------------------------------------------------------------------------------------------------------- SLA Name CCD Number Actual
Enrolment 2/12/2005
Estimate 30/11/2007
Growth (%)
---------------------------------------------------------------------------------------------------------------------- Annerley 3-24-03-01 261 265 1.53 Annerley 3-24-03-02 419 450 7.40 Annerley 3-24-03-03 422 443 4.98 Annerley 3-24-03-04 312 335 7.37 Annerley 3-24-03-05 325 330 1.54 Annerley 3-24-03-06 271 276 1.85 Annerley 3-24-03-07 312 331 6.09 Annerley 3-24-04-01 472 488 3.39 Annerley 3-24-04-02 322 328 1.86 Annerley 3-24-04-03 287 295 2.79 Annerley 3-24-04-04 289 291 0.69 Annerley 3-24-04-05 333 344 3.30 Annerley 3-24-04-06 406 412 1.48 Annerley 3-24-04-07 311 334 7.40 Annerley 3-24-04-08 286 292 2.10 Annerley 3-24-04-09 287 294 2.44 Annerley 16 5315 5508 3.63 Balmoral 3-21-16-01 274 287 4.74 Balmoral 3-21-16-02 388 394 1.55 Balmoral 3-21-16-03 192 194 1.04 Balmoral 3-21-16-04 306 319 4.25 Balmoral 3-21-16-05 550 556 1.09 Balmoral 3-21-16-06 304 313 2.96 Balmoral 3-21-16-07 99 105 6.06 Balmoral 3-21-16-08 345 363 5.22 Balmoral 8 2458 2531 2.97 Bulimba 3-21-15-01 659 683 3.64 Bulimba 3-21-15-02 399 413 3.51 Bulimba 3-21-15-03 297 314 5.72 Bulimba 3-21-15-04 249 262 5.22 Bulimba 3-21-15-05 136 149 9.56 Bulimba 3-21-15-06 387 407 5.17 Bulimba 3-21-15-07 654 894 36.70 Bulimba 3-21-15-08 159 195 22.64 Bulimba 3-21-15-09 148 157 6.08 Bulimba 9 3088 3474 12.50 Camp Hill 3-21-11-01 520 523 0.58 Camp Hill 3-21-11-02 424 432 1.89 Camp Hill 3-21-11-03 270 275 1.85 Camp Hill 3-21-11-04 464 471 1.51 Camp Hill 3-21-11-05 327 328 0.31

Queensland Redistribution Statistics 2006
Enrolment Projections
----------------------------------------------------------------------------------------------------------------------
76
Griffith
---------------------------------------------------------------------------------------------------------------------- SLA Name CCD Number Actual
Enrolment 2/12/2005
Estimate 30/11/2007
Growth (%)
---------------------------------------------------------------------------------------------------------------------- Camp Hill 3-21-11-06 424 450 6.13 Camp Hill 3-21-11-07 589 590 0.17 Camp Hill 3-21-11-08 223 227 1.79 Camp Hill 3-21-11-09 301 314 4.32 Camp Hill 3-21-11-10 353 358 1.42 Camp Hill 3-21-12-01 342 348 1.75 Camp Hill 3-21-12-02 431 438 1.62 Camp Hill 3-21-12-03 273 281 2.93 Camp Hill 3-21-12-04 348 345 -0.86 Camp Hill 3-21-12-05 308 306 -0.65 Camp Hill 3-21-12-06 303 306 0.99 Camp Hill 3-21-12-07 441 459 4.08 Camp Hill 3-21-12-08 451 455 0.89 Camp Hill 18 6792 6906 1.68 Cannon Hill 3-21-21-01 278 283 1.80 Cannon Hill 3-21-21-02 556 570 2.52 Cannon Hill 3-21-21-03 358 369 3.07 Cannon Hill 3-21-21-04 311 320 2.89 Cannon Hill 3-21-21-05 248 264 6.45 Cannon Hill 3-21-21-07 313 319 1.92 Cannon Hill 3-21-21-08 258 263 1.94 Cannon Hill 3-21-21-09 392 411 4.85 Cannon Hill 3-21-22-05 88 97 10.23 Cannon Hill 3-21-22-06 254 267 5.12 Cannon Hill 3-21-22-07 258 343 32.95 Cannon Hill 3-21-22-08 61 62 1.64 Cannon Hill 12 3375 3568 5.72 Carina 3-21-18-01 282 287 1.77 Carina 3-21-18-02 486 485 -0.21 Carina 3-21-18-03 399 399 0.00 Carina 3-21-18-05 282 291 3.19 Carina 3-21-18-06 476 484 1.68 Carina 3-21-18-07 534 550 3.00 Carina 3-21-18-08 315 325 3.17 Carina 3-21-18-09 536 560 4.48 Carina 3-21-18-10 365 389 6.58 Carina 3-21-18-11 520 526 1.15 Carina 3-21-18-13 462 473 2.38 Carina 11 4657 4769 2.40 Carina Heights 3-21-19-01 436 448 2.75 Carina Heights 3-21-19-02 433 446 3.00

Queensland Redistribution Statistics 2006
Enrolment Projections
----------------------------------------------------------------------------------------------------------------------
77
Griffith
---------------------------------------------------------------------------------------------------------------------- SLA Name CCD Number Actual
Enrolment 2/12/2005
Estimate 30/11/2007
Growth (%)
---------------------------------------------------------------------------------------------------------------------- Carina Heights 3-21-19-03 319 320 0.31 Carina Heights 3-21-19-04 267 270 1.12 Carina Heights 3-21-19-05 508 515 1.38 Carina Heights 3-21-19-06 562 573 1.96 Carina Heights 3-21-19-07 249 275 10.44 Carina Heights 3-21-19-08 612 603 -1.47 Carina Heights 3-21-19-09 287 313 9.06 Carina Heights 3-21-19-10 340 352 3.53 Carina Heights 10 4013 4115 2.54 Coorparoo 3-21-09-01 411 421 2.43 Coorparoo 3-21-09-02 191 249 30.37 Coorparoo 3-21-09-03 302 309 2.32 Coorparoo 3-21-09-04 379 404 6.60 Coorparoo 3-21-09-05 378 388 2.65 Coorparoo 3-21-09-06 256 257 0.39 Coorparoo 3-21-09-07 359 362 0.84 Coorparoo 3-21-09-08 336 338 0.60 Coorparoo 3-21-09-09 512 514 0.39 Coorparoo 3-21-09-10 187 195 4.28 Coorparoo 3-21-09-11 265 270 1.89 Coorparoo 3-21-09-12 465 473 1.72 Coorparoo 3-21-09-13 369 384 4.07 Coorparoo 3-21-09-14 322 331 2.80 Coorparoo 3-21-09-15 446 458 2.69 Coorparoo 3-21-10-01 334 335 0.30 Coorparoo 3-21-10-02 416 418 0.48 Coorparoo 3-21-10-03 296 299 1.01 Coorparoo 3-21-10-04 490 499 1.84 Coorparoo 3-21-10-05 333 339 1.80 Coorparoo 3-21-10-06 290 293 1.03 Coorparoo 3-21-10-07 344 349 1.45 Coorparoo 3-21-10-08 368 372 1.09 Coorparoo 3-21-10-09 328 331 0.91 Coorparoo 3-21-10-10 194 198 2.06 Coorparoo 3-21-10-11 126 128 1.59 Coorparoo 3-21-10-12 422 432 2.37 Coorparoo 3-21-10-13 383 392 2.35 Coorparoo 3-21-10-14 403 411 1.99 Coorparoo 29 9905 10149 2.46 Dutton Park 3-21-05-01 75 79 5.33 Dutton Park 3-21-05-02 105 103 -1.90 Dutton Park 3-21-05-03 297 293 -1.35 Dutton Park 3-21-05-04 254 248 -2.36

Queensland Redistribution Statistics 2006
Enrolment Projections
----------------------------------------------------------------------------------------------------------------------
78
Griffith
---------------------------------------------------------------------------------------------------------------------- SLA Name CCD Number Actual
Enrolment 2/12/2005
Estimate 30/11/2007
Growth (%)
---------------------------------------------------------------------------------------------------------------------- Dutton Park 3-21-05-05 129 120 -6.98 Dutton Park 3-21-05-06 97 97 0.00 Dutton Park 6 957 940 -1.78 East Brisbane 3-21-08-01 477 502 5.24 East Brisbane 3-21-08-02 302 303 0.33 East Brisbane 3-21-08-03 257 254 -1.17 East Brisbane 3-21-08-04 353 350 -0.85 East Brisbane 3-21-08-05 227 251 10.57 East Brisbane 3-21-08-06 218 210 -3.67 East Brisbane 3-21-08-07 205 211 2.93 East Brisbane 3-21-08-08 192 189 -1.56 East Brisbane 3-21-08-09 120 121 0.83 East Brisbane 3-21-08-10 361 380 5.26 East Brisbane 3-21-08-11 318 324 1.89 East Brisbane 3-21-08-12 266 271 1.88 East Brisbane 12 3296 3366 2.12 Fairfield 3-24-02-01 336 347 3.27 Fairfield 3-24-02-02 296 302 2.03 Fairfield 3-24-02-03 283 293 3.53 Fairfield 3-24-02-04 382 400 4.71 Fairfield 3-24-02-05 331 348 5.14 Fairfield 5 1628 1690 3.81 Greenslopes 3-24-05-01 195 209 7.18 Greenslopes 3-24-05-02 212 215 1.42 Greenslopes 3-24-05-03 279 280 0.36 Greenslopes 3-24-05-04 360 361 0.28 Greenslopes 3-24-05-05 227 225 -0.88 Greenslopes 3-24-05-06 462 467 1.08 Greenslopes 3-24-05-07 254 260 2.36 Greenslopes 3-24-05-08 316 314 -0.63 Greenslopes 3-24-05-09 233 235 0.86 Greenslopes 3-24-06-01 434 434 0.00 Greenslopes 3-24-06-02 287 289 0.70 Greenslopes 3-24-06-03 151 152 0.66 Greenslopes 3-24-06-04 392 398 1.53 Greenslopes 3-24-06-05 446 458 2.69 Greenslopes 3-24-06-06 396 402 1.52 Greenslopes 3-24-06-07 376 463 23.14 Greenslopes 3-24-06-08 275 275 0.00 Greenslopes 3-24-06-09 172 173 0.58 Greenslopes 18 5467 5610 2.62

Queensland Redistribution Statistics 2006
Enrolment Projections
----------------------------------------------------------------------------------------------------------------------
79
Highgate Hill 3-21-04-10 135 132 -2.22
Griffith
---------------------------------------------------------------------------------------------------------------------- SLA Name CCD Number Actual
Enrolment 2/12/2005
Estimate 30/11/2007
Growth (%)
---------------------------------------------------------------------------------------------------------------------- Hawthorne 3-21-14-01 337 355 5.34 Hawthorne 3-21-14-02 264 285 7.95 Hawthorne 3-21-14-03 482 535 11.00 Hawthorne 3-21-14-04 417 428 2.64 Hawthorne 3-21-14-05 306 317 3.59 Hawthorne 3-21-14-06 426 438 2.82 Hawthorne 3-21-14-07 329 346 5.17 Hawthorne 3-21-14-08 249 254 2.01 Hawthorne 8 2810 2958 5.27 Highgate Hill 3-21-04-01 246 245 -0.41 Highgate Hill 3-21-04-02 243 252 3.70 Highgate Hill 3-21-04-03 354 355 0.28 Highgate Hill 3-21-04-04 153 150 -1.96 Highgate Hill 3-21-04-05 313 308 -1.60 Highgate Hill 3-21-04-06 480 457 -4.79 Highgate Hill 3-21-04-07 263 275 4.56 Highgate Hill 3-21-04-08 276 273 -1.09 Highgate Hill 3-21-04-09 295 297 0.68
Highgate Hill 3-21-04-11 386 383 -0.78 Highgate Hill 3-21-04-12 311 299 -3.86 Highgate Hill 3-21-04-13 252 257 1.98 Highgate Hill 13 3707 3683 -0.65 Holland Park 3-24-07-01 563 569 1.07 Holland Park 3-24-07-02 375 378 0.80 Holland Park 3-24-07-03 451 458 1.55 Holland Park 3-24-07-04 434 427 -1.61 Holland Park 3-24-07-05 318 323 1.57 Holland Park 3-24-07-06 361 360 -0.28 Holland Park 3-24-07-07 558 559 0.18 Holland Park 3-24-07-08 320 320 0.00 Holland Park 3-24-07-09 370 370 0.00 Holland Park 3-24-07-10 632 626 -0.95 Holland Park 3-24-07-11 170 172 1.18 Holland Park 3-24-07-12 342 354 3.51 Holland Park 3-24-07-13 336 349 3.87 Holland Park 13 5230 5265 0.67 Holland Park West 3-24-13-01 152 155 1.97 Holland Park West 3-24-13-02 275 279 1.45 Holland Park West 3-24-13-03 503 528 4.97 Holland Park West 3-24-13-04 194 197 1.55
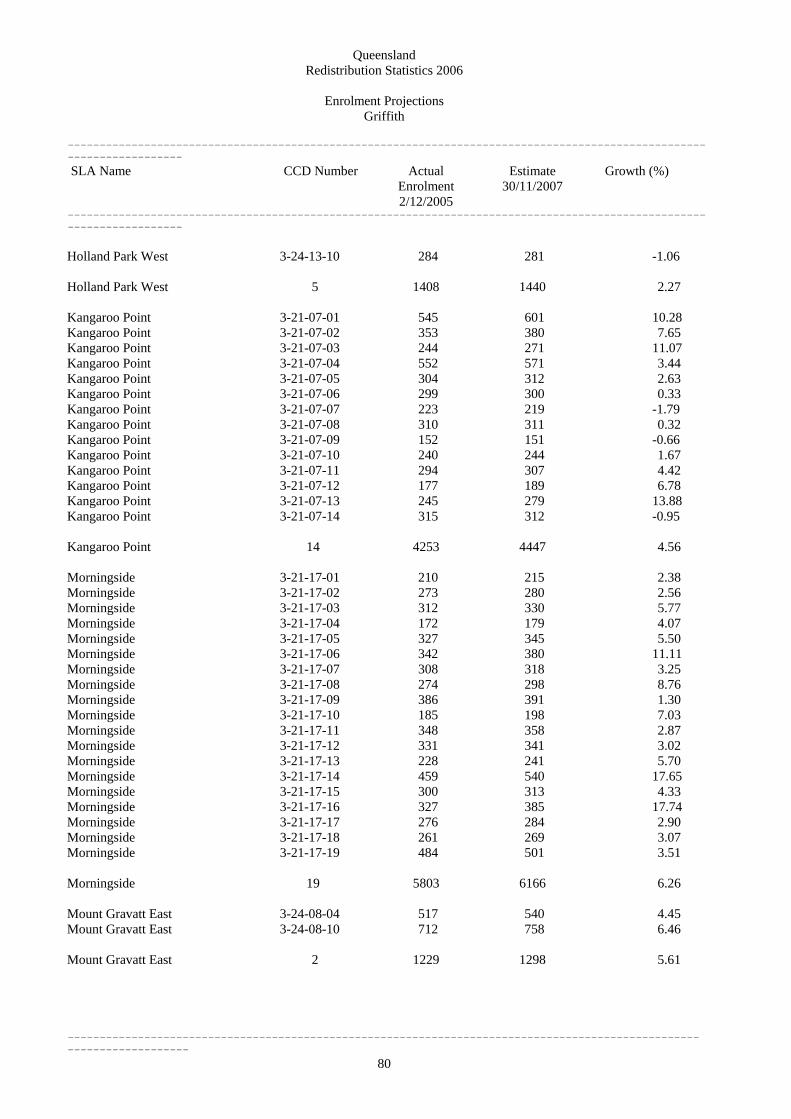
Queensland Redistribution Statistics 2006
Enrolment Projections
----------------------------------------------------------------------------------------------------------------------
80
Griffith
---------------------------------------------------------------------------------------------------------------------- SLA Name CCD Number Actual
Enrolment 2/12/2005
Estimate 30/11/2007
Growth (%)
---------------------------------------------------------------------------------------------------------------------- Holland Park West 3-24-13-10 284 281 -1.06 Holland Park West 5 1408 1440 2.27 Kangaroo Point 3-21-07-01 545 601 10.28 Kangaroo Point 3-21-07-02 353 380 7.65 Kangaroo Point 3-21-07-03 244 271 11.07 Kangaroo Point 3-21-07-04 552 571 3.44 Kangaroo Point 3-21-07-05 304 312 2.63 Kangaroo Point 3-21-07-06 299 300 0.33 Kangaroo Point 3-21-07-07 223 219 -1.79 Kangaroo Point 3-21-07-08 310 311 0.32 Kangaroo Point 3-21-07-09 152 151 -0.66 Kangaroo Point 3-21-07-10 240 244 1.67 Kangaroo Point 3-21-07-11 294 307 4.42 Kangaroo Point 3-21-07-12 177 189 6.78 Kangaroo Point 3-21-07-13 245 279 13.88 Kangaroo Point 3-21-07-14 315 312 -0.95 Kangaroo Point 14 4253 4447 4.56 Morningside 3-21-17-01 210 215 2.38 Morningside 3-21-17-02 273 280 2.56 Morningside 3-21-17-03 312 330 5.77 Morningside 3-21-17-04 172 179 4.07 Morningside 3-21-17-05 327 345 5.50 Morningside 3-21-17-06 342 380 11.11 Morningside 3-21-17-07 308 318 3.25 Morningside 3-21-17-08 274 298 8.76 Morningside 3-21-17-09 386 391 1.30 Morningside 3-21-17-10 185 198 7.03 Morningside 3-21-17-11 348 358 2.87 Morningside 3-21-17-12 331 341 3.02 Morningside 3-21-17-13 228 241 5.70 Morningside 3-21-17-14 459 540 17.65 Morningside 3-21-17-15 300 313 4.33 Morningside 3-21-17-16 327 385 17.74 Morningside 3-21-17-17 276 284 2.90 Morningside 3-21-17-18 261 269 3.07 Morningside 3-21-17-19 484 501 3.51 Morningside 19 5803 6166 6.26 Mount Gravatt East 3-24-08-04 517 540 4.45 Mount Gravatt East 3-24-08-10 712 758 6.46 Mount Gravatt East 2 1229 1298 5.61
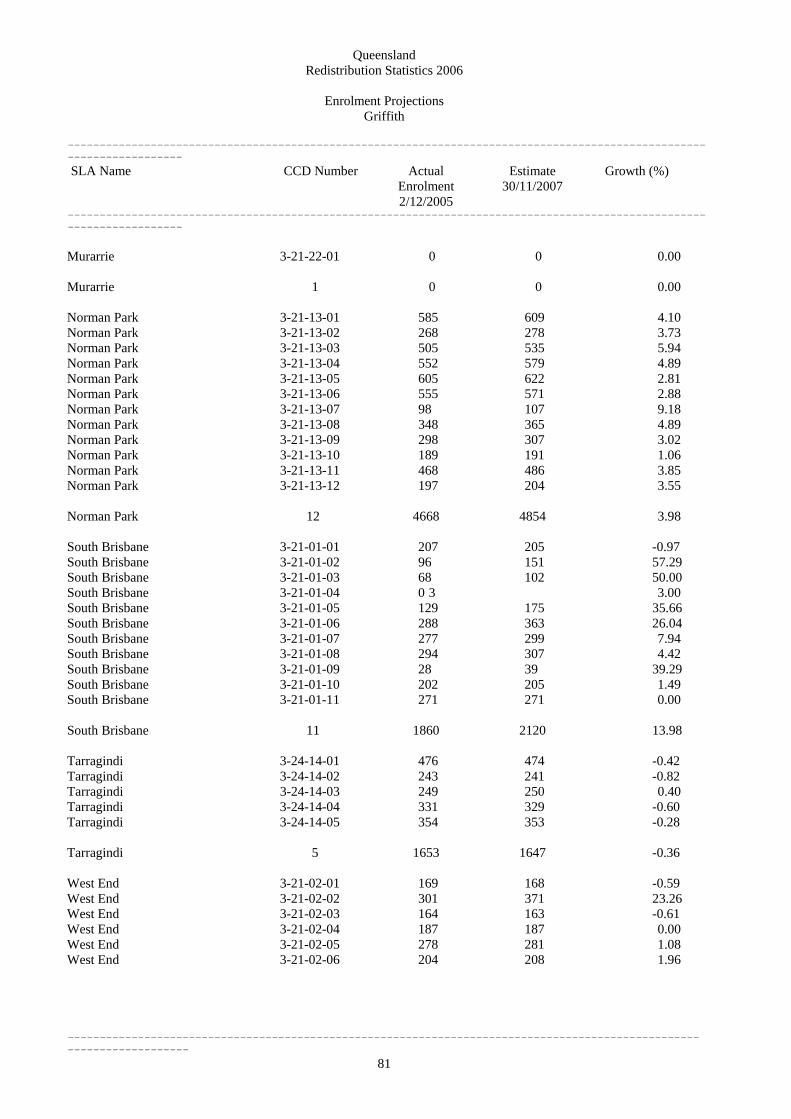
Queensland Redistribution Statistics 2006
Enrolment Projections
----------------------------------------------------------------------------------------------------------------------
81
Griffith
---------------------------------------------------------------------------------------------------------------------- SLA Name CCD Number Actual
Enrolment 2/12/2005
Estimate 30/11/2007
Growth (%)
---------------------------------------------------------------------------------------------------------------------- Murarrie 3-21-22-01 0 0 0.00 Murarrie 1 0 0 0.00 Norman Park 3-21-13-01 585 609 4.10 Norman Park 3-21-13-02 268 278 3.73 Norman Park 3-21-13-03 505 535 5.94 Norman Park 3-21-13-04 552 579 4.89 Norman Park 3-21-13-05 605 622 2.81 Norman Park 3-21-13-06 555 571 2.88 Norman Park 3-21-13-07 98 107 9.18 Norman Park 3-21-13-08 348 365 4.89 Norman Park 3-21-13-09 298 307 3.02 Norman Park 3-21-13-10 189 191 1.06 Norman Park 3-21-13-11 468 486 3.85 Norman Park 3-21-13-12 197 204 3.55 Norman Park 12 4668 4854 3.98 South Brisbane 3-21-01-01 207 205 -0.97 South Brisbane 3-21-01-02 96 151 57.29 South Brisbane 3-21-01-03 68 102 50.00 South Brisbane 3-21-01-04 0 3 3.00 South Brisbane 3-21-01-05 129 175 35.66 South Brisbane 3-21-01-06 288 363 26.04 South Brisbane 3-21-01-07 277 299 7.94 South Brisbane 3-21-01-08 294 307 4.42 South Brisbane 3-21-01-09 28 39 39.29 South Brisbane 3-21-01-10 202 205 1.49 South Brisbane 3-21-01-11 271 271 0.00 South Brisbane 11 1860 2120 13.98 Tarragindi 3-24-14-01 476 474 -0.42 Tarragindi 3-24-14-02 243 241 -0.82 Tarragindi 3-24-14-03 249 250 0.40 Tarragindi 3-24-14-04 331 329 -0.60 Tarragindi 3-24-14-05 354 353 -0.28 Tarragindi 5 1653 1647 -0.36 West End 3-21-02-01 169 168 -0.59 West End 3-21-02-02 301 371 23.26 West End 3-21-02-03 164 163 -0.61 West End 3-21-02-04 187 187 0.00 West End 3-21-02-05 278 281 1.08 West End 3-21-02-06 204 208 1.96

Queensland Redistribution Statistics 2006
Enrolment Projections
----------------------------------------------------------------------------------------------------------------------
82
Griffith
---------------------------------------------------------------------------------------------------------------------- SLA Name CCD Number Actual
Enrolment 2/12/2005
Estimate 30/11/2007
Growth (%)
---------------------------------------------------------------------------------------------------------------------- West End 3-21-02-07 199 200 0.50 West End 3-21-02-08 254 255 0.39 West End 3-21-03-01 299 315 5.35 West End 3-21-03-02 94 98 4.26 West End 3-21-03-03 284 284 0.00 West End 3-21-03-04 201 198 -1.49 West End 3-21-03-05 417 416 -0.24 West End 3-21-03-06 275 297 8.00 West End 3-21-03-07 272 277 1.84 West End 3-21-03-08 403 410 1.74 West End 3-21-03-09 225 226 0.44 West End 17 4226 4354 3.03 Woolloongabba 3-21-06-01 327 361 10.40 Woolloongabba 3-21-06-02 175 213 21.71 Woolloongabba 3-21-06-03 184 201 9.24 Woolloongabba 3-21-06-04 377 438 16.18 Woolloongabba 3-21-06-05 150 162 8.00 Woolloongabba 3-21-06-06 131 161 22.90 Woolloongabba 3-21-06-07 300 323 7.67 Woolloongabba 3-21-06-08 184 217 17.93 Woolloongabba 3-21-06-09 281 328 16.73 Woolloongabba 3-21-06-10 89 102 14.61 Woolloongabba 3-21-06-11 220 240 9.09 Woolloongabba 3-21-06-12 118 133 12.71 Woolloongabba 12 2536 2879 13.53 Yeronga 3-24-01-07 28 28 0.00 Yeronga 1 28 28 0.00 Griffith 287 90362 93765 3.77

Queensland Redistribution Statistics 2006
Enrolment Projections
----------------------------------------------------------------------------------------------------------------------
83
Groom
---------------------------------------------------------------------------------------------------------------------- SLA Name CCD Number Actual
Enrolment 2/12/2005
Estimate 30/11/2007
Growth (%)
---------------------------------------------------------------------------------------------------------------------- Cambooya (S) - Pt A 3-14-04-01 468 517 10.47 Cambooya (S) - Pt A 3-14-04-06 532 578 8.65 Cambooya (S) - Pt A 3-14-04-08 488 531 8.81 Cambooya (S) - Pt A 3-14-04-09 471 547 16.14 Cambooya (S) - Pt A 3-14-04-10 438 475 8.45 Cambooya (S) - Pt A 5 2397 2648 10.47 Cambooya (S) - Pt B 3-14-04-02 475 496 4.42 Cambooya (S) - Pt B 3-14-04-03 187 197 5.35 Cambooya (S) - Pt B 3-14-04-04 295 309 4.75 Cambooya (S) - Pt B 3-14-04-05 186 193 3.76 Cambooya (S) - Pt B 3-14-04-07 184 197 7.07 Cambooya (S) - Pt B 5 1327 1392 4.90 Clifton (S) 3-15-03-01 100 101 1.00 Clifton (S) 3-15-03-02 145 146 0.69 Clifton (S) 3-15-03-03 163 172 5.52 Clifton (S) 3-15-03-04 277 281 1.44 Clifton (S) 3-15-03-05 302 311 2.98 Clifton (S) 3-15-03-06 274 282 2.92 Clifton (S) 3-15-03-07 157 156 -0.64 Clifton (S) 3-15-03-08 364 367 0.82 Clifton (S) 8 1782 1816 1.91 Crow's Nest (S) - Pt A 3-14-22-04 497 580 16.70 Crow's Nest (S) - Pt A 3-14-22-05 69 74 7.25 Crow's Nest (S) - Pt A 3-14-22-06 902 1091 20.95 Crow's Nest (S) - Pt A 3-14-22-07 644 742 15.22 Crow's Nest (S) - Pt A 3-14-22-08 615 664 7.97 Crow's Nest (S) - Pt A 3-14-22-09 934 981 5.03 Crow's Nest (S) - Pt A 3-14-22-10 557 614 10.23 Crow's Nest (S) - Pt A 3-14-22-11 198 206 4.04 Crow's Nest (S) - Pt A 3-14-22-13 467 511 9.42 Crow's Nest (S) - Pt A 3-14-22-14 368 405 10.05 Crow's Nest (S) - Pt A 3-14-22-15 132 140 6.06 Crow's Nest (S) - Pt A 11 5383 6008 11.61 Crow's Nest (S) - Pt B 3-14-22-02 31 35 12.90 Crow's Nest (S) - Pt B 3-14-22-03 54 53 -1.85 Crow's Nest (S) - Pt B 3-14-22-12 250 254 1.60 Crow's Nest (S) - Pt B 3 335 342 2.09

Queensland Redistribution Statistics 2006
Enrolment Projections
----------------------------------------------------------------------------------------------------------------------
84
Groom
---------------------------------------------------------------------------------------------------------------------- SLA Name CCD Number Actual
Enrolment 2/12/2005
Estimate 30/11/2007
Growth (%)
---------------------------------------------------------------------------------------------------------------------- Jondaryan (S) - Pt A 3-14-17-02 154 163 5.84 Jondaryan (S) - Pt A 3-14-17-03 232 253 9.05 Jondaryan (S) - Pt A 3-14-17-05 146 163 11.64 Jondaryan (S) - Pt A 3-14-17-07 757 830 9.64 Jondaryan (S) - Pt A 3-14-17-08 392 450 14.80 Jondaryan (S) - Pt A 3-14-17-10 537 556 3.54 Jondaryan (S) - Pt A 3-14-17-11 296 305 3.04 Jondaryan (S) - Pt A 3-14-17-13 301 331 9.97 Jondaryan (S) - Pt A 3-14-17-14 1029 1180 14.67 Jondaryan (S) - Pt A 3-14-17-15 160 163 1.88 Jondaryan (S) - Pt A 3-14-17-16 471 488 3.61 Jondaryan (S) - Pt A 11 4475 4882 9.09 Jondaryan (S) - Pt B 3-14-17-01 449 465 3.56 Jondaryan (S) - Pt B 3-14-17-04 287 295 2.79 Jondaryan (S) - Pt B 3-14-17-06 313 324 3.51 Jondaryan (S) - Pt B 3-14-17-09 134 134 0.00 Jondaryan (S) - Pt B 3-14-17-12 181 185 2.21 Jondaryan (S) - Pt B 3-14-18-01 107 111 3.74 Jondaryan (S) - Pt B 3-14-18-02 124 127 2.42 Jondaryan (S) - Pt B 3-14-18-03 143 147 2.80 Jondaryan (S) - Pt B 3-14-18-04 121 124 2.48 Jondaryan (S) - Pt B 3-14-18-05 80 83 3.75 Jondaryan (S) - Pt B 3-14-18-06 280 290 3.57 Jondaryan (S) - Pt B 3-14-18-07 35 38 8.57 Jondaryan (S) - Pt B 3-14-18-08 469 483 2.99 Jondaryan (S) - Pt B 3-14-18-09 343 354 3.21 Jondaryan (S) - Pt B 3-14-18-10 511 525 2.74 Jondaryan (S) - Pt B 3-14-18-11 320 332 3.75 Jondaryan (S) - Pt B 3-14-18-12 229 238 3.93 Jondaryan (S) - Pt B 3-14-18-13 478 493 3.14 Jondaryan (S) - Pt B 3-14-18-14 49 52 6.12 Jondaryan (S) - Pt B 19 4653 4800 3.16 Pittsworth (S) 3-15-02-01 137 137 0.00 Pittsworth (S) 3-15-02-02 336 349 3.87 Pittsworth (S) 3-15-02-03 356 367 3.09 Pittsworth (S) 3-15-02-04 259 262 1.16 Pittsworth (S) 3-15-02-05 513 529 3.12 Pittsworth (S) 3-15-02-06 541 565 4.44 Pittsworth (S) 3-15-02-07 166 171 3.01 Pittsworth (S) 3-15-02-08 174 188 8.05 Pittsworth (S) 3-15-02-09 641 663 3.43 Pittsworth (S) 9 3123 3231 3.46

Queensland Redistribution Statistics 2006
Enrolment Projections
----------------------------------------------------------------------------------------------------------------------
85
Groom
---------------------------------------------------------------------------------------------------------------------- SLA Name CCD Number Actual
Enrolment 2/12/2005
Estimate 30/11/2007
Growth (%)
---------------------------------------------------------------------------------------------------------------------- Rosalie (S) - Pt A 3-14-19-04 341 358 4.99 Rosalie (S) - Pt A 3-14-19-08 359 381 6.13 Rosalie (S) - Pt A 3-14-19-09 526 557 5.89 Rosalie (S) - Pt A 3-14-19-11 571 602 5.43 Rosalie (S) - Pt A 3-14-19-13 595 638 7.23 Rosalie (S) - Pt A 3-14-19-14 388 403 3.87 Rosalie (S) - Pt A 6 2780 2939 5.72 Rosalie (S) - Pt B 3-14-19-01 155 156 0.65 Rosalie (S) - Pt B 3-14-19-02 96 95 -1.04 Rosalie (S) - Pt B 3-14-19-03 91 92 1.10 Rosalie (S) - Pt B 3-14-19-05 247 254 2.83 Rosalie (S) - Pt B 3-14-19-06 477 484 1.47 Rosalie (S) - Pt B 3-14-19-07 114 118 3.51 Rosalie (S) - Pt B 3-14-19-10 105 105 0.00 Rosalie (S) - Pt B 3-14-19-12 0 0 0.00 Rosalie (S) - Pt B 3-14-20-04 116 114 -1.72 Rosalie (S) - Pt B 3-14-20-05 127 129 1.57 Rosalie (S) - Pt B 3-14-20-06 209 210 0.48 Rosalie (S) - Pt B 3-14-20-07 181 183 1.10 Rosalie (S) - Pt B 3-14-20-08 199 199 0.00 Rosalie (S) - Pt B 13 2117 2139 1.04 Toowoomba (C) - Central 3-14-05-06 479 486 1.46 Toowoomba (C) - Central 3-14-05-07 455 451 -0.88 Toowoomba (C) - Central 3-14-05-08 405 412 1.73 Toowoomba (C) - Central 3-14-05-09 208 212 1.92 Toowoomba (C) - Central 3-14-05-14 309 307 -0.65 Toowoomba (C) - Central 3-14-05-15 542 542 0.00 Toowoomba (C) - Central 3-14-06-01 412 414 0.49 Toowoomba (C) - Central 3-14-06-02 395 408 3.29 Toowoomba (C) - Central 3-14-06-03 462 472 2.16 Toowoomba (C) - Central 3-14-06-04 433 445 2.77 Toowoomba (C) - Central 3-14-06-05 470 478 1.70 Toowoomba (C) - Central 3-14-06-06 425 429 0.94 Toowoomba (C) - Central 3-14-10-02 305 319 4.59 Toowoomba (C) - Central 3-14-10-03 167 172 2.99 Toowoomba (C) - Central 3-14-10-04 227 230 1.32 Toowoomba (C) - Central 3-14-10-11 152 155 1.97 Toowoomba (C) - Central 3-14-11-03 252 259 2.78 Toowoomba (C) - Central 3-14-11-04 80 80 0.00 Toowoomba (C) - Central 3-14-11-05 320 329 2.81 Toowoomba (C) - Central 3-14-11-06 80 80 0.00 Toowoomba (C) - Central 3-14-11-07 262 270 3.05 Toowoomba (C) - Central 3-14-11-08 93 98 5.38

Queensland Redistribution Statistics 2006
Enrolment Projections
----------------------------------------------------------------------------------------------------------------------
86
Groom
---------------------------------------------------------------------------------------------------------------------- SLA Name CCD Number Actual
Enrolment 2/12/2005
Estimate 30/11/2007
Growth (%)
---------------------------------------------------------------------------------------------------------------------- Toowoomba (C) - Central 3-14-11-09 305 306 0.33 Toowoomba (C) - Central 3-14-11-10 125 129 3.20 Toowoomba (C) - Central 3-14-11-11 256 260 1.56 Toowoomba (C) - Central 3-14-12-02 48 49 2.08 Toowoomba (C) - Central 3-14-12-03 116 118 1.72 Toowoomba (C) - Central 3-14-12-04 170 170 0.00 Toowoomba (C) - Central 3-14-12-07 472 475 0.64 Toowoomba (C) - Central 3-14-12-08 505 520 2.97 Toowoomba (C) - Central 3-14-12-09 355 359 1.13 Toowoomba (C) - Central 3-14-12-10 131 136 3.82 Toowoomba (C) - Central 3-14-12-11 200 198 -1.00 Toowoomba (C) - Central 33 9616 9768 1.58 Toowoomba (C) - North-East 3-14-12-01 66 65 -1.52 Toowoomba (C) - North-East 3-14-12-05 131 135 3.05 Toowoomba (C) - North-East 3-14-12-06 248 249 0.40 Toowoomba (C) - North-East 3-14-13-05 326 330 1.23 Toowoomba (C) - North-East 3-14-13-06 437 443 1.37 Toowoomba (C) - North-East 3-14-13-07 320 322 0.62 Toowoomba (C) - North-East 3-14-13-08 207 210 1.45 Toowoomba (C) - North-East 3-14-13-10 359 367 2.23 Toowoomba (C) - North-East 3-14-13-12 314 318 1.27 Toowoomba (C) - North-East 3-14-13-13 146 148 1.37 Toowoomba (C) - North-East 3-14-14-01 66 67 1.52 Toowoomba (C) - North-East 3-14-14-02 368 376 2.17 Toowoomba (C) - North-East 3-14-14-03 0 0 0.00 Toowoomba (C) - North-East 3-14-14-04 504 514 1.98 Toowoomba (C) - North-East 3-14-14-05 442 466 5.43 Toowoomba (C) - North-East 3-14-14-06 332 338 1.81 Toowoomba (C) - North-East 3-14-14-07 426 428 0.47 Toowoomba (C) - North-East 3-14-14-08 410 422 2.93 Toowoomba (C) - North-East 3-14-14-11 389 396 1.80 Toowoomba (C) - North-East 3-14-14-12 307 309 0.65 Toowoomba (C) - North-East 3-14-14-13 346 353 2.02 Toowoomba (C) - North-East 3-14-14-14 238 238 0.00 Toowoomba (C) - North-East 3-14-14-15 0 0 0.00 Toowoomba (C) - North-East 3-14-14-16 409 409 0.00 Toowoomba (C) - North-East 24 6791 6903 1.65 Toowoomba (C) - North-West 3-14-09-07 440 461 4.77 Toowoomba (C) - North-West 3-14-09-09 374 384 2.67 Toowoomba (C) - North-West 3-14-09-12 465 481 3.44 Toowoomba (C) - North-West 3-14-10-01 402 405 0.75 Toowoomba (C) - North-West 3-14-11-01 284 292 2.82 Toowoomba (C) - North-West 3-14-11-02 103 106 2.91

Queensland Redistribution Statistics 2006
Enrolment Projections
----------------------------------------------------------------------------------------------------------------------
87
Groom
---------------------------------------------------------------------------------------------------------------------- SLA Name CCD Number Actual
Enrolment 2/12/2005
Estimate 30/11/2007
Growth (%)
---------------------------------------------------------------------------------------------------------------------- Toowoomba (C) - North-West 3-14-14-09 238 239 0.42 Toowoomba (C) - North-West 3-14-14-10 170 167 -1.76 Toowoomba (C) - North-West 3-14-15-01 344 376 9.30 Toowoomba (C) - North-West 3-14-15-02 14 14 0.00 Toowoomba (C) - North-West 3-14-15-03 556 561 0.90 Toowoomba (C) - North-West 3-14-15-04 575 587 2.09 Toowoomba (C) - North-West 3-14-15-05 301 306 1.66 Toowoomba (C) - North-West 3-14-15-06 239 271 13.39 Toowoomba (C) - North-West 3-14-15-07 316 321 1.58 Toowoomba (C) - North-West 3-14-15-08 476 479 0.63 Toowoomba (C) - North-West 3-14-15-09 433 435 0.46 Toowoomba (C) - North-West 3-14-15-10 387 385 -0.52 Toowoomba (C) - North-West 3-14-15-11 583 608 4.29 Toowoomba (C) - North-West 3-14-15-12 398 410 3.02 Toowoomba (C) - North-West 3-14-15-13 363 368 1.38 Toowoomba (C) - North-West 3-14-15-14 300 305 1.67 Toowoomba (C) - North-West 3-14-15-15 307 314 2.28 Toowoomba (C) - North-West 3-14-15-16 552 585 5.98 Toowoomba (C) - North-West 3-14-16-01 42 44 4.76 Toowoomba (C) - North-West 3-14-16-02 532 549 3.20 Toowoomba (C) - North-West 3-14-16-03 379 377 -0.53 Toowoomba (C) - North-West 3-14-16-04 540 556 2.96 Toowoomba (C) - North-West 3-14-16-05 171 177 3.51 Toowoomba (C) - North-West 3-14-16-06 492 509 3.46 Toowoomba (C) - North-West 3-14-16-07 442 454 2.71 Toowoomba (C) - North-West 3-14-16-08 305 315 3.28 Toowoomba (C) - North-West 3-14-16-09 402 413 2.74 Toowoomba (C) - North-West 3-14-16-10 167 170 1.80 Toowoomba (C) - North-West 3-14-16-11 278 281 1.08 Toowoomba (C) - North-West 35 12370 12705 2.71 Toowoomba (C) - South-East 3-14-05-01 582 622 6.87 Toowoomba (C) - South-East 3-14-05-02 507 533 5.13 Toowoomba (C) - South-East 3-14-05-03 102 105 2.94 Toowoomba (C) - South-East 3-14-05-04 631 693 9.83 Toowoomba (C) - South-East 3-14-05-05 506 527 4.15 Toowoomba (C) - South-East 3-14-05-10 296 333 12.50 Toowoomba (C) - South-East 3-14-05-11 857 1057 23.34 Toowoomba (C) - South-East 3-14-05-12 373 409 9.65 Toowoomba (C) - South-East 3-14-05-13 549 564 2.73 Toowoomba (C) - South-East 3-14-05-16 393 399 1.53 Toowoomba (C) - South-East 3-14-05-17 865 962 11.21 Toowoomba (C) - South-East 3-14-05-18 692 718 3.76 Toowoomba (C) - South-East 3-14-05-19 381 395 3.67 Toowoomba (C) - South-East 3-14-05-20 603 633 4.98 Toowoomba (C) - South-East 3-14-05-21 531 543 2.26

Queensland Redistribution Statistics 2006
Enrolment Projections
----------------------------------------------------------------------------------------------------------------------
88
Groom
---------------------------------------------------------------------------------------------------------------------- SLA Name CCD Number Actual
Enrolment 2/12/2005
Estimate 30/11/2007
Growth (%)
---------------------------------------------------------------------------------------------------------------------- Toowoomba (C) - South-East 3-14-05-22 395 422 6.84 Toowoomba (C) - South-East 3-14-06-07 646 716 10.84 Toowoomba (C) - South-East 3-14-06-08 613 622 1.47 Toowoomba (C) - South-East 3-14-06-09 529 540 2.08 Toowoomba (C) - South-East 3-14-06-10 719 822 14.33 Toowoomba (C) - South-East 3-14-06-11 789 834 5.70 Toowoomba (C) - South-East 3-14-06-12 297 300 1.01 Toowoomba (C) - South-East 3-14-07-05 563 611 8.53 Toowoomba (C) - South-East 3-14-07-06 249 255 2.41 Toowoomba (C) - South-East 3-14-07-07 600 624 4.00 Toowoomba (C) - South-East 3-14-07-10 528 616 16.67 Toowoomba (C) - South-East 3-14-07-14 457 473 3.50 Toowoomba (C) - South-East 3-14-07-16 442 452 2.26 Toowoomba (C) - South-East 3-14-13-01 556 568 2.16 Toowoomba (C) - South-East 3-14-13-02 425 434 2.12 Toowoomba (C) - South-East 3-14-13-03 346 352 1.73 Toowoomba (C) - South-East 3-14-13-04 253 257 1.58 Toowoomba (C) - South-East 3-14-13-09 591 611 3.38 Toowoomba (C) - South-East 3-14-13-11 170 175 2.94 Toowoomba (C) - South-East 34 17036 18177 6.70 Toowoomba (C) - West 3-14-07-01 136 140 2.94 Toowoomba (C) - West 3-14-07-02 262 272 3.82 Toowoomba (C) - West 3-14-07-03 282 294 4.26 Toowoomba (C) - West 3-14-07-04 463 470 1.51 Toowoomba (C) - West 3-14-07-08 477 488 2.31 Toowoomba (C) - West 3-14-07-09 314 320 1.91 Toowoomba (C) - West 3-14-07-11 175 179 2.29 Toowoomba (C) - West 3-14-07-12 437 448 2.52 Toowoomba (C) - West 3-14-07-13 552 562 1.81 Toowoomba (C) - West 3-14-07-15 420 426 1.43 Toowoomba (C) - West 3-14-08-01 215 250 16.28 Toowoomba (C) - West 3-14-08-02 532 550 3.38 Toowoomba (C) - West 3-14-08-03 350 370 5.71 Toowoomba (C) - West 3-14-08-04 330 346 4.85 Toowoomba (C) - West 3-14-08-05 372 390 4.84 Toowoomba (C) - West 3-14-08-06 347 367 5.76 Toowoomba (C) - West 3-14-08-07 521 579 11.13 Toowoomba (C) - West 3-14-08-08 320 451 40.94 Toowoomba (C) - West 3-14-08-09 410 417 1.71 Toowoomba (C) - West 3-14-08-10 331 333 0.60 Toowoomba (C) - West 3-14-08-11 367 368 0.27 Toowoomba (C) - West 3-14-08-12 588 618 5.10 Toowoomba (C) - West 3-14-08-13 450 466 3.56 Toowoomba (C) - West 3-14-09-01 337 344 2.08 Toowoomba (C) - West 3-14-09-02 240 242 0.83

Queensland Redistribution Statistics 2006
Enrolment Projections
----------------------------------------------------------------------------------------------------------------------
89
Groom
---------------------------------------------------------------------------------------------------------------------- SLA Name CCD Number Actual
Enrolment 2/12/2005
Estimate 30/11/2007
Growth (%)
---------------------------------------------------------------------------------------------------------------------- Toowoomba (C) - West 3-14-09-03 418 428 2.39 Toowoomba (C) - West 3-14-09-04 292 304 4.11 Toowoomba (C) - West 3-14-09-05 373 382 2.41 Toowoomba (C) - West 3-14-09-06 398 409 2.76 Toowoomba (C) - West 3-14-09-08 317 326 2.84 Toowoomba (C) - West 3-14-09-10 387 403 4.13 Toowoomba (C) - West 3-14-09-11 621 640 3.06 Toowoomba (C) - West 3-14-09-13 683 711 4.10 Toowoomba (C) - West 3-14-10-05 384 392 2.08 Toowoomba (C) - West 3-14-10-06 508 528 3.94 Toowoomba (C) - West 3-14-10-07 518 538 3.86 Toowoomba (C) - West 3-14-10-08 491 539 9.78 Toowoomba (C) - West 3-14-10-09 127 132 3.94 Toowoomba (C) - West 3-14-10-10 201 209 3.98 Toowoomba (C) - West 39 14946 15631 4.58 Groom 255 89131 93381 4.77
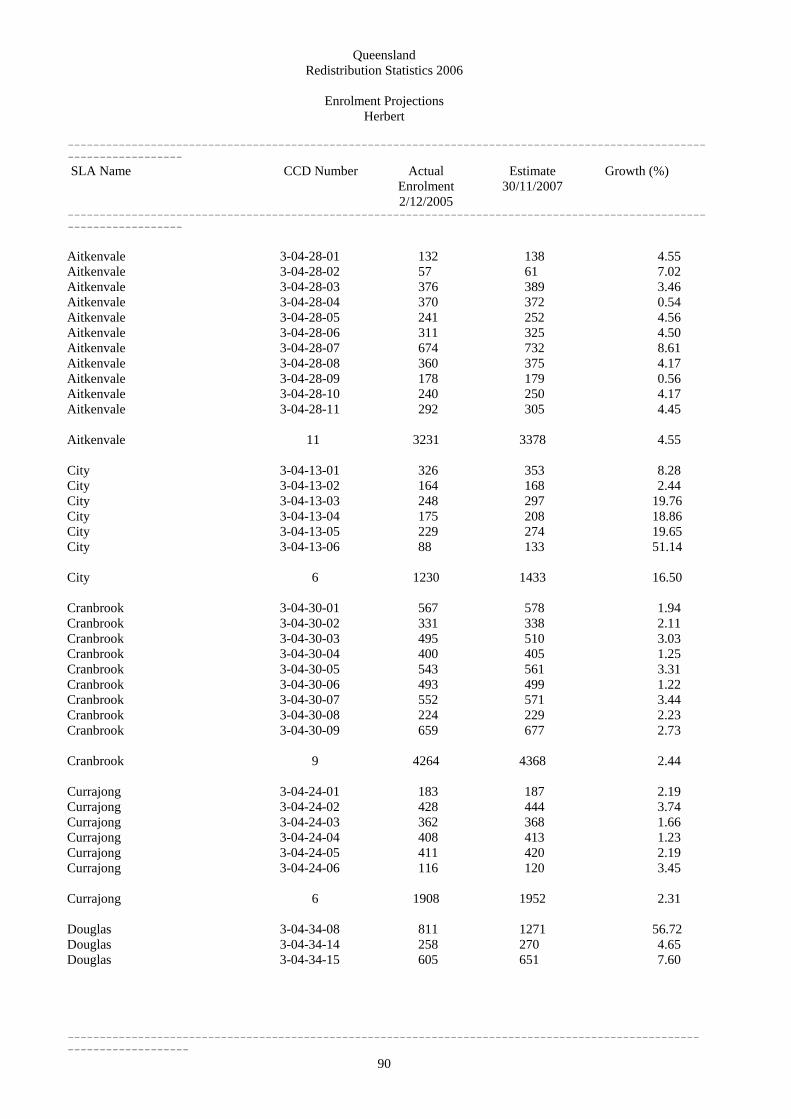
Queensland Redistribution Statistics 2006
Enrolment Projections
----------------------------------------------------------------------------------------------------------------------
90
Herbert
---------------------------------------------------------------------------------------------------------------------- SLA Name CCD Number Actual
Enrolment 2/12/2005
Estimate 30/11/2007
Growth (%)
---------------------------------------------------------------------------------------------------------------------- Aitkenvale 3-04-28-01 132 138 4.55 Aitkenvale 3-04-28-02 57 61 7.02 Aitkenvale 3-04-28-03 376 389 3.46 Aitkenvale 3-04-28-04 370 372 0.54 Aitkenvale 3-04-28-05 241 252 4.56 Aitkenvale 3-04-28-06 311 325 4.50 Aitkenvale 3-04-28-07 674 732 8.61 Aitkenvale 3-04-28-08 360 375 4.17 Aitkenvale 3-04-28-09 178 179 0.56 Aitkenvale 3-04-28-10 240 250 4.17 Aitkenvale 3-04-28-11 292 305 4.45 Aitkenvale 11 3231 3378 4.55 City 3-04-13-01 326 353 8.28 City 3-04-13-02 164 168 2.44 City 3-04-13-03 248 297 19.76 City 3-04-13-04 175 208 18.86 City 3-04-13-05 229 274 19.65 City 3-04-13-06 88 133 51.14 City 6 1230 1433 16.50 Cranbrook 3-04-30-01 567 578 1.94 Cranbrook 3-04-30-02 331 338 2.11 Cranbrook 3-04-30-03 495 510 3.03 Cranbrook 3-04-30-04 400 405 1.25 Cranbrook 3-04-30-05 543 561 3.31 Cranbrook 3-04-30-06 493 499 1.22 Cranbrook 3-04-30-07 552 571 3.44 Cranbrook 3-04-30-08 224 229 2.23 Cranbrook 3-04-30-09 659 677 2.73 Cranbrook 9 4264 4368 2.44 Currajong 3-04-24-01 183 187 2.19 Currajong 3-04-24-02 428 444 3.74 Currajong 3-04-24-03 362 368 1.66 Currajong 3-04-24-04 408 413 1.23 Currajong 3-04-24-05 411 420 2.19 Currajong 3-04-24-06 116 120 3.45 Currajong 6 1908 1952 2.31 Douglas 3-04-34-08 811 1271 56.72 Douglas 3-04-34-14 258 270 4.65 Douglas 3-04-34-15 605 651 7.60
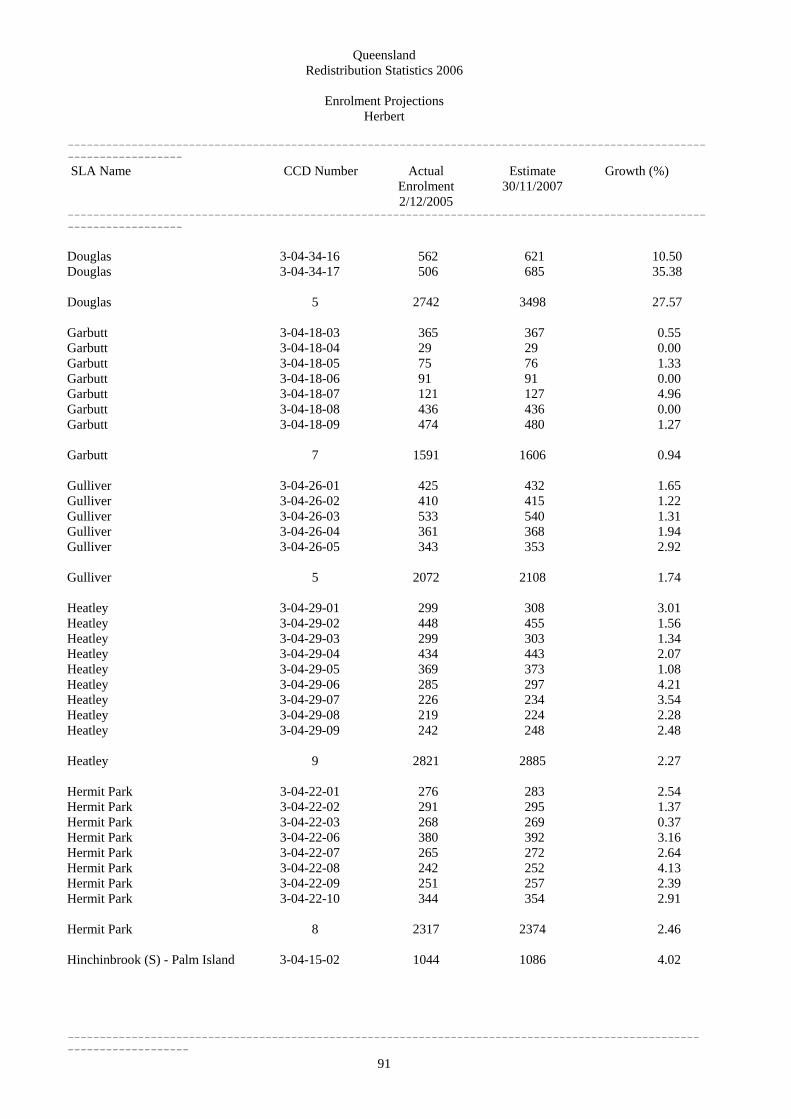
Queensland Redistribution Statistics 2006
Enrolment Projections
----------------------------------------------------------------------------------------------------------------------
91
Herbert
---------------------------------------------------------------------------------------------------------------------- SLA Name CCD Number Actual
Enrolment 2/12/2005
Estimate 30/11/2007
Growth (%)
---------------------------------------------------------------------------------------------------------------------- Douglas 3-04-34-16 562 621 10.50 Douglas 3-04-34-17 506 685 35.38 Douglas 5 2742 3498 27.57 Garbutt 3-04-18-03 365 367 0.55 Garbutt 3-04-18-04 29 29 0.00 Garbutt 3-04-18-05 75 76 1.33 Garbutt 3-04-18-06 91 91 0.00 Garbutt 3-04-18-07 121 127 4.96 Garbutt 3-04-18-08 436 436 0.00 Garbutt 3-04-18-09 474 480 1.27 Garbutt 7 1591 1606 0.94 Gulliver 3-04-26-01 425 432 1.65 Gulliver 3-04-26-02 410 415 1.22 Gulliver 3-04-26-03 533 540 1.31 Gulliver 3-04-26-04 361 368 1.94 Gulliver 3-04-26-05 343 353 2.92 Gulliver 5 2072 2108 1.74 Heatley 3-04-29-01 299 308 3.01 Heatley 3-04-29-02 448 455 1.56 Heatley 3-04-29-03 299 303 1.34 Heatley 3-04-29-04 434 443 2.07 Heatley 3-04-29-05 369 373 1.08 Heatley 3-04-29-06 285 297 4.21 Heatley 3-04-29-07 226 234 3.54 Heatley 3-04-29-08 219 224 2.28 Heatley 3-04-29-09 242 248 2.48 Heatley 9 2821 2885 2.27 Hermit Park 3-04-22-01 276 283 2.54 Hermit Park 3-04-22-02 291 295 1.37 Hermit Park 3-04-22-03 268 269 0.37 Hermit Park 3-04-22-06 380 392 3.16 Hermit Park 3-04-22-07 265 272 2.64 Hermit Park 3-04-22-08 242 252 4.13 Hermit Park 3-04-22-09 251 257 2.39 Hermit Park 3-04-22-10 344 354 2.91 Hermit Park 8 2317 2374 2.46 Hinchinbrook (S) - Palm Island 3-04-15-02 1044 1086 4.02
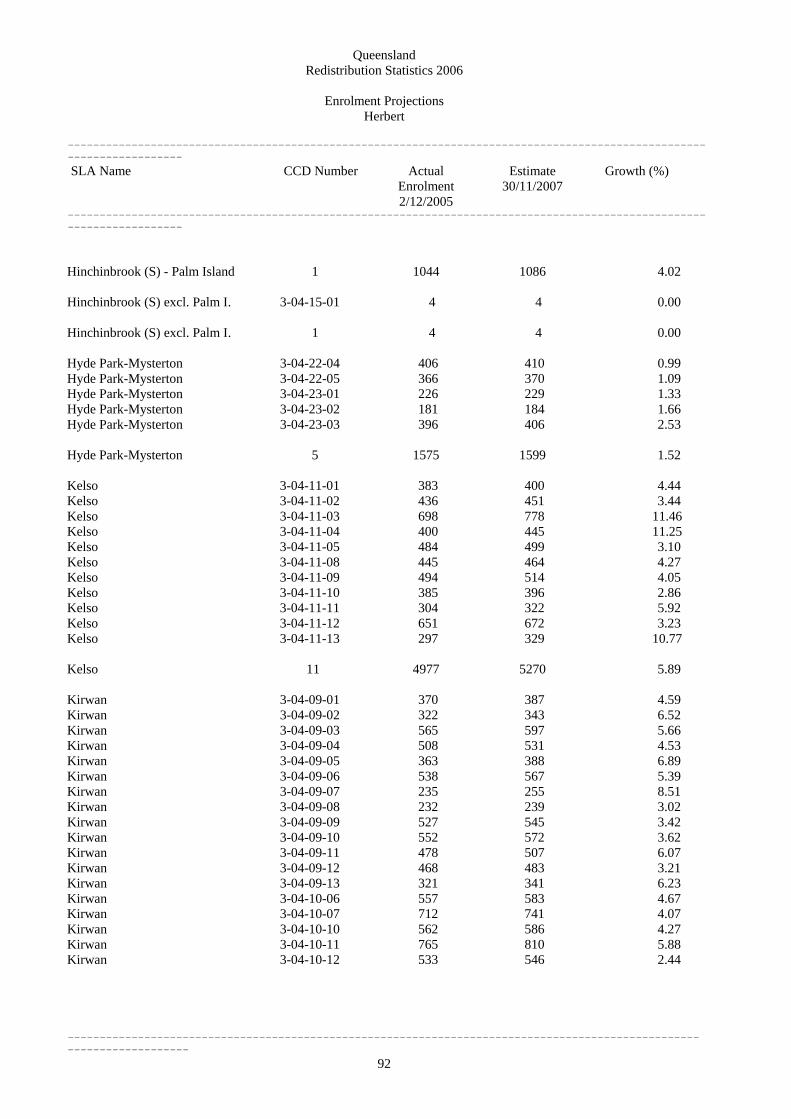
Queensland Redistribution Statistics 2006
Enrolment Projections
----------------------------------------------------------------------------------------------------------------------
92
Kirwan 3-04-10-06 557 583 4.67
Herbert
---------------------------------------------------------------------------------------------------------------------- SLA Name CCD Number Actual
Enrolment 2/12/2005
Estimate 30/11/2007
Growth (%)
---------------------------------------------------------------------------------------------------------------------- Hinchinbrook (S) - Palm Island 1 1044 1086 4.02 Hinchinbrook (S) excl. Palm I. 3-04-15-01 4 4 0.00 Hinchinbrook (S) excl. Palm I. 1 4 4 0.00 Hyde Park-Mysterton 3-04-22-04 406 410 0.99 Hyde Park-Mysterton 3-04-22-05 366 370 1.09 Hyde Park-Mysterton 3-04-23-01 226 229 1.33 Hyde Park-Mysterton 3-04-23-02 181 184 1.66 Hyde Park-Mysterton 3-04-23-03 396 406 2.53 Hyde Park-Mysterton 5 1575 1599 1.52 Kelso 3-04-11-01 383 400 4.44 Kelso 3-04-11-02 436 451 3.44 Kelso 3-04-11-03 698 778 11.46 Kelso 3-04-11-04 400 445 11.25 Kelso 3-04-11-05 484 499 3.10 Kelso 3-04-11-08 445 464 4.27 Kelso 3-04-11-09 494 514 4.05 Kelso 3-04-11-10 385 396 2.86 Kelso 3-04-11-11 304 322 5.92 Kelso 3-04-11-12 651 672 3.23 Kelso 3-04-11-13 297 329 10.77 Kelso 11 4977 5270 5.89 Kirwan 3-04-09-01 370 387 4.59 Kirwan 3-04-09-02 322 343 6.52 Kirwan 3-04-09-03 565 597 5.66 Kirwan 3-04-09-04 508 531 4.53 Kirwan 3-04-09-05 363 388 6.89 Kirwan 3-04-09-06 538 567 5.39 Kirwan 3-04-09-07 235 255 8.51 Kirwan 3-04-09-08 232 239 3.02 Kirwan 3-04-09-09 527 545 3.42 Kirwan 3-04-09-10 552 572 3.62 Kirwan 3-04-09-11 478 507 6.07 Kirwan 3-04-09-12 468 483 3.21 Kirwan 3-04-09-13 321 341 6.23
Kirwan 3-04-10-07 712 741 4.07 Kirwan 3-04-10-10 562 586 4.27 Kirwan 3-04-10-11 765 810 5.88 Kirwan 3-04-10-12 533 546 2.44

Queensland Redistribution Statistics 2006
Enrolment Projections
----------------------------------------------------------------------------------------------------------------------
93
SLA Name
Mundingburra 3-04-27-02 309 318 2.91
Herbert
----------------------------------------------------------------------------------------------------------------------
CCD Number Actual Enrolment 2/12/2005
Estimate 30/11/2007
Growth (%)
---------------------------------------------------------------------------------------------------------------------- Kirwan 3-04-10-13 429 648 51.05 Kirwan 3-04-10-14 219 230 5.02 Kirwan 3-04-10-17 323 343 6.19 Kirwan 3-04-10-18 220 305 38.64 Kirwan 3-04-10-19 430 498 15.81 Kirwan 3-04-10-20 534 574 7.49 Kirwan 3-04-10-21 444 479 7.88 Kirwan 3-04-10-22 697 888 27.40 Kirwan 3-04-10-23 556 587 5.58 Kirwan 3-04-10-24 870 1077 23.79 Kirwan 3-04-10-25 399 436 9.27 Kirwan 3-04-10-26 341 433 26.98 Kirwan 30 14070 15519 10.30 Magnetic Island 3-04-12-01 27 33 22.22 Magnetic Island 3-04-12-02 304 362 19.08 Magnetic Island 3-04-12-03 196 198 1.02 Magnetic Island 3-04-12-04 399 412 3.26 Magnetic Island 3-04-12-05 221 226 2.26 Magnetic Island 3-04-12-06 227 239 5.29
Magnetic Island 6 1374 1470 6.99 Mt Louisa-Mt St John-Bohle 3-04-17-01 394 427 8.38 Mt Louisa-Mt St John-Bohle 3-04-17-02 630 691 9.68 Mt Louisa-Mt St John-Bohle 3-04-17-03 821 1350 64.43 Mt Louisa-Mt St John-Bohle 3-04-17-04 89 96 7.87 Mt Louisa-Mt St John-Bohle 3-04-17-05 288 309 7.29 Mt Louisa-Mt St John-Bohle 3-04-17-06 375 456 21.60 Mt Louisa-Mt St John-Bohle 3-04-17-07 484 537 10.95 Mt Louisa-Mt St John-Bohle 7 3081 3866 25.48
Mundingburra 3-04-27-01 154 161 4.55
Mundingburra 3-04-27-03 267 273 2.25 Mundingburra 3-04-27-04 406 415 2.22 Mundingburra 3-04-27-05 346 348 0.58 Mundingburra 3-04-27-06 291 296 1.72 Mundingburra 3-04-27-07 381 375 -1.57 Mundingburra 3-04-27-08 131 132 0.76 Mundingburra 3-04-27-09 376 383 1.86 Mundingburra 9 2661 2701 1.50
Murray 3-04-34-01 777 791 1.80
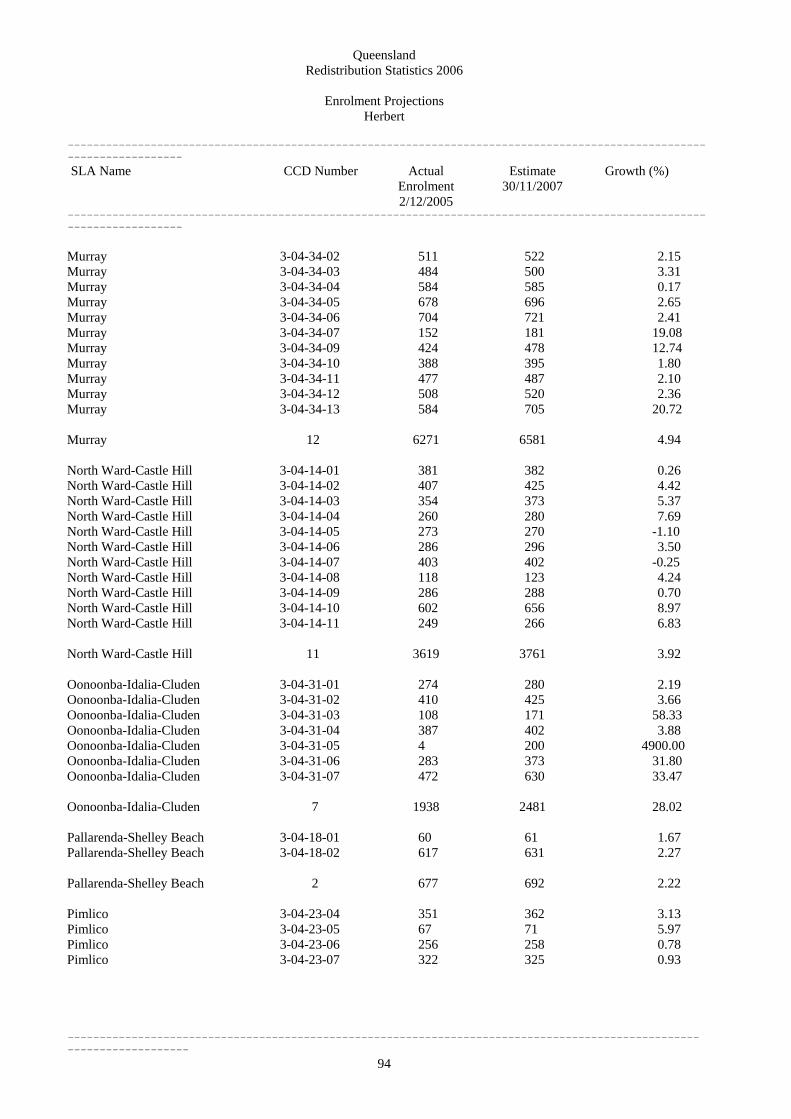
Queensland Redistribution Statistics 2006
Enrolment Projections
----------------------------------------------------------------------------------------------------------------------
94
SLA Name Actual Enrolment 2/12/2005
Herbert
----------------------------------------------------------------------------------------------------------------------
CCD Number Estimate 30/11/2007
Growth (%)
---------------------------------------------------------------------------------------------------------------------- Murray 3-04-34-02 511 522 2.15 Murray 3-04-34-03 484 500 3.31 Murray 3-04-34-04 584 585 0.17 Murray 3-04-34-05 678 696 2.65 Murray 3-04-34-06 704 721 2.41 Murray 3-04-34-07 152 181 19.08 Murray 3-04-34-09 424 478 12.74 Murray 3-04-34-10 388 395 1.80 Murray 3-04-34-11 477 487 2.10 Murray 3-04-34-12 508 520 2.36 Murray 3-04-34-13 584 705 20.72 Murray 12 6271 6581 4.94 North Ward-Castle Hill 3-04-14-01 381 382 0.26 North Ward-Castle Hill 3-04-14-02 407 425 4.42 North Ward-Castle Hill 3-04-14-03 354 373 5.37 North Ward-Castle Hill 3-04-14-04 260 280 7.69 North Ward-Castle Hill 3-04-14-05 273 270 -1.10 North Ward-Castle Hill 3-04-14-06 286 296 3.50 North Ward-Castle Hill 3-04-14-07 403 402 -0.25 North Ward-Castle Hill 3-04-14-08 118 123 4.24 North Ward-Castle Hill 3-04-14-09 286 288 0.70 North Ward-Castle Hill 3-04-14-10 602 656 8.97 North Ward-Castle Hill 3-04-14-11 249 266 6.83
North Ward-Castle Hill 11 3619 3761 3.92 Oonoonba-Idalia-Cluden 3-04-31-01 274 280 2.19 Oonoonba-Idalia-Cluden 3-04-31-02 410 425 3.66 Oonoonba-Idalia-Cluden 3-04-31-03 108 171 58.33 Oonoonba-Idalia-Cluden 3-04-31-04 387 402 3.88 Oonoonba-Idalia-Cluden 3-04-31-05 4 200 4900.00 Oonoonba-Idalia-Cluden 3-04-31-06 283 373 31.80 Oonoonba-Idalia-Cluden 3-04-31-07 472 630 33.47 Oonoonba-Idalia-Cluden 7 1938 2481 28.02 Pallarenda-Shelley Beach 3-04-18-01 60 61 1.67 Pallarenda-Shelley Beach 3-04-18-02 617 631 2.27 Pallarenda-Shelley Beach 2 677 692 2.22 Pimlico 3-04-23-04 351 362 3.13 Pimlico 3-04-23-05 67 71 5.97 Pimlico 3-04-23-06 256 258 0.78 Pimlico 3-04-23-07 322 325 0.93

Queensland Redistribution Statistics 2006
Enrolment Projections
----------------------------------------------------------------------------------------------------------------------
95
SLA Name Actual Enrolment 2/12/2005
South Townsville 3-04-20-02 219 225 2.74
South Townsville 3-04-20-05 125 130 4.00
Herbert
----------------------------------------------------------------------------------------------------------------------
CCD Number Estimate 30/11/2007
Growth (%)
---------------------------------------------------------------------------------------------------------------------- Pimlico 3-04-23-08 258 269 4.26 Pimlico 3-04-23-09 490 511 4.29 Pimlico 6 1744 1796 2.98 Railway Estate 3-04-21-01 281 280 -0.36 Railway Estate 3-04-21-02 186 191 2.69 Railway Estate 3-04-21-03 81 82 1.23 Railway Estate 3-04-21-04 373 383 2.68 Railway Estate 3-04-21-05 297 306 3.03 Railway Estate 3-04-21-06 384 389 1.30 Railway Estate 3-04-21-07 70 68 -2.86 Railway Estate 3-04-21-08 309 312 0.97 Railway Estate 8 1981 2011 1.51 Rosslea 3-04-33-01 234 243 3.85 Rosslea 3-04-33-02 191 197 3.14 Rosslea 3-04-33-03 196 203 3.57 Rosslea 3-04-33-04 175 179 2.29 Rosslea 3-04-33-05 252 259 2.78 Rosslea 5 1048 1081 3.15 Rowes Bay-Belgian Gardens 3-04-16-01 103 102 -0.97 Rowes Bay-Belgian Gardens 3-04-16-02 447 444 -0.67 Rowes Bay-Belgian Gardens 3-04-16-03 294 291 -1.02 Rowes Bay-Belgian Gardens 3-04-16-04 330 331 0.30 Rowes Bay-Belgian Gardens 3-04-16-05 421 425 0.95 Rowes Bay-Belgian Gardens 5 1595 1593 -0.13 South Townsville 3-04-20-01 121 134 10.74
South Townsville 3-04-20-03 227 235 3.52 South Townsville 3-04-20-04 320 334 4.38
South Townsville 3-04-20-06 246 273 10.98 South Townsville 6 1258 1331 5.80 Stuart-Roseneath 3-04-35-01 6 8 33.33 Stuart-Roseneath 3-04-35-02 208 219 5.29 Stuart-Roseneath 3-04-35-03 215 227 5.58 Stuart-Roseneath 3-04-35-04 23 23 0.00
Stuart-Roseneath 4 452 477 5.53

Queensland Redistribution Statistics 2006
Enrolment Projections
----------------------------------------------------------------------------------------------------------------------
96
Townsville (C) - Pt B 3-04-07-03 651 652 0.15
Wulguru 3-04-32-04 265 266 0.38
Herbert
---------------------------------------------------------------------------------------------------------------------- SLA Name CCD Number Actual
Enrolment 2/12/2005
Estimate 30/11/2007
Growth (%)
----------------------------------------------------------------------------------------------------------------------
Thuringowa (C) - Pt A Bal 3-04-10-01 1002 1142 13.97 Thuringowa (C) - Pt A Bal 3-04-10-02 496 523 5.44 Thuringowa (C) - Pt A Bal 3-04-10-03 569 591 3.87 Thuringowa (C) - Pt A Bal 3-04-10-04 470 488 3.83 Thuringowa (C) - Pt A Bal 3-04-10-05 788 843 6.98 Thuringowa (C) - Pt A Bal 3-04-10-08 606 640 5.61 Thuringowa (C) - Pt A Bal 3-04-10-09 534 562 5.24 Thuringowa (C) - Pt A Bal 3-04-10-15 309 406 31.39 Thuringowa (C) - Pt A Bal 3-04-10-16 449 546 21.60 Thuringowa (C) - Pt A Bal 3-04-11-06 386 417 8.03 Thuringowa (C) - Pt A Bal 3-04-11-07 275 295 7.27 Thuringowa (C) - Pt A Bal 11 5884 6453 9.67 Townsville (C) - Pt B 3-04-07-01 199 201 1.01 Townsville (C) - Pt B 3-04-07-02 568 571 0.53
Townsville (C) - Pt B 3-04-07-04 325 328 0.92 Townsville (C) - Pt B 3-04-07-05 305 314 2.95 Townsville (C) - Pt B 3-04-07-06 437 444 1.60 Townsville (C) - Pt B 6 2485 2510 1.01 Vincent 3-04-25-01 392 394 0.51 Vincent 3-04-25-02 251 249 -0.80 Vincent 3-04-25-03 273 275 0.73 Vincent 3-04-25-04 253 252 -0.40 Vincent 3-04-25-05 317 318 0.32 Vincent 5 1486 1488 0.13 West End 3-04-19-01 401 408 1.75 West End 3-04-19-02 433 460 6.24 West End 3-04-19-03 414 440 6.28 West End 3-04-19-04 409 419 2.44 West End 3-04-19-05 323 328 1.55 West End 3-04-19-06 104 114 9.62 West End 3-04-19-07 167 176 5.39 West End 3-04-19-08 125 129 3.20 West End 3-04-19-09 212 213 0.47 West End 9 2588 2687 3.83 Wulguru 3-04-32-01 677 688 1.62 Wulguru 3-04-32-02 439 462 5.24 Wulguru 3-04-32-03 643 673 4.67

Queensland Redistribution Statistics 2006
Enrolment Projections
----------------------------------------------------------------------------------------------------------------------
97
Herbert
---------------------------------------------------------------------------------------------------------------------- SLA Name CCD Number Actual
Enrolment 2/12/2005
Estimate 30/11/2007
Growth (%)
---------------------------------------------------------------------------------------------------------------------- Wulguru 3-04-32-05 471 472 0.21 Wulguru 3-04-32-06 458 472 3.06 Wulguru 3-04-32-07 332 341 2.71 Wulguru 7 3285 3374 2.71 Herbert 240 87273 93433 7.06

Queensland Redistribution Statistics 2006
Enrolment Projections
----------------------------------------------------------------------------------------------------------------------
98
Bundaberg (C) 3-07-09-10 101 103 1.98
Bundaberg (C) 3-07-12-01 45 46 2.22 Bundaberg (C) 3-07-12-02 462 471 1.95
Bundaberg (C) 3-07-12-16 489 525 7.36
Hinkler
---------------------------------------------------------------------------------------------------------------------- SLA Name CCD Number Actual
Enrolment 2/12/2005
Estimate 30/11/2007
Growth (%)
---------------------------------------------------------------------------------------------------------------------- Bundaberg (C) 3-07-09-01 674 689 2.23 Bundaberg (C) 3-07-09-02 869 914 5.18 Bundaberg (C) 3-07-09-03 186 189 1.61 Bundaberg (C) 3-07-09-04 417 419 0.48 Bundaberg (C) 3-07-09-05 688 759 10.32 Bundaberg (C) 3-07-09-06 453 484 6.84 Bundaberg (C) 3-07-09-07 400 404 1.00 Bundaberg (C) 3-07-09-08 244 258 5.74 Bundaberg (C) 3-07-09-09 452 450 -0.44
Bundaberg (C) 3-07-09-11 408 411 0.74
Bundaberg (C) 3-07-12-03 337 359 6.53 Bundaberg (C) 3-07-12-04 338 336 -0.59 Bundaberg (C) 3-07-12-05 102 107 4.90 Bundaberg (C) 3-07-12-06 221 224 1.36 Bundaberg (C) 3-07-12-07 75 76 1.33 Bundaberg (C) 3-07-12-08 240 243 1.25 Bundaberg (C) 3-07-12-09 178 180 1.12 Bundaberg (C) 3-07-12-10 243 244 0.41 Bundaberg (C) 3-07-12-11 93 109 17.20 Bundaberg (C) 3-07-12-12 231 230 -0.43 Bundaberg (C) 3-07-12-13 573 590 2.97 Bundaberg (C) 3-07-12-14 348 353 1.44 Bundaberg (C) 3-07-12-15 281 299 6.41
Bundaberg (C) 3-07-12-17 228 230 0.88 Bundaberg (C) 3-07-12-18 713 766 7.43 Bundaberg (C) 3-07-12-19 424 430 1.42 Bundaberg (C) 3-07-13-01 492 501 1.83 Bundaberg (C) 3-07-13-02 515 534 3.69 Bundaberg (C) 3-07-13-03 241 244 1.24 Bundaberg (C) 3-07-13-04 476 482 1.26 Bundaberg (C) 3-07-13-05 194 200 3.09 Bundaberg (C) 3-07-13-06 506 517 2.17 Bundaberg (C) 3-07-13-07 453 456 0.66 Bundaberg (C) 3-07-13-08 403 405 0.50 Bundaberg (C) 3-07-13-09 438 443 1.14 Bundaberg (C) 3-07-13-10 264 267 1.14 Bundaberg (C) 3-07-13-11 272 275 1.10 Bundaberg (C) 3-07-13-12 578 580 0.35 Bundaberg (C) 3-07-13-13 307 309 0.65 Bundaberg (C) 3-07-13-14 273 282 3.30 Bundaberg (C) 3-07-14-01 327 335 2.45 Bundaberg (C) 3-07-14-02 429 439 2.33 Bundaberg (C) 3-07-14-03 664 712 7.23

Queensland Redistribution Statistics 2006
Enrolment Projections
----------------------------------------------------------------------------------------------------------------------
99
Hinkler
---------------------------------------------------------------------------------------------------------------------- SLA Name CCD Number Actual
Enrolment 2/12/2005
Estimate 30/11/2007
Growth (%)
---------------------------------------------------------------------------------------------------------------------- Bundaberg (C) 3-07-14-04 473 477 0.85 Bundaberg (C) 3-07-14-05 674 723 7.27 Bundaberg (C) 3-07-14-06 168 170 1.19 Bundaberg (C) 3-07-14-07 329 335 1.82 Bundaberg (C) 3-07-14-08 479 499 4.18 Bundaberg (C) 3-07-14-09 393 402 2.29 Bundaberg (C) 3-07-14-10 274 282 2.92 Bundaberg (C) 3-07-14-11 362 384 6.08 Bundaberg (C) 3-07-14-12 360 378 5.00 Bundaberg (C) 3-07-14-13 329 326 -0.91 Bundaberg (C) 3-07-15-01 343 347 1.17 Bundaberg (C) 3-07-15-02 206 210 1.94 Bundaberg (C) 3-07-15-03 342 350 2.34 Bundaberg (C) 3-07-15-04 260 263 1.15 Bundaberg (C) 3-07-15-05 322 321 -0.31 Bundaberg (C) 3-07-15-06 412 412 0.00 Bundaberg (C) 3-07-15-07 237 239 0.84 Bundaberg (C) 3-07-15-08 215 217 0.93 Bundaberg (C) 3-07-15-09 308 309 0.32 Bundaberg (C) 3-07-15-10 262 270 3.05 Bundaberg (C) 3-07-15-11 378 380 0.53 Bundaberg (C) 3-07-15-12 276 278 0.72 Bundaberg (C) 3-07-15-13 292 301 3.08 Bundaberg (C) 3-07-15-14 517 533 3.09 Bundaberg (C) 3-07-16-01 472 483 2.33 Bundaberg (C) 3-07-16-02 557 566 1.62 Bundaberg (C) 3-07-16-03 356 361 1.40 Bundaberg (C) 3-07-16-04 278 276 -0.72 Bundaberg (C) 3-07-16-05 1070 1227 14.67 Bundaberg (C) 3-07-16-06 277 280 1.08 Bundaberg (C) 3-07-16-07 91 95 4.40 Bundaberg (C) 3-07-16-08 350 366 4.57 Bundaberg (C) 3-07-16-09 464 476 2.59 Bundaberg (C) 3-07-16-10 409 412 0.73 Bundaberg (C) 3-07-16-11 279 292 4.66 Bundaberg (C) 3-07-16-12 381 393 3.15 Bundaberg (C) 3-07-16-13 378 394 4.23 Bundaberg (C) 84 30918 31906 3.20 Burnett (S) - Pt A 3-07-08-05 472 495 4.87 Burnett (S) - Pt A 3-07-10-01 445 576 29.44 Burnett (S) - Pt A 3-07-10-02 962 1087 12.99 Burnett (S) - Pt A 3-07-10-04 455 482 5.93 Burnett (S) - Pt A 3-07-10-05 578 658 13.84 Burnett (S) - Pt A 3-07-10-06 79 83 5.06 Burnett (S) - Pt A 3-07-10-07 408 419 2.70

Queensland Redistribution Statistics 2006
Enrolment Projections
----------------------------------------------------------------------------------------------------------------------
100
Burnett (S) - Pt A 3-07-25-08 220 226 2.73
Burnett (S) - Pt B 3-07-11-03 389 399 2.57
Hinkler
---------------------------------------------------------------------------------------------------------------------- SLA Name CCD Number Actual
Enrolment 2/12/2005
Estimate 30/11/2007
Growth (%)
---------------------------------------------------------------------------------------------------------------------- Burnett (S) - Pt A 3-07-10-08 99 107 8.08 Burnett (S) - Pt A 3-07-10-09 130 133 2.31 Burnett (S) - Pt A 3-07-10-10 584 637 9.08 Burnett (S) - Pt A 3-07-10-11 511 575 12.52 Burnett (S) - Pt A 3-07-10-12 386 418 8.29 Burnett (S) - Pt A 3-07-10-13 506 544 7.51 Burnett (S) - Pt A 3-07-25-01 557 579 3.95 Burnett (S) - Pt A 3-07-25-02 241 250 3.73 Burnett (S) - Pt A 3-07-25-03 166 172 3.61 Burnett (S) - Pt A 3-07-25-04 670 732 9.25 Burnett (S) - Pt A 3-07-25-05 261 267 2.30 Burnett (S) - Pt A 3-07-25-06 437 476 8.92 Burnett (S) - Pt A 3-07-25-07 104 129 24.04
Burnett (S) - Pt A 3-07-25-09 595 639 7.39 Burnett (S) - Pt A 3-07-25-10 346 364 5.20
Burnett (S) - Pt A 23 9212 10048 9.08
Burnett (S) - Pt B 3-07-08-01 257 266 3.50 Burnett (S) - Pt B 3-07-08-02 327 338 3.36 Burnett (S) - Pt B 3-07-08-03 176 183 3.98 Burnett (S) - Pt B 3-07-08-04 426 440 3.29 Burnett (S) - Pt B 3-07-08-06 373 390 4.56 Burnett (S) - Pt B 3-07-08-07 195 202 3.59 Burnett (S) - Pt B 3-07-08-08 540 624 15.56 Burnett (S) - Pt B 3-07-08-09 463 496 7.13 Burnett (S) - Pt B 3-07-08-10 463 536 15.77 Burnett (S) - Pt B 3-07-10-03 509 523 2.75 Burnett (S) - Pt B 3-07-11-01 295 300 1.69 Burnett (S) - Pt B 3-07-11-02 139 142 2.16
Burnett (S) - Pt B 3-07-11-04 214 216 0.93 Burnett (S) - Pt B 3-07-11-05 429 444 3.50 Burnett (S) - Pt B 3-07-11-06 499 532 6.61 Burnett (S) - Pt B 3-07-11-07 489 509 4.09 Burnett (S) - Pt B 3-07-11-08 315 330 4.76 Burnett (S) - Pt B 3-07-11-09 504 540 7.14 Burnett (S) - Pt B 3-07-11-10 694 722 4.03 Burnett (S) - Pt B 3-07-11-11 364 383 5.22 Burnett (S) - Pt B 21 8060 8515 5.65 Calliope (S) - Pt A 3-07-01-03 308 317 2.92 Calliope (S) - Pt A 3-07-01-12 336 354 5.36 Calliope (S) - Pt A 3-07-02-01 473 481 1.69 Calliope (S) - Pt A 3-07-02-02 497 522 5.03

Queensland Redistribution Statistics 2006
Enrolment Projections
----------------------------------------------------------------------------------------------------------------------
101
Calliope (S) - Pt B 3-07-01-07 237 244 2.95
Calliope (S) - Pt B 3-07-01-09 20 20 1.63
Hinkler
---------------------------------------------------------------------------------------------------------------------- SLA Name CCD Number Actual
Enrolment 2/12/2005
Estimate 30/11/2007
Growth (%)
---------------------------------------------------------------------------------------------------------------------- Calliope (S) - Pt A 3-07-02-03 7 9 28.57 Calliope (S) - Pt A 3-07-02-04 584 588 0.68 Calliope (S) - Pt A 3-07-02-05 552 590 6.88 Calliope (S) - Pt A 3-07-02-06 83 89 7.23 Calliope (S) - Pt A 3-07-02-07 338 363 7.40 Calliope (S) - Pt A 3-07-02-08 484 499 3.10 Calliope (S) - Pt A 3-07-02-09 451 482 6.87 Calliope (S) - Pt A 3-07-02-10 427 443 3.75 Calliope (S) - Pt A 3-07-02-11 485 544 12.16 Calliope (S) - Pt A 3-07-02-12 533 658 23.45 Calliope (S) - Pt A 3-07-02-13 530 564 6.42 Calliope (S) - Pt A 3-07-02-14 537 568 5.77 Calliope (S) - Pt A 3-07-02-15 456 498 9.21 Calliope (S) - Pt A 3-07-02-16 499 531 6.41 Calliope (S) - Pt A 3-07-02-17 383 393 2.61 Calliope (S) - Pt A 3-07-02-18 336 355 5.65 Calliope (S) - Pt A 20 8299 8848 6.62
Calliope (S) - Pt B 3-07-01-01 146 147 0.68 Calliope (S) - Pt B 3-07-01-02 206 214 3.88 Calliope (S) - Pt B 3-07-01-04 161 162 0.62 Calliope (S) - Pt B 3-07-01-05 243 239 -1.65 Calliope (S) - Pt B 3-07-01-06 149 151 1.34
Calliope (S) - Pt B 3-07-01-08 167 168 0.60
Calliope (S) - Pt B 3-07-01-10 246 250 1.63 Calliope (S) - Pt B 3-07-01-11 100 101 1.00 Calliope (S) - Pt B 3-07-01-13 99 99 0.00 Calliope (S) - Pt B 11 1774 1795 1.18 Eidsvold (S) 3-07-21-01 139 137 -1.44 Eidsvold (S) 3-07-21-02 63 61 -3.17 Eidsvold (S) 3-07-21-03 116 123 6.03 Eidsvold (S) 3-07-21-04 304 305 0.33 Eidsvold (S) 4 622 626 0.64 Gayndah (S) 3-07-24-01 177 178 0.56 Gayndah (S) 3-07-24-02 117 117 0.00 Gayndah (S) 3-07-24-03 88 89 1.14 Gayndah (S) 3-07-24-04 152 152 0.00 Gayndah (S) 3-07-24-05 246 250 1.63 Gayndah (S) 3-07-24-06 447 442 -1.12 Gayndah (S) 3-07-24-07 462 460 -0.43
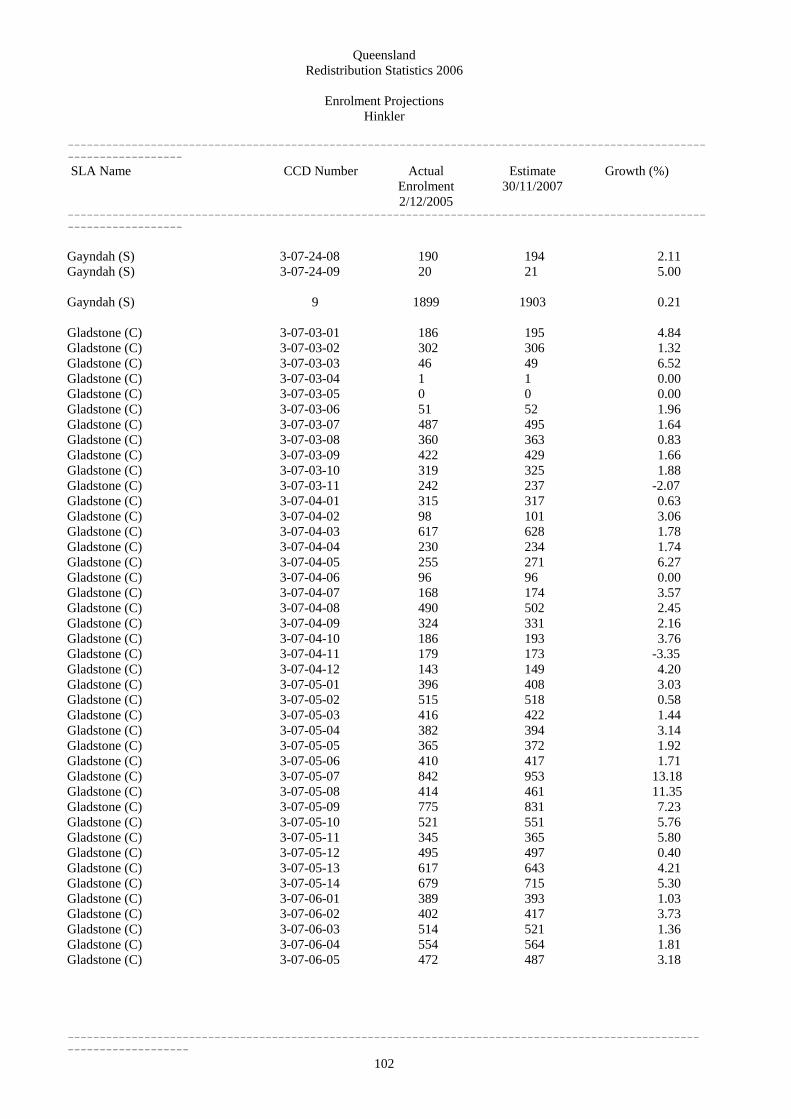
Queensland Redistribution Statistics 2006
Enrolment Projections
----------------------------------------------------------------------------------------------------------------------
102
Gladstone (C) 3-07-04-09 324 331 2.16
Gladstone (C) 3-07-04-11 179 173 -3.35
Hinkler
---------------------------------------------------------------------------------------------------------------------- SLA Name CCD Number Actual
Enrolment 2/12/2005
Estimate 30/11/2007
Growth (%)
---------------------------------------------------------------------------------------------------------------------- Gayndah (S) 3-07-24-08 190 194 2.11 Gayndah (S) 3-07-24-09 20 21 5.00 Gayndah (S) 9 1899 1903 0.21 Gladstone (C) 3-07-03-01 186 195 4.84 Gladstone (C) 3-07-03-02 302 306 1.32 Gladstone (C) 3-07-03-03 46 49 6.52 Gladstone (C) 3-07-03-04 1 1 0.00 Gladstone (C) 3-07-03-05 0 0 0.00 Gladstone (C) 3-07-03-06 51 52 1.96 Gladstone (C) 3-07-03-07 487 495 1.64 Gladstone (C) 3-07-03-08 360 363 0.83 Gladstone (C) 3-07-03-09 422 429 1.66 Gladstone (C) 3-07-03-10 319 325 1.88 Gladstone (C) 3-07-03-11 242 237 -2.07 Gladstone (C) 3-07-04-01 315 317 0.63 Gladstone (C) 3-07-04-02 98 101 3.06 Gladstone (C) 3-07-04-03 617 628 1.78 Gladstone (C) 3-07-04-04 230 234 1.74 Gladstone (C) 3-07-04-05 255 271 6.27 Gladstone (C) 3-07-04-06 96 96 0.00 Gladstone (C) 3-07-04-07 168 174 3.57 Gladstone (C) 3-07-04-08 490 502 2.45
Gladstone (C) 3-07-04-10 186 193 3.76
Gladstone (C) 3-07-04-12 143 149 4.20 Gladstone (C) 3-07-05-01 396 408 3.03 Gladstone (C) 3-07-05-02 515 518 0.58 Gladstone (C) 3-07-05-03 416 422 1.44 Gladstone (C) 3-07-05-04 382 394 3.14 Gladstone (C) 3-07-05-05 365 372 1.92 Gladstone (C) 3-07-05-06 410 417 1.71 Gladstone (C) 3-07-05-07 842 953 13.18 Gladstone (C) 3-07-05-08 414 461 11.35 Gladstone (C) 3-07-05-09 775 831 7.23 Gladstone (C) 3-07-05-10 521 551 5.76 Gladstone (C) 3-07-05-11 345 365 5.80 Gladstone (C) 3-07-05-12 495 497 0.40 Gladstone (C) 3-07-05-13 617 643 4.21 Gladstone (C) 3-07-05-14 679 715 5.30 Gladstone (C) 3-07-06-01 389 393 1.03 Gladstone (C) 3-07-06-02 402 417 3.73 Gladstone (C) 3-07-06-03 514 521 1.36 Gladstone (C) 3-07-06-04 554 564 1.81 Gladstone (C) 3-07-06-05 472 487 3.18

Queensland Redistribution Statistics 2006
Enrolment Projections
----------------------------------------------------------------------------------------------------------------------
103
Isis (S) 3-07-17-13 253 255 0.79
Isis (S) 3-07-17-15 280 295 5.36
Kolan (S) 3-07-19-09 360 367 1.94
Kolan (S) 3-07-19-11 372 375 0.81
Hinkler
---------------------------------------------------------------------------------------------------------------------- SLA Name CCD Number Actual
Enrolment 2/12/2005
Estimate 30/11/2007
Growth (%)
---------------------------------------------------------------------------------------------------------------------- Gladstone (C) 3-07-06-06 526 544 3.42 Gladstone (C) 3-07-06-07 528 564 6.82 Gladstone (C) 3-07-06-08 261 325 24.52 Gladstone (C) 3-07-06-09 184 185 0.54 Gladstone (C) 3-07-06-10 524 531 1.34 Gladstone (C) 3-07-06-11 151 152 0.66 Gladstone (C) 3-07-06-12 365 368 0.82 Gladstone (C) 3-07-06-13 330 352 6.67 Gladstone (C) 3-07-06-14 252 259 2.78 Gladstone (C) 51 18141 18830 3.80 Isis (S) 3-07-17-01 143 145 1.40 Isis (S) 3-07-17-02 250 256 2.40 Isis (S) 3-07-17-03 191 197 3.14 Isis (S) 3-07-17-04 305 303 -0.66 Isis (S) 3-07-17-05 316 334 5.70 Isis (S) 3-07-17-06 353 363 2.83 Isis (S) 3-07-17-07 477 484 1.47 Isis (S) 3-07-17-08 191 190 -0.52 Isis (S) 3-07-17-09 401 406 1.25 Isis (S) 3-07-17-10 223 227 1.79 Isis (S) 3-07-17-11 190 192 1.05 Isis (S) 3-07-17-12 107 112 4.67
Isis (S) 3-07-17-14 154 169 9.74
Isis (S) 3-07-17-16 159 188 18.24 Isis (S) 3-07-17-17 299 305 2.01 Isis (S) 17 4292 4421 3.01 Kolan (S) 3-07-19-01 120 117 -2.50 Kolan (S) 3-07-19-02 435 437 0.46 Kolan (S) 3-07-19-03 69 71 2.90 Kolan (S) 3-07-19-04 354 350 -1.13 Kolan (S) 3-07-19-05 353 353 0.00 Kolan (S) 3-07-19-06 209 210 0.48 Kolan (S) 3-07-19-07 209 209 0.00 Kolan (S) 3-07-19-08 117 115 -1.71
Kolan (S) 3-07-19-10 392 389 -0.77
Kolan (S) 11 2990 2993 0.10 Miriam Vale (S) 3-07-07-01 213 214 0.47

Queensland Redistribution Statistics 2006
Enrolment Projections
----------------------------------------------------------------------------------------------------------------------
104
Monto (S) 3-07-18-05 111 112 0.90
Monto (S) 3-07-18-07 241 238 -1.24
Mundubbera (S) 3-07-20-03 168 164 -2.38 Mundubbera (S) 3-07-20-04 191 194 1.57
Hinkler
---------------------------------------------------------------------------------------------------------------------- SLA Name CCD Number Actual
Enrolment 2/12/2005
Estimate 30/11/2007
Growth (%)
---------------------------------------------------------------------------------------------------------------------- Miriam Vale (S) 3-07-07-02 270 280 3.70 Miriam Vale (S) 3-07-07-03 76 81 6.58 Miriam Vale (S) 3-07-07-04 395 414 4.81 Miriam Vale (S) 3-07-07-05 408 422 3.43 Miriam Vale (S) 3-07-07-06 169 175 3.55 Miriam Vale (S) 3-07-07-07 208 214 2.88 Miriam Vale (S) 3-07-07-08 108 114 5.56 Miriam Vale (S) 3-07-07-09 211 224 6.16 Miriam Vale (S) 3-07-07-10 100 113 13.00 Miriam Vale (S) 3-07-07-11 133 151 13.53 Miriam Vale (S) 3-07-07-12 294 351 19.39 Miriam Vale (S) 3-07-07-13 281 367 30.60 Miriam Vale (S) 3-07-07-14 230 285 23.91 Miriam Vale (S) 3-07-07-15 33 32 -3.03 Miriam Vale (S) 3-07-07-16 94 95 1.06 Miriam Vale (S) 3-07-07-17 116 117 0.86 Miriam Vale (S) 3-07-08-11 1 1 0.00 Miriam Vale (S) 18 3340 3650 9.28 Monto (S) 3-07-18-01 82 79 -3.66 Monto (S) 3-07-18-02 224 223 -0.45 Monto (S) 3-07-18-03 156 150 -3.85 Monto (S) 3-07-18-04 136 138 1.47
Monto (S) 3-07-18-06 66 63 -4.55
Monto (S) 3-07-18-08 332 327 -1.51 Monto (S) 3-07-18-09 453 449 -0.88 Monto (S) 9 1801 1779 -1.22 Mundubbera (S) 3-07-20-01 192 192 0.00 Mundubbera (S) 3-07-20-02 476 471 -1.05
Mundubbera (S) 3-07-20-05 65 67 3.08 Mundubbera (S) 3-07-20-06 57 56 -1.75 Mundubbera (S) 3-07-20-07 33 34 3.03 Mundubbera (S) 3-07-20-08 240 239 -0.42 Mundubbera (S) 8 1422 1417 -0.35 Perry (S) 3-07-22-01 173 172 -0.58 Perry (S) 3-07-22-02 121 122 0.83 Perry (S) 2 294 294 0.00

Queensland Redistribution Statistics 2006
Enrolment Projections
----------------------------------------------------------------------------------------------------------------------
105
Hinkler
---------------------------------------------------------------------------------------------------------------------- SLA Name CCD Number Actual
Enrolment 2/12/2005
Estimate 30/11/2007
Growth (%)
---------------------------------------------------------------------------------------------------------------------- Hinkler 288 93064 97025 4.26

Queensland Redistribution Statistics 2006
Enrolment Projections
----------------------------------------------------------------------------------------------------------------------
106
Atherton (S) 3-03-05-07 278 287 3.24
Atherton (S) 3-03-06-08 324 337 4.01
Atherton (S) 3-03-06-10 242 247 2.07
Kennedy
---------------------------------------------------------------------------------------------------------------------- SLA Name CCD Number Actual
Enrolment 2/12/2005
Estimate 30/11/2007
Growth (%)
---------------------------------------------------------------------------------------------------------------------- Atherton (S) 3-03-05-01 394 408 3.55 Atherton (S) 3-03-05-02 115 120 4.35 Atherton (S) 3-03-05-03 146 149 2.05 Atherton (S) 3-03-05-04 184 195 5.98 Atherton (S) 3-03-05-05 256 261 1.95 Atherton (S) 3-03-05-06 597 625 4.69
Atherton (S) 3-03-05-08 175 187 6.86 Atherton (S) 3-03-05-09 200 242 21.00 Atherton (S) 3-03-05-10 391 412 5.37 Atherton (S) 3-03-05-11 191 200 4.71 Atherton (S) 3-03-06-01 544 559 2.76 Atherton (S) 3-03-06-02 275 286 4.00 Atherton (S) 3-03-06-03 293 296 1.02 Atherton (S) 3-03-06-04 414 429 3.62 Atherton (S) 3-03-06-05 342 347 1.46 Atherton (S) 3-03-06-06 273 281 2.93 Atherton (S) 3-03-06-07 167 169 1.20
Atherton (S) 3-03-06-09 310 313 0.97
Atherton (S) 3-03-06-11 111 114 2.70 Atherton (S) 3-03-06-12 341 349 2.35 Atherton (S) 3-03-06-13 256 279 8.98 Atherton (S) 3-03-06-14 299 304 1.67 Atherton (S) 25 7118 7396 3.91 Boulia (S) 3-02-13-01 41 41 0.00 Boulia (S) 3-02-13-02 167 163 -2.40 Boulia (S) 3-02-13-03 11 10 -9.09 Boulia (S) 3-02-13-04 25 26 4.00 Boulia (S) 3-02-13-05 59 54 -8.47 Boulia (S) 5 303 294 -2.97 Burke (S) 3-02-05-01 15 14 -6.67 Burke (S) 3-02-05-02 25 27 8.00 Burke (S) 3-02-05-03 103 97 -5.83 Burke (S) 3-02-05-04 59 62 5.08 Burke (S) 3-02-05-05 544 563 3.49 Burke (S) 3-02-05-06 0 0 0.00 Burke (S) 3-02-05-07 8 7 -12.50 Burke (S) 7 754 770 2.12 Cairns (C) - Pt B 3-01-20-01 0 0 0.00

Queensland Redistribution Statistics 2006
Enrolment Projections
----------------------------------------------------------------------------------------------------------------------
107
Kennedy
---------------------------------------------------------------------------------------------------------------------- SLA Name CCD Number Actual
Enrolment 2/12/2005
Estimate 30/11/2007
Growth (%)
---------------------------------------------------------------------------------------------------------------------- Cairns (C) - Pt B 3-01-20-02 153 154 0.65 Cairns (C) - Pt B 3-01-20-05 137 134 -2.19 Cairns (C) - Pt B 3-01-20-09 221 225 1.81 Cairns (C) - Pt B 3-01-20-10 58 59 1.72 Cairns (C) - Pt B 3-01-22-06 53 54 1.89 Cairns (C) - Pt B 3-01-22-17 92 95 3.26 Cairns (C) - Pt B 3-01-23-02 210 209 -0.48 Cairns (C) - Pt B 3-01-23-03 216 217 0.46 Cairns (C) - Pt B 3-01-23-04 246 246 0.00 Cairns (C) - Pt B 3-01-23-05 319 323 1.25 Cairns (C) - Pt B 3-01-23-06 175 177 1.14 Cairns (C) - Pt B 3-01-23-07 297 298 0.34 Cairns (C) - Pt B 3-01-23-08 200 202 1.00 Cairns (C) - Pt B 3-01-23-09 325 325 0.00 Cairns (C) - Pt B 3-01-23-10 87 88 1.15 Cairns (C) - Pt B 3-01-23-11 112 114 1.79 Cairns (C) - Pt B 17 2901 2920 0.65
Cairns (C) - Trinity 3-01-22-01 78 84 7.69 Cairns (C) - Trinity 3-01-22-04 292 309 5.82 Cairns (C) - Trinity 3-01-22-05 175 181 3.43 Cairns (C) - Trinity 3-01-22-07 411 425 3.41 Cairns (C) - Trinity 3-01-22-08 662 681 2.87 Cairns (C) - Trinity 3-01-22-09 257 261 1.56 Cairns (C) - Trinity 3-01-22-10 145 151 4.14 Cairns (C) - Trinity 3-01-22-11 51 53 3.92 Cairns (C) - Trinity 3-01-22-15 324 378 16.67 Cairns (C) - Trinity 3-01-22-16 568 585 2.99 Cairns (C) - Trinity 3-01-22-19 2 6 200.00 Cairns (C) - Trinity 3-01-22-22 277 286 3.25 Cairns (C) - Trinity 12 3242 3400 4.87
Cardwell (S) 3-04-01-01 347 357 2.88 Cardwell (S) 3-04-01-02 482 500 3.73 Cardwell (S) 3-04-01-03 476 489 2.73 Cardwell (S) 3-04-01-04 280 288 2.86 Cardwell (S) 3-04-01-05 480 493 2.71 Cardwell (S) 3-04-01-06 208 213 2.40 Cardwell (S) 3-04-01-07 290 319 10.00 Cardwell (S) 3-04-01-08 383 408 6.53 Cardwell (S) 3-04-01-09 12 12 0.00 Cardwell (S) 3-04-01-10 393 409 4.07 Cardwell (S) 3-04-01-11 42 41 -2.38 Cardwell (S) 3-04-01-12 278 325 16.91 Cardwell (S) 3-04-02-01 180 179 -0.56

Queensland Redistribution Statistics 2006
Enrolment Projections
----------------------------------------------------------------------------------------------------------------------
108
Carpentaria (S) 3-02-02-07 353 382 8.22
Kennedy
---------------------------------------------------------------------------------------------------------------------- SLA Name CCD Number Actual
Enrolment 2/12/2005
Estimate 30/11/2007
Growth (%)
---------------------------------------------------------------------------------------------------------------------- Cardwell (S) 3-04-02-02 264 280 6.06 Cardwell (S) 3-04-02-03 105 105 0.00 Cardwell (S) 3-04-02-04 309 314 1.62 Cardwell (S) 3-04-02-05 448 463 3.35 Cardwell (S) 3-04-02-06 316 331 4.75 Cardwell (S) 3-04-02-07 479 510 6.47 Cardwell (S) 3-04-02-08 31 34 9.68 Cardwell (S) 3-04-02-09 61 61 0.00 Cardwell (S) 21 5864 6131 4.55 Carpentaria (S) 3-02-02-01 13 14 7.69 Carpentaria (S) 3-02-02-03 35 35 0.00 Carpentaria (S) 3-02-02-04 759 767 1.05 Carpentaria (S) 3-02-02-05 15 15 0.00
Carpentaria (S) 3-02-02-08 23 23 0.00 Carpentaria (S) 3-02-02-09 36 37 2.78 Carpentaria (S) 7 1234 1273 3.16 Charters Towers (C) 3-03-14-01 491 493 0.41 Charters Towers (C) 3-03-14-02 608 607 -0.16 Charters Towers (C) 3-03-14-03 440 444 0.91 Charters Towers (C) 3-03-14-04 298 302 1.34 Charters Towers (C) 3-03-14-05 196 198 1.02 Charters Towers (C) 3-03-14-06 270 268 -0.74 Charters Towers (C) 3-03-14-07 206 202 -1.94 Charters Towers (C) 3-03-14-08 184 186 1.09 Charters Towers (C) 3-03-14-09 490 485 -1.02 Charters Towers (C) 3-03-14-10 219 218 -0.46 Charters Towers (C) 3-03-14-11 450 450 0.00 Charters Towers (C) 3-03-14-12 197 201 2.03 Charters Towers (C) 3-03-14-13 381 379 -0.52 Charters Towers (C) 3-03-14-14 344 346 0.58 Charters Towers (C) 14 4774 4779 0.10 Cloncurry (S) 3-02-10-01 81 81 0.00 Cloncurry (S) 3-02-10-02 29 29 0.00 Cloncurry (S) 3-02-10-03 77 78 1.30 Cloncurry (S) 3-02-10-04 107 111 3.74 Cloncurry (S) 3-02-10-05 64 66 3.12 Cloncurry (S) 3-02-10-06 400 408 2.00 Cloncurry (S) 3-02-10-07 595 622 4.54 Cloncurry (S) 3-02-10-08 179 180 0.56 Cloncurry (S) 3-02-10-09 202 207 2.48
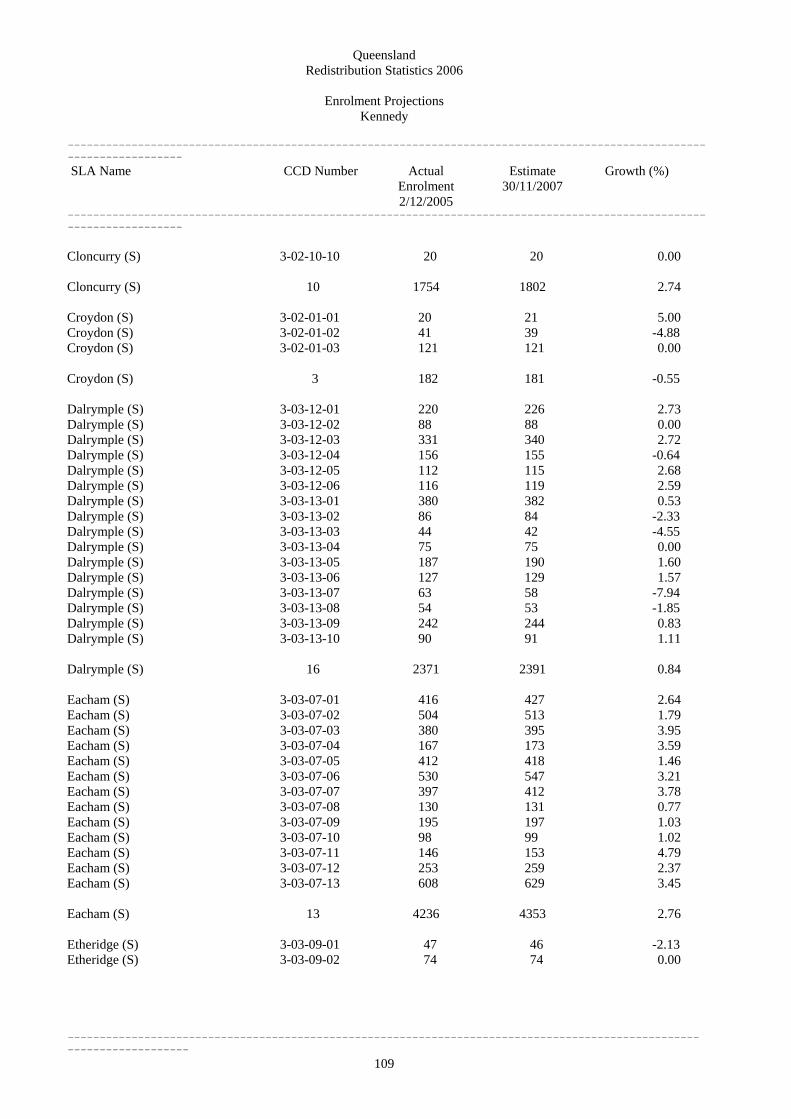
Queensland Redistribution Statistics 2006
Enrolment Projections
----------------------------------------------------------------------------------------------------------------------
109
Dalrymple (S) 3-03-12-06 116 119 2.59
Kennedy
---------------------------------------------------------------------------------------------------------------------- SLA Name CCD Number Actual
Enrolment 2/12/2005
Estimate 30/11/2007
Growth (%)
---------------------------------------------------------------------------------------------------------------------- Cloncurry (S) 3-02-10-10 20 20 0.00 Cloncurry (S) 10 1754 1802 2.74 Croydon (S) 3-02-01-01 20 21 5.00 Croydon (S) 3-02-01-02 41 39 -4.88 Croydon (S) 3-02-01-03 121 121 0.00 Croydon (S) 3 182 181 -0.55 Dalrymple (S) 3-03-12-01 220 226 2.73 Dalrymple (S) 3-03-12-02 88 88 0.00 Dalrymple (S) 3-03-12-03 331 340 2.72 Dalrymple (S) 3-03-12-04 156 155 -0.64 Dalrymple (S) 3-03-12-05 112 115 2.68
Dalrymple (S) 3-03-13-01 380 382 0.53 Dalrymple (S) 3-03-13-02 86 84 -2.33 Dalrymple (S) 3-03-13-03 44 42 -4.55 Dalrymple (S) 3-03-13-04 75 75 0.00 Dalrymple (S) 3-03-13-05 187 190 1.60 Dalrymple (S) 3-03-13-06 127 129 1.57 Dalrymple (S) 3-03-13-07 63 58 -7.94 Dalrymple (S) 3-03-13-08 54 53 -1.85 Dalrymple (S) 3-03-13-09 242 244 0.83 Dalrymple (S) 3-03-13-10 90 91 1.11 Dalrymple (S) 16 2371 2391 0.84 Eacham (S) 3-03-07-01 416 427 2.64 Eacham (S) 3-03-07-02 504 513 1.79 Eacham (S) 3-03-07-03 380 395 3.95 Eacham (S) 3-03-07-04 167 173 3.59 Eacham (S) 3-03-07-05 412 418 1.46 Eacham (S) 3-03-07-06 530 547 3.21 Eacham (S) 3-03-07-07 397 412 3.78 Eacham (S) 3-03-07-08 130 131 0.77 Eacham (S) 3-03-07-09 195 197 1.03 Eacham (S) 3-03-07-10 98 99 1.02 Eacham (S) 3-03-07-11 146 153 4.79 Eacham (S) 3-03-07-12 253 259 2.37 Eacham (S) 3-03-07-13 608 629 3.45 Eacham (S) 13 4236 4353 2.76 Etheridge (S) 3-03-09-01 47 46 -2.13 Etheridge (S) 3-03-09-02 74 74 0.00

Queensland Redistribution Statistics 2006
Enrolment Projections
----------------------------------------------------------------------------------------------------------------------
110
Herberton (S) 11 3269 3362 2.84
Kennedy
---------------------------------------------------------------------------------------------------------------------- SLA Name CCD Number Actual
Enrolment 2/12/2005
Estimate 30/11/2007
Growth (%)
---------------------------------------------------------------------------------------------------------------------- Etheridge (S) 3-03-09-03 24 26 8.33 Etheridge (S) 3-03-09-04 68 68 0.00 Etheridge (S) 3-03-09-05 148 143 -3.38 Etheridge (S) 3-03-09-06 40 41 2.50 Etheridge (S) 3-03-09-07 102 100 -1.96 Etheridge (S) 3-03-09-08 31 33 6.45 Etheridge (S) 8 534 531 -0.56 Flinders (S) 3-03-10-01 50 49 -2.00 Flinders (S) 3-03-10-02 57 63 10.53 Flinders (S) 3-03-10-03 263 250 -4.94 Flinders (S) 3-03-10-04 77 80 3.90 Flinders (S) 3-03-10-05 139 135 -2.88 Flinders (S) 3-03-10-06 301 284 -5.65 Flinders (S) 3-03-10-07 106 108 1.89 Flinders (S) 3-03-11-01 56 58 3.57 Flinders (S) 3-03-11-02 56 55 -1.79 Flinders (S) 3-03-11-03 65 63 -3.08 Flinders (S) 3-03-11-04 53 52 -1.89 Flinders (S) 3-03-11-05 31 29 -6.45 Flinders (S) 12 1254 1226 -2.23 Herberton (S) 3-03-08-01 363 377 3.86 Herberton (S) 3-03-08-02 580 593 2.24 Herberton (S) 3-03-08-03 435 445 2.30 Herberton (S) 3-03-08-04 254 259 1.97 Herberton (S) 3-03-08-05 302 309 2.32 Herberton (S) 3-03-08-06 41 42 2.44 Herberton (S) 3-03-08-07 291 294 1.03 Herberton (S) 3-03-08-08 57 59 3.51 Herberton (S) 3-03-08-09 217 225 3.69 Herberton (S) 3-03-08-10 314 323 2.87 Herberton (S) 3-03-08-11 415 436 5.06
Hinchinbrook (S) excl. Palm I. 3-04-03-01 102 102 0.00 Hinchinbrook (S) excl. Palm I. 3-04-03-02 128 124 -3.12 Hinchinbrook (S) excl. Palm I. 3-04-03-03 167 167 0.00 Hinchinbrook (S) excl. Palm I. 3-04-03-04 137 136 -0.73 Hinchinbrook (S) excl. Palm I. 3-04-03-05 158 158 0.00 Hinchinbrook (S) excl. Palm I. 3-04-03-06 210 211 0.48 Hinchinbrook (S) excl. Palm I. 3-04-03-07 63 63 0.00 Hinchinbrook (S) excl. Palm I. 3-04-03-08 184 177 -3.80 Hinchinbrook (S) excl. Palm I. 3-04-03-09 124 125 0.81
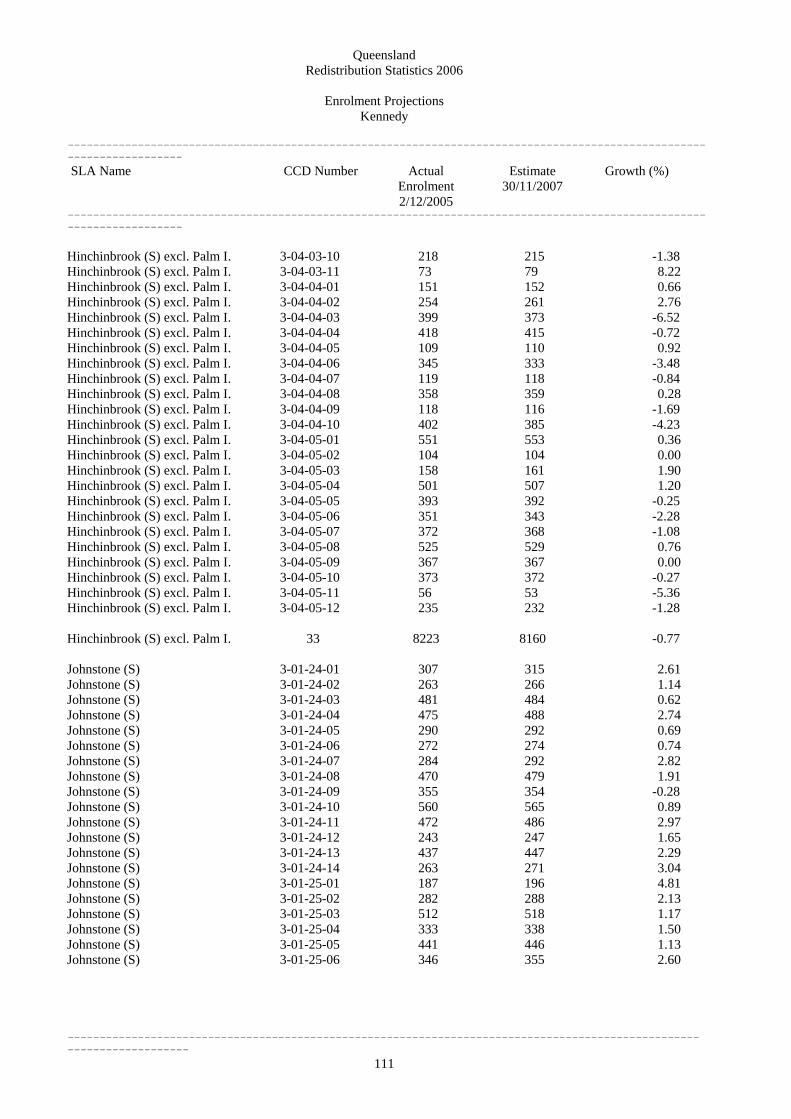
Queensland Redistribution Statistics 2006
Enrolment Projections
----------------------------------------------------------------------------------------------------------------------
111
Kennedy
---------------------------------------------------------------------------------------------------------------------- SLA Name CCD Number Actual
Enrolment 2/12/2005
Estimate 30/11/2007
Growth (%)
---------------------------------------------------------------------------------------------------------------------- Hinchinbrook (S) excl. Palm I. 3-04-03-10 218 215 -1.38 Hinchinbrook (S) excl. Palm I. 3-04-03-11 73 79 8.22 Hinchinbrook (S) excl. Palm I. 3-04-04-01 151 152 0.66 Hinchinbrook (S) excl. Palm I. 3-04-04-02 254 261 2.76 Hinchinbrook (S) excl. Palm I. 3-04-04-03 399 373 -6.52 Hinchinbrook (S) excl. Palm I. 3-04-04-04 418 415 -0.72 Hinchinbrook (S) excl. Palm I. 3-04-04-05 109 110 0.92 Hinchinbrook (S) excl. Palm I. 3-04-04-06 345 333 -3.48 Hinchinbrook (S) excl. Palm I. 3-04-04-07 119 118 -0.84 Hinchinbrook (S) excl. Palm I. 3-04-04-08 358 359 0.28 Hinchinbrook (S) excl. Palm I. 3-04-04-09 118 116 -1.69 Hinchinbrook (S) excl. Palm I. 3-04-04-10 402 385 -4.23 Hinchinbrook (S) excl. Palm I. 3-04-05-01 551 553 0.36 Hinchinbrook (S) excl. Palm I. 3-04-05-02 104 104 0.00 Hinchinbrook (S) excl. Palm I. 3-04-05-03 158 161 1.90 Hinchinbrook (S) excl. Palm I. 3-04-05-04 501 507 1.20 Hinchinbrook (S) excl. Palm I. 3-04-05-05 393 392 -0.25 Hinchinbrook (S) excl. Palm I. 3-04-05-06 351 343 -2.28 Hinchinbrook (S) excl. Palm I. 3-04-05-07 372 368 -1.08 Hinchinbrook (S) excl. Palm I. 3-04-05-08 525 529 0.76 Hinchinbrook (S) excl. Palm I. 3-04-05-09 367 367 0.00 Hinchinbrook (S) excl. Palm I. 3-04-05-10 373 372 -0.27 Hinchinbrook (S) excl. Palm I. 3-04-05-11 56 53 -5.36 Hinchinbrook (S) excl. Palm I. 3-04-05-12 235 232 -1.28 Hinchinbrook (S) excl. Palm I. 33 8223 8160 -0.77 Johnstone (S) 3-01-24-01 307 315 2.61 Johnstone (S) 3-01-24-02 263 266 1.14 Johnstone (S) 3-01-24-03 481 484 0.62 Johnstone (S) 3-01-24-04 475 488 2.74 Johnstone (S) 3-01-24-05 290 292 0.69 Johnstone (S) 3-01-24-06 272 274 0.74 Johnstone (S) 3-01-24-07 284 292 2.82 Johnstone (S) 3-01-24-08 470 479 1.91 Johnstone (S) 3-01-24-09 355 354 -0.28 Johnstone (S) 3-01-24-10 560 565 0.89 Johnstone (S) 3-01-24-11 472 486 2.97 Johnstone (S) 3-01-24-12 243 247 1.65 Johnstone (S) 3-01-24-13 437 447 2.29 Johnstone (S) 3-01-24-14 263 271 3.04 Johnstone (S) 3-01-25-01 187 196 4.81 Johnstone (S) 3-01-25-02 282 288 2.13 Johnstone (S) 3-01-25-03 512 518 1.17 Johnstone (S) 3-01-25-04 333 338 1.50 Johnstone (S) 3-01-25-05 441 446 1.13 Johnstone (S) 3-01-25-06 346 355 2.60

Queensland Redistribution Statistics 2006
Enrolment Projections
----------------------------------------------------------------------------------------------------------------------
112
Johnstone (S) 3-01-25-07 291 303 4.12
Kennedy
---------------------------------------------------------------------------------------------------------------------- SLA Name CCD Number Actual
Enrolment 2/12/2005
Estimate 30/11/2007
Growth (%)
----------------------------------------------------------------------------------------------------------------------
Johnstone (S) 3-01-25-08 381 390 2.36 Johnstone (S) 3-01-25-09 107 107 0.00 Johnstone (S) 3-01-25-10 377 383 1.59 Johnstone (S) 3-01-26-01 101 105 3.96 Johnstone (S) 3-01-26-02 262 270 3.05 Johnstone (S) 3-01-26-03 264 268 1.52 Johnstone (S) 3-01-26-04 437 447 2.29 Johnstone (S) 3-01-26-05 228 231 1.32 Johnstone (S) 3-01-26-06 144 145 0.69 Johnstone (S) 3-01-26-07 268 276 2.99 Johnstone (S) 3-01-26-08 167 174 4.19 Johnstone (S) 3-01-26-09 249 253 1.61 Johnstone (S) 3-01-26-10 255 259 1.57 Johnstone (S) 3-01-26-11 421 431 2.38 Johnstone (S) 3-01-26-12 173 189 9.25 Johnstone (S) 3-01-26-13 187 196 4.81 Johnstone (S) 3-01-26-14 162 192 18.52 Johnstone (S) 38 11747 12020 2.32 Mareeba (S) 3-03-01-02 14 14 0.00 Mareeba (S) 3-03-01-03 8 8 0.00 Mareeba (S) 3-03-01-04 21 21 0.00 Mareeba (S) 3-03-01-05 58 60 3.45 Mareeba (S) 3-03-01-06 132 135 2.27 Mareeba (S) 3-03-02-02 174 179 2.87 Mareeba (S) 3-03-02-03 200 201 0.50 Mareeba (S) 3-03-02-04 255 253 -0.78 Mareeba (S) 3-03-02-05 120 120 0.00 Mareeba (S) 3-03-02-06 47 44 -6.38 Mareeba (S) 3-03-02-07 190 187 -1.58 Mareeba (S) 3-03-02-08 24 24 0.00 Mareeba (S) 3-03-02-09 204 207 1.47 Mareeba (S) 3-03-02-10 207 211 1.93 Mareeba (S) 3-03-02-11 3 3 0.00 Mareeba (S) 3-03-03-05 10 10 0.00 Mareeba (S) 3-03-03-06 415 424 2.17 Mareeba (S) 3-03-03-07 333 345 3.60 Mareeba (S) 3-03-03-08 769 786 2.21 Mareeba (S) 3-03-03-09 528 543 2.84 Mareeba (S) 3-03-03-14 85 88 3.53 Mareeba (S) 3-03-04-01 316 322 1.90 Mareeba (S) 3-03-04-02 272 275 1.10 Mareeba (S) 3-03-04-03 439 457 4.10 Mareeba (S) 3-03-04-04 313 320 2.24 Mareeba (S) 3-03-04-05 462 463 0.22
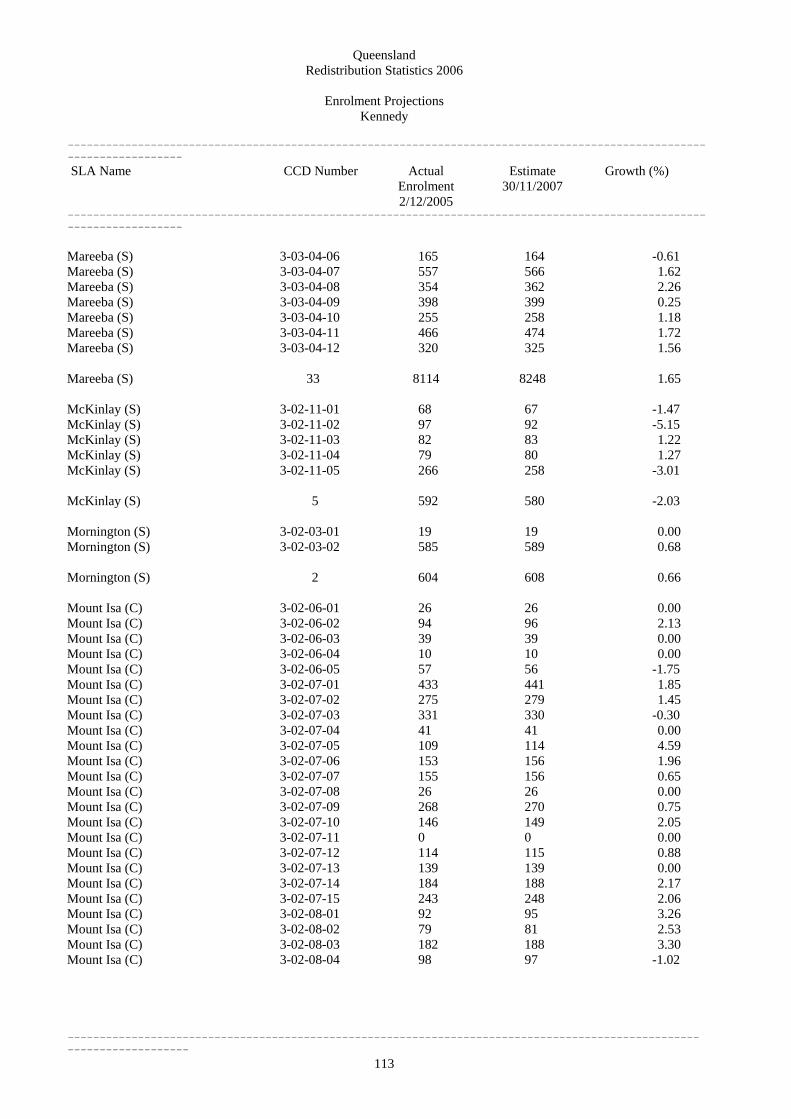
Queensland Redistribution Statistics 2006
Enrolment Projections
----------------------------------------------------------------------------------------------------------------------
113
----------------------------------------------------------------------------------------------------
Mount Isa (C) 3-02-07-09 268 270 0.75
Kennedy
---------------------------------------------------------------------------------------------------------------------- SLA Name CCD Number Actual
Enrolment 2/12/2005
Estimate 30/11/2007
Growth (%)
------------------ Mareeba (S) 3-03-04-06 165 164 -0.61 Mareeba (S) 3-03-04-07 557 566 1.62 Mareeba (S) 3-03-04-08 354 362 2.26 Mareeba (S) 3-03-04-09 398 399 0.25 Mareeba (S) 3-03-04-10 255 258 1.18 Mareeba (S) 3-03-04-11 466 474 1.72 Mareeba (S) 3-03-04-12 320 325 1.56 Mareeba (S) 33 8114 8248 1.65 McKinlay (S) 3-02-11-01 68 67 -1.47 McKinlay (S) 3-02-11-02 97 92 -5.15 McKinlay (S) 3-02-11-03 82 83 1.22 McKinlay (S) 3-02-11-04 79 80 1.27 McKinlay (S) 3-02-11-05 266 258 -3.01 McKinlay (S) 5 592 580 -2.03 Mornington (S) 3-02-03-01 19 19 0.00 Mornington (S) 3-02-03-02 585 589 0.68 Mornington (S) 2 604 608 0.66 Mount Isa (C) 3-02-06-01 26 26 0.00 Mount Isa (C) 3-02-06-02 94 96 2.13 Mount Isa (C) 3-02-06-03 39 39 0.00 Mount Isa (C) 3-02-06-04 10 10 0.00 Mount Isa (C) 3-02-06-05 57 56 -1.75 Mount Isa (C) 3-02-07-01 433 441 1.85 Mount Isa (C) 3-02-07-02 275 279 1.45 Mount Isa (C) 3-02-07-03 331 330 -0.30 Mount Isa (C) 3-02-07-04 41 41 0.00 Mount Isa (C) 3-02-07-05 109 114 4.59 Mount Isa (C) 3-02-07-06 153 156 1.96 Mount Isa (C) 3-02-07-07 155 156 0.65 Mount Isa (C) 3-02-07-08 26 26 0.00
Mount Isa (C) 3-02-07-10 146 149 2.05 Mount Isa (C) 3-02-07-11 0 0 0.00 Mount Isa (C) 3-02-07-12 114 115 0.88 Mount Isa (C) 3-02-07-13 139 139 0.00 Mount Isa (C) 3-02-07-14 184 188 2.17 Mount Isa (C) 3-02-07-15 243 248 2.06 Mount Isa (C) 3-02-08-01 92 95 3.26 Mount Isa (C) 3-02-08-02 79 81 2.53 Mount Isa (C) 3-02-08-03 182 188 3.30 Mount Isa (C) 3-02-08-04 98 97 -1.02

Queensland Redistribution Statistics 2006
Enrolment Projections
----------------------------------------------------------------------------------------------------------------------
114
Mount Isa (C) 3-02-08-07 243 246 1.23
Mount Isa (C) 3-02-08-13 185 186 0.54
Kennedy
---------------------------------------------------------------------------------------------------------------------- SLA Name CCD Number Actual
Enrolment 2/12/2005
Estimate 30/11/2007
Growth (%)
---------------------------------------------------------------------------------------------------------------------- Mount Isa (C) 3-02-08-05 123 126 2.44 Mount Isa (C) 3-02-08-06 79 80 1.27
Mount Isa (C) 3-02-08-08 379 389 2.64 Mount Isa (C) 3-02-08-09 178 182 2.25 Mount Isa (C) 3-02-08-10 156 156 0.00 Mount Isa (C) 3-02-08-11 69 71 2.90 Mount Isa (C) 3-02-08-12 204 207 1.47
Mount Isa (C) 3-02-08-14 257 262 1.95 Mount Isa (C) 3-02-08-15 198 202 2.02 Mount Isa (C) 3-02-08-16 148 155 4.73 Mount Isa (C) 3-02-08-17 370 376 1.62 Mount Isa (C) 3-02-08-18 351 354 0.85 Mount Isa (C) 3-02-08-19 323 482 49.23 Mount Isa (C) 3-02-08-20 51 52 1.96 Mount Isa (C) 3-02-09-01 62 63 1.61 Mount Isa (C) 3-02-09-02 423 430 1.65 Mount Isa (C) 3-02-09-03 50 50 0.00 Mount Isa (C) 3-02-09-04 94 95 1.06 Mount Isa (C) 3-02-09-05 429 433 0.93 Mount Isa (C) 3-02-09-06 272 278 2.21 Mount Isa (C) 3-02-09-07 383 387 1.04 Mount Isa (C) 3-02-09-08 337 342 1.48 Mount Isa (C) 3-02-09-09 324 324 0.00 Mount Isa (C) 3-02-09-10 214 218 1.87 Mount Isa (C) 3-02-09-11 181 182 0.55 Mount Isa (C) 3-02-09-12 237 244 2.95 Mount Isa (C) 3-02-09-13 214 217 1.40 Mount Isa (C) 3-02-09-14 160 163 1.88 Mount Isa (C) 3-02-09-15 66 67 1.52 Mount Isa (C) 3-02-09-16 259 264 1.93 Mount Isa (C) 56 10313 10623 3.01 Richmond (S) 3-02-12-01 54 53 -1.85 Richmond (S) 3-02-12-02 62 60 -3.23 Richmond (S) 3-02-12-03 52 54 3.85 Richmond (S) 3-02-12-04 369 365 -1.08 Richmond (S) 3-02-12-05 78 78 0.00 Richmond (S) 5 615 610 -0.81 Thuringowa (C) - Pt A Bal 3-04-08-02 293 313 6.83 Thuringowa (C) - Pt A Bal 3-04-08-03 389 404 3.86 Thuringowa (C) - Pt A Bal 3-04-08-04 614 660 7.49 Thuringowa (C) - Pt A Bal 3-04-08-05 52 66 26.92
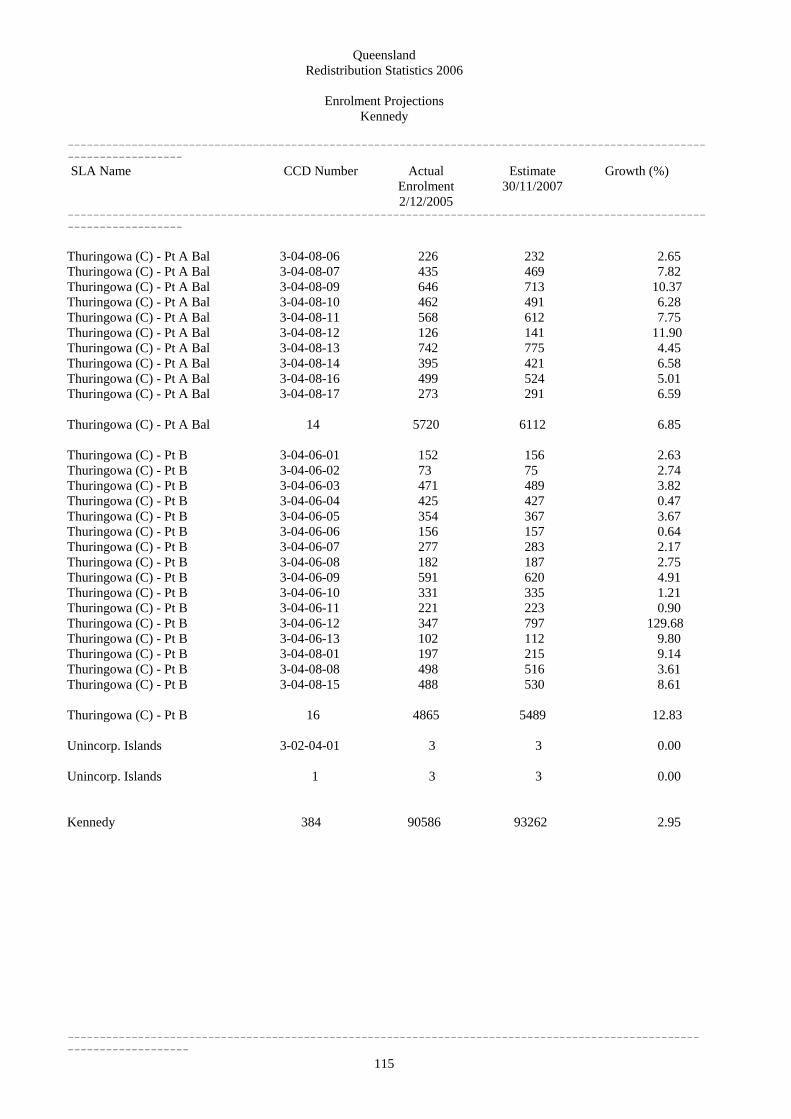
Queensland Redistribution Statistics 2006
Enrolment Projections
----------------------------------------------------------------------------------------------------------------------
115
Thuringowa (C) - Pt A Bal 3-04-08-16 499 524 5.01
Thuringowa (C) - Pt B 3-04-06-02 73 75 2.74
Kennedy
---------------------------------------------------------------------------------------------------------------------- SLA Name CCD Number Actual
Enrolment 2/12/2005
Estimate 30/11/2007
Growth (%)
---------------------------------------------------------------------------------------------------------------------- Thuringowa (C) - Pt A Bal 3-04-08-06 226 232 2.65 Thuringowa (C) - Pt A Bal 3-04-08-07 435 469 7.82 Thuringowa (C) - Pt A Bal 3-04-08-09 646 713 10.37 Thuringowa (C) - Pt A Bal 3-04-08-10 462 491 6.28 Thuringowa (C) - Pt A Bal 3-04-08-11 568 612 7.75 Thuringowa (C) - Pt A Bal 3-04-08-12 126 141 11.90 Thuringowa (C) - Pt A Bal 3-04-08-13 742 775 4.45 Thuringowa (C) - Pt A Bal 3-04-08-14 395 421 6.58
Thuringowa (C) - Pt A Bal 3-04-08-17 273 291 6.59 Thuringowa (C) - Pt A Bal 14 5720 6112 6.85 Thuringowa (C) - Pt B 3-04-06-01 152 156 2.63
Thuringowa (C) - Pt B 3-04-06-03 471 489 3.82 Thuringowa (C) - Pt B 3-04-06-04 425 427 0.47 Thuringowa (C) - Pt B 3-04-06-05 354 367 3.67 Thuringowa (C) - Pt B 3-04-06-06 156 157 0.64 Thuringowa (C) - Pt B 3-04-06-07 277 283 2.17 Thuringowa (C) - Pt B 3-04-06-08 182 187 2.75 Thuringowa (C) - Pt B 3-04-06-09 591 620 4.91 Thuringowa (C) - Pt B 3-04-06-10 331 335 1.21 Thuringowa (C) - Pt B 3-04-06-11 221 223 0.90 Thuringowa (C) - Pt B 3-04-06-12 347 797 129.68 Thuringowa (C) - Pt B 3-04-06-13 102 112 9.80 Thuringowa (C) - Pt B 3-04-08-01 197 215 9.14 Thuringowa (C) - Pt B 3-04-08-08 498 516 3.61 Thuringowa (C) - Pt B 3-04-08-15 488 530 8.61 Thuringowa (C) - Pt B 16 4865 5489 12.83 Unincorp. Islands 3-02-04-01 3 3 0.00 Unincorp. Islands 1 3 3 0.00 Kennedy 384 90586 93262 2.95

Queensland Redistribution Statistics 2006
Enrolment Projections
----------------------------------------------------------------------------------------------------------------------
116
Leichhardt
---------------------------------------------------------------------------------------------------------------------- SLA Name CCD Number Actual
Enrolment 2/12/2005
Estimate 30/11/2007
Growth (%)
---------------------------------------------------------------------------------------------------------------------- Aurukun (S) 3-01-05-01 659 693 5.16 Aurukun (S) 3-01-05-02 0 0 0.00 Aurukun (S) 2 659 693 5.16 Cairns (C) - Barron 3-01-17-05 335 346 3.28 Cairns (C) - Barron 3-01-17-06 341 350 2.64 Cairns (C) - Barron 3-01-17-07 498 514 3.21 Cairns (C) - Barron 3-01-17-11 270 275 1.85 Cairns (C) - Barron 3-01-17-12 258 273 5.81 Cairns (C) - Barron 3-01-17-13 359 370 3.06 Cairns (C) - Barron 3-01-18-02 364 392 7.69 Cairns (C) - Barron 3-01-18-03 527 621 17.84 Cairns (C) - Barron 3-01-18-04 136 141 3.68 Cairns (C) - Barron 3-01-18-05 274 278 1.46 Cairns (C) - Barron 3-01-18-06 324 335 3.40 Cairns (C) - Barron 3-01-18-07 260 269 3.46 Cairns (C) - Barron 3-01-18-08 210 215 2.38 Cairns (C) - Barron 3-01-18-09 404 417 3.22 Cairns (C) - Barron 3-01-18-10 279 282 1.08 Cairns (C) - Barron 3-01-18-11 332 351 5.72 Cairns (C) - Barron 3-01-18-12 246 303 23.17 Cairns (C) - Barron 3-01-19-01 522 542 3.83 Cairns (C) - Barron 3-01-19-06 423 487 15.13 Cairns (C) - Barron 3-01-19-08 357 372 4.20 Cairns (C) - Barron 3-01-19-09 551 564 2.36 Cairns (C) - Barron 3-01-19-10 0 0 0.00 Cairns (C) - Barron 3-01-19-11 581 651 12.05 Cairns (C) - Barron 3-01-19-12 473 495 4.65 Cairns (C) - Barron 3-01-19-13 525 595 13.33 Cairns (C) - Barron 3-01-19-14 244 250 2.46 Cairns (C) - Barron 3-01-19-16 276 289 4.71 Cairns (C) - Barron 3-01-19-17 201 204 1.49 Cairns (C) - Barron 3-01-19-18 407 422 3.69 Cairns (C) - Barron 3-01-19-19 597 695 16.42 Cairns (C) - Barron 3-01-21-13 1 1 0.00 Cairns (C) - Barron 3-01-21-23 375 416 10.93 Cairns (C) - Barron 3-01-21-24 608 716 17.76 Cairns (C) - Barron 33 11558 12431 7.55 Cairns (C) - Central Suburbs 3-01-10-05 202 204 0.99 Cairns (C) - Central Suburbs 3-01-10-10 308 309 0.32 Cairns (C) - Central Suburbs 3-01-11-01 403 404 0.25 Cairns (C) - Central Suburbs 3-01-11-02 291 300 3.09 Cairns (C) - Central Suburbs 3-01-11-03 70 68 -2.86 Cairns (C) - Central Suburbs 3-01-11-09 331 329 -0.60

Queensland Redistribution Statistics 2006
Enrolment Projections
----------------------------------------------------------------------------------------------------------------------
117
Leichhardt
Cairns (C) - Central Suburbs 3-01-13-06 159 163 2.52
---------------------------------------------------------------------------------------------------------------------- SLA Name CCD Number Actual
Enrolment 2/12/2005
Estimate 30/11/2007
Growth (%)
---------------------------------------------------------------------------------------------------------------------- Cairns (C) - Central Suburbs 3-01-11-10 177 179 1.13 Cairns (C) - Central Suburbs 3-01-11-11 310 311 0.32 Cairns (C) - Central Suburbs 3-01-11-12 168 169 0.60 Cairns (C) - Central Suburbs 3-01-11-13 421 423 0.48 Cairns (C) - Central Suburbs 3-01-11-14 317 322 1.58 Cairns (C) - Central Suburbs 3-01-12-01 240 242 0.83 Cairns (C) - Central Suburbs 3-01-12-02 161 163 1.24 Cairns (C) - Central Suburbs 3-01-12-03 145 147 1.38 Cairns (C) - Central Suburbs 3-01-12-15 57 56 -1.75 Cairns (C) - Central Suburbs 3-01-12-16 90 90 0.00 Cairns (C) - Central Suburbs 3-01-13-05 334 340 1.80
Cairns (C) - Central Suburbs 3-01-13-08 429 438 2.10 Cairns (C) - Central Suburbs 3-01-13-09 394 397 0.76 Cairns (C) - Central Suburbs 3-01-13-10 320 322 0.62 Cairns (C) - Central Suburbs 3-01-13-11 14 13 -7.14 Cairns (C) - Central Suburbs 3-01-13-12 364 371 1.92 Cairns (C) - Central Suburbs 3-01-13-13 111 113 1.80 Cairns (C) - Central Suburbs 3-01-13-14 71 74 4.23 Cairns (C) - Central Suburbs 3-01-13-15 152 157 3.29 Cairns (C) - Central Suburbs 3-01-14-01 374 375 0.27 Cairns (C) - Central Suburbs 3-01-14-03 379 389 2.64 Cairns (C) - Central Suburbs 3-01-14-04 395 401 1.52 Cairns (C) - Central Suburbs 3-01-14-07 218 222 1.83 Cairns (C) - Central Suburbs 3-01-14-12 271 274 1.11 Cairns (C) - Central Suburbs 3-01-14-13 336 338 0.60 Cairns (C) - Central Suburbs 3-01-15-01 461 465 0.87 Cairns (C) - Central Suburbs 3-01-15-02 256 262 2.34 Cairns (C) - Central Suburbs 3-01-15-03 317 322 1.58 Cairns (C) - Central Suburbs 3-01-15-04 596 601 0.84 Cairns (C) - Central Suburbs 3-01-15-06 360 374 3.89 Cairns (C) - Central Suburbs 3-01-15-07 314 321 2.23 Cairns (C) - Central Suburbs 3-01-15-08 485 490 1.03 Cairns (C) - Central Suburbs 3-01-15-09 364 363 -0.27 Cairns (C) - Central Suburbs 3-01-15-12 646 666 3.10 Cairns (C) - Central Suburbs 3-01-15-13 340 346 1.76 Cairns (C) - Central Suburbs 42 12151 12313 1.33 Cairns (C) - City 3-01-10-02 158 166 5.06 Cairns (C) - City 3-01-10-06 357 376 5.32 Cairns (C) - City 3-01-10-07 267 277 3.75 Cairns (C) - City 3-01-10-08 235 239 1.70 Cairns (C) - City 3-01-11-04 189 194 2.65 Cairns (C) - City 3-01-11-05 91 92 1.10 Cairns (C) - City 3-01-11-06 214 234 9.35 Cairns (C) - City 3-01-11-07 292 302 3.42

Queensland Redistribution Statistics 2006
Enrolment Projections
----------------------------------------------------------------------------------------------------------------------
118
Cairns (C) - City 3-01-12-14 85 86 1.18
Cairns (C) - Northern Suburbs 3-01-16-03 604 624 3.31
Leichhardt
---------------------------------------------------------------------------------------------------------------------- SLA Name CCD Number Actual
Enrolment 2/12/2005
Estimate 30/11/2007
Growth (%)
---------------------------------------------------------------------------------------------------------------------- Cairns (C) - City 3-01-11-08 108 134 24.07 Cairns (C) - City 3-01-12-04 138 138 0.00 Cairns (C) - City 3-01-12-05 224 230 2.68 Cairns (C) - City 3-01-12-06 255 275 7.84 Cairns (C) - City 3-01-12-07 96 97 1.04 Cairns (C) - City 3-01-12-08 119 121 1.68 Cairns (C) - City 3-01-12-09 77 79 2.60 Cairns (C) - City 3-01-12-10 106 111 4.72 Cairns (C) - City 3-01-12-11 148 225 52.03 Cairns (C) - City 3-01-12-12 187 243 29.95 Cairns (C) - City 3-01-12-13 152 156 2.63
Cairns (C) - City 3-01-12-18 55 58 5.45 Cairns (C) - City 21 3553 3833 7.88 Cairns (C) - Mt Whitfield 3-01-10-01 229 236 3.06 Cairns (C) - Mt Whitfield 3-01-10-03 430 440 2.33 Cairns (C) - Mt Whitfield 3-01-10-04 316 322 1.90 Cairns (C) - Mt Whitfield 3-01-10-09 266 357 34.21 Cairns (C) - Mt Whitfield 3-01-10-11 403 409 1.49 Cairns (C) - Mt Whitfield 3-01-10-12 530 548 3.40 Cairns (C) - Mt Whitfield 3-01-10-13 0 0 0.00 Cairns (C) - Mt Whitfield 3-01-14-02 419 431 2.86 Cairns (C) - Mt Whitfield 3-01-14-05 611 623 1.96 Cairns (C) - Mt Whitfield 3-01-14-06 282 292 3.55 Cairns (C) - Mt Whitfield 3-01-14-08 382 391 2.36 Cairns (C) - Mt Whitfield 3-01-14-09 343 365 6.41 Cairns (C) - Mt Whitfield 3-01-14-10 300 305 1.67 Cairns (C) - Mt Whitfield 3-01-14-11 395 399 1.01 Cairns (C) - Mt Whitfield 3-01-14-14 685 693 1.17 Cairns (C) - Mt Whitfield 3-01-18-01 28 30 7.14 Cairns (C) - Mt Whitfield 3-01-19-02 338 367 8.58 Cairns (C) - Mt Whitfield 3-01-19-03 651 706 8.45 Cairns (C) - Mt Whitfield 3-01-19-04 567 583 2.82 Cairns (C) - Mt Whitfield 3-01-19-05 299 306 2.34 Cairns (C) - Mt Whitfield 3-01-19-07 118 117 -0.85 Cairns (C) - Mt Whitfield 3-01-19-15 98 101 3.06 Cairns (C) - Mt Whitfield 22 7690 8021 4.30 Cairns (C) - Northern Suburbs 3-01-16-01 363 393 8.26 Cairns (C) - Northern Suburbs 3-01-16-02 320 330 3.12
Cairns (C) - Northern Suburbs 3-01-16-04 415 459 10.60 Cairns (C) - Northern Suburbs 3-01-16-05 91 92 1.10 Cairns (C) - Northern Suburbs 3-01-16-06 194 214 10.31

Queensland Redistribution Statistics 2006
Enrolment Projections
----------------------------------------------------------------------------------------------------------------------
119
Actual Enrolment 2/12/2005
Growth (%)
Cairns (C) - Northern Suburbs 3-01-16-18 296 358 20.95
Leichhardt
---------------------------------------------------------------------------------------------------------------------- SLA Name CCD Number Estimate
30/11/2007
---------------------------------------------------------------------------------------------------------------------- Cairns (C) - Northern Suburbs 3-01-16-07 404 434 7.43 Cairns (C) - Northern Suburbs 3-01-16-08 424 459 8.25 Cairns (C) - Northern Suburbs 3-01-16-09 1 2 100.00 Cairns (C) - Northern Suburbs 3-01-16-10 285 345 21.05 Cairns (C) - Northern Suburbs 3-01-16-11 366 388 6.01 Cairns (C) - Northern Suburbs 3-01-16-12 514 568 10.51 Cairns (C) - Northern Suburbs 3-01-16-13 394 397 0.76 Cairns (C) - Northern Suburbs 3-01-16-14 492 511 3.86 Cairns (C) - Northern Suburbs 3-01-16-15 322 327 1.55 Cairns (C) - Northern Suburbs 3-01-16-16 3 3 0.00 Cairns (C) - Northern Suburbs 3-01-16-17 281 293 4.27
Cairns (C) - Northern Suburbs 3-01-16-19 249 263 5.62 Cairns (C) - Northern Suburbs 3-01-16-20 66 77 16.67 Cairns (C) - Northern Suburbs 3-01-17-01 104 108 3.85 Cairns (C) - Northern Suburbs 3-01-17-02 547 563 2.93 Cairns (C) - Northern Suburbs 3-01-17-03 406 414 1.97 Cairns (C) - Northern Suburbs 3-01-17-04 398 410 3.02 Cairns (C) - Northern Suburbs 3-01-17-08 343 351 2.33 Cairns (C) - Northern Suburbs 3-01-17-09 0 2 2.00 Cairns (C) - Northern Suburbs 3-01-17-10 378 386 2.12 Cairns (C) - Northern Suburbs 3-01-17-14 477 510 6.92 Cairns (C) - Northern Suburbs 28 8737 9281 6.23 Cairns (C) - Pt B 3-01-20-03 0 0 0.00 Cairns (C) - Pt B 3-01-20-04 87 87 0.00 Cairns (C) - Pt B 3-01-20-07 1062 1113 4.80 Cairns (C) - Pt B 3-01-20-08 0 0 0.00 Cairns (C) - Pt B 3-01-20-11 3 2 -33.33 Cairns (C) - Pt B 3-01-20-12 0 0 0.00 Cairns (C) - Pt B 3-01-23-01 0 0 0.00 Cairns (C) - Pt B 7 1152 1202 4.34 Cairns (C) - Trinity 3-01-12-17 5 5 0.00 Cairns (C) - Trinity 3-01-20-06 341 357 4.69 Cairns (C) - Trinity 3-01-21-01 472 503 6.57 Cairns (C) - Trinity 3-01-21-03 642 667 3.89 Cairns (C) - Trinity 3-01-21-04 450 461 2.44 Cairns (C) - Trinity 3-01-21-05 354 368 3.95 Cairns (C) - Trinity 3-01-21-06 50 63 26.00 Cairns (C) - Trinity 3-01-21-07 603 644 6.80 Cairns (C) - Trinity 3-01-21-08 341 351 2.93 Cairns (C) - Trinity 3-01-21-10 698 781 11.89 Cairns (C) - Trinity 3-01-21-11 420 446 6.19 Cairns (C) - Trinity 3-01-21-12 203 235 15.76

Queensland Redistribution Statistics 2006
Enrolment Projections
----------------------------------------------------------------------------------------------------------------------
120
Cairns (C) - Trinity 3-01-22-14 604 666 10.26
Leichhardt
---------------------------------------------------------------------------------------------------------------------- SLA Name CCD Number Actual
Enrolment 2/12/2005
Estimate 30/11/2007
Growth (%)
---------------------------------------------------------------------------------------------------------------------- Cairns (C) - Trinity 3-01-21-16 292 301 3.08 Cairns (C) - Trinity 3-01-21-17 657 799 21.61 Cairns (C) - Trinity 3-01-21-18 308 366 18.83 Cairns (C) - Trinity 3-01-21-19 507 588 15.98 Cairns (C) - Trinity 3-01-21-20 112 115 2.68 Cairns (C) - Trinity 3-01-21-21 506 564 11.46 Cairns (C) - Trinity 3-01-21-22 487 508 4.31 Cairns (C) - Trinity 3-01-22-02 383 397 3.66 Cairns (C) - Trinity 3-01-22-03 499 529 6.01 Cairns (C) - Trinity 3-01-22-12 582 698 19.93 Cairns (C) - Trinity 3-01-22-13 302 342 13.25
Cairns (C) - Trinity 3-01-22-18 244 275 12.70 Cairns (C) - Trinity 3-01-22-20 405 442 9.14 Cairns (C) - Trinity 3-01-22-21 447 489 9.40 Cairns (C) - Trinity 3-01-27-02 253 261 3.16 Cairns (C) - Trinity 3-01-27-03 423 433 2.36 Cairns (C) - Trinity 3-01-27-04 504 522 3.57 Cairns (C) - Trinity 3-01-27-05 40 40 0.00 Cairns (C) - Trinity 3-01-27-06 406 419 3.20 Cairns (C) - Trinity 3-01-27-07 351 367 4.56 Cairns (C) - Trinity 3-01-27-09 245 255 4.08 Cairns (C) - Trinity 3-01-27-10 413 427 3.39 Cairns (C) - Trinity 3-01-27-11 468 500 6.84 Cairns (C) - Trinity 3-01-27-12 305 336 10.16 Cairns (C) - Trinity 3-01-27-13 262 277 5.73 Cairns (C) - Trinity 3-01-27-14 481 494 2.70 Cairns (C) - Trinity 3-01-27-15 71 75 5.63 Cairns (C) - Trinity 3-01-27-16 429 452 5.36 Cairns (C) - Trinity 41 15565 16818 8.05 Cairns (C) - Western Suburbs 3-01-13-01 255 262 2.75 Cairns (C) - Western Suburbs 3-01-13-02 234 235 0.43 Cairns (C) - Western Suburbs 3-01-13-03 562 571 1.60 Cairns (C) - Western Suburbs 3-01-13-04 261 265 1.53 Cairns (C) - Western Suburbs 3-01-13-07 451 537 19.07 Cairns (C) - Western Suburbs 3-01-13-16 308 314 1.95 Cairns (C) - Western Suburbs 3-01-13-17 403 412 2.23 Cairns (C) - Western Suburbs 3-01-15-05 551 578 4.90 Cairns (C) - Western Suburbs 3-01-15-10 354 411 16.10 Cairns (C) - Western Suburbs 3-01-15-11 604 613 1.49 Cairns (C) - Western Suburbs 3-01-15-14 78 79 1.28 Cairns (C) - Western Suburbs 3-01-15-15 611 676 10.64 Cairns (C) - Western Suburbs 3-01-21-02 656 664 1.22 Cairns (C) - Western Suburbs 3-01-21-09 566 581 2.65 Cairns (C) - Western Suburbs 3-01-21-14 481 498 3.53

Queensland Redistribution Statistics 2006
Enrolment Projections
----------------------------------------------------------------------------------------------------------------------
121
Cook (S) (excl. Weipa) 3-01-06-01 354 352 -0.56
Cook (S) (excl. Weipa) 3-01-06-12 0 0 0.00
Cook (S) (excl. Weipa) 3-01-07-06 118 121 2.54
Leichhardt
---------------------------------------------------------------------------------------------------------------------- SLA Name CCD Number Actual
Enrolment 2/12/2005
Estimate 30/11/2007
Growth (%)
---------------------------------------------------------------------------------------------------------------------- Cairns (C) - Western Suburbs 3-01-21-15 430 440 2.33 Cairns (C) - Western Suburbs 3-01-27-01 543 551 1.47 Cairns (C) - Western Suburbs 3-01-27-08 515 522 1.36 Cairns (C) - Western Suburbs 18 7863 8209 4.40 Carpentaria (S) 3-02-02-01 3 3 0.00 Carpentaria (S) 3-02-02-02 388 385 -0.77 Carpentaria (S) 3-02-02-06 586 601 2.56 Carpentaria (S) 3-02-02-10 0 0 0.00 Carpentaria (S) 3-02-02-11 0 0 0.00
Carpentaria (S) 5 977 989 1.23
Cook (S) (excl. Weipa) 3-01-06-02 5 5 0.00 Cook (S) (excl. Weipa) 3-01-06-03 32 32 0.00 Cook (S) (excl. Weipa) 3-01-06-04 49 49 0.00 Cook (S) (excl. Weipa) 3-01-06-05 14 14 0.00 Cook (S) (excl. Weipa) 3-01-06-06 21 23 9.52 Cook (S) (excl. Weipa) 3-01-06-07 518 516 -0.39 Cook (S) (excl. Weipa) 3-01-06-08 0 0 0.00 Cook (S) (excl. Weipa) 3-01-06-09 0 0 0.00 Cook (S) (excl. Weipa) 3-01-06-10 138 136 -1.45 Cook (S) (excl. Weipa) 3-01-06-11 0 0 0.00
Cook (S) (excl. Weipa) 3-01-06-13 0 0 0.00 Cook (S) (excl. Weipa) 3-01-06-14 175 177 1.14 Cook (S) (excl. Weipa) 3-01-06-15 0 0 0.00 Cook (S) (excl. Weipa) 3-01-06-16 176 186 5.68 Cook (S) (excl. Weipa) 3-01-07-01 35 33 -5.71 Cook (S) (excl. Weipa) 3-01-07-02 157 161 2.55 Cook (S) (excl. Weipa) 3-01-07-03 217 228 5.07 Cook (S) (excl. Weipa) 3-01-07-04 220 241 9.55 Cook (S) (excl. Weipa) 3-01-07-05 52 53 1.92
Cook (S) (excl. Weipa) 3-01-07-07 502 507 1.00 Cook (S) (excl. Weipa) 3-01-07-08 287 297 3.48 Cook (S) (excl. Weipa) 3-01-07-09 260 267 2.69 Cook (S) (excl. Weipa) 3-01-07-10 39 40 2.56 Cook (S) (excl. Weipa) 3-01-07-11 0 0 0.00 Cook (S) (excl. Weipa) 3-01-07-12 113 120 6.19 Cook (S) (excl. Weipa) 3-01-07-13 0 0 0.00 Cook (S) (excl. Weipa) 3-01-07-14 0 0 0.00 Cook (S) (excl. Weipa) 3-01-07-15 240 246 2.50 Cook (S) (excl. Weipa) 31 3722 3804 2.20

Queensland Redistribution Statistics 2006
Enrolment Projections
----------------------------------------------------------------------------------------------------------------------
122
Leichhardt
---------------------------------------------------------------------------------------------------------------------- SLA Name CCD Number Actual
Enrolment 2/12/2005
Estimate 30/11/2007
Growth (%)
---------------------------------------------------------------------------------------------------------------------- Cook (S) - Weipa only 3-01-04-01 253 251 -0.79 Cook (S) - Weipa only 3-01-04-02 151 153 1.32 Cook (S) - Weipa only 3-01-04-03 462 471 1.95 Cook (S) - Weipa only 3-01-04-04 219 226 3.20 Cook (S) - Weipa only 4 1085 1101 1.47 Douglas (S) 3-01-08-01 35 35 0.00 Douglas (S) 3-01-08-02 49 51 4.08 Douglas (S) 3-01-08-03 439 447 1.82 Douglas (S) 3-01-08-04 474 486 2.53 Douglas (S) 3-01-08-05 397 408 2.77 Douglas (S) 3-01-08-06 229 235 2.62 Douglas (S) 3-01-08-07 47 46 -2.13 Douglas (S) 3-01-08-08 187 203 8.56 Douglas (S) 3-01-08-09 223 221 -0.90 Douglas (S) 3-01-08-10 466 485 4.08 Douglas (S) 3-01-08-11 0 0 0.00 Douglas (S) 3-01-09-01 269 280 4.09 Douglas (S) 3-01-09-02 69 69 0.00 Douglas (S) 3-01-09-03 307 315 2.61 Douglas (S) 3-01-09-04 341 342 0.29 Douglas (S) 3-01-09-05 200 218 9.00 Douglas (S) 3-01-09-06 258 274 6.20 Douglas (S) 3-01-09-07 284 309 8.80 Douglas (S) 3-01-09-08 152 155 1.97 Douglas (S) 3-01-09-09 138 137 -0.72 Douglas (S) 3-01-09-10 108 108 0.00 Douglas (S) 3-01-09-11 510 580 13.73 Douglas (S) 3-01-09-12 308 331 7.47 Douglas (S) 3-01-09-13 28 29 3.57 Douglas (S) 3-01-09-14 428 437 2.10 Douglas (S) 3-01-09-15 99 97 -2.02 Douglas (S) 3-01-09-16 303 319 5.28 Douglas (S) 3-01-09-17 91 93 2.20 Douglas (S) 3-01-09-18 51 56 9.80 Douglas (S) 29 6490 6766 4.25 Mareeba (S) 3-03-01-01 2 2 0.00 Mareeba (S) 3-03-02-01 7 7 0.00 Mareeba (S) 3-03-03-01 310 313 0.97 Mareeba (S) 3-03-03-02 333 350 5.11 Mareeba (S) 3-03-03-03 172 173 0.58 Mareeba (S) 3-03-03-04 332 335 0.90 Mareeba (S) 3-03-03-10 54 53 -1.85 Mareeba (S) 3-03-03-11 468 476 1.71

Queensland Redistribution Statistics 2006
Enrolment Projections
----------------------------------------------------------------------------------------------------------------------
123
Leichhardt
---------------------------------------------------------------------------------------------------------------------- SLA Name CCD Number Actual
Enrolment 2/12/2005
Estimate 30/11/2007
Growth (%)
---------------------------------------------------------------------------------------------------------------------- Mareeba (S) 3-03-03-12 268 275 2.61 Mareeba (S) 3-03-03-13 282 286 1.42 Mareeba (S) 3-03-03-14 126 131 3.97 Mareeba (S) 3-03-03-15 93 95 2.15 Mareeba (S) 3-03-03-16 0 0 0.00 Mareeba (S) 3-03-03-17 220 237 7.73 Mareeba (S) 3-03-03-18 406 420 3.45 Mareeba (S) 15 3073 3153 2.60 Torres (S) 3-01-01-01 194 194 0.00 Torres (S) 3-01-01-02 87 87 0.00 Torres (S) 3-01-01-03 206 206 0.00 Torres (S) 3-01-01-04 0 0 0.00 Torres (S) 3-01-01-05 0 0 0.00 Torres (S) 3-01-01-06 213 213 0.00 Torres (S) 3-01-01-07 328 329 0.30 Torres (S) 3-01-01-08 216 216 0.00 Torres (S) 3-01-01-09 146 146 0.00 Torres (S) 3-01-01-10 201 205 1.99 Torres (S) 3-01-01-11 39 39 0.00 Torres (S) 3-01-02-01 447 459 2.68 Torres (S) 3-01-02-02 0 0 0.00 Torres (S) 3-01-02-03 138 138 0.00 Torres (S) 3-01-02-04 0 0 0.00 Torres (S) 3-01-02-05 1 1 0.00 Torres (S) 3-01-02-06 62 62 0.00 Torres (S) 3-01-02-07 164 164 0.00 Torres (S) 3-01-02-08 109 109 0.00 Torres (S) 3-01-02-09 111 111 0.00 Torres (S) 3-01-02-10 259 289 11.58 Torres (S) 3-01-02-11 121 121 0.00 Torres (S) 3-01-03-01 414 440 6.28 Torres (S) 3-01-03-02 365 368 0.82 Torres (S) 3-01-03-03 403 411 1.99 Torres (S) 3-01-28-01 93 93 0.00 Torres (S) 3-01-28-02 138 138 0.00 Torres (S) 3-01-28-03 7 8 14.29 Torres (S) 3-01-28-04 162 163 0.62 Torres (S) 3-01-28-05 473 486 2.75 Torres (S) 3-01-28-06 239 239 0.00 Torres (S) 3-01-28-07 0 0 0.00 Torres (S) 32 5336 5435 1.86 Leichhardt 330 89611 94049 4.95

Queensland Redistribution Statistics 2006
Enrolment Projections
----------------------------------------------------------------------------------------------------------------------
124
Lilley
---------------------------------------------------------------------------------------------------------------------- SLA Name CCD Number Actual
Enrolment 2/12/2005
Estimate 30/11/2007
Growth (%)
---------------------------------------------------------------------------------------------------------------------- Albion 3-19-09-01 289 285 -1.38 Albion 3-19-09-02 112 106 -5.36 Albion 3-19-09-03 200 196 -2.00 Albion 3-19-09-04 100 100 0.00 Albion 3-19-09-05 206 211 2.43 Albion 3-19-09-06 281 277 -1.42 Albion 3-19-09-07 241 238 -1.24 Albion 3-19-09-08 53 51 -3.77 Albion 8 1482 1464 -1.21 Ascot 3-19-07-01 160 161 0.62 Ascot 3-19-07-02 446 451 1.12 Ascot 3-19-07-03 218 220 0.92 Ascot 3-19-07-04 387 393 1.55 Ascot 3-19-07-05 201 205 1.99 Ascot 3-19-07-06 351 370 5.41 Ascot 3-19-07-07 528 540 2.27 Ascot 3-19-07-08 297 308 3.70 Ascot 3-19-07-09 371 383 3.23 Ascot 3-19-07-10 306 315 2.94 Ascot 10 3265 3346 2.48 Aspley 3-22-01-01 220 222 0.91 Aspley 3-22-02-01 460 463 0.65 Aspley 3-22-02-02 288 294 2.08 Aspley 3-22-02-03 257 264 2.72 Aspley 3-22-02-04 434 439 1.15 Aspley 3-22-02-05 0 0 0.00 Aspley 3-22-02-06 356 361 1.40 Aspley 3-22-02-07 647 658 1.70 Aspley 3-22-02-08 385 392 1.82 Aspley 3-22-02-09 427 435 1.87 Aspley 3-22-02-10 318 319 0.31 Aspley 3-22-02-11 210 215 2.38 Aspley 12 4002 4062 1.50 Banyo 3-22-24-04 567 549 -3.17 Banyo 3-22-24-05 326 331 1.53 Banyo 3-22-24-06 466 476 2.15 Banyo 3-22-24-07 499 504 1.00 Banyo 3-22-24-08 0 0 0.00 Banyo 3-22-24-09 494 501 1.42 Banyo 3-22-24-10 387 385 -0.52 Banyo 3-22-24-11 582 596 2.41

Queensland Redistribution Statistics 2006
Enrolment Projections
----------------------------------------------------------------------------------------------------------------------
125
Lilley
---------------------------------------------------------------------------------------------------------------------- SLA Name CCD Number Actual
Enrolment 2/12/2005
Estimate 30/11/2007
Growth (%)
---------------------------------------------------------------------------------------------------------------------- Banyo 8 3321 3342 0.63 Boondall 3-18-21-01 249 257 3.21 Boondall 3-18-21-02 414 426 2.90 Boondall 3-18-21-03 375 378 0.80 Boondall 3-18-21-04 261 264 1.15 Boondall 3-18-21-05 388 394 1.55 Boondall 3-18-21-06 0 0 0.00 Boondall 3-18-21-07 696 716 2.87 Boondall 3-18-21-08 436 445 2.06 Boondall 3-18-21-09 725 734 1.24 Boondall 3-18-21-10 595 606 1.85 Boondall 3-18-21-11 552 601 8.88 Boondall 3-18-21-12 600 608 1.33 Boondall 3-18-21-13 378 387 2.38 Boondall 13 5669 5816 2.59 Bracken Ridge 3-18-18-04 37 42 13.51 Bracken Ridge 1 37 42 13.51 Brighton 3-18-16-01 782 794 1.53 Brighton 3-18-16-02 412 418 1.46 Brighton 3-18-16-03 465 472 1.51 Brighton 3-18-16-04 287 291 1.39 Brighton 3-18-16-05 415 416 0.24 Brighton 3-18-16-06 251 250 -0.40 Brighton 3-18-16-07 620 635 2.42 Brighton 3-18-16-08 449 458 2.00 Brighton 3-18-17-01 268 273 1.87 Brighton 3-18-17-02 146 149 2.05 Brighton 3-18-17-03 312 316 1.28 Brighton 3-18-17-04 226 235 3.98 Brighton 3-18-17-05 212 223 5.19 Brighton 3-18-17-06 288 290 0.69 Brighton 3-18-17-07 316 324 2.53 Brighton 3-18-17-08 414 427 3.14 Brighton 16 5863 5971 1.84 Chermside 3-22-05-01 473 476 0.63 Chermside 3-22-05-02 510 522 2.35 Chermside 3-22-05-03 449 481 7.13 Chermside 3-22-05-04 378 384 1.59 Chermside 3-22-05-05 382 398 4.19

Queensland Redistribution Statistics 2006
Enrolment Projections
----------------------------------------------------------------------------------------------------------------------
126
Chermside 3-22-05-07 281 297 5.69
Lilley
---------------------------------------------------------------------------------------------------------------------- SLA Name CCD Number Actual
Enrolment 2/12/2005
Estimate 30/11/2007
Growth (%)
---------------------------------------------------------------------------------------------------------------------- Chermside 3-22-05-06 394 410 4.06
Chermside 3-22-05-08 394 416 5.58 Chermside 3-22-05-09 432 441 2.08 Chermside 3-22-05-10 304 332 9.21 Chermside 3-22-05-11 220 226 2.73 Chermside 11 4217 4383 3.94 Clayfield 3-19-02-01 428 439 2.57 Clayfield 3-19-02-02 304 312 2.63 Clayfield 3-19-02-03 377 382 1.33 Clayfield 3-19-02-04 352 364 3.41 Clayfield 3-19-02-05 364 368 1.10 Clayfield 3-19-02-06 419 428 2.15 Clayfield 3-19-02-07 77 80 3.90 Clayfield 3-19-02-08 283 288 1.77 Clayfield 3-19-02-09 221 228 3.17 Clayfield 3-19-02-10 318 325 2.20 Clayfield 3-19-03-01 177 186 5.08 Clayfield 3-19-03-02 186 187 0.54 Clayfield 3-19-03-03 257 265 3.11 Clayfield 3-19-03-04 349 356 2.01 Clayfield 3-19-03-05 399 402 0.75 Clayfield 3-19-03-06 382 385 0.79 Clayfield 3-19-03-07 387 388 0.26 Clayfield 3-19-03-08 302 322 6.62 Clayfield 3-19-03-09 373 383 2.68 Clayfield 3-19-03-10 193 200 3.63 Clayfield 3-19-03-11 151 155 2.65 Clayfield 3-19-03-12 198 201 1.52 Clayfield 22 6497 6644 2.26 Deagon 3-18-20-01 437 434 -0.69 Deagon 3-18-20-02 466 466 0.00 Deagon 3-18-20-03 412 411 -0.24 Deagon 3-18-20-04 514 492 -4.28 Deagon 3-18-20-05 402 401 -0.25 Deagon 5 2231 2204 -1.21 Geebung 3-22-04-01 250 268 7.20 Geebung 3-22-04-02 484 479 -1.03 Geebung 3-22-04-03 228 224 -1.75 Geebung 3-22-04-04 356 357 0.28 Geebung 3-22-04-05 399 381 -4.51

Queensland Redistribution Statistics 2006
Enrolment Projections
----------------------------------------------------------------------------------------------------------------------
127
CCD Number
Lilley
---------------------------------------------------------------------------------------------------------------------- SLA Name Actual
Enrolment 2/12/2005
Estimate 30/11/2007
Growth (%)
---------------------------------------------------------------------------------------------------------------------- Geebung 3-22-04-06 527 536 1.71 Geebung 3-22-04-07 312 315 0.96 Geebung 3-22-04-08 314 313 -0.32 Geebung 8 2870 2873 0.10 Hamilton 3-19-08-01 314 323 2.87 Hamilton 3-19-08-02 154 161 4.55 Hamilton 3-19-08-03 191 194 1.57 Hamilton 3-19-08-04 274 288 5.11 Hamilton 3-19-08-05 327 338 3.36 Hamilton 3-19-08-06 427 438 2.58 Hamilton 3-19-08-07 294 304 3.40 Hamilton 3-19-08-08 261 263 0.77 Hamilton 3-19-08-09 134 138 2.99 Hamilton 3-19-08-10 218 221 1.38 Hamilton 3-19-08-11 324 329 1.54 Hamilton 11 2918 2997 2.71 Hendra 3-19-04-01 824 900 9.22 Hendra 3-19-04-02 499 504 1.00 Hendra 3-19-04-03 194 199 2.58 Hendra 3-19-04-04 191 190 -0.52 Hendra 3-19-04-05 351 355 1.14 Hendra 3-19-04-06 257 270 5.06 Hendra 3-19-04-07 472 484 2.54 Hendra 7 2788 2902 4.09 Kedron 3-22-17-01 338 342 1.18 Kedron 3-22-17-02 267 273 2.25 Kedron 3-22-17-03 295 299 1.36 Kedron 3-22-17-04 311 312 0.32 Kedron 3-22-17-05 314 317 0.96 Kedron 3-22-17-06 301 302 0.33 Kedron 3-22-17-07 290 300 3.45 Kedron 3-22-17-08 371 382 2.96 Kedron 3-22-17-09 368 369 0.27 Kedron 3-22-17-10 211 222 5.21 Kedron 3-22-17-11 413 419 1.45 Kedron 3-22-17-12 197 197 0.00 Kedron 3-22-17-13 253 254 0.40 Kedron 3-22-18-01 376 378 0.53 Kedron 3-22-18-02 265 272 2.64 Kedron 3-22-18-03 210 211 0.48 Kedron 3-22-18-04 121 120 -0.83

Queensland Redistribution Statistics 2006
Enrolment Projections
----------------------------------------------------------------------------------------------------------------------
128
Nundah 3-22-21-03 361 364 0.83
Lilley
---------------------------------------------------------------------------------------------------------------------- SLA Name CCD Number Actual
Enrolment 2/12/2005
Estimate 30/11/2007
Growth (%)
---------------------------------------------------------------------------------------------------------------------- Kedron 3-22-18-05 428 435 1.64 Kedron 3-22-18-06 388 393 1.29 Kedron 3-22-18-07 150 153 2.00 Kedron 3-22-18-08 221 224 1.36 Kedron 3-22-18-09 395 400 1.27 Kedron 3-22-18-10 318 316 -0.63 Kedron 3-22-18-11 589 594 0.85 Kedron 3-22-18-12 258 265 2.71 Kedron 3-22-18-13 461 471 2.17 Kedron 26 8109 8220 1.37 Lutwyche 3-22-14-01 389 390 0.26 Lutwyche 3-22-14-02 291 305 4.81 Lutwyche 3-22-14-03 388 393 1.29 Lutwyche 3-22-14-04 515 549 6.60 Lutwyche 3-22-14-05 200 203 1.50 Lutwyche 5 1783 1840 3.20 Northgate 3-22-23-01 45 45 0.00 Northgate 3-22-23-02 473 495 4.65 Northgate 3-22-23-03 343 350 2.04 Northgate 3-22-23-04 346 352 1.73 Northgate 3-22-23-05 289 295 2.08 Northgate 3-22-23-06 332 345 3.92 Northgate 3-22-23-07 440 446 1.36 Northgate 3-22-23-08 432 437 1.16 Northgate 8 2700 2765 2.41 Nudgee 3-22-15-01 692 718 3.76 Nudgee 3-22-15-02 738 742 0.54 Nudgee 2 1430 1460 2.10 Nudgee Beach 3-22-15-03 247 249 0.81 Nudgee Beach 1 247 249 0.81 Nundah 3-22-21-01 158 161 1.90 Nundah 3-22-21-02 304 316 3.95
Nundah 3-22-21-04 303 308 1.65 Nundah 3-22-21-05 274 274 0.00 Nundah 3-22-21-06 245 253 3.27 Nundah 3-22-21-07 193 192 -0.52

Queensland Redistribution Statistics 2006
Enrolment Projections
----------------------------------------------------------------------------------------------------------------------
129
Lilley
---------------------------------------------------------------------------------------------------------------------- SLA Name CCD Number Actual
Enrolment 2/12/2005
Estimate 30/11/2007
Growth (%)
---------------------------------------------------------------------------------------------------------------------- Nundah 3-22-21-08 234 240 2.56 Nundah 3-22-21-09 249 257 3.21 Nundah 3-22-22-01 205 204 -0.49 Nundah 3-22-22-02 326 334 2.45 Nundah 3-22-22-03 258 272 5.43 Nundah 3-22-22-04 249 292 17.27 Nundah 3-22-22-05 345 351 1.74 Nundah 3-22-22-06 456 470 3.07 Nundah 3-22-22-07 460 491 6.74 Nundah 3-22-22-08 385 384 -0.26 Nundah 3-22-22-09 274 278 1.46 Nundah 3-22-22-10 222 225 1.35 Nundah 3-22-22-11 296 306 3.38 Nundah 20 5797 5972 3.02 Pinkenba-Eagle Farm 3-19-05-01 1 1 0.00 Pinkenba-Eagle Farm 3-19-05-02 1 1 0.00 Pinkenba-Eagle Farm 3-19-05-03 35 33 -5.71 Pinkenba-Eagle Farm 3-19-05-04 205 203 -0.98 Pinkenba-Eagle Farm 4 242 238 -1.65 Sandgate 3-18-19-01 327 331 1.22 Sandgate 3-18-19-02 656 656 0.00 Sandgate 3-18-19-03 145 150 3.45 Sandgate 3-18-19-04 212 217 2.36 Sandgate 3-18-19-05 338 345 2.07 Sandgate 3-18-19-06 343 368 7.29 Sandgate 3-18-19-07 450 451 0.22 Sandgate 3-18-19-08 320 322 0.62 Sandgate 3-18-19-09 502 519 3.39 Sandgate 3-18-19-10 383 383 0.00 Sandgate 3-18-19-11 97 99 2.06 Sandgate 3-18-19-12 277 279 0.72 Sandgate 3-18-19-13 317 327 3.15 Sandgate 13 4367 4447 1.83 Stafford 3-22-11-08 391 395 1.02 Stafford 3-22-11-09 103 114 10.68 Stafford 3-22-11-10 215 219 1.86 Stafford 3-22-11-13 183 187 2.19 Stafford 4 892 915 2.58 Stafford Heights 3-22-09-04 231 234 1.30
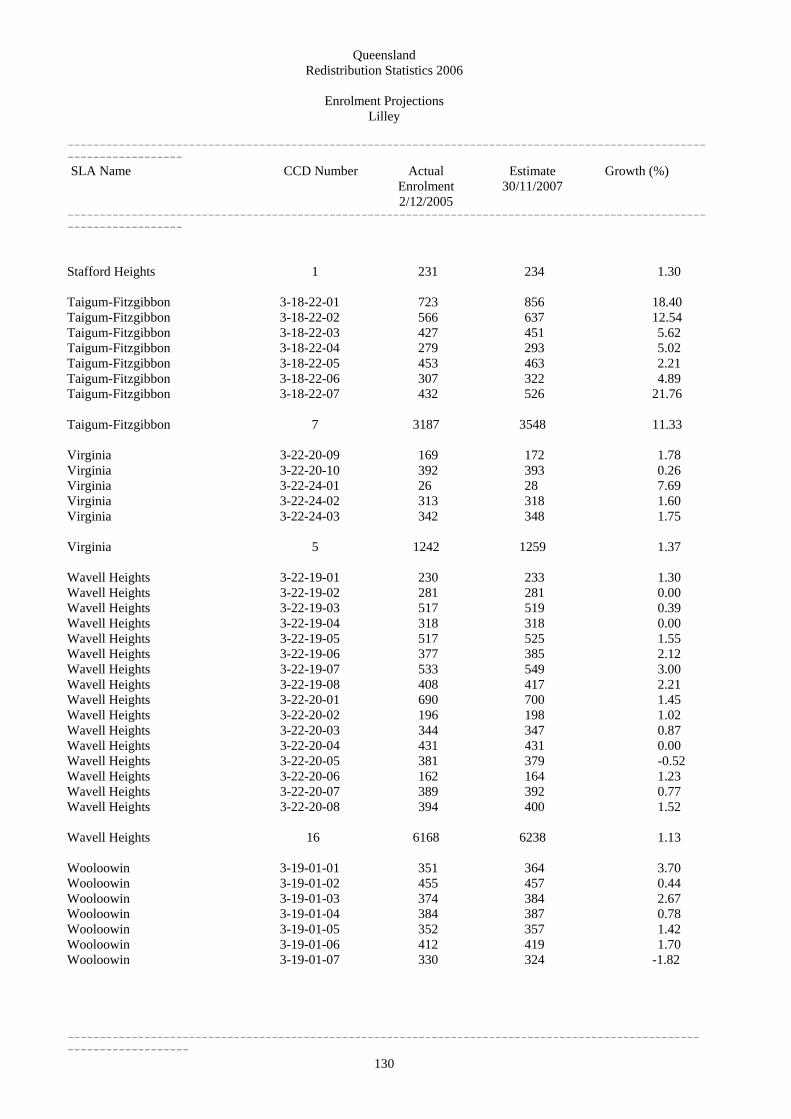
Queensland Redistribution Statistics 2006
Enrolment Projections
----------------------------------------------------------------------------------------------------------------------
130
Lilley
---------------------------------------------------------------------------------------------------------------------- SLA Name CCD Number Actual
Enrolment 2/12/2005
Estimate 30/11/2007
Growth (%)
---------------------------------------------------------------------------------------------------------------------- Stafford Heights 1 231 234 1.30 Taigum-Fitzgibbon 3-18-22-01 723 856 18.40 Taigum-Fitzgibbon 3-18-22-02 566 637 12.54 Taigum-Fitzgibbon 3-18-22-03 427 451 5.62 Taigum-Fitzgibbon 3-18-22-04 279 293 5.02 Taigum-Fitzgibbon 3-18-22-05 453 463 2.21 Taigum-Fitzgibbon 3-18-22-06 307 322 4.89 Taigum-Fitzgibbon 3-18-22-07 432 526 21.76 Taigum-Fitzgibbon 7 3187 3548 11.33 Virginia 3-22-20-09 169 172 1.78 Virginia 3-22-20-10 392 393 0.26 Virginia 3-22-24-01 26 28 7.69 Virginia 3-22-24-02 313 318 1.60 Virginia 3-22-24-03 342 348 1.75 Virginia 5 1242 1259 1.37 Wavell Heights 3-22-19-01 230 233 1.30 Wavell Heights 3-22-19-02 281 281 0.00 Wavell Heights 3-22-19-03 517 519 0.39 Wavell Heights 3-22-19-04 318 318 0.00 Wavell Heights 3-22-19-05 517 525 1.55 Wavell Heights 3-22-19-06 377 385 2.12 Wavell Heights 3-22-19-07 533 549 3.00 Wavell Heights 3-22-19-08 408 417 2.21 Wavell Heights 3-22-20-01 690 700 1.45 Wavell Heights 3-22-20-02 196 198 1.02 Wavell Heights 3-22-20-03 344 347 0.87 Wavell Heights 3-22-20-04 431 431 0.00 Wavell Heights 3-22-20-05 381 379 -0.52 Wavell Heights 3-22-20-06 162 164 1.23 Wavell Heights 3-22-20-07 389 392 0.77 Wavell Heights 3-22-20-08 394 400 1.52 Wavell Heights 16 6168 6238 1.13 Wooloowin 3-19-01-01 351 364 3.70 Wooloowin 3-19-01-02 455 457 0.44 Wooloowin 3-19-01-03 374 384 2.67 Wooloowin 3-19-01-04 384 387 0.78 Wooloowin 3-19-01-05 352 357 1.42 Wooloowin 3-19-01-06 412 419 1.70 Wooloowin 3-19-01-07 330 324 -1.82

Queensland Redistribution Statistics 2006
Enrolment Projections
----------------------------------------------------------------------------------------------------------------------
131
Lilley
---------------------------------------------------------------------------------------------------------------------- SLA Name CCD Number Actual
Enrolment 2/12/2005
Estimate 30/11/2007
Growth (%)
---------------------------------------------------------------------------------------------------------------------- Wooloowin 3-19-01-08 233 241 3.43 Wooloowin 3-19-01-09 316 327 3.48 Wooloowin 3-19-01-10 265 271 2.26 Wooloowin 3-19-01-11 250 252 0.80 Wooloowin 11 3722 3783 1.64 Zillmere 3-22-03-01 121 120 -0.83 Zillmere 3-22-03-02 475 471 -0.84 Zillmere 3-22-03-03 424 428 0.94 Zillmere 3-22-03-04 242 244 0.83 Zillmere 3-22-03-05 248 249 0.40 Zillmere 3-22-03-06 240 242 0.83 Zillmere 3-22-03-07 273 274 0.37 Zillmere 3-22-03-08 550 554 0.73 Zillmere 3-22-03-09 553 551 -0.36 Zillmere 3-22-03-10 477 481 0.84 Zillmere 3-22-03-11 259 260 0.39 Zillmere 3-22-03-12 434 436 0.46 Zillmere 3-22-03-13 150 152 1.33 Zillmere 3-22-03-14 322 325 0.93 Zillmere 3-22-03-15 201 196 -2.49 Zillmere 15 4969 4983 0.28 Lilley 270 90246 92197 2.16

Queensland Redistribution Statistics 2006
Enrolment Projections
----------------------------------------------------------------------------------------------------------------------
132
Longman
---------------------------------------------------------------------------------------------------------------------- SLA Name CCD Number Actual
Enrolment 2/12/2005
Estimate 30/11/2007
Growth (%)
---------------------------------------------------------------------------------------------------------------------- Bribie Island 3-12-04-01 135 136 0.74 Bribie Island 3-12-04-02 238 244 2.52 Bribie Island 3-12-04-03 216 219 1.39 Bribie Island 3-12-04-04 234 235 0.43 Bribie Island 3-12-04-05 200 204 2.00 Bribie Island 3-12-04-06 359 369 2.79 Bribie Island 3-12-04-07 473 501 5.92 Bribie Island 3-12-04-08 310 314 1.29 Bribie Island 3-12-04-09 463 464 0.22 Bribie Island 3-12-04-10 422 424 0.47 Bribie Island 3-12-04-11 199 205 3.02 Bribie Island 3-12-04-12 446 450 0.90 Bribie Island 3-12-04-13 347 355 2.31 Bribie Island 3-12-04-14 370 369 -0.27 Bribie Island 3-12-04-15 352 361 2.56 Bribie Island 3-12-04-16 572 610 6.64 Bribie Island 3-12-04-17 444 455 2.48 Bribie Island 3-12-04-18 0 0 0.00 Bribie Island 3-12-05-01 494 498 0.81 Bribie Island 3-12-05-02 433 436 0.69 Bribie Island 3-12-05-03 601 615 2.33 Bribie Island 3-12-05-04 327 326 -0.31 Bribie Island 3-12-05-05 342 348 1.75 Bribie Island 3-12-05-06 782 808 3.32 Bribie Island 3-12-05-07 360 362 0.56 Bribie Island 3-12-05-08 358 365 1.96 Bribie Island 3-12-05-09 193 191 -1.04 Bribie Island 3-12-05-10 238 238 0.00 Bribie Island 3-12-05-11 475 510 7.37 Bribie Island 3-12-05-12 523 523 0.00 Bribie Island 3-12-05-13 798 836 4.76 Bribie Island 3-12-05-14 244 247 1.23 Bribie Island 32 11948 12218 2.26 Burpengary-Narangba 3-12-09-01 551 570 3.45 Burpengary-Narangba 3-12-09-02 816 925 13.36 Burpengary-Narangba 3-12-09-04 638 668 4.70 Burpengary-Narangba 3-12-09-05 481 505 4.99 Burpengary-Narangba 3-12-09-06 457 490 7.22 Burpengary-Narangba 3-12-09-08 389 405 4.11 Burpengary-Narangba 3-12-09-09 587 606 3.24 Burpengary-Narangba 3-12-09-10 709 796 12.27 Burpengary-Narangba 3-12-09-11 527 550 4.36 Burpengary-Narangba 3-12-09-12 712 753 5.76 Burpengary-Narangba 3-12-22-01 664 720 8.43 Burpengary-Narangba 3-12-22-02 900 1149 27.67

Queensland Redistribution Statistics 2006
Enrolment Projections
----------------------------------------------------------------------------------------------------------------------
133
Longman
---------------------------------------------------------------------------------------------------------------------- SLA Name CCD Number Actual
Enrolment 2/12/2005
Estimate 30/11/2007
Growth (%)
---------------------------------------------------------------------------------------------------------------------- Burpengary-Narangba 3-12-22-09 576 599 3.99 Burpengary-Narangba 3-12-22-11 435 446 2.53 Burpengary-Narangba 3-12-22-12 710 749 5.49 Burpengary-Narangba 3-12-22-13 609 635 4.27 Burpengary-Narangba 3-12-22-14 282 294 4.26 Burpengary-Narangba 3-12-22-15 452 621 37.39 Burpengary-Narangba 3-12-22-16 374 404 8.02 Burpengary-Narangba 3-12-22-17 499 630 26.25 Burpengary-Narangba 3-12-22-18 246 308 25.20 Burpengary-Narangba 3-12-22-19 473 518 9.51 Burpengary-Narangba 3-12-22-20 495 525 6.06 Burpengary-Narangba 3-12-22-26 589 639 8.49 Burpengary-Narangba 24 13171 14505 10.13 Caboolture (S) - Central 3-12-08-02 216 224 3.70 Caboolture (S) - Central 3-12-08-03 584 750 28.42 Caboolture (S) - Central 3-12-08-04 267 274 2.62 Caboolture (S) - Central 3-12-08-05 160 159 -0.62 Caboolture (S) - Central 3-12-08-06 334 353 5.69 Caboolture (S) - Central 3-12-08-07 391 406 3.84 Caboolture (S) - Central 3-12-08-08 534 588 10.11 Caboolture (S) - Central 3-12-08-09 477 492 3.14 Caboolture (S) - Central 3-12-08-11 366 377 3.01 Caboolture (S) - Central 3-12-08-12 296 306 3.38 Caboolture (S) - Central 3-12-08-13 379 392 3.43 Caboolture (S) - Central 3-12-21-01 538 559 3.90 Caboolture (S) - Central 3-12-21-03 482 494 2.49 Caboolture (S) - Central 3-12-21-04 69 67 -2.90 Caboolture (S) - Central 3-12-21-05 263 323 22.81 Caboolture (S) - Central 3-12-21-06 438 446 1.83 Caboolture (S) - Central 3-12-21-07 442 504 14.03 Caboolture (S) - Central 3-12-21-08 668 690 3.29 Caboolture (S) - Central 3-12-21-09 399 413 3.51 Caboolture (S) - Central 3-12-21-10 605 673 11.24 Caboolture (S) - Central 3-12-21-11 522 648 24.14 Caboolture (S) - Central 3-12-21-12 370 379 2.43 Caboolture (S) - Central 3-12-21-13 469 481 2.56 Caboolture (S) - Central 3-12-21-14 442 457 3.39 Caboolture (S) - Central 3-12-21-15 282 286 1.42 Caboolture (S) - Central 3-12-21-16 661 713 7.87 Caboolture (S) - Central 3-12-21-17 298 323 8.39 Caboolture (S) - Central 27 10952 11777 7.53 Caboolture (S) - East 3-12-06-01 61 65 6.56 Caboolture (S) - East 3-12-06-02 172 175 1.74

Queensland Redistribution Statistics 2006
Enrolment Projections
----------------------------------------------------------------------------------------------------------------------
134
Caboolture (S) Bal in BSD 3-12-08-01 173 181 4.62
Longman
---------------------------------------------------------------------------------------------------------------------- SLA Name CCD Number Actual
Enrolment 2/12/2005
Estimate 30/11/2007
Growth (%)
---------------------------------------------------------------------------------------------------------------------- Caboolture (S) - East 3-12-06-03 257 263 2.33 Caboolture (S) - East 3-12-06-04 510 522 2.35 Caboolture (S) - East 3-12-06-05 496 512 3.23 Caboolture (S) - East 3-12-06-06 625 637 1.92 Caboolture (S) - East 3-12-06-07 361 379 4.99 Caboolture (S) - East 3-12-06-08 493 511 3.65 Caboolture (S) - East 3-12-06-09 448 466 4.02 Caboolture (S) - East 3-12-06-10 198 203 2.53 Caboolture (S) - East 3-12-06-11 734 791 7.77 Caboolture (S) - East 3-12-06-12 327 342 4.59 Caboolture (S) - East 3-12-06-13 588 628 6.80 Caboolture (S) - East 3-12-06-14 557 585 5.03 Caboolture (S) - East 3-12-06-15 630 797 26.51 Caboolture (S) - East 3-12-06-16 414 438 5.80 Caboolture (S) - East 3-12-06-17 570 591 3.68 Caboolture (S) - East 3-12-06-18 233 239 2.58 Caboolture (S) - East 3-12-08-10 452 462 2.21 Caboolture (S) - East 3-12-10-01 924 1046 13.20 Caboolture (S) - East 3-12-10-03 910 940 3.30 Caboolture (S) - East 3-12-10-10 391 409 4.60 Caboolture (S) - East 22 10351 11001 6.28 Caboolture (S) - Pt B 3-12-07-01 295 309 4.75 Caboolture (S) - Pt B 3-12-07-02 263 278 5.70 Caboolture (S) - Pt B 3-12-07-03 384 404 5.21 Caboolture (S) - Pt B 3-12-07-04 422 445 5.45 Caboolture (S) - Pt B 3-12-07-05 480 507 5.62 Caboolture (S) - Pt B 3-12-07-06 210 223 6.19 Caboolture (S) - Pt B 3-12-07-07 373 392 5.09 Caboolture (S) - Pt B 3-12-07-08 166 178 7.23 Caboolture (S) - Pt B 3-12-07-09 364 378 3.85 Caboolture (S) - Pt B 3-12-07-11 1 1 0.00 Caboolture (S) - Pt B 3-12-07-12 391 414 5.88 Caboolture (S) - Pt B 11 3349 3529 5.37 Caboolture (S) Bal in BSD 3-12-07-10 252 272 7.94
Caboolture (S) Bal in BSD 3-12-08-14 384 409 6.51 Caboolture (S) Bal in BSD 3-12-08-15 559 631 12.88 Caboolture (S) Bal in BSD 3-12-18-05 249 262 5.22 Caboolture (S) Bal in BSD 3-12-18-06 593 623 5.06 Caboolture (S) Bal in BSD 3-12-18-07 293 303 3.41 Caboolture (S) Bal in BSD 3-12-18-08 654 730 11.62 Caboolture (S) Bal in BSD 3-12-18-09 410 441 7.56 Caboolture (S) Bal in BSD 3-12-18-10 495 527 6.46

Queensland Redistribution Statistics 2006
Enrolment Projections
----------------------------------------------------------------------------------------------------------------------
135
Longman
Caloundra (C) - Rail Corridor 3-12-03-07 503 523 3.98
Caloundra (C) - Rail Corridor 3-12-03-12 629 678 7.79
Caloundra (C) - Rail Corridor 3-12-20-08 531 533 0.38
Caloundra (C) - Rail Corridor 3-12-20-10 540 584 8.15
---------------------------------------------------------------------------------------------------------------------- SLA Name CCD Number Actual
Enrolment 2/12/2005
Estimate 30/11/2007
Growth (%)
---------------------------------------------------------------------------------------------------------------------- Caboolture (S) Bal in BSD 3-12-18-11 508 543 6.89 Caboolture (S) Bal in BSD 3-12-18-15 117 122 4.27 Caboolture (S) Bal in BSD 3-12-18-16 380 460 21.05 Caboolture (S) Bal in BSD 3-12-21-02 535 570 6.54 Caboolture (S) Bal in BSD 3-12-22-03 167 175 4.79 Caboolture (S) Bal in BSD 3-12-22-04 556 591 6.29 Caboolture (S) Bal in BSD 3-12-22-05 116 123 6.03 Caboolture (S) Bal in BSD 3-12-22-06 269 278 3.35 Caboolture (S) Bal in BSD 3-12-22-21 424 457 7.78 Caboolture (S) Bal in BSD 3-12-22-22 425 441 3.76 Caboolture (S) Bal in BSD 3-12-22-23 419 431 2.86 Caboolture (S) Bal in BSD 3-12-22-24 268 331 23.51 Caboolture (S) Bal in BSD 3-12-22-25 462 481 4.11 Caboolture (S) Bal in BSD 23 8708 9382 7.74 Caloundra (C) - Caloundra S. 3-11-13-14 99 116 17.17
Caloundra (C) - Caloundra S. 1 99 116 17.17 Caloundra (C) - Hinterland 3-12-20-12 242 249 2.89 Caloundra (C) - Hinterland 1 242 249 2.89 Caloundra (C) - Rail Corridor 3-12-03-01 391 439 12.28 Caloundra (C) - Rail Corridor 3-12-03-03 86 89 3.49 Caloundra (C) - Rail Corridor 3-12-03-04 324 334 3.09 Caloundra (C) - Rail Corridor 3-12-03-05 496 548 10.48 Caloundra (C) - Rail Corridor 3-12-03-06 543 592 9.02
Caloundra (C) - Rail Corridor 3-12-03-08 453 475 4.86
Caloundra (C) - Rail Corridor 3-12-03-13 264 269 1.89 Caloundra (C) - Rail Corridor 3-12-03-14 541 561 3.70 Caloundra (C) - Rail Corridor 3-12-03-15 390 410 5.13 Caloundra (C) - Rail Corridor 3-12-20-01 436 446 2.29 Caloundra (C) - Rail Corridor 3-12-20-02 443 465 4.97 Caloundra (C) - Rail Corridor 3-12-20-03 597 646 8.21 Caloundra (C) - Rail Corridor 3-12-20-04 300 307 2.33 Caloundra (C) - Rail Corridor 3-12-20-05 434 488 12.44 Caloundra (C) - Rail Corridor 3-12-20-07 432 457 5.79
Caloundra (C) - Rail Corridor 3-12-20-09 102 105 2.94
Caloundra (C) - Rail Corridor 3-12-20-11 217 229 5.53 Caloundra (C) - Rail Corridor 21 8652 9178 6.08
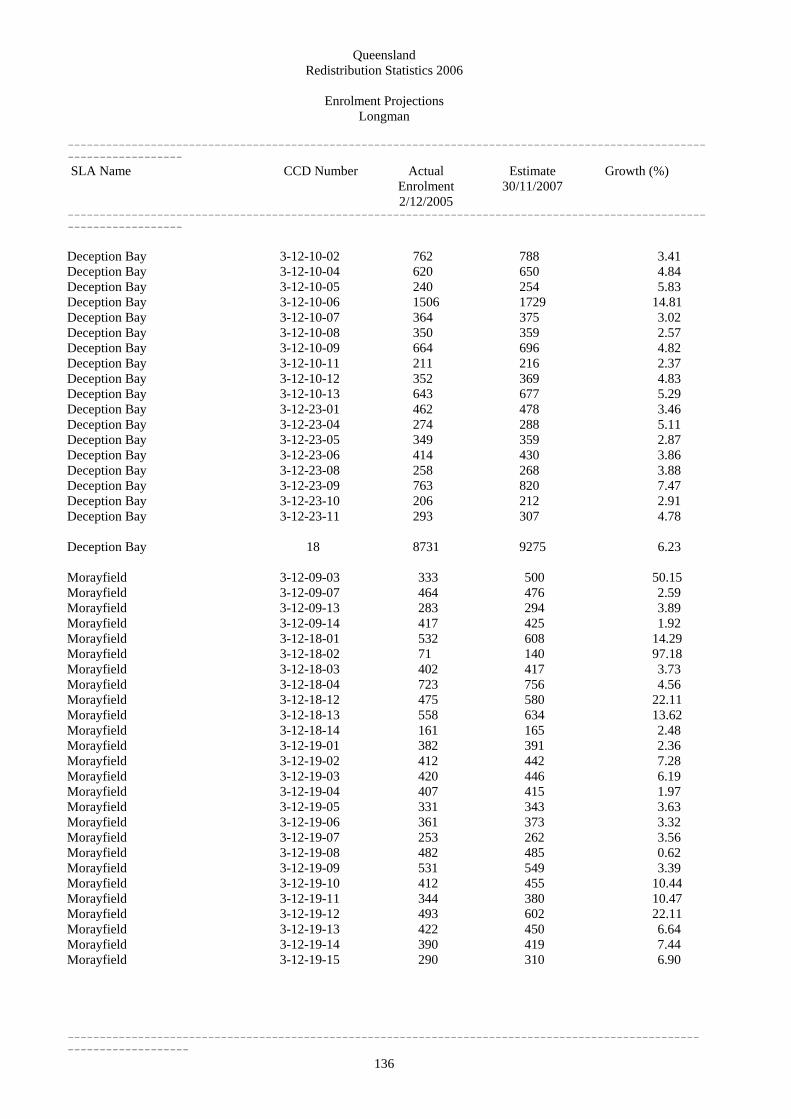
Queensland Redistribution Statistics 2006
Enrolment Projections
----------------------------------------------------------------------------------------------------------------------
136
Morayfield 3-12-19-11 344 380 10.47
Longman
---------------------------------------------------------------------------------------------------------------------- SLA Name CCD Number Actual
Enrolment 2/12/2005
Estimate 30/11/2007
Growth (%)
---------------------------------------------------------------------------------------------------------------------- Deception Bay 3-12-10-02 762 788 3.41 Deception Bay 3-12-10-04 620 650 4.84 Deception Bay 3-12-10-05 240 254 5.83 Deception Bay 3-12-10-06 1506 1729 14.81 Deception Bay 3-12-10-07 364 375 3.02 Deception Bay 3-12-10-08 350 359 2.57 Deception Bay 3-12-10-09 664 696 4.82 Deception Bay 3-12-10-11 211 216 2.37 Deception Bay 3-12-10-12 352 369 4.83 Deception Bay 3-12-10-13 643 677 5.29 Deception Bay 3-12-23-01 462 478 3.46 Deception Bay 3-12-23-04 274 288 5.11 Deception Bay 3-12-23-05 349 359 2.87 Deception Bay 3-12-23-06 414 430 3.86 Deception Bay 3-12-23-08 258 268 3.88 Deception Bay 3-12-23-09 763 820 7.47 Deception Bay 3-12-23-10 206 212 2.91 Deception Bay 3-12-23-11 293 307 4.78 Deception Bay 18 8731 9275 6.23
Morayfield 3-12-09-03 333 500 50.15 Morayfield 3-12-09-07 464 476 2.59 Morayfield 3-12-09-13 283 294 3.89 Morayfield 3-12-09-14 417 425 1.92 Morayfield 3-12-18-01 532 608 14.29 Morayfield 3-12-18-02 71 140 97.18 Morayfield 3-12-18-03 402 417 3.73 Morayfield 3-12-18-04 723 756 4.56 Morayfield 3-12-18-12 475 580 22.11 Morayfield 3-12-18-13 558 634 13.62 Morayfield 3-12-18-14 161 165 2.48 Morayfield 3-12-19-01 382 391 2.36 Morayfield 3-12-19-02 412 442 7.28 Morayfield 3-12-19-03 420 446 6.19 Morayfield 3-12-19-04 407 415 1.97 Morayfield 3-12-19-05 331 343 3.63 Morayfield 3-12-19-06 361 373 3.32 Morayfield 3-12-19-07 253 262 3.56 Morayfield 3-12-19-08 482 485 0.62 Morayfield 3-12-19-09 531 549 3.39 Morayfield 3-12-19-10 412 455 10.44
Morayfield 3-12-19-12 493 602 22.11 Morayfield 3-12-19-13 422 450 6.64 Morayfield 3-12-19-14 390 419 7.44 Morayfield 3-12-19-15 290 310 6.90

Queensland Redistribution Statistics 2006
Enrolment Projections
----------------------------------------------------------------------------------------------------------------------
137
SLA Name Actual Enrolment 2/12/2005
Longman
----------------------------------------------------------------------------------------------------------------------
CCD Number Estimate 30/11/2007
Growth (%)
---------------------------------------------------------------------------------------------------------------------- Morayfield 3-12-22-07 559 720 28.80 Morayfield 3-12-22-08 518 527 1.74 Morayfield 3-12-22-10 435 448 2.99 Morayfield 29 11861 13012 9.70 Longman 209 88064 94242 7.02
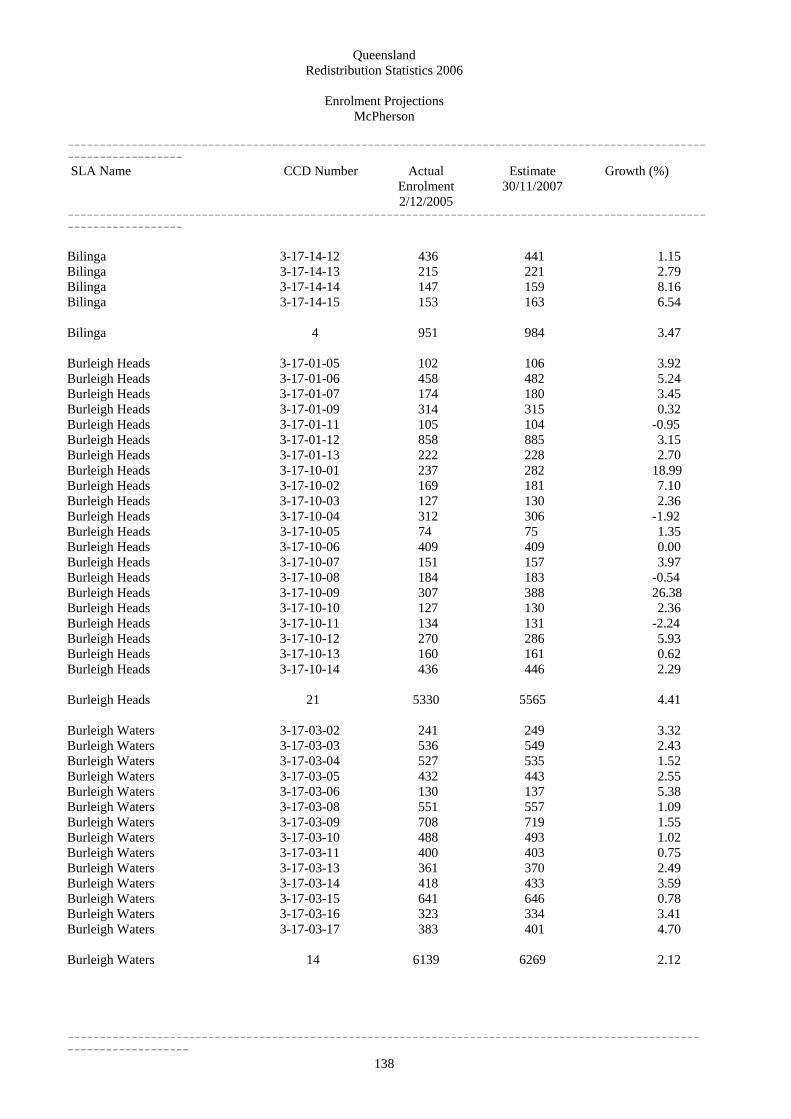
Queensland Redistribution Statistics 2006
Enrolment Projections
----------------------------------------------------------------------------------------------------------------------
138
Bilinga 3-17-14-15 153 163 6.54
Burleigh Heads 3-17-10-02 169 181 7.10
Burleigh Waters 3-17-03-03 536 549 2.43
McPherson
---------------------------------------------------------------------------------------------------------------------- SLA Name CCD Number Actual
Enrolment 2/12/2005
Estimate 30/11/2007
Growth (%)
---------------------------------------------------------------------------------------------------------------------- Bilinga 3-17-14-12 436 441 1.15 Bilinga 3-17-14-13 215 221 2.79 Bilinga 3-17-14-14 147 159 8.16
Bilinga 4 951 984 3.47
Burleigh Heads 3-17-01-05 102 106 3.92 Burleigh Heads 3-17-01-06 458 482 5.24 Burleigh Heads 3-17-01-07 174 180 3.45 Burleigh Heads 3-17-01-09 314 315 0.32 Burleigh Heads 3-17-01-11 105 104 -0.95 Burleigh Heads 3-17-01-12 858 885 3.15 Burleigh Heads 3-17-01-13 222 228 2.70 Burleigh Heads 3-17-10-01 237 282 18.99
Burleigh Heads 3-17-10-03 127 130 2.36 Burleigh Heads 3-17-10-04 312 306 -1.92 Burleigh Heads 3-17-10-05 74 75 1.35 Burleigh Heads 3-17-10-06 409 409 0.00 Burleigh Heads 3-17-10-07 151 157 3.97 Burleigh Heads 3-17-10-08 184 183 -0.54 Burleigh Heads 3-17-10-09 307 388 26.38 Burleigh Heads 3-17-10-10 127 130 2.36 Burleigh Heads 3-17-10-11 134 131 -2.24 Burleigh Heads 3-17-10-12 270 286 5.93 Burleigh Heads 3-17-10-13 160 161 0.62 Burleigh Heads 3-17-10-14 436 446 2.29 Burleigh Heads 21 5330 5565 4.41 Burleigh Waters 3-17-03-02 241 249 3.32
Burleigh Waters 3-17-03-04 527 535 1.52 Burleigh Waters 3-17-03-05 432 443 2.55 Burleigh Waters 3-17-03-06 130 137 5.38 Burleigh Waters 3-17-03-08 551 557 1.09 Burleigh Waters 3-17-03-09 708 719 1.55 Burleigh Waters 3-17-03-10 488 493 1.02 Burleigh Waters 3-17-03-11 400 403 0.75 Burleigh Waters 3-17-03-13 361 370 2.49 Burleigh Waters 3-17-03-14 418 433 3.59 Burleigh Waters 3-17-03-15 641 646 0.78 Burleigh Waters 3-17-03-16 323 334 3.41 Burleigh Waters 3-17-03-17 383 401 4.70 Burleigh Waters 14 6139 6269 2.12

Queensland Redistribution Statistics 2006
Enrolment Projections
----------------------------------------------------------------------------------------------------------------------
139
Coolangatta 3-17-16-09 96 106 10.42
McPherson
---------------------------------------------------------------------------------------------------------------------- SLA Name CCD Number Actual
Enrolment 2/12/2005
Estimate 30/11/2007
Growth (%)
---------------------------------------------------------------------------------------------------------------------- Carrara-Merrimac 3-17-21-04 500 550 10.00 Carrara-Merrimac 3-17-21-10 380 418 10.00 Carrara-Merrimac 3-17-21-15 531 558 5.08 Carrara-Merrimac 3-17-21-16 230 238 3.48 Carrara-Merrimac 3-17-21-17 404 425 5.20 Carrara-Merrimac 5 2045 2189 7.04 Coolangatta 3-17-16-01 244 276 13.11 Coolangatta 3-17-16-02 360 418 16.11 Coolangatta 3-17-16-03 397 399 0.50 Coolangatta 3-17-16-04 224 301 34.38 Coolangatta 3-17-16-05 122 119 -2.46 Coolangatta 3-17-16-06 26 24 -7.69 Coolangatta 3-17-16-07 107 110 2.80 Coolangatta 3-17-16-08 138 139 0.72
Coolangatta 3-17-16-10 239 249 4.18 Coolangatta 3-17-16-11 611 622 1.80 Coolangatta 3-17-16-12 446 481 7.85 Coolangatta 3-17-16-13 265 264 -0.38 Coolangatta 13 3275 3508 7.11 Currumbin 3-17-12-01 465 484 4.09 Currumbin 3-17-12-02 264 273 3.41 Currumbin 3-17-12-03 357 361 1.12 Currumbin 3-17-12-10 372 376 1.08 Currumbin 3-17-12-13 180 200 11.11 Currumbin 3-17-12-14 180 183 1.67 Currumbin 6 1818 1877 3.25 Currumbin Waters 3-17-17-01 708 751 6.07 Currumbin Waters 3-17-17-02 526 536 1.90 Currumbin Waters 3-17-17-03 487 500 2.67 Currumbin Waters 3-17-17-04 360 374 3.89 Currumbin Waters 3-17-17-05 299 307 2.68 Currumbin Waters 3-17-17-06 493 496 0.61 Currumbin Waters 3-17-17-07 493 511 3.65 Currumbin Waters 3-17-17-08 509 523 2.75 Currumbin Waters 3-17-17-09 530 529 -0.19 Currumbin Waters 3-17-17-10 661 661 0.00 Currumbin Waters 3-17-17-11 538 549 2.04 Currumbin Waters 3-17-17-12 589 602 2.21 Currumbin Waters 3-17-17-13 360 365 1.39 Currumbin Waters 13 6553 6704 2.30
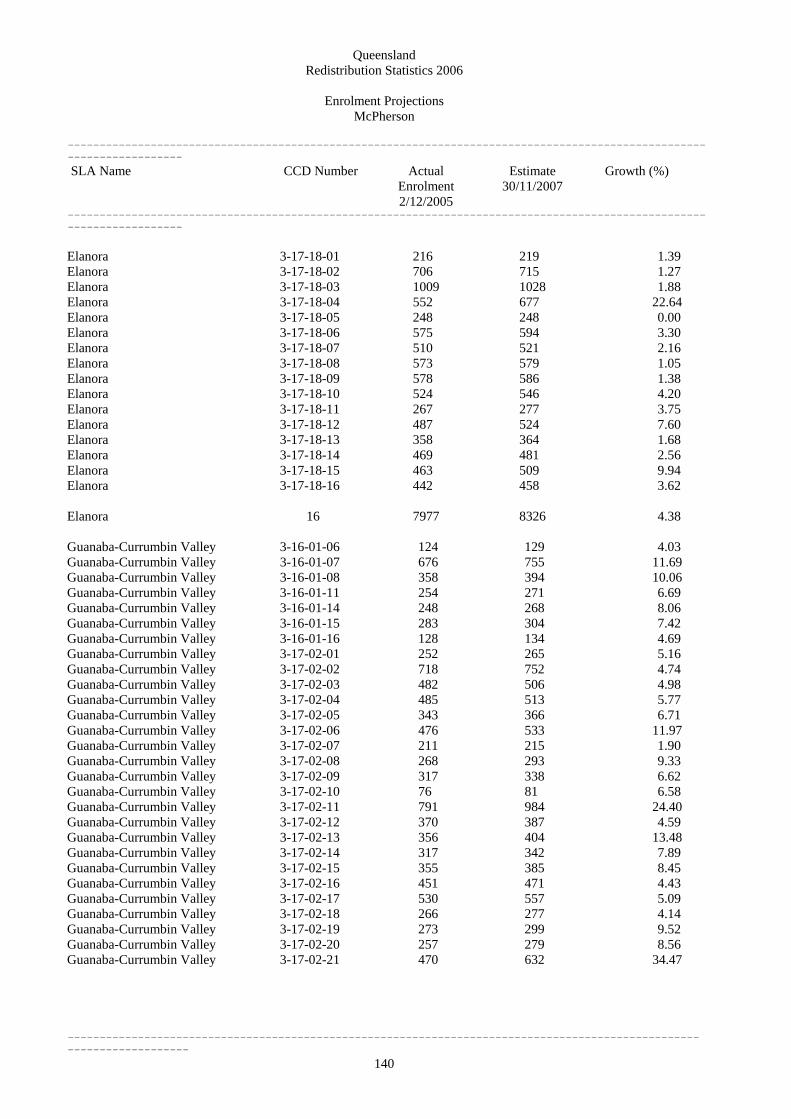
Queensland Redistribution Statistics 2006
Enrolment Projections
----------------------------------------------------------------------------------------------------------------------
140
Elanora 3-17-18-03 1009 1028 1.88
Elanora 3-17-18-05 248 248 0.00 Elanora 3-17-18-06 575 594 3.30
Guanaba-Currumbin Valley 3-16-01-06 124 129 4.03
McPherson
---------------------------------------------------------------------------------------------------------------------- SLA Name CCD Number Actual
Enrolment 2/12/2005
Estimate 30/11/2007
Growth (%)
---------------------------------------------------------------------------------------------------------------------- Elanora 3-17-18-01 216 219 1.39 Elanora 3-17-18-02 706 715 1.27
Elanora 3-17-18-04 552 677 22.64
Elanora 3-17-18-07 510 521 2.16 Elanora 3-17-18-08 573 579 1.05 Elanora 3-17-18-09 578 586 1.38 Elanora 3-17-18-10 524 546 4.20 Elanora 3-17-18-11 267 277 3.75 Elanora 3-17-18-12 487 524 7.60 Elanora 3-17-18-13 358 364 1.68 Elanora 3-17-18-14 469 481 2.56 Elanora 3-17-18-15 463 509 9.94 Elanora 3-17-18-16 442 458 3.62 Elanora 16 7977 8326 4.38
Guanaba-Currumbin Valley 3-16-01-07 676 755 11.69 Guanaba-Currumbin Valley 3-16-01-08 358 394 10.06 Guanaba-Currumbin Valley 3-16-01-11 254 271 6.69 Guanaba-Currumbin Valley 3-16-01-14 248 268 8.06 Guanaba-Currumbin Valley 3-16-01-15 283 304 7.42 Guanaba-Currumbin Valley 3-16-01-16 128 134 4.69 Guanaba-Currumbin Valley 3-17-02-01 252 265 5.16 Guanaba-Currumbin Valley 3-17-02-02 718 752 4.74 Guanaba-Currumbin Valley 3-17-02-03 482 506 4.98 Guanaba-Currumbin Valley 3-17-02-04 485 513 5.77 Guanaba-Currumbin Valley 3-17-02-05 343 366 6.71 Guanaba-Currumbin Valley 3-17-02-06 476 533 11.97 Guanaba-Currumbin Valley 3-17-02-07 211 215 1.90 Guanaba-Currumbin Valley 3-17-02-08 268 293 9.33 Guanaba-Currumbin Valley 3-17-02-09 317 338 6.62 Guanaba-Currumbin Valley 3-17-02-10 76 81 6.58 Guanaba-Currumbin Valley 3-17-02-11 791 984 24.40 Guanaba-Currumbin Valley 3-17-02-12 370 387 4.59 Guanaba-Currumbin Valley 3-17-02-13 356 404 13.48 Guanaba-Currumbin Valley 3-17-02-14 317 342 7.89 Guanaba-Currumbin Valley 3-17-02-15 355 385 8.45 Guanaba-Currumbin Valley 3-17-02-16 451 471 4.43 Guanaba-Currumbin Valley 3-17-02-17 530 557 5.09 Guanaba-Currumbin Valley 3-17-02-18 266 277 4.14 Guanaba-Currumbin Valley 3-17-02-19 273 299 9.52 Guanaba-Currumbin Valley 3-17-02-20 257 279 8.56 Guanaba-Currumbin Valley 3-17-02-21 470 632 34.47

Queensland Redistribution Statistics 2006
Enrolment Projections
----------------------------------------------------------------------------------------------------------------------
141
McPherson
---------------------------------------------------------------------------------------------------------------------- SLA Name CCD Number Actual
Enrolment 2/12/2005
Estimate 30/11/2007
Growth (%)
---------------------------------------------------------------------------------------------------------------------- Guanaba-Currumbin Valley 3-17-02-22 274 292 6.57 Guanaba-Currumbin Valley 3-17-02-23 301 320 6.31 Guanaba-Currumbin Valley 30 10710 11746 9.67 Mermaid Wtrs-Clear Is. Wtrs 3-17-05-04 201 203 1.00 Mermaid Wtrs-Clear Is. Wtrs 3-17-05-05 508 544 7.09 Mermaid Wtrs-Clear Is. Wtrs 3-17-15-02 293 293 0.00 Mermaid Wtrs-Clear Is. Wtrs 3-17-15-03 557 581 4.31 Mermaid Wtrs-Clear Is. Wtrs 3-17-15-05 656 677 3.20 Mermaid Wtrs-Clear Is. Wtrs 3-17-15-14 382 383 0.26 Mermaid Wtrs-Clear Is. Wtrs 6 2597 2681 3.23 Miami 3-17-09-12 15 15 0.00 Miami 1 15 15 0.00 Mudgeeraba 3-17-20-01 485 504 3.92 Mudgeeraba 3-17-20-02 347 372 7.20 Mudgeeraba 3-17-20-03 120 121 0.83 Mudgeeraba 3-17-20-04 294 301 2.38 Mudgeeraba 3-17-20-05 290 295 1.72 Mudgeeraba 3-17-20-06 679 708 4.27 Mudgeeraba 3-17-20-07 382 400 4.71 Mudgeeraba 3-17-20-08 375 405 8.00 Mudgeeraba 3-17-20-09 422 434 2.84 Mudgeeraba 3-17-20-10 344 365 6.10 Mudgeeraba 3-17-20-11 328 338 3.05 Mudgeeraba 3-17-20-12 451 502 11.31 Mudgeeraba 3-17-20-13 203 216 6.40 Mudgeeraba 3-17-20-14 351 369 5.13 Mudgeeraba 3-17-20-15 369 395 7.05 Mudgeeraba 15 5440 5725 5.24 Palm Beach 3-17-01-01 331 341 3.02 Palm Beach 3-17-01-02 272 277 1.84 Palm Beach 3-17-01-03 415 417 0.48 Palm Beach 3-17-01-04 605 604 -0.17 Palm Beach 3-17-01-08 210 220 4.76 Palm Beach 3-17-01-10 461 463 0.43 Palm Beach 3-17-11-01 236 242 2.54 Palm Beach 3-17-11-02 258 261 1.16 Palm Beach 3-17-11-03 241 252 4.56 Palm Beach 3-17-11-04 283 294 3.89 Palm Beach 3-17-11-05 299 324 8.36

Queensland Redistribution Statistics 2006
Enrolment Projections
----------------------------------------------------------------------------------------------------------------------
142
Palm Beach 3-17-11-12 405 417 2.96
Palm Beach 3-17-11-15 221 233 5.43
Palm Beach 3-17-12-05 476 493 3.57
Robina 3-17-04-07 332 407 22.59
McPherson
---------------------------------------------------------------------------------------------------------------------- SLA Name CCD Number Actual
Enrolment 2/12/2005
Estimate 30/11/2007
Growth (%)
---------------------------------------------------------------------------------------------------------------------- Palm Beach 3-17-11-06 266 267 0.38 Palm Beach 3-17-11-07 210 220 4.76 Palm Beach 3-17-11-08 240 251 4.58 Palm Beach 3-17-11-09 193 205 6.22 Palm Beach 3-17-11-10 298 303 1.68 Palm Beach 3-17-11-11 382 380 -0.52
Palm Beach 3-17-11-13 356 360 1.12 Palm Beach 3-17-11-14 302 304 0.66
Palm Beach 3-17-12-04 144 145 0.69
Palm Beach 3-17-12-06 127 128 0.79 Palm Beach 3-17-12-07 533 574 7.69 Palm Beach 3-17-12-08 395 402 1.77 Palm Beach 3-17-12-09 458 470 2.62 Palm Beach 3-17-12-11 119 127 6.72 Palm Beach 3-17-12-12 231 223 -3.46 Palm Beach 29 8967 9197 2.56 Robina 3-17-04-01 794 1046 31.74 Robina 3-17-04-02 343 360 4.96 Robina 3-17-04-06 372 380 2.15
Robina 3-17-04-09 469 471 0.43 Robina 3-17-04-13 466 469 0.64 Robina 3-17-04-15 680 780 14.71 Robina 3-17-04-16 253 312 23.32 Robina 3-17-04-17 750 896 19.47 Robina 3-17-04-18 505 672 33.07 Robina 3-17-04-21 308 332 7.79 Robina 3-17-04-22 400 423 5.75 Robina 3-17-04-23 330 334 1.21 Robina 3-17-04-24 162 166 2.47 Robina 3-17-04-25 204 206 0.98 Robina 3-17-04-26 129 137 6.20 Robina 3-17-04-27 426 472 10.80 Robina 3-17-04-29 239 245 2.51 Robina 3-17-13-01 610 616 0.98 Robina 3-17-13-11 445 446 0.22 Robina 3-17-13-12 333 333 0.00 Robina 3-17-13-13 355 360 1.41 Robina 3-17-13-14 375 377 0.53 Robina 3-17-15-01 385 389 1.04 Robina 3-17-15-04 341 343 0.59 Robina 3-17-15-06 475 477 0.42

Queensland Redistribution Statistics 2006
Enrolment Projections
----------------------------------------------------------------------------------------------------------------------
143
Stephens 3-17-04-08 290 315 8.62
McPherson
---------------------------------------------------------------------------------------------------------------------- SLA Name CCD Number Actual
Enrolment 2/12/2005
Estimate 30/11/2007
Growth (%)
---------------------------------------------------------------------------------------------------------------------- Robina 3-17-15-07 469 473 0.85 Robina 3-17-15-08 640 656 2.50 Robina 3-17-15-09 537 544 1.30 Robina 3-17-15-10 262 268 2.29 Robina 3-17-15-11 279 281 0.72 Robina 3-17-15-12 368 372 1.09 Robina 32 13036 14043 7.72 Stephens 3-17-04-03 393 425 8.14 Stephens 3-17-04-04 1271 1831 44.06
Stephens 3-17-04-11 402 441 9.70 Stephens 3-17-04-12 469 504 7.46 Stephens 3-17-04-19 349 376 7.74 Stephens 3-17-04-20 418 494 18.18 Stephens 3-17-04-28 208 224 7.69
Stephens 8 3800 4610 21.32
Tugun 3-17-14-01 314 320 1.91 Tugun 3-17-14-02 381 396 3.94 Tugun 3-17-14-03 65 65 0.00 Tugun 3-17-14-04 149 162 8.72 Tugun 3-17-14-05 430 452 5.12 Tugun 3-17-14-06 160 167 4.38 Tugun 3-17-14-07 425 431 1.41 Tugun 3-17-14-08 156 163 4.49 Tugun 3-17-14-09 370 390 5.41 Tugun 3-17-14-10 152 163 7.24 Tugun 3-17-14-11 380 388 2.11 Tugun 3-17-14-16 314 333 6.05 Tugun 12 3296 3430 4.07 Worongary-Tallai 3-17-19-06 321 329 2.49 Worongary-Tallai 3-17-19-14 419 429 2.39 Worongary-Tallai 3-17-19-18 342 350 2.34 Worongary-Tallai 3 1082 1108 2.40 McPherson 228 83031 87977 5.96

Queensland Redistribution Statistics 2006
Enrolment Projections
----------------------------------------------------------------------------------------------------------------------
144
Balonne (S) 3-09-11-04 83 79 -4.82
Balonne (S) 3-09-11-06 78 79 1.28
Maranoa
---------------------------------------------------------------------------------------------------------------------- SLA Name CCD Number Actual
Enrolment 2/12/2005
Estimate 30/11/2007
Growth (%)
---------------------------------------------------------------------------------------------------------------------- Aramac (S) 3-03-18-01 58 56 -3.45 Aramac (S) 3-03-18-02 69 63 -8.70 Aramac (S) 3-03-18-03 52 53 1.92 Aramac (S) 3-03-18-04 231 235 1.73 Aramac (S) 3-03-18-05 69 64 -7.25 Aramac (S) 3-03-18-06 47 43 -8.51 Aramac (S) 6 526 514 -2.28 Balonne (S) 3-09-10-01 126 126 0.00 Balonne (S) 3-09-10-02 84 85 1.19 Balonne (S) 3-09-10-03 161 160 -0.62 Balonne (S) 3-09-10-04 138 136 -1.45 Balonne (S) 3-09-10-05 405 415 2.47 Balonne (S) 3-09-10-06 483 504 4.35 Balonne (S) 3-09-10-07 653 680 4.13 Balonne (S) 3-09-11-01 60 62 3.33 Balonne (S) 3-09-11-02 116 117 0.86 Balonne (S) 3-09-11-03 141 141 0.00
Balonne (S) 3-09-11-05 58 61 5.17
Balonne (S) 3-09-11-07 283 286 1.06 Balonne (S) 3-09-11-08 102 105 2.94 Balonne (S) 3-09-11-09 62 63 1.61 Balonne (S) 3-09-11-10 45 47 4.44 Balonne (S) 17 3078 3146 2.21 Barcaldine (S) 3-02-17-01 80 81 1.25 Barcaldine (S) 3-02-17-02 336 336 0.00 Barcaldine (S) 3-02-17-03 539 539 0.00 Barcaldine (S) 3-02-17-04 107 111 3.74 Barcaldine (S) 4 1062 1067 0.47 Barcoo (S) 3-09-02-01 37 38 2.70 Barcoo (S) 3-09-02-02 59 66 11.86 Barcoo (S) 3-09-02-03 117 111 -5.13 Barcoo (S) 3-09-02-04 40 40 0.00 Barcoo (S) 3-09-02-05 9 9 0.00 Barcoo (S) 5 262 264 0.76 Bauhinia (S) 3-08-06-01 59 60 1.69 Bauhinia (S) 3-08-06-02 103 104 0.97 Bauhinia (S) 3-08-06-03 129 130 0.78

Queensland Redistribution Statistics 2006
Enrolment Projections
----------------------------------------------------------------------------------------------------------------------
145
Blackall (S) 3-02-18-03 60 58 -3.33
Blackall (S) 3-02-18-05 296 288 -2.70
Booringa (S) 3-09-09-04 102 102 0.00
Maranoa
---------------------------------------------------------------------------------------------------------------------- SLA Name CCD Number Actual
Enrolment 2/12/2005
Estimate 30/11/2007
Growth (%)
---------------------------------------------------------------------------------------------------------------------- Bauhinia (S) 3-08-06-04 488 490 0.41 Bauhinia (S) 3-08-06-05 144 144 0.00 Bauhinia (S) 3-08-06-06 99 96 -3.03 Bauhinia (S) 3-08-06-07 149 149 0.00 Bauhinia (S) 3-08-06-08 91 92 1.10 Bauhinia (S) 3-08-06-09 150 148 -1.33 Bauhinia (S) 9 1412 1413 0.07 Bendemere (S) 3-08-12-01 143 140 -2.10 Bendemere (S) 3-08-12-02 152 153 0.66 Bendemere (S) 3-08-12-03 165 163 -1.21 Bendemere (S) 3-08-12-04 111 115 3.60 Bendemere (S) 3-08-12-05 111 116 4.50 Bendemere (S) 5 682 687 0.73 Blackall (S) 3-02-18-01 28 29 3.57 Blackall (S) 3-02-18-02 29 28 -3.45
Blackall (S) 3-02-18-04 46 45 -2.17
Blackall (S) 3-02-18-06 26 26 0.00 Blackall (S) 3-02-18-07 67 63 -5.97 Blackall (S) 3-02-18-08 264 261 -1.14 Blackall (S) 3-02-18-09 325 313 -3.69 Blackall (S) 9 1141 1111 -2.63 Booringa (S) 3-09-08-01 151 153 1.32 Booringa (S) 3-09-08-02 76 75 -1.32 Booringa (S) 3-09-08-03 158 154 -2.53 Booringa (S) 3-09-09-01 272 265 -2.57 Booringa (S) 3-09-09-02 313 308 -1.60 Booringa (S) 3-09-09-03 50 50 0.00
Booringa (S) 3-09-09-05 82 83 1.22
Booringa (S) 8 1204 1190 -1.16 Bulloo (S) 3-09-14-01 17 17 0.00 Bulloo (S) 3-09-14-02 36 36 0.00 Bulloo (S) 3-09-14-03 139 141 1.44 Bulloo (S) 3-09-14-04 64 61 -4.69 Bulloo (S) 4 256 255 -0.39

Queensland Redistribution Statistics 2006
Enrolment Projections
----------------------------------------------------------------------------------------------------------------------
146
Chinchilla (S) 3-08-10-08 202 205 1.49
Chinchilla (S) 3-08-10-10 73 75 2.74
Dalby (T) 3-08-17-01 433 452 4.39
Dalby (T) 3-08-17-15 370 385 4.05
Maranoa
---------------------------------------------------------------------------------------------------------------------- SLA Name CCD Number Actual
Enrolment 2/12/2005
Estimate 30/11/2007
Growth (%)
---------------------------------------------------------------------------------------------------------------------- Bungil (S) 3-08-07-01 126 127 0.79 Bungil (S) 3-08-07-02 166 167 0.60 Bungil (S) 3-08-07-03 223 228 2.24 Bungil (S) 3-08-07-04 148 145 -2.03 Bungil (S) 3-08-07-05 110 110 0.00 Bungil (S) 3-08-07-06 165 164 -0.61 Bungil (S) 3-08-07-07 262 262 0.00 Bungil (S) 3-08-07-08 73 76 4.11 Bungil (S) 3-08-07-09 162 164 1.23 Bungil (S) 9 1435 1443 0.56 Chinchilla (S) 3-08-10-01 56 55 -1.79 Chinchilla (S) 3-08-10-02 325 330 1.54 Chinchilla (S) 3-08-10-03 388 397 2.32 Chinchilla (S) 3-08-10-04 269 278 3.35 Chinchilla (S) 3-08-10-05 604 619 2.48 Chinchilla (S) 3-08-10-06 430 438 1.86 Chinchilla (S) 3-08-10-07 323 329 1.86
Chinchilla (S) 3-08-10-09 279 289 3.58
Chinchilla (S) 3-08-10-11 10 11 10.00 Chinchilla (S) 3-08-10-12 126 128 1.59 Chinchilla (S) 3-08-10-13 248 254 2.42 Chinchilla (S) 3-08-10-14 200 203 1.50 Chinchilla (S) 3-08-10-15 402 427 6.22 Chinchilla (S) 15 3935 4038 2.62
Dalby (T) 3-08-17-02 440 442 0.45 Dalby (T) 3-08-17-03 447 447 0.00 Dalby (T) 3-08-17-04 431 441 2.32 Dalby (T) 3-08-17-05 290 299 3.10 Dalby (T) 3-08-17-06 333 354 6.31 Dalby (T) 3-08-17-07 127 136 7.09 Dalby (T) 3-08-17-08 121 124 2.48 Dalby (T) 3-08-17-09 454 467 2.86 Dalby (T) 3-08-17-10 664 674 1.51 Dalby (T) 3-08-17-11 357 366 2.52 Dalby (T) 3-08-17-12 267 277 3.75 Dalby (T) 3-08-17-13 223 229 2.69 Dalby (T) 3-08-17-14 207 218 5.31
Dalby (T) 3-08-17-16 156 162 3.85 Dalby (T) 3-08-17-17 478 501 4.81

Queensland Redistribution Statistics 2006
Enrolment Projections
----------------------------------------------------------------------------------------------------------------------
147
Emerald (S) 3-08-02-10 352 358 1.70
Emerald (S) 3-08-03-05 52 53 1.92
Emerald (S) 3-08-03-07 112 114 1.79
Maranoa
---------------------------------------------------------------------------------------------------------------------- SLA Name CCD Number Actual
Enrolment 2/12/2005
Estimate 30/11/2007
Growth (%)
---------------------------------------------------------------------------------------------------------------------- Dalby (T) 3-08-17-18 251 253 0.80 Dalby (T) 3-08-17-19 256 261 1.95 Dalby (T) 19 6305 6488 2.90 Diamantina (S) 3-09-01-01 11 11 0.00 Diamantina (S) 3-09-01-02 132 135 2.27 Diamantina (S) 3-09-01-03 7 6 -14.29 Diamantina (S) 3-09-01-04 8 8 0.00 Diamantina (S) 4 158 160 1.27 Emerald (S) 3-08-02-01 524 545 4.01 Emerald (S) 3-08-02-02 133 138 3.76 Emerald (S) 3-08-02-03 524 542 3.44 Emerald (S) 3-08-02-04 221 221 0.00 Emerald (S) 3-08-02-05 344 348 1.16 Emerald (S) 3-08-02-06 366 373 1.91 Emerald (S) 3-08-02-07 443 451 1.81 Emerald (S) 3-08-02-08 513 518 0.97 Emerald (S) 3-08-02-09 234 245 4.70
Emerald (S) 3-08-02-11 455 469 3.08 Emerald (S) 3-08-02-12 213 230 7.98 Emerald (S) 3-08-02-13 457 507 10.94 Emerald (S) 3-08-02-14 466 488 4.72 Emerald (S) 3-08-02-15 378 394 4.23 Emerald (S) 3-08-02-16 486 486 0.00 Emerald (S) 3-08-02-17 501 521 3.99 Emerald (S) 3-08-03-01 267 271 1.50 Emerald (S) 3-08-03-02 343 348 1.46 Emerald (S) 3-08-03-03 87 89 2.30 Emerald (S) 3-08-03-04 62 63 1.61
Emerald (S) 3-08-03-06 241 254 5.39
Emerald (S) 3-08-03-08 55 56 1.82 Emerald (S) 3-08-03-09 86 88 2.33 Emerald (S) 3-08-03-10 60 62 3.33 Emerald (S) 27 7975 8232 3.22 Goondiwindi (T) 3-08-19-01 688 710 3.20 Goondiwindi (T) 3-08-19-02 285 288 1.05 Goondiwindi (T) 3-08-19-03 444 458 3.15 Goondiwindi (T) 3-08-19-04 384 392 2.08 Goondiwindi (T) 3-08-19-05 356 363 1.97

Queensland Redistribution Statistics 2006
Enrolment Projections
----------------------------------------------------------------------------------------------------------------------
148
Jericho (S) 3-03-17-04 71 69 -2.82
Maranoa
---------------------------------------------------------------------------------------------------------------------- SLA Name CCD Number Actual
Enrolment 2/12/2005
Estimate 30/11/2007
Growth (%)
---------------------------------------------------------------------------------------------------------------------- Goondiwindi (T) 3-08-19-06 412 455 10.44 Goondiwindi (T) 3-08-19-07 407 420 3.19 Goondiwindi (T) 7 2976 3086 3.70 Ilfracombe (S) 3-02-16-01 58 58 0.00 Ilfracombe (S) 3-02-16-02 100 100 0.00 Ilfracombe (S) 3-02-16-03 35 35 0.00 Ilfracombe (S) 3 193 193 0.00 Inglewood (S) 3-15-05-01 288 285 -1.04 Inglewood (S) 3-15-05-02 81 82 1.23 Inglewood (S) 3-15-05-03 83 82 -1.20 Inglewood (S) 3-15-05-04 172 171 -0.58 Inglewood (S) 3-15-05-05 320 319 -0.31 Inglewood (S) 3-15-05-06 145 144 -0.69 Inglewood (S) 3-15-05-07 240 241 0.42 Inglewood (S) 3-15-05-08 179 175 -2.23 Inglewood (S) 3-15-05-09 216 213 -1.39 Inglewood (S) 3-15-05-10 100 101 1.00 Inglewood (S) 10 1824 1813 -0.60 Isisford (S) 3-02-19-01 44 44 0.00 Isisford (S) 3-02-19-02 42 41 -2.38 Isisford (S) 3-02-19-03 94 94 0.00 Isisford (S) 3 180 179 -0.56 Jericho (S) 3-03-17-01 105 108 2.86 Jericho (S) 3-03-17-02 222 223 0.45 Jericho (S) 3-03-17-03 82 83 1.22
Jericho (S) 3-03-17-05 71 71 0.00 Jericho (S) 3-03-17-06 100 99 -1.00 Jericho (S) 6 651 653 0.31 Longreach (S) 3-02-15-01 49 50 2.04 Longreach (S) 3-02-15-02 279 279 0.00 Longreach (S) 3-02-15-03 117 117 0.00 Longreach (S) 3-02-15-04 447 448 0.22 Longreach (S) 3-02-15-05 26 26 0.00 Longreach (S) 3-02-15-06 71 69 -2.82 Longreach (S) 3-02-15-07 227 227 0.00 Longreach (S) 3-02-15-08 125 126 0.80
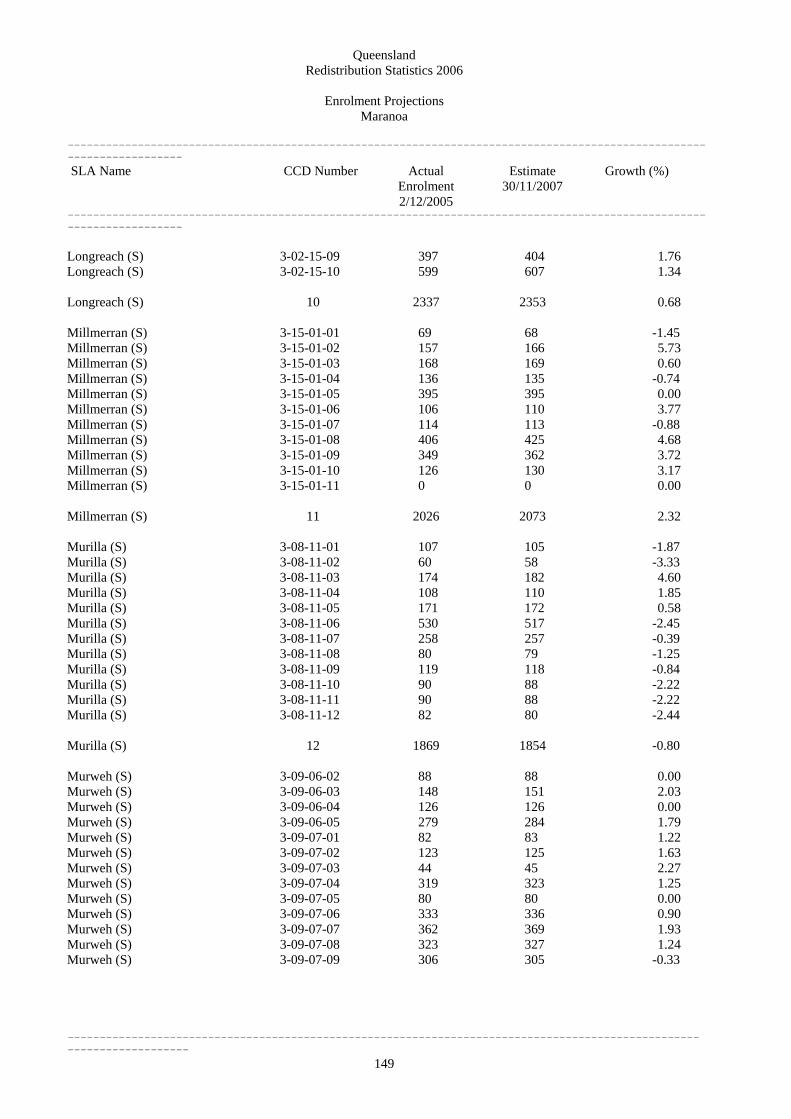
Queensland Redistribution Statistics 2006
Enrolment Projections
----------------------------------------------------------------------------------------------------------------------
149
Murilla (S) 3-08-11-12 82 80 -2.44
Maranoa
---------------------------------------------------------------------------------------------------------------------- SLA Name CCD Number Actual
Enrolment 2/12/2005
Estimate 30/11/2007
Growth (%)
---------------------------------------------------------------------------------------------------------------------- Longreach (S) 3-02-15-09 397 404 1.76 Longreach (S) 3-02-15-10 599 607 1.34 Longreach (S) 10 2337 2353 0.68 Millmerran (S) 3-15-01-01 69 68 -1.45 Millmerran (S) 3-15-01-02 157 166 5.73 Millmerran (S) 3-15-01-03 168 169 0.60 Millmerran (S) 3-15-01-04 136 135 -0.74 Millmerran (S) 3-15-01-05 395 395 0.00 Millmerran (S) 3-15-01-06 106 110 3.77 Millmerran (S) 3-15-01-07 114 113 -0.88 Millmerran (S) 3-15-01-08 406 425 4.68 Millmerran (S) 3-15-01-09 349 362 3.72 Millmerran (S) 3-15-01-10 126 130 3.17 Millmerran (S) 3-15-01-11 0 0 0.00 Millmerran (S) 11 2026 2073 2.32 Murilla (S) 3-08-11-01 107 105 -1.87 Murilla (S) 3-08-11-02 60 58 -3.33 Murilla (S) 3-08-11-03 174 182 4.60 Murilla (S) 3-08-11-04 108 110 1.85 Murilla (S) 3-08-11-05 171 172 0.58 Murilla (S) 3-08-11-06 530 517 -2.45 Murilla (S) 3-08-11-07 258 257 -0.39 Murilla (S) 3-08-11-08 80 79 -1.25 Murilla (S) 3-08-11-09 119 118 -0.84 Murilla (S) 3-08-11-10 90 88 -2.22 Murilla (S) 3-08-11-11 90 88 -2.22
Murilla (S) 12 1869 1854 -0.80 Murweh (S) 3-09-06-02 88 88 0.00 Murweh (S) 3-09-06-03 148 151 2.03 Murweh (S) 3-09-06-04 126 126 0.00 Murweh (S) 3-09-06-05 279 284 1.79 Murweh (S) 3-09-07-01 82 83 1.22 Murweh (S) 3-09-07-02 123 125 1.63 Murweh (S) 3-09-07-03 44 45 2.27 Murweh (S) 3-09-07-04 319 323 1.25 Murweh (S) 3-09-07-05 80 80 0.00 Murweh (S) 3-09-07-06 333 336 0.90 Murweh (S) 3-09-07-07 362 369 1.93 Murweh (S) 3-09-07-08 323 327 1.24 Murweh (S) 3-09-07-09 306 305 -0.33

Queensland Redistribution Statistics 2006
Enrolment Projections
----------------------------------------------------------------------------------------------------------------------
150
Quilpie (S) 3-09-04-02 29 31 6.90
Maranoa
---------------------------------------------------------------------------------------------------------------------- SLA Name CCD Number Actual
Enrolment 2/12/2005
Estimate 30/11/2007
Growth (%)
---------------------------------------------------------------------------------------------------------------------- Murweh (S) 3-09-07-10 39 39 0.00 Murweh (S) 3-09-07-11 71 74 4.23 Murweh (S) 3-09-07-12 328 328 0.00 Murweh (S) 16 3051 3083 1.05 Paroo (S) 3-09-12-01 75 70 -6.67 Paroo (S) 3-09-12-02 84 82 -2.38 Paroo (S) 3-09-12-03 75 76 1.33 Paroo (S) 3-09-12-04 110 111 0.91 Paroo (S) 3-09-13-01 37 38 2.70 Paroo (S) 3-09-13-02 309 313 1.29 Paroo (S) 3-09-13-03 102 98 -3.92 Paroo (S) 3-09-13-04 248 248 0.00 Paroo (S) 3-09-13-05 271 272 0.37 Paroo (S) 3-09-13-06 83 79 -4.82 Paroo (S) 10 1394 1387 -0.50 Peak Downs (S) 3-08-01-01 96 100 4.17 Peak Downs (S) 3-08-01-02 475 485 2.11 Peak Downs (S) 3-08-01-03 222 228 2.70 Peak Downs (S) 3-08-01-04 163 167 2.45 Peak Downs (S) 3-08-01-05 528 536 1.52 Peak Downs (S) 3-08-01-06 278 277 -0.36 Peak Downs (S) 6 1762 1793 1.76 Quilpie (S) 3-09-03-01 21 20 -4.76 Quilpie (S) 3-09-04-01 50 48 -4.00
Quilpie (S) 3-09-04-03 38 37 -2.63 Quilpie (S) 3-09-04-04 14 15 7.14 Quilpie (S) 3-09-04-05 26 25 -3.85 Quilpie (S) 3-09-04-06 52 48 -7.69 Quilpie (S) 3-09-04-07 32 33 3.12 Quilpie (S) 3-09-04-08 376 369 -1.86 Quilpie (S) 3-09-04-09 47 50 6.38 Quilpie (S) 10 685 676 -1.31 Roma (T) 3-08-08-01 314 316 0.64 Roma (T) 3-08-08-02 422 426 0.95 Roma (T) 3-08-08-03 162 164 1.23 Roma (T) 3-08-08-04 371 373 0.54 Roma (T) 3-08-08-05 310 314 1.29 Roma (T) 3-08-08-06 212 212 0.00

Queensland Redistribution Statistics 2006
Enrolment Projections
----------------------------------------------------------------------------------------------------------------------
151
Maranoa
---------------------------------------------------------------------------------------------------------------------- SLA Name CCD Number Actual
Enrolment 2/12/2005
Estimate 30/11/2007
Growth (%)
---------------------------------------------------------------------------------------------------------------------- Roma (T) 3-08-08-07 243 241 -0.82 Roma (T) 3-08-08-08 393 400 1.78 Roma (T) 3-08-08-09 386 385 -0.26 Roma (T) 3-08-08-10 524 527 0.57 Roma (T) 3-08-08-11 524 523 -0.19 Roma (T) 3-08-08-12 351 354 0.85 Roma (T) 12 4212 4235 0.55 Stanthorpe (S) 3-15-06-01 149 148 -0.67 Stanthorpe (S) 3-15-06-02 134 137 2.24 Stanthorpe (S) 3-15-06-03 491 498 1.43 Stanthorpe (S) 3-15-06-04 305 308 0.98 Stanthorpe (S) 3-15-06-05 50 51 2.00 Stanthorpe (S) 3-15-06-06 101 104 2.97 Stanthorpe (S) 3-15-06-07 266 268 0.75 Stanthorpe (S) 3-15-06-08 0 0 0.00 Stanthorpe (S) 3-15-06-09 211 213 0.95 Stanthorpe (S) 3-15-06-10 414 418 0.97 Stanthorpe (S) 3-15-06-11 417 425 1.92 Stanthorpe (S) 3-15-06-12 276 282 2.17 Stanthorpe (S) 3-15-07-01 261 263 0.77 Stanthorpe (S) 3-15-07-02 374 373 -0.27 Stanthorpe (S) 3-15-07-03 218 220 0.92 Stanthorpe (S) 3-15-07-04 580 586 1.03 Stanthorpe (S) 3-15-07-05 532 534 0.38 Stanthorpe (S) 3-15-07-06 357 362 1.40 Stanthorpe (S) 3-15-07-07 338 344 1.78 Stanthorpe (S) 3-15-07-08 221 232 4.98 Stanthorpe (S) 3-15-07-09 411 416 1.22 Stanthorpe (S) 3-15-07-10 418 424 1.44 Stanthorpe (S) 3-15-07-11 282 285 1.06 Stanthorpe (S) 3-15-07-12 466 478 2.58 Stanthorpe (S) 24 7272 7369 1.33 Tambo (S) 3-09-05-01 62 63 1.61 Tambo (S) 3-09-05-02 89 91 2.25 Tambo (S) 3-09-05-03 257 261 1.56 Tambo (S) 3-09-06-01 35 35 0.00 Tambo (S) 4 443 450 1.58 Tara (S) 3-08-14-01 62 63 1.61 Tara (S) 3-08-14-02 104 105 0.96 Tara (S) 3-08-14-03 125 122 -2.40 Tara (S) 3-08-14-04 282 284 0.71

Queensland Redistribution Statistics 2006
Enrolment Projections
----------------------------------------------------------------------------------------------------------------------
152
----------------------------------------------------------------------------------------------------------------------
Maranoa
SLA Name CCD Number Actual Enrolment 2/12/2005
Estimate 30/11/2007
Growth (%)
---------------------------------------------------------------------------------------------------------------------- Tara (S) 3-08-14-05 73 74 1.37 Tara (S) 3-08-14-06 259 261 0.77 Tara (S) 3-08-14-07 234 234 0.00 Tara (S) 3-08-14-08 213 215 0.94 Tara (S) 3-08-14-09 145 146 0.69 Tara (S) 3-08-14-10 165 168 1.82 Tara (S) 3-08-14-11 263 264 0.38 Tara (S) 3-08-14-12 132 135 2.27 Tara (S) 3-08-14-13 174 175 0.57 Tara (S) 3-08-14-14 144 145 0.69 Tara (S) 14 2375 2391 0.67 Taroom (S) 3-08-09-01 85 84 -1.18 Taroom (S) 3-08-09-02 95 93 -2.11 Taroom (S) 3-08-09-03 201 198 -1.49 Taroom (S) 3-08-09-04 451 452 0.22 Taroom (S) 3-08-09-05 102 97 -4.90 Taroom (S) 3-08-09-06 64 64 0.00 Taroom (S) 3-08-09-07 148 143 -3.38 Taroom (S) 3-08-09-08 194 193 -0.52 Taroom (S) 3-08-09-09 259 257 -0.77 Taroom (S) 3-08-09-10 95 98 3.16 Taroom (S) 3-08-09-11 123 121 -1.63 Taroom (S) 11 1817 1800 -0.94 Waggamba (S) 3-08-18-01 101 99 -1.98 Waggamba (S) 3-08-18-02 76 78 2.63 Waggamba (S) 3-08-18-03 77 78 1.30 Waggamba (S) 3-08-18-04 62 62 0.00 Waggamba (S) 3-08-18-05 146 150 2.74 Waggamba (S) 3-08-18-06 183 185 1.09 Waggamba (S) 3-08-18-07 143 147 2.80 Waggamba (S) 3-08-18-08 340 353 3.82 Waggamba (S) 3-08-18-09 92 93 1.09 Waggamba (S) 3-08-18-10 101 102 0.99 Waggamba (S) 3-08-18-11 144 148 2.78 Waggamba (S) 3-08-18-12 539 565 4.82 Waggamba (S) 12 2004 2060 2.79 Wambo (S) 3-08-15-01 162 165 1.85 Wambo (S) 3-08-15-02 568 574 1.06 Wambo (S) 3-08-15-03 144 144 0.00 Wambo (S) 3-08-15-04 117 118 0.85 Wambo (S) 3-08-15-05 90 89 -1.11

Queensland Redistribution Statistics 2006
Enrolment Projections
----------------------------------------------------------------------------------------------------------------------
153
Maranoa
---------------------------------------------------------------------------------------------------------------------- SLA Name CCD Number Actual
Enrolment 2/12/2005
Estimate 30/11/2007
Growth (%)
---------------------------------------------------------------------------------------------------------------------- Wambo (S) 3-08-15-06 57 60 5.26 Wambo (S) 3-08-15-07 156 158 1.28 Wambo (S) 3-08-15-08 143 148 3.50 Wambo (S) 3-08-15-09 182 184 1.10 Wambo (S) 3-08-16-01 328 336 2.44 Wambo (S) 3-08-16-02 197 202 2.54 Wambo (S) 3-08-16-03 153 151 -1.31 Wambo (S) 3-08-16-04 163 168 3.07 Wambo (S) 3-08-16-05 193 196 1.55 Wambo (S) 3-08-16-06 302 307 1.66 Wambo (S) 3-08-16-07 198 199 0.51 Wambo (S) 3-08-16-08 215 219 1.86 Wambo (S) 3-08-16-09 231 233 0.87 Wambo (S) 18 3599 3651 1.44
Warroo (S) 3-08-13-01 77 76 -1.30 Warroo (S) 3-08-13-02 56 51 -8.93 Warroo (S) 3-08-13-03 321 328 2.18 Warroo (S) 3-08-13-04 95 96 1.05 Warroo (S) 3-08-13-05 137 137 0.00 Warroo (S) 3-08-13-06 89 90 1.12 Warroo (S) 6 775 778 0.39 Warwick (S) - Central 3-15-09-01 505 529 4.75 Warwick (S) - Central 3-15-09-02 574 597 4.01 Warwick (S) - Central 3-15-09-03 454 462 1.76 Warwick (S) - Central 3-15-09-04 251 254 1.20 Warwick (S) - Central 3-15-09-05 384 386 0.52 Warwick (S) - Central 3-15-09-06 307 319 3.91 Warwick (S) - Central 3-15-09-07 315 316 0.32 Warwick (S) - Central 3-15-09-08 321 329 2.49 Warwick (S) - Central 3-15-09-09 243 248 2.06 Warwick (S) - Central 3-15-09-10 309 312 0.97 Warwick (S) - Central 3-15-09-11 295 299 1.36 Warwick (S) - Central 3-15-09-12 519 538 3.66 Warwick (S) - Central 3-15-10-01 487 485 -0.41 Warwick (S) - Central 3-15-10-02 288 286 -0.69 Warwick (S) - Central 3-15-10-03 583 600 2.92 Warwick (S) - Central 3-15-10-04 384 388 1.04 Warwick (S) - Central 3-15-10-05 440 443 0.68 Warwick (S) - Central 3-15-10-06 480 480 0.00 Warwick (S) - Central 3-15-10-07 340 353 3.82 Warwick (S) - Central 19 7479 7624 1.94
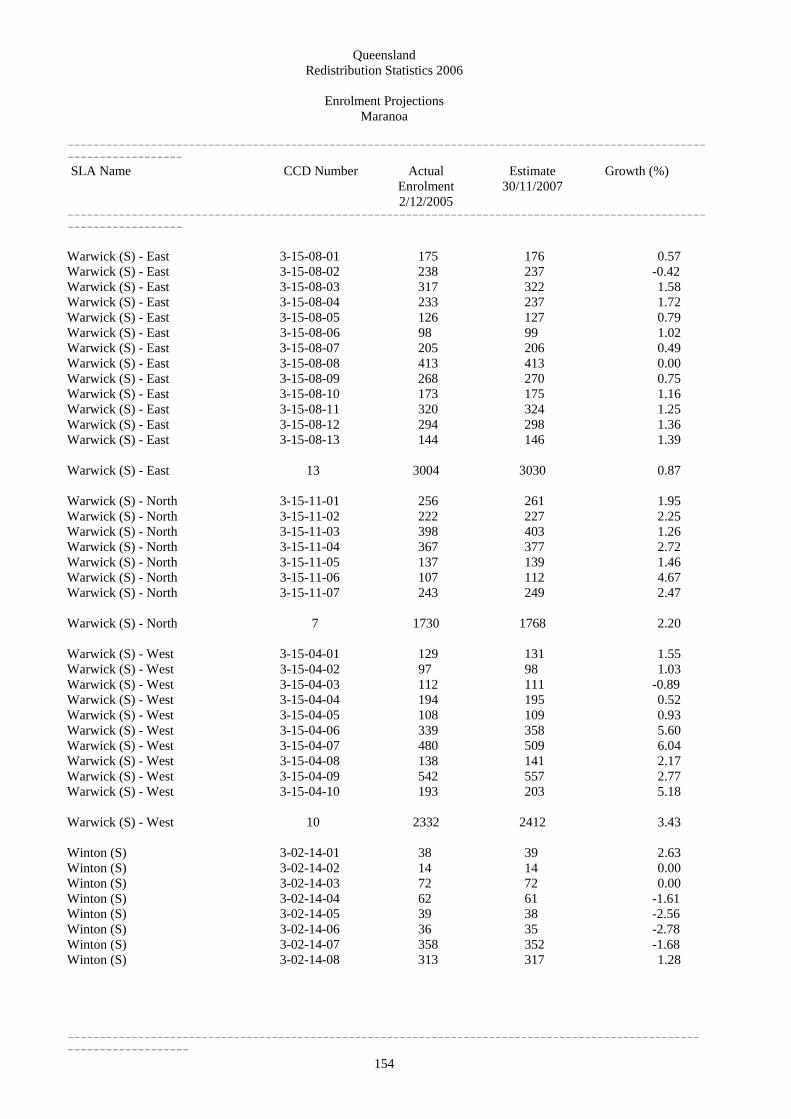
Queensland Redistribution Statistics 2006
Enrolment Projections
----------------------------------------------------------------------------------------------------------------------
154
Warwick (S) - East 3-15-08-13 144 146 1.39
Maranoa
---------------------------------------------------------------------------------------------------------------------- SLA Name CCD Number Actual
Enrolment 2/12/2005
Estimate 30/11/2007
Growth (%)
---------------------------------------------------------------------------------------------------------------------- Warwick (S) - East 3-15-08-01 175 176 0.57 Warwick (S) - East 3-15-08-02 238 237 -0.42 Warwick (S) - East 3-15-08-03 317 322 1.58 Warwick (S) - East 3-15-08-04 233 237 1.72 Warwick (S) - East 3-15-08-05 126 127 0.79 Warwick (S) - East 3-15-08-06 98 99 1.02 Warwick (S) - East 3-15-08-07 205 206 0.49 Warwick (S) - East 3-15-08-08 413 413 0.00 Warwick (S) - East 3-15-08-09 268 270 0.75 Warwick (S) - East 3-15-08-10 173 175 1.16 Warwick (S) - East 3-15-08-11 320 324 1.25 Warwick (S) - East 3-15-08-12 294 298 1.36
Warwick (S) - East 13 3004 3030 0.87 Warwick (S) - North 3-15-11-01 256 261 1.95 Warwick (S) - North 3-15-11-02 222 227 2.25 Warwick (S) - North 3-15-11-03 398 403 1.26 Warwick (S) - North 3-15-11-04 367 377 2.72 Warwick (S) - North 3-15-11-05 137 139 1.46 Warwick (S) - North 3-15-11-06 107 112 4.67 Warwick (S) - North 3-15-11-07 243 249 2.47 Warwick (S) - North 7 1730 1768 2.20 Warwick (S) - West 3-15-04-01 129 131 1.55 Warwick (S) - West 3-15-04-02 97 98 1.03 Warwick (S) - West 3-15-04-03 112 111 -0.89 Warwick (S) - West 3-15-04-04 194 195 0.52 Warwick (S) - West 3-15-04-05 108 109 0.93 Warwick (S) - West 3-15-04-06 339 358 5.60 Warwick (S) - West 3-15-04-07 480 509 6.04 Warwick (S) - West 3-15-04-08 138 141 2.17 Warwick (S) - West 3-15-04-09 542 557 2.77 Warwick (S) - West 3-15-04-10 193 203 5.18 Warwick (S) - West 10 2332 2412 3.43 Winton (S) 3-02-14-01 38 39 2.63 Winton (S) 3-02-14-02 14 14 0.00 Winton (S) 3-02-14-03 72 72 0.00 Winton (S) 3-02-14-04 62 61 -1.61 Winton (S) 3-02-14-05 39 38 -2.56 Winton (S) 3-02-14-06 36 35 -2.78 Winton (S) 3-02-14-07 358 352 -1.68 Winton (S) 3-02-14-08 313 317 1.28

Queensland Redistribution Statistics 2006
Enrolment Projections
----------------------------------------------------------------------------------------------------------------------
155
----------------------------------------------------------------------------------------------------------------------
Maranoa
SLA Name CCD Number Actual Enrolment 2/12/2005
Estimate 30/11/2007
Growth (%)
---------------------------------------------------------------------------------------------------------------------- Winton (S) 3-02-14-09 34 34 0.00 Winton (S) 9 966 962 -0.41 Maranoa 404 86387 87681 1.50

Queensland Redistribution Statistics 2006
Enrolment Projections
----------------------------------------------------------------------------------------------------------------------
156
Estimate 30/11/2007
Ashmore 3-16-20-01 294 296 0.68
Moncrieff
---------------------------------------------------------------------------------------------------------------------- SLA Name CCD Number Actual
Enrolment 2/12/2005
Growth (%)
----------------------------------------------------------------------------------------------------------------------
Ashmore 3-16-20-02 518 524 1.16 Ashmore 3-16-20-03 193 193 0.00 Ashmore 3-16-20-04 534 570 6.74 Ashmore 3-16-20-05 573 583 1.75 Ashmore 3-16-20-06 386 385 -0.26 Ashmore 3-16-20-07 583 582 -0.17 Ashmore 3-16-20-08 429 439 2.33 Ashmore 3-16-20-09 852 865 1.53 Ashmore 3-16-20-10 536 547 2.05 Ashmore 3-16-20-11 461 474 2.82 Ashmore 3-16-21-03 407 431 5.90 Ashmore 3-16-21-04 673 684 1.63 Ashmore 3-16-21-11 467 488 4.50 Ashmore 14 6906 7061 2.24 Benowa 3-16-21-01 586 608 3.75 Benowa 3-16-21-02 269 287 6.69 Benowa 3-16-21-05 510 531 4.12 Benowa 3-16-21-06 318 328 3.14 Benowa 3-16-21-07 202 204 0.99 Benowa 3-16-21-08 338 347 2.66 Benowa 3-16-21-09 354 363 2.54 Benowa 3-16-21-10 612 625 2.12 Benowa 3-16-21-12 254 256 0.79 Benowa 3-16-21-13 652 739 13.34 Benowa 3-16-21-14 438 457 4.34 Benowa 11 4533 4745 4.68 Broadbeach 3-17-07-01 250 256 2.40 Broadbeach 3-17-07-02 165 166 0.61 Broadbeach 3-17-07-03 283 290 2.47 Broadbeach 3-17-07-04 138 135 -2.17 Broadbeach 3-17-07-05 207 207 0.00 Broadbeach 3-17-07-06 204 193 -5.39 Broadbeach 3-17-07-07 152 155 1.97 Broadbeach 3-17-07-08 116 148 27.59 Broadbeach 3-17-07-09 114 110 -3.51 Broadbeach 3-17-07-10 79 117 48.10 Broadbeach 3-17-07-11 186 180 -3.23 Broadbeach 3-17-07-12 138 136 -1.45 Broadbeach 3-17-07-13 75 71 -5.33 Broadbeach 3-17-07-14 120 121 0.83 Broadbeach 3-17-07-15 19 17 -10.53 Broadbeach 15 2246 2302 2.49

Queensland Redistribution Statistics 2006
Enrolment Projections
----------------------------------------------------------------------------------------------------------------------
157
Broadbeach Waters 3-17-06-05 335 340 1.49
Moncrieff
---------------------------------------------------------------------------------------------------------------------- SLA Name CCD Number Actual
Enrolment 2/12/2005
Estimate 30/11/2007
Growth (%)
---------------------------------------------------------------------------------------------------------------------- Broadbeach Waters 3-17-06-01 278 277 -0.36 Broadbeach Waters 3-17-06-02 304 310 1.97 Broadbeach Waters 3-17-06-03 459 461 0.44 Broadbeach Waters 3-17-06-04 382 387 1.31
Broadbeach Waters 3-17-06-06 394 400 1.52 Broadbeach Waters 3-17-06-07 218 220 0.92 Broadbeach Waters 3-17-06-08 257 258 0.39 Broadbeach Waters 3-17-06-09 199 209 5.03 Broadbeach Waters 3-17-06-10 82 84 2.44 Broadbeach Waters 3-17-06-11 125 126 0.80 Broadbeach Waters 3-17-06-12 345 349 1.16 Broadbeach Waters 3-17-06-13 457 461 0.88 Broadbeach Waters 3-17-06-14 220 224 1.82 Broadbeach Waters 3-17-06-15 259 261 0.77 Broadbeach Waters 3-17-06-16 441 436 -1.13 Broadbeach Waters 3-17-15-13 408 411 0.74 Broadbeach Waters 17 5163 5214 0.99 Bundall 3-16-10-02 559 559 0.00 Bundall 3-16-10-03 409 423 3.42 Bundall 3-16-10-04 557 572 2.69 Bundall 3-16-10-05 280 280 0.00 Bundall 3-16-10-06 519 512 -1.35 Bundall 3-16-10-13 376 402 6.91 Bundall 6 2700 2748 1.78 Burleigh Waters 3-17-03-01 356 358 0.56 Burleigh Waters 3-17-03-07 324 335 3.40 Burleigh Waters 3-17-03-12 631 632 0.16 Burleigh Waters 3-17-04-05 368 381 3.53 Burleigh Waters 3-17-04-10 455 463 1.76 Burleigh Waters 3-17-04-14 382 394 3.14 Burleigh Waters 6 2516 2563 1.87 Carrara-Merrimac 3-17-21-01 751 775 3.20 Carrara-Merrimac 3-17-21-02 320 347 8.44 Carrara-Merrimac 3-17-21-03 353 441 24.93 Carrara-Merrimac 3-17-21-05 502 525 4.58 Carrara-Merrimac 3-17-21-06 697 738 5.88 Carrara-Merrimac 3-17-21-07 349 364 4.30 Carrara-Merrimac 3-17-21-08 694 729 5.04 Carrara-Merrimac 3-17-21-09 457 478 4.60 Carrara-Merrimac 3-17-21-11 337 356 5.64

Queensland Redistribution Statistics 2006
Enrolment Projections
----------------------------------------------------------------------------------------------------------------------
158
Mermaid Beach 3-17-08-02 202 205 1.49
Mermaid Beach 3-17-08-11 256 255 -0.39
Mermaid Beach 3-17-08-13 336 351 4.46
Moncrieff
---------------------------------------------------------------------------------------------------------------------- SLA Name CCD Number Actual
Enrolment 2/12/2005
Estimate 30/11/2007
Growth (%)
---------------------------------------------------------------------------------------------------------------------- Carrara-Merrimac 3-17-21-12 470 488 3.83 Carrara-Merrimac 3-17-21-13 568 629 10.74 Carrara-Merrimac 3-17-21-14 224 364 62.50 Carrara-Merrimac 3-17-21-18 333 344 3.30 Carrara-Merrimac 3-17-21-19 214 257 20.09 Carrara-Merrimac 3-17-21-20 572 640 11.89 Carrara-Merrimac 3-17-21-21 276 288 4.35 Carrara-Merrimac 16 7117 7763 9.08 Guanaba-Currumbin Valley 3-17-19-13 111 134 20.72 Guanaba-Currumbin Valley 3-17-19-15 387 415 7.24 Guanaba-Currumbin Valley 2 498 549 10.24 Main Beach-Broadwater 3-16-23-03 193 199 3.11 Main Beach-Broadwater 3-16-23-04 122 123 0.82 Main Beach-Broadwater 3-16-23-05 142 143 0.70 Main Beach-Broadwater 3-16-23-06 247 268 8.50 Main Beach-Broadwater 3-16-23-07 129 128 -0.78 Main Beach-Broadwater 3-16-23-08 77 77 0.00 Main Beach-Broadwater 3-16-23-09 372 366 -1.61 Main Beach-Broadwater 3-16-23-10 121 125 3.31 Main Beach-Broadwater 3-16-23-11 166 165 -0.60 Main Beach-Broadwater 3-16-23-12 123 126 2.44 Main Beach-Broadwater 3-16-23-13 168 172 2.38 Main Beach-Broadwater 3-16-23-14 71 73 2.82 Main Beach-Broadwater 3-16-23-15 386 413 6.99 Main Beach-Broadwater 13 2317 2378 2.63 Mermaid Beach 3-17-08-01 352 363 3.12
Mermaid Beach 3-17-08-03 130 135 3.85 Mermaid Beach 3-17-08-04 253 267 5.53 Mermaid Beach 3-17-08-05 454 542 19.38 Mermaid Beach 3-17-08-06 360 371 3.06 Mermaid Beach 3-17-08-07 258 264 2.33 Mermaid Beach 3-17-08-08 297 310 4.38 Mermaid Beach 3-17-08-09 161 169 4.97 Mermaid Beach 3-17-08-10 296 308 4.05
Mermaid Beach 3-17-08-12 103 107 3.88
Mermaid Beach 13 3458 3647 5.47

Queensland Redistribution Statistics 2006
Enrolment Projections
----------------------------------------------------------------------------------------------------------------------
159
Estimate 30/11/2007
Moncrieff
---------------------------------------------------------------------------------------------------------------------- SLA Name CCD Number Actual
Enrolment 2/12/2005
Growth (%)
---------------------------------------------------------------------------------------------------------------------- Mermaid Wtrs-Clear Is. Wtrs 3-17-05-01 311 316 1.61 Mermaid Wtrs-Clear Is. Wtrs 3-17-05-03 490 493 0.61 Mermaid Wtrs-Clear Is. Wtrs 3-17-05-06 308 311 0.97 Mermaid Wtrs-Clear Is. Wtrs 3-17-05-07 261 266 1.92 Mermaid Wtrs-Clear Is. Wtrs 3-17-05-08 549 556 1.28 Mermaid Wtrs-Clear Is. Wtrs 3-17-05-09 266 279 4.89 Mermaid Wtrs-Clear Is. Wtrs 3-17-05-10 194 196 1.03 Mermaid Wtrs-Clear Is. Wtrs 3-17-05-11 437 446 2.06 Mermaid Wtrs-Clear Is. Wtrs 3-17-05-12 360 369 2.50 Mermaid Wtrs-Clear Is. Wtrs 3-17-05-13 406 409 0.74 Mermaid Wtrs-Clear Is. Wtrs 3-17-13-02 222 226 1.80 Mermaid Wtrs-Clear Is. Wtrs 3-17-13-04 643 647 0.62 Mermaid Wtrs-Clear Is. Wtrs 3-17-13-05 319 330 3.45 Mermaid Wtrs-Clear Is. Wtrs 3-17-13-06 453 458 1.10 Mermaid Wtrs-Clear Is. Wtrs 3-17-13-07 359 363 1.11 Mermaid Wtrs-Clear Is. Wtrs 3-17-13-08 370 374 1.08 Mermaid Wtrs-Clear Is. Wtrs 3-17-13-10 271 273 0.74 Mermaid Wtrs-Clear Is. Wtrs 3-17-13-15 309 321 3.88 Mermaid Wtrs-Clear Is. Wtrs 18 6528 6633 1.61 Miami 3-17-09-01 289 295 2.08 Miami 3-17-09-02 227 222 -2.20 Miami 3-17-09-03 309 322 4.21 Miami 3-17-09-04 265 282 6.42 Miami 3-17-09-05 266 284 6.77 Miami 3-17-09-06 350 387 10.57 Miami 3-17-09-07 180 186 3.33 Miami 3-17-09-08 65 70 7.69 Miami 3-17-09-09 446 452 1.35 Miami 3-17-09-10 202 203 0.50 Miami 3-17-09-11 212 235 10.85 Miami 3-17-09-12 107 109 1.87 Miami 3-17-09-13 337 357 5.93 Miami 3-17-09-14 342 347 1.46 Miami 3-17-09-15 179 178 -0.56 Miami 15 3776 3929 4.05 Nerang 3-16-04-04 359 364 1.39 Nerang 3-16-04-07 527 534 1.33 Nerang 3-16-04-08 632 646 2.22 Nerang 3-16-04-11 543 561 3.31 Nerang 3-16-08-01 757 815 7.66 Nerang 3-16-08-02 351 374 6.55 Nerang 3-16-08-03 375 384 2.40 Nerang 3-16-08-04 607 626 3.13

Queensland Redistribution Statistics 2006
Enrolment Projections
----------------------------------------------------------------------------------------------------------------------
160
Estimate 30/11/2007
Southport 3-16-19-05 568 595 4.75
Southport 3-16-22-05 375 401 6.93
Southport 3-16-22-07 241 261 8.30
Moncrieff
---------------------------------------------------------------------------------------------------------------------- SLA Name CCD Number Actual
Enrolment 2/12/2005
Growth (%)
---------------------------------------------------------------------------------------------------------------------- Nerang 3-16-08-05 456 469 2.85 Nerang 3-16-08-06 296 295 -0.34 Nerang 3-16-08-07 672 720 7.14 Nerang 3-16-08-08 606 676 11.55 Nerang 3-16-08-09 543 696 28.18 Nerang 3-16-08-10 549 561 2.19 Nerang 3-16-08-11 531 541 1.88 Nerang 3-16-08-12 1129 1164 3.10 Nerang 3-16-08-13 221 270 22.17 Nerang 3-16-08-14 378 395 4.50 Nerang 3-16-08-15 273 290 6.23 Nerang 3-16-08-16 404 455 12.62 Nerang 3-16-08-17 292 295 1.03 Nerang 3-17-19-01 157 167 6.37 Nerang 3-17-19-02 423 442 4.49 Nerang 3-17-19-03 428 439 2.57 Nerang 24 11509 12179 5.82 Robina 3-17-05-02 345 351 1.74 Robina 3-17-13-03 568 569 0.18 Robina 3-17-13-09 354 363 2.54 Robina 3 1267 1283 1.26 Southport 3-16-19-04 421 431 2.38
Southport 3-16-19-06 320 341 6.56 Southport 3-16-19-07 440 460 4.55 Southport 3-16-19-08 175 174 -0.57 Southport 3-16-19-09 462 481 4.11 Southport 3-16-19-10 334 339 1.50 Southport 3-16-19-11 578 595 2.94 Southport 3-16-19-12 475 487 2.53 Southport 3-16-22-01 291 300 3.09 Southport 3-16-22-02 266 355 33.46 Southport 3-16-22-03 274 306 11.68 Southport 3-16-22-04 383 366 -4.44
Southport 3-16-22-06 170 172 1.18
Southport 3-16-22-08 392 416 6.12 Southport 3-16-22-09 298 310 4.03 Southport 3-16-22-10 223 223 0.00 Southport 3-16-22-11 346 365 5.49 Southport 3-16-22-12 226 229 1.33 Southport 3-16-22-13 250 255 2.00

Queensland Redistribution Statistics 2006
Enrolment Projections
----------------------------------------------------------------------------------------------------------------------
161
Estimate 30/11/2007
Moncrieff
---------------------------------------------------------------------------------------------------------------------- SLA Name CCD Number Actual
Enrolment 2/12/2005
Growth (%)
---------------------------------------------------------------------------------------------------------------------- Southport 3-16-22-14 269 278 3.35 Southport 3-16-22-15 531 559 5.27 Southport 3-16-22-16 300 320 6.67 Southport 25 8608 9019 4.77 Surfers Paradise 3-16-10-01 230 231 0.43 Surfers Paradise 3-16-10-07 529 558 5.48 Surfers Paradise 3-16-10-08 212 208 -1.89 Surfers Paradise 3-16-10-09 132 132 0.00 Surfers Paradise 3-16-10-10 144 155 7.64 Surfers Paradise 3-16-10-11 474 477 0.63 Surfers Paradise 3-16-10-12 282 285 1.06 Surfers Paradise 3-16-12-01 215 269 25.12 Surfers Paradise 3-16-12-02 78 76 -2.56 Surfers Paradise 3-16-12-03 103 109 5.83 Surfers Paradise 3-16-12-04 96 94 -2.08 Surfers Paradise 3-16-12-05 41 40 -2.44 Surfers Paradise 3-16-12-06 56 95 69.64 Surfers Paradise 3-16-12-07 82 82 0.00 Surfers Paradise 3-16-12-08 135 131 -2.96 Surfers Paradise 3-16-12-09 121 119 -1.65 Surfers Paradise 3-16-12-10 27 25 -7.41 Surfers Paradise 3-16-12-11 191 190 -0.52 Surfers Paradise 3-16-12-12 142 132 -7.04 Surfers Paradise 3-16-12-13 84 78 -7.14 Surfers Paradise 3-16-12-14 116 115 -0.86 Surfers Paradise 3-16-12-15 65 64 -1.54 Surfers Paradise 3-16-24-01 472 489 3.60 Surfers Paradise 3-16-24-02 75 71 -5.33 Surfers Paradise 3-16-24-03 395 390 -1.27 Surfers Paradise 3-16-24-04 147 160 8.84 Surfers Paradise 3-16-24-05 102 102 0.00 Surfers Paradise 3-16-24-06 77 74 -3.90 Surfers Paradise 3-16-24-07 185 184 -0.54 Surfers Paradise 3-16-24-08 119 124 4.20 Surfers Paradise 3-16-24-09 97 98 1.03 Surfers Paradise 3-16-24-10 27 28 3.70 Surfers Paradise 3-16-24-11 127 128 0.79 Surfers Paradise 3-16-24-12 86 119 38.37 Surfers Paradise 3-16-24-13 328 330 0.61 Surfers Paradise 3-16-24-14 49 53 8.16 Surfers Paradise 3-16-24-15 28 27 -3.57 Surfers Paradise 3-16-24-16 57 58 1.75 Surfers Paradise 3-16-24-17 79 78 -1.27 Surfers Paradise 3-16-25-01 196 194 -1.02 Surfers Paradise 3-16-25-02 94 88 -6.38

Queensland Redistribution Statistics 2006
Enrolment Projections
----------------------------------------------------------------------------------------------------------------------
162
Estimate 30/11/2007
Moncrieff
---------------------------------------------------------------------------------------------------------------------- SLA Name CCD Number Actual
Enrolment 2/12/2005
Growth (%)
---------------------------------------------------------------------------------------------------------------------- Surfers Paradise 3-16-25-03 123 251 104.07 Surfers Paradise 3-16-25-04 137 134 -2.19 Surfers Paradise 3-16-25-05 255 253 -0.78 Surfers Paradise 3-16-25-06 326 358 9.82 Surfers Paradise 3-16-25-07 24 26 8.33 Surfers Paradise 3-16-25-08 293 286 -2.39 Surfers Paradise 3-16-25-09 14 16 14.29 Surfers Paradise 3-16-25-10 8 8 0.00 Surfers Paradise 3-16-25-11 48 45 -6.25 Surfers Paradise 3-16-25-12 43 44 2.33 Surfers Paradise 3-16-25-13 89 92 3.37 Surfers Paradise 3-16-25-14 271 271 0.00 Surfers Paradise 3-16-25-15 253 264 4.35 Surfers Paradise 3-16-26-01 67 63 -5.97 Surfers Paradise 3-16-26-02 66 64 -3.03 Surfers Paradise 3-16-26-03 102 107 4.90 Surfers Paradise 3-16-26-04 96 102 6.25 Surfers Paradise 3-16-26-05 150 158 5.33 Surfers Paradise 3-16-26-06 159 167 5.03 Surfers Paradise 3-16-26-07 23 24 4.35 Surfers Paradise 3-16-26-08 65 65 0.00 Surfers Paradise 3-16-26-09 14 19 35.71 Surfers Paradise 3-16-26-10 94 187 98.94 Surfers Paradise 3-16-26-11 91 89 -2.20 Surfers Paradise 3-16-26-12 88 84 -4.55 Surfers Paradise 3-16-26-13 245 236 -3.67 Surfers Paradise 3-16-26-14 97 103 6.19 Surfers Paradise 3-16-26-15 31 31 0.00 Surfers Paradise 69 9567 10007 4.60 Worongary-Tallai 3-17-19-04 605 642 6.12 Worongary-Tallai 3-17-19-05 391 417 6.65 Worongary-Tallai 3-17-19-07 327 334 2.14 Worongary-Tallai 3-17-19-08 279 283 1.43 Worongary-Tallai 3-17-19-09 441 446 1.13 Worongary-Tallai 3-17-19-10 671 694 3.43 Worongary-Tallai 3-17-19-11 701 704 0.43 Worongary-Tallai 3-17-19-12 375 385 2.67 Worongary-Tallai 3-17-19-16 468 476 1.71 Worongary-Tallai 3-17-19-17 402 430 6.97 Worongary-Tallai 10 4660 4811 3.24 Moncrieff 277 83369 86831 4.15

Queensland Redistribution Statistics 2006
Enrolment Projections
----------------------------------------------------------------------------------------------------------------------
163
Actual Enrolment 2/12/2005
Algester 3-26-24-05 549 577 5.10
Annerley 3-24-03-08 485 499 2.89
Moreton
---------------------------------------------------------------------------------------------------------------------- SLA Name CCD Number Estimate
30/11/2007 Growth (%)
---------------------------------------------------------------------------------------------------------------------- Acacia Ridge 3-26-27-04 2 2 0.00 Acacia Ridge 1 2 2 0.00 Algester 3-26-24-02 456 466 2.19 Algester 3-26-24-03 317 324 2.21 Algester 3-26-24-04 586 591 0.85
Algester 3-26-24-06 466 466 0.00 Algester 3-26-24-07 286 297 3.85 Algester 3-26-24-08 675 688 1.93 Algester 3-26-24-09 303 307 1.32 Algester 3-26-24-10 506 516 1.98 Algester 3-26-28-11 838 1037 23.75 Algester 10 4982 5269 5.76
Annerley 3-24-03-09 461 471 2.17 Annerley 2 946 970 2.54 Archerfield 3-26-16-04 173 174 0.58 Archerfield 3-26-16-05 208 212 1.92 Archerfield 2 381 386 1.31 Calamvale 3-26-10-01 592 622 5.07 Calamvale 3-26-10-02 734 778 5.99 Calamvale 3-26-10-03 765 811 6.01 Calamvale 3-26-10-04 740 792 7.03 Calamvale 3-26-10-05 604 629 4.14 Calamvale 3-26-10-06 333 694 108.41 Calamvale 3-26-10-07 444 474 6.76 Calamvale 3-26-10-08 444 507 14.19 Calamvale 3-26-17-01 480 605 26.04 Calamvale 3-26-17-05 399 463 16.04 Calamvale 3-26-17-06 409 488 19.32 Calamvale 11 5944 6863 15.46 Chelmer 3-26-15-01 383 389 1.57 Chelmer 3-26-15-02 358 372 3.91 Chelmer 3-26-15-03 195 193 -1.03 Chelmer 3-26-15-04 217 225 3.69 Chelmer 3-26-15-05 328 338 3.05 Chelmer 3-26-15-06 381 393 3.15

Queensland Redistribution Statistics 2006
Enrolment Projections
----------------------------------------------------------------------------------------------------------------------
164
Moreton
---------------------------------------------------------------------------------------------------------------------- SLA Name CCD Number Actual
Enrolment 2/12/2005
Estimate 30/11/2007
Growth (%)
---------------------------------------------------------------------------------------------------------------------- Chelmer 6 1862 1910 2.58 Coopers Plains 3-24-23-01 78 76 -2.56 Coopers Plains 3-24-23-02 426 394 -7.51 Coopers Plains 3-24-23-03 277 258 -6.86 Coopers Plains 3-24-23-04 387 394 1.81 Coopers Plains 3-24-23-05 657 662 0.76 Coopers Plains 3-24-23-06 142 149 4.93 Coopers Plains 3-24-23-07 141 144 2.13 Coopers Plains 3-24-23-08 79 82 3.80 Coopers Plains 3-24-23-09 402 402 0.00 Coopers Plains 9 2589 2561 -1.08 Eight Mile Plains 3-26-04-01 301 315 4.65 Eight Mile Plains 3-26-04-02 366 395 7.92 Eight Mile Plains 3-26-04-03 0 0 0.00 Eight Mile Plains 3-26-04-04 732 796 8.74 Eight Mile Plains 3-26-04-05 537 554 3.17 Eight Mile Plains 3-26-04-06 410 424 3.41 Eight Mile Plains 3-26-04-07 357 363 1.68 Eight Mile Plains 3-26-04-08 654 783 19.72 Eight Mile Plains 3-26-04-12 517 569 10.06 Eight Mile Plains 3-26-04-13 730 775 6.16 Eight Mile Plains 3-26-04-14 368 379 2.99 Eight Mile Plains 3-26-04-15 623 661 6.10 Eight Mile Plains 12 5595 6014 7.49 Graceville 3-26-14-01 253 261 3.16 Graceville 3-26-14-02 413 417 0.97 Graceville 3-26-14-03 356 362 1.69 Graceville 3-26-14-04 260 264 1.54 Graceville 3-26-14-05 573 581 1.40 Graceville 3-26-14-06 369 377 2.17 Graceville 3-26-14-07 480 491 2.29 Graceville 7 2704 2753 1.81 Kuraby 3-26-08-16 151 164 8.61 Kuraby 1 151 164 8.61 MacGregor 3-24-21-01 383 383 0.00 MacGregor 3-24-21-02 408 411 0.74 MacGregor 3-24-21-03 441 447 1.36

Queensland Redistribution Statistics 2006
Enrolment Projections
----------------------------------------------------------------------------------------------------------------------
165
Moreton
---------------------------------------------------------------------------------------------------------------------- SLA Name CCD Number Actual
Enrolment 2/12/2005
Estimate 30/11/2007
Growth (%)
---------------------------------------------------------------------------------------------------------------------- MacGregor 3-24-21-04 527 535 1.52 MacGregor 3-24-21-05 298 305 2.35 MacGregor 3-24-21-06 526 529 0.57 MacGregor 3-24-21-07 504 497 -1.39 MacGregor 3-24-21-08 526 527 0.19 MacGregor 8 3613 3634 0.58 Moorooka 3-24-17-01 410 418 1.95 Moorooka 3-24-17-02 275 277 0.73 Moorooka 3-24-17-03 388 389 0.26 Moorooka 3-24-17-04 456 459 0.66 Moorooka 3-24-17-05 336 344 2.38 Moorooka 3-24-17-06 388 388 0.00 Moorooka 3-24-17-07 369 373 1.08 Moorooka 3-24-17-08 119 117 -1.68 Moorooka 3-24-18-01 379 383 1.06 Moorooka 3-24-18-02 228 229 0.44 Moorooka 3-24-18-03 369 369 0.00 Moorooka 3-24-18-04 307 308 0.33 Moorooka 3-24-18-05 255 258 1.18 Moorooka 3-24-18-06 411 416 1.22 Moorooka 3-24-18-07 213 212 -0.47 Moorooka 3-24-18-08 432 433 0.23 Moorooka 3-24-18-09 332 338 1.81 Moorooka 3-24-18-10 390 385 -1.28 Moorooka 3-24-18-11 235 237 0.85 Moorooka 19 6292 6333 0.65 Nathan 3-24-12-07 211 218 3.32 Nathan 3-24-12-08 118 122 3.39 Nathan 3-24-12-09 401 416 3.74 Nathan 3 730 756 3.56 Parkinson-Drewvale 3-26-08-01 567 662 16.75 Parkinson-Drewvale 3-26-17-02 606 641 5.78 Parkinson-Drewvale 3-26-17-03 498 592 18.88 Parkinson-Drewvale 3-26-17-04 490 725 47.96 Parkinson-Drewvale 3-26-17-07 344 356 3.49 Parkinson-Drewvale 3-26-17-08 459 509 10.89 Parkinson-Drewvale 3-26-17-09 469 486 3.62 Parkinson-Drewvale 3-26-17-10 727 839 15.41 Parkinson-Drewvale 3-26-17-11 606 629 3.80 Parkinson-Drewvale 3-26-17-12 712 767 7.72 Parkinson-Drewvale 10 5478 6206 13.29

Queensland Redistribution Statistics 2006
Enrolment Projections
----------------------------------------------------------------------------------------------------------------------
166
Runcorn 3-26-26-16 254 254 0.00
Moreton
---------------------------------------------------------------------------------------------------------------------- SLA Name CCD Number Actual
Enrolment 2/12/2005
Estimate 30/11/2007
Growth (%)
---------------------------------------------------------------------------------------------------------------------- Robertson 3-24-22-01 611 656 7.36 Robertson 3-24-22-02 357 370 3.64 Robertson 3-24-22-03 276 279 1.09 Robertson 3-24-22-04 209 212 1.44 Robertson 3-24-22-05 309 321 3.88 Robertson 3-24-22-06 375 391 4.27 Robertson 3-24-22-07 371 380 2.43 Robertson 3-24-22-08 364 369 1.37 Robertson 8 2872 2978 3.69 Rocklea 3-26-16-01 203 197 -2.96 Rocklea 3-26-16-02 343 330 -3.79 Rocklea 3-26-16-03 406 402 -0.99 Rocklea 3 952 929 -2.42 Runcorn 3-26-26-01 492 503 2.24 Runcorn 3-26-26-02 424 433 2.12 Runcorn 3-26-26-03 367 376 2.45 Runcorn 3-26-26-04 451 452 0.22 Runcorn 3-26-26-05 677 686 1.33 Runcorn 3-26-26-06 329 338 2.74 Runcorn 3-26-26-07 211 221 4.74 Runcorn 3-26-26-08 559 559 0.00 Runcorn 3-26-26-09 510 527 3.33 Runcorn 3-26-26-10 402 413 2.74 Runcorn 3-26-26-11 441 441 0.00 Runcorn 3-26-26-12 350 360 2.86 Runcorn 3-26-26-13 463 502 8.42 Runcorn 3-26-26-14 375 387 3.20 Runcorn 3-26-26-15 252 256 1.59
Runcorn 3-26-26-17 501 506 1.00 Runcorn 3-26-26-18 433 441 1.85 Runcorn 18 7491 7655 2.19 Salisbury 3-24-19-01 267 267 0.00 Salisbury 3-24-19-02 252 254 0.79 Salisbury 3-24-19-03 475 479 0.84 Salisbury 3-24-19-04 240 242 0.83 Salisbury 3-24-19-05 303 302 -0.33 Salisbury 3-24-19-06 356 352 -1.12 Salisbury 3-24-19-07 284 288 1.41 Salisbury 3-24-19-08 514 529 2.92 Salisbury 3-24-19-09 339 350 3.24

Queensland Redistribution Statistics 2006
Enrolment Projections
----------------------------------------------------------------------------------------------------------------------
167
Sunnybank Hills 3-26-27-11 354 359 1.41
Moreton
---------------------------------------------------------------------------------------------------------------------- SLA Name CCD Number Actual
Enrolment 2/12/2005
Estimate 30/11/2007
Growth (%)
---------------------------------------------------------------------------------------------------------------------- Salisbury 3-24-19-10 352 360 2.27 Salisbury 3-24-19-11 351 351 0.00 Salisbury 11 3733 3774 1.10 Sherwood 3-26-13-01 529 550 3.97 Sherwood 3-26-13-02 496 498 0.40 Sherwood 3-26-13-03 481 496 3.12 Sherwood 3-26-13-04 404 419 3.71 Sherwood 3-26-13-05 311 320 2.89 Sherwood 3-26-13-06 741 778 4.99 Sherwood 3-26-13-07 322 342 6.21 Sherwood 7 3284 3403 3.62 Stretton-Karawatha 3-26-08-02 394 418 6.09 Stretton-Karawatha 3-26-08-03 920 1115 21.20 Stretton-Karawatha 3-26-08-04 553 576 4.16 Stretton-Karawatha 3-26-08-11 572 587 2.62 Stretton-Karawatha 4 2439 2696 10.54 Sunnybank 3-26-29-01 568 583 2.64 Sunnybank 3-26-29-02 432 456 5.56 Sunnybank 3-26-29-03 542 554 2.21 Sunnybank 3-26-29-04 687 698 1.60 Sunnybank 3-26-29-05 492 498 1.22 Sunnybank 3-26-29-06 383 401 4.70 Sunnybank 3-26-29-07 264 270 2.27 Sunnybank 3-26-29-08 212 219 3.30 Sunnybank 3-26-29-09 324 327 0.93 Sunnybank 3-26-29-10 415 441 6.27 Sunnybank 3-26-29-11 501 507 1.20 Sunnybank 3-26-29-12 365 370 1.37 Sunnybank 12 5185 5324 2.68 Sunnybank Hills 3-26-27-01 310 318 2.58 Sunnybank Hills 3-26-27-02 499 511 2.40 Sunnybank Hills 3-26-27-03 466 480 3.00 Sunnybank Hills 3-26-27-05 219 222 1.37 Sunnybank Hills 3-26-27-06 407 456 12.04 Sunnybank Hills 3-26-27-07 465 475 2.15 Sunnybank Hills 3-26-27-08 443 480 8.35 Sunnybank Hills 3-26-27-09 315 324 2.86 Sunnybank Hills 3-26-27-10 274 281 2.55
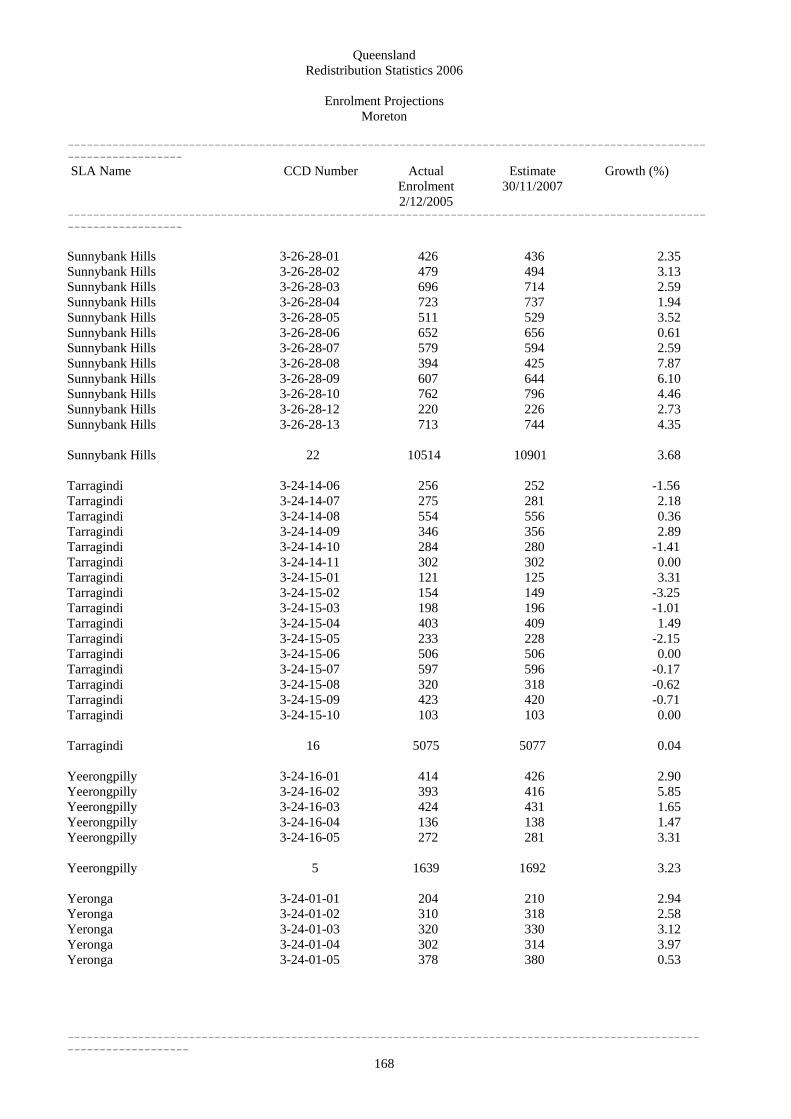
Queensland Redistribution Statistics 2006
Enrolment Projections
----------------------------------------------------------------------------------------------------------------------
168
Yeerongpilly 3-24-16-04 136 138 1.47
Moreton
---------------------------------------------------------------------------------------------------------------------- SLA Name CCD Number Actual
Enrolment 2/12/2005
Estimate 30/11/2007
Growth (%)
---------------------------------------------------------------------------------------------------------------------- Sunnybank Hills 3-26-28-01 426 436 2.35 Sunnybank Hills 3-26-28-02 479 494 3.13 Sunnybank Hills 3-26-28-03 696 714 2.59 Sunnybank Hills 3-26-28-04 723 737 1.94 Sunnybank Hills 3-26-28-05 511 529 3.52 Sunnybank Hills 3-26-28-06 652 656 0.61 Sunnybank Hills 3-26-28-07 579 594 2.59 Sunnybank Hills 3-26-28-08 394 425 7.87 Sunnybank Hills 3-26-28-09 607 644 6.10 Sunnybank Hills 3-26-28-10 762 796 4.46 Sunnybank Hills 3-26-28-12 220 226 2.73 Sunnybank Hills 3-26-28-13 713 744 4.35 Sunnybank Hills 22 10514 10901 3.68 Tarragindi 3-24-14-06 256 252 -1.56 Tarragindi 3-24-14-07 275 281 2.18 Tarragindi 3-24-14-08 554 556 0.36 Tarragindi 3-24-14-09 346 356 2.89 Tarragindi 3-24-14-10 284 280 -1.41 Tarragindi 3-24-14-11 302 302 0.00 Tarragindi 3-24-15-01 121 125 3.31 Tarragindi 3-24-15-02 154 149 -3.25 Tarragindi 3-24-15-03 198 196 -1.01 Tarragindi 3-24-15-04 403 409 1.49 Tarragindi 3-24-15-05 233 228 -2.15 Tarragindi 3-24-15-06 506 506 0.00 Tarragindi 3-24-15-07 597 596 -0.17 Tarragindi 3-24-15-08 320 318 -0.62 Tarragindi 3-24-15-09 423 420 -0.71 Tarragindi 3-24-15-10 103 103 0.00 Tarragindi 16 5075 5077 0.04 Yeerongpilly 3-24-16-01 414 426 2.90 Yeerongpilly 3-24-16-02 393 416 5.85 Yeerongpilly 3-24-16-03 424 431 1.65
Yeerongpilly 3-24-16-05 272 281 3.31 Yeerongpilly 5 1639 1692 3.23 Yeronga 3-24-01-01 204 210 2.94 Yeronga 3-24-01-02 310 318 2.58 Yeronga 3-24-01-03 320 330 3.12 Yeronga 3-24-01-04 302 314 3.97 Yeronga 3-24-01-05 378 380 0.53

Queensland Redistribution Statistics 2006
Enrolment Projections
----------------------------------------------------------------------------------------------------------------------
169
Moreton
---------------------------------------------------------------------------------------------------------------------- SLA Name CCD Number Actual
Enrolment 2/12/2005
Estimate 30/11/2007
Growth (%)
---------------------------------------------------------------------------------------------------------------------- Yeronga 3-24-01-06 289 305 5.54 Yeronga 3-24-01-07 74 77 4.05 Yeronga 3-24-01-08 215 221 2.79 Yeronga 3-24-01-09 405 418 3.21 Yeronga 3-24-01-10 275 281 2.18 Yeronga 3-24-01-11 244 254 4.10 Yeronga 3-24-01-12 299 302 1.00 Yeronga 3-24-01-13 328 350 6.71 Yeronga 13 3643 3760 3.21 Moreton 220 88096 92010 4.44
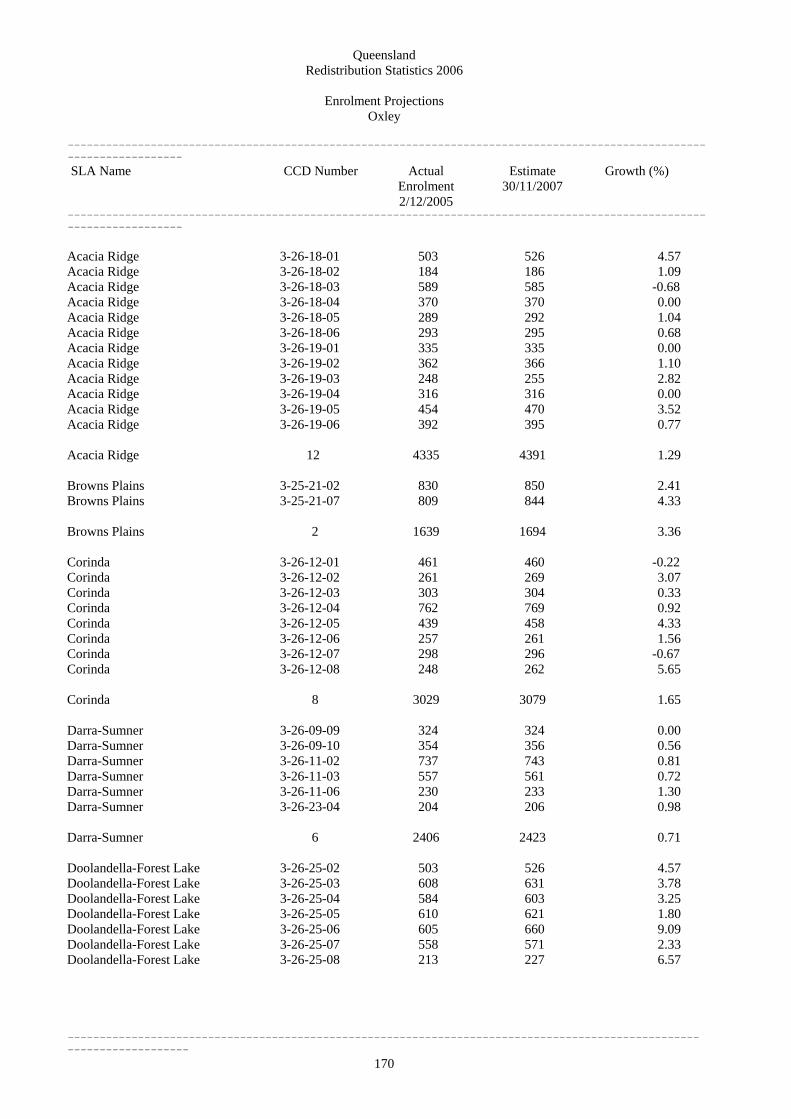
Queensland Redistribution Statistics 2006
Enrolment Projections
----------------------------------------------------------------------------------------------------------------------
170
Oxley
---------------------------------------------------------------------------------------------------------------------- SLA Name CCD Number Actual
Enrolment 2/12/2005
Estimate 30/11/2007
Growth (%)
---------------------------------------------------------------------------------------------------------------------- Acacia Ridge 3-26-18-01 503 526 4.57 Acacia Ridge 3-26-18-02 184 186 1.09 Acacia Ridge 3-26-18-03 589 585 -0.68 Acacia Ridge 3-26-18-04 370 370 0.00 Acacia Ridge 3-26-18-05 289 292 1.04 Acacia Ridge 3-26-18-06 293 295 0.68 Acacia Ridge 3-26-19-01 335 335 0.00 Acacia Ridge 3-26-19-02 362 366 1.10 Acacia Ridge 3-26-19-03 248 255 2.82 Acacia Ridge 3-26-19-04 316 316 0.00 Acacia Ridge 3-26-19-05 454 470 3.52 Acacia Ridge 3-26-19-06 392 395 0.77 Acacia Ridge 12 4335 4391 1.29 Browns Plains 3-25-21-02 830 850 2.41 Browns Plains 3-25-21-07 809 844 4.33 Browns Plains 2 1639 1694 3.36 Corinda 3-26-12-01 461 460 -0.22 Corinda 3-26-12-02 261 269 3.07 Corinda 3-26-12-03 303 304 0.33 Corinda 3-26-12-04 762 769 0.92 Corinda 3-26-12-05 439 458 4.33 Corinda 3-26-12-06 257 261 1.56 Corinda 3-26-12-07 298 296 -0.67 Corinda 3-26-12-08 248 262 5.65 Corinda 8 3029 3079 1.65 Darra-Sumner 3-26-09-09 324 324 0.00 Darra-Sumner 3-26-09-10 354 356 0.56 Darra-Sumner 3-26-11-02 737 743 0.81 Darra-Sumner 3-26-11-03 557 561 0.72 Darra-Sumner 3-26-11-06 230 233 1.30 Darra-Sumner 3-26-23-04 204 206 0.98 Darra-Sumner 6 2406 2423 0.71 Doolandella-Forest Lake 3-26-25-02 503 526 4.57 Doolandella-Forest Lake 3-26-25-03 608 631 3.78 Doolandella-Forest Lake 3-26-25-04 584 603 3.25 Doolandella-Forest Lake 3-26-25-05 610 621 1.80 Doolandella-Forest Lake 3-26-25-06 605 660 9.09 Doolandella-Forest Lake 3-26-25-07 558 571 2.33 Doolandella-Forest Lake 3-26-25-08 213 227 6.57

Queensland Redistribution Statistics 2006
Enrolment Projections
----------------------------------------------------------------------------------------------------------------------
171
Growth (%)
Oxley
---------------------------------------------------------------------------------------------------------------------- SLA Name CCD Number Actual
Enrolment 2/12/2005
Estimate 30/11/2007
---------------------------------------------------------------------------------------------------------------------- Doolandella-Forest Lake 3-26-25-09 607 637 4.94 Doolandella-Forest Lake 3-26-25-10 462 475 2.81 Doolandella-Forest Lake 3-26-25-11 555 571 2.88 Doolandella-Forest Lake 3-26-25-12 298 326 9.40 Doolandella-Forest Lake 3-26-25-13 627 644 2.71 Doolandella-Forest Lake 3-26-25-14 399 440 10.28 Doolandella-Forest Lake 3-26-25-15 903 980 8.53 Doolandella-Forest Lake 3-26-25-17 487 498 2.26 Doolandella-Forest Lake 3-26-25-18 487 513 5.34 Doolandella-Forest Lake 3-26-25-19 463 478 3.24 Doolandella-Forest Lake 3-26-25-20 349 371 6.30 Doolandella-Forest Lake 3-26-25-21 196 202 3.06 Doolandella-Forest Lake 3-26-25-22 519 577 11.18 Doolandella-Forest Lake 20 10033 10551 5.16 Durack 3-26-20-01 688 686 -0.29 Durack 3-26-20-02 1095 1199 9.50 Durack 3-26-20-03 683 687 0.59 Durack 3-26-20-04 465 465 0.00 Durack 3-26-20-05 562 558 -0.71 Durack 3-26-20-06 580 580 0.00 Durack 6 4073 4175 2.50 Ellen Grove 3-26-23-03 711 849 19.41 Ellen Grove 3-26-23-05 335 350 4.48 Ellen Grove 3-26-23-06 521 541 3.84 Ellen Grove 3-26-23-07 455 485 6.59 Ellen Grove 3-26-25-01 253 321 26.88 Ellen Grove 3-26-25-16 724 913 26.10 Ellen Grove 6 2999 3459 15.34 Greenbank-Boronia Heights 3-25-23-01 0 0 0.00 Greenbank-Boronia Heights 3-25-23-02 0 0 0.00 Greenbank-Boronia Heights 2 0 0 0.00 Inala 3-26-21-01 73 71 -2.74 Inala 3-26-21-02 270 268 -0.74 Inala 3-26-21-03 416 412 -0.96 Inala 3-26-21-04 297 295 -0.67 Inala 3-26-21-05 369 374 1.36 Inala 3-26-21-06 489 493 0.82 Inala 3-26-21-07 150 147 -2.00 Inala 3-26-21-08 247 249 0.81
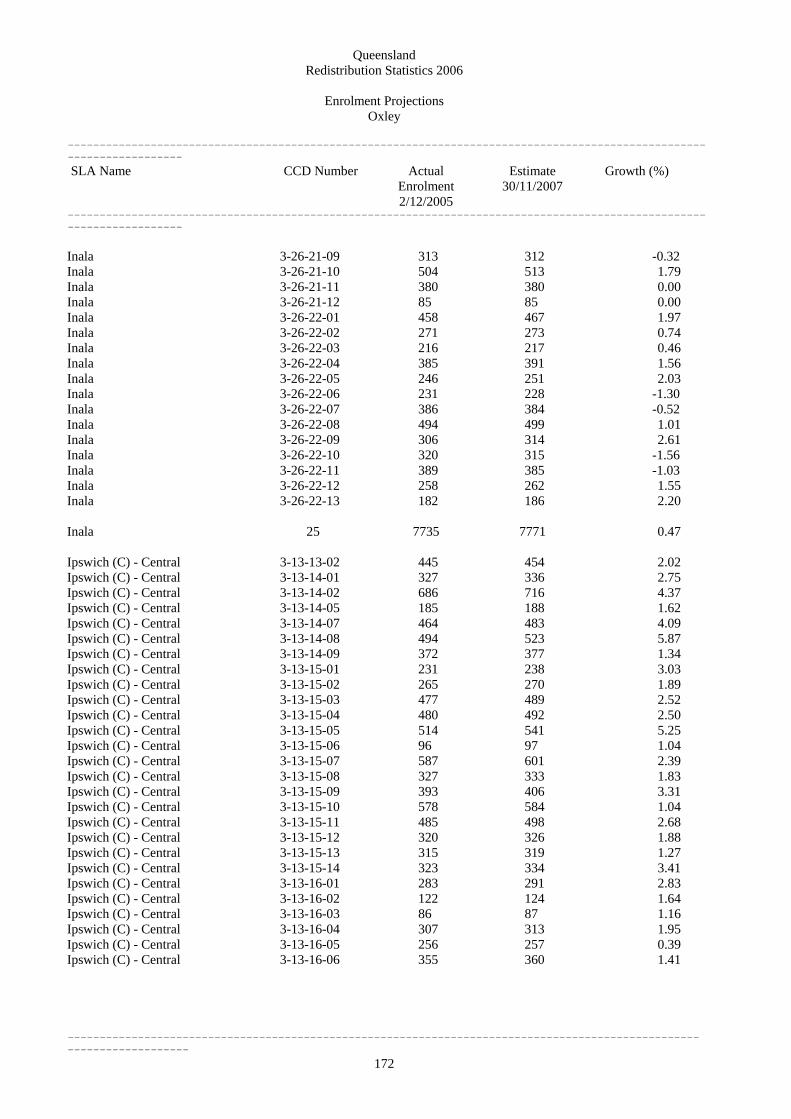
Queensland Redistribution Statistics 2006
Enrolment Projections
----------------------------------------------------------------------------------------------------------------------
172
Oxley
---------------------------------------------------------------------------------------------------------------------- SLA Name CCD Number Actual
Enrolment 2/12/2005
Estimate 30/11/2007
Growth (%)
---------------------------------------------------------------------------------------------------------------------- Inala 3-26-21-09 313 312 -0.32 Inala 3-26-21-10 504 513 1.79 Inala 3-26-21-11 380 380 0.00 Inala 3-26-21-12 85 85 0.00 Inala 3-26-22-01 458 467 1.97 Inala 3-26-22-02 271 273 0.74 Inala 3-26-22-03 216 217 0.46 Inala 3-26-22-04 385 391 1.56 Inala 3-26-22-05 246 251 2.03 Inala 3-26-22-06 231 228 -1.30 Inala 3-26-22-07 386 384 -0.52 Inala 3-26-22-08 494 499 1.01 Inala 3-26-22-09 306 314 2.61 Inala 3-26-22-10 320 315 -1.56 Inala 3-26-22-11 389 385 -1.03 Inala 3-26-22-12 258 262 1.55 Inala 3-26-22-13 182 186 2.20 Inala 25 7735 7771 0.47 Ipswich (C) - Central 3-13-13-02 445 454 2.02 Ipswich (C) - Central 3-13-14-01 327 336 2.75 Ipswich (C) - Central 3-13-14-02 686 716 4.37 Ipswich (C) - Central 3-13-14-05 185 188 1.62 Ipswich (C) - Central 3-13-14-07 464 483 4.09 Ipswich (C) - Central 3-13-14-08 494 523 5.87 Ipswich (C) - Central 3-13-14-09 372 377 1.34 Ipswich (C) - Central 3-13-15-01 231 238 3.03 Ipswich (C) - Central 3-13-15-02 265 270 1.89 Ipswich (C) - Central 3-13-15-03 477 489 2.52 Ipswich (C) - Central 3-13-15-04 480 492 2.50 Ipswich (C) - Central 3-13-15-05 514 541 5.25 Ipswich (C) - Central 3-13-15-06 96 97 1.04 Ipswich (C) - Central 3-13-15-07 587 601 2.39 Ipswich (C) - Central 3-13-15-08 327 333 1.83 Ipswich (C) - Central 3-13-15-09 393 406 3.31 Ipswich (C) - Central 3-13-15-10 578 584 1.04 Ipswich (C) - Central 3-13-15-11 485 498 2.68 Ipswich (C) - Central 3-13-15-12 320 326 1.88 Ipswich (C) - Central 3-13-15-13 315 319 1.27 Ipswich (C) - Central 3-13-15-14 323 334 3.41 Ipswich (C) - Central 3-13-16-01 283 291 2.83 Ipswich (C) - Central 3-13-16-02 122 124 1.64 Ipswich (C) - Central 3-13-16-03 86 87 1.16 Ipswich (C) - Central 3-13-16-04 307 313 1.95 Ipswich (C) - Central 3-13-16-05 256 257 0.39 Ipswich (C) - Central 3-13-16-06 355 360 1.41

Queensland Redistribution Statistics 2006
Enrolment Projections
----------------------------------------------------------------------------------------------------------------------
173
Oxley
---------------------------------------------------------------------------------------------------------------------- SLA Name CCD Number Actual
Enrolment 2/12/2005
Estimate 30/11/2007
Growth (%)
---------------------------------------------------------------------------------------------------------------------- Ipswich (C) - Central 3-13-16-07 477 475 -0.42 Ipswich (C) - Central 3-13-16-08 355 357 0.56 Ipswich (C) - Central 3-13-16-09 608 623 2.47 Ipswich (C) - Central 3-13-16-10 105 109 3.81 Ipswich (C) - Central 3-13-16-11 275 282 2.55 Ipswich (C) - Central 3-13-17-01 316 321 1.58 Ipswich (C) - Central 3-13-17-02 250 255 2.00 Ipswich (C) - Central 3-13-17-03 471 484 2.76 Ipswich (C) - Central 3-13-17-04 243 252 3.70 Ipswich (C) - Central 3-13-17-05 245 250 2.04 Ipswich (C) - Central 3-13-17-06 231 237 2.60 Ipswich (C) - Central 3-13-17-07 268 270 0.75 Ipswich (C) - Central 3-13-17-08 256 260 1.56 Ipswich (C) - Central 3-13-17-09 225 232 3.11 Ipswich (C) - Central 3-13-17-10 549 560 2.00 Ipswich (C) - Central 3-13-17-11 175 183 4.57 Ipswich (C) - Central 3-13-17-12 192 193 0.52 Ipswich (C) - Central 3-13-17-13 114 122 7.02 Ipswich (C) - Central 3-13-17-14 357 365 2.24 Ipswich (C) - Central 46 15485 15867 2.47 Ipswich (C) - East 3-13-08-01 342 373 9.06 Ipswich (C) - East 3-13-08-02 466 512 9.87 Ipswich (C) - East 3-13-08-03 611 676 10.64 Ipswich (C) - East 3-13-08-04 691 782 13.17 Ipswich (C) - East 3-13-08-05 519 577 11.18 Ipswich (C) - East 3-13-08-06 538 623 15.80 Ipswich (C) - East 3-13-08-07 301 336 11.63 Ipswich (C) - East 3-13-08-08 372 411 10.48 Ipswich (C) - East 3-13-08-09 426 470 10.33 Ipswich (C) - East 3-13-08-10 508 562 10.63 Ipswich (C) - East 3-13-08-11 979 1441 47.19 Ipswich (C) - East 3-13-08-12 168 186 10.71 Ipswich (C) - East 3-13-08-13 363 412 13.50 Ipswich (C) - East 3-13-08-14 932 1611 72.85 Ipswich (C) - East 3-13-08-15 154 223 44.81 Ipswich (C) - East 3-13-09-01 467 512 9.64 Ipswich (C) - East 3-13-09-02 418 480 14.83 Ipswich (C) - East 3-13-09-03 626 704 12.46 Ipswich (C) - East 3-13-09-04 314 359 14.33 Ipswich (C) - East 3-13-09-05 106 118 11.32 Ipswich (C) - East 3-13-09-06 486 545 12.14 Ipswich (C) - East 3-13-09-07 246 286 16.26 Ipswich (C) - East 3-13-10-01 0 0 0.00 Ipswich (C) - East 3-13-10-02 761 859 12.88 Ipswich (C) - East 3-13-10-03 621 682 9.82
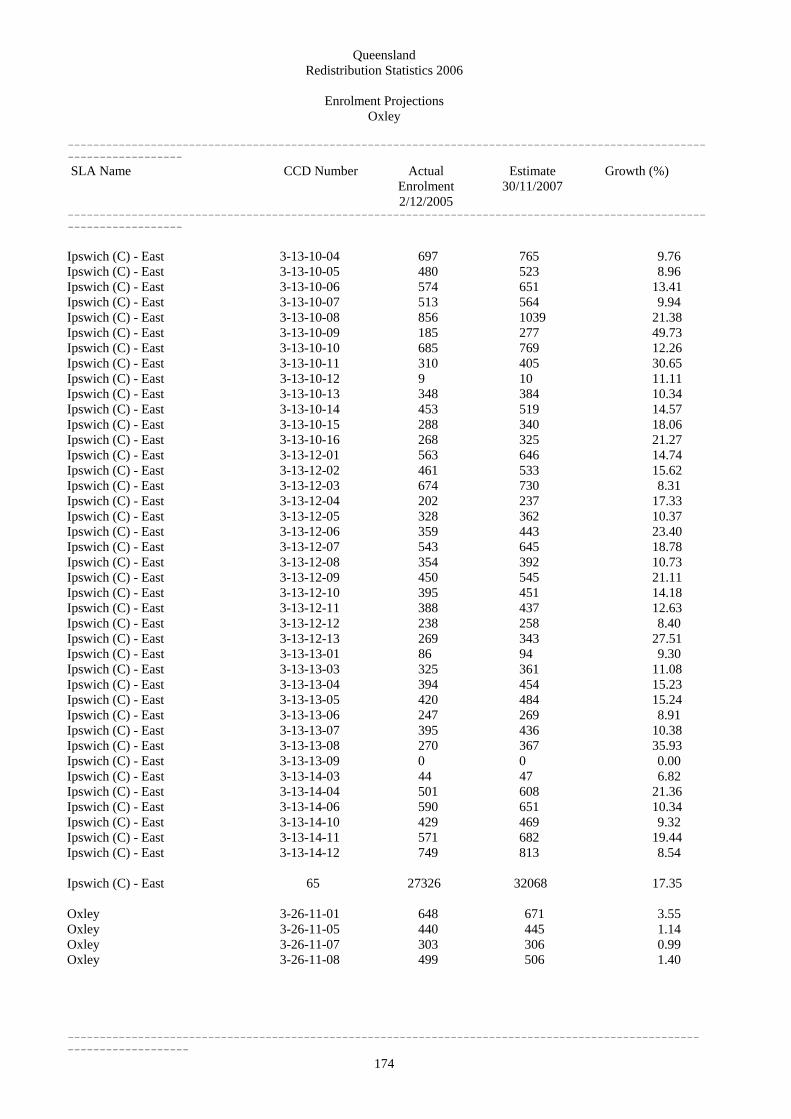
Queensland Redistribution Statistics 2006
Enrolment Projections
----------------------------------------------------------------------------------------------------------------------
174
Oxley
---------------------------------------------------------------------------------------------------------------------- SLA Name CCD Number Actual
Enrolment 2/12/2005
Estimate 30/11/2007
Growth (%)
---------------------------------------------------------------------------------------------------------------------- Ipswich (C) - East 3-13-10-04 697 765 9.76 Ipswich (C) - East 3-13-10-05 480 523 8.96 Ipswich (C) - East 3-13-10-06 574 651 13.41 Ipswich (C) - East 3-13-10-07 513 564 9.94 Ipswich (C) - East 3-13-10-08 856 1039 21.38 Ipswich (C) - East 3-13-10-09 185 277 49.73 Ipswich (C) - East 3-13-10-10 685 769 12.26 Ipswich (C) - East 3-13-10-11 310 405 30.65 Ipswich (C) - East 3-13-10-12 9 10 11.11 Ipswich (C) - East 3-13-10-13 348 384 10.34 Ipswich (C) - East 3-13-10-14 453 519 14.57 Ipswich (C) - East 3-13-10-15 288 340 18.06 Ipswich (C) - East 3-13-10-16 268 325 21.27 Ipswich (C) - East 3-13-12-01 563 646 14.74 Ipswich (C) - East 3-13-12-02 461 533 15.62 Ipswich (C) - East 3-13-12-03 674 730 8.31 Ipswich (C) - East 3-13-12-04 202 237 17.33 Ipswich (C) - East 3-13-12-05 328 362 10.37 Ipswich (C) - East 3-13-12-06 359 443 23.40 Ipswich (C) - East 3-13-12-07 543 645 18.78 Ipswich (C) - East 3-13-12-08 354 392 10.73 Ipswich (C) - East 3-13-12-09 450 545 21.11 Ipswich (C) - East 3-13-12-10 395 451 14.18 Ipswich (C) - East 3-13-12-11 388 437 12.63 Ipswich (C) - East 3-13-12-12 238 258 8.40 Ipswich (C) - East 3-13-12-13 269 343 27.51 Ipswich (C) - East 3-13-13-01 86 94 9.30 Ipswich (C) - East 3-13-13-03 325 361 11.08 Ipswich (C) - East 3-13-13-04 394 454 15.23 Ipswich (C) - East 3-13-13-05 420 484 15.24 Ipswich (C) - East 3-13-13-06 247 269 8.91 Ipswich (C) - East 3-13-13-07 395 436 10.38 Ipswich (C) - East 3-13-13-08 270 367 35.93 Ipswich (C) - East 3-13-13-09 0 0 0.00 Ipswich (C) - East 3-13-14-03 44 47 6.82 Ipswich (C) - East 3-13-14-04 501 608 21.36 Ipswich (C) - East 3-13-14-06 590 651 10.34 Ipswich (C) - East 3-13-14-10 429 469 9.32 Ipswich (C) - East 3-13-14-11 571 682 19.44 Ipswich (C) - East 3-13-14-12 749 813 8.54 Ipswich (C) - East 65 27326 32068 17.35 Oxley 3-26-11-01 648 671 3.55 Oxley 3-26-11-05 440 445 1.14 Oxley 3-26-11-07 303 306 0.99 Oxley 3-26-11-08 499 506 1.40
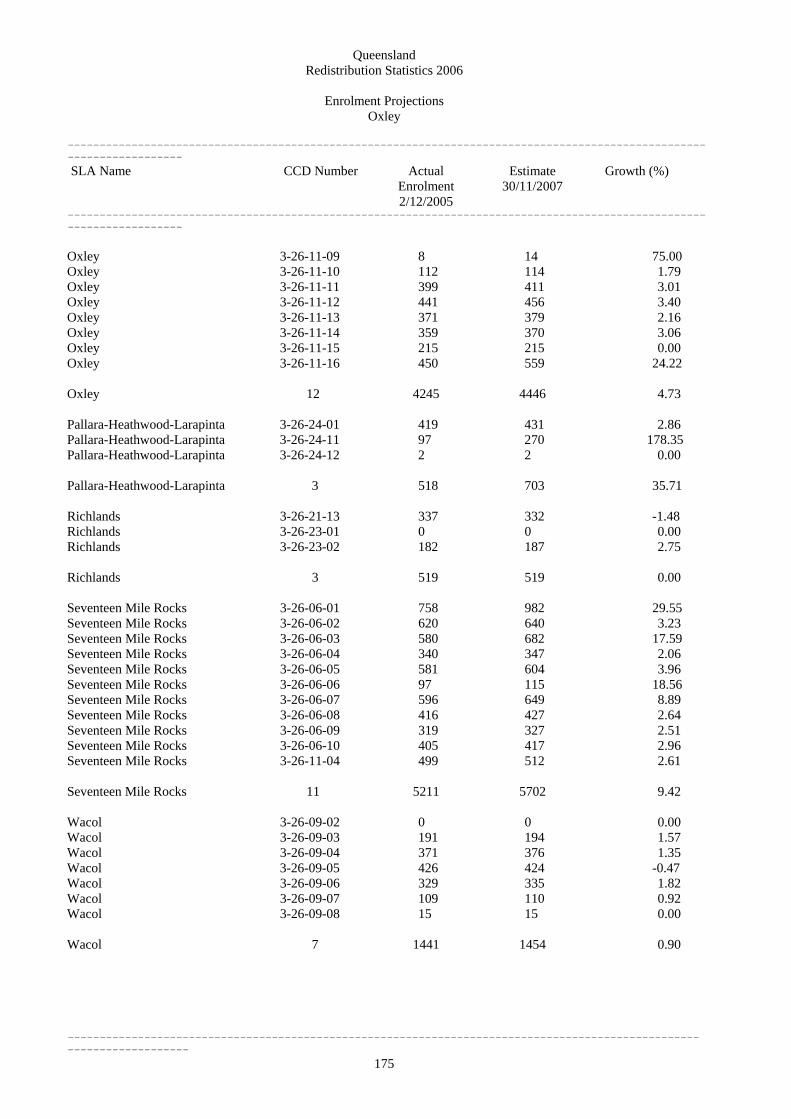
Queensland Redistribution Statistics 2006
Enrolment Projections
----------------------------------------------------------------------------------------------------------------------
175
Oxley
---------------------------------------------------------------------------------------------------------------------- SLA Name CCD Number Actual
Enrolment 2/12/2005
Estimate 30/11/2007
Growth (%)
---------------------------------------------------------------------------------------------------------------------- Oxley 3-26-11-09 8 14 75.00 Oxley 3-26-11-10 112 114 1.79 Oxley 3-26-11-11 399 411 3.01 Oxley 3-26-11-12 441 456 3.40 Oxley 3-26-11-13 371 379 2.16 Oxley 3-26-11-14 359 370 3.06 Oxley 3-26-11-15 215 215 0.00 Oxley 3-26-11-16 450 559 24.22 Oxley 12 4245 4446 4.73 Pallara-Heathwood-Larapinta 3-26-24-01 419 431 2.86 Pallara-Heathwood-Larapinta 3-26-24-11 97 270 178.35 Pallara-Heathwood-Larapinta 3-26-24-12 2 2 0.00 Pallara-Heathwood-Larapinta 3 518 703 35.71 Richlands 3-26-21-13 337 332 -1.48 Richlands 3-26-23-01 0 0 0.00 Richlands 3-26-23-02 182 187 2.75 Richlands 3 519 519 0.00 Seventeen Mile Rocks 3-26-06-01 758 982 29.55 Seventeen Mile Rocks 3-26-06-02 620 640 3.23 Seventeen Mile Rocks 3-26-06-03 580 682 17.59 Seventeen Mile Rocks 3-26-06-04 340 347 2.06 Seventeen Mile Rocks 3-26-06-05 581 604 3.96 Seventeen Mile Rocks 3-26-06-06 97 115 18.56 Seventeen Mile Rocks 3-26-06-07 596 649 8.89 Seventeen Mile Rocks 3-26-06-08 416 427 2.64 Seventeen Mile Rocks 3-26-06-09 319 327 2.51 Seventeen Mile Rocks 3-26-06-10 405 417 2.96 Seventeen Mile Rocks 3-26-11-04 499 512 2.61 Seventeen Mile Rocks 11 5211 5702 9.42 Wacol 3-26-09-02 0 0 0.00 Wacol 3-26-09-03 191 194 1.57 Wacol 3-26-09-04 371 376 1.35 Wacol 3-26-09-05 426 424 -0.47 Wacol 3-26-09-06 329 335 1.82 Wacol 3-26-09-07 109 110 0.92 Wacol 3-26-09-08 15 15 0.00 Wacol 7 1441 1454 0.90

Queensland Redistribution Statistics 2006
Enrolment Projections
----------------------------------------------------------------------------------------------------------------------
176
Oxley
---------------------------------------------------------------------------------------------------------------------- SLA Name CCD Number Actual
Enrolment 2/12/2005
Estimate 30/11/2007
Growth (%)
---------------------------------------------------------------------------------------------------------------------- Willawong 3-26-20-07 122 124 1.64 Willawong 1 122 124 1.64 Oxley 235 91116 98426 8.02

Queensland Redistribution Statistics 2006
Enrolment Projections
----------------------------------------------------------------------------------------------------------------------
177
Bald Hills 3-18-15-01 412 404 -1.94
Petrie
---------------------------------------------------------------------------------------------------------------------- SLA Name CCD Number Actual
Enrolment 2/12/2005
Estimate 30/11/2007
Growth (%)
---------------------------------------------------------------------------------------------------------------------- Aspley 3-22-01-02 687 688 0.15 Aspley 3-22-01-03 473 471 -0.42 Aspley 3-22-01-04 607 610 0.49 Aspley 3-22-01-05 575 578 0.52 Aspley 3-22-01-06 470 471 0.21 Aspley 3-22-01-07 361 364 0.83 Aspley 3-22-01-08 539 555 2.97 Aspley 3-22-01-09 545 550 0.92 Aspley 3-22-02-05 249 250 0.40 Aspley 9 4506 4537 0.69
Bald Hills 3-18-15-02 580 572 -1.38 Bald Hills 3-18-15-03 420 410 -2.38 Bald Hills 3-18-15-04 450 449 -0.22 Bald Hills 3-18-15-05 241 286 18.67 Bald Hills 3-18-15-06 689 883 28.16 Bald Hills 3-18-15-07 694 686 -1.15 Bald Hills 3-18-18-08 449 442 -1.56 Bald Hills 3-18-18-09 570 561 -1.58 Bald Hills 9 4505 4693 4.17
Bracken Ridge 3-18-15-08 665 775 16.54 Bracken Ridge 3-18-15-09 655 666 1.68 Bracken Ridge 3-18-15-10 648 662 2.16 Bracken Ridge 3-18-15-11 540 565 4.63 Bracken Ridge 3-18-15-12 485 499 2.89 Bracken Ridge 3-18-15-13 812 834 2.71 Bracken Ridge 3-18-15-14 650 659 1.38 Bracken Ridge 3-18-18-01 463 479 3.46 Bracken Ridge 3-18-18-02 550 561 2.00 Bracken Ridge 3-18-18-03 418 432 3.35 Bracken Ridge 3-18-18-04 838 971 15.87 Bracken Ridge 3-18-18-05 458 476 3.93 Bracken Ridge 3-18-18-06 366 376 2.73 Bracken Ridge 3-18-18-07 450 466 3.56 Bracken Ridge 3-18-18-10 483 487 0.83 Bracken Ridge 3-18-18-11 359 364 1.39 Bracken Ridge 3-18-18-12 651 659 1.23 Bracken Ridge 3-18-18-13 439 448 2.05 Bracken Ridge 18 9930 10379 4.52 Bridgeman Downs 3-18-13-01 461 481 4.34 Bridgeman Downs 3-18-13-02 826 903 9.32

Queensland Redistribution Statistics 2006
Enrolment Projections
----------------------------------------------------------------------------------------------------------------------
178
SLA Name
Bridgeman Downs 3-18-13-06 881 935 6.13
Carseldine 3-18-14-08 259 263 1.54
Carseldine 8 4964 5178 4.31
Chermside West 3-22-06-05 582 577 -0.86
Chermside West 3-22-06-07 367 365 -0.54
Petrie
----------------------------------------------------------------------------------------------------------------------
CCD Number Actual Enrolment 2/12/2005
Estimate 30/11/2007
Growth (%)
---------------------------------------------------------------------------------------------------------------------- Bridgeman Downs 3-18-13-03 810 869 7.28 Bridgeman Downs 3-18-13-04 633 689 8.85 Bridgeman Downs 3-18-13-05 507 565 11.44
Bridgeman Downs 3-18-13-07 488 500 2.46
Bridgeman Downs 7 4606 4942 7.29 Carseldine 3-18-14-01 891 1020 14.48 Carseldine 3-18-14-02 707 709 0.28 Carseldine 3-18-14-03 932 941 0.97 Carseldine 3-18-14-04 749 773 3.20 Carseldine 3-18-14-05 566 586 3.53 Carseldine 3-18-14-06 444 452 1.80 Carseldine 3-18-14-07 416 434 4.33
Chermside West 3-22-06-01 415 418 0.72 Chermside West 3-22-06-02 579 581 0.35 Chermside West 3-22-06-03 407 409 0.49 Chermside West 3-22-06-04 389 393 1.03
Chermside West 3-22-06-06 508 508 0.00
Chermside West 3-22-06-08 412 415 0.73 Chermside West 3-22-06-09 362 362 0.00 Chermside West 3-22-06-10 398 399 0.25 Chermside West 10 4419 4427 0.18 Clontarf 3-12-15-01 371 367 -1.08 Clontarf 3-12-15-02 310 309 -0.32 Clontarf 3-12-15-05 318 318 0.00 Clontarf 3-12-15-08 375 370 -1.33 Clontarf 3-12-15-11 407 408 0.25 Clontarf 3-12-16-01 357 353 -1.12 Clontarf 3-12-16-02 142 141 -0.70 Clontarf 3-12-16-03 344 347 0.87 Clontarf 3-12-16-04 342 339 -0.88 Clontarf 3-12-16-05 588 590 0.34 Clontarf 3-12-16-07 193 192 -0.52 Clontarf 3-12-16-08 520 511 -1.73 Clontarf 3-12-16-09 337 337 0.00 Clontarf 3-12-16-10 222 211 -4.95 Clontarf 3-12-16-11 140 139 -0.71
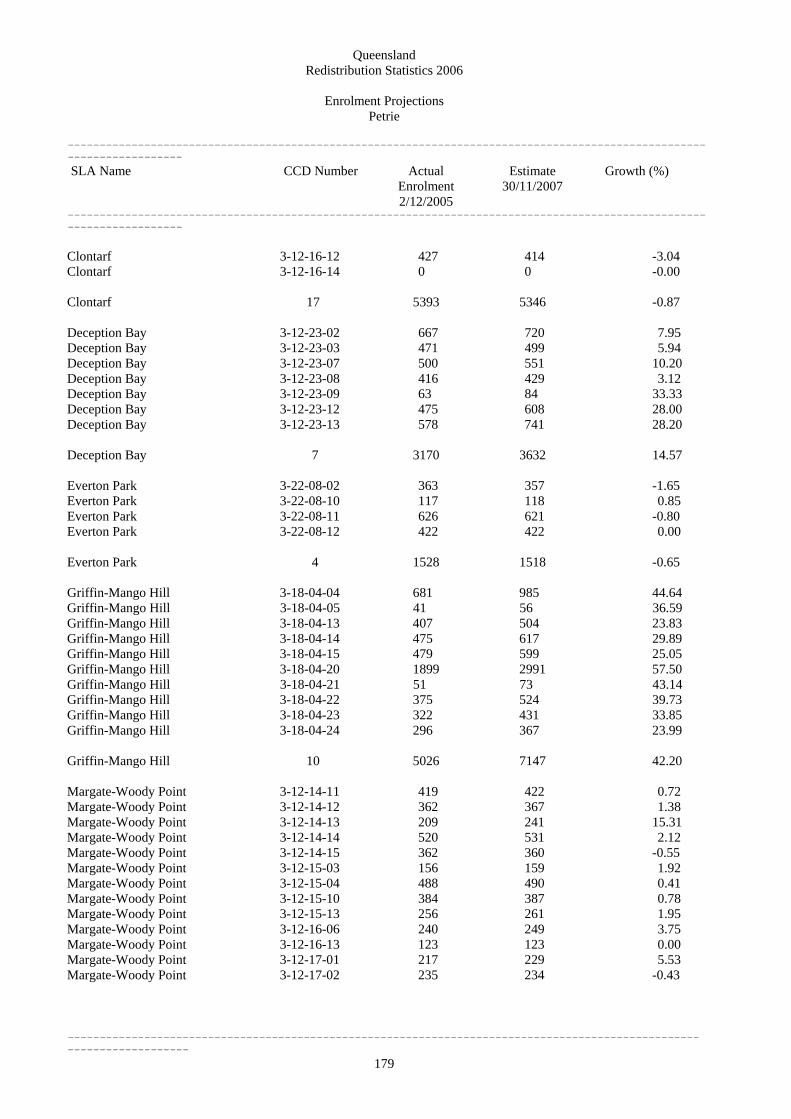
Queensland Redistribution Statistics 2006
Enrolment Projections
----------------------------------------------------------------------------------------------------------------------
179
Growth (%)
Everton Park 3-22-08-11 626 621 -0.80
Griffin-Mango Hill 3-18-04-05 41 56 36.59
Griffin-Mango Hill 3-18-04-14 475 617 29.89
Griffin-Mango Hill 3-18-04-21 51 73 43.14
Griffin-Mango Hill 3-18-04-23 322 431 33.85
Petrie
---------------------------------------------------------------------------------------------------------------------- SLA Name CCD Number Actual
Enrolment 2/12/2005
Estimate 30/11/2007
---------------------------------------------------------------------------------------------------------------------- Clontarf 3-12-16-12 427 414 -3.04 Clontarf 3-12-16-14 0 0 -0.00 Clontarf 17 5393 5346 -0.87 Deception Bay 3-12-23-02 667 720 7.95 Deception Bay 3-12-23-03 471 499 5.94 Deception Bay 3-12-23-07 500 551 10.20 Deception Bay 3-12-23-08 416 429 3.12 Deception Bay 3-12-23-09 63 84 33.33 Deception Bay 3-12-23-12 475 608 28.00 Deception Bay 3-12-23-13 578 741 28.20 Deception Bay 7 3170 3632 14.57 Everton Park 3-22-08-02 363 357 -1.65 Everton Park 3-22-08-10 117 118 0.85
Everton Park 3-22-08-12 422 422 0.00 Everton Park 4 1528 1518 -0.65 Griffin-Mango Hill 3-18-04-04 681 985 44.64
Griffin-Mango Hill 3-18-04-13 407 504 23.83
Griffin-Mango Hill 3-18-04-15 479 599 25.05 Griffin-Mango Hill 3-18-04-20 1899 2991 57.50
Griffin-Mango Hill 3-18-04-22 375 524 39.73
Griffin-Mango Hill 3-18-04-24 296 367 23.99 Griffin-Mango Hill 10 5026 7147 42.20 Margate-Woody Point 3-12-14-11 419 422 0.72 Margate-Woody Point 3-12-14-12 362 367 1.38 Margate-Woody Point 3-12-14-13 209 241 15.31 Margate-Woody Point 3-12-14-14 520 531 2.12 Margate-Woody Point 3-12-14-15 362 360 -0.55 Margate-Woody Point 3-12-15-03 156 159 1.92 Margate-Woody Point 3-12-15-04 488 490 0.41 Margate-Woody Point 3-12-15-10 384 387 0.78 Margate-Woody Point 3-12-15-13 256 261 1.95 Margate-Woody Point 3-12-16-06 240 249 3.75 Margate-Woody Point 3-12-16-13 123 123 0.00 Margate-Woody Point 3-12-17-01 217 229 5.53 Margate-Woody Point 3-12-17-02 235 234 -0.43

Queensland Redistribution Statistics 2006
Enrolment Projections
----------------------------------------------------------------------------------------------------------------------
180
Margate-Woody Point 3-12-17-05 394 402 2.03
Margate-Woody Point 3-12-17-08 500 525 5.00
McDowall 3-22-07-01 535 581 8.60
Redcliffe-Scarborough 3-12-12-06 224 230 2.68
Petrie
---------------------------------------------------------------------------------------------------------------------- SLA Name CCD Number Actual
Enrolment 2/12/2005
Estimate 30/11/2007
Growth (%)
---------------------------------------------------------------------------------------------------------------------- Margate-Woody Point 3-12-17-03 277 282 1.81 Margate-Woody Point 3-12-17-04 153 153 0.00
Margate-Woody Point 3-12-17-06 288 290 0.69 Margate-Woody Point 3-12-17-07 185 187 1.08
Margate-Woody Point 3-12-17-09 280 299 6.79 Margate-Woody Point 3-12-17-10 331 338 2.11 Margate-Woody Point 3-12-17-11 270 267 -1.11 Margate-Woody Point 3-12-17-12 246 251 2.03 Margate-Woody Point 3-12-17-13 288 295 2.43 Margate-Woody Point 24 7183 7342 2.21
McDowall 3-22-07-02 571 583 2.10 McDowall 3-22-07-03 734 835 13.76 McDowall 3-22-07-04 334 341 2.10 McDowall 3-22-07-05 604 620 2.65 McDowall 3-22-07-06 474 488 2.95 McDowall 3-22-07-07 533 542 1.69 McDowall 3-22-07-08 532 550 3.38 McDowall 3-22-07-09 442 462 4.52 McDowall 9 4759 5002 5.11 Redcliffe-Scarborough 3-12-12-01 451 460 2.00 Redcliffe-Scarborough 3-12-12-02 183 197 7.65 Redcliffe-Scarborough 3-12-12-03 243 265 9.05 Redcliffe-Scarborough 3-12-12-04 414 419 1.21 Redcliffe-Scarborough 3-12-12-05 338 346 2.37
Redcliffe-Scarborough 3-12-12-07 219 220 0.46 Redcliffe-Scarborough 3-12-12-08 302 317 4.97 Redcliffe-Scarborough 3-12-12-09 491 507 3.26 Redcliffe-Scarborough 3-12-12-10 812 813 0.12 Redcliffe-Scarborough 3-12-12-11 328 338 3.05 Redcliffe-Scarborough 3-12-12-12 464 463 -0.22 Redcliffe-Scarborough 3-12-12-13 322 357 10.87 Redcliffe-Scarborough 3-12-12-14 663 702 5.88 Redcliffe-Scarborough 3-12-12-15 557 559 0.36 Redcliffe-Scarborough 3-12-13-01 408 416 1.96 Redcliffe-Scarborough 3-12-13-02 224 230 2.68 Redcliffe-Scarborough 3-12-13-03 227 231 1.76 Redcliffe-Scarborough 3-12-13-04 448 459 2.46 Redcliffe-Scarborough 3-12-13-05 425 450 5.88 Redcliffe-Scarborough 3-12-13-06 387 390 0.78

Queensland Redistribution Statistics 2006
Enrolment Projections
----------------------------------------------------------------------------------------------------------------------
181
Redcliffe-Scarborough 3-12-14-16 274 277 1.09
Petrie
---------------------------------------------------------------------------------------------------------------------- SLA Name CCD Number Actual
Enrolment 2/12/2005
Estimate 30/11/2007
Growth (%)
---------------------------------------------------------------------------------------------------------------------- Redcliffe-Scarborough 3-12-13-07 672 748 11.31 Redcliffe-Scarborough 3-12-13-08 412 412 0.00 Redcliffe-Scarborough 3-12-13-09 248 256 3.23 Redcliffe-Scarborough 3-12-13-10 399 406 1.75 Redcliffe-Scarborough 3-12-13-11 110 117 6.36 Redcliffe-Scarborough 3-12-13-12 373 376 0.80 Redcliffe-Scarborough 3-12-14-01 133 134 0.75 Redcliffe-Scarborough 3-12-14-02 260 267 2.69 Redcliffe-Scarborough 3-12-14-03 341 368 7.92 Redcliffe-Scarborough 3-12-14-04 94 93 -1.06 Redcliffe-Scarborough 3-12-14-05 266 279 4.89 Redcliffe-Scarborough 3-12-14-06 312 326 4.49 Redcliffe-Scarborough 3-12-14-07 199 201 1.01 Redcliffe-Scarborough 3-12-14-08 321 323 0.62 Redcliffe-Scarborough 3-12-14-09 268 270 0.75 Redcliffe-Scarborough 3-12-14-10 147 149 1.36
Redcliffe-Scarborough 38 12959 13371 3.18 Rothwell-Kippa-Ring 3-12-11-01 391 402 2.81 Rothwell-Kippa-Ring 3-12-11-02 657 711 8.22 Rothwell-Kippa-Ring 3-12-11-03 451 461 2.22 Rothwell-Kippa-Ring 3-12-11-04 381 386 1.31 Rothwell-Kippa-Ring 3-12-11-05 116 124 6.90 Rothwell-Kippa-Ring 3-12-11-06 317 325 2.52 Rothwell-Kippa-Ring 3-12-11-07 266 313 17.67 Rothwell-Kippa-Ring 3-12-11-08 468 484 3.42 Rothwell-Kippa-Ring 3-12-11-09 743 812 9.29 Rothwell-Kippa-Ring 3-12-11-10 214 218 1.87 Rothwell-Kippa-Ring 3-12-11-11 311 317 1.93 Rothwell-Kippa-Ring 3-12-11-12 558 629 12.72 Rothwell-Kippa-Ring 3-12-11-13 308 311 0.97 Rothwell-Kippa-Ring 3-12-11-14 419 435 3.82 Rothwell-Kippa-Ring 3-12-11-15 598 611 2.17 Rothwell-Kippa-Ring 3-12-11-16 415 448 7.95 Rothwell-Kippa-Ring 3-12-11-17 451 454 0.67 Rothwell-Kippa-Ring 3-12-15-06 366 371 1.37 Rothwell-Kippa-Ring 3-12-15-07 385 396 2.86 Rothwell-Kippa-Ring 3-12-15-09 561 573 2.14 Rothwell-Kippa-Ring 3-12-15-12 505 509 0.79 Rothwell-Kippa-Ring 3-12-15-14 511 523 2.35 Rothwell-Kippa-Ring 22 9392 9813 4.48 Stafford Heights 3-22-09-01 651 653 0.31 Stafford Heights 3-22-09-02 464 465 0.22

Queensland Redistribution Statistics 2006
Enrolment Projections
----------------------------------------------------------------------------------------------------------------------
182
Stafford Heights 3-22-09-08 396 396 0.00
Stafford Heights 3-22-09-10 439 435 -0.91 Stafford Heights 3-22-09-11 398 399 0.25
Petrie
---------------------------------------------------------------------------------------------------------------------- SLA Name CCD Number Actual
Enrolment 2/12/2005
Estimate 30/11/2007
Growth (%)
---------------------------------------------------------------------------------------------------------------------- Stafford Heights 3-22-09-03 671 669 -0.30 Stafford Heights 3-22-09-05 220 220 0.00 Stafford Heights 3-22-09-06 377 375 -0.53 Stafford Heights 3-22-09-07 474 479 1.05
Stafford Heights 3-22-09-09 568 568 0.00
Stafford Heights 10 4658 4659 0.02 Taigum-Fitzgibbon 3-18-23-01 692 704 1.73 Taigum-Fitzgibbon 3-18-23-02 357 367 2.80 Taigum-Fitzgibbon 3-18-23-03 334 335 0.30 Taigum-Fitzgibbon 3-18-23-04 303 316 4.29 Taigum-Fitzgibbon 4 1686 1722 2.14 Petrie 206 88684 93708 5.67

Queensland Redistribution Statistics 2006
Enrolment Projections
----------------------------------------------------------------------------------------------------------------------
183
Rankin
---------------------------------------------------------------------------------------------------------------------- SLA Name CCD Number Actual
Enrolment 2/12/2005
Estimate 30/11/2007
Growth (%)
---------------------------------------------------------------------------------------------------------------------- Browns Plains 3-25-10-02 557 597 7.18 Browns Plains 3-25-10-04 268 280 4.48 Browns Plains 3-25-10-05 762 768 0.79 Browns Plains 3-25-10-06 235 241 2.55 Browns Plains 3-25-10-07 661 734 11.04 Browns Plains 3-25-10-08 558 572 2.51 Browns Plains 3-25-10-09 599 611 2.00 Browns Plains 3-25-10-10 654 716 9.48 Browns Plains 3-25-10-11 489 553 13.09 Browns Plains 3-25-10-12 580 701 20.86 Browns Plains 3-25-20-01 452 464 2.65 Browns Plains 3-25-20-02 423 431 1.89 Browns Plains 3-25-20-03 547 565 3.29 Browns Plains 3-25-20-04 307 312 1.63 Browns Plains 3-25-20-05 290 297 2.41 Browns Plains 3-25-20-06 602 609 1.16 Browns Plains 3-25-20-07 578 596 3.11 Browns Plains 3-25-20-08 483 491 1.66 Browns Plains 3-25-20-09 314 321 2.23 Browns Plains 3-25-20-10 336 347 3.27 Browns Plains 3-25-20-11 547 558 2.01 Browns Plains 3-25-20-12 699 712 1.86 Browns Plains 3-25-20-13 292 296 1.37 Browns Plains 3-25-21-01 421 428 1.66 Browns Plains 3-25-21-03 359 370 3.06 Browns Plains 3-25-21-04 452 465 2.88 Browns Plains 3-25-21-05 565 582 3.01 Browns Plains 3-25-21-06 526 531 0.95 Browns Plains 3-25-21-08 434 440 1.38 Browns Plains 3-25-21-09 371 380 2.43 Browns Plains 3-25-21-10 293 304 3.75 Browns Plains 3-25-21-11 393 396 0.76 Browns Plains 32 15047 15668 4.13 Daisy Hill-Priestdale 3-25-06-01 103 102 -0.97 Daisy Hill-Priestdale 3-25-06-02 0 0 0.00 Daisy Hill-Priestdale 3-25-06-03 533 542 1.69 Daisy Hill-Priestdale 3-25-06-04 434 439 1.15 Daisy Hill-Priestdale 3-25-06-05 336 339 0.89 Daisy Hill-Priestdale 3-25-06-06 714 723 1.26 Daisy Hill-Priestdale 3-25-06-07 676 676 0.00 Daisy Hill-Priestdale 3-25-06-08 0 0 0.00 Daisy Hill-Priestdale 8 2796 2821 0.89 Eight Mile Plains 3-26-04-03 60 68 13.33

Queensland Redistribution Statistics 2006
Enrolment Projections
----------------------------------------------------------------------------------------------------------------------
184
Kingston 3-25-17-09 257 260 1.17
Kingston 3-25-17-12 390 405 3.85
Kingston 19 7054 7150 1.36
Rankin
---------------------------------------------------------------------------------------------------------------------- SLA Name CCD Number Actual
Enrolment 2/12/2005
Estimate 30/11/2007
Growth (%)
---------------------------------------------------------------------------------------------------------------------- Eight Mile Plains 3-26-04-08 0 0 0.00 Eight Mile Plains 2 60 68 13.33 Greenbank-Boronia Heights 3-25-23-01 0 0 0.00 Greenbank-Boronia Heights 3-25-23-02 314 319 1.59 Greenbank-Boronia Heights 3-25-23-03 331 345 4.23 Greenbank-Boronia Heights 3-25-23-04 338 350 3.55 Greenbank-Boronia Heights 3-25-23-05 442 471 6.56 Greenbank-Boronia Heights 3-25-23-06 539 545 1.11 Greenbank-Boronia Heights 3-25-23-07 583 597 2.40 Greenbank-Boronia Heights 3-25-23-08 543 565 4.05 Greenbank-Boronia Heights 3-25-23-09 592 599 1.18 Greenbank-Boronia Heights 3-25-23-10 584 598 2.40 Greenbank-Boronia Heights 3-25-23-11 428 454 6.07 Greenbank-Boronia Heights 11 4694 4843 3.17 Kingston 3-25-13-01 395 401 1.52 Kingston 3-25-13-02 434 436 0.46 Kingston 3-25-13-03 481 484 0.62 Kingston 3-25-13-04 429 436 1.63 Kingston 3-25-13-05 421 421 0.00 Kingston 3-25-13-06 451 456 1.11 Kingston 3-25-13-07 303 307 1.32 Kingston 3-25-17-01 360 364 1.11 Kingston 3-25-17-02 505 513 1.58 Kingston 3-25-17-03 304 307 0.99 Kingston 3-25-17-04 387 392 1.29 Kingston 3-25-17-05 205 210 2.44 Kingston 3-25-17-06 570 577 1.23 Kingston 3-25-17-07 349 353 1.15 Kingston 3-25-17-08 124 124 0.00
Kingston 3-25-17-10 261 266 1.92 Kingston 3-25-17-11 428 438 2.34
Kuraby 3-26-08-07 757 927 22.46 Kuraby 3-26-08-08 148 202 36.49 Kuraby 3-26-08-09 673 708 5.20 Kuraby 3-26-08-12 642 708 10.28 Kuraby 3-26-08-13 456 524 14.91 Kuraby 3-26-08-14 580 646 11.38 Kuraby 3-26-08-15 461 492 6.72

Queensland Redistribution Statistics 2006
Enrolment Projections
----------------------------------------------------------------------------------------------------------------------
185
----------------------------------------------------------------------------------------------------------------------
Marsden 3-25-19-05 413 441 6.78
Marsden 3-25-19-11 556 766 37.77
Marsden 3-25-19-13 322 339 5.28
Rankin
SLA Name CCD Number Actual Enrolment 2/12/2005
Estimate 30/11/2007
Growth (%)
---------------------------------------------------------------------------------------------------------------------- Kuraby 7 3717 4207 13.18 Logan (C) Bal 3-25-10-01 687 807 17.47 Logan (C) Bal 3-25-10-03 498 513 3.01 Logan (C) Bal 2 1185 1320 11.39 Loganholme 3-25-09-02 605 613 1.32 Loganholme 3-25-09-03 646 677 4.80 Loganholme 3-25-09-05 472 486 2.97 Loganholme 3-25-09-13 438 468 6.85 Loganholme 3-25-09-14 681 710 4.26 Loganholme 3-25-09-16 401 412 2.74 Loganholme 6 3243 3366 3.79 Loganlea 3-25-11-03 37 37 0.00 Loganlea 3-25-11-04 4 4 0.00 Loganlea 3-25-11-08 472 650 37.71 Loganlea 3-25-11-09 2 2 0.00 Loganlea 4 515 693 34.56 Marsden 3-25-18-01 103 108 4.85 Marsden 3-25-18-02 322 337 4.66 Marsden 3-25-18-03 607 630 3.79 Marsden 3-25-18-04 398 413 3.77 Marsden 3-25-18-05 425 444 4.47 Marsden 3-25-18-06 535 635 18.69 Marsden 3-25-18-07 279 285 2.15 Marsden 3-25-18-08 551 580 5.26 Marsden 3-25-18-09 560 660 17.86 Marsden 3-25-18-10 528 567 7.39 Marsden 3-25-19-01 506 522 3.16 Marsden 3-25-19-02 602 900 49.50 Marsden 3-25-19-03 347 367 5.76 Marsden 3-25-19-04 273 287 5.13
Marsden 3-25-19-06 459 477 3.92 Marsden 3-25-19-07 420 445 5.95 Marsden 3-25-19-08 431 449 4.18 Marsden 3-25-19-09 358 370 3.35 Marsden 3-25-19-10 364 383 5.22
Marsden 3-25-19-12 350 362 3.43

Queensland Redistribution Statistics 2006
Enrolment Projections
----------------------------------------------------------------------------------------------------------------------
186
Shailer Park 3-25-07-03 262 269 2.67
Shailer Park 3-25-07-05 413 419 1.45
Rankin
---------------------------------------------------------------------------------------------------------------------- SLA Name CCD Number Actual
Enrolment 2/12/2005
Estimate 30/11/2007
Growth (%)
---------------------------------------------------------------------------------------------------------------------- Marsden 3-25-19-14 370 392 5.95 Marsden 24 10079 11159 10.72 Parkinson-Drewvale 3-26-08-01 0 0 0.00 Parkinson-Drewvale 3-26-08-10 629 764 21.46 Parkinson-Drewvale 2 629 764 21.46 Rochedale South 3-25-02-01 485 480 -1.03 Rochedale South 3-25-02-02 577 571 -1.04 Rochedale South 3-25-02-03 364 361 -0.82 Rochedale South 3-25-02-04 374 375 0.27 Rochedale South 3-25-02-05 513 510 -0.58 Rochedale South 3-25-02-06 379 379 0.00 Rochedale South 3-25-02-07 459 463 0.87 Rochedale South 3-25-02-08 222 219 -1.35 Rochedale South 3-25-02-09 195 195 0.00 Rochedale South 3-25-02-10 416 418 0.48 Rochedale South 3-25-02-11 509 517 1.57 Rochedale South 3-25-02-12 335 334 -0.30 Rochedale South 3-25-02-13 311 315 1.29 Rochedale South 3-25-04-01 349 349 0.00 Rochedale South 3-25-04-02 349 347 -0.57 Rochedale South 3-25-04-03 606 606 0.00 Rochedale South 3-25-04-04 528 531 0.57 Rochedale South 3-25-04-05 561 572 1.96 Rochedale South 3-25-04-06 457 460 0.66 Rochedale South 3-25-04-07 196 194 -1.02 Rochedale South 3-25-04-08 242 240 -0.83 Rochedale South 3-25-04-09 338 340 0.59 Rochedale South 3-25-04-10 400 400 0.00 Rochedale South 3-25-04-11 255 259 1.57 Rochedale South 3-25-04-12 640 633 -1.09 Rochedale South 25 10060 10068 0.08 Runcorn 3-26-26-09 0 0 0.00 Runcorn 3-26-26-17 0 0 0.00 Runcorn 2 0 0 0.00 Shailer Park 3-25-07-01 442 459 3.85 Shailer Park 3-25-07-02 578 588 1.73
Shailer Park 3-25-07-04 559 567 1.43

Queensland Redistribution Statistics 2006
Enrolment Projections
----------------------------------------------------------------------------------------------------------------------
187
Rankin
---------------------------------------------------------------------------------------------------------------------- SLA Name CCD Number Actual
Enrolment 2/12/2005
Estimate 30/11/2007
Growth (%)
---------------------------------------------------------------------------------------------------------------------- Shailer Park 3-25-07-06 393 397 1.02 Shailer Park 3-25-07-07 389 403 3.60 Shailer Park 3-25-07-08 557 568 1.97 Shailer Park 3-25-07-09 464 478 3.02 Shailer Park 3-25-07-10 682 694 1.76 Shailer Park 3-25-07-11 407 415 1.97 Shailer Park 3-25-07-12 357 366 2.52 Shailer Park 3-25-07-13 432 443 2.55 Shailer Park 3-25-07-14 609 650 6.73 Shailer Park 3-25-07-15 459 463 0.87 Shailer Park 15 7003 7179 2.51 Slacks Creek 3-25-12-01 354 357 0.85 Slacks Creek 3-25-12-02 416 420 0.96 Slacks Creek 3-25-12-03 500 503 0.60 Slacks Creek 3-25-12-04 486 491 1.03 Slacks Creek 3-25-12-05 590 591 0.17 Slacks Creek 3-25-12-06 466 480 3.00 Slacks Creek 3-25-12-07 495 501 1.21 Slacks Creek 3-25-12-08 249 250 0.40 Slacks Creek 3-25-12-09 336 336 0.00 Slacks Creek 3-25-12-10 182 187 2.75 Slacks Creek 3-25-12-11 83 84 1.20 Slacks Creek 3-25-13-08 246 252 2.44 Slacks Creek 3-25-13-09 516 521 0.97 Slacks Creek 3-25-14-01 287 289 0.70 Slacks Creek 3-25-14-02 453 455 0.44 Slacks Creek 3-25-14-03 284 287 1.06 Slacks Creek 3-25-14-06 421 429 1.90 Slacks Creek 3-25-14-07 361 365 1.11 Slacks Creek 3-25-14-08 415 418 0.72 Slacks Creek 19 7140 7216 1.06 Springwood 3-25-03-01 310 306 -1.29 Springwood 3-25-03-02 645 639 -0.93 Springwood 3-25-03-03 691 692 0.14 Springwood 3-25-03-04 582 583 0.17 Springwood 3-25-03-05 373 374 0.27 Springwood 3-25-03-06 701 698 -0.43 Springwood 3-25-03-07 285 285 0.00 Springwood 3-25-03-08 175 174 -0.57 Springwood 3-25-03-09 294 296 0.68
Springwood 9 4056 4047 -0.22

Queensland Redistribution Statistics 2006
Enrolment Projections
----------------------------------------------------------------------------------------------------------------------
188
Stretton-Karawatha 3-26-08-02 0 0 0.00
Woodridge 3-25-16-06 463 465 0.43
Woodridge 3-25-16-08 349 359 2.87
Rankin
---------------------------------------------------------------------------------------------------------------------- SLA Name CCD Number Actual
Enrolment 2/12/2005
Estimate 30/11/2007
Growth (%)
----------------------------------------------------------------------------------------------------------------------
Stretton-Karawatha 3-26-08-03 0 0 0.00 Stretton-Karawatha 3-26-08-06 30 33 10.00 Stretton-Karawatha 3 30 33 10.00 Tanah Merah 3-25-11-01 593 592 -0.17 Tanah Merah 1 593 592 -0.17 Underwood 3-25-01-01 488 499 2.25 Underwood 3-25-01-02 451 463 2.66 Underwood 3-25-01-03 544 564 3.68 Underwood 3-25-01-04 131 134 2.29 Underwood 3-25-01-05 371 479 29.11 Underwood 3-25-01-06 685 852 24.38 Underwood 6 2670 2991 12.02 Woodridge 3-25-14-04 214 215 0.47 Woodridge 3-25-14-05 507 512 0.99 Woodridge 3-25-14-09 378 380 0.53 Woodridge 3-25-14-10 479 482 0.63 Woodridge 3-25-14-11 267 267 0.00 Woodridge 3-25-14-12 188 188 0.00 Woodridge 3-25-15-01 167 167 0.00 Woodridge 3-25-15-02 406 407 0.25 Woodridge 3-25-15-03 246 247 0.41 Woodridge 3-25-15-04 269 269 0.00 Woodridge 3-25-15-05 555 557 0.36 Woodridge 3-25-15-06 184 188 2.17 Woodridge 3-25-15-07 296 295 -0.34 Woodridge 3-25-15-08 290 295 1.72 Woodridge 3-25-15-09 107 108 0.93 Woodridge 3-25-15-10 260 260 0.00 Woodridge 3-25-15-11 294 293 -0.34 Woodridge 3-25-15-12 309 311 0.65 Woodridge 3-25-15-13 269 271 0.74 Woodridge 3-25-15-14 267 270 1.12 Woodridge 3-25-16-01 534 537 0.56 Woodridge 3-25-16-02 476 483 1.47 Woodridge 3-25-16-03 319 321 0.63 Woodridge 3-25-16-04 240 239 -0.42 Woodridge 3-25-16-05 429 431 0.47
Woodridge 3-25-16-07 536 540 0.75
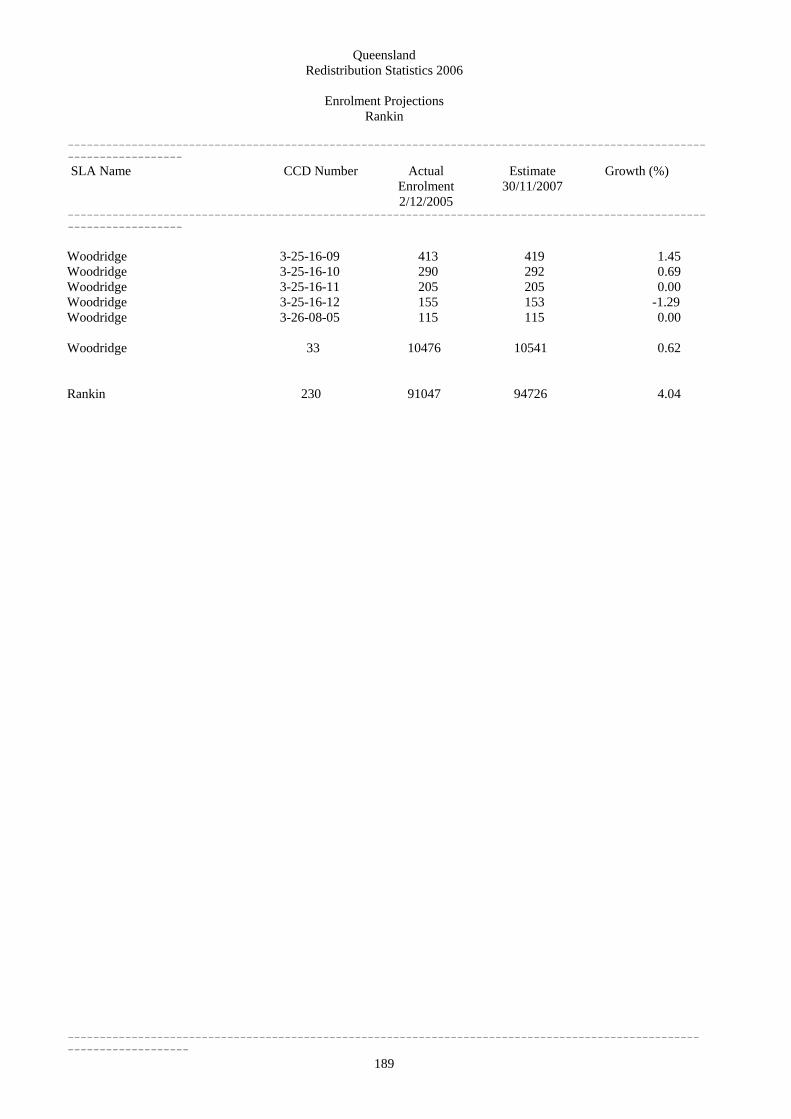
Queensland Redistribution Statistics 2006
Enrolment Projections
----------------------------------------------------------------------------------------------------------------------
189
CCD Number Actual Enrolment 2/12/2005
Rankin
---------------------------------------------------------------------------------------------------------------------- SLA Name Estimate
30/11/2007 Growth (%)
---------------------------------------------------------------------------------------------------------------------- Woodridge 3-25-16-09 413 419 1.45 Woodridge 3-25-16-10 290 292 0.69 Woodridge 3-25-16-11 205 205 0.00 Woodridge 3-25-16-12 155 153 -1.29 Woodridge 3-26-08-05 115 115 0.00 Woodridge 33 10476 10541 0.62
Rankin 230 91047 94726 4.04

Queensland Redistribution Statistics 2006
Enrolment Projections
----------------------------------------------------------------------------------------------------------------------
190
Bellbowrie 6 3242 3612 11.41
Chapel Hill 3-23-23-04 516 524 1.55
Chapel Hill 3-23-23-06 71 71 0.00
Ryan
---------------------------------------------------------------------------------------------------------------------- SLA Name CCD Number Actual
Enrolment 2/12/2005
Estimate 30/11/2007
Growth (%)
---------------------------------------------------------------------------------------------------------------------- Anstead 3-23-11-01 599 617 3.01 Anstead 3-23-11-02 134 136 1.49 Anstead 2 733 753 2.73 Bardon 3-23-08-11 505 520 2.97 Bardon 3-23-08-12 363 368 1.38 Bardon 3-23-08-13 346 353 2.02 Bardon 3-23-08-14 351 363 3.42 Bardon 4 1565 1604 2.49 Bellbowrie 3-23-01-01 725 850 17.24 Bellbowrie 3-23-01-02 666 824 23.72 Bellbowrie 3-23-01-03 355 368 3.66 Bellbowrie 3-23-01-04 632 655 3.64 Bellbowrie 3-23-01-05 387 397 2.58 Bellbowrie 3-23-01-07 477 518 8.60
Brookfield (incl. Mt C'tha) 3-23-12-02 525 556 5.90 Brookfield (incl. Mt C'tha) 3-23-12-03 596 614 3.02 Brookfield (incl. Mt C'tha) 3-23-12-04 933 959 2.79 Brookfield (incl. Mt C'tha) 3-23-12-05 352 359 1.99 Brookfield (incl. Mt C'tha) 4 2406 2488 3.41 Chapel Hill 3-23-23-01 370 386 4.32 Chapel Hill 3-23-23-02 515 524 1.75 Chapel Hill 3-23-23-03 632 638 0.95
Chapel Hill 3-23-23-05 441 445 0.91
Chapel Hill 3-23-23-07 597 610 2.18 Chapel Hill 3-23-23-08 427 438 2.58 Chapel Hill 3-23-23-09 482 492 2.07 Chapel Hill 3-23-23-10 221 229 3.62 Chapel Hill 3-23-23-11 355 363 2.25 Chapel Hill 3-23-23-12 567 581 2.47 Chapel Hill 3-23-23-13 505 532 5.35 Chapel Hill 3-23-23-14 385 406 5.45 Chapel Hill 3-23-23-15 565 584 3.36 Chapel Hill 3-23-23-16 479 492 2.71 Chapel Hill 16 7128 7315 2.62

Queensland Redistribution Statistics 2006
Enrolment Projections
----------------------------------------------------------------------------------------------------------------------
191
Jindalee 3-26-05-09 389 384 -1.29
Ryan
---------------------------------------------------------------------------------------------------------------------- SLA Name CCD Number Actual
Enrolment 2/12/2005
Estimate 30/11/2007
Growth (%)
---------------------------------------------------------------------------------------------------------------------- Darra-Sumner 3-26-09-01 117 254 117.09 Darra-Sumner 1 117 254 117.09 Fig Tree Pocket 3-23-21-01 325 327 0.62 Fig Tree Pocket 3-23-21-02 767 813 6.00 Fig Tree Pocket 3-23-21-03 634 690 8.83 Fig Tree Pocket 3-23-21-04 363 370 1.93 Fig Tree Pocket 4 2089 2200 5.31 Indooroopilly 3-23-19-01 368 420 14.13 Indooroopilly 3-23-19-02 335 352 5.07 Indooroopilly 3-23-19-03 315 318 0.95 Indooroopilly 3-23-19-04 359 387 7.80 Indooroopilly 3-23-19-05 363 448 23.42 Indooroopilly 3-23-19-06 521 537 3.07 Indooroopilly 3-23-19-07 726 738 1.65 Indooroopilly 3-23-19-08 210 216 2.86 Indooroopilly 3-23-19-09 277 287 3.61 Indooroopilly 3-23-20-01 312 319 2.24 Indooroopilly 3-23-20-02 411 428 4.14 Indooroopilly 3-23-20-03 410 425 3.66 Indooroopilly 3-23-20-04 429 447 4.20 Indooroopilly 3-23-20-05 217 220 1.38 Indooroopilly 3-23-20-06 467 474 1.50 Indooroopilly 3-23-20-07 507 521 2.76 Indooroopilly 3-23-20-08 582 597 2.58 Indooroopilly 3-23-20-09 304 355 16.78 Indooroopilly 18 7113 7489 5.29
Jamboree Heights 3-26-07-01 614 692 12.70 Jamboree Heights 3-26-07-02 474 477 0.63 Jamboree Heights 3-26-07-03 335 335 0.00 Jamboree Heights 3-26-07-04 415 420 1.20 Jamboree Heights 3-26-07-05 406 403 -0.74 Jamboree Heights 5 2244 2327 3.70 Jindalee 3-26-05-03 594 589 -0.84 Jindalee 3-26-05-04 414 410 -0.97 Jindalee 3-26-05-05 357 351 -1.68 Jindalee 3-26-05-06 403 397 -1.49 Jindalee 3-26-05-07 629 614 -2.38 Jindalee 3-26-05-08 449 447 -0.45

Queensland Redistribution Statistics 2006
Enrolment Projections
----------------------------------------------------------------------------------------------------------------------
192
Kenmore 3-23-22-13 381 386 1.31
Ryan
---------------------------------------------------------------------------------------------------------------------- SLA Name CCD Number Actual
Enrolment 2/12/2005
Estimate 30/11/2007
Growth (%)
---------------------------------------------------------------------------------------------------------------------- Jindalee 3-26-05-10 354 349 -1.41 Jindalee 8 3589 3541 -1.34 Karana Downs-Lake Manchester 3-13-05-04 321 338 5.30 Karana Downs-Lake Manchester 3-13-05-08 411 436 6.08 Karana Downs-Lake Manchester 3-13-05-09 349 371 6.30 Karana Downs-Lake Manchester 3-13-05-10 540 571 5.74 Karana Downs-Lake Manchester 3-13-06-02 234 255 8.97 Karana Downs-Lake Manchester 3-13-06-06 697 808 15.93 Karana Downs-Lake Manchester 3-13-06-07 387 425 9.82 Karana Downs-Lake Manchester 3-13-06-10 686 724 5.54 Karana Downs-Lake Manchester 3-13-11-09 0 0 0.00 Karana Downs-Lake Manchester 9 3625 3928 8.36 Kenmore 3-23-22-01 455 464 1.98 Kenmore 3-23-22-02 523 528 0.96 Kenmore 3-23-22-03 248 252 1.61 Kenmore 3-23-22-04 385 387 0.52 Kenmore 3-23-22-05 152 149 -1.97 Kenmore 3-23-22-06 213 216 1.41 Kenmore 3-23-22-07 464 461 -0.65 Kenmore 3-23-22-08 496 499 0.60 Kenmore 3-23-22-09 412 415 0.73 Kenmore 3-23-22-10 734 738 0.54 Kenmore 3-23-22-11 591 592 0.17 Kenmore 3-23-22-12 457 460 0.66
Kenmore 3-23-22-14 467 464 -0.64 Kenmore 14 5978 6011 0.55 Kenmore Hills 3-23-24-01 842 857 1.78 Kenmore Hills 3-23-24-02 892 916 2.69 Kenmore Hills 2 1734 1773 2.25 Middle Park 3-26-03-01 650 652 0.31 Middle Park 3-26-03-02 618 618 0.00 Middle Park 3-26-03-03 493 496 0.61 Middle Park 3-26-03-04 544 547 0.55 Middle Park 3-26-03-05 514 517 0.58 Middle Park 5 2819 2830 0.39 Moggill 3-23-01-06 325 411 26.46

Queensland Redistribution Statistics 2006
Enrolment Projections
----------------------------------------------------------------------------------------------------------------------
193
Riverhills 3-26-02-04 345 354 2.61
Ryan
---------------------------------------------------------------------------------------------------------------------- SLA Name CCD Number Actual
Enrolment 2/12/2005
Estimate 30/11/2007
Growth (%)
---------------------------------------------------------------------------------------------------------------------- Moggill 3-23-01-08 805 933 15.90 Moggill 2 1130 1344 18.94 Mount Ommaney 3-26-05-01 760 778 2.37 Mount Ommaney 3-26-05-02 805 817 1.49 Mount Ommaney 2 1565 1595 1.92 Paddington 3-19-11-08 134 137 2.24 Paddington 3-19-11-11 290 298 2.76 Paddington 2 424 435 2.59 Pinjarra Hills 3-23-11-03 272 274 0.74 Pinjarra Hills 1 272 274 0.74 Pullenvale 3-23-25-01 531 634 19.40 Pullenvale 3-23-25-02 314 346 10.19 Pullenvale 3-23-25-03 615 653 6.18 Pullenvale 3-23-25-04 505 533 5.54 Pullenvale 4 1965 2166 10.23 Riverhills 3-26-02-01 276 280 1.45 Riverhills 3-26-02-02 407 427 4.91 Riverhills 3-26-02-03 189 189 0.00
Riverhills 3-26-02-05 395 408 3.29 Riverhills 3-26-02-06 493 512 3.85 Riverhills 3-26-02-07 377 406 7.69 Riverhills 7 2482 2576 3.79 St Lucia 3-23-17-01 314 327 4.14 St Lucia 3-23-17-02 169 174 2.96 St Lucia 3-23-17-03 219 232 5.94 St Lucia 3-23-17-04 254 256 0.79 St Lucia 3-23-17-05 297 304 2.36 St Lucia 3-23-17-06 481 492 2.29 St Lucia 3-23-17-07 167 169 1.20 St Lucia 3-23-17-08 227 237 4.41 St Lucia 3-23-17-09 166 175 5.42 St Lucia 3-23-17-10 262 284 8.40 St Lucia 3-23-18-01 493 496 0.61 St Lucia 3-23-18-02 386 398 3.11

Queensland Redistribution Statistics 2006
Enrolment Projections
----------------------------------------------------------------------------------------------------------------------
194
Ryan
---------------------------------------------------------------------------------------------------------------------- SLA Name CCD Number Actual
Enrolment 2/12/2005
Estimate 30/11/2007
Growth (%)
---------------------------------------------------------------------------------------------------------------------- St Lucia 3-23-18-03 228 236 3.51 St Lucia 3-23-18-04 219 228 4.11 St Lucia 3-23-18-05 125 131 4.80 St Lucia 3-23-18-06 394 396 0.51 St Lucia 3-23-18-07 245 248 1.22 St Lucia 3-23-18-08 143 147 2.80 St Lucia 3-23-18-09 283 288 1.77 St Lucia 3-23-18-10 148 148 0.00 St Lucia 20 5220 5366 2.80 Taringa 3-23-16-01 622 644 3.54 Taringa 3-23-16-02 250 255 2.00 Taringa 3-23-16-03 310 324 4.52 Taringa 3-23-16-04 404 417 3.22 Taringa 3-23-16-05 519 581 11.95 Taringa 3-23-16-06 444 453 2.03 Taringa 3-23-16-07 414 424 2.42 Taringa 3-23-16-08 415 419 0.96 Taringa 3-23-16-09 446 454 1.79 Taringa 3-23-16-10 148 148 0.00 Taringa 3-23-16-11 243 259 6.58 Taringa 3-23-16-12 367 371 1.09 Taringa 3-23-16-13 416 426 2.40 Taringa 13 4998 5175 3.54 The Gap (incl. Enoggera Res.) 3-23-09-01 512 513 0.20 The Gap (incl. Enoggera Res.) 3-23-09-02 434 432 -0.46 The Gap (incl. Enoggera Res.) 3-23-09-03 453 459 1.32 The Gap (incl. Enoggera Res.) 3-23-09-04 680 682 0.29 The Gap (incl. Enoggera Res.) 3-23-09-05 422 426 0.95 The Gap (incl. Enoggera Res.) 3-23-09-06 370 374 1.08 The Gap (incl. Enoggera Res.) 3-23-09-07 310 315 1.61 The Gap (incl. Enoggera Res.) 3-23-09-08 457 456 -0.22 The Gap (incl. Enoggera Res.) 3-23-09-09 484 500 3.31 The Gap (incl. Enoggera Res.) 3-23-09-10 374 380 1.60 The Gap (incl. Enoggera Res.) 3-23-09-11 540 558 3.33 The Gap (incl. Enoggera Res.) 3-23-09-12 385 390 1.30 The Gap (incl. Enoggera Res.) 3-23-10-01 52 57 9.62 The Gap (incl. Enoggera Res.) 3-23-10-02 658 671 1.98 The Gap (incl. Enoggera Res.) 3-23-10-03 455 464 1.98 The Gap (incl. Enoggera Res.) 3-23-10-04 341 344 0.88 The Gap (incl. Enoggera Res.) 3-23-10-05 334 342 2.40 The Gap (incl. Enoggera Res.) 3-23-10-06 727 739 1.65 The Gap (incl. Enoggera Res.) 3-23-10-07 486 490 0.82 The Gap (incl. Enoggera Res.) 3-23-10-08 629 635 0.95

Queensland Redistribution Statistics 2006
Enrolment Projections
----------------------------------------------------------------------------------------------------------------------
195
Ryan
---------------------------------------------------------------------------------------------------------------------- SLA Name CCD Number Actual
Enrolment 2/12/2005
Estimate 30/11/2007
Growth (%)
---------------------------------------------------------------------------------------------------------------------- The Gap (incl. Enoggera Res.) 3-23-10-09 707 713 0.85 The Gap (incl. Enoggera Res.) 3-23-10-10 461 467 1.30 The Gap (incl. Enoggera Res.) 3-23-10-11 410 439 7.07 The Gap (incl. Enoggera Res.) 3-23-10-12 337 352 4.45 The Gap (incl. Enoggera Res.) 24 11018 11198 1.63 Toowong 3-23-13-01 316 329 4.11 Toowong 3-23-13-02 312 316 1.28 Toowong 3-23-13-03 136 138 1.47 Toowong 3-23-13-04 353 354 0.28 Toowong 3-23-13-05 266 270 1.50 Toowong 3-23-13-06 395 389 -1.52 Toowong 3-23-13-07 237 233 -1.69 Toowong 3-23-13-08 101 100 -0.99 Toowong 3-23-13-09 161 159 -1.24 Toowong 3-23-14-01 167 165 -1.20 Toowong 3-23-14-02 197 197 0.00 Toowong 3-23-14-03 177 181 2.26 Toowong 3-23-14-04 320 314 -1.88 Toowong 3-23-14-05 219 224 2.28 Toowong 3-23-14-06 254 252 -0.79 Toowong 3-23-14-07 247 248 0.40 Toowong 3-23-14-08 385 520 35.06 Toowong 3-23-14-09 503 709 40.95 Toowong 3-23-14-10 287 293 2.09 Toowong 3-23-15-01 262 271 3.44 Toowong 3-23-15-02 280 278 -0.71 Toowong 3-23-15-03 275 281 2.18 Toowong 3-23-15-04 380 382 0.53 Toowong 3-23-15-05 356 364 2.25 Toowong 3-23-15-06 405 407 0.49 Toowong 3-23-15-07 455 465 2.20 Toowong 3-23-15-08 434 437 0.69 Toowong 3-23-15-09 571 578 1.23 Toowong 3-23-15-10 288 290 0.69 Toowong 3-23-15-11 169 174 2.96 Toowong 3-23-15-12 137 150 9.49 Toowong 3-23-15-13 280 290 3.57 Toowong 3-23-15-14 337 364 8.01 Toowong 33 9662 10122 4.76 Upper Brookfield 3-23-12-01 441 466 5.67 Upper Brookfield 1 441 466 5.67

Queensland Redistribution Statistics 2006
Enrolment Projections
----------------------------------------------------------------------------------------------------------------------
196
Ryan
---------------------------------------------------------------------------------------------------------------------- SLA Name CCD Number Actual
Enrolment 2/12/2005
Estimate 30/11/2007
Growth (%)
---------------------------------------------------------------------------------------------------------------------- Westlake 3-26-01-01 474 484 2.11 Westlake 3-26-01-02 673 749 11.29 Westlake 3-26-01-03 472 482 2.12 Westlake 3-26-01-04 922 949 2.93 Westlake 3-26-01-05 260 265 1.92 Westlake 3-26-01-06 414 431 4.11 Westlake 6 3215 3360 4.51 Ryan 213 86774 90202 3.95

Queensland Redistribution Statistics 2006
Enrolment Projections
----------------------------------------------------------------------------------------------------------------------
197
Cooloola (S) (excl. Gympie) 3-10-13-12 480 494 2.92
Wide Bay
---------------------------------------------------------------------------------------------------------------------- SLA Name CCD Number Actual
Enrolment 2/12/2005
Estimate 30/11/2007
Growth (%)
---------------------------------------------------------------------------------------------------------------------- Biggenden (S) 3-07-23-01 71 72 1.41 Biggenden (S) 3-07-23-02 151 158 4.64 Biggenden (S) 3-07-23-03 196 201 2.55 Biggenden (S) 3-07-23-04 118 116 -1.69 Biggenden (S) 3-07-23-05 483 483 0.00 Biggenden (S) 3-07-23-06 100 105 5.00 Biggenden (S) 6 1119 1135 1.43 Cooloola (S) (excl. Gympie) 3-10-09-01 351 365 3.99 Cooloola (S) (excl. Gympie) 3-10-11-01 261 287 9.96 Cooloola (S) (excl. Gympie) 3-10-11-02 344 378 9.88 Cooloola (S) (excl. Gympie) 3-10-11-03 508 547 7.68 Cooloola (S) (excl. Gympie) 3-10-11-04 512 575 12.30 Cooloola (S) (excl. Gympie) 3-10-11-05 86 99 15.12 Cooloola (S) (excl. Gympie) 3-10-11-06 493 513 4.06 Cooloola (S) (excl. Gympie) 3-10-11-07 67 86 28.36 Cooloola (S) (excl. Gympie) 3-10-11-08 305 316 3.61 Cooloola (S) (excl. Gympie) 3-10-11-09 254 262 3.15 Cooloola (S) (excl. Gympie) 3-10-11-10 436 443 1.61 Cooloola (S) (excl. Gympie) 3-10-11-11 328 333 1.52 Cooloola (S) (excl. Gympie) 3-10-11-12 275 286 4.00 Cooloola (S) (excl. Gympie) 3-10-11-13 464 481 3.66 Cooloola (S) (excl. Gympie) 3-10-11-14 837 1015 21.27 Cooloola (S) (excl. Gympie) 3-10-11-15 394 410 4.06 Cooloola (S) (excl. Gympie) 3-10-11-16 318 327 2.83 Cooloola (S) (excl. Gympie) 3-10-11-17 426 500 17.37 Cooloola (S) (excl. Gympie) 3-10-11-18 2 2 0.00 Cooloola (S) (excl. Gympie) 3-10-12-01 403 422 4.71 Cooloola (S) (excl. Gympie) 3-10-12-02 132 139 5.30 Cooloola (S) (excl. Gympie) 3-10-12-03 589 611 3.74 Cooloola (S) (excl. Gympie) 3-10-12-04 460 481 4.57 Cooloola (S) (excl. Gympie) 3-10-12-05 336 360 7.14 Cooloola (S) (excl. Gympie) 3-10-13-01 349 364 4.30 Cooloola (S) (excl. Gympie) 3-10-13-02 464 477 2.80 Cooloola (S) (excl. Gympie) 3-10-13-03 436 459 5.28 Cooloola (S) (excl. Gympie) 3-10-13-04 551 574 4.17 Cooloola (S) (excl. Gympie) 3-10-13-05 337 354 5.04 Cooloola (S) (excl. Gympie) 3-10-13-06 344 353 2.62 Cooloola (S) (excl. Gympie) 3-10-13-07 475 494 4.00 Cooloola (S) (excl. Gympie) 3-10-13-08 278 294 5.76 Cooloola (S) (excl. Gympie) 3-10-13-09 142 144 1.41 Cooloola (S) (excl. Gympie) 3-10-13-10 223 233 4.48 Cooloola (S) (excl. Gympie) 3-10-13-11 298 313 5.03
Cooloola (S) (excl. Gympie) 3-10-13-13 148 155 4.73 Cooloola (S) (excl. Gympie) 37 13106 13946 6.41

Queensland Redistribution Statistics 2006
Enrolment Projections
----------------------------------------------------------------------------------------------------------------------
198
Cooloola (S) - Gympie only 3-10-10-11 268 274 2.24
Wide Bay
---------------------------------------------------------------------------------------------------------------------- SLA Name CCD Number Actual
Enrolment 2/12/2005
Estimate 30/11/2007
Growth (%)
---------------------------------------------------------------------------------------------------------------------- Cooloola (S) - Gympie only 3-10-09-02 336 344 2.38 Cooloola (S) - Gympie only 3-10-09-03 302 312 3.31 Cooloola (S) - Gympie only 3-10-09-04 275 280 1.82 Cooloola (S) - Gympie only 3-10-09-05 300 304 1.33 Cooloola (S) - Gympie only 3-10-09-06 344 349 1.45 Cooloola (S) - Gympie only 3-10-09-07 233 237 1.72 Cooloola (S) - Gympie only 3-10-09-08 367 369 0.54 Cooloola (S) - Gympie only 3-10-09-09 231 231 0.00 Cooloola (S) - Gympie only 3-10-09-10 404 413 2.23 Cooloola (S) - Gympie only 3-10-10-01 504 520 3.17 Cooloola (S) - Gympie only 3-10-10-02 508 525 3.35 Cooloola (S) - Gympie only 3-10-10-03 276 284 2.90 Cooloola (S) - Gympie only 3-10-10-04 405 406 0.25 Cooloola (S) - Gympie only 3-10-10-05 413 420 1.69 Cooloola (S) - Gympie only 3-10-10-06 269 264 -1.86 Cooloola (S) - Gympie only 3-10-10-07 700 723 3.29 Cooloola (S) - Gympie only 3-10-10-08 371 391 5.39 Cooloola (S) - Gympie only 3-10-10-09 466 474 1.72 Cooloola (S) - Gympie only 3-10-10-10 475 484 1.89
Cooloola (S) - Gympie only 3-10-12-06 310 311 0.32 Cooloola (S) - Gympie only 3-10-12-07 582 584 0.34 Cooloola (S) - Gympie only 3-10-12-08 388 394 1.55 Cooloola (S) - Gympie only 3-10-12-09 341 357 4.69 Cooloola (S) - Gympie only 3-10-12-10 552 579 4.89 Cooloola (S) - Gympie only 3-10-12-11 582 609 4.64 Cooloola (S) - Gympie only 3-10-12-12 351 362 3.13 Cooloola (S) - Gympie only 3-10-12-13 318 338 6.29 Cooloola (S) - Gympie only 3-10-12-14 111 113 1.80 Cooloola (S) - Gympie only 29 10982 11251 2.45 Hervey Bay (C) - Pt A 3-10-01-01 386 418 8.29 Hervey Bay (C) - Pt A 3-10-01-07 333 354 6.31 Hervey Bay (C) - Pt A 3-10-01-08 681 739 8.52 Hervey Bay (C) - Pt A 3-10-01-13 619 701 13.25 Hervey Bay (C) - Pt A 3-10-01-14 217 228 5.07 Hervey Bay (C) - Pt A 3-10-01-15 200 216 8.00 Hervey Bay (C) - Pt A 3-10-01-16 285 315 10.53 Hervey Bay (C) - Pt A 3-10-01-17 372 410 10.22 Hervey Bay (C) - Pt A 3-10-01-18 467 535 14.56 Hervey Bay (C) - Pt A 3-10-01-19 573 675 17.80 Hervey Bay (C) - Pt A 3-10-01-20 604 641 6.13 Hervey Bay (C) - Pt A 3-10-01-21 260 266 2.31 Hervey Bay (C) - Pt A 3-10-01-23 457 490 7.22 Hervey Bay (C) - Pt A 3-10-01-25 191 206 7.85 Hervey Bay (C) - Pt A 3-10-01-26 276 294 6.52

Queensland Redistribution Statistics 2006
Enrolment Projections
----------------------------------------------------------------------------------------------------------------------
199
SLA Name
Wide Bay
----------------------------------------------------------------------------------------------------------------------
CCD Number Actual Enrolment 2/12/2005
Estimate 30/11/2007
Growth (%)
---------------------------------------------------------------------------------------------------------------------- Hervey Bay (C) - Pt A 3-10-01-27 395 431 9.11 Hervey Bay (C) - Pt A 3-10-01-28 37 39 5.41 Hervey Bay (C) - Pt A 3-10-02-01 543 566 4.24 Hervey Bay (C) - Pt A 3-10-02-02 622 679 9.16 Hervey Bay (C) - Pt A 3-10-02-03 437 445 1.83 Hervey Bay (C) - Pt A 3-10-02-04 188 195 3.72 Hervey Bay (C) - Pt A 3-10-02-05 826 909 10.05 Hervey Bay (C) - Pt A 3-10-02-06 202 214 5.94 Hervey Bay (C) - Pt A 3-10-02-07 536 597 11.38 Hervey Bay (C) - Pt A 3-10-02-08 183 183 0.00 Hervey Bay (C) - Pt A 3-10-02-09 361 371 2.77 Hervey Bay (C) - Pt A 3-10-02-10 450 461 2.44 Hervey Bay (C) - Pt A 3-10-02-11 491 519 5.70 Hervey Bay (C) - Pt A 3-10-02-12 378 383 1.32 Hervey Bay (C) - Pt A 3-10-02-13 454 481 5.95 Hervey Bay (C) - Pt A 3-10-02-14 474 570 20.25 Hervey Bay (C) - Pt A 3-10-02-15 533 547 2.63 Hervey Bay (C) - Pt A 3-10-02-16 413 433 4.84 Hervey Bay (C) - Pt A 3-10-02-17 441 485 9.98 Hervey Bay (C) - Pt A 3-10-03-01 171 179 4.68 Hervey Bay (C) - Pt A 3-10-03-02 188 189 0.53 Hervey Bay (C) - Pt A 3-10-03-03 336 333 -0.89 Hervey Bay (C) - Pt A 3-10-03-04 197 202 2.54 Hervey Bay (C) - Pt A 3-10-03-05 297 312 5.05 Hervey Bay (C) - Pt A 3-10-03-06 112 116 3.57 Hervey Bay (C) - Pt A 3-10-03-07 286 296 3.50 Hervey Bay (C) - Pt A 3-10-03-08 310 323 4.19 Hervey Bay (C) - Pt A 3-10-03-09 488 512 4.92 Hervey Bay (C) - Pt A 3-10-03-10 621 631 1.61 Hervey Bay (C) - Pt A 3-10-03-11 704 736 4.55 Hervey Bay (C) - Pt A 3-10-03-12 313 320 2.24 Hervey Bay (C) - Pt A 3-10-20-01 440 464 5.45 Hervey Bay (C) - Pt A 3-10-20-02 390 395 1.28 Hervey Bay (C) - Pt A 3-10-20-03 617 635 2.92 Hervey Bay (C) - Pt A 3-10-20-04 479 492 2.71 Hervey Bay (C) - Pt A 3-10-20-05 263 284 7.98 Hervey Bay (C) - Pt A 3-10-20-06 464 493 6.25 Hervey Bay (C) - Pt A 3-10-20-07 258 297 15.12 Hervey Bay (C) - Pt A 3-10-20-08 215 221 2.79 Hervey Bay (C) - Pt A 3-10-20-09 476 495 3.99 Hervey Bay (C) - Pt A 3-10-20-10 323 340 5.26 Hervey Bay (C) - Pt A 3-10-20-11 468 483 3.21 Hervey Bay (C) - Pt A 3-10-20-12 133 186 39.85 Hervey Bay (C) - Pt A 3-10-20-13 473 504 6.55 Hervey Bay (C) - Pt A 3-10-20-14 299 304 1.67 Hervey Bay (C) - Pt A 3-10-20-15 309 316 2.27 Hervey Bay (C) - Pt A 3-10-20-16 327 408 24.77

Queensland Redistribution Statistics 2006
Enrolment Projections
----------------------------------------------------------------------------------------------------------------------
200
SLA Name
----------------------------------------------------------------------------------------------------
Wide Bay
----------------------------------------------------------------------------------------------------------------------
CCD Number Actual Enrolment 2/12/2005
Estimate 30/11/2007
Growth (%)
------------------ Hervey Bay (C) - Pt A 3-10-20-17 478 557 16.53 Hervey Bay (C) - Pt A 3-10-21-01 672 717 6.70 Hervey Bay (C) - Pt A 3-10-21-02 766 847 10.57 Hervey Bay (C) - Pt A 3-10-21-03 833 890 6.84 Hervey Bay (C) - Pt A 3-10-21-04 586 593 1.19 Hervey Bay (C) - Pt A 3-10-21-05 280 346 23.57 Hervey Bay (C) - Pt A 3-10-21-06 50 54 8.00 Hervey Bay (C) - Pt A 3-10-21-07 324 323 -0.31 Hervey Bay (C) - Pt A 3-10-21-08 122 124 1.64 Hervey Bay (C) - Pt A 3-10-21-09 398 476 19.60 Hervey Bay (C) - Pt A 3-10-21-10 337 350 3.86 Hervey Bay (C) - Pt A 3-10-21-11 301 298 -1.00 Hervey Bay (C) - Pt A 3-10-21-12 1423 1787 25.58 Hervey Bay (C) - Pt A 3-10-21-13 601 623 3.66 Hervey Bay (C) - Pt A 3-10-21-14 579 606 4.66 Hervey Bay (C) - Pt A 3-10-21-15 511 551 7.83 Hervey Bay (C) - Pt A 3-10-21-16 212 217 2.36 Hervey Bay (C) - Pt A 79 32315 34821 7.75 Hervey Bay (C) - Pt B 3-10-01-02 258 273 5.81 Hervey Bay (C) - Pt B 3-10-01-03 205 216 5.37 Hervey Bay (C) - Pt B 3-10-01-04 526 553 5.13 Hervey Bay (C) - Pt B 3-10-01-05 247 253 2.43 Hervey Bay (C) - Pt B 3-10-01-06 270 283 4.81 Hervey Bay (C) - Pt B 3-10-01-09 0 0 0.00 Hervey Bay (C) - Pt B 3-10-01-10 237 250 5.49 Hervey Bay (C) - Pt B 3-10-01-11 55 56 1.82 Hervey Bay (C) - Pt B 3-10-01-12 176 184 4.55 Hervey Bay (C) - Pt B 3-10-01-22 295 307 4.07 Hervey Bay (C) - Pt B 3-10-01-24 326 355 8.90 Hervey Bay (C) - Pt B 11 2595 2730 5.20 Kilkivan (S) 3-10-14-01 85 86 1.18 Kilkivan (S) 3-10-14-02 95 97 2.11 Kilkivan (S) 3-10-14-03 159 164 3.14 Kilkivan (S) 3-10-14-04 514 528 2.72 Kilkivan (S) 3-10-14-05 113 117 3.54 Kilkivan (S) 3-10-14-06 242 247 2.07 Kilkivan (S) 3-10-14-07 413 424 2.66 Kilkivan (S) 3-10-14-08 162 169 4.32 Kilkivan (S) 3-10-14-09 188 186 -1.06 Kilkivan (S) 3-10-14-10 329 338 2.74 Kilkivan (S) 3-10-14-11 97 100 3.09 Kilkivan (S) 3-10-14-12 28 27 -3.57 Kilkivan (S) 12 2425 2483 2.39

Queensland Redistribution Statistics 2006
Enrolment Projections
----------------------------------------------------------------------------------------------------------------------
201
Maryborough (C) 3-10-05-09 577 588 1.91
Maryborough (C) 3-10-05-18 385 384 -0.26
Maryborough (C) 3-10-06-02 357 362 1.40
Wide Bay
---------------------------------------------------------------------------------------------------------------------- SLA Name CCD Number Actual
Enrolment 2/12/2005
Estimate 30/11/2007
Growth (%)
---------------------------------------------------------------------------------------------------------------------- Maryborough (C) 3-10-04-01 333 339 1.80 Maryborough (C) 3-10-04-02 158 166 5.06 Maryborough (C) 3-10-04-03 400 406 1.50 Maryborough (C) 3-10-04-04 98 102 4.08 Maryborough (C) 3-10-04-05 361 370 2.49 Maryborough (C) 3-10-04-06 463 474 2.38 Maryborough (C) 3-10-04-07 351 360 2.56 Maryborough (C) 3-10-04-08 261 272 4.21 Maryborough (C) 3-10-04-09 497 500 0.60 Maryborough (C) 3-10-04-10 19 17 -10.53 Maryborough (C) 3-10-04-11 466 470 0.86 Maryborough (C) 3-10-04-12 306 319 4.25 Maryborough (C) 3-10-04-13 367 382 4.09 Maryborough (C) 3-10-04-14 712 731 2.67 Maryborough (C) 3-10-04-15 24 26 8.33 Maryborough (C) 3-10-05-01 720 738 2.50 Maryborough (C) 3-10-05-02 579 580 0.17 Maryborough (C) 3-10-05-03 215 214 -0.47 Maryborough (C) 3-10-05-04 192 195 1.56 Maryborough (C) 3-10-05-05 564 571 1.24 Maryborough (C) 3-10-05-06 539 535 -0.74 Maryborough (C) 3-10-05-07 535 543 1.50 Maryborough (C) 3-10-05-08 543 552 1.66
Maryborough (C) 3-10-05-10 379 383 1.06 Maryborough (C) 3-10-05-11 489 504 3.07 Maryborough (C) 3-10-05-12 220 220 0.00 Maryborough (C) 3-10-05-13 332 342 3.01 Maryborough (C) 3-10-05-14 528 537 1.70 Maryborough (C) 3-10-05-15 290 302 4.14 Maryborough (C) 3-10-05-16 157 160 1.91 Maryborough (C) 3-10-05-17 478 497 3.97
Maryborough (C) 3-10-06-01 366 374 2.19
Maryborough (C) 3-10-06-03 257 253 -1.56 Maryborough (C) 3-10-06-04 73 73 0.00 Maryborough (C) 3-10-06-05 335 338 0.90 Maryborough (C) 3-10-06-06 256 257 0.39 Maryborough (C) 3-10-06-07 349 358 2.58 Maryborough (C) 3-10-06-08 150 153 2.00 Maryborough (C) 3-10-06-09 338 338 0.00 Maryborough (C) 3-10-06-10 481 488 1.46 Maryborough (C) 3-10-06-11 343 347 1.17 Maryborough (C) 3-10-06-12 441 456 3.40 Maryborough (C) 3-10-06-13 485 500 3.09 Maryborough (C) 3-10-06-14 243 245 0.82
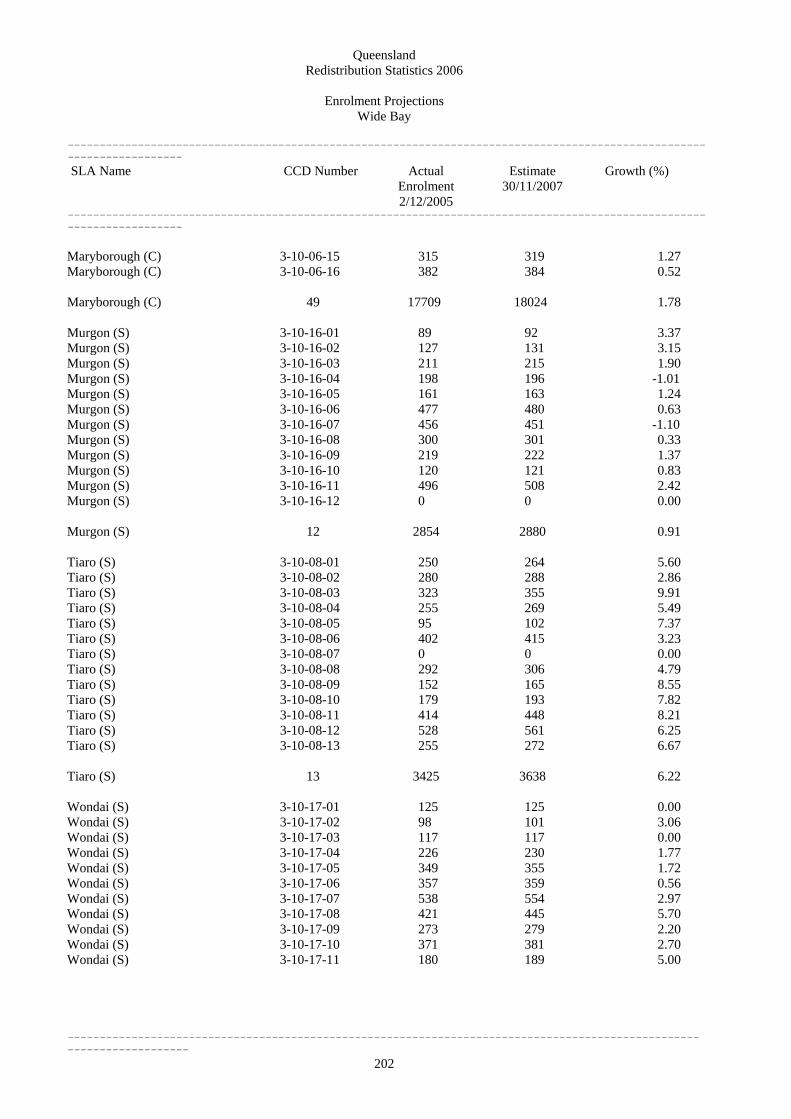
Queensland Redistribution Statistics 2006
Enrolment Projections
----------------------------------------------------------------------------------------------------------------------
202
Wide Bay
---------------------------------------------------------------------------------------------------------------------- SLA Name CCD Number Actual
Enrolment 2/12/2005
Estimate 30/11/2007
Growth (%)
---------------------------------------------------------------------------------------------------------------------- Maryborough (C) 3-10-06-15 315 319 1.27 Maryborough (C) 3-10-06-16 382 384 0.52 Maryborough (C) 49 17709 18024 1.78 Murgon (S) 3-10-16-01 89 92 3.37 Murgon (S) 3-10-16-02 127 131 3.15 Murgon (S) 3-10-16-03 211 215 1.90 Murgon (S) 3-10-16-04 198 196 -1.01 Murgon (S) 3-10-16-05 161 163 1.24 Murgon (S) 3-10-16-06 477 480 0.63 Murgon (S) 3-10-16-07 456 451 -1.10 Murgon (S) 3-10-16-08 300 301 0.33 Murgon (S) 3-10-16-09 219 222 1.37 Murgon (S) 3-10-16-10 120 121 0.83 Murgon (S) 3-10-16-11 496 508 2.42 Murgon (S) 3-10-16-12 0 0 0.00 Murgon (S) 12 2854 2880 0.91 Tiaro (S) 3-10-08-01 250 264 5.60 Tiaro (S) 3-10-08-02 280 288 2.86 Tiaro (S) 3-10-08-03 323 355 9.91 Tiaro (S) 3-10-08-04 255 269 5.49 Tiaro (S) 3-10-08-05 95 102 7.37 Tiaro (S) 3-10-08-06 402 415 3.23 Tiaro (S) 3-10-08-07 0 0 0.00 Tiaro (S) 3-10-08-08 292 306 4.79 Tiaro (S) 3-10-08-09 152 165 8.55 Tiaro (S) 3-10-08-10 179 193 7.82 Tiaro (S) 3-10-08-11 414 448 8.21 Tiaro (S) 3-10-08-12 528 561 6.25 Tiaro (S) 3-10-08-13 255 272 6.67 Tiaro (S) 13 3425 3638 6.22 Wondai (S) 3-10-17-01 125 125 0.00 Wondai (S) 3-10-17-02 98 101 3.06 Wondai (S) 3-10-17-03 117 117 0.00 Wondai (S) 3-10-17-04 226 230 1.77 Wondai (S) 3-10-17-05 349 355 1.72 Wondai (S) 3-10-17-06 357 359 0.56 Wondai (S) 3-10-17-07 538 554 2.97 Wondai (S) 3-10-17-08 421 445 5.70 Wondai (S) 3-10-17-09 273 279 2.20 Wondai (S) 3-10-17-10 371 381 2.70 Wondai (S) 3-10-17-11 180 189 5.00

Queensland Redistribution Statistics 2006
Enrolment Projections
----------------------------------------------------------------------------------------------------------------------
203
Wide Bay
---------------------------------------------------------------------------------------------------------------------- SLA Name CCD Number Actual
Enrolment 2/12/2005
Estimate 30/11/2007
Growth (%)
---------------------------------------------------------------------------------------------------------------------- Wondai (S) 11 3055 3135 2.62 Woocoo (S) 3-10-07-01 91 95 4.40 Woocoo (S) 3-10-07-02 134 132 -1.49 Woocoo (S) 3-10-07-03 109 110 0.92 Woocoo (S) 3-10-07-04 555 573 3.24 Woocoo (S) 3-10-07-05 543 559 2.95 Woocoo (S) 3-10-07-06 548 572 4.38 Woocoo (S) 3-10-07-07 335 360 7.46 Woocoo (S) 7 2315 2401 3.71 Wide Bay 266 91900 96444 4.94
Queensland 7207 2471372 2598034 5.13

204