QAPI TOOLKITabaqis.s3.amazonaws.com/ProvidigmQAPIToolkit.pdfRoot Cause Analysis Tools Fishbone...
48
Sponsored by QAPI TOOLKIT
Transcript of QAPI TOOLKITabaqis.s3.amazonaws.com/ProvidigmQAPIToolkit.pdfRoot Cause Analysis Tools Fishbone...
Sponsored by
QAPI TOOLKIT

2 | PROVIDIGM QAPI TOOLKIT

Employee AcknowledgementThis QAPI Toolkit belongs to:
DATE:


PROVIDIGM QAPI TOOLKIT | 5
Quality Assurance and Performance Improvement (QAPI) is an effective way to improve the work and care practices of staff in nursing homes. QAPI should be a continuous process and a part of everyone’s daily work.
QAPI principles, methods and tools are not new. QAPI principles were developed over the past few decades by Dr. W. Edwards Deming and Dr. Joseph Juran, among others. Successful QAPI requires leadership from senior management and clinicians, a supportive culture, and people trained in group processes and change management. All this needs to be aligned with the organization’s strategic objectives and with the quality management systems in place.
In October of 2016, CMS released the Final Rule of Reform of Requirements for Long Term Care Facilities. Among other regulatory changes, this final rule included a new regulation requiring all long term care facilities to develop, implement, and maintain an effective, comprehensive, data-driven QAPI program that focuses on systems of care, outcomes of care, and quality of life.
Providigm developed this QAPI Toolkit to provide staff in long term care facilities a convenient and quick reference guide. Teaching staff how to do quality improvement is no easy task. When staff members participate in the QAPI Committee and/or are assigned to a Performance Improvement Project (PIP) team, they need to learn different skills for generating ideas, prioritizing problems, making decisions and working with data and numbers.
Our aim at Providigm is to take the mystery out of QAPI and provide staff with an understandable and operational approach to quality assessment and quality improvement. We hope this QAPI Toolkit helps your quality journey run more smoothly.
6 | PROVIDIGM QAPI TOOLKIT
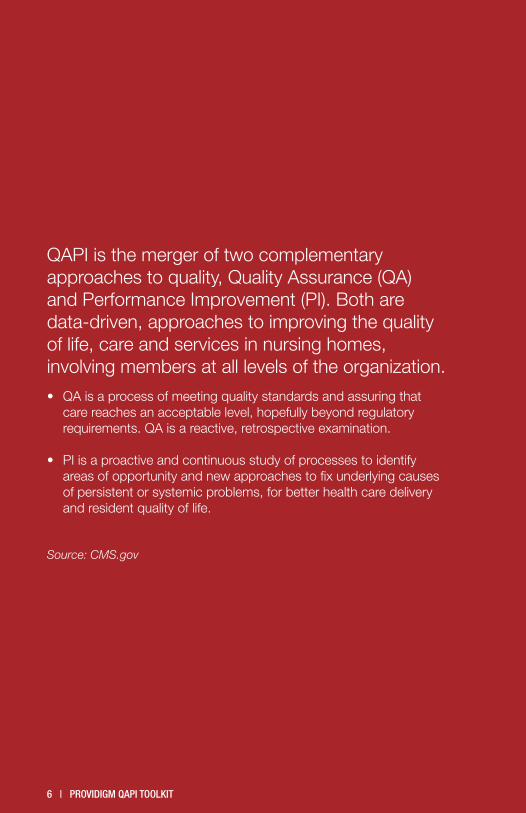
QAPI is the merger of two complementary approaches to quality, Quality Assurance (QA) and Performance Improvement (PI). Both are data-driven, approaches to improving the quality of life, care and services in nursing homes, involving members at all levels of the organization.
• QA is a process of meeting quality standards and assuring that care reaches an acceptable level, hopefully beyond regulatory requirements. QA is a reactive, retrospective examination.
• PI is a proactive and continuous study of processes to identify areas of opportunity and new approaches to fix underlying causes of persistent or systemic problems, for better health care delivery and resident quality of life.
Source: CMS.gov
PROVIDIGM QAPI TOOLKIT | 7
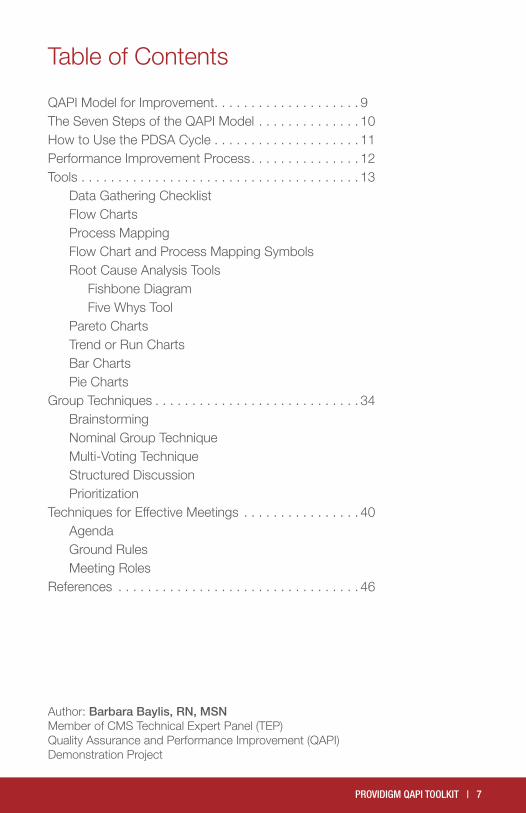
QAPI Model for Improvement. . . . . . . . . . . . . . . . . . . . 9The Seven Steps of the QAPI Model . . . . . . . . . . . . . . 10How to Use the PDSA Cycle . . . . . . . . . . . . . . . . . . . . 11Performance Improvement Process. . . . . . . . . . . . . . . 12Tools . . . . . . . . . . . . . . . . . . . . . . . . . . . . . . . . . . . . . . 13 Data Gathering Checklist Flow Charts Process Mapping Flow Chart and Process Mapping Symbols Root Cause Analysis Tools Fishbone Diagram Five Whys Tool Pareto Charts Trend or Run Charts Bar Charts Pie ChartsGroup Techniques . . . . . . . . . . . . . . . . . . . . . . . . . . . . 34 Brainstorming Nominal Group Technique Multi-Voting Technique Structured Discussion PrioritizationTechniques for Effective Meetings . . . . . . . . . . . . . . . . 40 Agenda Ground Rules Meeting RolesReferences . . . . . . . . . . . . . . . . . . . . . . . . . . . . . . . . . 46
Table of Contents
Author: Barbara Baylis, RN, MSN Member of CMS Technical Expert Panel (TEP) Quality Assurance and Performance Improvement (QAPI) Demonstration Project

8 | PROVIDIGM QAPI TOOLKIT
Quality is not an act, it is a habit.
-Aristotle

PROVIDIGM QAPI TOOLKIT | 9
QAPI Model for Improvement
AIM
MEASURE
CHANGE
RAPID CYCLE IMPROVEMENT
What are we trying to accomplish?
How will we know if a change is an improvement?
First, you need to select a model for improvement. There are many models available. The Langley, Nolan & Nolan Model for Improvement is a simple yet powerful tool for accelerating positive change. It is the model we suggest and describe in this guide. This model has been used very successfully by hundreds of health care organizations in many countries to improve many different health care processes and outcomes.
The Model for Improvement includes:
What changes can we make that will result in improvement?
ACT
PLAN
STUDY
DO

10 | PROVIDIGM QAPI TOOLKIT
The Seven Steps of the QAPI Model for Improvement1. Forming the Team. Including the right people on a process
improvement team is critical to a successful improvement effort. Teams vary in size and composition. Each organization builds teams to suit its own needs.
2. Setting Aims. Improvement requires setting aims. The aim should be time-specific and measurable; it should also define the specific population of residents or other system that will be affected.
3. Establishing Measures. Teams use quantitative measures to determine if a specific change actually leads to an improvement.
4. Selecting Changes. Ideas for change may come from the insights of those who work in the system, from change concepts, or other creative thinking techniques, or by borrowing them from the experience of others who have successfully improved.
5. Testing Changes. The Plan-Do-Study-Act (PDSA) cycle is shorthand for testing a change in the real work setting by planning it, trying it, observing the results, and acting on what is learned. This is the scientific method adapted for action oriented learning.
6. Implementing Changes. After testing a change on a small scale, learning from each test, and refining the change through several PDSA cycles, the team may implement the change on a broader scale, for example, for an entire pilot population or unit.
7. Spreading Changes. After successful implementation of a change, or a package of changes for a pilot population or an entire unit, the team can spread the changes to other parts of the organization.

PROVIDIGM QAPI TOOLKIT | 11
How to Use the PDSA Cycle
Use ‘plan-do- study- act’ cycles to conduct small–scale tests of change
Plan a change • Identify an issue and define the problem • Collect baseline data for the identified process change
Do it in a small test
• Pilot process the change • Document procedures and observations • Collect the data produced by the change (on- going)
Study its effects
• Assess the collected data • Compare results and monitor trends • Fine tune changes
Act on what was learned
• Make permanent changes based on pilot by educating staff in organizational process change and new technology.
• The PIP team uses and links small PDSA cycles for broader implementation.
12 | PROVIDIGM QAPI TOOLKIT
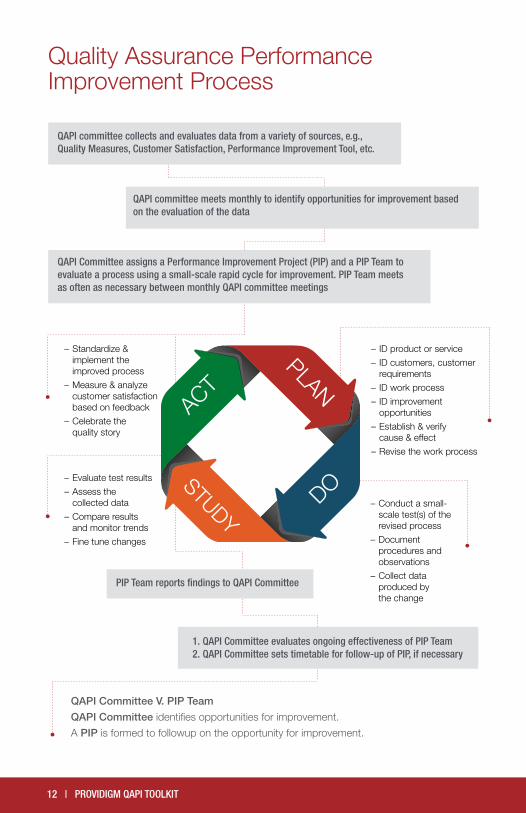
QAPI committee collects and evaluates data from a variety of sources, e.g., Quality Measures, Customer Satisfaction, Performance Improvement Tool, etc.
QAPI committee meets monthly to identify opportunities for improvement based on the evaluation of the data
QAPI Committee assigns a Performance Improvement Project (PIP) and a PIP Team to evaluate a process using a small-scale rapid cycle for improvement. PIP Team meets as often as necessary between monthly QAPI committee meetings
– ID product or service
– ID customers, customer requirements
– ID work process
– ID improvement opportunities
– Establish & verify cause & effect
– Revise the work process
– Conduct a small- scale test(s) of the revised process
– Document procedures and observations
– Collect data produced by the change
– Evaluate test results
– Assess the collected data
– Compare results and monitor trends
– Fine tune changes
– Standardize & implement the improved process
– Measure & analyze customer satisfaction based on feedback
– Celebrate the quality story
QAPI Committee V. PIP Team
QAPI Committee identifies opportunities for improvement.
A PIP is formed to followup on the opportunity for improvement.
ACT
PLAN
STUDY
DO
PIP Team reports findings to QAPI Committee
1. QAPI Committee evaluates ongoing effectiveness of PIP Team2. QAPI Committee sets timetable for follow-up of PIP, if necessary
Quality Assurance Performance Improvement Process

PROVIDIGM QAPI TOOLKIT | 13
Quality Assurance Performance Improvement Process
Tools That Help You Understand Data And Analyze Your Process
Tool When to Use
Data Gathering Checklist To collect data on your quality issue and identify the most important source of the problem
Flow Charting/Process Mapping To understand all the different steps that takes place in your process. A fundamental tool for any QAPI project
Root Cause Analysis – Fishbone/Ishikawa/Cause & Effect Diagrams
To brainstorm about the main causes of a quality problem and the sub-cause leading to each main cause
5 Whys To drill down deeper to get to the root cause of a problem
Pareto Chart
To see which causes or problems occur most frequently. To observe the Pareto Effect when 20% of the causes contribute to 80% of the overall problem
Trend or Run Charts To give a visual representation of data over a period of time
Bar Chart To show comparisons among categories with a chart that uses either horizontal or vertical bars
Pie chart
To analyze polls, statistics, and managing money and data, pie charts are an easy way to visualize percentage breakdowns of a total
14 | PROVIDIGM QAPI TOOLKIT
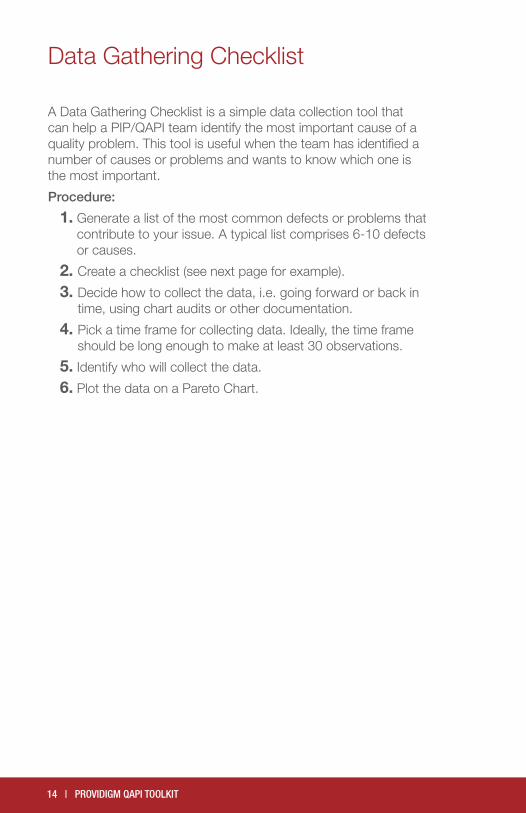
A Data Gathering Checklist is a simple data collection tool that can help a PIP/QAPI team identify the most important cause of a quality problem. This tool is useful when the team has identified a number of causes or problems and wants to know which one is the most important.
Procedure:
1. Generate a list of the most common defects or problems that contribute to your issue. A typical list comprises 6-10 defects or causes.
2. Create a checklist (see next page for example).
3. Decide how to collect the data, i.e. going forward or back in time, using chart audits or other documentation.
4. Pick a time frame for collecting data. Ideally, the time frame should be long enough to make at least 30 observations.
5. Identify who will collect the data.
6. Plot the data on a Pareto Chart.
Data Gathering Checklist
PROVIDIGM QAPI TOOLKIT | 15
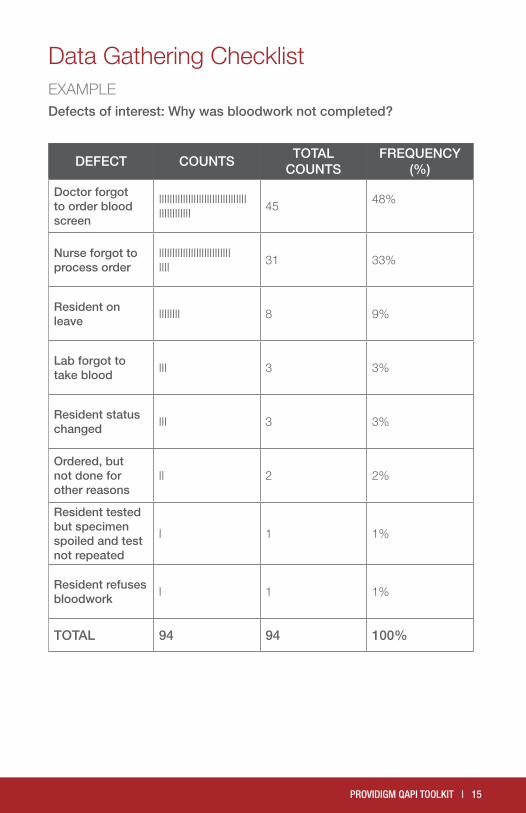
Defects of interest: Why was bloodwork not completed?
DEFECT COUNTSTOTAL
COUNTSFREQUENCY
(%)
Doctor forgot to order blood screen
IIIIIIIIIIIIIIIIIIIIIIIIIIIIIIIIIIIIIIIIIIIII
4548%
Nurse forgot toprocess order
IIIIIIIIIIIIIIIIIIIIIIIIIIIIIII
31 33%
Resident on leave
IIIIIIII 8 9%
Lab forgot to take blood
III 3 3%
Resident statuschanged
III 3 3%
Ordered, but not done for other reasons
II 2 2%
Resident tested but specimen spoiled and test not repeated
I 1 1%
Resident refusesbloodwork
I 1 1%
TOTAL 94 94 100%
Data Gathering ChecklistEXAMPLE

16 | PROVIDIGM QAPI TOOLKIT
A flowchart is a pictorial representation describing a process being studied. Flow charts give team members a common reference point when analyzing a work process and planning for process improvement.
Procedure:
1. Decide on the process to flowchart.
2. Define the beginning and ending steps of the process.
3. Use ovals to indicate the beginning and ending boundaries of a process.
4. Write the beginning step in an oval.
5. Use rectangles to indicate each successive action step in the process.
6. When a step in the process requires decision, write a yes/no question in a diamond and develop paths for either answer.
7. Write the ending step in an oval.
Flowcharts

PROVIDIGM QAPI TOOLKIT | 17
FlowchartsEXAMPLE
Pressure Ulcer Identification
Initial Assessment
Education and Development of Treatment Plan
Nutritional Assessment and Support Wound Care Management
Ulcer Care: Managing Bacterial Colonization
Monitor
YesIs the Ulcer Healing?
No
Reassessment of Treatment Plan and Evaluation Adherence
Return to the Beginning
18 | PROVIDIGM QAPI TOOLKIT
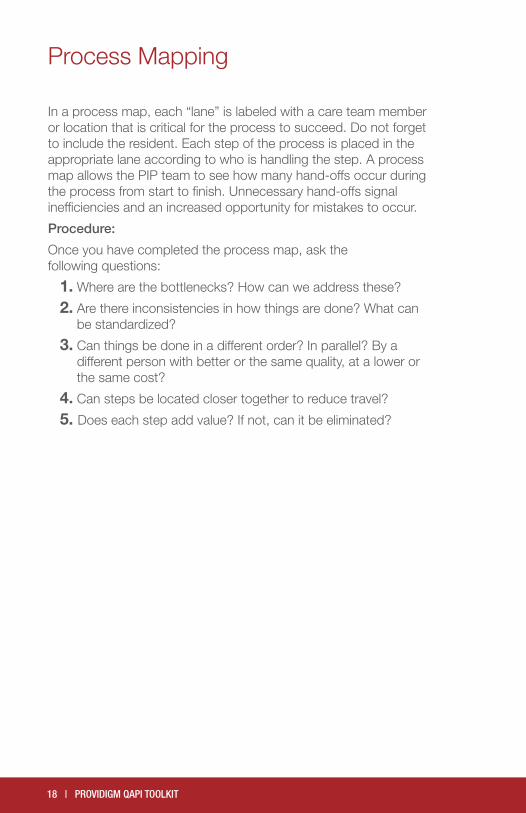
Process Mapping
In a process map, each “lane” is labeled with a care team member or location that is critical for the process to succeed. Do not forget to include the resident. Each step of the process is placed in the appropriate lane according to who is handling the step. A process map allows the PIP team to see how many hand-offs occur during the process from start to finish. Unnecessary hand-offs signal inefficiencies and an increased opportunity for mistakes to occur.
Procedure:
Once you have completed the process map, ask the following questions:
1. Where are the bottlenecks? How can we address these?
2. Are there inconsistencies in how things are done? What can be standardized?
3. Can things be done in a different order? In parallel? By a different person with better or the same quality, at a lower or the same cost?
4. Can steps be located closer together to reduce travel?
5. Does each step add value? If not, can it be eliminated?

PROVIDIGM QAPI TOOLKIT | 19
The example below shows the process of a resident receiving a new medication. A minimum of three hand-offs of the medication order occur during the process; from the physician to the nurse, from the nurse to the pharmacist, then to the resident. If there is a question, then the hand-offs continue back through the nurse and physician.
Process MappingEXAMPLE
Orders Medication
Process Order
Reviews and Questions Order
Necessary to Re-Order?
Receives Medication
Prescribes New Order
Calls Doctor to Inform of Discrepancy
Calls Nurse to Inform of Discrepancy
Do
cto
rN
urse
Pha
rmac
ist
Res
iden
t
Yes
No

20 | PROVIDIGM QAPI TOOLKIT
Process Rectangle
Decision Point Diamond
Start or Stop Point Oval
Input or Output Data Parallelogram
Documentation Document
Delay Bullet
Database Cylinder
Unclear Step Cloud
Connector Circle
Flow chart and process MAPPING SYMBOLS
PROVIDIGM QAPI TOOLKIT | 21
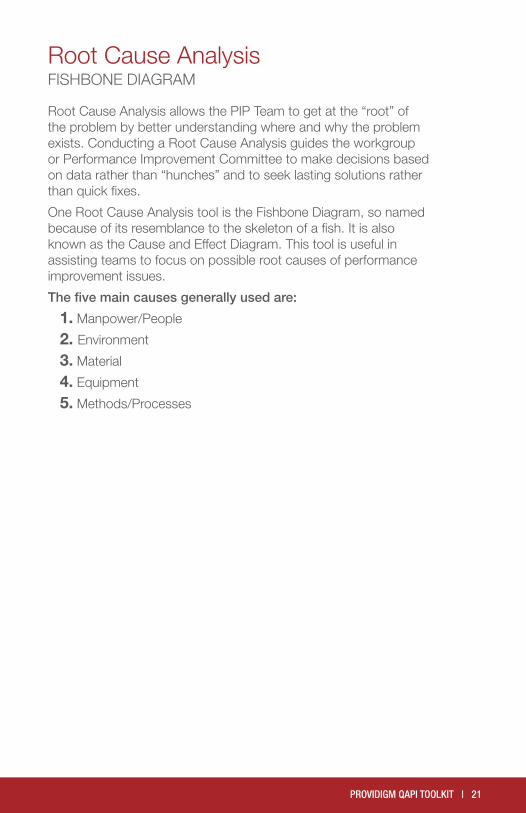
Root Cause Analysis allows the PIP Team to get at the “root” of the problem by better understanding where and why the problem exists. Conducting a Root Cause Analysis guides the workgroup or Performance Improvement Committee to make decisions based on data rather than “hunches” and to seek lasting solutions rather than quick fixes.
One Root Cause Analysis tool is the Fishbone Diagram, so named because of its resemblance to the skeleton of a fish. It is also known as the Cause and Effect Diagram. This tool is useful in assisting teams to focus on possible root causes of performance improvement issues.
The five main causes generally used are:
1. Manpower/People
2. Environment
3. Material
4. Equipment
5. Methods/Processes
Root Cause Analysis FISHBONE DIAGRAM

22 | PROVIDIGM QAPI TOOLKIT
Before creating the Fishbone Diagram, the desired outcome needs to be decided. Beginning with the desired outcome, work backward to identify the main factors that could affect that outcome and show them as the prominent branches or “bones” of the diagram’s structure.
Once the team has established the desired outcome, the next step of the analysis is to consider all of the factors that support or impede the outcome. Begin the Root Cause Analysis with “brainstorming”. The workgroup talks about all of the factors of the problem.
Identify where and why a system or process problem exists. Afterwards, the PIP team takes the information that they have discussed and begins to work on constructing a Fishbone Diagram. Based on the analysis process, the PIP team launches new interventions designed to address the problem.
Procedure:
1. Identify the problem the group will work on. Write the problem in a box on the right side of a flip chart.
2. Draw the “fish” outline, a long horizontal line (backbone) coming from the box and a series of diagonal lines (rib bones) coming off of the backbone.
3. Identify the main branches with the categories of causes.
4. Brainstorm for specific causes, which contribute to the main branches.
5. Clarify as needed. Develop the causes by asking “why” until a useful level of detail is reached.
6. Under each main branch list all of the relevant factors associated with the branch that will influence the desired outcome.
Root Cause Analysis FISHBONE DIAGRAM

PROVIDIGM QAPI TOOLKIT | 23
Root Cause Analysis FISHBONE DIAGRAM EXAMPLE
Resident/ Patient Meals
are Late or Cold
Lack of Staff
New Staff
Manpower
Agency Staff
Lack of Meal Carts
Materials
Orientation of Nutrition
Services Staff
Methods
Broken Steam Table Element
Equipment
24 | PROVIDIGM QAPI TOOLKIT
Root Cause Analysis: The Five Whys
Another method of completing a root cause analysis is by making a table that asks a series of questions. The analysis repeatedly digs deeper by asking “Why?” then, when answered, “Why?” again, and so on until the cause of the issue is determined.
Procedure:
1. Write down the specific problem. Writing the issue helps you formalize the problem and describe it completely. It also helps a team focus on the same problem.
2. Ask ‘Why’ the problem happens and write the answer down below the problem.
3. If the answer you just provided doesn’t identify the root cause of the problem that you wrote down in Step 1, ask ‘Why’ again and write that answer down.
4. Loop back to step 3 until the team is in agreement that the problem’s root cause is identified.
PROVIDIGM QAPI TOOLKIT | 25
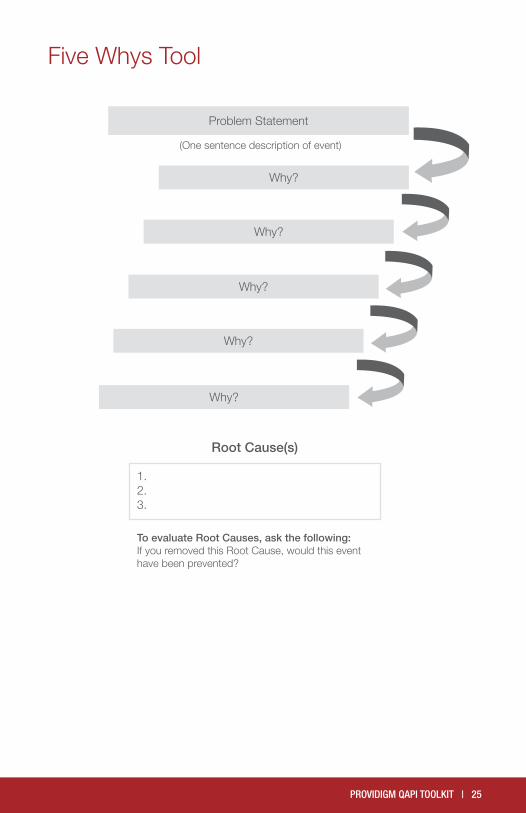
Five Whys Tool
Problem Statement
Why?
(One sentence description of event)
Why?
Why?
Why?
Why?
1.2.3.
Root Cause(s)
To evaluate Root Causes, ask the following:If you removed this Root Cause, would this event have been prevented?

26 | PROVIDIGM QAPI TOOLKIT
The Pareto Chart is a tool that helps teams see which causes or problems occur most frequently. The chart plots out the activities or areas that contribute most to poor quality. The Pareto Chart is based on the theory that a small number of causes will have the largest contribution to poor quality. When a few activities contribute to most of the problem, it is called the Pareto Effect. A classic Pareto Effect is observed when 20% of the causes contribute to 80% of the overall problem.
Procedure:
1. Place the data captured in the Check Sheet into a table, in descending order. From this table, calculate the percentage frequency and the cumulative frequency.
2. Plot this information as a bar chart, where each vertical bar represents a different cause or problem and the left vertical axis represents the number of causes and problems.
3. Identify the bar where the cumulative frequency is high relative to the number of categories.
4. Look for a Pareto Effect, where the first few categories account for most of the problems.
Pareto Charts

PROVIDIGM QAPI TOOLKIT | 27
05
10
1520
25
30
35
40
45
50
Fre
que
ncy
Co
unt
A B C D E F G
Defect Type (Reason Blood Work Was Not Completed)
Pareto ChartEXAMPLE
Pareto Charts
Pareto Chart: Reasons Why Blood Work Was Not Completed
28 | PROVIDIGM QAPI TOOLKIT
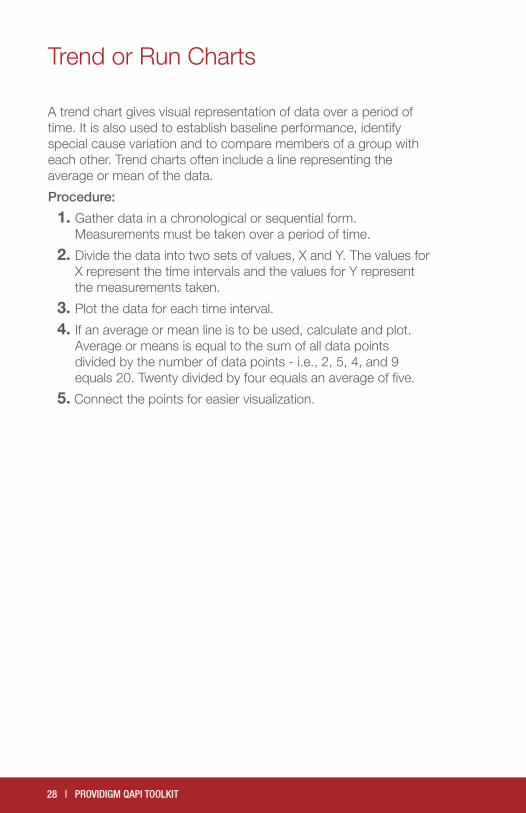
A trend chart gives visual representation of data over a period of time. It is also used to establish baseline performance, identify special cause variation and to compare members of a group with each other. Trend charts often include a line representing the average or mean of the data.
Procedure:
1. Gather data in a chronological or sequential form. Measurements must be taken over a period of time.
2. Divide the data into two sets of values, X and Y. The values for X represent the time intervals and the values for Y represent the measurements taken.
3. Plot the data for each time interval.
4. If an average or mean line is to be used, calculate and plot. Average or means is equal to the sum of all data points divided by the number of data points - i.e., 2, 5, 4, and 9 equals 20. Twenty divided by four equals an average of five.
5. Connect the points for easier visualization.
Trend or Run Charts
PROVIDIGM QAPI TOOLKIT | 29
0
10
20
30
40
50
Day
s
1
Month
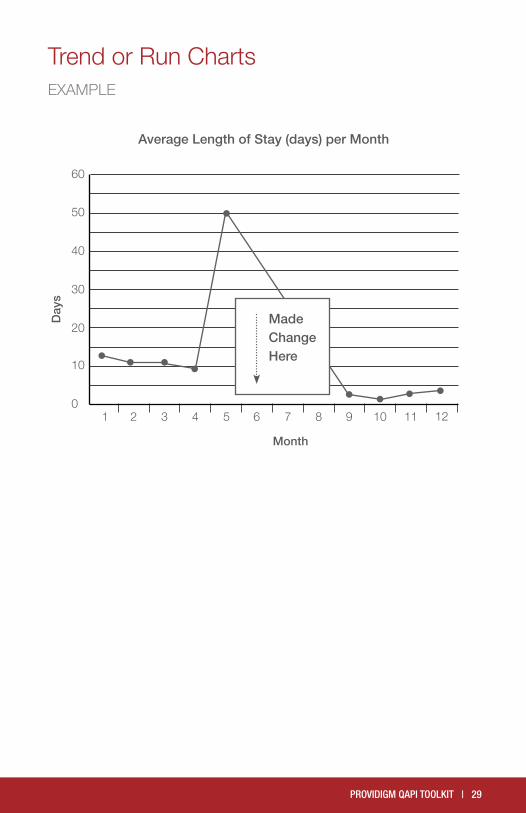
Average Length of Stay (days) per Month
60
2 3 4 5 6 7 8 9 10 11 12
Made Change Here
Trend or Run ChartsEXAMPLE
30 | PROVIDIGM QAPI TOOLKIT
Purpose:A bar graph is a chart that uses either horizontal or vertical bars to show comparisons among categories. One axis of the chart shows the specific categories being compared, and the other axis represents a discrete value. Some bar graphs present bars clustered in groups of more than one (grouped bar graphs), and others show the bars divided into subparts to show cumulate effect (stacked bar graphs).
Procedure:
1. Determine the discrete range. Examine your data to find the bar with the largest value. This will help you determine the range of the vertical axis and the size of each increment. Then label the vertical axis.
2. Determine the number of bars. Examine your data to find how many bars your chart will contain. These may be single, grouped, or stacked bars. Use this number to draw and label the horizontal axis.
3. Determine the order of the bars. Bars may be arranged in any order. (A bar chart arranged from highest to lowest incidence is called a Pareto Chart.) Normally, bars showing frequency will be arranged in chronological (time) sequence. Draw the bars.
Bar Chart

PROVIDIGM QAPI TOOLKIT | 31
Bar ChartEXAMPLE
0.5
1
1.52
2.5
3
3.5
4
4.5
5
Per
cent
age
(Num
ber
of
Err
ors
Ove
r N
umb
er
of
Tota
l Med
s A
dm
inis
trat
ed)
Defect Type (Reasons for medication error)
1 2 3 4 5 6 7 8 9 10 11 12
Percentage of Medication Errors

32 | PROVIDIGM QAPI TOOLKIT
Pie charts, a form of an area chart, are an easy way to visualize percentage breakdowns of a total. They’re useful for analyzing polls, statistics, and managing money and data. And they make an excellent visual display for explaining data to other people.
Procedure:
1. Calculate Pie Chart Proportions.
2. Gather your numerical data and label information and write it down with one data point per line, in descending order.
3. Add the data all together, calculate the total. This number will be your denominator.
4. Calculate the percentage of the total for each data point by divid-ing each one by the denominator (total) calculated above.
5. Calculate the angle between the two sides of each pie slice. To do this, multiply each percentage (still in decimal form) by 360 (the number of degrees in a circle).
6. Utilize the charting capabilities in Microsoft Office (Excel or Word). To complete manually, use a mathematical compass to draw a circle. To draw a pie chart accurately, you need to start with a perfect circle. This can be done using a compass (and a pro-tractor to measure the angles). If you don’t have a compass, try tracing around a circle template, using something round such as a lid or a CD.
7. Draw the radius. Start in the exact center of the circle an draw a straight line to the outside of the circle.
8. Place your protractor on the circle. Position it on the circle so that the 90 degrees crosshair is situated directly above the center of the circle. The zero point should be vertically aligned along the vertical plot line.
9. Draw each section division. Draw the sections by marking the first division against the edge of the protractor at the correct angle, using the angle formulations you got in the earlier step. Each time you add a section, the radius changes to the line you just drew; rotate your protractor accordingly.
10. Color each segment. You can use color, patterns or just words, depending on what meets your purpose best. Add the name of each section and the percent it represents in the chart.
Pie Chart
PROVIDIGM QAPI TOOLKIT | 33
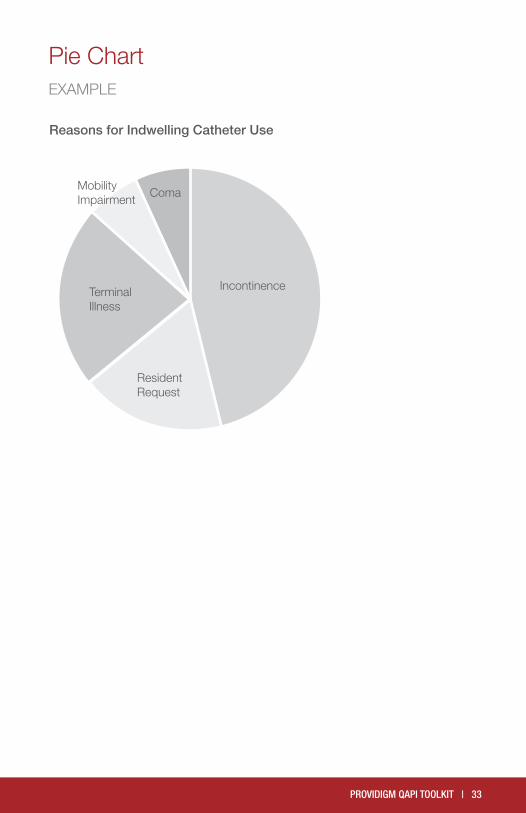
Reasons for Indwelling Catheter Use
Incontinence
Resident Request
Terminal Illness
Mobility Impairment
Coma
Pie ChartEXAMPLE

34 | PROVIDIGM QAPI TOOLKIT
Group Techniques
Technique When to use
Brainstorming
To generate many ideas in a short amount of time. Ideas are suggested while criticism and evaluation is avoided
Nominal Group Techniques
To generate a list of options for a structured decision through the contributions of group members working individually
Multi-VotingTo select the most important of popular topics from a list with limited group discussion and difficulty
Structured DiscussionTo gain group consensus on a list of ideas or topics
High Volume, High Risk, Problem Prone, High Cost
To prioritize issues so that those issues with the largest impact are addressed first and resources are utilized appropriately

PROVIDIGM QAPI TOOLKIT | 35
Brainstorming is a technique designed to generate many ideas in a short amount of time. Ideas are suggested while criticism and evaluation is avoided. Members should feel free to build on others’ ideas.
Procedure:
1. Decide on a topic to be “brainstormed”.
2. Give the group a minute or two to quietly think about the issue and its causes.
3. Encourage group members to write down their ideas.
4. In order, have each member offer one idea about the situation being discussed.
5. Record each answer on a flip chart.
6. Continue until all ideas are recorded.
7. With the group’s agreement, similar ideas can be clarified or combined.
Brainstorming
36 | PROVIDIGM QAPI TOOLKIT
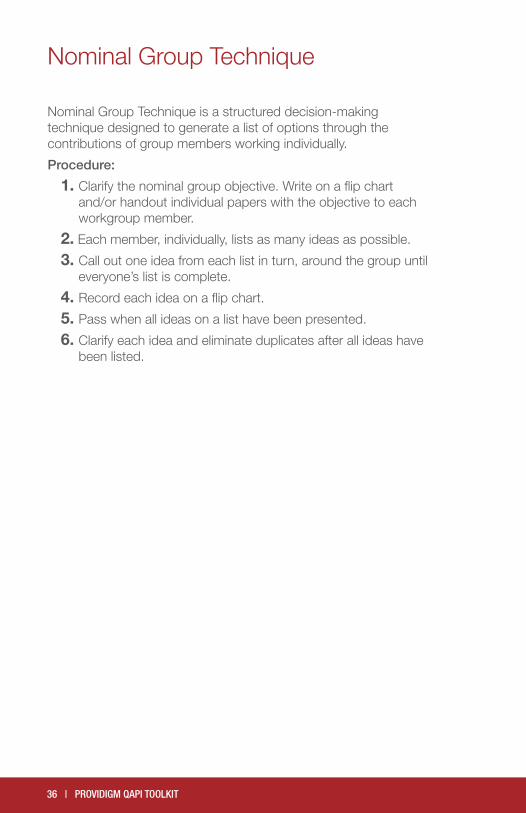
Nominal Group Technique is a structured decision-making technique designed to generate a list of options through the contributions of group members working individually.
Procedure:
1. Clarify the nominal group objective. Write on a flip chart and/or handout individual papers with the objective to each workgroup member.
2. Each member, individually, lists as many ideas as possible.
3. Call out one idea from each list in turn, around the group until everyone’s list is complete.
4. Record each idea on a flip chart.
5. Pass when all ideas on a list have been presented.
6. Clarify each idea and eliminate duplicates after all ideas have been listed.
Nominal Group Technique

PROVIDIGM QAPI TOOLKIT | 37
Multi-voting is a group decision-making technique designed to select the most important or popular topics from a list with limited discussion and difficulty. Multi-voting often follows a brainstorming session in order to identify the few topics worthy of immediate attention.
Procedure:
1. Generate a list of topics.
2. Agree on the criteria for selecting ideas.
3. Assign each idea on the list a letter of the alphabet.
4. Agree on the number of ideas (20 – 30%) for which all members will vote.
5. Each member votes individually, listing the letters of each selected idea.
6. After all members have completed their selections, tally the votes.
7. Let members vote by a show of hands as each topic number is called out.
8. Record and add the votes on a flip chart.
9. Decide which ideas will receive further consideration and attention.
Multi-Voting
38 | PROVIDIGM QAPI TOOLKIT
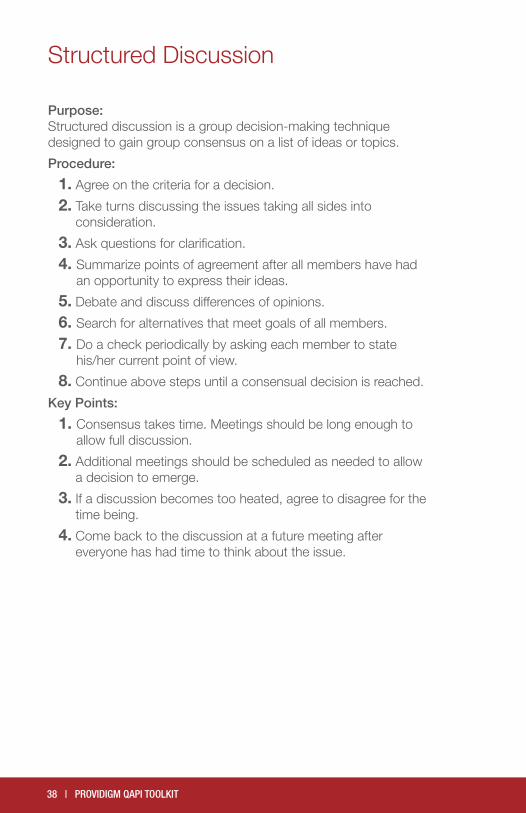
Purpose:Structured discussion is a group decision-making technique designed to gain group consensus on a list of ideas or topics.
Procedure:
1. Agree on the criteria for a decision.
2. Take turns discussing the issues taking all sides into consideration.
3. Ask questions for clarification.
4. Summarize points of agreement after all members have had an opportunity to express their ideas.
5. Debate and discuss differences of opinions.
6. Search for alternatives that meet goals of all members.
7. Do a check periodically by asking each member to state his/her current point of view.
8. Continue above steps until a consensual decision is reached.
Key Points:
1. Consensus takes time. Meetings should be long enough to allow full discussion.
2. Additional meetings should be scheduled as needed to allow a decision to emerge.
3. If a discussion becomes too heated, agree to disagree for the time being.
4. Come back to the discussion at a future meeting after everyone has had time to think about the issue.
Structured Discussion
PROVIDIGM QAPI TOOLKIT | 39
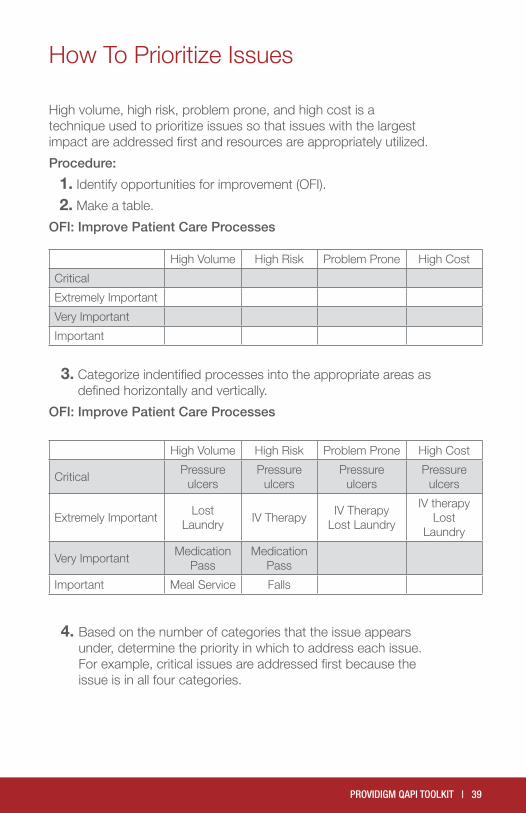
High volume, high risk, problem prone, and high cost is a technique used to prioritize issues so that issues with the largest impact are addressed first and resources are appropriately utilized.
Procedure:
1. Identify opportunities for improvement (OFI).
2. Make a table.
OFI: Improve Patient Care Processes
How To Prioritize Issues
High Volume High Risk Problem Prone High Cost
Critical
Extremely Important
Very Important
Important
3. Categorize indentified processes into the appropriate areas as defined horizontally and vertically.
OFI: Improve Patient Care Processes
High Volume High Risk Problem Prone High Cost
CriticalPressure
ulcersPressure
ulcersPressure
ulcersPressure
ulcers
Extremely ImportantLost
LaundryIV Therapy
IV TherapyLost Laundry
IV therapyLost
Laundry
Very ImportantMedication
PassMedication
Pass
Important Meal Service Falls
4. Based on the number of categories that the issue appears under, determine the priority in which to address each issue. For example, critical issues are addressed first because the issue is in all four categories.

40 | PROVIDIGM QAPI TOOLKIT
An agenda provides structure that guides the meeting. Use of agendas improves meeting efficiency and increases the likelihood of achieving outcomes.
Structure and Organization:
Agendas should include:
• Purpose of the Meeting • Topics • Time Estimates for each Topic • Lead Person for each Topic
Guidelines for use:
• The agenda should be developed prior to the meeting, if possible, and distributed to participants.
• Review agenda with participants at the start of the meeting. • Discuss and make any necessary changes.
Techniques Purpose
AgendaAn agenda provides structure that guides the meeting. Use of agendas improves meeting efficiency and improves likelihood of achieving outcomes
Ground Rules
Ground rules are agreements about acceptable and unacceptable individual and group behaviors. The purpose of ground rules is to limit distraction and help keep members focused
Meeting Roles Assigning meeting roles clarifies and assigns esponsibilities. Roles help hold members accountable and ensure meeting time is productive
Techniques for Effective Meetings
Agenda
PROVIDIGM QAPI TOOLKIT | 41
Ground rules are agreements about acceptable and unacceptable individual and group behaviors. The purpose of ground rules is to limit distraction and help keep members focused. Ground rules should be established during the first few meetings and may be reviewed and revised as necessary.
Examples:
• Start and end meetings on time • Minimize interruptions – turn off all cell phones and pagers • Listen constructively • Keep an open mind • Critique ideas, not people • Maintain communication courtesy • One person speaks at a time • Share responsibilities • Have fun • Celebrate success
Guidelines for use:
• Establish during first few minutes • Review and revise as necessary
Ground Rules

42 | PROVIDIGM QAPI TOOLKIT
Assigning meeting roles clarifies and assigns responsibilities. Roles help hold members accountable and ensure meeting time is productive.
Chairperson
• Sets the date and time of meeting • Prepares the agenda • Ensures the meeting room is set up • Notifies committee members of scheduled time and
meeting location • Notifies guests of scheduled time and meeting location • Prints and distributes the meeting minutes • Ensures data reports are available • Compiles a list of potential agenda topics and distributes
to members • Looks for trends and prioritizes the information • Maintains meeting schedule • Schedules subsequent meetings in response to a significant
finding
Facilitator
• Facilitates the meeting • Opens meeting • Announces agenda and time allotments for each topic • Announces meeting direction and goals • Maintains control of flow of meeting • Encourages team member participation • Ensures needed actions are assigned • Defines and delegates tasks • Knows when it is time to summarize information • Announces next meeting time and place • Closes meeting
Meeting Roles

PROVIDIGM QAPI TOOLKIT | 43
Meeting RolesCONTINUEDTimekeeper
• Keeps accurate track of time during meeting • Alerts when the time allotted for an agenda topic is almost
up so the group can decide whether to keep discussing or move on
• Assists the group to manage time effectively
Recorder (Note taker)
• Writes updates on the Meeting Minutes as directed by the team discussion and input
• Condenses discussion points when possible • Verifies that ideas and information is written accurately • Summarizes discussions in complete sentences • Gets input from group on wording of needs, preference,
problems, goals and interventions
Member
• Reviews data reports in their area of responsibility and notifies the meeting organizer of potential agenda topics
• Arrives on time and is prepared • Remains attentive and focused throughout the meeting • Is prepared to share and participate in discussion • Contributes to development of action plans • Accurately completes assigned documentation • Proceeds to share/implement action plans

Notes

Notes
46 | PROVIDIGM QAPI TOOLKIT
Brassard, M, Ritter, D, & Oddo, F (2010). The Memory Jogger II: A Pocket Guide of Tools for Continuous Improvement and Effective Planning.
Langley GJ, Nolan KM, Nolan TW, Norman CL, Provost LP, Moen, R. The Improvement Guide: A Practical Approach to Enhancing Organizational Performance (2nd edition). San Francisco: Jossey-Bass Publishers; 2009.
Joiner, BL, Scholtes, PR, & Streibel, BJ (2003). The Team Handbook. Madison: Suttle-Straus, Inc.
(2012). Quality Improvement Guide Long-Term Care. Ontario: Health Quality Ontario (HQO).
The Plan-Do-Study-Act (PDSA) cycle was originally developed by Walter A. Shewhart as the Plan-Do-Check-Act (PDCA) cycle. W. Edwards Deming modified Shewhart’s cycle to PDSA, replacing “Check” with “Study.” [See Deming WE. The New Economics for Industry, Government, and Education. Cambridge, MA: The MIT Press; 2000.]
Medicare and Medicaid Programs; Reform of Requirements for Long-Term Care Facilities, 2016, 81 Fed. Reg. 68688 (October 4, 2016) (to be codified at 42 C.F.R. Pts. 405, 431, 447, 482, 483, 485, 488,& 489). Available at: https://www.federalregister.gov/documents/2016/10/04/2016-23503/medicare-and-medicaid-programs-reform-of-requirements-for-long-term-care-facilities.
Have questions about this toolkit or need more information? Contact Providigm at 877-221-0184 or [email protected].
References

PROVIDIGM QAPI TOOLKIT | 47
About the authorBarbara Baylis has served on various committees and subcommittees, and has presented at numerous workshops and conventions. As a member of the Centers for Medicare and Medicaid Services (CMS) Technical Expert Panel (TEP), she was part of the QAPI demonstration project. Barbara served as Chair of the AHCA Clinical Practice Committee and Co-Chair of the Nurse Executive Council. Barbara is a Master Examiner for American Health Care Association (ACHA) and has been a National Quality Award Examiner since 1996. She also serves on the AHCA Quality Award Program Board of Overseers, is a member of the Kentucky Center for Performance Excellence Operating Committee and a KYCPE award application examiner. In 2012 she was honored with the Mary K. Ousley Champion of Quality Award from the American Health Care Association. In addition to this QAPI Toolkit, she is co-author of Continuous Quality Improvement: Using the Regulatory Framework.
YES NOYES NO
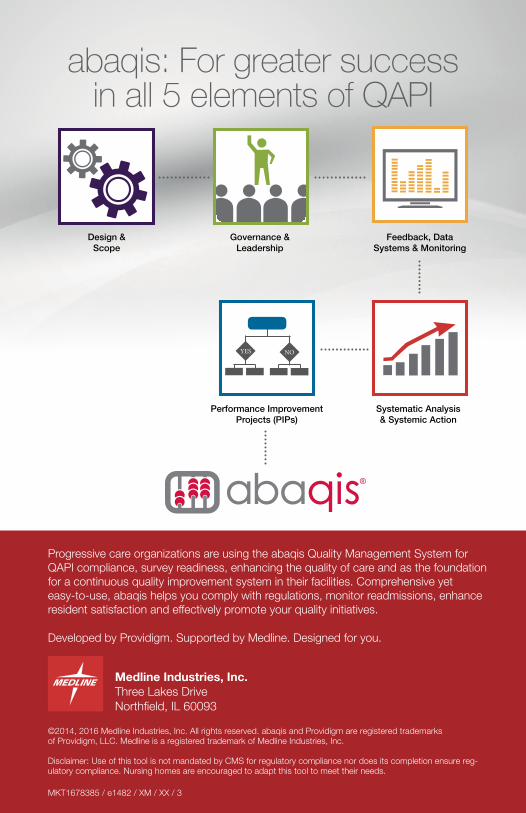
Design & Scope
Governance & Leadership
Performance Improvement Projects (PIPs)
Feedback, Data Systems & Monitoring
Systematic Analysis & Systemic Action
abaqis: For greater success in all 5 elements of QAPI
Medline Industries, Inc.Three Lakes DriveNorthfield, IL 60093
©2014, 2016 Medline Industries, Inc. All rights reserved. abaqis and Providigm are registered trademarks of Providigm, LLC. Medline is a registered trademark of Medline Industries, Inc.
Disclaimer: Use of this tool is not mandated by CMS for regulatory compliance nor does its completion ensure reg-ulatory compliance. Nursing homes are encouraged to adapt this tool to meet their needs.
MKT1678385 / e1482 / XM / XX / 3
Progressive care organizations are using the abaqis Quality Management System for QAPI compliance, survey readiness, enhancing the quality of care and as the foundation for a continuous quality improvement system in their facilities. Comprehensive yet easy-to-use, abaqis helps you comply with regulations, monitor readmissions, enhance resident satisfaction and effectively promote your quality initiatives. Developed by Providigm. Supported by Medline. Designed for you.