Q4/YE Earnings Presentation
35
May 24, 2021
Transcript of Q4/YE Earnings Presentation

May 24, 2021
Forward-Looking Statements
Certain statements and information in this presentation may constitute forward-looking statements within the meaning of the Private Securities Litigation Reform Act of 1995. Words such as “believe,” “anticipate," “guidance,”
“plan,” “potential,” “expect,” “should,” “will,” “forecast,” “target” and similar expressions are forward-looking statements within the meaning of the "safe harbor" provisions of the Private Securities Litigation Reform Act of
1995. These forward-looking statements reflect our current expectations, assumptions and/or beliefs concerning future events. As a result, these forward-looking statements rely on a number of assumptions, forecasts, and
estimates and, therefore, these forward-looking statements are subject to a number of risks and uncertainties that may cause the Company's actual performance to differ materially from that projected in such statements.
Such forward-looking statements may include, but are not limited to, statements concerning our market commentary and performance expectations, including our second quarter 2021 forecasted net sales, gross profit,
and Adjusted EBITDA, and our fiscal year 2021 forecasted capital spending, cost savings initiatives, return of near-term expenses, net debt leverage, cash interest expense, cash tax rate and other
consolidated financial performance guidance. Among the factors that could cause actual results to differ materially include, but are not limited to, industry cyclicality and seasonality and adverse weather conditions;
challenging economic conditions affecting the nonresidential construction industry; downturns in the residential new construction and repair and remodeling end markets, or the economy or the availability of consumer
credit; volatility in the United States (“U.S.”) economy and abroad, generally, and in the credit markets; the severity, duration and spread of the COVID-19 pandemic, as well as actions that may be taken by the Company or
governmental authorities to containCOVID-19 or to treat its impact; impairment of goodwill and/or intangible assets; our ability to successfully develop new products or improve existing products and market acceptance of
such products; the effects of manufacturing or assembly realignments; seasonality of the business and other external factors beyond our control; commodity price volatility and/or limited availability of raw materials,
including steel, PVC resin, glass and aluminum; our ability to identify and develop relationships with a sufficient number of qualified suppliers and to avoid a significant interruption in our supply chains; retention and
replacement of key personnel; enforcement and obsolescence of our intellectual property rights; costs related to compliance with, violations of or liabilities under environmental, health and safety laws; changes in building
codes and standards; competitive activity and pricing pressure in our industry; our ability to make strategic acquisitions accretive to earnings and achieve expected cost savings from historical acquisitions; our ability to
carry out our restructuring plans and to fully realize the expected cost savings; global climate change, including legal, regulatory or market responses thereto; breaches of our information system security measures; damage
to our computer infrastructure and software systems; necessary maintenance or replacements to our enterprise resource planning technologies; potential personal injury, property damage or product liability claims or
other types of litigation; compliance with certain laws related to our international business operations; inability to attract and retain employees, increases in labor costs, potential labor disputes, union organizing activity and
work stoppages at our facilities or the facilities of our suppliers; significant changes in factors and assumptions used to measure certain of our defined benefit plan obligations and the effect of actual investment returns
on pension assets; the cost and difficulty associated with integrating and combining acquired businesses; volatility of the Company’s stock price; substantial governance and other rights held by the Investors; the effect
on our common stock price caused by transactions engaged in by the Investors, our directors or executives; our substantial indebtedness and our ability to incur substantially more indebtedness; limitations that our debt
agreements place on our ability to engage in certain business and financial transactions; our ability to obtain financing on acceptable terms; downgrades of our credit ratings; and the effect of increased interest rates on
our ability to service our debt. See also the “Risk Factors” in the Company’s Annual Report on Form 10-K for the fiscal year ended December 31, 2020 filed with the SEC on March 4, 2021 and other risks described in
documents subsequently filed by the Company from time to time with the SEC, which identify other important factors, though not necessarily all such factors, that could cause future outcomes to differ materially from
those set forth in the forward-looking statements. The Company expressly disclaims any obligation to update these forward-looking statements, whether as a result of new information, future events, or otherwise.
Non-GAAP Financial Measures
This presentation includes certain "non-GAAP financial measures" as defined under the Securities Exchange Act of 1934 and in accordance with Regulation G. Management believes the use of such non-GAAP financial
measures assists investors in understanding the ongoing operating performance of the Company by presenting the financial results between periods on a more comparable basis. Such non-GAAP financial measures
should not be construed as an alternative to reported results determined in accordance with U.S. GAAP. We have included reconciliations of these non-GAAP financial measures to the most directly comparable financial
measures calculated and provided in accordance with U.S. GAAP in the Appendix to this presentation. A reconciliation of the forecasted range for Adjusted EBITDA for the second quarter of 2021 is not included in this
presentation due to the number of variables in the projected range and because we are currently unable to quantify accurately certain amounts that would be required to be included in the GAAP measure or the individual
adjustments for such reconciliation. In addition, we believe such reconciliation would imply a degree of precision that would be confusing or misleading to investors.
Disclaimer
2

BusinessOverview
3

Market LeadershipUnparalleled Customer
RelationshipsExtensive Footprint
Cost Advantaged
Platform
Largest North American Exterior Building Products Manufacturer
Big Box
Retailers
Leading
Distributors Production
Builders
Commercial
General
Contractors
107 manufacturing,
distribution, and
branch office facilities
~20,500 employees
⚫⚫⚫⚫⚫⚫⚫⚫⚫⚫⚫⚫⚫⚫⚫⚫⚫⚫⚫⚫⚫⚫⚫⚫⚫⚫⚫⚫⚫⚫⚫⚫⚫⚫⚫⚫⚫⚫⚫⚫⚫⚫⚫⚫⚫⚫⚫⚫⚫
⚫⚫⚫⚫⚫⚫⚫⚫⚫⚫⚫⚫⚫⚫⚫⚫⚫⚫⚫⚫⚫⚫⚫⚫⚫⚫⚫⚫⚫⚫⚫⚫⚫⚫⚫⚫⚫⚫⚫⚫⚫⚫⚫⚫⚫⚫⚫⚫⚫
⚫⚫⚫⚫⚫⚫⚫⚫⚫⚫⚫⚫⚫⚫⚫⚫⚫⚫⚫⚫⚫⚫⚫⚫⚫⚫⚫⚫⚫⚫⚫⚫⚫⚫⚫⚫⚫⚫⚫⚫⚫⚫⚫⚫⚫⚫⚫⚫⚫
⚫⚫⚫⚫⚫⚫⚫⚫⚫⚫⚫⚫⚫⚫⚫⚫⚫⚫⚫⚫⚫⚫⚫⚫⚫⚫⚫⚫⚫⚫⚫⚫⚫⚫⚫⚫⚫⚫⚫⚫⚫⚫⚫⚫⚫⚫⚫⚫⚫
⚫⚫⚫⚫⚫⚫⚫⚫⚫⚫⚫⚫⚫⚫⚫⚫⚫⚫⚫⚫⚫⚫⚫⚫⚫⚫⚫⚫⚫⚫⚫⚫⚫⚫⚫⚫⚫⚫⚫⚫⚫⚫⚫⚫⚫⚫⚫⚫⚫⚫⚫⚫⚫⚫⚫⚫⚫⚫⚫⚫⚫⚫⚫⚫⚫⚫⚫⚫⚫⚫⚫⚫⚫⚫⚫⚫⚫⚫⚫⚫⚫⚫⚫⚫⚫⚫⚫⚫⚫⚫⚫⚫⚫⚫⚫⚫⚫⚫
⚫⚫⚫⚫⚫⚫⚫⚫⚫⚫⚫⚫⚫⚫⚫⚫⚫⚫⚫⚫⚫⚫⚫⚫⚫⚫⚫⚫⚫⚫⚫⚫⚫⚫⚫⚫⚫⚫⚫⚫⚫⚫⚫⚫⚫⚫⚫⚫⚫
⚫⚫⚫⚫⚫⚫⚫⚫⚫⚫⚫⚫⚫⚫⚫⚫⚫⚫⚫⚫⚫⚫⚫⚫⚫⚫⚫⚫⚫⚫⚫⚫⚫⚫⚫⚫⚫⚫⚫⚫⚫⚫⚫⚫⚫⚫⚫⚫⚫
⚫⚫⚫⚫⚫⚫⚫⚫⚫⚫⚫⚫⚫⚫⚫⚫⚫⚫⚫⚫⚫⚫⚫⚫⚫⚫⚫⚫⚫⚫⚫⚫⚫⚫⚫⚫⚫⚫⚫⚫⚫⚫⚫⚫⚫⚫⚫⚫⚫
⚫⚫⚫⚫⚫⚫⚫⚫⚫⚫⚫⚫⚫⚫⚫⚫⚫⚫⚫⚫⚫⚫⚫⚫⚫⚫⚫⚫⚫⚫⚫⚫⚫⚫⚫⚫⚫⚫⚫⚫⚫⚫⚫⚫⚫⚫⚫⚫⚫
⚫⚫⚫⚫⚫⚫⚫⚫⚫⚫⚫⚫⚫⚫⚫⚫⚫⚫⚫⚫⚫⚫⚫⚫⚫⚫⚫⚫⚫⚫⚫⚫⚫⚫⚫⚫⚫⚫⚫⚫⚫⚫⚫⚫⚫⚫⚫⚫⚫
⚫⚫⚫⚫⚫⚫⚫⚫⚫⚫⚫⚫⚫⚫⚫⚫⚫⚫⚫⚫⚫⚫⚫⚫⚫⚫⚫⚫⚫⚫⚫⚫⚫⚫⚫⚫⚫⚫⚫⚫⚫⚫⚫⚫⚫⚫⚫⚫⚫
⚫⚫⚫⚫⚫⚫⚫⚫⚫⚫⚫⚫⚫⚫⚫⚫⚫⚫⚫⚫⚫⚫⚫⚫⚫⚫⚫⚫⚫⚫⚫⚫⚫⚫⚫⚫⚫⚫⚫⚫⚫⚫⚫⚫⚫⚫⚫⚫⚫
⚫⚫⚫⚫⚫⚫⚫⚫⚫⚫⚫⚫⚫⚫⚫⚫⚫⚫⚫⚫⚫⚫⚫⚫⚫⚫⚫⚫⚫⚫⚫⚫⚫⚫⚫⚫⚫⚫⚫⚫⚫⚫⚫⚫⚫⚫⚫⚫⚫
⚫⚫⚫⚫⚫⚫⚫⚫⚫⚫⚫⚫⚫⚫⚫⚫⚫⚫⚫⚫⚫⚫⚫⚫⚫⚫⚫⚫⚫⚫⚫⚫⚫⚫⚫⚫⚫⚫⚫⚫⚫⚫⚫⚫⚫⚫⚫⚫⚫
⚫⚫⚫⚫⚫⚫⚫⚫⚫⚫⚫⚫⚫⚫⚫⚫⚫⚫⚫⚫⚫⚫⚫⚫⚫⚫⚫⚫⚫⚫⚫⚫⚫⚫⚫⚫⚫⚫⚫⚫⚫⚫⚫⚫⚫⚫⚫⚫⚫
⚫⚫⚫⚫⚫⚫⚫⚫⚫⚫⚫⚫⚫⚫⚫⚫⚫⚫⚫⚫⚫⚫⚫⚫⚫⚫⚫⚫⚫⚫⚫⚫⚫⚫⚫⚫⚫⚫⚫⚫⚫⚫⚫⚫⚫⚫⚫⚫⚫
⚫⚫⚫⚫⚫⚫⚫⚫⚫⚫⚫⚫⚫⚫⚫⚫⚫⚫⚫⚫⚫⚫⚫⚫⚫⚫⚫⚫⚫⚫⚫⚫⚫⚫⚫⚫⚫⚫⚫⚫⚫⚫⚫⚫⚫⚫⚫⚫⚫
⚫⚫⚫⚫⚫⚫⚫⚫⚫⚫⚫⚫⚫⚫⚫⚫⚫⚫⚫⚫⚫⚫⚫⚫⚫⚫⚫⚫⚫⚫⚫⚫⚫⚫⚫⚫⚫⚫⚫⚫⚫⚫⚫⚫⚫⚫⚫⚫⚫
⚫⚫⚫⚫⚫⚫⚫⚫⚫⚫⚫⚫⚫⚫⚫⚫⚫⚫⚫⚫⚫⚫⚫⚫⚫⚫⚫⚫⚫⚫⚫⚫⚫⚫⚫⚫⚫⚫⚫⚫⚫⚫⚫⚫⚫⚫⚫⚫⚫
⚫⚫⚫⚫⚫⚫⚫⚫⚫⚫⚫⚫⚫⚫⚫⚫⚫⚫⚫⚫⚫⚫⚫⚫⚫⚫⚫⚫⚫⚫⚫⚫⚫⚫⚫⚫⚫⚫⚫⚫⚫⚫⚫⚫⚫⚫⚫⚫⚫
⚫⚫⚫⚫⚫⚫⚫⚫⚫⚫⚫⚫⚫⚫⚫⚫⚫⚫⚫⚫⚫⚫⚫⚫⚫⚫⚫⚫⚫⚫⚫⚫⚫⚫⚫⚫⚫⚫⚫⚫⚫⚫⚫⚫⚫⚫⚫⚫⚫
⚫⚫⚫⚫⚫⚫⚫⚫⚫⚫⚫⚫⚫⚫⚫⚫⚫⚫⚫⚫⚫⚫⚫⚫⚫⚫⚫⚫⚫⚫⚫⚫⚫⚫⚫⚫⚫⚫⚫⚫⚫⚫⚫⚫⚫⚫⚫⚫⚫
⚫⚫⚫⚫⚫⚫⚫⚫⚫⚫⚫⚫⚫⚫⚫⚫⚫⚫⚫⚫⚫⚫⚫⚫⚫⚫⚫⚫⚫⚫⚫⚫⚫⚫⚫⚫⚫⚫⚫⚫⚫⚫⚫⚫⚫⚫⚫⚫⚫
⚫⚫⚫⚫⚫⚫⚫⚫⚫⚫⚫⚫⚫⚫⚫⚫⚫⚫⚫⚫⚫⚫⚫⚫⚫⚫⚫⚫⚫⚫⚫⚫⚫⚫⚫⚫⚫⚫⚫⚫⚫⚫⚫⚫⚫⚫⚫⚫⚫
⚫⚫⚫⚫⚫⚫⚫⚫⚫⚫⚫⚫⚫⚫⚫⚫⚫⚫⚫⚫⚫⚫⚫⚫⚫⚫⚫⚫⚫⚫⚫⚫⚫⚫⚫⚫⚫⚫⚫⚫⚫⚫⚫⚫⚫⚫⚫⚫⚫
⚫⚫⚫⚫⚫⚫⚫⚫⚫⚫⚫⚫⚫⚫⚫⚫⚫⚫⚫⚫⚫⚫⚫⚫⚫⚫⚫⚫⚫⚫⚫⚫⚫⚫⚫⚫⚫⚫⚫⚫⚫⚫⚫⚫⚫⚫⚫⚫⚫
⚫⚫⚫⚫⚫⚫⚫⚫⚫⚫⚫⚫⚫⚫⚫⚫⚫⚫⚫⚫⚫⚫⚫⚫⚫⚫⚫⚫⚫⚫⚫⚫⚫⚫⚫⚫⚫⚫⚫⚫⚫⚫⚫⚫⚫⚫⚫⚫⚫
⚫⚫⚫⚫⚫⚫⚫⚫⚫⚫⚫⚫⚫⚫⚫⚫⚫⚫⚫⚫⚫⚫⚫⚫⚫⚫⚫⚫⚫⚫⚫⚫⚫⚫⚫⚫⚫⚫⚫⚫⚫⚫⚫⚫⚫⚫⚫⚫⚫
⚫⚫⚫⚫⚫⚫⚫⚫⚫⚫⚫⚫⚫⚫⚫⚫⚫⚫⚫⚫⚫⚫⚫⚫⚫⚫⚫⚫⚫⚫⚫⚫⚫⚫⚫⚫⚫⚫⚫⚫⚫⚫⚫⚫⚫⚫⚫⚫⚫
⚫⚫⚫⚫⚫⚫⚫⚫⚫⚫⚫⚫⚫⚫⚫⚫⚫⚫⚫⚫⚫⚫⚫⚫⚫⚫⚫⚫⚫⚫⚫⚫⚫⚫⚫⚫⚫⚫⚫⚫⚫⚫⚫⚫⚫⚫⚫⚫⚫
⚫⚫⚫⚫⚫⚫⚫⚫⚫⚫⚫⚫⚫⚫⚫⚫⚫⚫⚫⚫⚫⚫⚫⚫⚫⚫⚫⚫⚫⚫⚫⚫⚫⚫⚫⚫⚫⚫⚫⚫⚫⚫⚫⚫⚫⚫⚫⚫⚫⚫⚫⚫⚫⚫⚫⚫⚫⚫⚫⚫⚫⚫⚫⚫⚫⚫⚫⚫⚫⚫⚫⚫⚫⚫⚫⚫⚫⚫⚫⚫⚫⚫⚫⚫⚫⚫⚫⚫⚫⚫⚫⚫⚫⚫⚫⚫⚫⚫
⚫⚫⚫⚫⚫⚫⚫⚫⚫⚫⚫⚫⚫⚫⚫⚫⚫⚫⚫⚫⚫⚫⚫⚫⚫⚫⚫⚫⚫⚫⚫⚫⚫⚫⚫⚫⚫⚫⚫⚫⚫⚫⚫⚫⚫⚫⚫⚫⚫⚫⚫⚫⚫⚫⚫⚫⚫⚫⚫⚫⚫⚫⚫⚫⚫⚫⚫⚫⚫⚫⚫⚫⚫⚫⚫⚫⚫⚫⚫⚫⚫⚫⚫⚫⚫⚫⚫⚫⚫⚫⚫⚫⚫⚫⚫⚫⚫⚫
⚫⚫⚫⚫⚫⚫⚫⚫⚫⚫⚫⚫⚫⚫⚫⚫⚫⚫⚫⚫⚫⚫⚫⚫⚫⚫⚫⚫⚫⚫⚫⚫⚫⚫⚫⚫⚫⚫⚫⚫⚫⚫⚫⚫⚫⚫⚫⚫⚫
⚫⚫⚫⚫⚫⚫⚫⚫⚫⚫⚫⚫⚫⚫⚫⚫⚫⚫⚫⚫⚫⚫⚫⚫⚫⚫⚫⚫⚫⚫⚫⚫⚫⚫⚫⚫⚫⚫⚫⚫⚫⚫⚫⚫⚫⚫⚫⚫⚫
⚫⚫⚫⚫⚫⚫⚫⚫⚫⚫⚫⚫⚫⚫⚫⚫⚫⚫⚫⚫⚫⚫⚫⚫⚫⚫⚫⚫⚫⚫⚫⚫⚫⚫⚫⚫⚫⚫⚫⚫⚫⚫⚫⚫⚫⚫⚫⚫⚫⚫⚫⚫⚫⚫⚫⚫⚫⚫⚫⚫⚫⚫⚫⚫⚫⚫⚫⚫⚫⚫⚫⚫⚫⚫⚫⚫⚫⚫⚫⚫⚫⚫⚫⚫⚫⚫⚫⚫⚫⚫⚫⚫⚫⚫⚫⚫⚫⚫
⚫⚫⚫⚫⚫⚫⚫⚫⚫⚫⚫⚫⚫⚫⚫⚫⚫⚫⚫⚫⚫⚫⚫⚫⚫⚫⚫⚫⚫⚫⚫⚫⚫⚫⚫⚫⚫⚫⚫⚫⚫⚫⚫⚫⚫⚫⚫⚫⚫
⚫⚫⚫⚫⚫⚫⚫⚫⚫⚫⚫⚫⚫⚫⚫⚫⚫⚫⚫⚫⚫⚫⚫⚫⚫⚫⚫⚫⚫⚫⚫⚫⚫⚫⚫⚫⚫⚫⚫⚫⚫⚫⚫⚫⚫⚫⚫⚫⚫
⚫⚫⚫⚫⚫⚫⚫⚫⚫⚫⚫⚫⚫⚫⚫⚫⚫⚫⚫⚫⚫⚫⚫⚫⚫⚫⚫⚫⚫⚫⚫⚫⚫⚫⚫⚫⚫⚫⚫⚫⚫⚫⚫⚫⚫⚫⚫⚫⚫⚫⚫⚫⚫⚫⚫⚫⚫⚫⚫⚫⚫⚫⚫⚫⚫⚫⚫⚫⚫⚫⚫⚫⚫⚫⚫⚫⚫⚫⚫⚫⚫⚫⚫⚫⚫⚫⚫⚫⚫⚫⚫⚫⚫⚫⚫⚫⚫⚫
⚫⚫⚫⚫⚫⚫⚫⚫⚫⚫⚫⚫⚫⚫⚫⚫⚫⚫⚫⚫⚫⚫⚫⚫⚫⚫⚫⚫⚫⚫⚫⚫⚫⚫⚫⚫⚫⚫⚫⚫⚫⚫⚫⚫⚫⚫⚫⚫⚫⚫⚫⚫⚫⚫⚫⚫⚫⚫⚫⚫⚫⚫⚫⚫⚫⚫⚫⚫⚫⚫⚫⚫⚫⚫⚫⚫⚫⚫⚫⚫⚫⚫⚫⚫⚫⚫⚫⚫⚫⚫⚫⚫⚫⚫⚫⚫⚫⚫⚫⚫⚫⚫⚫⚫⚫⚫⚫⚫⚫⚫⚫⚫⚫⚫⚫⚫⚫⚫⚫⚫⚫⚫⚫⚫⚫⚫⚫⚫⚫⚫⚫⚫⚫⚫⚫⚫⚫⚫⚫⚫⚫⚫⚫⚫⚫⚫⚫
⚫⚫⚫⚫⚫⚫⚫⚫⚫⚫⚫⚫⚫⚫⚫⚫⚫⚫⚫⚫⚫⚫⚫⚫⚫⚫⚫⚫⚫⚫⚫⚫⚫⚫⚫⚫⚫⚫⚫⚫⚫⚫⚫⚫⚫⚫⚫⚫⚫
⚫⚫⚫⚫⚫⚫⚫⚫⚫⚫⚫⚫⚫⚫⚫⚫⚫⚫⚫⚫⚫⚫⚫⚫⚫⚫⚫⚫⚫⚫⚫⚫⚫⚫⚫⚫⚫⚫⚫⚫⚫⚫⚫⚫⚫⚫⚫⚫⚫
⚫⚫⚫⚫⚫⚫⚫⚫⚫⚫⚫⚫⚫⚫⚫⚫⚫⚫⚫⚫⚫⚫⚫⚫⚫⚫⚫⚫⚫⚫⚫⚫⚫⚫⚫⚫⚫⚫⚫⚫⚫⚫⚫⚫⚫⚫⚫⚫⚫⚫⚫⚫⚫⚫⚫⚫⚫⚫⚫⚫⚫⚫⚫⚫⚫⚫⚫⚫⚫⚫⚫⚫⚫⚫⚫⚫⚫⚫⚫⚫⚫⚫⚫⚫⚫⚫⚫⚫⚫⚫⚫⚫⚫⚫⚫⚫⚫⚫ ⚫⚫⚫⚫⚫⚫⚫⚫⚫⚫⚫⚫⚫⚫⚫⚫⚫⚫⚫⚫⚫⚫⚫⚫⚫⚫⚫⚫⚫⚫⚫⚫⚫⚫⚫⚫⚫⚫⚫⚫⚫⚫⚫⚫⚫⚫⚫⚫⚫
⚫⚫⚫⚫⚫⚫⚫⚫⚫⚫⚫⚫⚫⚫⚫⚫⚫⚫⚫⚫⚫⚫⚫⚫⚫⚫⚫⚫⚫⚫⚫⚫⚫⚫⚫⚫⚫⚫⚫⚫⚫⚫⚫⚫⚫⚫⚫⚫⚫
⚫⚫⚫⚫⚫⚫⚫⚫⚫⚫⚫⚫⚫⚫⚫⚫⚫⚫⚫⚫⚫⚫⚫⚫⚫⚫⚫⚫⚫⚫⚫⚫⚫⚫⚫⚫⚫⚫⚫⚫⚫⚫⚫⚫⚫⚫⚫⚫⚫
⚫⚫⚫⚫⚫⚫⚫⚫⚫⚫⚫⚫⚫⚫⚫⚫⚫⚫⚫⚫⚫⚫⚫⚫⚫⚫⚫⚫⚫⚫⚫⚫⚫⚫⚫⚫⚫⚫⚫⚫⚫⚫⚫⚫⚫⚫⚫⚫⚫
⚫⚫⚫⚫⚫⚫⚫⚫⚫⚫⚫⚫⚫⚫⚫⚫⚫⚫⚫⚫⚫⚫⚫⚫⚫⚫⚫⚫⚫⚫⚫⚫⚫⚫⚫⚫⚫⚫⚫⚫⚫⚫⚫⚫⚫⚫⚫⚫⚫
⚫⚫⚫⚫⚫⚫⚫⚫⚫⚫⚫⚫⚫⚫⚫⚫⚫⚫⚫⚫⚫⚫⚫⚫⚫⚫⚫⚫⚫⚫⚫⚫⚫⚫⚫⚫⚫⚫⚫⚫⚫⚫⚫⚫⚫⚫⚫⚫⚫
⚫⚫⚫⚫⚫⚫⚫⚫⚫⚫⚫⚫⚫⚫⚫⚫⚫⚫⚫⚫⚫⚫⚫⚫⚫⚫⚫⚫⚫⚫⚫⚫⚫⚫⚫⚫⚫⚫⚫⚫⚫⚫⚫⚫⚫⚫⚫⚫⚫
⚫⚫⚫⚫⚫⚫⚫⚫⚫⚫⚫⚫⚫⚫⚫⚫⚫⚫⚫⚫⚫⚫⚫⚫⚫⚫⚫⚫⚫⚫⚫⚫⚫⚫⚫⚫⚫⚫⚫⚫⚫⚫⚫⚫⚫⚫⚫⚫⚫⚫⚫⚫⚫⚫⚫⚫⚫⚫⚫⚫⚫⚫⚫⚫⚫⚫⚫⚫⚫⚫⚫⚫⚫⚫⚫⚫⚫⚫⚫⚫⚫⚫⚫⚫⚫⚫⚫⚫⚫⚫⚫⚫⚫⚫⚫⚫⚫⚫
⚫⚫⚫⚫⚫⚫⚫⚫⚫⚫⚫⚫⚫⚫⚫⚫⚫⚫⚫⚫⚫⚫⚫⚫⚫⚫⚫⚫⚫⚫⚫⚫⚫⚫⚫⚫⚫⚫⚫⚫⚫⚫⚫⚫⚫⚫⚫⚫⚫
⚫⚫⚫⚫⚫⚫⚫⚫⚫⚫⚫⚫⚫⚫⚫⚫⚫⚫⚫⚫⚫⚫⚫⚫⚫⚫⚫⚫⚫⚫⚫⚫⚫⚫⚫⚫⚫⚫⚫⚫⚫⚫⚫⚫⚫⚫⚫⚫⚫
⚫⚫⚫⚫⚫⚫⚫⚫⚫⚫⚫⚫⚫⚫⚫⚫⚫⚫⚫⚫⚫⚫⚫⚫⚫⚫⚫⚫⚫⚫⚫⚫⚫⚫⚫⚫⚫⚫⚫⚫⚫⚫⚫⚫⚫⚫⚫⚫⚫ ⚫⚫⚫⚫⚫⚫⚫⚫⚫⚫⚫⚫⚫⚫⚫⚫⚫⚫⚫⚫⚫⚫⚫⚫⚫⚫⚫⚫⚫⚫⚫⚫⚫⚫⚫⚫⚫⚫⚫⚫⚫⚫⚫⚫⚫⚫⚫⚫⚫
⚫⚫⚫⚫⚫⚫⚫⚫⚫⚫⚫⚫⚫⚫⚫⚫⚫⚫⚫⚫⚫⚫⚫⚫⚫⚫⚫⚫⚫⚫⚫⚫⚫⚫⚫⚫⚫⚫⚫⚫⚫⚫⚫⚫⚫⚫⚫⚫⚫
⚫⚫⚫⚫⚫⚫⚫⚫⚫⚫⚫⚫⚫⚫⚫⚫⚫⚫⚫⚫⚫⚫⚫⚫⚫⚫⚫⚫⚫⚫⚫⚫⚫⚫⚫⚫⚫⚫⚫⚫⚫⚫⚫⚫⚫⚫⚫⚫⚫
⚫⚫⚫⚫⚫⚫⚫⚫⚫⚫⚫⚫⚫⚫⚫⚫⚫⚫⚫⚫⚫⚫⚫⚫⚫⚫⚫⚫⚫⚫⚫⚫⚫⚫⚫⚫⚫⚫⚫⚫⚫⚫⚫⚫⚫⚫⚫⚫⚫⚫⚫⚫⚫⚫⚫⚫⚫⚫⚫⚫⚫⚫⚫⚫⚫⚫⚫⚫⚫⚫⚫⚫⚫⚫⚫⚫⚫⚫⚫⚫⚫⚫⚫⚫⚫⚫⚫⚫⚫⚫⚫⚫⚫⚫⚫⚫⚫⚫
⚫⚫⚫⚫⚫⚫⚫⚫⚫⚫⚫⚫⚫⚫⚫⚫⚫⚫⚫⚫⚫⚫⚫⚫⚫⚫⚫⚫⚫⚫⚫⚫⚫⚫⚫⚫⚫⚫⚫⚫⚫⚫⚫⚫⚫⚫⚫⚫⚫
⚫⚫⚫⚫⚫⚫⚫⚫⚫⚫⚫⚫⚫⚫⚫⚫⚫⚫⚫⚫⚫⚫⚫⚫⚫⚫⚫⚫⚫⚫⚫⚫⚫⚫⚫⚫⚫⚫⚫⚫⚫⚫⚫⚫⚫⚫⚫⚫⚫ ⚫⚫⚫⚫⚫⚫⚫⚫⚫⚫⚫⚫⚫⚫⚫⚫⚫⚫⚫⚫⚫⚫⚫⚫⚫⚫⚫⚫⚫⚫⚫⚫⚫⚫⚫⚫⚫⚫⚫⚫⚫⚫⚫⚫⚫⚫⚫⚫⚫
⚫⚫⚫⚫⚫⚫⚫⚫⚫⚫⚫⚫⚫⚫⚫⚫⚫⚫⚫⚫⚫⚫⚫⚫⚫⚫⚫⚫⚫⚫⚫⚫⚫⚫⚫⚫⚫⚫⚫⚫⚫⚫⚫⚫⚫⚫⚫⚫⚫
⚫⚫⚫⚫⚫⚫⚫⚫⚫⚫⚫⚫⚫⚫⚫⚫⚫⚫⚫⚫⚫⚫⚫⚫⚫⚫⚫⚫⚫⚫⚫⚫⚫⚫⚫⚫⚫⚫⚫⚫⚫⚫⚫⚫⚫⚫⚫⚫⚫
⚫⚫⚫⚫⚫⚫⚫⚫⚫⚫⚫⚫⚫⚫⚫⚫⚫⚫⚫⚫⚫⚫⚫⚫⚫⚫⚫⚫⚫⚫⚫⚫⚫⚫⚫⚫⚫⚫⚫⚫⚫⚫⚫⚫⚫⚫⚫⚫⚫
⚫⚫⚫⚫⚫⚫⚫⚫⚫⚫⚫⚫⚫⚫⚫⚫⚫⚫⚫⚫⚫⚫⚫⚫⚫⚫⚫⚫⚫⚫⚫⚫⚫⚫⚫⚫⚫⚫⚫⚫⚫⚫⚫⚫⚫⚫⚫⚫⚫
⚫⚫⚫⚫⚫⚫⚫⚫⚫⚫⚫⚫⚫⚫⚫⚫⚫⚫⚫⚫⚫⚫⚫⚫⚫⚫⚫⚫⚫⚫⚫⚫⚫⚫⚫⚫⚫⚫⚫⚫⚫⚫⚫⚫⚫⚫⚫⚫⚫
⚫⚫⚫⚫⚫⚫⚫⚫⚫⚫⚫⚫⚫⚫⚫⚫⚫⚫⚫⚫⚫⚫⚫⚫⚫⚫⚫⚫⚫⚫⚫⚫⚫⚫⚫⚫⚫⚫⚫⚫⚫⚫⚫⚫⚫⚫⚫⚫⚫⚫⚫⚫⚫⚫⚫⚫⚫⚫⚫⚫⚫⚫⚫⚫⚫⚫⚫⚫⚫⚫⚫⚫⚫⚫⚫⚫⚫⚫⚫⚫⚫⚫⚫⚫⚫⚫⚫⚫⚫⚫⚫⚫⚫⚫⚫⚫⚫⚫
1335988_11335988_11335988_11335988_11335988_11335988_11335988_11335988_11335988_11335988_11335988_11335988_11335988_11335988_11335988_11335988_11335988_11335988_11335988_11335988_11335988_11335988_11335988_11335988_11335988_11335988_11335988_11335988_11335988_11335988_11335988_11335988_11335988_11335988_11335988_11335988_11335988_11335988_11335988_11335988_11335988_11335988_11335988_11335988_11335988_11335988_11335988_11335988_11335988_1
$250 million of realized
cost improvements2
LTM 2021 Net Sales1: $4.8 billion | LTM 2021 Adjusted EBITDA1: $650 million | LTM 2021 Adj. EBITDA Margin1 13.6%
#1
#1
Vinyl
Windows
Vinyl
Siding
Stone Veneer
(industry’s only
national turnkey
installation provider)
#2
#1
#1
Metal
Accessories
Insulated
Metal Panels
Metal
Roofing and
Wall
Systems
#1
Cornerstone Buildings Brands at a Glance
1 See Appendix for reconciliations of non-GAAP financial measures. LTM period ended 4/3/21.
2 Achieved cost savings from 2018 - 20204
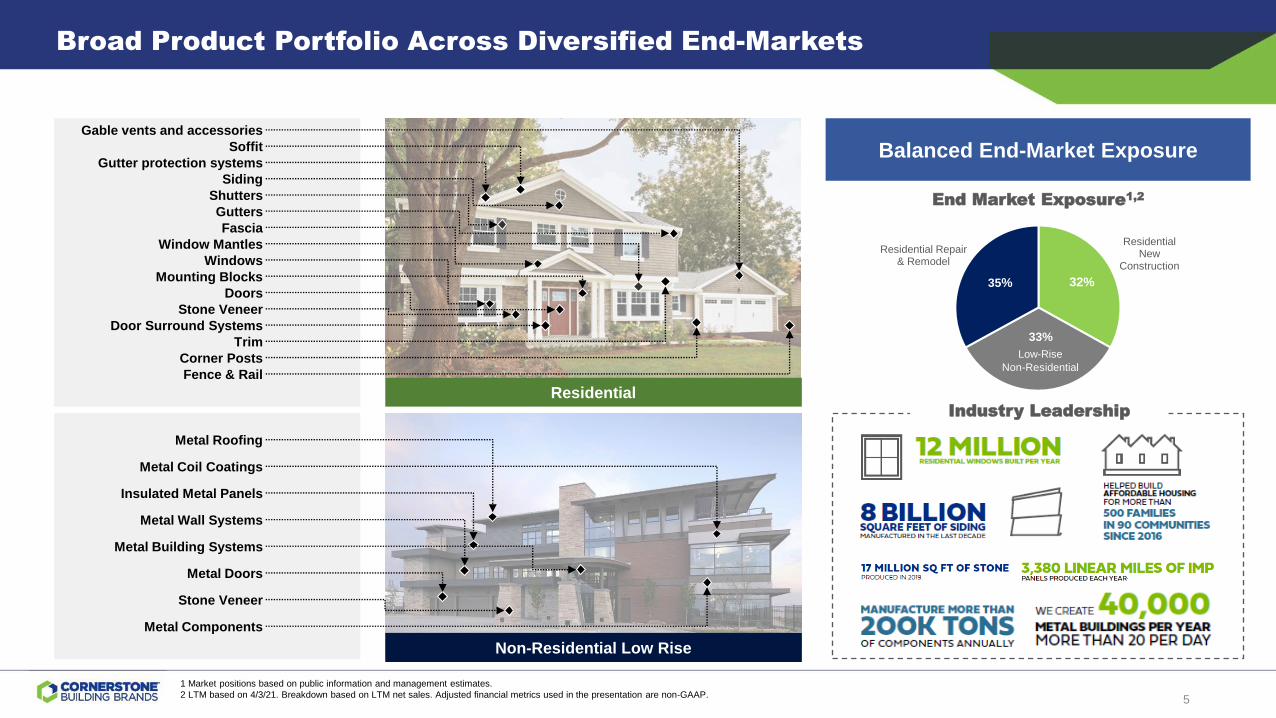
Broad Product Portfolio Across Diversified End-Markets
Residential
Non-Residential Low Rise
Gable vents and accessories
Gutter protection systems
Soffit
Siding
Stone Veneer
Shutters
Gutters
Fascia
Fence & Rail
Mounting Blocks
Doors
Door Surround Systems
Trim
Window Mantles
Windows
Corner Posts
Metal Roofing
Insulated Metal Panels
Metal Wall Systems
Metal Doors
Metal Building Systems
Metal Coil Coatings
Metal Components
Stone Veneer
Residential New
Construction
Residential Repair & Remodel
32%35%
33%
Low-Rise
Non-Residential
End Market Exposure1,2
Industry Leadership
1 Market positions based on public information and management estimates.
2 LTM based on 4/3/21. Breakdown based on LTM net sales. Adjusted financial metrics used in the presentation are non-GAAP.
Balanced End-Market Exposure
5
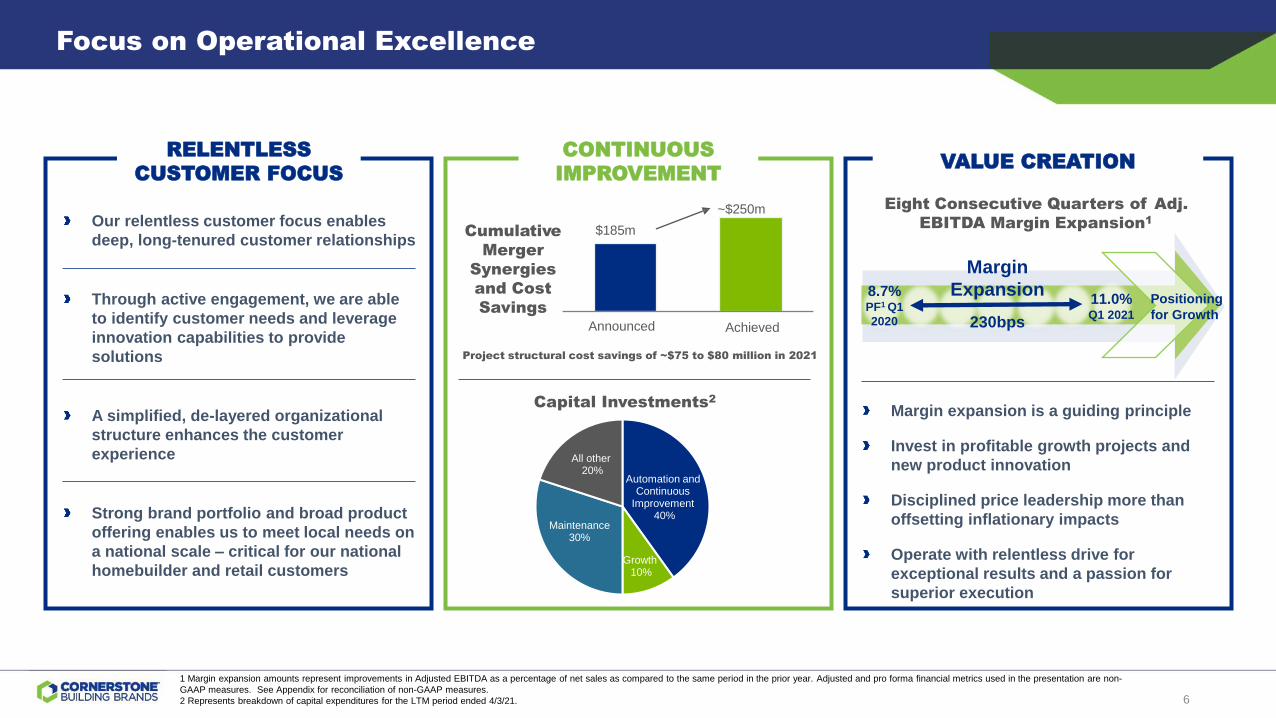
Focus on Operational Excellence
1 Margin expansion amounts represent improvements in Adjusted EBITDA as a percentage of net sales as compared to the same period in the prior year. Adjusted and pro forma financial metrics used in the presentation are non-
GAAP measures. See Appendix for reconciliation of non-GAAP measures.
2 Represents breakdown of capital expenditures for the LTM period ended 4/3/21.
$185m
~$250m
Announced Achieved
Cumulative
Merger
Synergies
and Cost
Savings
Automation and Continuous
Improvement40%
Growth10%
Maintenance30%
All other20%
Capital Investments2
Project structural cost savings of ~$75 to $80 million in 2021
RELENTLESS
CUSTOMER FOCUS
Our relentless customer focus enables
deep, long-tenured customer relationships
Through active engagement, we are able
to identify customer needs and leverage
innovation capabilities to provide
solutions
A simplified, de-layered organizational
structure enhances the customer
experience
Strong brand portfolio and broad product
offering enables us to meet local needs on
a national scale – critical for our national
homebuilder and retail customers
CONTINUOUS
IMPROVEMENTVALUE CREATION
Margin expansion is a guiding principle
Invest in profitable growth projects and
new product innovation
Disciplined price leadership more than
offsetting inflationary impacts
Operate with relentless drive for
exceptional results and a passion for
superior execution
Eight Consecutive Quarters of Adj.
EBITDA Margin Expansion1
8.7%PF1 Q1
2020
11.0%Q1 2021
Margin
Expansion
230bps
Positioning
for Growth
6
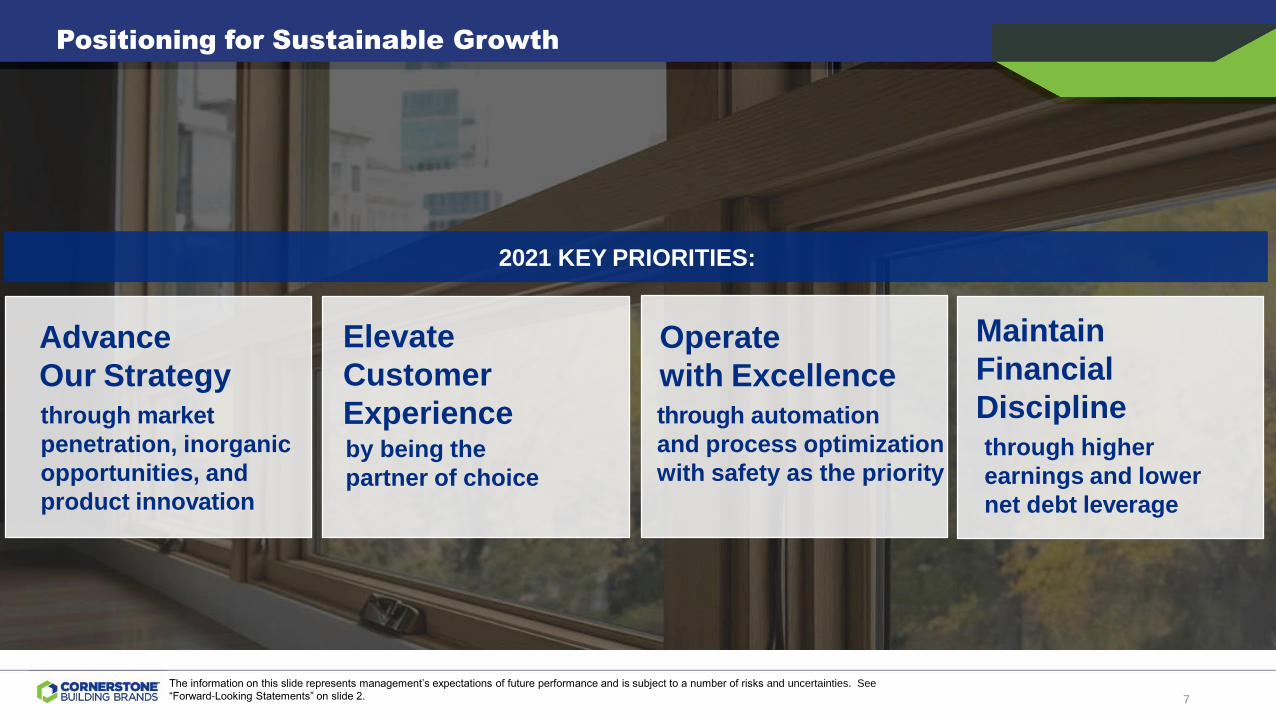
Positioning for Sustainable Growth
2021 KEY PRIORITIES:
Advance
Our Strategythrough market
penetration, inorganic
opportunities, and
product innovation
Elevate
Customer
Experienceby being the
partner of choice
Maintain
Financial
Disciplinethrough higher
earnings and lower
net debt leverage
Operate
with Excellencethrough automation
and process optimization
with safety as the priority
The information on this slide represents management’s expectations of future performance and is subject to a number of risks and uncertainties. See
“Forward-Looking Statements” on slide 2. 7

Investment Highlights
8
Key Investment Highlights
1
2
3
4
5
6
7
Largest Manufacturer of Exterior Building Products in North America
Expansive Portfolio of High-Quality Products with Strong Brand Recognition
Multichannel Distribution Platform Serving a Broad, Long-Tenured Customer Base
Highly Efficient Operating Platform
Diverse End Markets with Strong Fundamentals Support Future Growth
Significant Cash Flow Generation with Proven Ability to Delever
Committed Stewardship to All Stakeholders
9
$4.6
$3.0
$2.7
$2.5
$1.8
$1.8
$1.7
$1.4
$1.3
$1.3
$1.0
$1.0
$0.9
$0.9
$0.9
$0.6
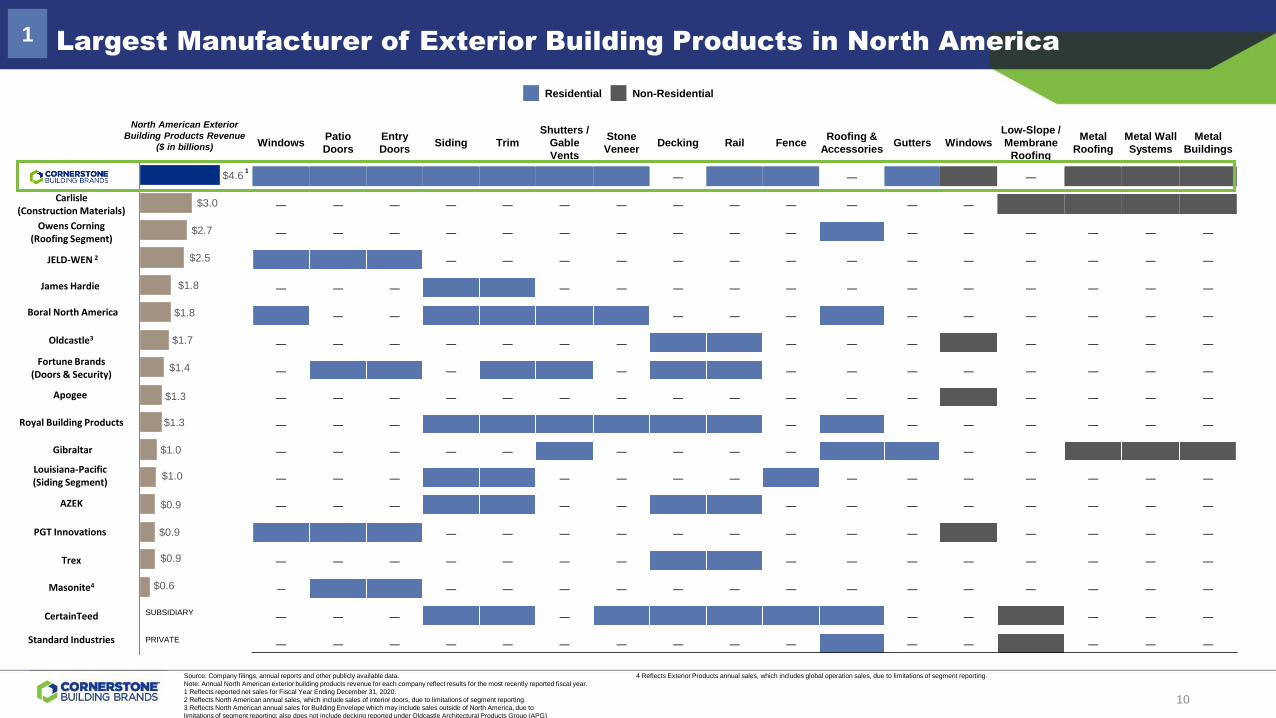
Largest Manufacturer of Exterior Building Products in North America
Source: Company filings, annual reports and other publicly available data.
Note: Annual North American exterior building products revenue for each company reflect results for the most recently reported fiscal year.
1 Reflects reported net sales for Fiscal Year Ending December 31, 2020.
2 Reflects North American annual sales, which include sales of interior doors, due to limitations of segment reporting.
3 Reflects North American annual sales for Building Envelope which may include sales outside of North America, due to
limitations of segment reporting; also does not include decking reported under Oldcastle Architectural Products Group (APG)
4 Reflects Exterior Products annual sales, which includes global operation sales, due to limitations of segment reporting.
1
North American Exterior
Building Products Revenue
($ in billions)
Residential Non-Residential
SUBSIDIARY
PRIVATE
1
Carlisle (Construction Materials)
Owens Corning(Roofing Segment)
JELD-WEN 2
CertainTeed
Boral North America
Royal Building Products
James Hardie
Oldcastle3
Fortune Brands(Doors & Security)
Apogee
Gibraltar
Louisiana-Pacific(Siding Segment)
AZEK
Trex
PGT Innovations
Masonite4
Standard Industries
WindowsPatio
Doors
Entry
DoorsSiding Trim
Shutters /
Gable
Vents
Stone
VeneerDecking Rail Fence
Roofing &
AccessoriesGutters Windows
Low-Slope /
Membrane
Roofing
Metal
Roofing
Metal Wall
Systems
Metal
Buildings
― ― ―
― ― ― ― ― ― ― ― ― ― ― ― ―
― ― ― ― ― ― ― ― ― ― ― ― ― ― ― ―
― ― ― ― ― ― ― ― ― ― ― ― ― ―
― ― ― ― ― ― ― ― ― ― ― ― ― ― ―
― ― ― ― ― ― ― ― ― ― ―
― ― ― ― ― ― ― ― ― ― ― ― ― ―
― ― ― ― ― ― ― ― ― ― ―
― ― ― ― ― ― ― ― ― ― ― ― ― ― ― ―
― ― ― ― ― ― ― ― ― ―
― ― ― ― ― ― ― ― ― ― ―
― ― ― ― ― ― ― ― ― ― ― ― ― ―
― ― ― ― ― ― ― ― ― ― ― ― ―
― ― ― ― ― ― ― ― ― ― ― ― ―
― ― ― ― ― ― ― ― ― ― ― ― ― ― ―
― ― ― ― ― ― ― ― ― ― ― ― ― ― ―
― ― ― ― ― ― ― ― ―
― ― ― ― ― ― ― ― ― ― ― ― ― ― ―
10
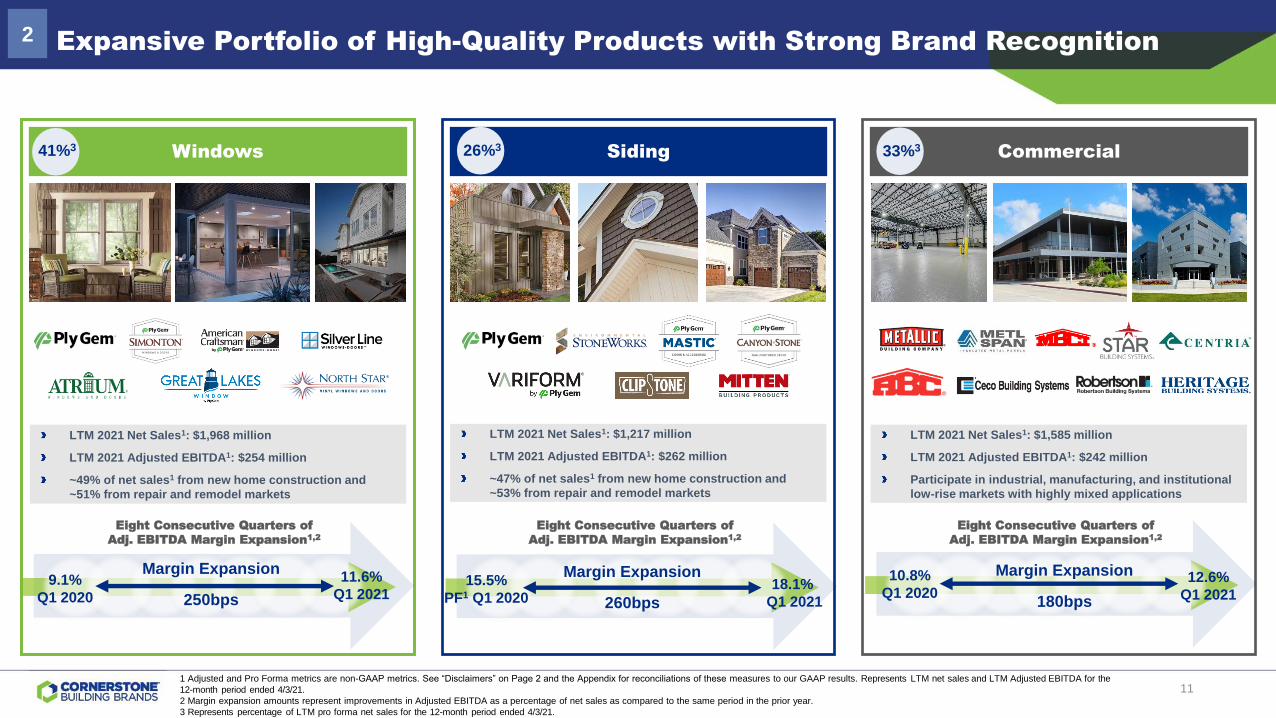
Expansive Portfolio of High-Quality Products with Strong Brand Recognition2
Windows Siding Commercial
LTM 2021 Net Sales1: $1,968 million
LTM 2021 Adjusted EBITDA1: $254 million
~49% of net sales1 from new home construction and
~51% from repair and remodel markets
LTM 2021 Net Sales1: $1,217 million
LTM 2021 Adjusted EBITDA1: $262 million
~47% of net sales1 from new home construction and
~53% from repair and remodel markets
LTM 2021 Net Sales1: $1,585 million
LTM 2021 Adjusted EBITDA1: $242 million
Participate in industrial, manufacturing, and institutional
low-rise markets with highly mixed applications
Eight Consecutive Quarters of
Adj. EBITDA Margin Expansion1,2
Eight Consecutive Quarters of
Adj. EBITDA Margin Expansion1,2
Eight Consecutive Quarters of
Adj. EBITDA Margin Expansion1,2
11.6%
Q1 2021
Margin Expansion
250bps
9.1%
Q1 2020
Margin Expansion
260bps
18.1%
Q1 2021
15.5%
PF1 Q1 2020
10.8%
Q1 2020
Margin Expansion
180bps
12.6%
Q1 2021
41%3 26%3 33%3
1 Adjusted and Pro Forma metrics are non-GAAP metrics. See “Disclaimers” on Page 2 and the Appendix for reconciliations of these measures to our GAAP results. Represents LTM net sales and LTM Adjusted EBITDA for the
12-month period ended 4/3/21.
2 Margin expansion amounts represent improvements in Adjusted EBITDA as a percentage of net sales as compared to the same period in the prior year.
3 Represents percentage of LTM pro forma net sales for the 12-month period ended 4/3/21.
11
Expansive Footprint of
Manufacturing and Distribution Facilities
Strong Customer Relationships
Across Diverse Channel Mix
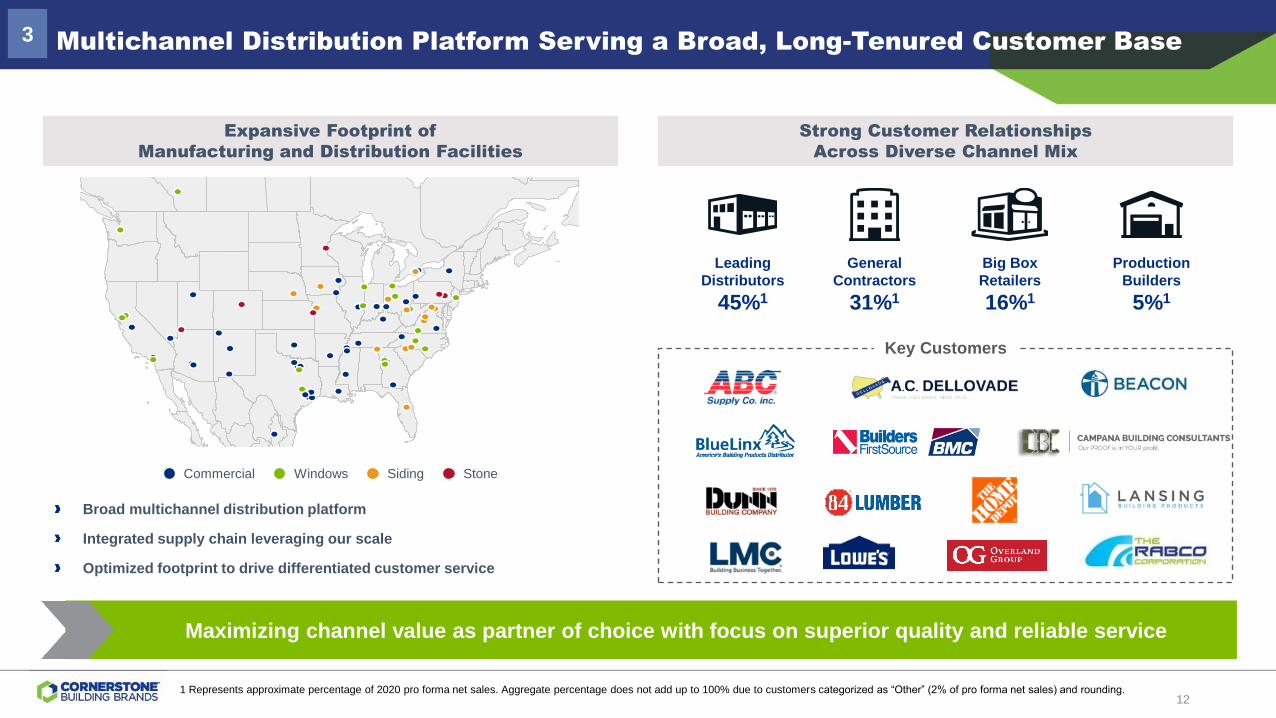
Multichannel Distribution Platform Serving a Broad, Long-Tenured Customer Base3
Broad multichannel distribution platform
Integrated supply chain leveraging our scale
Optimized footprint to drive differentiated customer service
Big Box
Retailers
16%1
Leading
Distributors
45%1
Production
Builders
5%1
General
Contractors
31%1
1 Represents approximate percentage of 2020 pro forma net sales. Aggregate percentage does not add up to 100% due to customers categorized as “Other” (2% of pro forma net sales) and rounding.
Maximizing channel value as partner of choice with focus on superior quality and reliable service
Key Customers⚫⚫⚫⚫⚫⚫⚫⚫⚫⚫⚫⚫⚫⚫⚫⚫⚫⚫⚫⚫⚫⚫⚫⚫⚫⚫⚫⚫⚫⚫⚫⚫⚫⚫⚫⚫⚫⚫⚫⚫⚫⚫⚫⚫⚫⚫⚫⚫⚫
⚫⚫⚫⚫⚫⚫⚫⚫⚫⚫⚫⚫⚫⚫⚫⚫⚫⚫⚫⚫⚫⚫⚫⚫⚫⚫⚫⚫⚫⚫⚫⚫⚫⚫⚫⚫⚫⚫⚫⚫⚫⚫⚫⚫⚫⚫⚫⚫⚫
⚫⚫⚫⚫⚫⚫⚫⚫⚫⚫⚫⚫⚫⚫⚫⚫⚫⚫⚫⚫⚫⚫⚫⚫⚫⚫⚫⚫⚫⚫⚫⚫⚫⚫⚫⚫⚫⚫⚫⚫⚫⚫⚫⚫⚫⚫⚫⚫⚫
⚫⚫⚫⚫⚫⚫⚫⚫⚫⚫⚫⚫⚫⚫⚫⚫⚫⚫⚫⚫⚫⚫⚫⚫⚫⚫⚫⚫⚫⚫⚫⚫⚫⚫⚫⚫⚫⚫⚫⚫⚫⚫⚫⚫⚫⚫⚫⚫⚫
⚫⚫⚫⚫⚫⚫⚫⚫⚫⚫⚫⚫⚫⚫⚫⚫⚫⚫⚫⚫⚫⚫⚫⚫⚫⚫⚫⚫⚫⚫⚫⚫⚫⚫⚫⚫⚫⚫⚫⚫⚫⚫⚫⚫⚫⚫⚫⚫⚫⚫⚫⚫⚫⚫⚫⚫⚫⚫⚫⚫⚫⚫⚫⚫⚫⚫⚫⚫⚫⚫⚫⚫⚫⚫⚫⚫⚫⚫⚫⚫⚫⚫⚫⚫⚫⚫⚫⚫⚫⚫⚫⚫⚫⚫⚫⚫⚫⚫
⚫⚫⚫⚫⚫⚫⚫⚫⚫⚫⚫⚫⚫⚫⚫⚫⚫⚫⚫⚫⚫⚫⚫⚫⚫⚫⚫⚫⚫⚫⚫⚫⚫⚫⚫⚫⚫⚫⚫⚫⚫⚫⚫⚫⚫⚫⚫⚫⚫
⚫⚫⚫⚫⚫⚫⚫⚫⚫⚫⚫⚫⚫⚫⚫⚫⚫⚫⚫⚫⚫⚫⚫⚫⚫⚫⚫⚫⚫⚫⚫⚫⚫⚫⚫⚫⚫⚫⚫⚫⚫⚫⚫⚫⚫⚫⚫⚫⚫
⚫⚫⚫⚫⚫⚫⚫⚫⚫⚫⚫⚫⚫⚫⚫⚫⚫⚫⚫⚫⚫⚫⚫⚫⚫⚫⚫⚫⚫⚫⚫⚫⚫⚫⚫⚫⚫⚫⚫⚫⚫⚫⚫⚫⚫⚫⚫⚫⚫
⚫⚫⚫⚫⚫⚫⚫⚫⚫⚫⚫⚫⚫⚫⚫⚫⚫⚫⚫⚫⚫⚫⚫⚫⚫⚫⚫⚫⚫⚫⚫⚫⚫⚫⚫⚫⚫⚫⚫⚫⚫⚫⚫⚫⚫⚫⚫⚫⚫
⚫⚫⚫⚫⚫⚫⚫⚫⚫⚫⚫⚫⚫⚫⚫⚫⚫⚫⚫⚫⚫⚫⚫⚫⚫⚫⚫⚫⚫⚫⚫⚫⚫⚫⚫⚫⚫⚫⚫⚫⚫⚫⚫⚫⚫⚫⚫⚫⚫
⚫⚫⚫⚫⚫⚫⚫⚫⚫⚫⚫⚫⚫⚫⚫⚫⚫⚫⚫⚫⚫⚫⚫⚫⚫⚫⚫⚫⚫⚫⚫⚫⚫⚫⚫⚫⚫⚫⚫⚫⚫⚫⚫⚫⚫⚫⚫⚫⚫
⚫⚫⚫⚫⚫⚫⚫⚫⚫⚫⚫⚫⚫⚫⚫⚫⚫⚫⚫⚫⚫⚫⚫⚫⚫⚫⚫⚫⚫⚫⚫⚫⚫⚫⚫⚫⚫⚫⚫⚫⚫⚫⚫⚫⚫⚫⚫⚫⚫
⚫⚫⚫⚫⚫⚫⚫⚫⚫⚫⚫⚫⚫⚫⚫⚫⚫⚫⚫⚫⚫⚫⚫⚫⚫⚫⚫⚫⚫⚫⚫⚫⚫⚫⚫⚫⚫⚫⚫⚫⚫⚫⚫⚫⚫⚫⚫⚫⚫
⚫⚫⚫⚫⚫⚫⚫⚫⚫⚫⚫⚫⚫⚫⚫⚫⚫⚫⚫⚫⚫⚫⚫⚫⚫⚫⚫⚫⚫⚫⚫⚫⚫⚫⚫⚫⚫⚫⚫⚫⚫⚫⚫⚫⚫⚫⚫⚫⚫
⚫⚫⚫⚫⚫⚫⚫⚫⚫⚫⚫⚫⚫⚫⚫⚫⚫⚫⚫⚫⚫⚫⚫⚫⚫⚫⚫⚫⚫⚫⚫⚫⚫⚫⚫⚫⚫⚫⚫⚫⚫⚫⚫⚫⚫⚫⚫⚫⚫
⚫⚫⚫⚫⚫⚫⚫⚫⚫⚫⚫⚫⚫⚫⚫⚫⚫⚫⚫⚫⚫⚫⚫⚫⚫⚫⚫⚫⚫⚫⚫⚫⚫⚫⚫⚫⚫⚫⚫⚫⚫⚫⚫⚫⚫⚫⚫⚫⚫
⚫⚫⚫⚫⚫⚫⚫⚫⚫⚫⚫⚫⚫⚫⚫⚫⚫⚫⚫⚫⚫⚫⚫⚫⚫⚫⚫⚫⚫⚫⚫⚫⚫⚫⚫⚫⚫⚫⚫⚫⚫⚫⚫⚫⚫⚫⚫⚫⚫
⚫⚫⚫⚫⚫⚫⚫⚫⚫⚫⚫⚫⚫⚫⚫⚫⚫⚫⚫⚫⚫⚫⚫⚫⚫⚫⚫⚫⚫⚫⚫⚫⚫⚫⚫⚫⚫⚫⚫⚫⚫⚫⚫⚫⚫⚫⚫⚫⚫
⚫⚫⚫⚫⚫⚫⚫⚫⚫⚫⚫⚫⚫⚫⚫⚫⚫⚫⚫⚫⚫⚫⚫⚫⚫⚫⚫⚫⚫⚫⚫⚫⚫⚫⚫⚫⚫⚫⚫⚫⚫⚫⚫⚫⚫⚫⚫⚫⚫
⚫⚫⚫⚫⚫⚫⚫⚫⚫⚫⚫⚫⚫⚫⚫⚫⚫⚫⚫⚫⚫⚫⚫⚫⚫⚫⚫⚫⚫⚫⚫⚫⚫⚫⚫⚫⚫⚫⚫⚫⚫⚫⚫⚫⚫⚫⚫⚫⚫
⚫⚫⚫⚫⚫⚫⚫⚫⚫⚫⚫⚫⚫⚫⚫⚫⚫⚫⚫⚫⚫⚫⚫⚫⚫⚫⚫⚫⚫⚫⚫⚫⚫⚫⚫⚫⚫⚫⚫⚫⚫⚫⚫⚫⚫⚫⚫⚫⚫
⚫⚫⚫⚫⚫⚫⚫⚫⚫⚫⚫⚫⚫⚫⚫⚫⚫⚫⚫⚫⚫⚫⚫⚫⚫⚫⚫⚫⚫⚫⚫⚫⚫⚫⚫⚫⚫⚫⚫⚫⚫⚫⚫⚫⚫⚫⚫⚫⚫
⚫⚫⚫⚫⚫⚫⚫⚫⚫⚫⚫⚫⚫⚫⚫⚫⚫⚫⚫⚫⚫⚫⚫⚫⚫⚫⚫⚫⚫⚫⚫⚫⚫⚫⚫⚫⚫⚫⚫⚫⚫⚫⚫⚫⚫⚫⚫⚫⚫
⚫⚫⚫⚫⚫⚫⚫⚫⚫⚫⚫⚫⚫⚫⚫⚫⚫⚫⚫⚫⚫⚫⚫⚫⚫⚫⚫⚫⚫⚫⚫⚫⚫⚫⚫⚫⚫⚫⚫⚫⚫⚫⚫⚫⚫⚫⚫⚫⚫
⚫⚫⚫⚫⚫⚫⚫⚫⚫⚫⚫⚫⚫⚫⚫⚫⚫⚫⚫⚫⚫⚫⚫⚫⚫⚫⚫⚫⚫⚫⚫⚫⚫⚫⚫⚫⚫⚫⚫⚫⚫⚫⚫⚫⚫⚫⚫⚫⚫
⚫⚫⚫⚫⚫⚫⚫⚫⚫⚫⚫⚫⚫⚫⚫⚫⚫⚫⚫⚫⚫⚫⚫⚫⚫⚫⚫⚫⚫⚫⚫⚫⚫⚫⚫⚫⚫⚫⚫⚫⚫⚫⚫⚫⚫⚫⚫⚫⚫
⚫⚫⚫⚫⚫⚫⚫⚫⚫⚫⚫⚫⚫⚫⚫⚫⚫⚫⚫⚫⚫⚫⚫⚫⚫⚫⚫⚫⚫⚫⚫⚫⚫⚫⚫⚫⚫⚫⚫⚫⚫⚫⚫⚫⚫⚫⚫⚫⚫
⚫⚫⚫⚫⚫⚫⚫⚫⚫⚫⚫⚫⚫⚫⚫⚫⚫⚫⚫⚫⚫⚫⚫⚫⚫⚫⚫⚫⚫⚫⚫⚫⚫⚫⚫⚫⚫⚫⚫⚫⚫⚫⚫⚫⚫⚫⚫⚫⚫
⚫⚫⚫⚫⚫⚫⚫⚫⚫⚫⚫⚫⚫⚫⚫⚫⚫⚫⚫⚫⚫⚫⚫⚫⚫⚫⚫⚫⚫⚫⚫⚫⚫⚫⚫⚫⚫⚫⚫⚫⚫⚫⚫⚫⚫⚫⚫⚫⚫
⚫⚫⚫⚫⚫⚫⚫⚫⚫⚫⚫⚫⚫⚫⚫⚫⚫⚫⚫⚫⚫⚫⚫⚫⚫⚫⚫⚫⚫⚫⚫⚫⚫⚫⚫⚫⚫⚫⚫⚫⚫⚫⚫⚫⚫⚫⚫⚫⚫
⚫⚫⚫⚫⚫⚫⚫⚫⚫⚫⚫⚫⚫⚫⚫⚫⚫⚫⚫⚫⚫⚫⚫⚫⚫⚫⚫⚫⚫⚫⚫⚫⚫⚫⚫⚫⚫⚫⚫⚫⚫⚫⚫⚫⚫⚫⚫⚫⚫⚫⚫⚫⚫⚫⚫⚫⚫⚫⚫⚫⚫⚫⚫⚫⚫⚫⚫⚫⚫⚫⚫⚫⚫⚫⚫⚫⚫⚫⚫⚫⚫⚫⚫⚫⚫⚫⚫⚫⚫⚫⚫⚫⚫⚫⚫⚫⚫⚫
⚫⚫⚫⚫⚫⚫⚫⚫⚫⚫⚫⚫⚫⚫⚫⚫⚫⚫⚫⚫⚫⚫⚫⚫⚫⚫⚫⚫⚫⚫⚫⚫⚫⚫⚫⚫⚫⚫⚫⚫⚫⚫⚫⚫⚫⚫⚫⚫⚫⚫⚫⚫⚫⚫⚫⚫⚫⚫⚫⚫⚫⚫⚫⚫⚫⚫⚫⚫⚫⚫⚫⚫⚫⚫⚫⚫⚫⚫⚫⚫⚫⚫⚫⚫⚫⚫⚫⚫⚫⚫⚫⚫⚫⚫⚫⚫⚫⚫
⚫⚫⚫⚫⚫⚫⚫⚫⚫⚫⚫⚫⚫⚫⚫⚫⚫⚫⚫⚫⚫⚫⚫⚫⚫⚫⚫⚫⚫⚫⚫⚫⚫⚫⚫⚫⚫⚫⚫⚫⚫⚫⚫⚫⚫⚫⚫⚫⚫
⚫⚫⚫⚫⚫⚫⚫⚫⚫⚫⚫⚫⚫⚫⚫⚫⚫⚫⚫⚫⚫⚫⚫⚫⚫⚫⚫⚫⚫⚫⚫⚫⚫⚫⚫⚫⚫⚫⚫⚫⚫⚫⚫⚫⚫⚫⚫⚫⚫
⚫⚫⚫⚫⚫⚫⚫⚫⚫⚫⚫⚫⚫⚫⚫⚫⚫⚫⚫⚫⚫⚫⚫⚫⚫⚫⚫⚫⚫⚫⚫⚫⚫⚫⚫⚫⚫⚫⚫⚫⚫⚫⚫⚫⚫⚫⚫⚫⚫⚫⚫⚫⚫⚫⚫⚫⚫⚫⚫⚫⚫⚫⚫⚫⚫⚫⚫⚫⚫⚫⚫⚫⚫⚫⚫⚫⚫⚫⚫⚫⚫⚫⚫⚫⚫⚫⚫⚫⚫⚫⚫⚫⚫⚫⚫⚫⚫⚫
⚫⚫⚫⚫⚫⚫⚫⚫⚫⚫⚫⚫⚫⚫⚫⚫⚫⚫⚫⚫⚫⚫⚫⚫⚫⚫⚫⚫⚫⚫⚫⚫⚫⚫⚫⚫⚫⚫⚫⚫⚫⚫⚫⚫⚫⚫⚫⚫⚫
⚫⚫⚫⚫⚫⚫⚫⚫⚫⚫⚫⚫⚫⚫⚫⚫⚫⚫⚫⚫⚫⚫⚫⚫⚫⚫⚫⚫⚫⚫⚫⚫⚫⚫⚫⚫⚫⚫⚫⚫⚫⚫⚫⚫⚫⚫⚫⚫⚫
⚫⚫⚫⚫⚫⚫⚫⚫⚫⚫⚫⚫⚫⚫⚫⚫⚫⚫⚫⚫⚫⚫⚫⚫⚫⚫⚫⚫⚫⚫⚫⚫⚫⚫⚫⚫⚫⚫⚫⚫⚫⚫⚫⚫⚫⚫⚫⚫⚫⚫⚫⚫⚫⚫⚫⚫⚫⚫⚫⚫⚫⚫⚫⚫⚫⚫⚫⚫⚫⚫⚫⚫⚫⚫⚫⚫⚫⚫⚫⚫⚫⚫⚫⚫⚫⚫⚫⚫⚫⚫⚫⚫⚫⚫⚫⚫⚫⚫
⚫⚫⚫⚫⚫⚫⚫⚫⚫⚫⚫⚫⚫⚫⚫⚫⚫⚫⚫⚫⚫⚫⚫⚫⚫⚫⚫⚫⚫⚫⚫⚫⚫⚫⚫⚫⚫⚫⚫⚫⚫⚫⚫⚫⚫⚫⚫⚫⚫⚫⚫⚫⚫⚫⚫⚫⚫⚫⚫⚫⚫⚫⚫⚫⚫⚫⚫⚫⚫⚫⚫⚫⚫⚫⚫⚫⚫⚫⚫⚫⚫⚫⚫⚫⚫⚫⚫⚫⚫⚫⚫⚫⚫⚫⚫⚫⚫⚫⚫⚫⚫⚫⚫⚫⚫⚫⚫⚫⚫⚫⚫⚫⚫⚫⚫⚫⚫⚫⚫⚫⚫⚫⚫⚫⚫⚫⚫⚫⚫⚫⚫⚫⚫⚫⚫⚫⚫⚫⚫⚫⚫⚫⚫⚫⚫⚫⚫
⚫⚫⚫⚫⚫⚫⚫⚫⚫⚫⚫⚫⚫⚫⚫⚫⚫⚫⚫⚫⚫⚫⚫⚫⚫⚫⚫⚫⚫⚫⚫⚫⚫⚫⚫⚫⚫⚫⚫⚫⚫⚫⚫⚫⚫⚫⚫⚫⚫
⚫⚫⚫⚫⚫⚫⚫⚫⚫⚫⚫⚫⚫⚫⚫⚫⚫⚫⚫⚫⚫⚫⚫⚫⚫⚫⚫⚫⚫⚫⚫⚫⚫⚫⚫⚫⚫⚫⚫⚫⚫⚫⚫⚫⚫⚫⚫⚫⚫
⚫⚫⚫⚫⚫⚫⚫⚫⚫⚫⚫⚫⚫⚫⚫⚫⚫⚫⚫⚫⚫⚫⚫⚫⚫⚫⚫⚫⚫⚫⚫⚫⚫⚫⚫⚫⚫⚫⚫⚫⚫⚫⚫⚫⚫⚫⚫⚫⚫⚫⚫⚫⚫⚫⚫⚫⚫⚫⚫⚫⚫⚫⚫⚫⚫⚫⚫⚫⚫⚫⚫⚫⚫⚫⚫⚫⚫⚫⚫⚫⚫⚫⚫⚫⚫⚫⚫⚫⚫⚫⚫⚫⚫⚫⚫⚫⚫⚫ ⚫⚫⚫⚫⚫⚫⚫⚫⚫⚫⚫⚫⚫⚫⚫⚫⚫⚫⚫⚫⚫⚫⚫⚫⚫⚫⚫⚫⚫⚫⚫⚫⚫⚫⚫⚫⚫⚫⚫⚫⚫⚫⚫⚫⚫⚫⚫⚫⚫
⚫⚫⚫⚫⚫⚫⚫⚫⚫⚫⚫⚫⚫⚫⚫⚫⚫⚫⚫⚫⚫⚫⚫⚫⚫⚫⚫⚫⚫⚫⚫⚫⚫⚫⚫⚫⚫⚫⚫⚫⚫⚫⚫⚫⚫⚫⚫⚫⚫
⚫⚫⚫⚫⚫⚫⚫⚫⚫⚫⚫⚫⚫⚫⚫⚫⚫⚫⚫⚫⚫⚫⚫⚫⚫⚫⚫⚫⚫⚫⚫⚫⚫⚫⚫⚫⚫⚫⚫⚫⚫⚫⚫⚫⚫⚫⚫⚫⚫
⚫⚫⚫⚫⚫⚫⚫⚫⚫⚫⚫⚫⚫⚫⚫⚫⚫⚫⚫⚫⚫⚫⚫⚫⚫⚫⚫⚫⚫⚫⚫⚫⚫⚫⚫⚫⚫⚫⚫⚫⚫⚫⚫⚫⚫⚫⚫⚫⚫
⚫⚫⚫⚫⚫⚫⚫⚫⚫⚫⚫⚫⚫⚫⚫⚫⚫⚫⚫⚫⚫⚫⚫⚫⚫⚫⚫⚫⚫⚫⚫⚫⚫⚫⚫⚫⚫⚫⚫⚫⚫⚫⚫⚫⚫⚫⚫⚫⚫
⚫⚫⚫⚫⚫⚫⚫⚫⚫⚫⚫⚫⚫⚫⚫⚫⚫⚫⚫⚫⚫⚫⚫⚫⚫⚫⚫⚫⚫⚫⚫⚫⚫⚫⚫⚫⚫⚫⚫⚫⚫⚫⚫⚫⚫⚫⚫⚫⚫
⚫⚫⚫⚫⚫⚫⚫⚫⚫⚫⚫⚫⚫⚫⚫⚫⚫⚫⚫⚫⚫⚫⚫⚫⚫⚫⚫⚫⚫⚫⚫⚫⚫⚫⚫⚫⚫⚫⚫⚫⚫⚫⚫⚫⚫⚫⚫⚫⚫
⚫⚫⚫⚫⚫⚫⚫⚫⚫⚫⚫⚫⚫⚫⚫⚫⚫⚫⚫⚫⚫⚫⚫⚫⚫⚫⚫⚫⚫⚫⚫⚫⚫⚫⚫⚫⚫⚫⚫⚫⚫⚫⚫⚫⚫⚫⚫⚫⚫⚫⚫⚫⚫⚫⚫⚫⚫⚫⚫⚫⚫⚫⚫⚫⚫⚫⚫⚫⚫⚫⚫⚫⚫⚫⚫⚫⚫⚫⚫⚫⚫⚫⚫⚫⚫⚫⚫⚫⚫⚫⚫⚫⚫⚫⚫⚫⚫⚫
⚫⚫⚫⚫⚫⚫⚫⚫⚫⚫⚫⚫⚫⚫⚫⚫⚫⚫⚫⚫⚫⚫⚫⚫⚫⚫⚫⚫⚫⚫⚫⚫⚫⚫⚫⚫⚫⚫⚫⚫⚫⚫⚫⚫⚫⚫⚫⚫⚫
⚫⚫⚫⚫⚫⚫⚫⚫⚫⚫⚫⚫⚫⚫⚫⚫⚫⚫⚫⚫⚫⚫⚫⚫⚫⚫⚫⚫⚫⚫⚫⚫⚫⚫⚫⚫⚫⚫⚫⚫⚫⚫⚫⚫⚫⚫⚫⚫⚫
⚫⚫⚫⚫⚫⚫⚫⚫⚫⚫⚫⚫⚫⚫⚫⚫⚫⚫⚫⚫⚫⚫⚫⚫⚫⚫⚫⚫⚫⚫⚫⚫⚫⚫⚫⚫⚫⚫⚫⚫⚫⚫⚫⚫⚫⚫⚫⚫⚫ ⚫⚫⚫⚫⚫⚫⚫⚫⚫⚫⚫⚫⚫⚫⚫⚫⚫⚫⚫⚫⚫⚫⚫⚫⚫⚫⚫⚫⚫⚫⚫⚫⚫⚫⚫⚫⚫⚫⚫⚫⚫⚫⚫⚫⚫⚫⚫⚫⚫
⚫⚫⚫⚫⚫⚫⚫⚫⚫⚫⚫⚫⚫⚫⚫⚫⚫⚫⚫⚫⚫⚫⚫⚫⚫⚫⚫⚫⚫⚫⚫⚫⚫⚫⚫⚫⚫⚫⚫⚫⚫⚫⚫⚫⚫⚫⚫⚫⚫
⚫⚫⚫⚫⚫⚫⚫⚫⚫⚫⚫⚫⚫⚫⚫⚫⚫⚫⚫⚫⚫⚫⚫⚫⚫⚫⚫⚫⚫⚫⚫⚫⚫⚫⚫⚫⚫⚫⚫⚫⚫⚫⚫⚫⚫⚫⚫⚫⚫
⚫⚫⚫⚫⚫⚫⚫⚫⚫⚫⚫⚫⚫⚫⚫⚫⚫⚫⚫⚫⚫⚫⚫⚫⚫⚫⚫⚫⚫⚫⚫⚫⚫⚫⚫⚫⚫⚫⚫⚫⚫⚫⚫⚫⚫⚫⚫⚫⚫⚫⚫⚫⚫⚫⚫⚫⚫⚫⚫⚫⚫⚫⚫⚫⚫⚫⚫⚫⚫⚫⚫⚫⚫⚫⚫⚫⚫⚫⚫⚫⚫⚫⚫⚫⚫⚫⚫⚫⚫⚫⚫⚫⚫⚫⚫⚫⚫⚫
⚫⚫⚫⚫⚫⚫⚫⚫⚫⚫⚫⚫⚫⚫⚫⚫⚫⚫⚫⚫⚫⚫⚫⚫⚫⚫⚫⚫⚫⚫⚫⚫⚫⚫⚫⚫⚫⚫⚫⚫⚫⚫⚫⚫⚫⚫⚫⚫⚫
⚫⚫⚫⚫⚫⚫⚫⚫⚫⚫⚫⚫⚫⚫⚫⚫⚫⚫⚫⚫⚫⚫⚫⚫⚫⚫⚫⚫⚫⚫⚫⚫⚫⚫⚫⚫⚫⚫⚫⚫⚫⚫⚫⚫⚫⚫⚫⚫⚫ ⚫⚫⚫⚫⚫⚫⚫⚫⚫⚫⚫⚫⚫⚫⚫⚫⚫⚫⚫⚫⚫⚫⚫⚫⚫⚫⚫⚫⚫⚫⚫⚫⚫⚫⚫⚫⚫⚫⚫⚫⚫⚫⚫⚫⚫⚫⚫⚫⚫
⚫⚫⚫⚫⚫⚫⚫⚫⚫⚫⚫⚫⚫⚫⚫⚫⚫⚫⚫⚫⚫⚫⚫⚫⚫⚫⚫⚫⚫⚫⚫⚫⚫⚫⚫⚫⚫⚫⚫⚫⚫⚫⚫⚫⚫⚫⚫⚫⚫
⚫⚫⚫⚫⚫⚫⚫⚫⚫⚫⚫⚫⚫⚫⚫⚫⚫⚫⚫⚫⚫⚫⚫⚫⚫⚫⚫⚫⚫⚫⚫⚫⚫⚫⚫⚫⚫⚫⚫⚫⚫⚫⚫⚫⚫⚫⚫⚫⚫
⚫⚫⚫⚫⚫⚫⚫⚫⚫⚫⚫⚫⚫⚫⚫⚫⚫⚫⚫⚫⚫⚫⚫⚫⚫⚫⚫⚫⚫⚫⚫⚫⚫⚫⚫⚫⚫⚫⚫⚫⚫⚫⚫⚫⚫⚫⚫⚫⚫
⚫⚫⚫⚫⚫⚫⚫⚫⚫⚫⚫⚫⚫⚫⚫⚫⚫⚫⚫⚫⚫⚫⚫⚫⚫⚫⚫⚫⚫⚫⚫⚫⚫⚫⚫⚫⚫⚫⚫⚫⚫⚫⚫⚫⚫⚫⚫⚫⚫
⚫⚫⚫⚫⚫⚫⚫⚫⚫⚫⚫⚫⚫⚫⚫⚫⚫⚫⚫⚫⚫⚫⚫⚫⚫⚫⚫⚫⚫⚫⚫⚫⚫⚫⚫⚫⚫⚫⚫⚫⚫⚫⚫⚫⚫⚫⚫⚫⚫
⚫⚫⚫⚫⚫⚫⚫⚫⚫⚫⚫⚫⚫⚫⚫⚫⚫⚫⚫⚫⚫⚫⚫⚫⚫⚫⚫⚫⚫⚫⚫⚫⚫⚫⚫⚫⚫⚫⚫⚫⚫⚫⚫⚫⚫⚫⚫⚫⚫⚫⚫⚫⚫⚫⚫⚫⚫⚫⚫⚫⚫⚫⚫⚫⚫⚫⚫⚫⚫⚫⚫⚫⚫⚫⚫⚫⚫⚫⚫⚫⚫⚫⚫⚫⚫⚫⚫⚫⚫⚫⚫⚫⚫⚫⚫⚫⚫⚫
1335988_11335988_11335988_11335988_11335988_11335988_11335988_11335988_11335988_11335988_11335988_11335988_11335988_11335988_11335988_11335988_11335988_11335988_11335988_11335988_11335988_11335988_11335988_11335988_11335988_11335988_11335988_11335988_11335988_11335988_11335988_11335988_11335988_11335988_11335988_11335988_11335988_11335988_11335988_11335988_11335988_11335988_11335988_11335988_11335988_11335988_11335988_11335988_11335988_1Commercial Windows Siding Stone
12
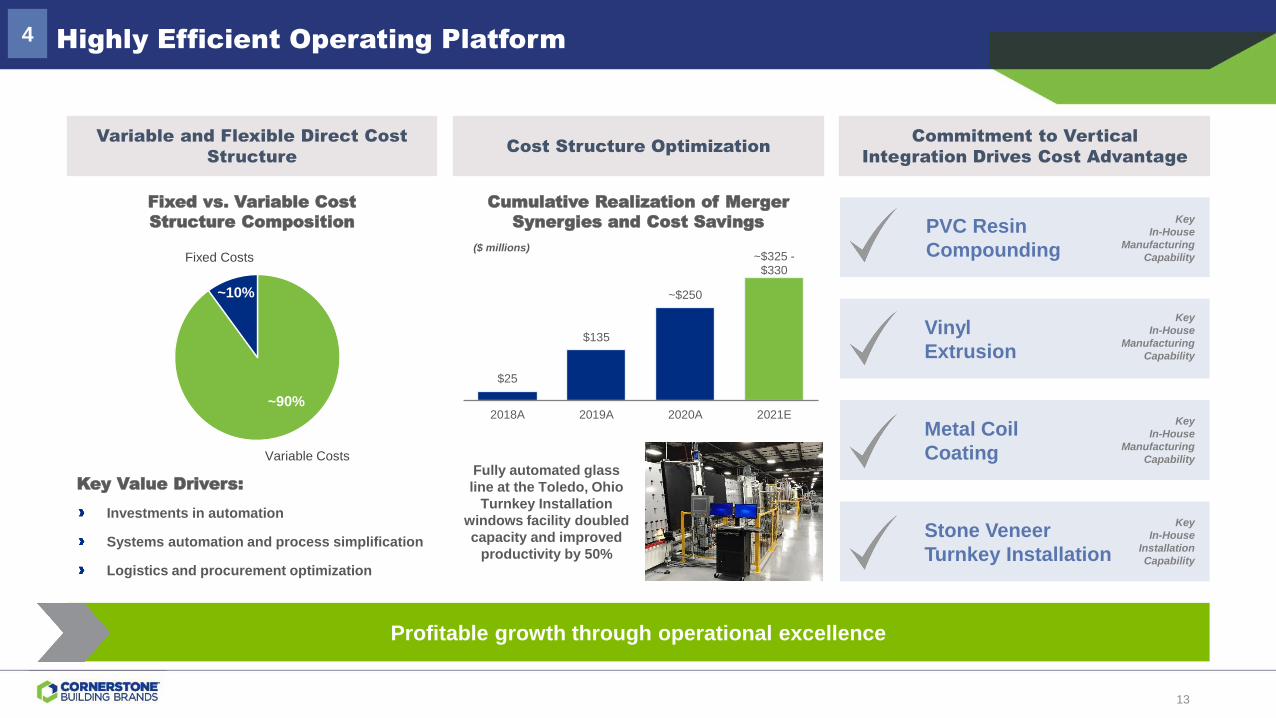
Highly Efficient Operating Platform4
Profitable growth through operational excellence
Cumulative Realization of Merger
Synergies and Cost Savings
Variable and Flexible Direct Cost
StructureCost Structure Optimization
Commitment to Vertical
Integration Drives Cost Advantage
Key
In-House
Manufacturing
Capability
PVC Resin
Compounding
Key
In-House
Manufacturing
Capability
Vinyl
Extrusion
Key
In-House
Manufacturing
Capability
Metal Coil
Coating
($ millions)
Key
In-House
Installation
Capability
Stone Veneer
Turnkey Installation
$25
$135
~$250
~$325 -$330
2018A 2019A 2020A 2021E~90%
~10%
Variable Costs
Fixed Costs
Fixed vs. Variable Cost
Structure Composition
Investments in automation
Systems automation and process simplification
Logistics and procurement optimization
Key Value Drivers:Fully automated glass
line at the Toledo, Ohio
Turnkey Installation
windows facility doubled
capacity and improved
productivity by 50%
13

Diverse End Markets with Strong Fundamentals Support Future Growth5
Source: FRED, US Census Bureau, Statista, Bloomberg, Cornerstone Building Brands and Consensus Estimates
1 Represents percentage of LTM pro forma net sales for the 12-month period ended 12/31/20.
2 Long-term average calculated from 1/1963 to 1/2021.
3 Long-term average calculated from 1990 to 2020.
Months
Supply Of
New Homes
Annual Single-Family New Construction (000s units)
Annual
Household
Formations
Household Debt
Service as % of
Disposable
Personal Income
4.0 months
30% of pro forma Net
Sales1
Single-Family
Residential
New Construction
0
3.1mm
9.1%
Current level
6.0 months2
1.2mm3
11.2%4
Long-run average
Current levelLong-run average
Current levelLong-run average
Single family homes underbuilt
Household formations overtaking housing starts
Better housing affordability due to low mortgage
rates and higher personal income
1,716
1,465
1,046
622
445 471431
535618 648
715782
849 876 888
991
1,118
2005 2006 2007 2008 2009 2010 2011 2012 2013 2014 2015 2016 2017 2018 2019 2020 2021E
10.0% CAGR
Long-term average:
1,0144
4 Long-term average calculated from 1959 to 2020.
14
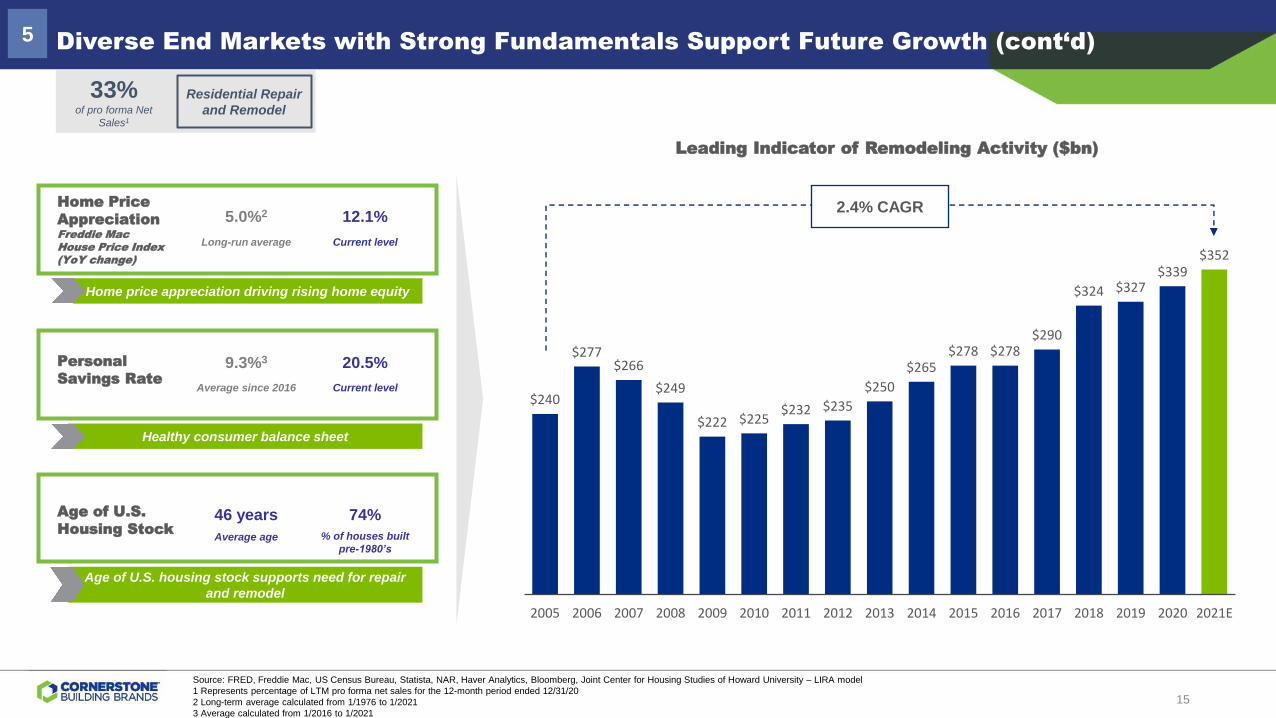
Diverse End Markets with Strong Fundamentals Support Future Growth (cont‘d)5
Leading Indicator of Remodeling Activity ($bn)
Source: FRED, Freddie Mac, US Census Bureau, Statista, NAR, Haver Analytics, Bloomberg, Joint Center for Housing Studies of Howard University – LIRA model
1 Represents percentage of LTM pro forma net sales for the 12-month period ended 12/31/20
2 Long-term average calculated from 1/1976 to 1/2021
3 Average calculated from 1/2016 to 1/2021
33% of pro forma Net
Sales1
Residential Repair
and Remodel
$240
$277$266
$249
$222 $225$232 $235
$250
$265$278 $278
$290
$324 $327$339
$352
2005 2006 2007 2008 2009 2010 2011 2012 2013 2014 2015 2016 2017 2018 2019 2020 2021E
2.4% CAGRHome Price
AppreciationFreddie Mac House Price Index (YoY change)
Personal
Savings Rate
Age of U.S.
Housing Stock
12.1%
0
20.5%
74%
Current level
5.0%2
9.3%3
46 years
Long-run average
Current levelAverage since 2016
% of houses built
pre-1980’s
Home price appreciation driving rising home equity
Healthy consumer balance sheet
Average age
Age of U.S. housing stock supports need for repair
and remodel
15
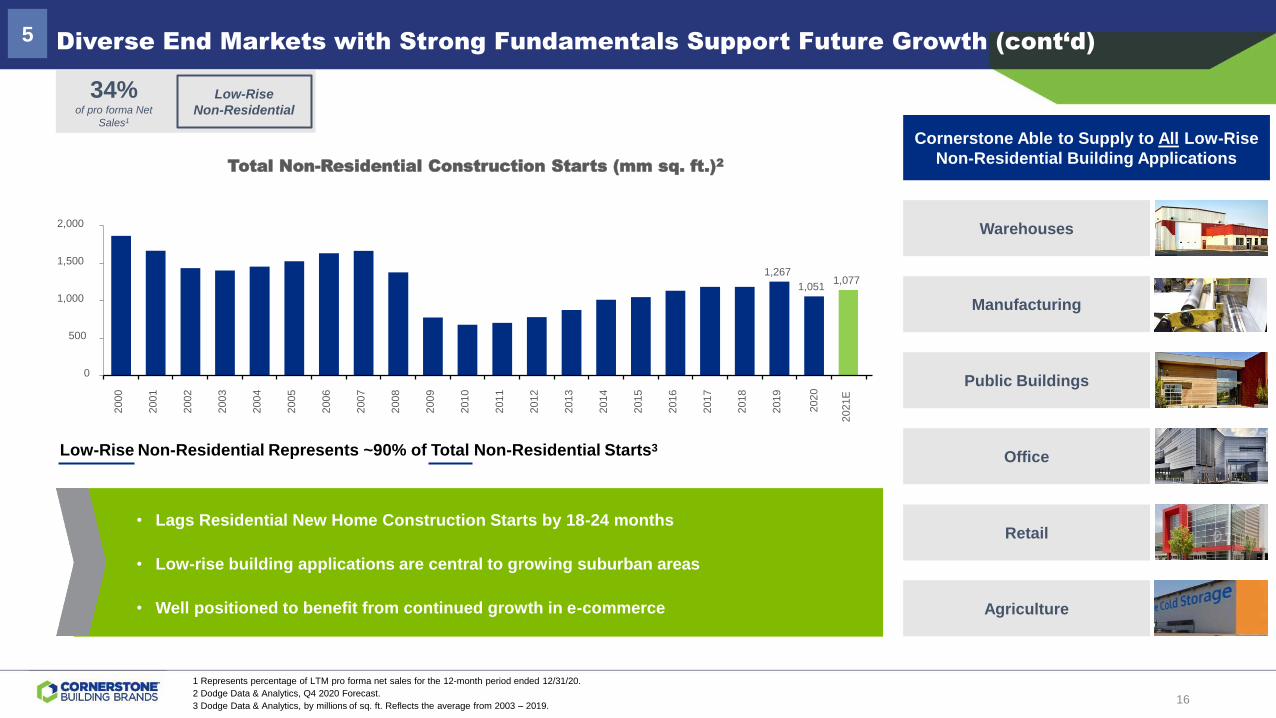
Low-Rise Non-Residential Represents ~90% of Total Non-Residential Starts3
• Lags Residential New Home Construction Starts by 18-24 months
• Low-rise building applications are central to growing suburban areas
• Well positioned to benefit from continued growth in e-commerce
1 Represents percentage of LTM pro forma net sales for the 12-month period ended 12/31/20.
2 Dodge Data & Analytics, Q4 2020 Forecast.
3 Dodge Data & Analytics, by millions of sq. ft. Reflects the average from 2003 – 2019.
Diverse End Markets with Strong Fundamentals Support Future Growth (cont‘d)5
34% of pro forma Net
Sales1
Low-Rise
Non-Residential
Cornerstone Able to Supply to All Low-Rise
Non-Residential Building Applications
Warehouses
Manufacturing
Public Buildings
Office
Retail
Agriculture
Total Non-Residential Construction Starts (mm sq. ft.)2
0
500
1,000
1,500
2,000
2000
2001
2002
2003
2004
2005
2006
2007
2008
2009
2010
2011
2012
2013
2014
2015
2016
2017
2018
2019
2021E
2020
1,267
1,0511,077
16
($30)
$49
$155
$53
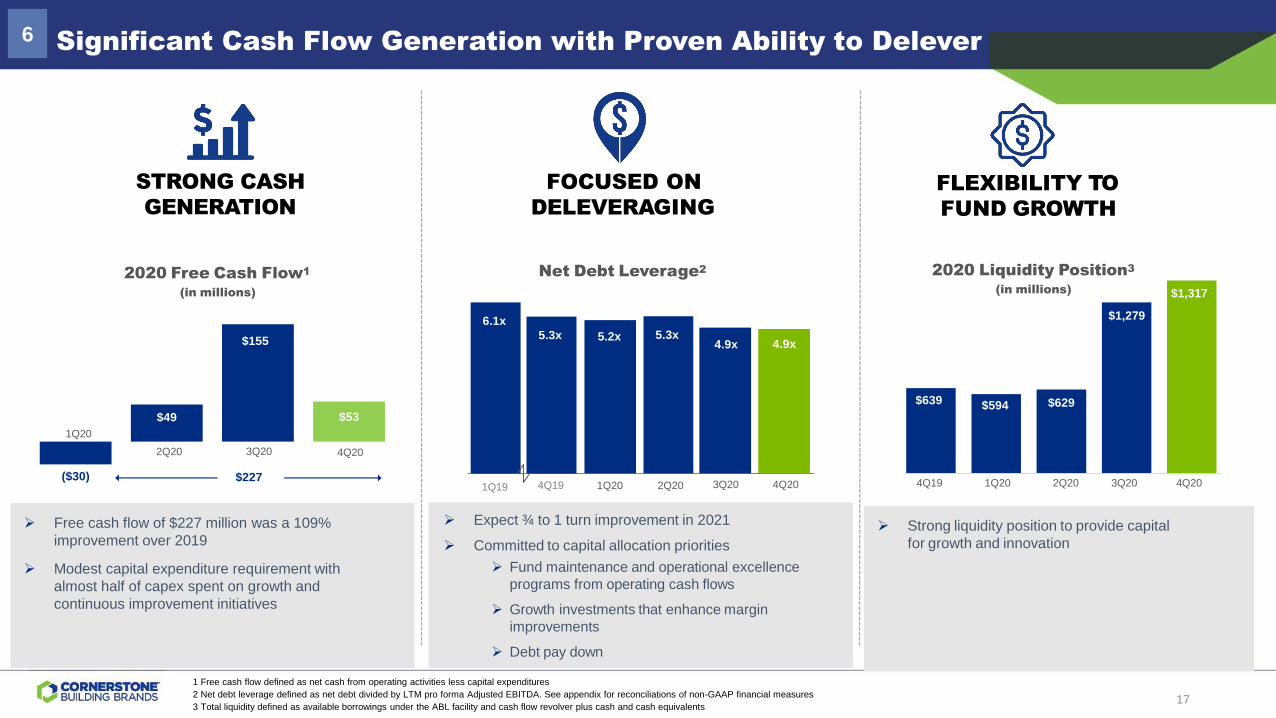
Significant Cash Flow Generation with Proven Ability to Delever6
➢ Free cash flow of $227 million was a 109%
improvement over 2019
➢ Modest capital expenditure requirement with
almost half of capex spent on growth and
continuous improvement initiatives
➢ Strong liquidity position to provide capital
for growth and innovation
➢ Expect ¾ to 1 turn improvement in 2021
➢ Committed to capital allocation priorities
➢ Fund maintenance and operational excellence
programs from operating cash flows
➢ Growth investments that enhance margin
improvements
➢ Debt pay down
1Q20 2Q20 3Q20 4Q20
Net Debt Leverage2
4.9x5.2x
FOCUSED ON
DELEVERAGING
5.3x
4Q19
4.9x5.3x
6.1x
1Q19 4Q19 1Q20 2Q20 3Q20 4Q20
2020 Liquidity Position3
(in millions) $1,317
FLEXIBILITY TO
FUND GROWTH
$1,279
$629$594$639
2020 Free Cash Flow1
(in millions)
STRONG CASH
GENERATION
$227
1Q20
2Q20 3Q20 4Q20
1 Free cash flow defined as net cash from operating activities less capital expenditures
2 Net debt leverage defined as net debt divided by LTM pro forma Adjusted EBITDA. See appendix for reconciliations of non-GAAP financial measures
3 Total liquidity defined as available borrowings under the ABL facility and cash flow revolver plus cash and cash equivalents17
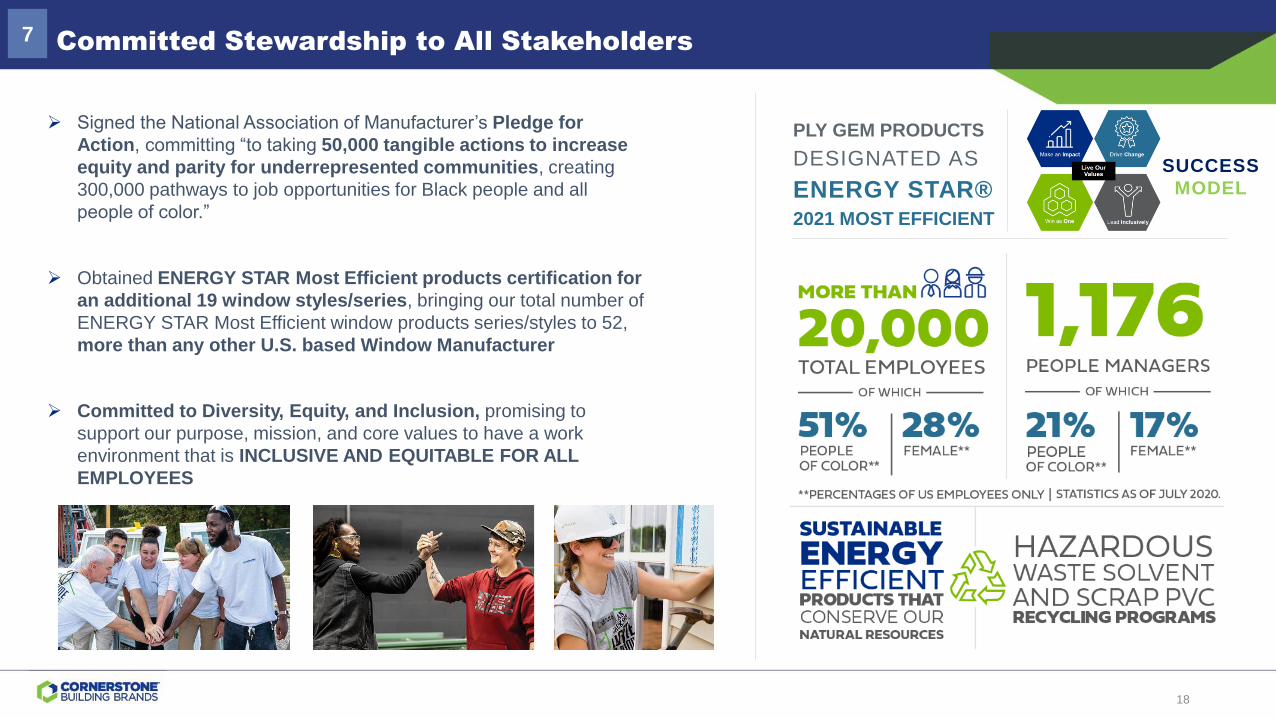
Committed Stewardship to All Stakeholders7
➢ Signed the National Association of Manufacturer’s Pledge for
Action, committing “to taking 50,000 tangible actions to increase
equity and parity for underrepresented communities, creating
300,000 pathways to job opportunities for Black people and all
people of color.”
➢ Obtained ENERGY STAR Most Efficient products certification for
an additional 19 window styles/series, bringing our total number of
ENERGY STAR Most Efficient window products series/styles to 52,
more than any other U.S. based Window Manufacturer
➢ Committed to Diversity, Equity, and Inclusion, promising to
support our purpose, mission, and core values to have a work
environment that is INCLUSIVE AND EQUITABLE FOR ALL
EMPLOYEES
PLY GEM PRODUCTS
DESIGNATED AS
ENERGY STAR® 2021 MOST EFFICIENT
SUCCESS
MODEL
18

Financial Performance
19
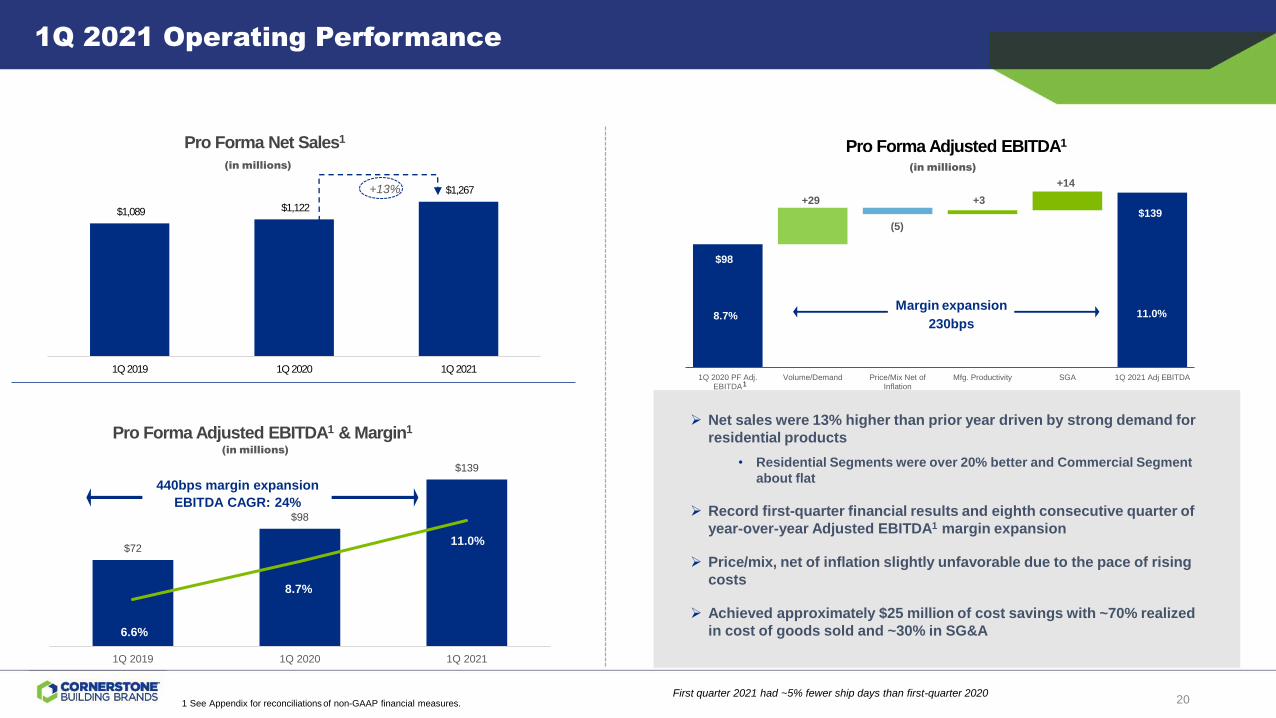
1Q 2020 PF Adj.EBITDA
Volume/Demand Price/Mix Net ofInflation
Mfg. Productivity SGA 1Q 2021 Adj EBITDA
Pro Forma Adjusted EBITDA1
+14
+3
8.7%
$139
11.0%
+29
(5)
$98
(in millions)
Margin expansion
230bps
1 See Appendix for reconciliations of non-GAAP financial measures.
➢ Net sales were 13% higher than prior year driven by strong demand for
residential products
• Residential Segments were over 20% better and Commercial Segment
about flat
➢ Record first-quarter financial results and eighth consecutive quarter of
year-over-year Adjusted EBITDA1 margin expansion
➢ Price/mix, net of inflation slightly unfavorable due to the pace of rising
costs
➢ Achieved approximately $25 million of cost savings with ~70% realized
in cost of goods sold and ~30% in SG&A
(in millions)
440bps margin expansion
EBITDA CAGR: 24%
1Q 2021 Operating Performance
$72
$98
$139
6.6%
8.7%
11.0%
1Q 2019 1Q 2020 1Q 2021
(in millions)
$1,089 $1,122
$1,267
1Q 2019 1Q 2020 1Q 2021
Pro Forma Net Sales1
Pro Forma Adjusted EBITDA1 & Margin1
1
First quarter 2021 had ~5% fewer ship days than first-quarter 2020
+13%
20

Segment Overview – Windows & Siding
1 See Appendix for reconciliationsof non-GAAP financial measures.
Windows
15.5%
Key Comments
First-Quarter Highlights
➢ Eighth consecutive quarter of year-over-year
margin expansion
➢ Record first-quarter results
➢ Advanced strategic customer relationships
➢ Expanded through acquisitions
2021 Sentiment
➢ Firm market leadership position leveraging
2020 capacity increases
➢ 70% of capital expenditures investing in
growth and continuous improvement projects
➢ Price to offset PVC resin, aluminum, and
other inflationary impacts compressing
margins in the short-term
Adjusted EBITDA1 (in millions)
and Margin %1
Net Sales (in millions)
+18% y-o-y
+15% from strong
volume
250bps margin
expansion
+volume leverage
+lower costs
$448
$527
$41
$61
9.1%
11.6%
1Q20
1Q20 1Q21
1Q21
Siding
$448
$527
$41
$61
9.1%
11.6%
$249
$316
+27% y-o-y
+19% from strong
volume
260bps margin
expansion
+volume leverage
+lower costs
1Q211Q20
$39
$57
15.5%18.1%
1Q20 1Q21
Scale for Growth Innovation for Growth
Pro Forma Adjusted EBITDA1 (in millions)
and Margin %1
Pro Forma NetSales1 (in millions)
21
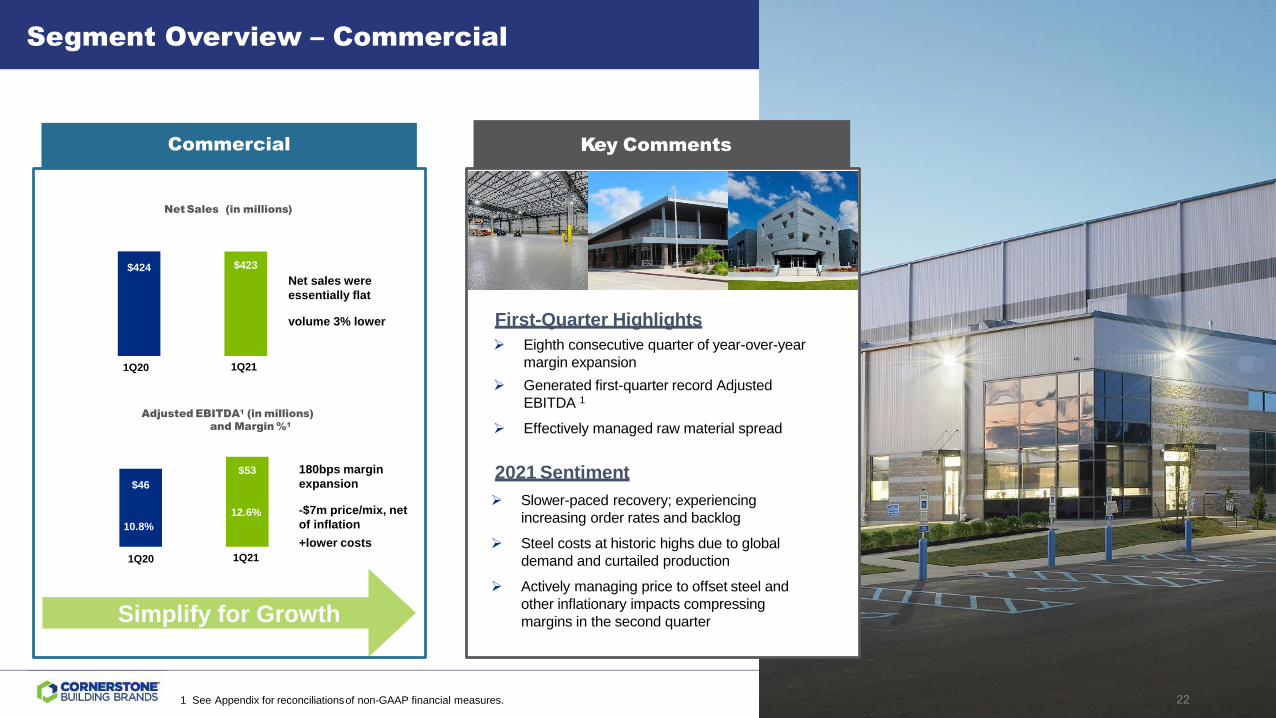
Segment Overview – Commercial
1 See Appendix for reconciliationsof non-GAAP financial measures.
Commercial
First-Quarter Highlights
➢ Eighth consecutive quarter of year-over-year
margin expansion
➢ Generated first-quarter record Adjusted
EBITDA 1
➢ Effectively managed raw material spread
2021 Sentiment
➢ Slower-paced recovery; experiencing
increasing order rates and backlog
➢ Steel costs at historic highs due to global
demand and curtailed production
➢ Actively managing price to offset steel and
other inflationary impacts compressing
margins in the second quarter
$46
$53
10.8%
12.6%
Key Comments
$424 $423
Net sales were
essentially flat
volume 3% lower
$424 $423
1Q20 1Q21
$46
$53
1Q20 1Q21
10.8%
12.6%
180bps margin
expansion
-$7m price/mix, net
of inflation
+lower costs
Simplify for Growth
NetSales (in millions)
Adjusted EBITDA1 (in millions)
and Margin %1
22
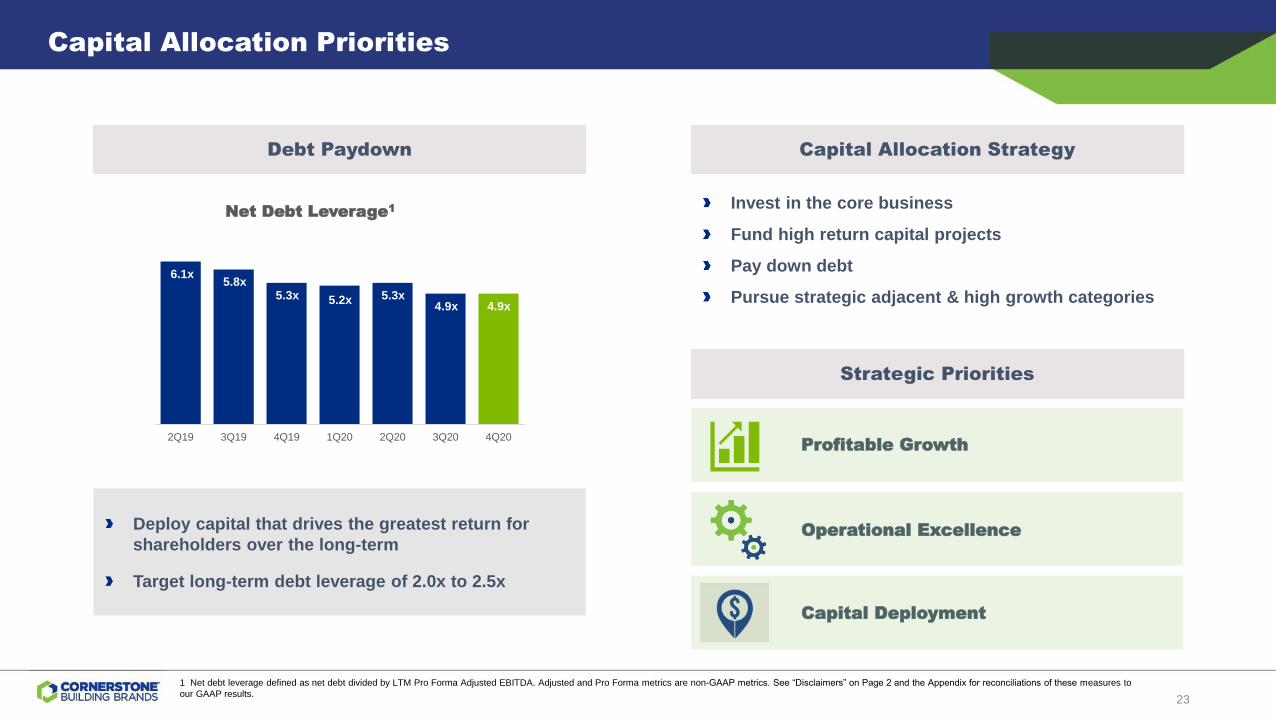
Capital Allocation Priorities
1 Net debt leverage defined as net debt divided by LTM Pro Forma Adjusted EBITDA. Adjusted and Pro Forma metrics are non-GAAP metrics. See “Disclaimers” on Page 2 and the Appendix for reconciliations of these measures to
our GAAP results.
Deploy capital that drives the greatest return for
shareholders over the long-term
Target long-term debt leverage of 2.0x to 2.5x
2Q19 3Q19 4Q19 1Q20 2Q20 3Q20 4Q20
Net Debt Leverage1
5.3x
6.1x
5.3x5.8x
5.2x
Debt Paydown Capital Allocation Strategy
Invest in the core business
Fund high return capital projects
Pay down debt
Pursue strategic adjacent & high growth categories
Strategic Priorities
Operational Excellence
Profitable Growth
Capital Deployment
4.9x 4.9x
23

Integrated Foundation for Growth
Growth, Automation and
Continuous Improvement
50%
Maintenance & Other
50%
Capital Investments
Expect structural cost savings of ~$75 to $80 million in 2021
FUEL FOR GROWTH INVEST FOR GROWTH POSITION FOR GROWTH
5.3x4.9x
3.9x –
4.1x
Net Debt Leverage
2019 2020 2021E
$135
$250
~$325-$330
2019 2020 2021E
Acquisitions
Value Drivers
➢ Investments in automation
➢ Systems and process simplification
➢ Logistics and procurement optimization
Cumulative Realization of Merger
Synergies and Cost Savings(in millions)
➢ Reduce net debt leverage by ¾ to 1 turn in 2021
from earnings generation
➢ First-quarter 2021 net debt leverage ratio was
4.6x, over a quarter turn better than at the end
of 2020
➢ Target long-term net debt leverage of 2.0x to 2.5x
24
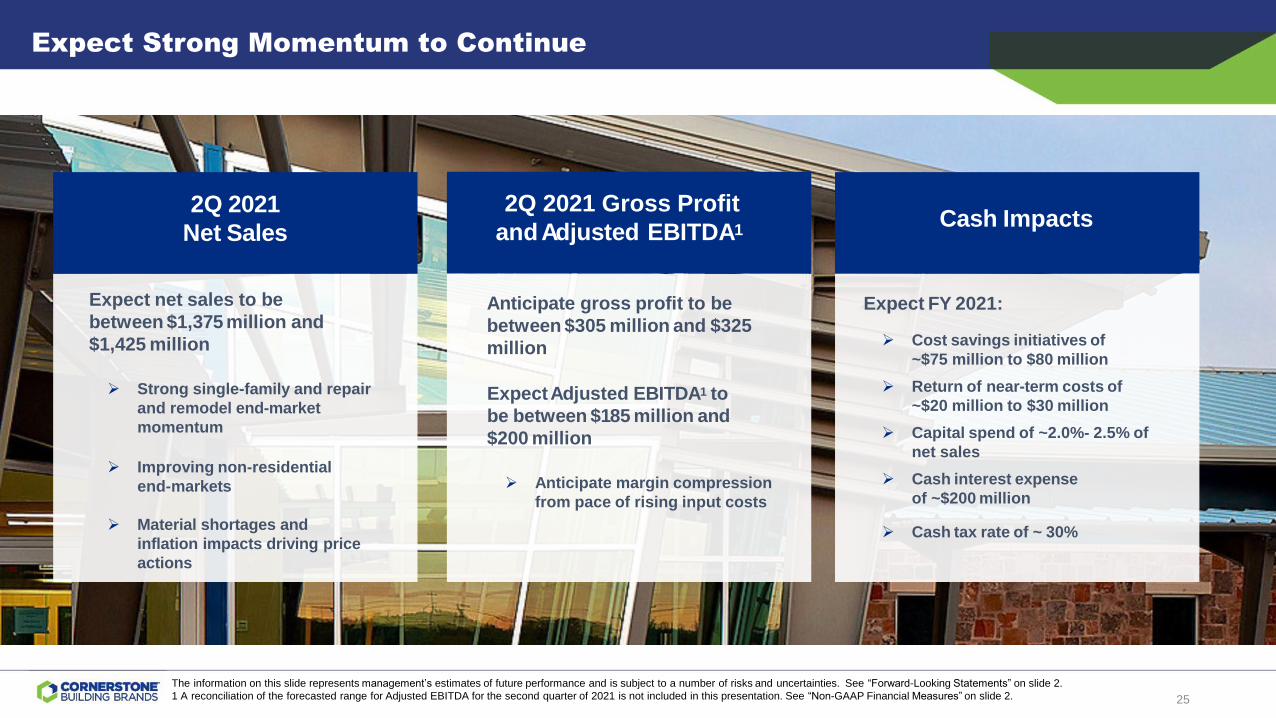
Expect Strong Momentum to Continue
The information on this slide represents management’s estimates of future performance and is subject to a number of risks and uncertainties. See “Forward-Looking Statements” on slide 2.
1 A reconciliation of the forecasted range for Adjusted EBITDA for the second quarter of 2021 is not included in this presentation. See “Non-GAAP Financial Measures” on slide 2.
Cash Impacts
Expect FY 2021:
➢ Cost savings initiatives of
~$75 million to $80 million
➢ Return of near-term costs of
~$20 million to $30 million
➢ Capital spend of ~2.0%- 2.5% of
net sales
➢ Cash interest expense
of ~$200 million
➢ Cash tax rate of ~ 30%
Anticipate gross profit to be
between $305 million and $325
million
ExpectAdjusted EBITDA1 to
be between $185 million and
$200 million
➢ Anticipate margin compression
from pace of rising input costs
2Q 2021 Gross Profit
andAdjusted EBITDA1
2Q 2021
Net Sales
Expect net sales to be
between $1,375 million and
$1,425 million
➢ Strong single-family and repair
and remodel end-market
momentum
➢ Improving non-residential
end-markets
➢ Material shortages and
inflation impacts driving price
actions
25

Key Investment Highlights
1
2
3
4
5
6
7
Largest Manufacturer of Exterior Building Products in North America
Expansive Portfolio of High Quality Products with Strong Brand Recognition
Multichannel Distribution Platform Serving a Broad, Long-Tenured Customer Base
Highly Efficient Operating Platform
Diverse End Markets with Strong Fundamentals Support Future Growth
Significant Cash Flow Generation with Proven Ability to Delever
Committed Stewardship to All Stakeholders
26

Appendix
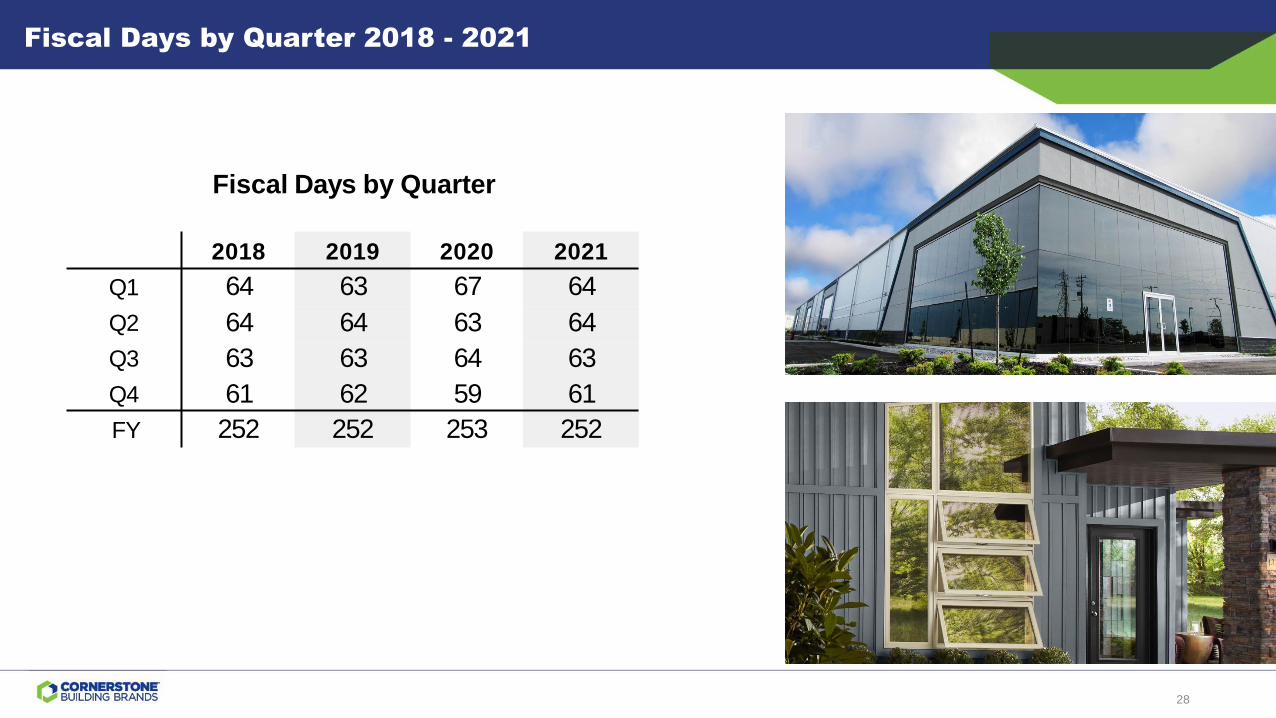
Fiscal Days by Quarter 2018 - 2021
2018 2019 2020 2021
Q1 64 63 67 64
Q2 64 64 63 64
Q3 63 63 64 63
Q4 61 62 59 61
FY 252 252 253 252
Fiscal Days by Quarter
28
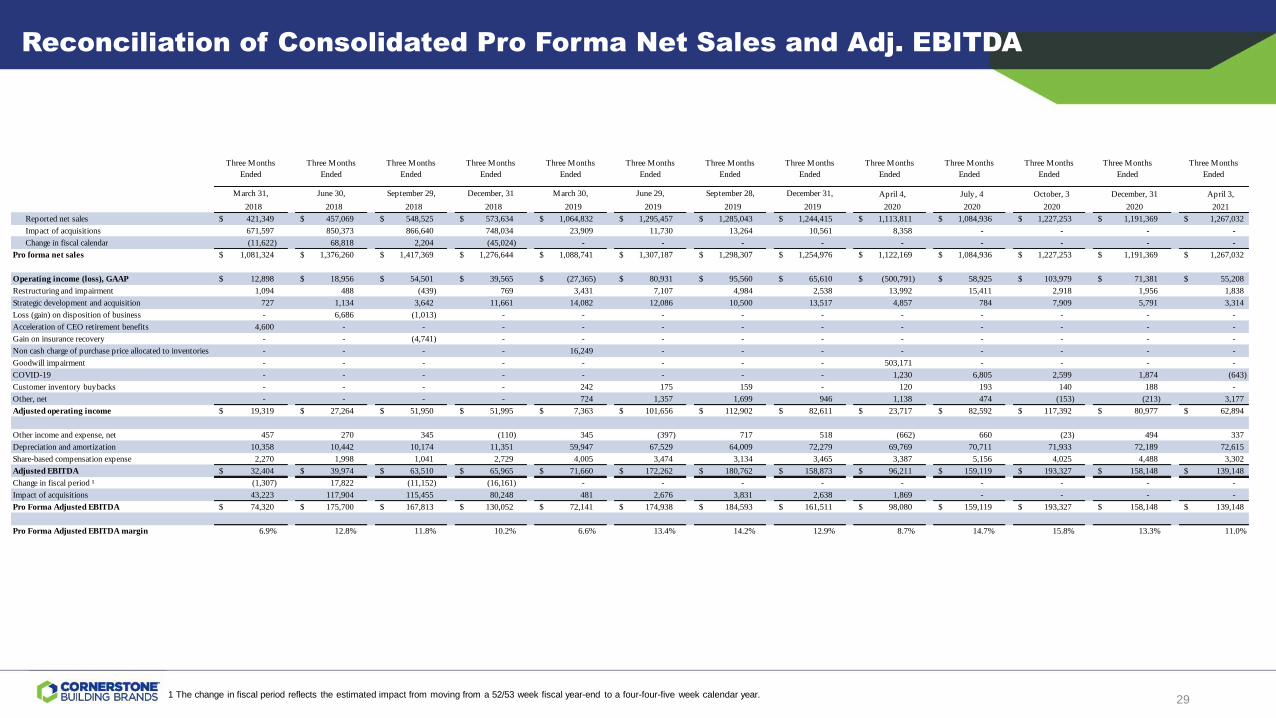
Reconciliation of Consolidated Pro Forma Net Sales and Adj. EBITDA
1 The change in fiscal period reflects the estimated impact from moving from a 52/53 week fiscal year-end to a four-four-five week calendar year.
April 4, July, 4 October, 3 December, 31 April 3,
2018 2018 2018 2018 2019 2019 2019 2019 2020 2020 2020 2020 2021
Reported net sales $ 421,349 $ 457,069 $ 548,525 $ 573,634 $ 1,064,832 $ 1,295,457 $ 1,285,043 $ 1,244,415 $ 1,113,811 $ 1,084,936 $ 1,227,253 $ 1,191,369 $ 1,267,032
Impact of acquisitions 671,597 850,373 866,640 748,034 23,909 11,730 13,264 10,561 8,358 - - - -
Change in fiscal calendar (11,622) 68,818 2,204 (45,024) - - - - - - - - -
Pro forma net sales $ 1,081,324 $ 1,376,260 $ 1,417,369 $ 1,276,644 $ 1,088,741 $ 1,307,187 $ 1,298,307 $ 1,254,976 $ 1,122,169 $ 1,084,936 $ 1,227,253 $ 1,191,369 $ 1,267,032
Operating income (loss), GAAP $ 12,898 $ 18,956 $ 54,501 $ 39,565 $ (27,365) $ 80,931 $ 95,560 $ 65,610 $ (500,791) $ 58,925 $ 103,979 $ 71,381 $ 55,208
Restructuring and impairment 1,094 488 (439) 769 3,431 7,107 4,984 2,538 13,992 15,411 2,918 1,956 1,838
Strategic development and acquisition 727 1,134 3,642 11,661 14,082 12,086 10,500 13,517 4,857 784 7,909 5,791 3,314
Loss (gain) on disposition of business - 6,686 (1,013) - - - - - - - - - -
Acceleration of CEO retirement benefits 4,600 - - - - - - - - - - - -
Gain on insurance recovery - - (4,741) - - - - - - - - - -
Non cash charge of purchase price allocated to inventories - - - - 16,249 - - - - - - - -
Goodwill impairment - - - - - - - - 503,171 - - - -
COVID-19 - - - - - - - - 1,230 6,805 2,599 1,874 (643)
Customer inventory buybacks - - - - 242 175 159 - 120 193 140 188 -
Other, net - - - - 724 1,357 1,699 946 1,138 474 (153) (213) 3,177
Adjusted operating income $ 19,319 $ 27,264 $ 51,950 $ 51,995 $ 7,363 $ 101,656 $ 112,902 $ 82,611 $ 23,717 $ 82,592 $ 117,392 $ 80,977 $ 62,894
Other income and expense, net 457 270 345 (110) 345 (397) 717 518 (662) 660 (23) 494 337
Depreciation and amortization 10,358 10,442 10,174 11,351 59,947 67,529 64,009 72,279 69,769 70,711 71,933 72,189 72,615
Share-based compensation expense 2,270 1,998 1,041 2,729 4,005 3,474 3,134 3,465 3,387 5,156 4,025 4,488 3,302
Adjusted EBITDA $ 32,404 $ 39,974 $ 63,510 $ 65,965 $ 71,660 $ 172,262 $ 180,762 $ 158,873 $ 96,211 $ 159,119 $ 193,327 $ 158,148 $ 139,148
Change in fiscal period ¹ (1,307) 17,822 (11,152) (16,161) - - - - - - - - -
Impact of acquisitions 43,223 117,904 115,455 80,248 481 2,676 3,831 2,638 1,869 - - - -
Pro Forma Adjusted EBITDA $ 74,320 $ 175,700 $ 167,813 $ 130,052 $ 72,141 $ 174,938 $ 184,593 $ 161,511 $ 98,080 $ 159,119 $ 193,327 $ 158,148 $ 139,148
Pro Forma Adjusted EBITDA margin 6.9% 12.8% 11.8% 10.2% 6.6% 13.4% 14.2% 12.9% 8.7% 14.7% 15.8% 13.3% 11.0%
Three Months
Ended
Three Months
Ended
Three Months
Ended
Three Months
Ended
Three Months
Ended
Three Months
Ended
March 31, June 30, September 29, December, 31 March 30,
Three Months
Ended
Three Months
Ended
Three Months
Ended
December 31,
Three Months
Ended
Three Months
Ended
Three Months
Ended
Three Months
Ended
June 29, September 28,
29

Reconciliation of Pro Forma Net Sales and Adj. EBITDA – Windows Segment
April 4, July, 4 October, 3 December, 31 April 3,
2018 2018 2018 2018 2019 2019 2019 2019 2020 2020 2020 2020 2021
Reported net sales $ - $ - $ - $ - $ 421,594 $ 508,647 $ 504,338 $ 495,868 $ 448,450 $ 428,275 $ 501,314 $ 511,586 $ 527,263
Impact of acquisitions 437,658 527,791 539,929 471,825 - - - - - - - - -
Pro forma net sales $ 437,658 $ 527,791 $ 539,929 $ 471,825 $ 421,594 $ 508,647 $ 504,338 $ 495,868 $ 448,450 $ 428,275 $ 501,314 $ 511,586 $ 527,263
Operating income (loss), GAAP $ - $ - $ - $ - $ (4,319) $ 31,912 $ 34,446 $ 30,499 $ (313,190) $ 23,101 $ 37,295 $ 29,150 $ 29,362
Restructuring and impairment - - - - 121 900 505 339 1,466 4,184 1,539 310 932
Strategic development and acquisition - - - - 4,009 8,052 4,993 2,893 16 - - - -
Goodwill impairment - - - - - - - - 320,990 - - - -
COVID-19 - - - - - - - - 928 3,964 1,031 921 -
Other, net - - - - 384 (424) 577 2,905 785 (785) 252 349 -
Adjusted operating income $ - $ - $ - $ - $ 195 $ 40,440 $ 40,521 $ 36,636 $ 10,995 $ 30,464 $ 40,117 $ 30,730 $ 30,294
Other income and expense, net - - - - (327) (411) 285 (385) - - (115) 8 (87)
Depreciation and amortization - - - - 23,977 24,848 23,778 22,134 29,853 30,182 30,644 30,840 30,798
Adjusted EBITDA $ - $ - $ - $ - $ 23,845 $ 64,877 $ 64,584 $ 58,385 $ 40,848 $ 60,646 $ 70,646 $ 61,578 $ 61,005
Impact of acquisitions 22,294 62,830 57,755 39,160 - - - - - - - - -
Pro Forma Adjusted EBITDA $ 22,294 $ 62,830 $ 57,755 $ 39,160 $ 23,845 $ 64,877 $ 64,584 $ 58,385 $ 40,848 $ 60,646 $ 70,646 $ 61,578 $ 61,005
Pro Forma Adjusted EBITDA margin 5.1% 11.9% 10.7% 8.3% 5.7% 12.8% 12.8% 11.8% 9.1% 14.2% 14.1% 12.0% 11.6%
Three Months
Ended
Three Months
Ended
Three Months
Ended
Three Months
Ended
Three Months
Ended
Three Months
Ended
June 29, September 28,
Three Months
Ended
Three Months
Ended
December 31,
Three Months
Ended
Three Months
Ended
Three Months
Ended
Three Months
Ended
Three Months
Ended
March 31, June 30, September 29, December, 31 March 30,
30
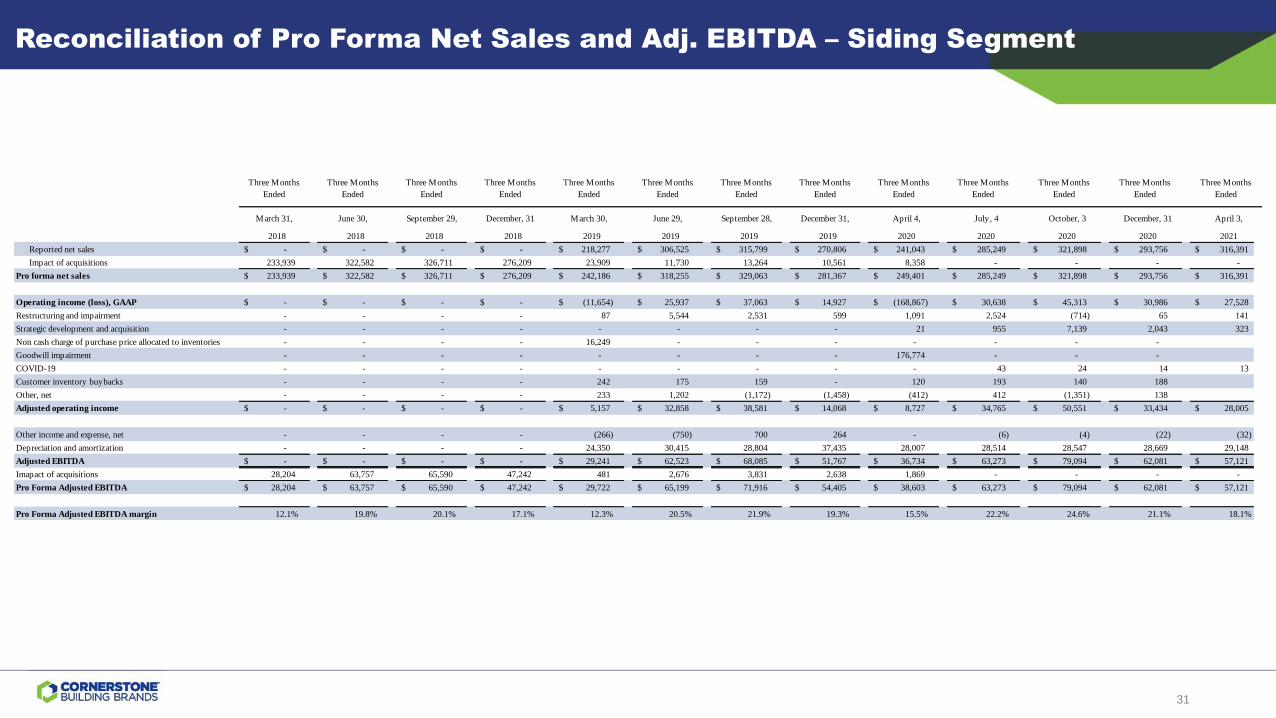
Reconciliation of Pro Forma Net Sales and Adj. EBITDA – Siding Segment
April 4, July, 4 October, 3 December, 31 April 3,
2018 2018 2018 2018 2019 2019 2019 2019 2020 2020 2020 2020 2021
Reported net sales $ - $ - $ - $ - $ 218,277 $ 306,525 $ 315,799 $ 270,806 $ 241,043 $ 285,249 $ 321,898 $ 293,756 $ 316,391
Impact of acquisitions 233,939 322,582 326,711 276,209 23,909 11,730 13,264 10,561 8,358 - - - -
Pro forma net sales $ 233,939 $ 322,582 $ 326,711 $ 276,209 $ 242,186 $ 318,255 $ 329,063 $ 281,367 $ 249,401 $ 285,249 $ 321,898 $ 293,756 $ 316,391
Operating income (loss), GAAP $ - $ - $ - $ - $ (11,654) $ 25,937 $ 37,063 $ 14,927 $ (168,867) $ 30,638 $ 45,313 $ 30,986 $ 27,528
Restructuring and impairment - - - - 87 5,544 2,531 599 1,091 2,524 (714) 65 141
Strategic development and acquisition - - - - - - - - 21 955 7,139 2,043 323
Non cash charge of purchase price allocated to inventories - - - - 16,249 - - - - - - -
Goodwill impairment - - - - - - - - 176,774 - - -
COVID-19 - - - - - - - - - 43 24 14 13
Customer inventory buybacks - - - - 242 175 159 - 120 193 140 188
Other, net - - - - 233 1,202 (1,172) (1,458) (412) 412 (1,351) 138
Adjusted operating income $ - $ - $ - $ - $ 5,157 $ 32,858 $ 38,581 $ 14,068 $ 8,727 $ 34,765 $ 50,551 $ 33,434 $ 28,005
Other income and expense, net - - - - (266) (750) 700 264 - (6) (4) (22) (32)
Depreciation and amortization - - - - 24,350 30,415 28,804 37,435 28,007 28,514 28,547 28,669 29,148
Adjusted EBITDA $ - $ - $ - $ - $ 29,241 $ 62,523 $ 68,085 $ 51,767 $ 36,734 $ 63,273 $ 79,094 $ 62,081 $ 57,121
Imapact of acquisitions 28,204 63,757 65,590 47,242 481 2,676 3,831 2,638 1,869 - - - -
Pro Forma Adjusted EBITDA $ 28,204 $ 63,757 $ 65,590 $ 47,242 $ 29,722 $ 65,199 $ 71,916 $ 54,405 $ 38,603 $ 63,273 $ 79,094 $ 62,081 $ 57,121
Pro Forma Adjusted EBITDA margin 12.1% 19.8% 20.1% 17.1% 12.3% 20.5% 21.9% 19.3% 15.5% 22.2% 24.6% 21.1% 18.1%
Three Months
Ended
Three Months
Ended
Three Months
Ended
Three Months
Ended
Three Months
Ended
Three Months
Ended
Three Months
Ended
Three Months
Ended
Three Months
Ended
Three Months
Ended
Three Months
Ended
June 30, September 29, December, 31 March 30, June 29, September 28,
Three Months
Ended
Three Months
Ended
March 31, December 31,
31
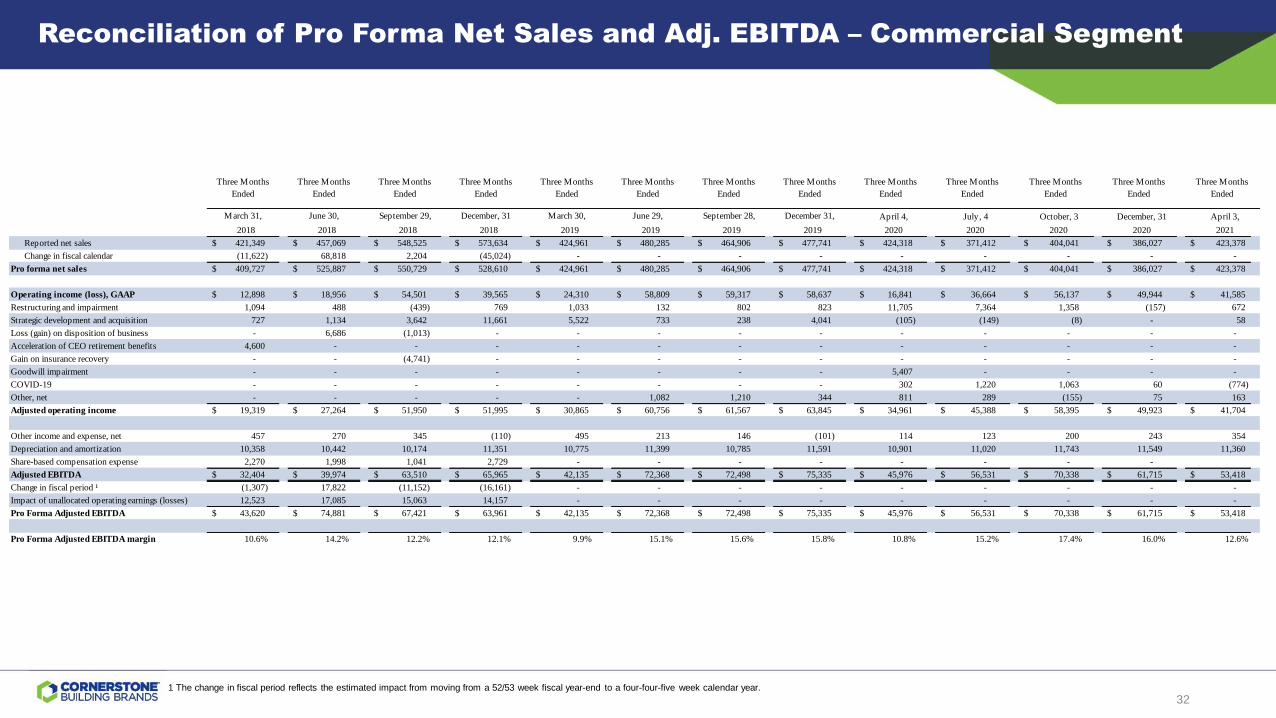
1 The change in fiscal period reflects the estimated impact from moving from a 52/53 week fiscal year-end to a four-four-five week calendar year.
Reconciliation of Pro Forma Net Sales and Adj. EBITDA – Commercial Segment
April 4, July, 4 October, 3 December, 31 April 3,
2018 2018 2018 2018 2019 2019 2019 2019 2020 2020 2020 2020 2021
Reported net sales $ 421,349 $ 457,069 $ 548,525 $ 573,634 $ 424,961 $ 480,285 $ 464,906 $ 477,741 $ 424,318 $ 371,412 $ 404,041 $ 386,027 $ 423,378
Change in fiscal calendar (11,622) 68,818 2,204 (45,024) - - - - - - - - -
Pro forma net sales $ 409,727 $ 525,887 $ 550,729 $ 528,610 $ 424,961 $ 480,285 $ 464,906 $ 477,741 $ 424,318 $ 371,412 $ 404,041 $ 386,027 $ 423,378
Operating income (loss), GAAP $ 12,898 $ 18,956 $ 54,501 $ 39,565 $ 24,310 $ 58,809 $ 59,317 $ 58,637 $ 16,841 $ 36,664 $ 56,137 $ 49,944 $ 41,585
Restructuring and impairment 1,094 488 (439) 769 1,033 132 802 823 11,705 7,364 1,358 (157) 672
Strategic development and acquisition 727 1,134 3,642 11,661 5,522 733 238 4,041 (105) (149) (8) - 58
Loss (gain) on disposition of business - 6,686 (1,013) - - - - - - - - - -
Acceleration of CEO retirement benefits 4,600 - - - - - - - - - - - -
Gain on insurance recovery - - (4,741) - - - - - - - - - -
Goodwill impairment - - - - - - - - 5,407 - - - -
COVID-19 - - - - - - - - 302 1,220 1,063 60 (774)
Other, net - - - - - 1,082 1,210 344 811 289 (155) 75 163
Adjusted operating income $ 19,319 $ 27,264 $ 51,950 $ 51,995 $ 30,865 $ 60,756 $ 61,567 $ 63,845 $ 34,961 $ 45,388 $ 58,395 $ 49,923 $ 41,704
Other income and expense, net 457 270 345 (110) 495 213 146 (101) 114 123 200 243 354
Depreciation and amortization 10,358 10,442 10,174 11,351 10,775 11,399 10,785 11,591 10,901 11,020 11,743 11,549 11,360
Share-based compensation expense 2,270 1,998 1,041 2,729 - - - - - - - -
Adjusted EBITDA $ 32,404 $ 39,974 $ 63,510 $ 65,965 $ 42,135 $ 72,368 $ 72,498 $ 75,335 $ 45,976 $ 56,531 $ 70,338 $ 61,715 $ 53,418
Change in fiscal period ¹ (1,307) 17,822 (11,152) (16,161) - - - - - - - - -
Impact of unallocated operating earnings (losses) 12,523 17,085 15,063 14,157 - - - - - - - - -
Pro Forma Adjusted EBITDA $ 43,620 $ 74,881 $ 67,421 $ 63,961 $ 42,135 $ 72,368 $ 72,498 $ 75,335 $ 45,976 $ 56,531 $ 70,338 $ 61,715 $ 53,418
Pro Forma Adjusted EBITDA margin 10.6% 14.2% 12.2% 12.1% 9.9% 15.1% 15.6% 15.8% 10.8% 15.2% 17.4% 16.0% 12.6%
Three Months
Ended
Three Months
Ended
Three Months
Ended
Three Months
Ended
Three Months
Ended
Three Months
Ended
Three Months
Ended
Three Months
Ended
Three Months
Ended
Three Months
Ended
Three Months
Ended
June 30, September 29, December, 31 March 30, June 29, September 28,
Three Months
Ended
Three Months
Ended
March 31, December 31,
32
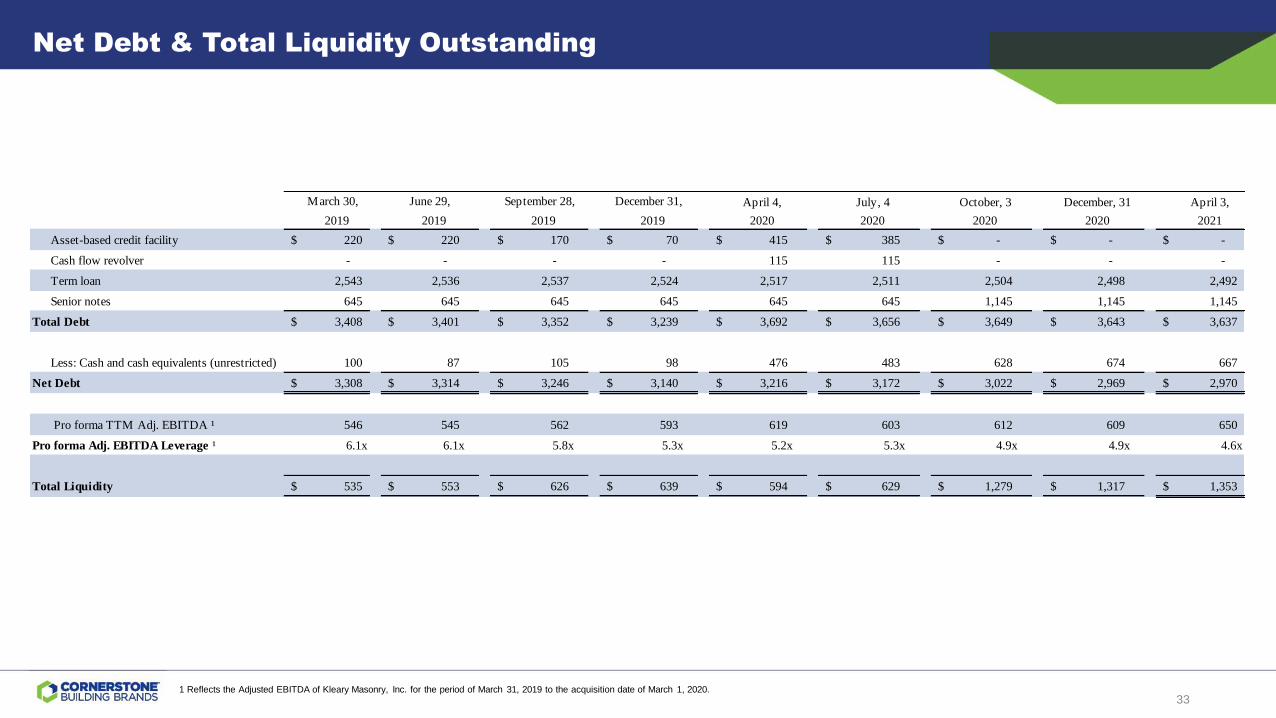
Net Debt & Total Liquidity Outstanding
1 Reflects the Adjusted EBITDA of Kleary Masonry, Inc. for the period of March 31, 2019 to the acquisition date of March 1, 2020.
April 4, July, 4 October, 3 December, 31 April 3,
2019 2019 2019 2019 2020 2020 2020 2020 2021
Asset-based credit facility $ 220 $ 220 $ 170 $ 70 $ 415 $ 385 $ - $ - $ -
Cash flow revolver - - - - 115 115 - - -
Term loan 2,543 2,536 2,537 2,524 2,517 2,511 2,504 2,498 2,492
Senior notes 645 645 645 645 645 645 1,145 1,145 1,145
Total Debt $ 3,408 $ 3,401 $ 3,352 $ 3,239 $ 3,692 $ 3,656 $ 3,649 $ 3,643 $ 3,637
Less: Cash and cash equivalents (unrestricted) 100 87 105 98 476 483 628 674 667
Net Debt $ 3,308 $ 3,314 $ 3,246 $ 3,140 $ 3,216 $ 3,172 $ 3,022 $ 2,969 $ 2,970
Pro forma TTM Adj. EBITDA ¹ 546 545 562 593 619 603 612 609 650
Pro forma Adj. EBITDA Leverage ¹ 6.1x 6.1x 5.8x 5.3x 5.2x 5.3x 4.9x 4.9x 4.6x
Total Liquidity $ 535 $ 553 $ 626 $ 639 $ 594 $ 629 $ 1,279 $ 1,317 $ 1,353
March 30, June 29, September 28, December 31,
33
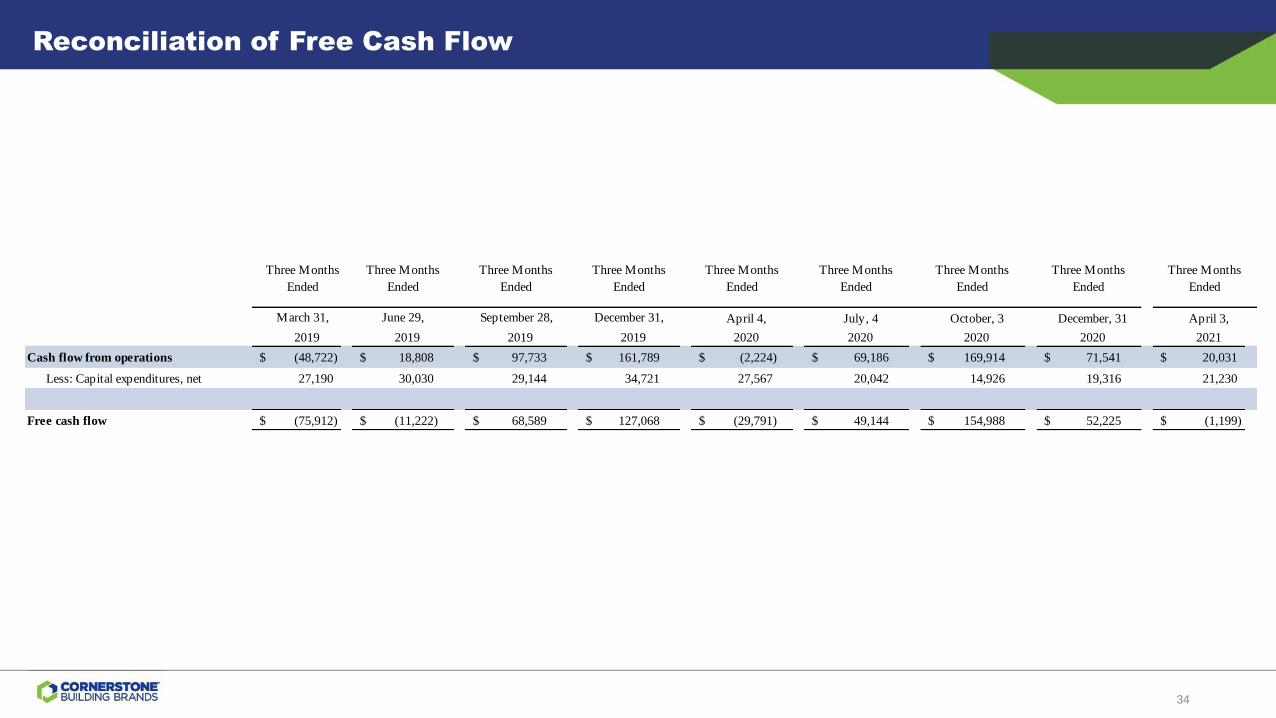
Reconciliation of Free Cash Flow
April 4, July, 4 October, 3 December, 31 April 3,
2019 2019 2019 2019 2020 2020 2020 2020 2021
Cash flow from operations $ (48,722) $ 18,808 $ 97,733 $ 161,789 $ (2,224) $ 69,186 $ 169,914 $ 71,541 $ 20,031
Less: Capital expenditures, net 27,190 30,030 29,144 34,721 27,567 20,042 14,926 19,316 21,230
Free cash flow $ (75,912) $ (11,222) $ 68,589 $ 127,068 $ (29,791) $ 49,144 $ 154,988 $ 52,225 $ (1,199)
Three Months
Ended
Three Months
Ended
Three Months
Ended
Three Months
Ended
Three Months
Ended
June 29,
Three Months
Ended
Three Months
Ended
Three Months
Ended
Three Months
Ended
March 31, September 28, December 31,
34