PotashCorp - 2014 Q4 Earnings
16
PotashCorp.com Q4 2014 Conference Call January 29, 2015
-
Upload
potashcorp -
Category
Investor Relations
-
view
134 -
download
2
Transcript of PotashCorp - 2014 Q4 Earnings
PotashCorp.com
Q4 2014 Conference Call
January 29, 2015
Forward-looking Statements
Slide#2
This presentation contains forward-looking statements or forward-looking information (forward-looking statements). These statements can
be identified by expressions of belief, expectation or intention, as well as those statements that are not historical fact. These statements
often contain words such as “should,” “could,” “expect,” “may,” “anticipate,” “believe,” “intend,” “estimate,” “plan” and similar expressions.
These statements are based on certain factors and assumptions, including with respect to: foreign exchange rates, expected growth,
results of operations, performance, business prospects and opportunities, and effective tax rates. While PotashCorp considers these
factors and assumptions to be reasonable based on information currently available, they may prove to be incorrect. Forward-looking
statements are subject to risks and uncertainties that are difficult to predict. The results or events set forth in forward-looking statements
may differ materially from actual results or events. Several factors could cause actual results to differ materially from those expressed in
the forward-looking statements, including, but not limited to: variations from our assumptions with respect to foreign exchange rates,
expected growth, results of operations, performance, business prospects and opportunities and effective tax rates; risks and uncertainties
related to operating and workforce changes made in response to our industry and the markets we serve; changes in competitive
pressures, including pricing pressures; risks and uncertainties related to our international operations and assets; fluctuations in supply
and demand in the fertilizer, sulfur, transportation and petrochemical markets; costs and availability of transportation and distribution for
our raw materials and products, including railcars and ocean freight; adverse or uncertain economic conditions and changes in credit and
financial markets; the results of sales contract negotiations within major markets; unexpected geological or environmental conditions,
including water inflows; economic and political uncertainty around the world; risks associated with natural gas and other hedging
activities; changes in capital markets; unexpected or adverse weather conditions; changes in currency and exchange rates; imprecision in
reserve estimates; adverse developments in new and pending legal proceedings or government investigations; acquisitions we may
undertake; increases in the price or reduced availability of the raw materials that we use; strikes or other forms of work stoppage or
slowdowns; timing and impact of capital expenditures; rates of return on, and the risks associated with, our investments and capital
expenditures; changes in, and the effects of, government policies and regulations; security risks related to our information technology
systems; risks related to reputational loss; and earnings and the decisions of taxing authorities which could affect our effective tax rates.
Additional risks and uncertainties that could cause actual results to differ materially from results expressed on this Site can be found in
PotashCorp’s most recent earnings release, in PotashCorp’s Form 10-K for the fiscal year ended December 31, 2013 under the captions
"Forward-Looking Statements" and "Item 1A - Risk Factors" and in PotashCorp’s other filings with the U.S. Securities and Exchange
Commission and the Canadian provincial securities commissions. The forward-looking statements contained in the documents and
information placed on this Site are made as of the date of the release of such document or the posting of such information on this Site, as
applicable. PotashCorp disclaims any obligation to update or revise any forward-looking statements, whether as a result of new
information, future events or otherwise, except as required by law.
Slide#3
Performance
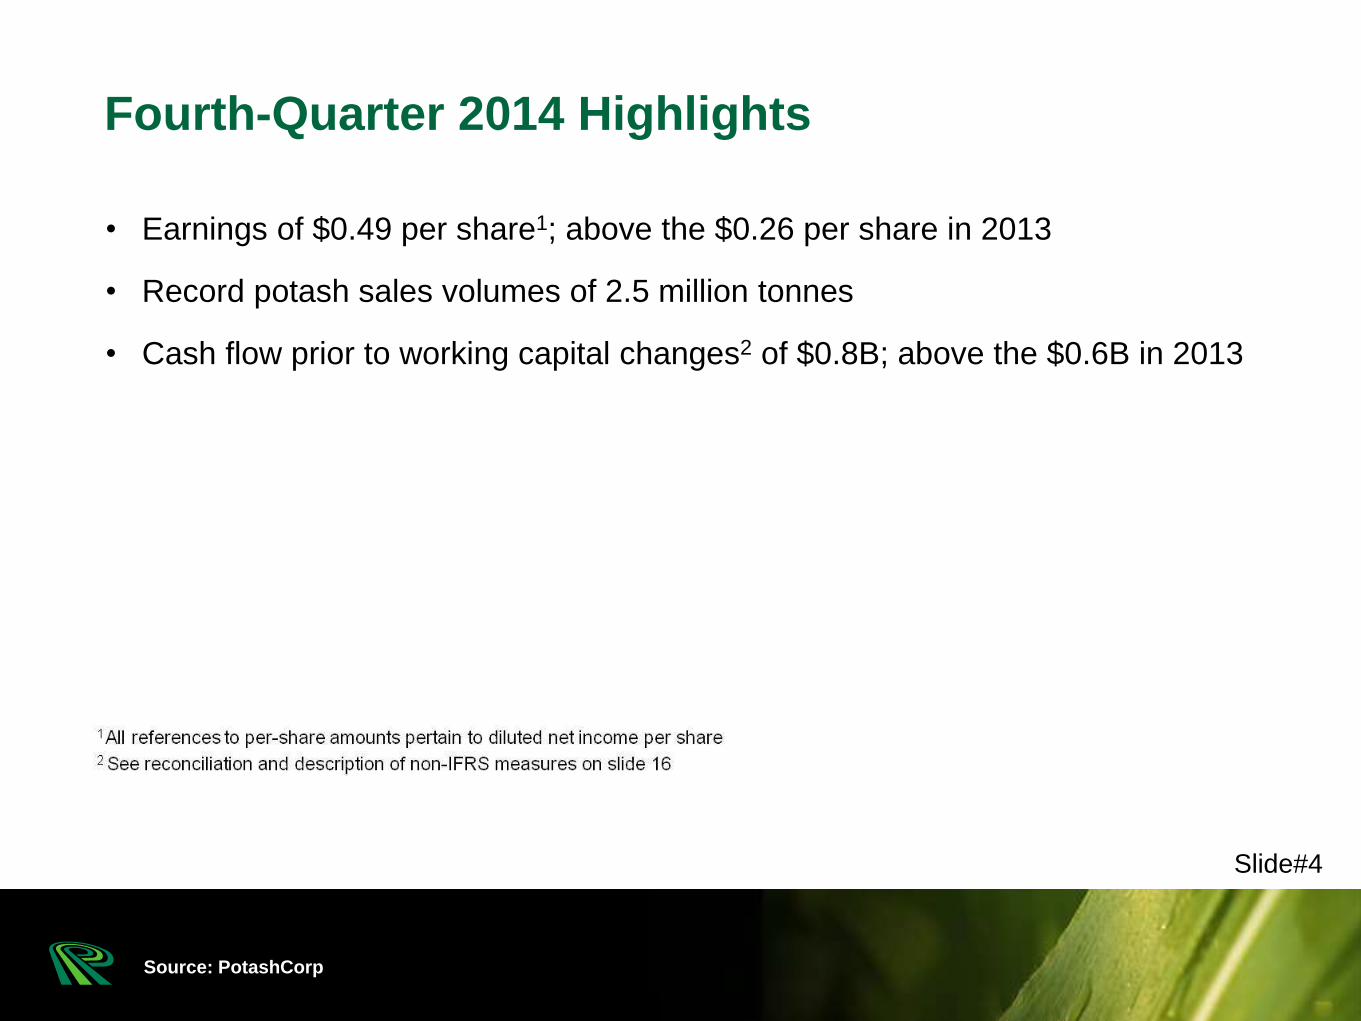
Fourth-Quarter 2014 Highlights
• Earnings of $0.49 per share1; above the $0.26 per share in 2013
• Record potash sales volumes of 2.5 million tonnes
• Cash flow prior to working capital changes2 of $0.8B; above the $0.6B in 2013
Source: PotashCorp
Slide#4
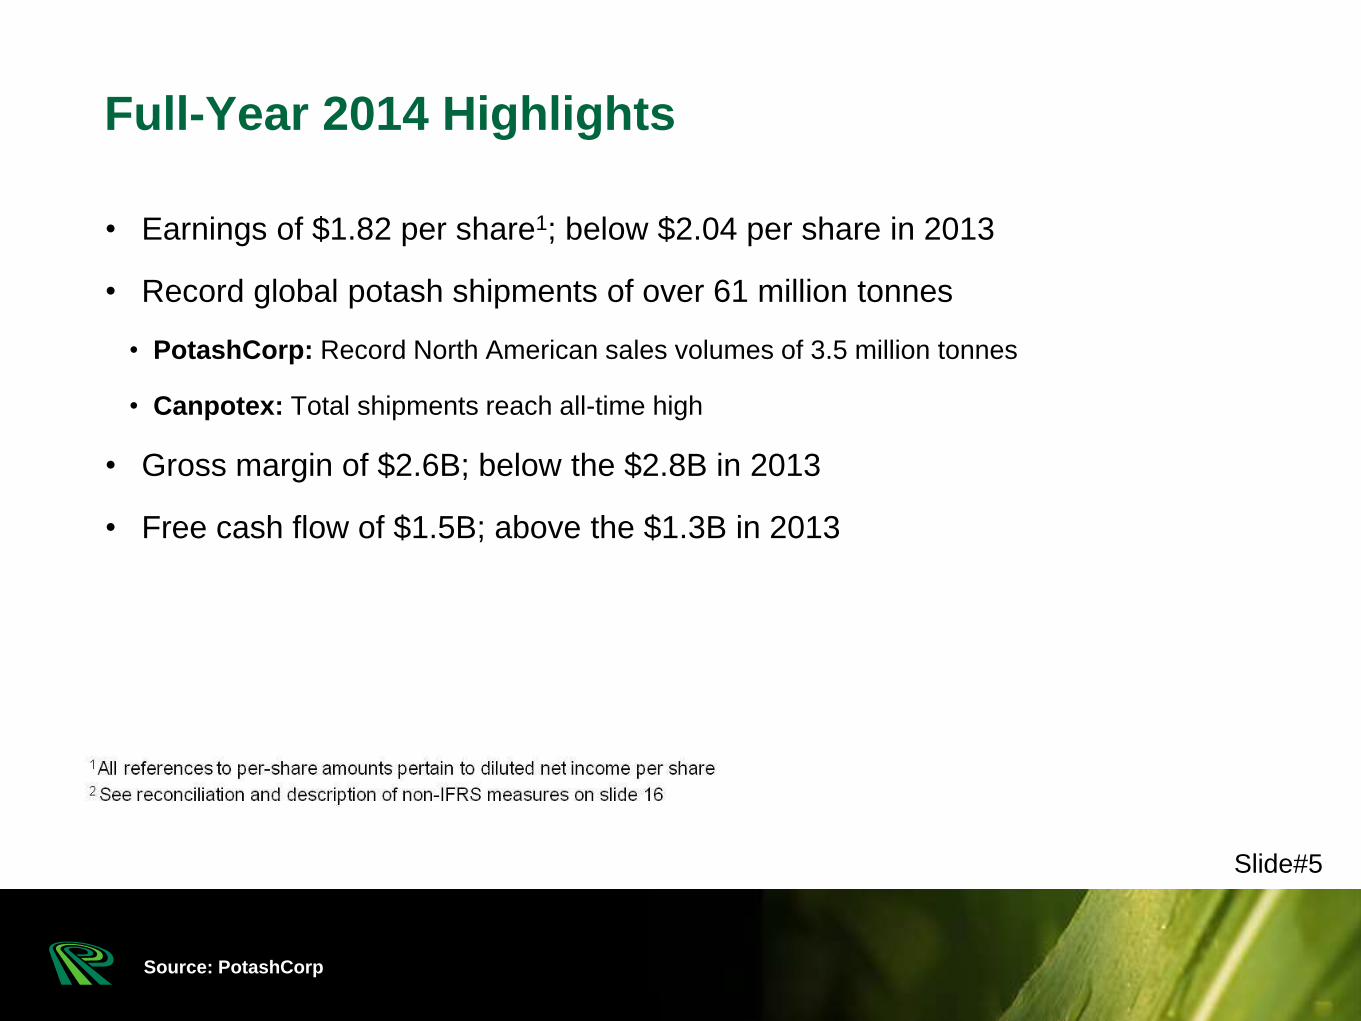
• Earnings of $1.82 per share1; below $2.04 per share in 2013
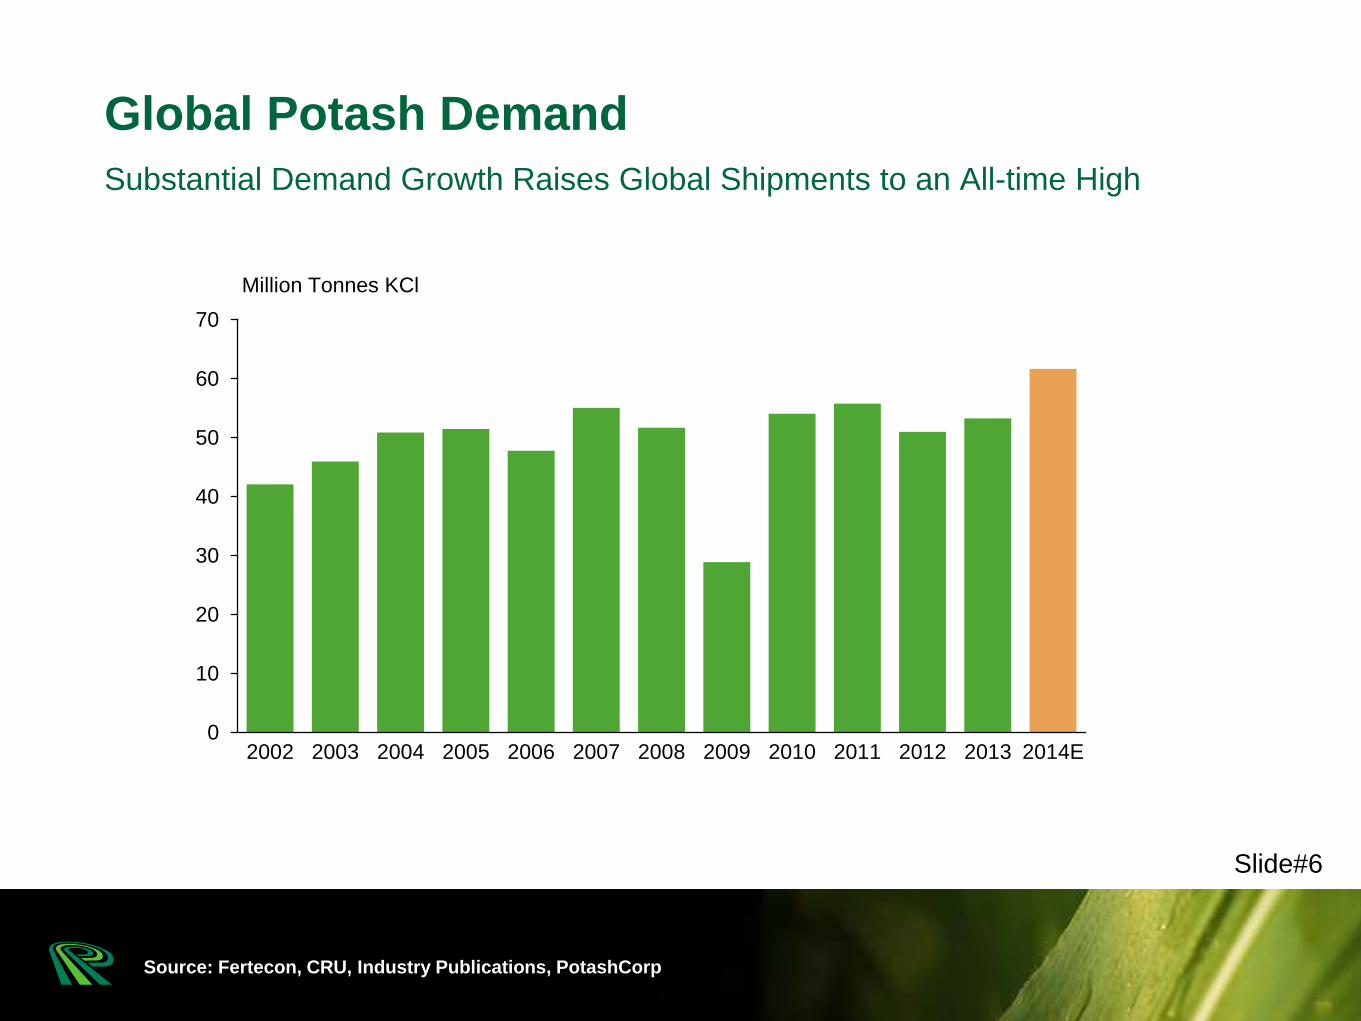
• Record global potash shipments of over 61 million tonnes
• PotashCorp: Record North American sales volumes of 3.5 million tonnes
• Canpotex: Total shipments reach all-time high
• Gross margin of $2.6B; below the $2.8B in 2013
• Free cash flow of $1.5B; above the $1.3B in 2013
Full-Year 2014 Highlights
Source: PotashCorp
Slide#5
Source: Fertecon, CRU, Industry Publications, PotashCorp
Substantial Demand Growth Raises Global Shipments to an All-time High
Global Potash Demand
0
10
20
30
40
50
60
70
2002 2003 2004 2005 2006 2007 2008 2009 2010 2011 2012 2013 2014E
Million Tonnes KCl
Slide#6
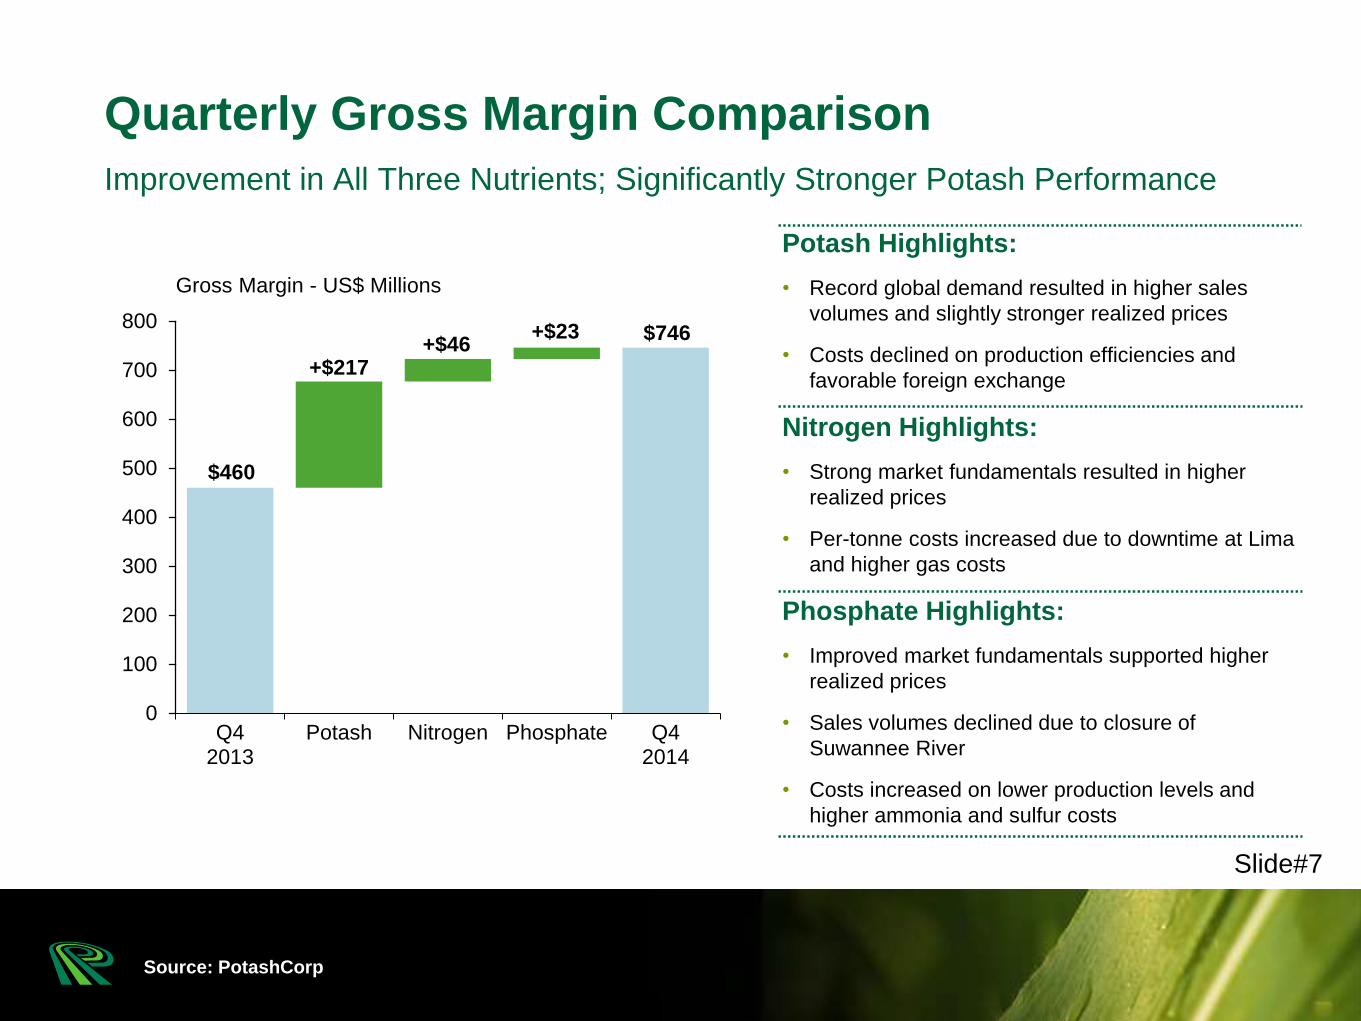
Improvement in All Three Nutrients; Significantly Stronger Potash Performance
Quarterly Gross Margin Comparison
$460
$746
+$217+$46
+$23
0
100
200
300
400
500
600
700
800
Q42013
Potash Nitrogen Phosphate Q42014
Gross Margin - US$ Millions
Potash Highlights:
• Record global demand resulted in higher sales
volumes and slightly stronger realized prices
• Costs declined on production efficiencies and
favorable foreign exchange
Nitrogen Highlights:
• Strong market fundamentals resulted in higher
realized prices
• Per-tonne costs increased due to downtime at Lima
and higher gas costs
Phosphate Highlights:
• Improved market fundamentals supported higher
realized prices
• Sales volumes declined due to closure of
Suwannee River
• Costs increased on lower production levels and
higher ammonia and sulfur costs
Source: PotashCorp
Slide#7
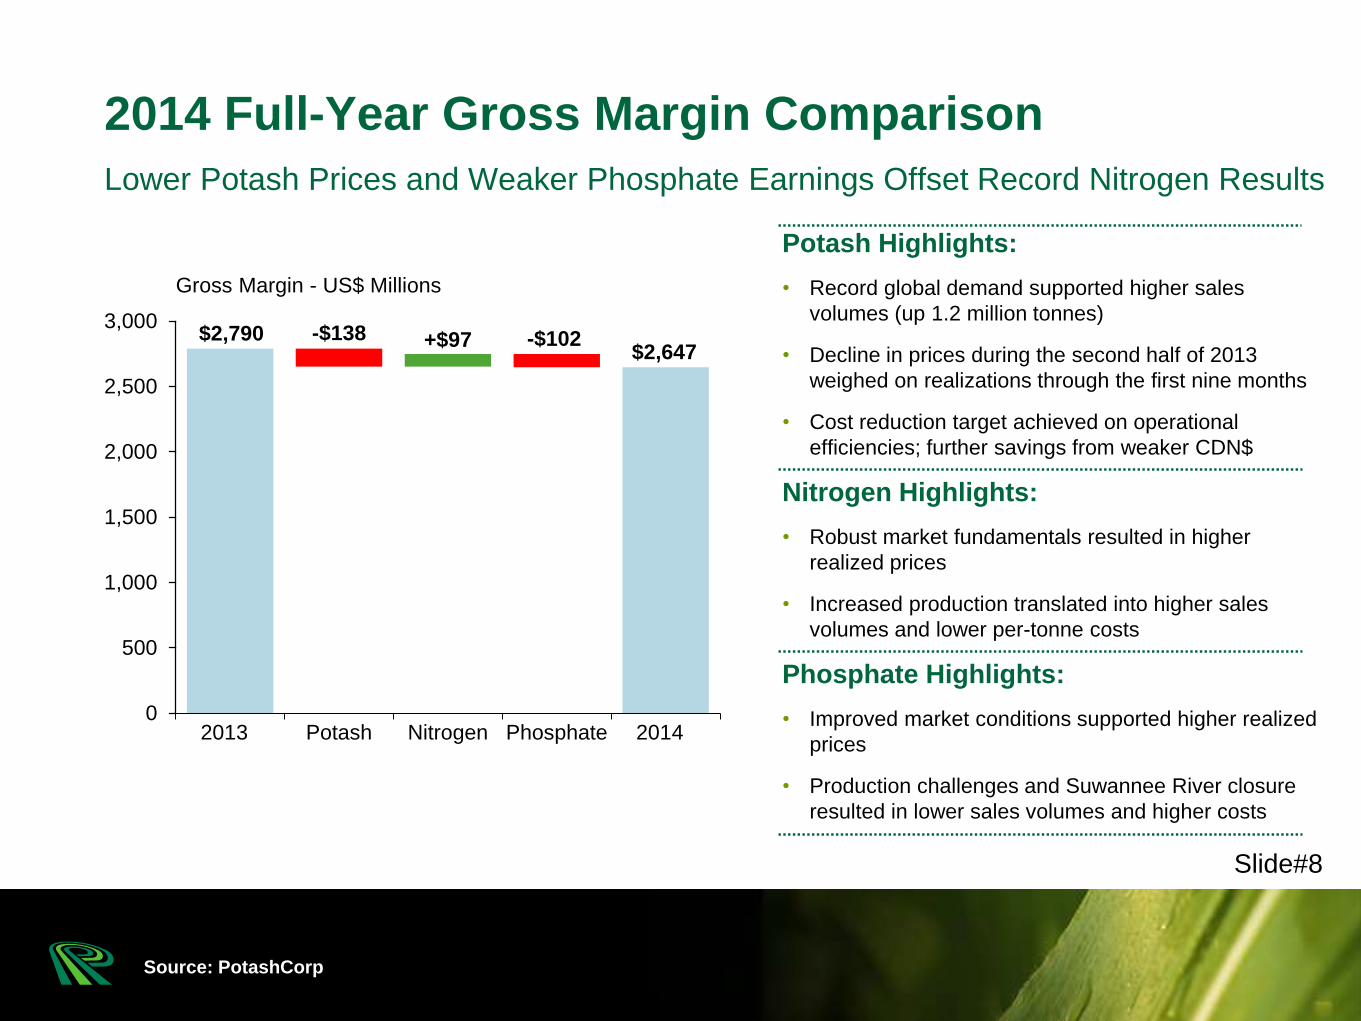
Lower Potash Prices and Weaker Phosphate Earnings Offset Record Nitrogen Results
2014 Full-Year Gross Margin Comparison
$2,790$2,647
-$138 +$97 -$102
0
500
1,000
1,500
2,000
2,500
3,000
2013 Potash Nitrogen Phosphate 2014
Gross Margin - US$ Millions
Potash Highlights:
• Record global demand supported higher sales
volumes (up 1.2 million tonnes)
• Decline in prices during the second half of 2013
weighed on realizations through the first nine months
• Cost reduction target achieved on operational
efficiencies; further savings from weaker CDN$
Nitrogen Highlights:
• Robust market fundamentals resulted in higher
realized prices
• Increased production translated into higher sales
volumes and lower per-tonne costs
Phosphate Highlights:
• Improved market conditions supported higher realized
prices
• Production challenges and Suwannee River closure
resulted in lower sales volumes and higher costs
Source: PotashCorp
Slide#8

Slide#9
Strategy and Outlook
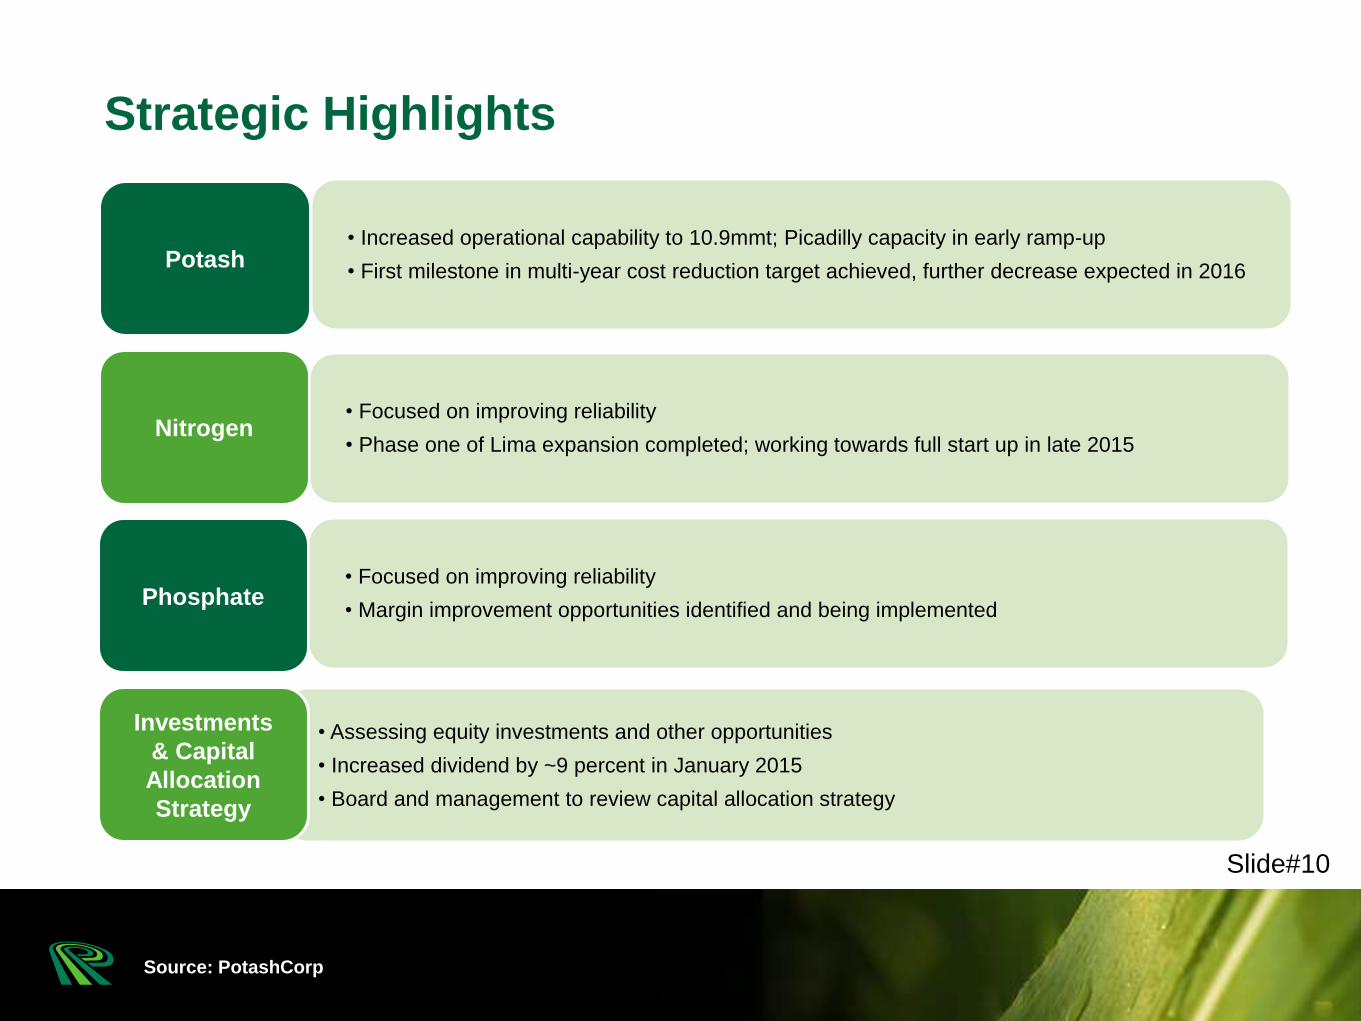
Strategic Highlights
Source: PotashCorp
Slide#10
Potash
Nitrogen
Phosphate
• Assessing equity investments and other opportunities
• Increased dividend by ~9 percent in January 2015
• Board and management to review capital allocation strategy
Investments
& Capital
Allocation
Strategy
• Focused on improving reliability
• Margin improvement opportunities identified and being implemented
• Focused on improving reliability
• Phase one of Lima expansion completed; working towards full start up in late 2015
• Increased operational capability to 10.9mmt; Picadilly capacity in early ramp-up
• First milestone in multi-year cost reduction target achieved, further decrease expected in 2016
Source: PotashCorp
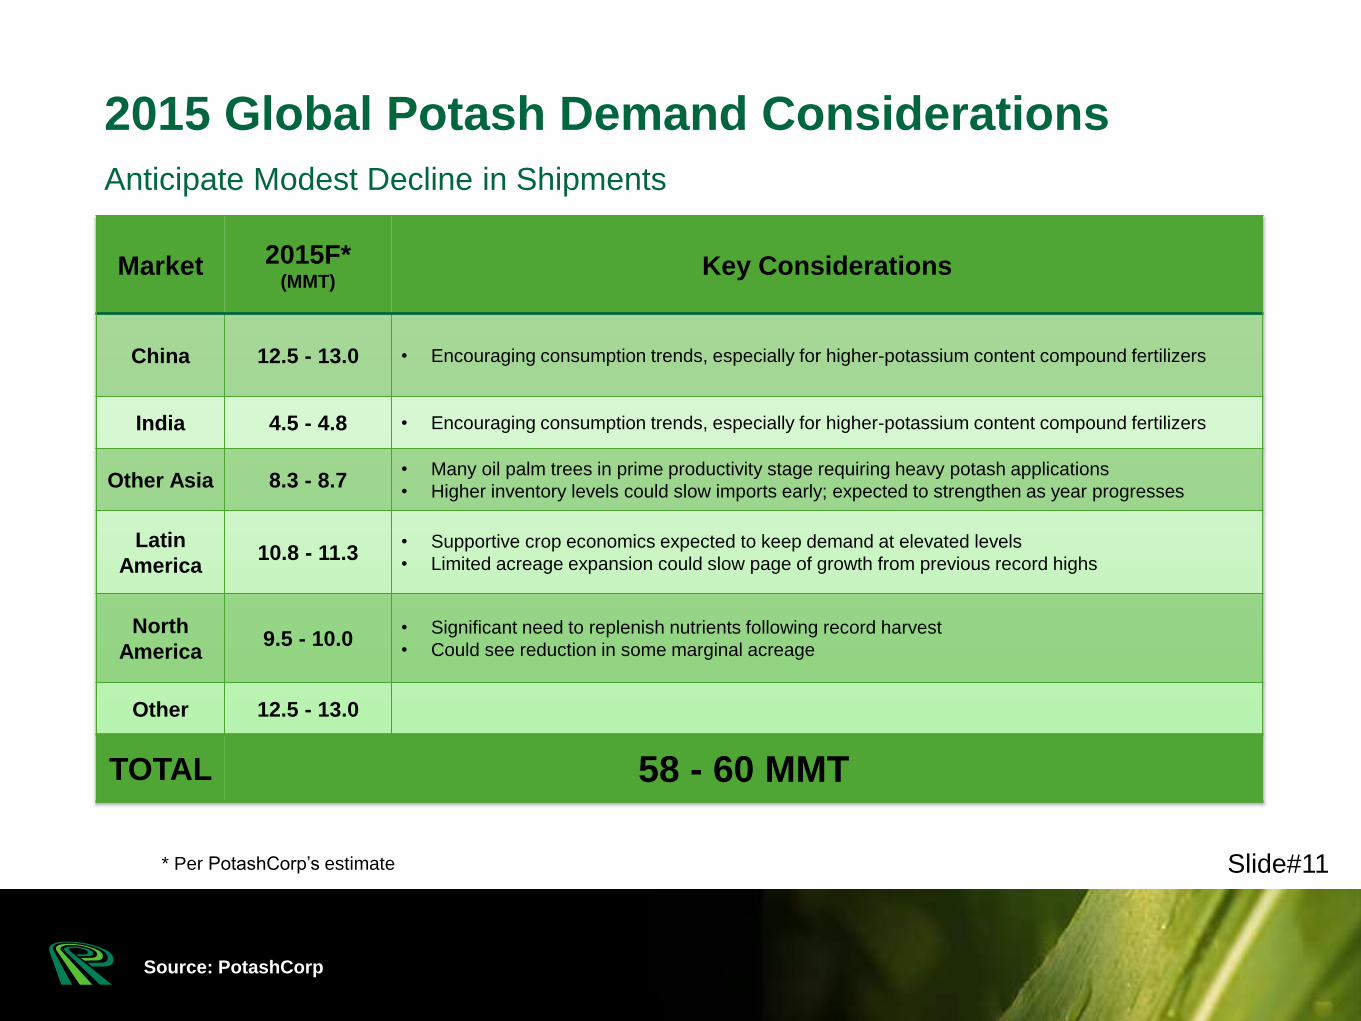
Anticipate Modest Decline in Shipments
2015 Global Potash Demand Considerations
Slide#11* Per PotashCorp’s estimate
Market 2015F*(MMT)
Key Considerations
China 12.5 - 13.0 • Encouraging consumption trends, especially for higher-potassium content compound fertilizers
India 4.5 - 4.8 • Encouraging consumption trends, especially for higher-potassium content compound fertilizers
Other Asia 8.3 - 8.7• Many oil palm trees in prime productivity stage requiring heavy potash applications
• Higher inventory levels could slow imports early; expected to strengthen as year progresses
Latin
America10.8 - 11.3
• Supportive crop economics expected to keep demand at elevated levels
• Limited acreage expansion could slow page of growth from previous record highs
North
America9.5 - 10.0
• Significant need to replenish nutrients following record harvest
• Could see reduction in some marginal acreage
Other 12.5 - 13.0
TOTAL 58 - 60 MMT
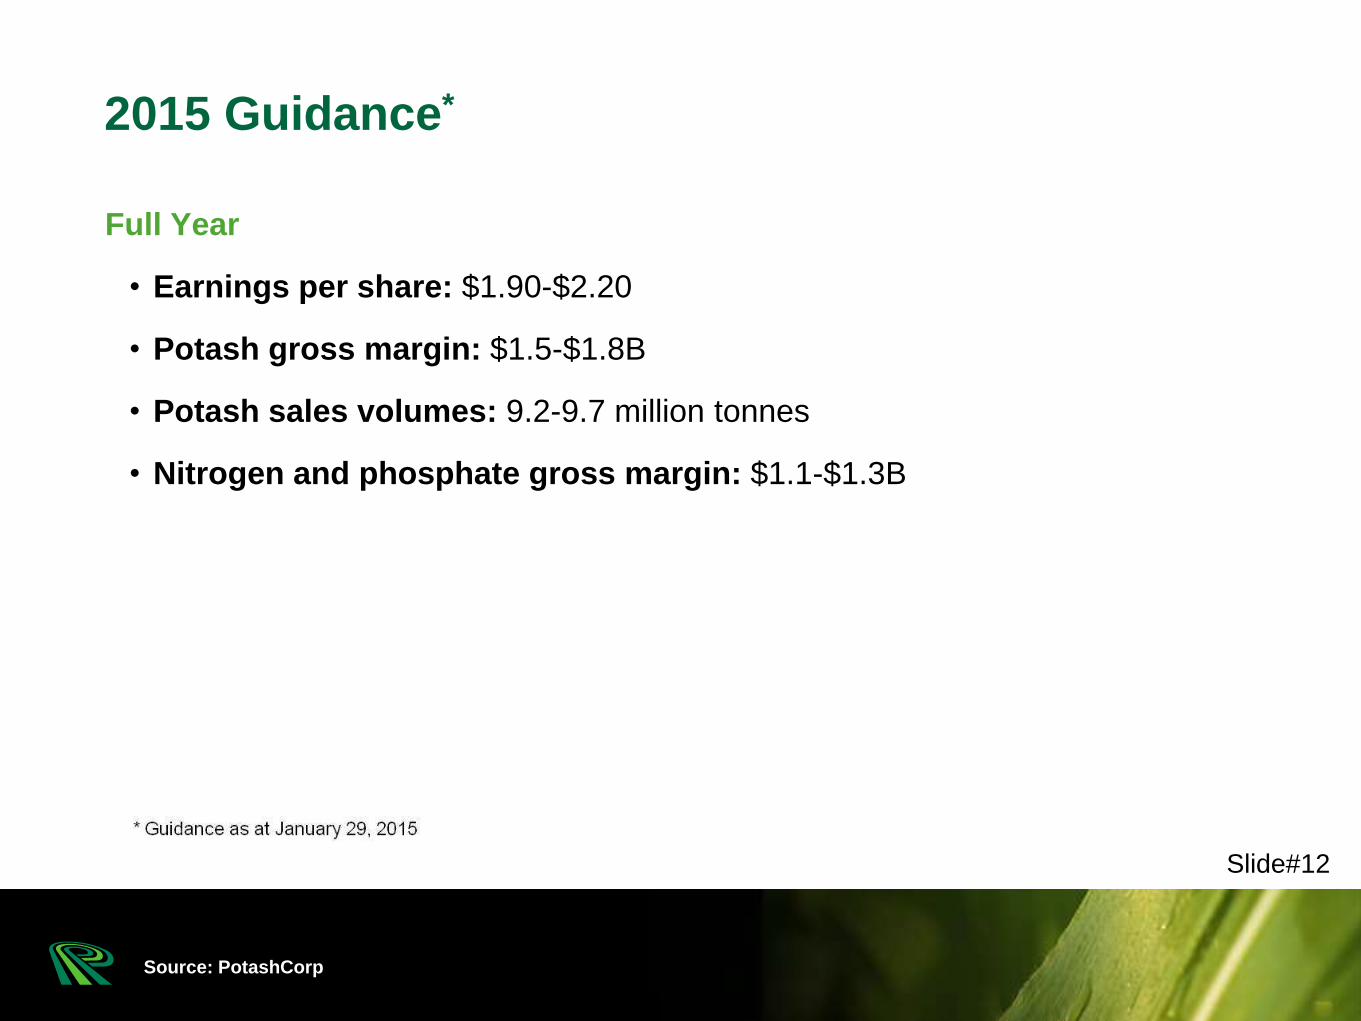
2015 Guidance*
Full Year
• Earnings per share: $1.90-$2.20
• Potash gross margin: $1.5-$1.8B
• Potash sales volumes: 9.2-9.7 million tonnes
• Nitrogen and phosphate gross margin: $1.1-$1.3B
Source: PotashCorp
Slide#12
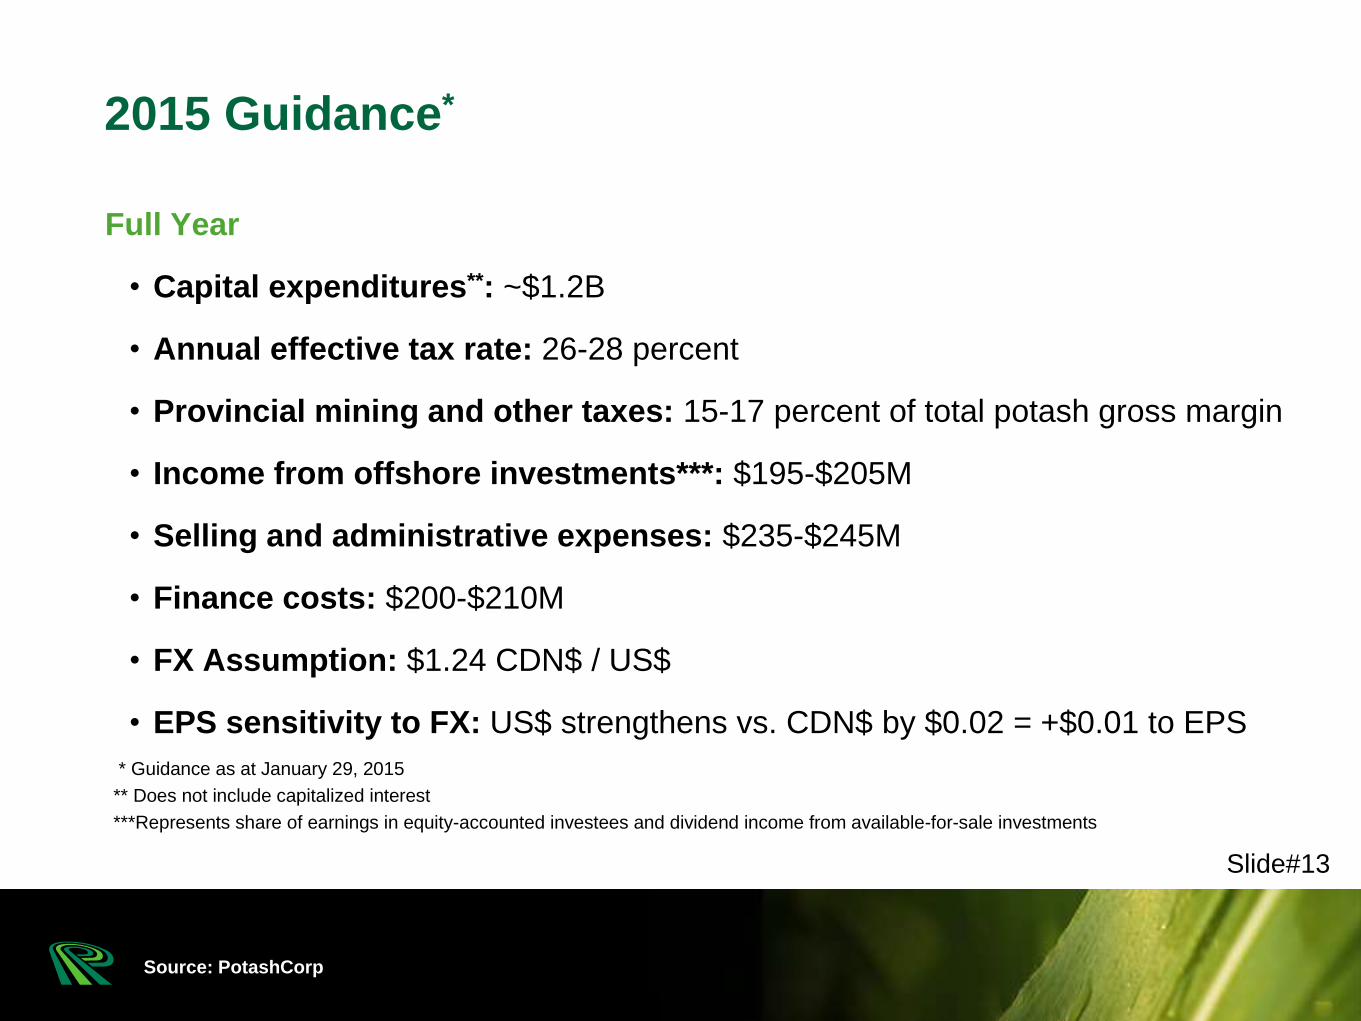
2015 Guidance*
Full Year
• Capital expenditures**: ~$1.2B
• Annual effective tax rate: 26-28 percent
• Provincial mining and other taxes: 15-17 percent of total potash gross margin
• Income from offshore investments***: $195-$205M
• Selling and administrative expenses: $235-$245M
• Finance costs: $200-$210M
• FX Assumption: $1.24 CDN$ / US$
• EPS sensitivity to FX: US$ strengthens vs. CDN$ by $0.02 = +$0.01 to EPS
Source: PotashCorp
Slide#13
* Guidance as at January 29, 2015
** Does not include capitalized interest
***Represents share of earnings in equity-accounted investees and dividend income from available-for-sale investments
0.0
0.5
1.0
1.5
2.0
2.5
2008 2010 2012 2014 2016E 2018E
Source: PotashCorp
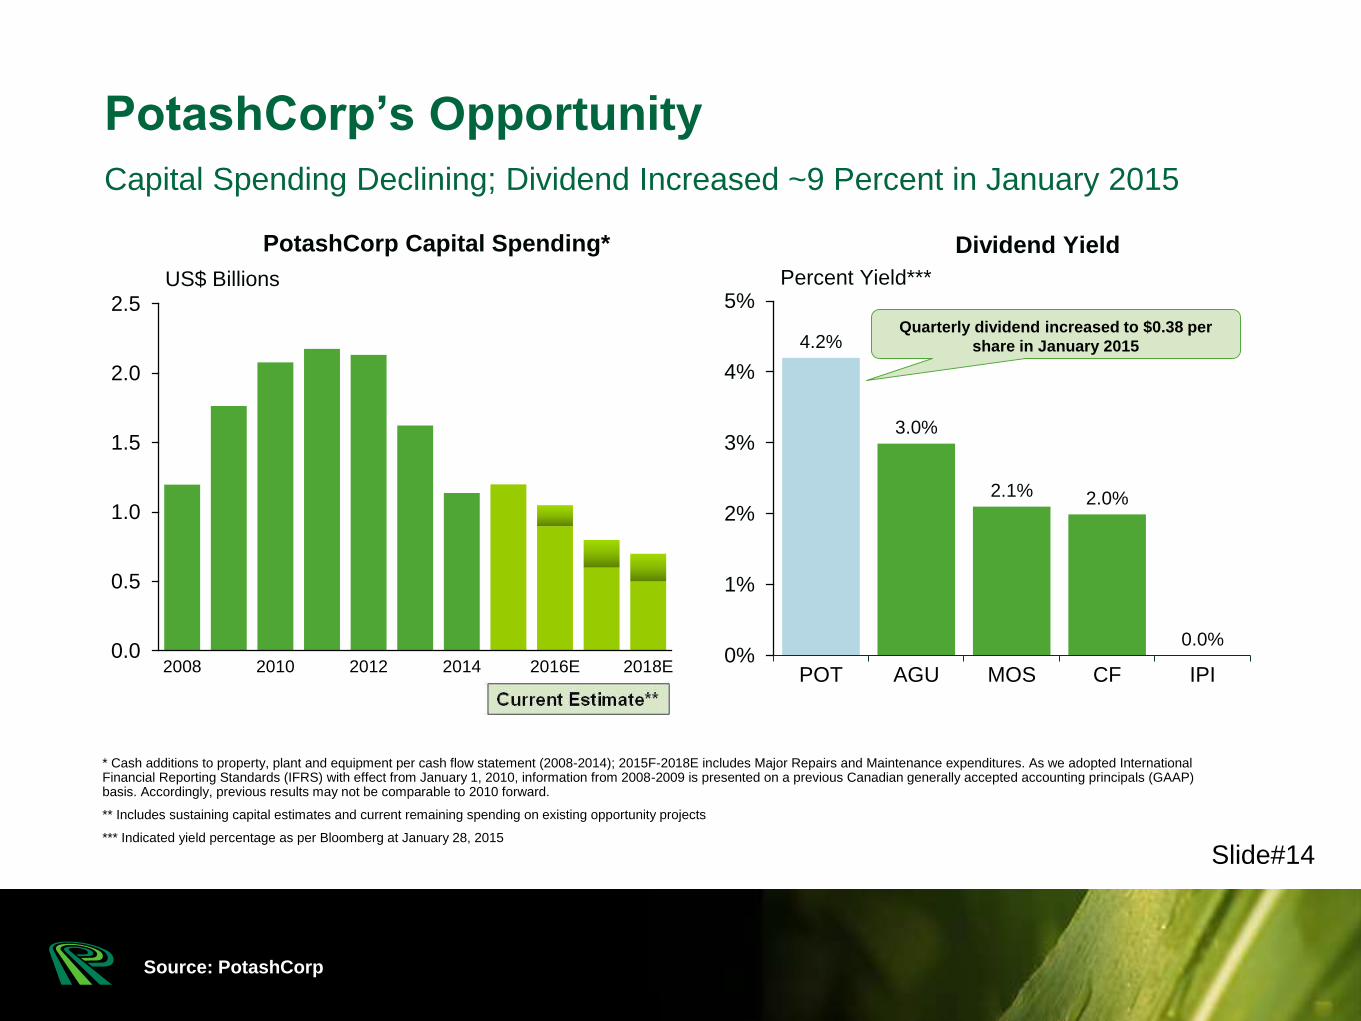
PotashCorp Capital Spending*
Capital Spending Declining; Dividend Increased ~9 Percent in January 2015
PotashCorp’s Opportunity
US$ Billions
Slide#14
4.2%
3.0%
2.1% 2.0%
0.0%0%
1%
2%
3%
4%
5%
POT AGU MOS CF IPI
Percent Yield***
Dividend Yield
Quarterly dividend increased to $0.38 per
share in January 2015
* Cash additions to property, plant and equipment per cash flow statement (2008-2014); 2015F-2018E includes Major Repairs and Maintenance expenditures. As we adopted International Financial Reporting Standards (IFRS) with effect from January 1, 2010, information from 2008-2009 is presented on a previous Canadian generally accepted accounting principals (GAAP) basis. Accordingly, previous results may not be comparable to 2010 forward.
** Includes sustaining capital estimates and current remaining spending on existing opportunity projects
*** Indicated yield percentage as per Bloomberg at January 28, 2015

There’s more online:
PotashCorp.comVisit us online
Facebook.com/PotashCorpFind us on Facebook
Twitter.com/PotashCorpFollow us on Twitter
Thank you
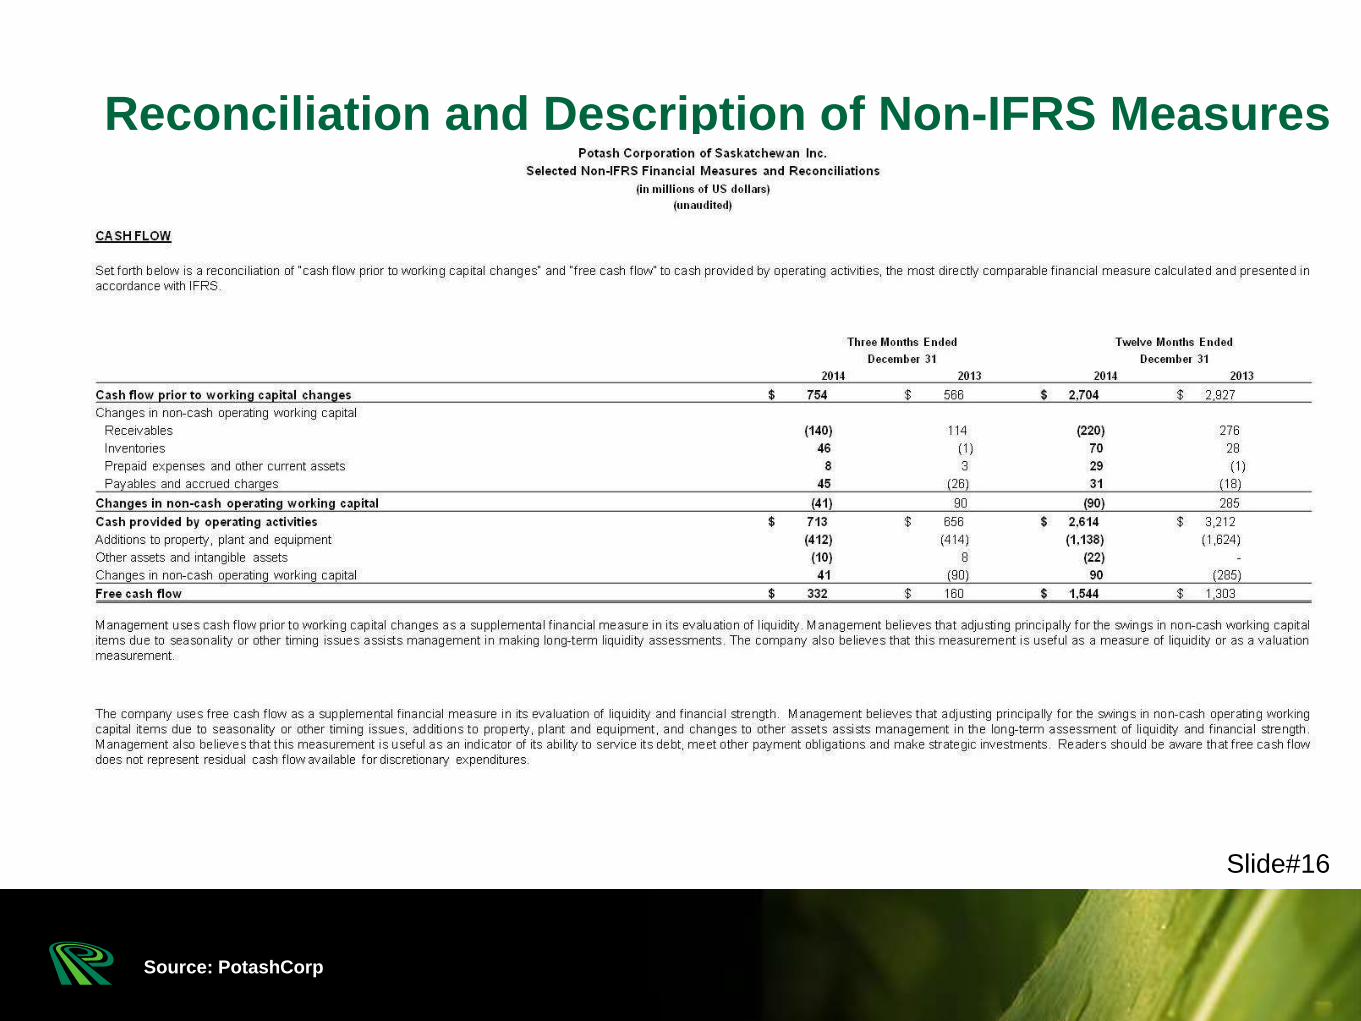
Reconciliation and Description of Non-IFRS Measures
Source: PotashCorp
Slide#16