Q4 I FY 2015 Hapag-Lloyd AG Investor Report profit / loss million USD – 52 – 499 126 – 802...
24
Q4 I FY 2015 Hapag-Lloyd AG Investor Report 1 January to 31 December 2015
Transcript of Q4 I FY 2015 Hapag-Lloyd AG Investor Report profit / loss million USD – 52 – 499 126 – 802...

Q4 I FY 2015Hapag-Lloyd AG
InvestorReport1 January to 31 December 2015

1) MFO = Marine Fuel Oil2) MDO = Marine Diesel Oil
Disclaimer: This Investor Report presents supplemental information to the respective Interim or Annual Report of Hapag-Lloyd AG for capital markets participants. It has not been reviewed by auditors. The Hapag-Lloyd AG reporting currency is EUR. Translation into USD has been undertaken for information purposes only. The respective Interim and Annual Reports of Hapag-Lloyd AG remain to be the prevailing and legally binding documents.
This report was published on 23 March 2016.
3) The CSAV container shipping activities are included in the numbers for 2014 from the date of the consolidation (2 December 2014) onwards and are therefore only included for the month of December.
SUMMARY OF HAPAG-LLOYD KEY FIGURES
KEY OPERATING FIGURES Q4 2015 Q4 20143) FY 2015 FY 20143) % Change
Total vessels, of which 177 191 177 191 – 7%
own vessels 68 77 68 77 – 12%
leased vessels 3 5 3 5 – 40%
chartered vessels 106 109 106 109 – 3%
Aggregate capacity of vessels TTEU 966 1,009 966 1,009 – 4%
Aggregate container capacity TTEU 1,564 1,619 1,564 1,619 – 3%
Bunker price (MFO, average for the period) 1) USD/t 245 525 312 575 – 46%
Bunker price (MDO, average for the period) 2) USD/t 465 814 540 898 – 40%
Freight rate (average for the period) USD/TEU 1,116 1,412 1,225 1,427 – 14%
Transport volume TTEU 1,822 1,560 7,401 5,907 25%
Revenue million USD 2,225 2,412 9,814 9,046 8%
Transport expenses million USD 1,857 2,179 8,057 8,053 0%
EBITDA million USD 152 – 111 922 131 602%
EBIT million USD 18 – 403 407 – 509 n.m.
Group profit / loss million USD – 52 – 499 126 – 802 n.m.
Cash flow from operating activities million USD 95 280 635 501 27%
Investment in property, plant and equipment million USD 46 96 836 439 91%
KEY RETURN FIGURES
EBITDA margin (EBITDA / revenue) 6.8% – 4.6% 9.4% 1.5% 7.9 ppt
EBIT margin (EBIT / revenue) 0.8% – 16.7% 4.1% – 5.6% 9.8 ppt
KEY BALANCE SHEET FIGURES AS AT 31 DECEMBER
Balance sheet total million USD 12,069 12,271 – 2%
Equity million USD 5,497 5,068 8%
Equity ratio (equity / balance sheet total) 45.5% 41.3% 4.2 ppt
Borrowed capital million USD 6,572 7,203 – 9%
KEY FINANCIAL FIGURES AS AT 31 DECEMBER
Financial debt million USD 4,256 4,518 – 6%
Cash and cash equivalents million USD 625 865 – 28%
Net debt (financial debt – cash and cash equivalents) million USD 3,631 3,653 – 1%
Gearing (net debt / equity) 66.1% 72.1% – 6.0 ppt
Net debt / EBITDA 3.9x 27.8x – 23.9x
Unused credit lines 423 256 66%
Liquidity reserve 1,048 1,121 – 6%
NUMBER OF EMPLOYEES AS AT 31 DECEMBER
Employees at sea 1,519 1,504 1%
Employees on land 7,898 9,019 – 12%
HAPAG-LLOYD TOTAL 9,417 10,523 – 11%
3
Q4 / FY 2015 I INVESTOR REPORT
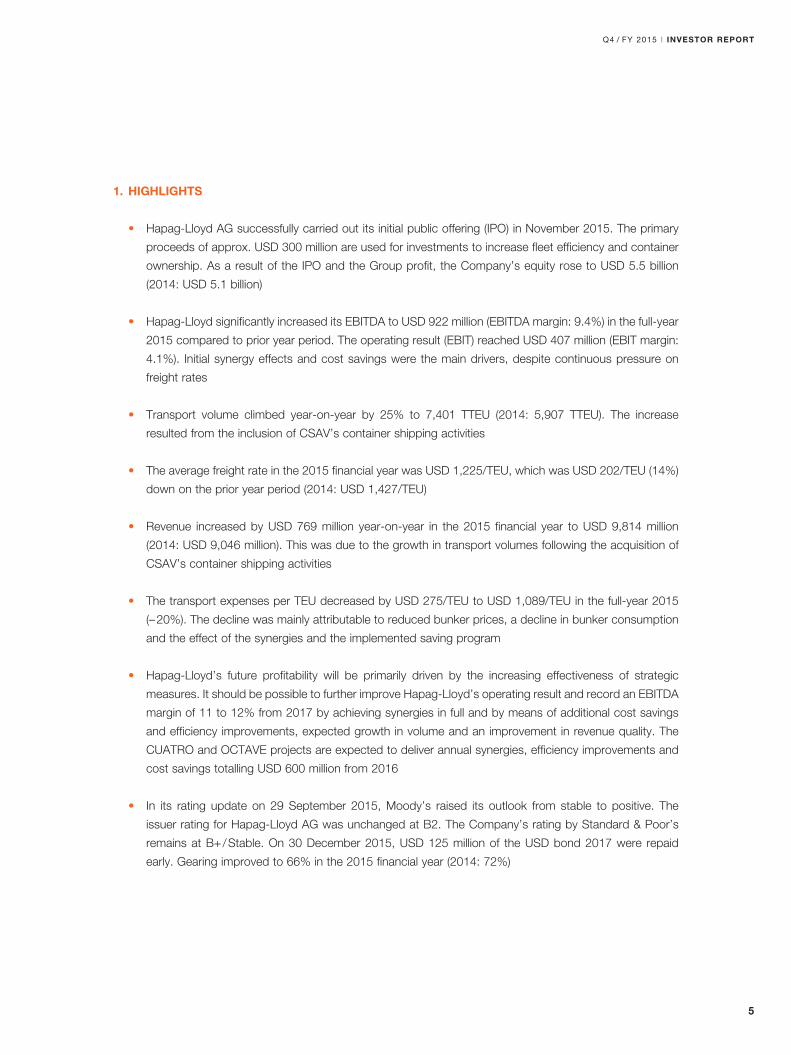
CONTENTS
1. Highlights 5
2. Sector-specific conditions 6
3. Structure of Hapag-Lloyd’s vessel and container fleet 8
4. Group earnings position 9
4.1 Freight rate per trade 9
4.2 Transport volume per trade 9
4.3 Revenue per trade 10
4.4 Consolidated income statement 10
4.5 Transport expenses 12
4.6 Earnings position 14
5. Group net asset position 15
5.1 Changes in the net asset structure 15
5.2 Return on invested capital 16
6. Group financial position 17
6.1 Developments in cash and cash equivalents 17
6.2 Financial position 18
7. Events after the balance sheet date 20
8. Outlook 20
9. Financial calendar 2016 22
10. Disclaimer 23

4
INVESTOR REPORT I Q4 / FY 2015
The information provided in this Investor Report is based on a calculation of USD figures, derived from the
figures published in EUR within the respective Interim or Annual Report of Hapag-Lloyd AG (available via
http://ir.hapag-lloyd.com/websites/hapaglloyd/English/4000/publications.html).
The container shipping activities acquired from CSAV have been consolidated from 2 December 2014. As
such, figures for 2015 can only be compared with those of previous years to a limited extent.
The USD figures presented herein have not been reviewed by auditors and are supplemental information to the
respective Interim or Annual Report of Hapag-Lloyd AG for capital market participants. The respective Interim
and Annual Reports of Hapag-Lloyd AG remain the prevailing and legally binding documents.
Hapag-Lloyd AG conducts its container shipping business in an international business environment in which
transactions are invoiced mainly in US dollars and payment procedures are handled in US dollars. This relates
not only to operating business transactions, but also to investment activities, an example being the purchase,
chartering and rental of vessels and containers, as well as the corresponding financing of investments. The
functional currency of Hapag-Lloyd AG is, therefore, the US dollar. The reporting currency of Hapag-Lloyd AG
is, however, the EUR.
For reconciliation to the Annual Report 2015, please find below the respective exchange rates:
• Values for Q4 2015 / Q4 2014 have been calculated by subtracting the 9M 2015 / 9M 2014 values from
the full-year 2015 / full-year 2014 figures.
• 9M 2015 / 9M 2014 values have been converted at the respective 9M 2015 / 9M 2014 exchange rates.
• For full-year 2015 / full-year 2014 values the respective full-year 2015 / full-year 2014 exchange rates
have been used.
• Values for Q3 2015 have been calculated by subtracting the H1 2015 figures from the 9M 2015 figures.
• H1 2015 values have been converted at the respective H1 2015 exchange rates.
This report contains statements concerning future developments at Hapag-Lloyd AG. Due to market fluctua-
tions, the development of the competitive situation, market prices for commodities, and changes in exchange
rates and the economic environment, the actual results may differ considerably from these forecasts. Hapag-
Lloyd AG neither intends nor undertakes to update forward-looking statements to adjust them for events or
developments, which occur after the date of this report.
This report was published on 23 March 2016.
IMPORTANT NOTICE
EXCHANGE RATES
Closing rate Average rate
per EUR 31.12.2015 30.09.2015 31.12.2014 FY 2015 9M 2015 FY 2014 9M 2014
US dollars 1.0893 1.1215 1.2155 1.1100 1.1151 1.3288 1.3555
5
Q4 / FY 2015 I INVESTOR REPORT
1. HIGHLIGHTS
• Hapag-Lloyd AG successfully carried out its initial public offering (IPO) in November 2015. The primary
proceeds of approx. USD 300 million are used for investments to increase fleet efficiency and container
ownership. As a result of the IPO and the Group profit, the Company’s equity rose to USD 5.5 billion
(2014: USD 5.1 billion)
• Hapag-Lloyd significantly increased its EBITDA to USD 922 million (EBITDA margin: 9.4%) in the full-year
2015 compared to prior year period. The operating result (EBIT) reached USD 407 million (EBIT margin:
4.1%). Initial synergy effects and cost savings were the main drivers, despite continuous pressure on
freight rates
• Transport volume climbed year-on-year by 25% to 7,401 TTEU (2014: 5,907 TTEU). The increase
resulted from the inclusion of CSAV’s container shipping activities
• The average freight rate in the 2015 financial year was USD 1,225/TEU, which was USD 202/TEU (14%)
down on the prior year period (2014: USD 1,427/TEU)
• Revenue increased by USD 769 million year-on-year in the 2015 financial year to USD 9,814 million
(2014: USD 9,046 million). This was due to the growth in transport volumes following the acquisition of
CSAV’s container shipping activities
• The transport expenses per TEU decreased by USD 275/TEU to USD 1,089/TEU in the full-year 2015
(– 20%). The decline was mainly attributable to reduced bunker prices, a decline in bunker consumption
and the effect of the synergies and the implemented saving program
• Hapag-Lloyd’s future profitability will be primarily driven by the increasing effectiveness of strategic
measures. It should be possible to further improve Hapag-Lloyd’s operating result and record an EBITDA
margin of 11 to 12% from 2017 by achieving synergies in full and by means of additional cost savings
and efficiency improvements, expected growth in volume and an improvement in revenue quality. The
CUATRO and OCTAVE projects are expected to deliver annual synergies, efficiency improvements and
cost savings totalling USD 600 million from 2016
• In its rating update on 29 September 2015, Moody’s raised its outlook from stable to positive. The
issuer rating for Hapag-Lloyd AG was unchanged at B2. The Company’s rating by Standard & Poor’s
remains at B+ / Stable. On 30 December 2015, USD 125 million of the USD bond 2017 were repaid
early. Gearing improved to 66% in the 2015 financial year (2014: 72%)

6
INVESTOR REPORT I Q4 / FY 2015
2. SECTOR-SPECIFIC CONDITIONS
According to the IMF, the volume of global trade, which is key to the demand for container shipping services,
is forecast to increase by 3.4% in the current year and by 4.1% in 2017. This means that global trade will grow
at around the same pace as the global economy in 2016 and faster than it in 2017. Above all, imports and
exports to and from the emerging markets and the US are expected to continue to rise at an above-average
rate compared with global trade in the period under review.
With the world trading volume forecast to grow, demand for container shipping services is likewise expected
to increase further over the next few years. For instance, IHS Global Insight (February 2016) expects a 3.5%
increase in the global container shipping volume in 2016 and growth of 4.9% to approximately 140 million TEU
in 2017. This would put the forecast rise in worldwide transport volumes in container shipping for 2016 and
2017 slightly above the rate of growth for global trade. Current forecasts put the expected compound annual
growth rate (CAGR) for the period from 2016 to 2020 at 4.9%, compared with an average growth rate of 3.1%
between 2010 and 2015. The volume of global container shipping could reach approximately 161.5 million
TEU in 2020. As a result, container shipping will continue to be a growth industry in the medium to long term.
Due to a generally only modest rate of global economic growth, the increase in global container shipping ser-
vices was just 1.0% last year (2014: 4.3%), according to calculations by IHS Global Insight (February 2016).
With the exception of the Far East trade, the various trades saw an increase in container shipping volumes in
2015: Transpacific (+1.6%), Far East (–2.8%), Intra-Asia (+1.8%), Atlantic (+1.8%) and Latin America (+2.0%).
Transport volumes and freight rates in container liner shipping are subject to seasonal fluctuations. Demand for
transport services is traditionally higher in the second and third quarter of any given year.
While the rate of global trade growth determines the demand for container shipping services, putting new
vessels into service and scrapping inefficient ones are the most important factors influencing the supply of
transport capacities. Supply has grown at a faster pace than demand in recent years as a result of new and
particularly large container ships continually being put into service. This led to continued pressure on freight
rates in all trades again in 2015.
The capacity of all the ship newbuilds on order as at 31 December 2015 totalled approximately 4.0 million TEU
(2014: 3.2 million TEU). However, at around 19% of the global container fleet’s capacity, the TEU capacity of
DEVELOPMENTS IN GLOBAL ECONOMIC GROWTH (GDP), WORLD TRADING VOLUME AND GLOBAL CONTAINER TRANSPORT VOLUME
in % 2013 2014 2015e 2016e 2017e
Global economic growth 3.3 3.4 3.1 3.4 3.6
World trading volume (goods and services) 3.3 3.4 2.6 3.4 4.1
Global container transport volume 2.3 4.3 1.0 3.5 4.9
Source: IMF, IHS Global Insight

7
Q4 / FY 2015 I INVESTOR REPORT
the container ships on order in the fourth quarter of 2015 remained far below the record high of 56% seen in
2008. The heightened trend towards larger vessels is reflected in the distribution of the orders. Approximately
85% of ship newbuild orders are for vessels with a capacity of over 8,000 TEU (MDS Transmodal, February
2016). In 2015, around 87% of the ships delivered were vessels with capacity of over 8,000 TEU (approximately
1.7 million TEU).
With the total capacity of the world container ship fleet estimated at 21.0 million TEU at the end of 2015
(MDS Transmodal, February 2016), the supply capacity should – based on the current orders – see increases
of 1.4 million TEU in both 2016 and 2017.
Continuing pressure on freight rates in 2015 and disappointing volume developments in the second half of
2015 led to a dramatic increase in the idle fleet from the third quarter of 2015 onwards. The level of idle vessels
at the end of 2015 came to around 1.36 million TEU (AXS-Alphaliner, January 2016), compared with “free”
capacities of approximately 228,000 TEU at the end of 2014. The “free” capacities thus corresponded to ap-
proximately 6.5% of the global container fleet’s total tonnage, the highest level since 2010. Of the 331 vessels
idle at the end of 2015, only approximately 46% are smaller ships of up to 3,000 TEU at present (2014: 86%).
The projected nominal increase in the global container ship fleet’s transport capacity is expected to be reduced
due to the scrapping of older and less efficient vessels, delays in the delivery of ship newbuilds and the use of
slow steaming (reducing the speed at which services operate).
According to the sector information service Drewry (December 2015), only container vessels with an aggregate
transport capacity of around 150,000 TEU were scrapped in 2015 (2014: 381,000 TEU, 2013: 444,000 TEU).
Scrapping activities in 2015 therefore fell well short of the level seen in the previous years. A scrapping level
of 250,000 TEU is predicted for 2016. The continuing low level of scrapping may lead to increased pressure
on freight rates.
Although the prospects for growth remain positive in the medium term, there may be temporary imbalances
in supply and demand, which could have a substantial impact on the respective transport volumes and freight
rates. For example, as more and more new vessels go into service, transport capacities will increase sharply,
further affecting the development of freight rates in all the trades.
GLOBAL CAPACITY DEVELOPMENT
in % 2013 2014 2015e 2016e1) 2017e1)
Forecasted capacity growth 12 10 11 7 6
Capacity measures
Delayed deliveries 4 3 1 1 1
Scrappings 3 2 1 1 1
Actual increase in capacity 5 5 9 5 41) Based on current orderbook
Source: Drewry, MDS Transmodal

8
INVESTOR REPORT I Q4 / FY 2015
3. STRUCTURE OF HAPAG-LLOYD’S VESSEL AND CONTAINER FLEET
The total TEU capacity of Hapag-Lloyd’s container ship fleet amounted to approximately 966 TTEU as at the
balance sheet date. The average ship size within the Hapag-Lloyd fleet was 5,458 TEU (31 December 2015),
which is around 9% above the average for the 20 largest container shipping companies and around 66%, or
2,177 TEU, above the average ship size in the global container fleet. The Company’s own or leased ships rep-
resented around 54% of total TEU capacity at the end of 2015 (31 December 2014: 53%). As at the balance
sheet date of 31 December 2015, the order book corresponded to around 5.4% of the transport capacity of
the total Hapag-Lloyd fleet. Depending on the expected growth in demand for container shipping services,
Hapag-Lloyd may invest in new ship systems to exploit medium-term market opportunities.
Hapag-Lloyd also owned or leased 969,723 containers (including reefer containers) with a capacity of ap-
proximately 1,564 TTEU for transporting cargo. Around 42% of containers were owned by the Company, as
measured by transport capacity, at the end of 2015 (previous year: 33%) and approximately 58% of containers
were leased as at 31 December 2015.
With a fleet of around 77,000 reefer containers capable of transporting approximately 146,200 TEU, Hapag-
Lloyd has a much stronger competitive position in the attractive market segment for refrigerated shipping.
STRUCTURE OF HAPAG-LLOYD'S VESSEL AND CONTAINER FLEET
31.12.2015 30.09.2015 31.12.2014
Number of vessels 177 175 191
Aggregate capacity of vessels (TTEU) 966 946 1.009
thereof
Number of own vessels 68 68 77
Aggregate capacity of own vessels (TTEU) 512 512 514
Number of leased vessels 3 3 5
Aggregate capacity of leased vessels (TTEU) 12 12 21
Number of chartered vessels 106 104 109
Aggregate capacity of chartered vessels (TTEU) 442 422 474
Aggregate container capacity (TTEU) 1,564 1,613 1,619
Number of services 121 122 119
The figures for 2014 relate to Hapag-Lloyd’s fleet including the container shipping activities acquired from CSAV.

9
Q4 / FY 2015 I INVESTOR REPORT
4. GROUP EARNINGS POSITION
4.1 Freight rate per trade
The average freight rate in the 2015 financial year was USD 1,225/TEU, which was USD 202/TEU (14.2%)
down on the prior year period (USD 1,427/TEU). Besides the initial inclusion of CSAV’s container shipping
activities, which had a lower freight rate level overall, the main reason for the decline was the ongoing difficult
market environment, with pressure on freight rates persisting throughout the year and continuing in the fourth
quarter of 2015. On a comparable basis (by including CSAV’s container shipping activities for the full year
2014), the average freight rate for 2014 would have been USD 1,369/TEU. This would have meant a drop of
USD 144/TEU, or 10.5%, in the average freight rate.
4.2 Transport volume per tradeThe transport volume climbed year-on-year from 5,907 TTEU to 7,401 TTEU, which reflected an increase of
25.3%. The increase resulted from the inclusion of CSAV’s container shipping activities. Overall, however,
transport volumes did not develop as well as expected, mainly due to weak economic developments in Latin
America and China. On a comparable basis (by including CSAV’s container shipping activities for the full year
2014), the transport volume in 2014 would have come to 7,681 TTEU, which would have meant a decrease
of 3.6% in the transport volume.
FREIGHT RATE PER TRADE *
USD/TEU
Q4 2015 Q3 2015 Q4 2014** QoQ % change
YoY % change
FY 2015 FY 2014** YoY % change
Atlantic 1,476 1,526 1,598 – 3% – 8% 1,504 1,585 – 5%
Transpacific 1,452 1,548 1,791 – 6% – 19% 1,599 1,768 – 10%
Far East 829 876 1,129 – 5% – 27% 942 1,179 – 20%
Latin America 968 1,025 1,346 – 6% – 28% 1,111 1,357 – 18%
Intra Asia 576 635 792 – 9% – 27% 655 796 – 18%
EMAO (Europe–Mediterranean–Africa–Oceania) 1,131 1,226 1,350 – 8% – 16% 1,210 1,407 – 14%
Total (weighted average) 1,116 1,189 1,412 – 6% – 21% 1,225 1,427 – 14%
* The trades have been restructured and the assignment of individual services amended as part of the CSAV Integration. The prior period figures have been amended accordingly.
** The figures for 2014 include the container shipping activities acquired from CSAV from the date of first-time consolidation 2 December 2014.
TRANSPORT VOLUME PER TRADE *
TTEU
Q4 2015 Q3 2015 Q4 2014** QoQ % change
YoY % change
FY 2015 FY 2014** YoY % change
Atlantic 368 398 357 – 8% 3% 1,541 1,446 7%
Transpacific 347 363 325 – 4% 7% 1,390 1,319 5%
Far East 307 320 279 – 4% 10% 1,283 1,135 13%
Latin America 549 550 379 0% 45% 2,247 1,158 94%
Intra Asia 153 140 129 9% 19% 573 491 17%
EMAO (Europe–Mediterranean–Africa–Oceania) 98 90 91 9% 8% 367 358 3%
Total 1,822 1,861 1,560 – 2% 17% 7,401 5,907 25%
* The trades have been restructured and the assignment of individual services amended as part of the CSAV Integration. The prior period figures have been amended accordingly.
** The figures for 2014 include the container shipping activities acquired from CSAV from the date of first-time consolidation 2 December 2014.

10
4.3 Revenue per trade
Revenue increased by USD 768.6 million year-on-year in the full-year 2015, from USD 9,045.8 million to
USD 9,814.4 million. This was due to the growth in transport volumes following the incorporation of CSAV’s
container shipping activities.
4.4 Consolidated income statement
The earnings position is only comparable with the corresponding prior year period to a limited degree, as
CSAV’s container shipping activities were included in the consolidated financial statements of Hapag-Lloyd AG
for the first-time from 2 December 2014.
The Hapag-Lloyd Group’s performance in the 2015 financial year was once again dominated by weak econo-
mic developments in Latin America and China. The global economy grew by just 3.1% in 2015, falling short of
the IMF’s original forecast of 3.5% (January 2015). As in the previous year, the intense competition in container
shipping continued to put considerable pressure on freight rates. By contrast, initial synergy effects and cost
savings in particular had a very positive impact on the Group’s earnings position, as did a further drop in the
bunker price this year compared with the previous year. Overall, Hapag-Lloyd recorded a profit of USD 126.4
million in the 2015 financial year, which was a substantial improvement of USD 928.6 million compared with
the prior year period.
INVESTOR REPORT I Q4 / FY 2015
REVENUE PER TRADE *
million USD
Q4 2015 Q3 2015 Q4 2014** QoQ % change
YoY % change
FY 2015 FY 2014** YoY % change
Atlantic 544.0 607.1 570.5 – 10% – 5% 2,317.7 2.291.4 1%
Transpacific 503.8 562.3 581.7 – 10% – 13% 2,222.4 2.331.8 – 5%
Far East 253.9 279.8 315.3 – 9% – 19% 1,207.7 1.337.8 – 10%
Latin America 532.6 564.6 509.7 – 6% 4% 2,497.2 1.571.8 59%
Intra Asia 88.3 88.7 102.2 0% – 14% 375.6 391.3 – 4%
EMAO (Europe–Mediterranean–Africa–Oceania) 111.0 109.8 122.7 1% – 10% 444.0 503.6 – 12%
Other 191.4 163.7 209.3 17% – 9% 749.8 618.0 21%
Total 2,225.0 2,376.0 2,411.5 – 6% – 8% 9,814.4 9,045.8 8%
* The trades have been restructured and the assignment of individual services amended as part of the CSAV Integration. The prior period figures have been amended accordingly.
** The figures for 2014 include the container shipping activities acquired from CSAV from the date of first-time consolidation 2 December 2014.

11
Q4 / FY 2015 I INVESTOR REPORT
Changes in the US dollar/euro exchange rate caused period-specific exchange rate gains and losses to in-
crease in the period under review. This was reflected in other operating income and other operating expenses.
Netted, the exchange rate-related income and expenses resulted in exchange rate losses of USD 30.3 million
in the 2015 financial year (prior year period: exchange rate gain of USD 5.2 million).
Depreciation and amortisation totalled USD 515.7 in the 2015 financial year (previous year: 640.1 million). The
decrease in depreciation and amortisation compared with the previous year was primarily due to the impair-
ment of a portfolio of older ships (“Old Ladies”) in the previous year amounting to USD 141.4 million. These
vessels were subsequently reclassified as held-for-sale in 2014 and sold in the 2015 financial year. This was
offset by an increase in the depreciation of acquired ships and containers and in the amortisation of acquired
intangible assets, some of which were acquired in December 2014 as a result of the acquisiton of CSAV’s
container shipping activities.
Training expenses, travel expenses and relocation expenses were incurred in the 2015 financial year due to the
integration of CSAV’s container shipping activities. At the same time, a total of USD 54.9 million of the restruc-
turing provision had to be released in this period, as implementation of some of the measures cost less than
originally planned. The release was recognised under other operating income and, in the case of provisions for
personnel measures, under personnel expenses.
CONSOLIDATED INCOME STATEMENT
million USD
Q4 2015 Q3 2015 Q4 2014 QoQ % change
YoY % change
FY 2015 FY 2014 YoY % change
Revenue 2,225.0 2,376.0 2,411.5 – 6% – 8% 9,814.4 9,045.8 8%
Other operating income 52.3 46.9 77.6 12% – 33% 215.0 155.2 39%
Transport expenses – 1,857.3 – 1,965.5 – 2,178.7 – 6% – 15% – 8,056.9 – 8,052.6 0%
Personnel expenses – 136.2 – 118.3 – 182.6 15% – 25% – 537.8 – 535.9 0%
Depreciation, amorti- sation and impairment – 134.3 – 129.5 – 292.4 4% – 54% – 515.7 – 640.1 – 19%
Other operating expenses – 173.6 – 129.1 – 244.4 34% – 29% – 574.6 – 522.7 10%
Operating result -24.1 80.5 – 409.0 – 130% – 94% 344.4 – 550.3 – 163%
Share of profit of equity- accounted investees 6.5 9.7 9.4 – 33% – 31% 31.6 45.4 – 30%
Other financial result 35.6 – 0.5 – 3.6 n.m. n.m. 30.7 – 3.8 n.m.
Earnings before interest and tax (EBIT) 18.0 89.7 – 403.2 n.m. n.m. 406.7 – 508.7 n.m.
Interest result – 63.8 – 77.7 – 86.0 – 18% – 26% – 252.3 – 278.6 – 9%
Income taxes 6.7 8.7 9.4 – 23% – 29% 28.0 14.9 88%
Group profit/loss – 52.5 3.3 – 498.6 – 1,691% – 89% 126.4 – 802.2 n.m.
The container shipping activities acquired from CSAV are included in the consolidated income statement for the previous year 2014 from their first-time consolidation as at 2 December 2014. As such, the income statement figures are only comparable with the previous year to a limited extent.

12
INVESTOR REPORT I Q4 / FY 2015
4.5 Transport expenses
Transport expenses increased slightly to USD 8,056.9 million from USD 8,052.6 million in the prior year period.
This development was mainly attributable to reduced bunker prices and decreased bunker consumption, which
led to a year-on-year decrease of USD 624.8 million in expenses for raw materials and supplies, despite the
incorporation of CSAV’s container shipping activities. This decline was primarily due to a drop of approximately
46% in bunker consumption prices and the cost savings achieved from greater bunker efficiency. In the 2015
financial year, the average bunker price (MFO) was USD 312 per tonne, down USD 263 per tonne on the prior
year period’s figure of USD 575 per tonne.
The transport expenses per TEU decreased by USD 274.6/TEU to USD 1,088.6/TEU in the financial year 2015.
The decline was mainly attributable to reduced bunker prices and a decline in bunker consumption as further
explained below. Costs of purchased services declined as well by USD –128.3/TEU as a consequence of
the realised synergies and cost savings. The decrease was mainly driven by lower container transport costs,
deriving from a lower share of inland transport in the US, as well as lower port, canal and terminal costs.
TRANSPORT EXPENSES
million USD
Q4 2015 Q3 2015 Q4 2014 QoQ % change
YoY % change
FY 2015 FY 2014 YoY % change
Expenses for raw materials and supplies 237.3 291.9 426.9 – 19% – 44% 1,185.3 1,810.2 – 35%
Cost of purchased services 1,620.0 1,673.6 1,751.8 – 3% – 8% 6,871.6 6,242.5 10%
thereof
Port, canal and terminal costs 698.9 777.9 714.5 – 10% – 2% 3,070.5 2,698.0 14%
Chartering, leases and container rentals 347.6 279.4 333.5 24% 4% 1,242.7 921.5 35%
Container transport costs 532.2 577.3 651.7 – 8% – 18% 2,384.7 2,446.9 – 3%
Maintenance/repair/other 41.2 39.0 52.1 6% – 21% 173.7 176.1 – 1%
Transport expenses 1,857.3 1,965.5 2,178.7 – 6% – 15% 8,056.9 8,052.6 0%
The container shipping activities acquired from CSAV are included in the consolidated income statement for the previous year 2014 from their first-time consolidation as at 2 December 2014. As such, the income statement figures are only comparable with the previous year to a limited extent.
TRANSPORT EXPENSES PER TEU
USD/TEU
Q4 2015 Q3 2015 Q4 2014 QoQ % change
YoY % change
FY 2015 FY 2014 YoY % change
Expenses for raw materials and supplies 130.3 156.9 273,7 – 17% – 52% 160.2 306.4 – 48%
Cost of purchased services 889.1 899.3 1,122.9 – 1% – 21% 928.5 1,056.8 – 12%
thereof
Port, canal and terminal costs 383.6 418.0 458.0 – 8% – 16% 414.9 456.8 – 9%
Chartering, leases and container rentals 190.8 150.2 213.8 27% – 11% 167.9 156.0 8%
Container transport costs 292.1 310.2 417.7 – 6% – 30% 322.2 414.2 – 22%
Maintenance/repair/other 22.6 20.9 33.4 8% – 32% 23.5 29.8 – 21%
Transport expenses 1,019.4 1,056.2 1,396.6 – 3% – 27% 1,088.6 1,363.2 – 20%
The container shipping activities acquired from CSAV are included in the consolidated income statement for the previous year 2014 from their first-time consolidation as at 2 December 2014. As such, the income statement figures are only comparable with the previous year to a limited extent.

13
Q4 / FY 2015 I INVESTOR REPORT
Bunker consumption development
The efficiency and sustainability of the Hapag-Lloyd fleet further improved as a result of seven newbuilds,
each with a transport capacity of 9,300 TEU, being placed into service in 2015. Bunker consumption per slot
(container storage space) has been considerably reduced over the past five years. The design and technical
equipment of the ships will be further optimised in order to lower bunker consumption.
In 2015, Consumption of marine fuel oil (MFO) amounted to approximately 2,934,012 metric tons in the full-
year 2015 (FY 2014, approximately 2,823,807 tons). The average bunker consumption price for MFO stood at
USD 312/ton (previous year: USD 575/ton). Consumption of low-sulphur marine diesel oil (MDO) amounted to
approximately 416,950 metric tons metric tons (12% of bunker consumption) in the full-year 2015 (FY 2014:
approximately 100,050 tons). The average bunker consumption price for MDO stood at USD 540/ton (previous
year: USD 898/ton).
The bunker consumption per slot (measured at the average capacity for the year) was at 3.39 mt, 11% below
the prior year figure for Hapag-Lloyd only. The bunker consumption per TEU transported stood at 0.45 mt,
9% lower than the prior year, Hapag-Lloyd only, figure.
Bunker consumption
24 (3%)
708 (97%)
FY 2015 [k mt] FY 2014 [k mt]1)
Marine diesel oil (MDO)
Marine fuel oil (MFO)
417 12%
2,934 88%
2,824 97%
100 3%
Marine diesel oil (MDO)
Marine fuel oil (MFO)
= 3,351 = 2,924
1) Figures for Dec 2014 containing CCS consumption

14
INVESTOR REPORT I Q4 / FY 2015
4.6 Earnings position
The Group’s earnings before interest and taxes (EBIT) amounted to USD 406.7 million in the reporting period.
They were therefore well above the corresponding figure in the prior year period of USD – 508.7 million. The
Group’s earnings before interest, taxes, depreciation and amortisation (EBITDA) came to USD 922.4 million in
the financial year (previous year: USD 131.4 million).
Earnings per share were at USD 1.2/share in the financial year 2015, as compared to a negative amount of
USD –11.7/share in the prior year.
EBIT AND EBITDA MARGIN
million USD
Q4 2015 Q3 2015 Q4 2014 QoQ % change
YoY % change
FY 2015 FY 2014 YoY % change
Revenue 2,225.0 2,376.0 2,411.5 – 6% – 8% 9,814.4 9,045.8 8%
EBIT 18.0 89.7 – 403.2 – 80% n.m. 406.7 – 508.7 n.m.
EBITDA 152.3 219.2 – 110.8 – 31% n.m. 922.4 131.4 602%
EBIT margin 0.8% 3.8% – 16.7% – 3.0 ppt 17.5 ppt 4.1% – 5.6% 9.8 ppt
EBITDA margin 6.8% 9.2% – 4.6% – 2.4 ppt 11.4 ppt 9.4% 1.5% 7.9 ppt
The container shipping activities acquired from CSAV are included in the consolidated income statement for the previous year 2014 from their first-time consolidation as at 2 December 2014. As such, the income statement figures are only comparable with the previous year to a limited extent.
EARNINGS PER SHARE
FY 2015 FY 2014 % change
Basic Earnings Per Share USD 1.2 – 11.7 n.m.
Profit/Loss attributable to shareholders of Hapag-Lloyd AG million USD 123.9 – 803.9 n.m.
Weighted average number of shares million shares 106.9 68.7 56%
15
Q4 / FY 2015 I INVESTOR REPORT
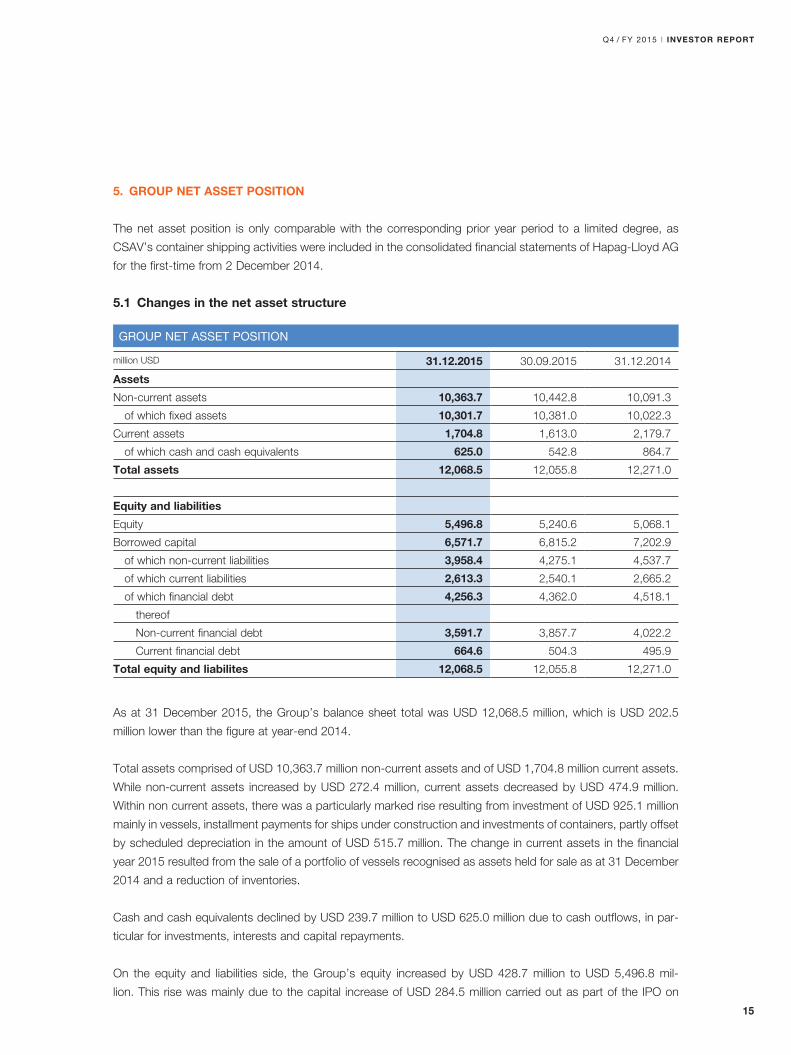
5. GROUP NET ASSET POSITION
The net asset position is only comparable with the corresponding prior year period to a limited degree, as
CSAV’s container shipping activities were included in the consolidated financial statements of Hapag-Lloyd AG
for the first-time from 2 December 2014.
5.1 Changes in the net asset structure
As at 31 December 2015, the Group’s balance sheet total was USD 12,068.5 million, which is USD 202.5
million lower than the figure at year-end 2014.
Total assets comprised of USD 10,363.7 million non-current assets and of USD 1,704.8 million current assets.
While non-current assets increased by USD 272.4 million, current assets decreased by USD 474.9 million.
Within non current assets, there was a particularly marked rise resulting from investment of USD 925.1 million
mainly in vessels, installment payments for ships under construction and investments of containers, partly offset
by scheduled depreciation in the amount of USD 515.7 million. The change in current assets in the financial
year 2015 resulted from the sale of a portfolio of vessels recognised as assets held for sale as at 31 December
2014 and a reduction of inventories.
Cash and cash equivalents declined by USD 239.7 million to USD 625.0 million due to cash outflows, in par-
ticular for investments, interests and capital repayments.
On the equity and liabilities side, the Group’s equity increased by USD 428.7 million to USD 5,496.8 mil-
lion. This rise was mainly due to the capital increase of USD 284.5 million carried out as part of the IPO on
GROUP NET ASSET POSITION
million USD 31.12.2015 30.09.2015 31.12.2014
Assets
Non-current assets 10,363.7 10,442.8 10,091.3
of which fixed assets 10,301.7 10,381.0 10,022.3
Current assets 1,704.8 1,613.0 2,179.7
of which cash and cash equivalents 625.0 542.8 864.7
Total assets 12,068.5 12,055.8 12,271.0
Equity and liabilities
Equity 5,496.8 5,240.6 5,068.1
Borrowed capital 6,571.7 6,815.2 7,202.9
of which non-current liabilities 3,958.4 4,275.1 4,537.7
of which current liabilities 2,613.3 2,540.1 2,665.2
of which financial debt 4,256.3 4,362.0 4,518.1
thereof
Non-current financial debt 3,591.7 3,857.7 4,022.2
Current financial debt 664.6 504.3 495.9
Total equity and liabilites 12,068.5 12,055.8 12,271.0
16
INVESTOR REPORT I Q4 / FY 2015
6 November 2015 and the Group profit of USD 126.4 million. The equity ratio climbed to approximately 46%
as at 31 December 2015 (31 December 2014: approximately 41%).
The Group’s borrowed capital declined by USD 631.2 million to USD 6,571.7 million compared with the 2014
consolidated financial statements. This decrease includes a USD 261.8 million decrease in financial debt mainly
by capital repayments of USD 830.9 million. The increase of loans for ships and container financings totaling
USD 614.3 million had an offsetting effect. On 30 December 2015, USD 125 million was used for the early
partial repayment of the USD bond due in 2017, with the result that the nominal amount of the remaining bond
was USD 125 million as at 31 December 2015.
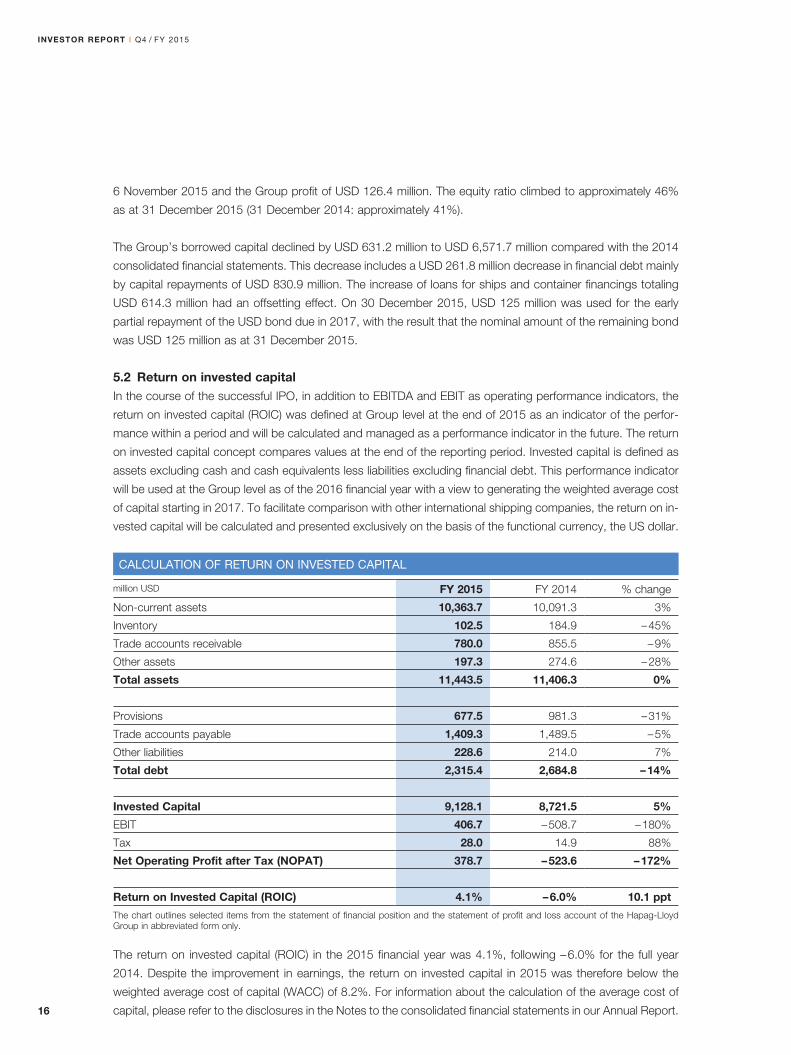
5.2 Return on invested capitalIn the course of the successful IPO, in addition to EBITDA and EBIT as operating performance indicators, the
return on invested capital (ROIC) was defined at Group level at the end of 2015 as an indicator of the perfor-
mance within a period and will be calculated and managed as a performance indicator in the future. The return
on invested capital concept compares values at the end of the reporting period. Invested capital is defined as
assets excluding cash and cash equivalents less liabilities excluding financial debt. This performance indicator
will be used at the Group level as of the 2016 financial year with a view to generating the weighted average cost
of capital starting in 2017. To facilitate comparison with other international shipping companies, the return on in-
vested capital will be calculated and presented exclusively on the basis of the functional currency, the US dollar.
The return on invested capital (ROIC) in the 2015 financial year was 4.1%, following – 6.0% for the full year
2014. Despite the improvement in earnings, the return on invested capital in 2015 was therefore below the
weighted average cost of capital (WACC) of 8.2%. For information about the calculation of the average cost of
capital, please refer to the disclosures in the Notes to the consolidated financial statements in our Annual Report.
CALCULATION OF RETURN ON INVESTED CAPITAL
million USD FY 2015 FY 2014 % change
Non-current assets 10,363.7 10,091.3 3%
Inventory 102.5 184.9 – 45%
Trade accounts receivable 780.0 855.5 – 9%
Other assets 197.3 274.6 – 28%
Total assets 11,443.5 11,406.3 0%
Provisions 677.5 981.3 – 31%
Trade accounts payable 1,409.3 1,489.5 – 5%
Other liabilities 228.6 214.0 7%
Total debt 2,315.4 2,684.8 – 14%
Invested Capital 9,128.1 8,721.5 5%
EBIT 406.7 – 508.7 – 180%
Tax 28.0 14.9 88%
Net Operating Profit after Tax (NOPAT) 378.7 – 523.6 – 172%
Return on Invested Capital (ROIC) 4.1% – 6.0% 10.1 ppt
The chart outlines selected items from the statement of financial position and the statement of profit and loss account of the Hapag-Lloyd Group in abbreviated form only.

17
6. GROUP FINANCIAL POSITION
The financial position is only comparable with the corresponding prior year period to a limited degree, as
CSAV’s container shipping activities were included in the consolidated financial statements of Hapag-Lloyd AG
for the first-time from 2 December 2014.
6.1 Developments in cash and cash equivalents
Cash flow from operating activities
Based on EBITDA of USD 922.4 million, the Hapag-Lloyd Group generated a significantly improved operating
cash flow of USD 635.0 million in the 2015 financial year (previous year: USD 501.2 million).
Q4 / FY 2015 I INVESTOR REPORT
DEVELOPMENT OF LIQUIDITY RESERVE
million USD Q4 2015 Q4 2014 FY 2015 FY 2014
Cash and cash equivalents beginning of the period 542.8 559.8 864.7 639.8
Unused credit lines beginning of the period 486.4 95.0 255.8 95.0
Liquidity reserve beginning of the period 1,029.2 654.8 1,120.5 734.8
EBITDA 152.3 – 110.8 922.4 131.4
Working capital – 69.7 368.6 – 200.0 396.0
Others 12.2 22.1 -87.4 – 26.2
Operating cash flow 94.7 280.1 635.0 501.2
Investments – 141.3 – 137.3 – 804.3 – 452.6
thereof vessel -6.9 – 84.8 – 541.8 – 251.5
thereof container – 129.0 – 48.5 – 243.4 – 184.2
thereof other -5.4 – 4.0 -19.1 – 16.9
Cash received from acquisitions 0.0 58.4 0.0 58.4
Disinvestments 2.2 0.5 87.9 6.5
Dividends received 5.4 – 0.8 43.2 45.4
Investing cash flow – 133.7 – 79.3 – 673.2 – 342.3
Capital increase 289.1 407.8 289.1 407.8
Payments for capital increase – 5.6 0.0 – 5.6 0.0
Debt intake 253.3 369.0 638.6 994.2
Debt repayment – 321.9 – 552.1 – 830.9 – 1,050.5
Dividends paid 0.0 0.0 -2.3 – 1.2
Interest – 58.3 – 86.5 – 236.9 – 241.8
Payments made from hedges for financial debts – 35.3 0.0 – 53.1 0.0
Financing cash flow 121.3 138.2 – 201.1 108.5
Changes due to exchange rate fluctuations – 0.1 – 34.1 – 0.4 – 42.5
Liquidity reserve end of the period 1,048.4 1,120.5 1,048.4 1,120.5
Cash and cash equivalents end of the period 625.0 864.7 625.0 864.7
Unused credit lines end of the period 423.4 255.8 423.4 255.8

18
Cash flow from investing activities
The cash outflow from investing activities totalled USD 673.2 million (previous year: USD 342.3 million). This
mainly consisted of payments for investments in ships and containers totalling USD 785.2 million. Proceeds
from the sale of a portfolio of vessels to be decommissioned (“Old Ladies”) totalling USD 83.1 million had an
offsetting effect, as did dividend payments received amounting to USD 43.2 million.
Cash flow from financing activitiesFinancing activities resulted in a net cash outflow of USD 201.1 million in the reporting period (prior year period:
cash inflow of USD 108.5 million). The cash inflow of USD 927.7 million, which resulted firstly from the inflow of
USD 289.1 million from the capital increase carried out as part of the IPO on 6 November 2015 and secondly
from loans granted amounting to USD 638.6 million, was essentially offset by the early partial repayment of
a USD bond due in 2017 as well as interest and capital repayments of USD 1,067.8 million. Payments of
USD 53.1 million were also made for foreign currency hedging for financial debt. The cash inflow primarily
related to payments received for the financing of investments in ships and containers.
6.2 Financial positionAt USD 3,631.3 million, the Group’s net debt was lower as at 31 December 2015 than one year earlier, when
it stood at USD 3,653.4 million. Gearing (net debt/equity) fell to 66% (previous year: 72%). This was due to the
increase in equity deriving from the capital increase and parallel reduction of net debt by repayment of financial
debt.
The Hapag-Lloyd Group’s solvency was fully guaranteed at all times in the last financial year by cash inflows
from operating activities, a portfolio of cash and cash equivalents, and syndicated credit facilities. Furthermore,
the IPO carried out in the fourth quarter generated gross issue proceeds of around USD 289.1 million. To fur-
ther strengthen the liquidity reserve, an unsecured credit line amounting to USD 125 million was granted, which
enhances the company’s liquidity reserve (consisting of cash, cash equivalents and unused credit facilities) to
USD 1,048.4 million by December 31, 2015 (previous year: USD 1,120.5 million).
INVESTOR REPORT I Q4 / FY 2015
FINANCIAL SOLIDITY
million USD 31.12.2015 30.09.2015 31.12.2014
Cash and cash equivalents 625.0 542.8 864.7
Financial debt 4,256.3 4,362.0 4,518.1
Net debt 3,631.3 3,819.2 3,653.4
Unused credit lines 423.4 486.4 255.8
Liquidity reserve 1,048.4 1,029.2 1,120.5
Equity 5,496.8 5,240.6 5,068.1
Gearing (net debt/equity) (%) 66.1% 72.9% 72.1%
Equity ratio (%) 45.5% 43.5% 41.3%

19
Q4 / FY 2015 I INVESTOR REPORT
Financial debt profile (USD millon)
The financial debt of USD 4,256.3 million is categorized between (1) liabilities to banks, (2) bonds, (3) liabilities
from finance lease contracts and (4) other financial liabilities.
Liabilities to banks comprise loans to finance the existing fleet of vessels and containers. Furthermore, liabilities
to banks include the Ballindamm financing (USD 60 million), the BLADEX financing (USD 100 million) and the
ABS programme (USD 247 million). The ABS programme has been prolongated for a three-year term, running
until 2018.
Hapag-Lloyd has three bonds outstanding: USD 125 million 9.75% Senior Notes due October 2017, EUR 400
million 7.75% Senior Notes due October 2018 and EUR 250 million 7.50% Senior Notes due October 2019.
1) BLADEX financing 2) ABS programme prolongated on 3-years basis
123
434
272
589268
348
306
308
869
56021
961
36
34 32
2020 2019
351
642
9 33
2018
1,083
30 23
247
2017
29 35
100 1)
2016
665
28 27
Bonds
Liabilities from finance lease contracts Liabilities to banks
Other financial liabilities
123
434
272
489 368
348
306
308
869
56021
36
≥2021
34 32
9 33
30 23
2)
29 35
100 1)
28 27
555

20
INVESTOR REPORT I Q4 / FY 2015
7. EVENTS AFTER THE BALANCE SHEET DATE
In the first quarter of 2016, Hapag-Lloyd will take delivery of two modern 3,500-TEU ships with a special wide-
beam design from the Dutch shipping company NileDutch. The wide-beam design of the hull means that the
ships, which were built in 2015, maintain a comparatively high slot capacity despite having a lower draught.
8. OUTLOOK
In its latest economic outlook (January 2016), the International Monetary Fund (IMF) expects global economic
growth to reach 3.4% in the current year. This forecast means that the global economy is set to grow at only
a marginally faster rate in 2016 than in the previous year (+3.1%). According to the IMF, the volume of global
trade, which is key to the demand for container shipping services, will increase by 3.4% in the current year
(2015: +2.6%). This means that global trade will grow at around the same pace as the global economy in 2016.
For instance, IHS Global Insight (February 2016) is forecasting that the global container shipping volume will
increase by 3.5% to approximately 133 million TEU in 2016 (2015: 1.0%). As such, the forecast rise in world-
wide transport volumes in container shipping for 2016 would be in line with the rate of growth for global trade.
Following a rise in transport capacities of approximately 1.7 million TEU to 21.0 million TEU in 2015,
MDS Transmodal forecasts an increase in transport capacities of around 1.4 million TEU to approximately
22.4 million TEU for the current year. The further growth in supply capacity will likely make it difficult once again
to push through freight rate increases in 2016.
Based on unchanged ambitious macroeconomic and sector-specific conditions, Hapag-Lloyd expects its
transport volume to increase slightly. Assuming that there is a sharp fall in the bunker consumption price in
2016, the average freight rate is forecast to decrease moderately. If further synergy effects, additional cost sav-
ings, the planned improvement in revenue quality and a slight growth in volumes are achieved, and assuming
that the peak season is better in 2016, Hapag-Lloyd expects to achieve a moderate increase in EBITDA and a
clear rise in EBIT compared with the previous year.

21
Q4 / FY 2015 I INVESTOR REPORT
Key benchmark figures for the 2016 outlook
In particular in the first half of 2015, Hapag-Lloyd’s earnings development was determined by the positive
development of key external factors, primarily the sharp fall in bunker prices, the significant increase in the US
dollar against the euro, relatively stable freight rate developments and the achievement of initial synergy effects
and cost savings. Given that the third quarter – the peak season – has a major impact on the earnings position,
Hapag-Lloyd expects the focus of its earnings development in 2016 to be on the realization of earnings in the
second half of 2016.
Hapag-Lloyd has entered into long-term loan agreements to secure financing for all of the ship newbuilds or-
dered as at the balance sheet date of 31 December 2015. The launching of five 10,500 TEU vessels, which are
set to be put into service by April 2017, as well as further investments in containers, may lead to a moderate
rise in net debt. Overall, Hapag-Lloyd expects its liquidity reserve to remain adequate for the 2016 financial year
and for it to have balanced maturity dates.
Risks that may have an impact on the forecast for business development are described in detail in the risk
report. Significant risks for the Group’s revenue and earnings development include a further slowdown in
global economic and trade volume growth, a significant and lasting rise in bunker prices extending beyond the
average level seen in 2015, a sharp increase in the euro against the US dollar, and a sustained and consider-
able reduction in freight rates. The occurrence of one or more of these risks could have a significant negative
impact on the industry in 2016 and, by extension, on the business development of Hapag-Lloyd in the current
financial year. Additional risks could result from the consolidation of the industry and possible changes in the
composition of global alliances.
Global economic growth + 3.1%
Increase in global trade + 3.2%
Increase in global container transport volume (IHS) + 3.5%
Change in transport volume, Hapag-Lloyd Slightly increasing
Change in average bunker consumption price, Hapag-Lloyd Clearly decreasing
Change in average freight rate, Hapag-Lloyd Moderately decreasing
EBITDA (Earnings before interest, taxes, depreciation and amortisation) Increasing moderately
EBIT (Earnings before interest and taxes) Clearly increasing
The revenue and earnings forecast is based on the assumption of unchanged exchange rates.
22
INVESTOR REPORT I Q4 / FY 2015
9. FINANCIAL CALENDAR 2016
13 May 2016 Investor Report Q1 2016
1 June 2016 Annual General Meeting
10 August 2016 Investor Report Q2 / H1 2016
14 November 2016 Investor Report Q3 / 9M 2016

23
Q4 / FY 2015 I INVESTOR REPORT
10. DISCLAIMER
This report provides general information about Hapag-Lloyd AG. It consists of summary information based on
a calculation of USD figures. It does not purport to be complete and it is not intended to be relied upon as
advice to investors.
No representations or warranties, expressed or implied, are made as to, and no reliance should be placed on,
the accuracy, fairness or completeness of the information presented or contained in this report.
This report contains forward looking statements within the meaning of the 'safe harbor' provision of the US se-
curities laws. These statements are based on management's current expectations or beliefs and are subject to
a number of factors and uncertainties that could cause actual results to differ materially from those described in
the forward-looking statements. Actual results may differ from those set forth in the forward-looking statements
as a result of various factors (including, but not limited to, future global economic conditions, market conditions
affecting the container shipping industry, intense competition in the markets in which we operate, potential
environmental liability and capital costs of compliance with applicable laws, regulations and standards in the
markets in which we operate, diverse political, legal, economic and other conditions affecting the markets in
which we operate, our ability to successfully integrate business acquisitions and our ability to service our debt
requirements). Many of these factors are beyond our control.
This report is intended to provide a general overview of Hapag-Lloyd’s business and does not purport to deal
with all aspects and details regarding Hapag-Lloyd. Accordingly, neither Hapag-Lloyd nor any of its directors,
officers, employees or advisers nor any other person makes any representation or warranty, expressed or
implied, as to, and accordingly no reliance should be placed on, the fairness, accuracy or completeness of the
information contained in the presentation or of the views given or implied. Neither Hapag-Lloyd nor any of its
directors, officers, employees or advisors nor any other person shall have any liability whatsoever for any errors
or omissions or any loss howsoever arising, directly or indirectly, from any use of this information or its contents
or otherwise arising in connection therewith.
Neither the Company or any of its affiliates, advisers or representatives make any undertaking to update any
such information subsequent to the date hereof.
Each investor must conduct and rely on its own evaluation in taking an investment decision.
Recipients of this report are not to construe the contents of this summary as legal, tax or investment advice
and recipients should consult their own advisors in this regard.
INVESTOR REPORT I Q4 / FY 2015
24
IMPRINT
Hapag-Lloyd AG
Ballindamm 25
20095 Hamburg
Investor Relations
Phone: +49 40 3001-2896
Fax: +49 40 3001-73490
Email: [email protected]
http://ir.hapag-lloyd.com/websites/hapaglloyd/English/0/ir-home.html