Q3 2021 Earnings Call
26
Q3 2021 Earnings Call November 8, 2021
Transcript of Q3 2021 Earnings Call

Q3 2021 Earnings CallNovember 8, 2021

Q3 2021 Earnings Call November 8, 2021
Legal Disclaimer
This presentation contains forward-looking statements within the meaning of the federal securities law. All statements other than statements of historical facts contained in this presentation, including statements regarding our future results of operations and financial position, business strategy and plans and objectives of management for future operations, are forward-looking statements. In many cases, you can identify forward-looking statements by terms such as “may,” “should,” “expects,” “plans,” “anticipates,” “could,” “intends,” “target,” “projects,” “contemplates,” “believes,” “estimates,” “predicts,” “potential” or “continue” or the negative of these terms or other similar words. Forward-looking statements contained in this presentation include, but are not limited to, statements about: (i) the potential impact of the COVID-19 pandemic on our business and results of operations; (ii) competition from other wind blade and wind blade turbine manufacturers; (iii) our ability to procure adequate supplies of raw materials and components in a cost-effective manner to fulfill our volume commitments to our customers; (iv) the discovery of defects in our products and our ability to estimate the future cost of warranty campaigns; (v) growth of the wind energy and electric vehicle markets and our addressable markets for our products and services; (vi) the potential impact of the increasing prevalence of auction-based tenders in the wind energy market and increased competition from solar energy on our gross margins and overall financial performance; (vii) our future financial performance, including our net sales, cost of goods sold, gross profit or gross margin, operating expenses, ability to generate positive cash flow, and ability to achieve or maintain profitability; (viii) changes in domestic or international government or regulatory policy, including without limitation, changes in trade policy and a potential extension of the Production Tax Credit in the United States; (ix) the sufficiency of our cash and cash equivalents and our ability to raise additional capital to meet our liquidity needs; (x) our ability to attract and retain customers for our products, and to optimize product pricing; (xi) our ability to effectively manage our growth strategy and future expenses, including our startup and transition costs; (xii) our ability to successfully expand in our existing wind energy markets and into new international wind energy markets, including our ability to expand our field service inspection and repair services business and manufacture wind blades for offshore wind energy projects; (xiii) our ability to successfully open new manufacturing facilities, take over existing facilities of our customers and expand our existing facilities on time and on budget; (xiv) the impact of the accelerated pace of new product and wind blade model introductions on our business and our results of operations; (xv) our ability to successfully expand our transportation business and execute upon our strategy of entering new markets outside of wind energy; (xvi) worldwide economic conditions and their impact on customer demand; (xvii) our ability to maintain, protect and enhance our intellectual property; (xviii) our ability to comply with existing, modified or new laws and regulations applying to our business, including the imposition of new taxes, duties or similar assessments on our products; (xix) the attraction and retention of qualified employees and key personnel; (xx) our ability to maintain good working relationships with our employees, and avoid labor disruptions, strikes and other disputes with labor unions that represent certain of our employees; and (xxi) the potential impact of one or more of our customers becoming bankrupt or insolvent, or experiencing other financial problems.
These forward-looking statements are only predictions. These statements relate to future events or our future financial performance and involve known and unknown risks, uncertainties and other important factors that may cause our actual results, levels of activity, performance or achievements to materially differ from any future results, levels of activity, performance or achievements expressed or implied by these forward-looking statements. Because forward-looking statements are inherently subject to risks and uncertainties, some of which cannot be predicted or quantified, you should not rely on these forward-looking statements as guarantees of future events. Further information on the factors, risks and uncertainties that could affect our financial results and the forward-looking statements in this presentation are included in our filings with the Securities and Exchange Commission and will be included in subsequent periodic and current reports we make with the Securities and Exchange Commission from time to time, including in our Annual Report on Form 10-K for the year ended December 31, 2020.
The forward-looking statements in this presentation represent our views as of the date of this presentation. We anticipate that subsequent events and developments will cause our views to change. However, while we may elect to update these forward-looking statements at some point in the future, we undertake no obligation to update any forward-looking statement to reflect events or developments after the date on which the statement is made or to reflect the occurrence of unanticipated events except to the extent required by applicable law. You should, therefore, not rely on these forward-looking statements as representing our views as of any date after the date of this presentation. Our forward-looking statements do not reflect the potential impact of any future acquisitions, mergers, dispositions, joint ventures, or investments we may make.
This presentation includes unaudited non-GAAP financial measures including EBITDA, adjusted EBITDA, net cash (debt) and free cash flow. We define EBITDA as net income (loss) plus interest expense (including losses on the extinguishment of debt and net of interest income), income taxes and depreciation and amortization. We define Adjusted EBITDA as EBITDA plus any share-based compensation expense, any foreign currency income or losses, any gains or losses on the sale of assets and asset impairments and any restructuring charges. We define net cash (debt) as total unrestricted cash and cash equivalents less the total principal amount of debt outstanding. We define free cash flow as net cash flow from operating activities less capital expenditures. We present non-GAAP measures when we believe that the additional information is useful and meaningful to investors. Non-GAAP financial measures do not have any standardized meaning and are therefore unlikely to be comparable to similar measures presented by other companies. The presentation of non-GAAP financial measures is not intended to be a substitute for, and should not be considered in isolation from, the financial measures reported in accordance with GAAP. See the Appendix for the reconciliations of certain non-GAAP financial measures to the comparable GAAP measures.
This presentation also contains estimates and other information concerning our industry that are based on industry publications, surveys and forecasts. This information involves a number of assumptions and limitations, and we have not independently verified the accuracy or completeness of the information.
2
Q3 2021 Earnings Call November 8, 2021
Agenda
3
• Q3 2021 Highlights and Operations/Market Overview
• Q3 2021 Financial Highlights and 2021 Guidance
• Overview of Investment by Oaktree
• Q&A
• Wrap Up
• Appendix
– Non-GAAP Financial Information
November 8, 2021
Q3 2021 Highlights and Operations/Market Overview
Q3 2021 Earnings Call November 8, 2021
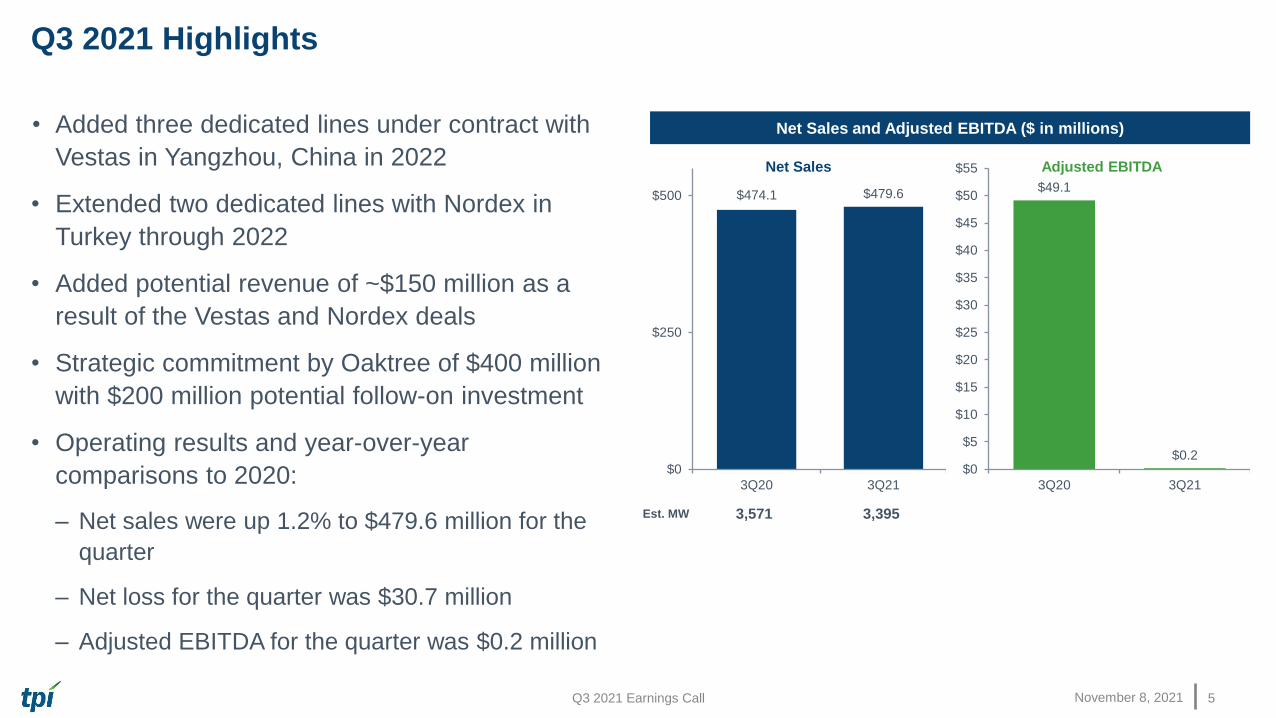
• Added three dedicated lines under contract with
Vestas in Yangzhou, China in 2022
• Extended two dedicated lines with Nordex in
Turkey through 2022
• Added potential revenue of ~$150 million as a
result of the Vestas and Nordex deals
• Strategic commitment by Oaktree of $400 million
with $200 million potential follow-on investment
• Operating results and year-over-year
comparisons to 2020:
– Net sales were up 1.2% to $479.6 million for the
quarter
– Net loss for the quarter was $30.7 million
– Adjusted EBITDA for the quarter was $0.2 million
Q3 2021 Highlights
5
Net Sales and Adjusted EBITDA ($ in millions)
Est. MW 3,571 3,395
$474.1 $479.6
$0
$250
$500
3Q20 3Q21
Net Sales
$49.1
$0.2$0
$5
$10
$15
$20
$25
$30
$35
$40
$45
$50
$55
3Q20 3Q21
Adjusted EBITDA
Q3 2021 Earnings Call November 8, 2021
Business Update
6
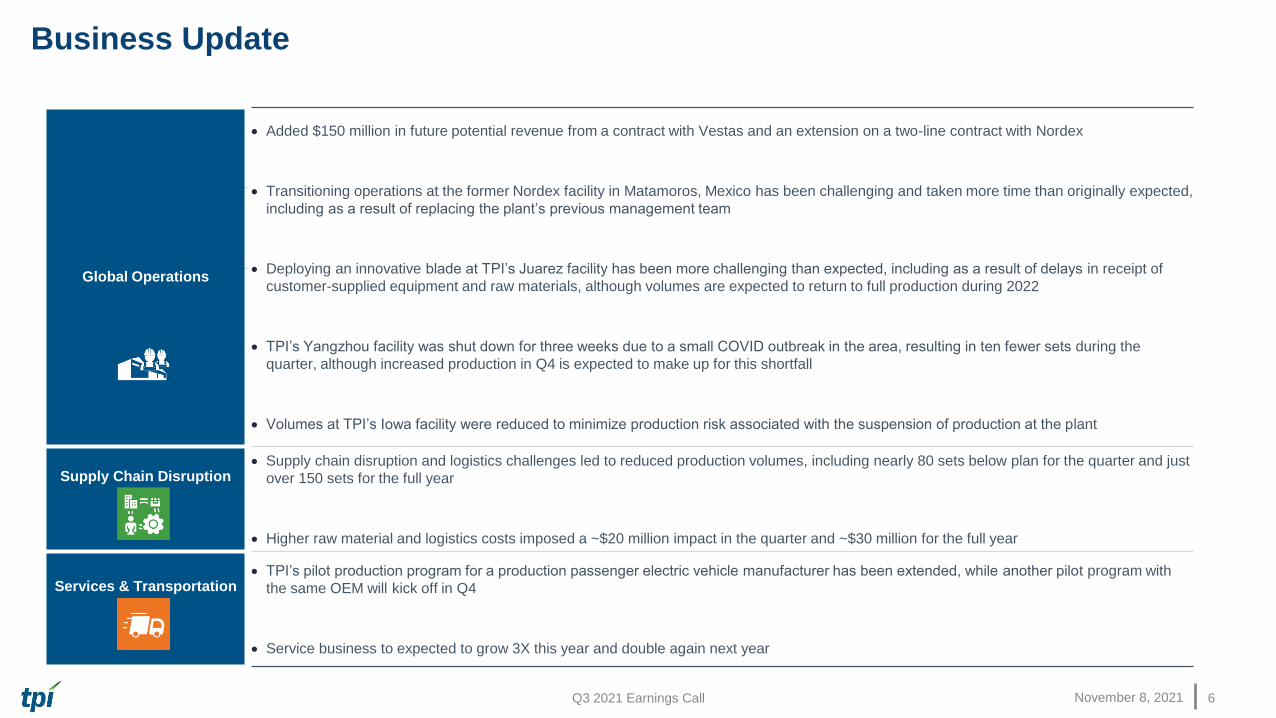
Global Operations
• Added $150 million in future potential revenue from a contract with Vestas and an extension on a two-line contract with Nordex
• Transitioning operations at the former Nordex facility in Matamoros, Mexico has been challenging and taken more time than originally expected,
including as a result of replacing the plant’s previous management team
• Deploying an innovative blade at TPI’s Juarez facility has been more challenging than expected, including as a result of delays in receipt of
customer-supplied equipment and raw materials, although volumes are expected to return to full production during 2022
• TPI’s Yangzhou facility was shut down for three weeks due to a small COVID outbreak in the area, resulting in ten fewer sets during the
quarter, although increased production in Q4 is expected to make up for this shortfall
• Volumes at TPI’s Iowa facility were reduced to minimize production risk associated with the suspension of production at the plant
Supply Chain Disruption• Supply chain disruption and logistics challenges led to reduced production volumes, including nearly 80 sets below plan for the quarter and just
over 150 sets for the full year
• Higher raw material and logistics costs imposed a ~$20 million impact in the quarter and ~$30 million for the full year
Services & Transportation• TPI’s pilot production program for a production passenger electric vehicle manufacturer has been extended, while another pilot program with
the same OEM will kick off in Q4
• Service business to expected to grow 3X this year and double again next year
Q3 2021 Earnings Call November 8, 2021
Wind Market Update
7
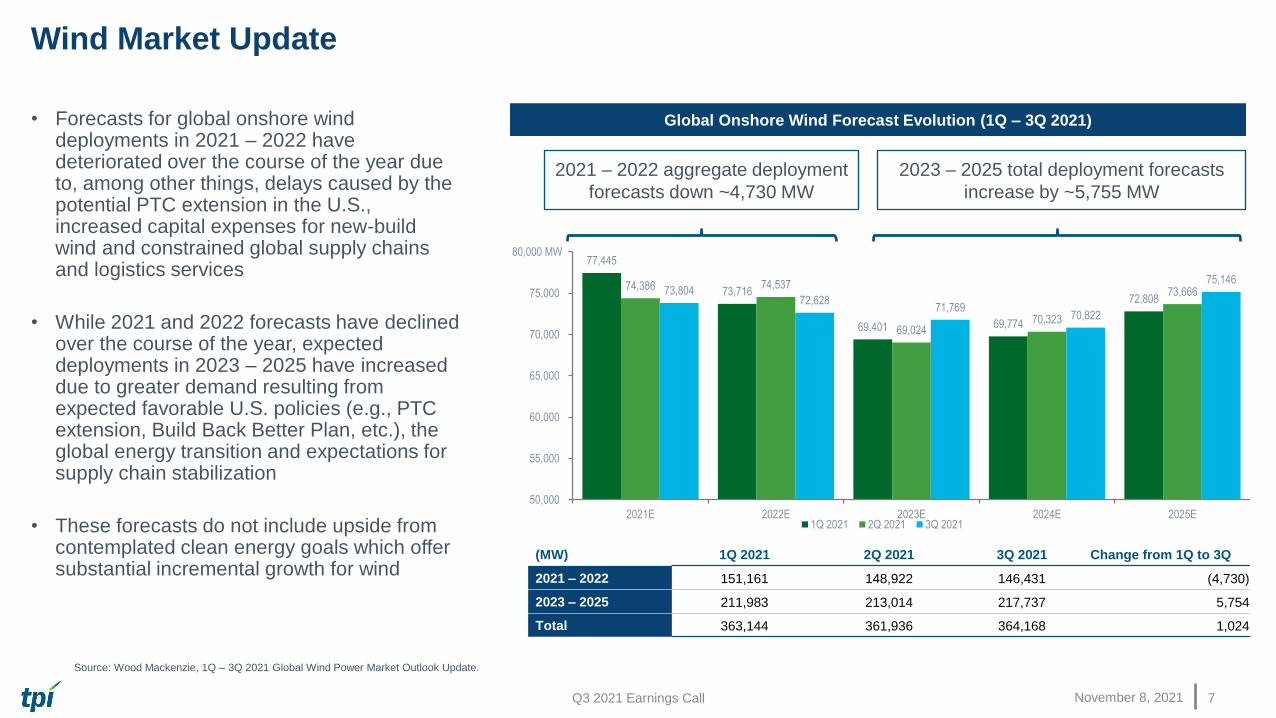
• Forecasts for global onshore wind deployments in 2021 – 2022 have deteriorated over the course of the year due to, among other things, delays caused by the potential PTC extension in the U.S., increased capital expenses for new-build wind and constrained global supply chains and logistics services
• While 2021 and 2022 forecasts have declined over the course of the year, expected deployments in 2023 – 2025 have increased due to greater demand resulting from expected favorable U.S. policies (e.g., PTC extension, Build Back Better Plan, etc.), the global energy transition and expectations for supply chain stabilization
• These forecasts do not include upside from contemplated clean energy goals which offer substantial incremental growth for wind
77,445
73,716
69,401 69,774
72,80874,386 74,537
69,02470,323
73,66673,80472,628
71,76970,822
75,146
50,000
55,000
60,000
65,000
70,000
75,000
80,000 MW
2021E 2022E 2023E 2024E 2025E1Q 2021 2Q 2021 3Q 2021
Source: Wood Mackenzie, 1Q – 3Q 2021 Global Wind Power Market Outlook Update.
Global Onshore Wind Forecast Evolution (1Q – 3Q 2021)
2021 – 2022 aggregate deployment
forecasts down ~4,730 MW
2023 – 2025 total deployment forecasts
increase by ~5,755 MW
(MW) 1Q 2021 2Q 2021 3Q 2021 Change from 1Q to 3Q
2021 – 2022 151,161 148,922 146,431 (4,730)
2023 – 2025 211,983 213,014 217,737 5,754
Total 363,144 361,936 364,168 1,024
Q3 2021 Earnings Call November 8, 2021
Drivers Accelerating the Global Energy Transition
8
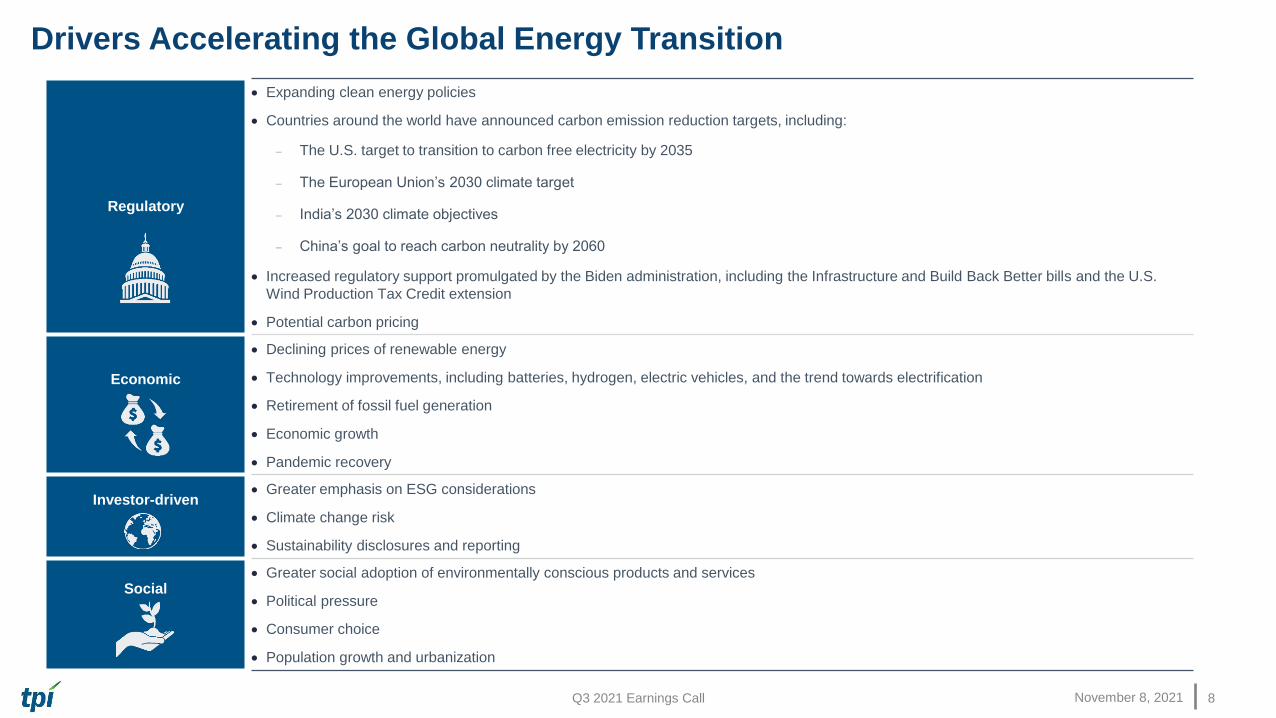
Regulatory
• Expanding clean energy policies
• Countries around the world have announced carbon emission reduction targets, including:
− The U.S. target to transition to carbon free electricity by 2035
− The European Union’s 2030 climate target
− India’s 2030 climate objectives
− China’s goal to reach carbon neutrality by 2060
• Increased regulatory support promulgated by the Biden administration, including the Infrastructure and Build Back Better bills and the U.S.
Wind Production Tax Credit extension
• Potential carbon pricing
Economic
• Declining prices of renewable energy
• Technology improvements, including batteries, hydrogen, electric vehicles, and the trend towards electrification
• Retirement of fossil fuel generation
• Economic growth
• Pandemic recovery
Investor-driven• Greater emphasis on ESG considerations
• Climate change risk
• Sustainability disclosures and reporting
Social• Greater social adoption of environmentally conscious products and services
• Political pressure
• Consumer choice
• Population growth and urbanization
Q3 2021 Earnings Call November 8, 2021
Existing Contracts Provide for ~$3.9 Billion in Potential Revenue through 2024
9
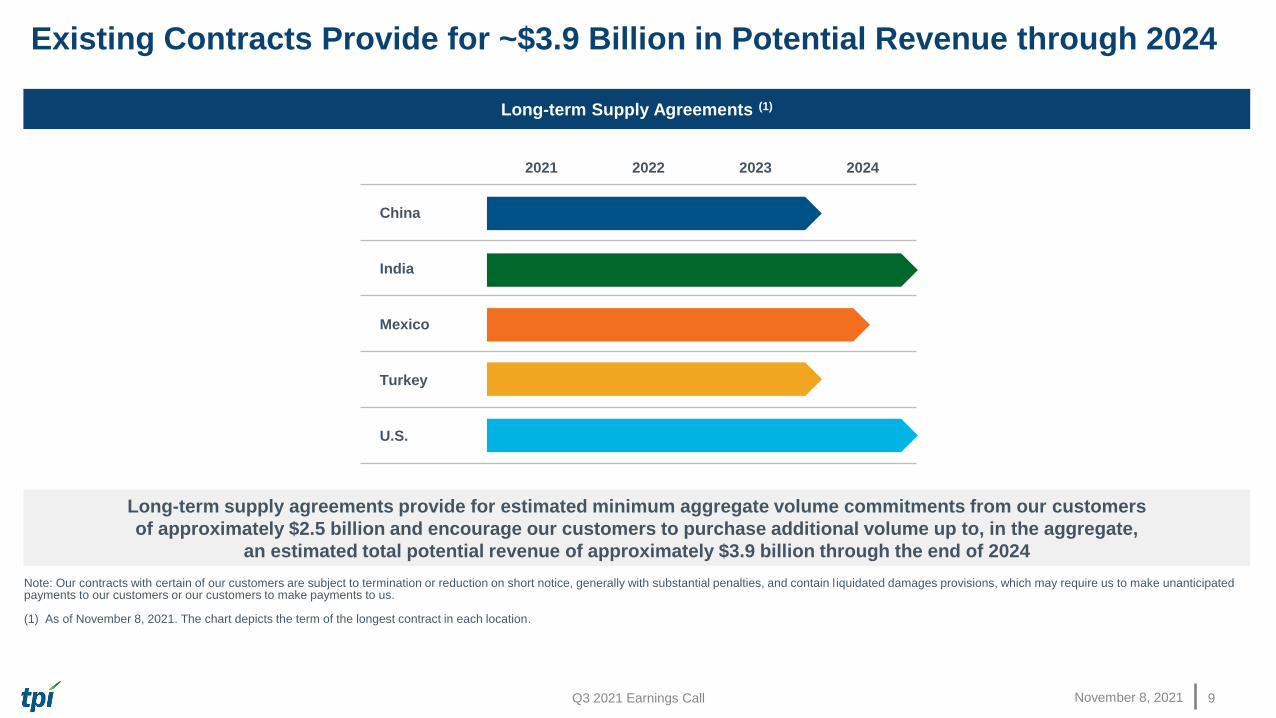
Long-term Supply Agreements (1)
Long-term supply agreements provide for estimated minimum aggregate volume commitments from our customers
of approximately $2.5 billion and encourage our customers to purchase additional volume up to, in the aggregate,
an estimated total potential revenue of approximately $3.9 billion through the end of 2024
Note: Our contracts with certain of our customers are subject to termination or reduction on short notice, generally with substantial penalties, and contain l iquidated damages provisions, which may require us to make unanticipated payments to our customers or our customers to make payments to us.
(1) As of November 8, 2021. The chart depicts the term of the longest contract in each location.
2021 2022 2023 2024
China
India
Mexico
Turkey
U.S.
November 8, 2021
Q3 2021 Financial Highlightsand 2021 Guidance
Q3 2021 Earnings Call November 8, 2021
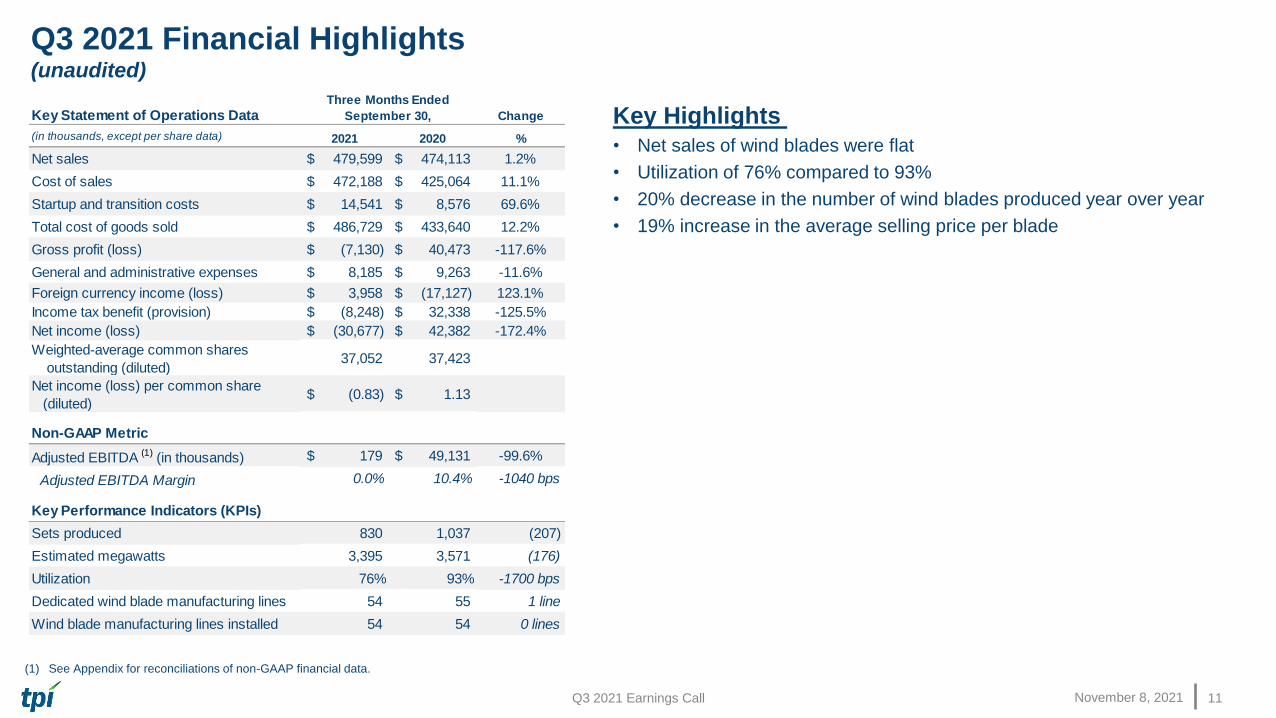
Q3 2021 Financial Highlights (unaudited)
11
Key Highlights• Net sales of wind blades were flat
• Utilization of 76% compared to 93%
• 20% decrease in the number of wind blades produced year over year
• 19% increase in the average selling price per blade
(1) See Appendix for reconciliations of non-GAAP financial data.
Key Statement of Operations Data Change
(in thousands, except per share data) 2021 2020 %
Net sales $ 479,599 $ 474,113 1.2%
Cost of sales $ 472,188 $ 425,064 11.1%
Startup and transition costs $ 14,541 $ 8,576 69.6%
Total cost of goods sold $ 486,729 $ 433,640 12.2%
Gross profit (loss) $ (7,130) $ 40,473 -117.6%
General and administrative expenses $ 8,185 $ 9,263 -11.6%
Foreign currency income (loss) $ 3,958 $ (17,127) 123.1%
Income tax benefit (provision) $ (8,248) $ 32,338 -125.5%
Net income (loss) $ (30,677) $ 42,382 -172.4%
Weighted-average common shares
outstanding (diluted) 37,052 37,423
Net income (loss) per common share
(diluted) $ (0.83) $ 1.13
Non-GAAP Metric
Adjusted EBITDA (1) (in thousands) $ 179 $ 49,131 -99.6%
Adjusted EBITDA Margin 0.0% 10.4% -1040 bps
Key Performance Indicators (KPIs)
Sets produced 830 1,037 (207)
Estimated megawatts 3,395 3,571 (176)
Utilization 76% 93% -1700 bps
Dedicated wind blade manufacturing lines 54 55 1 line
Wind blade manufacturing lines installed 54 54 0 lines
Three Months Ended
September 30,
Q3 2021 Earnings Call November 8, 2021
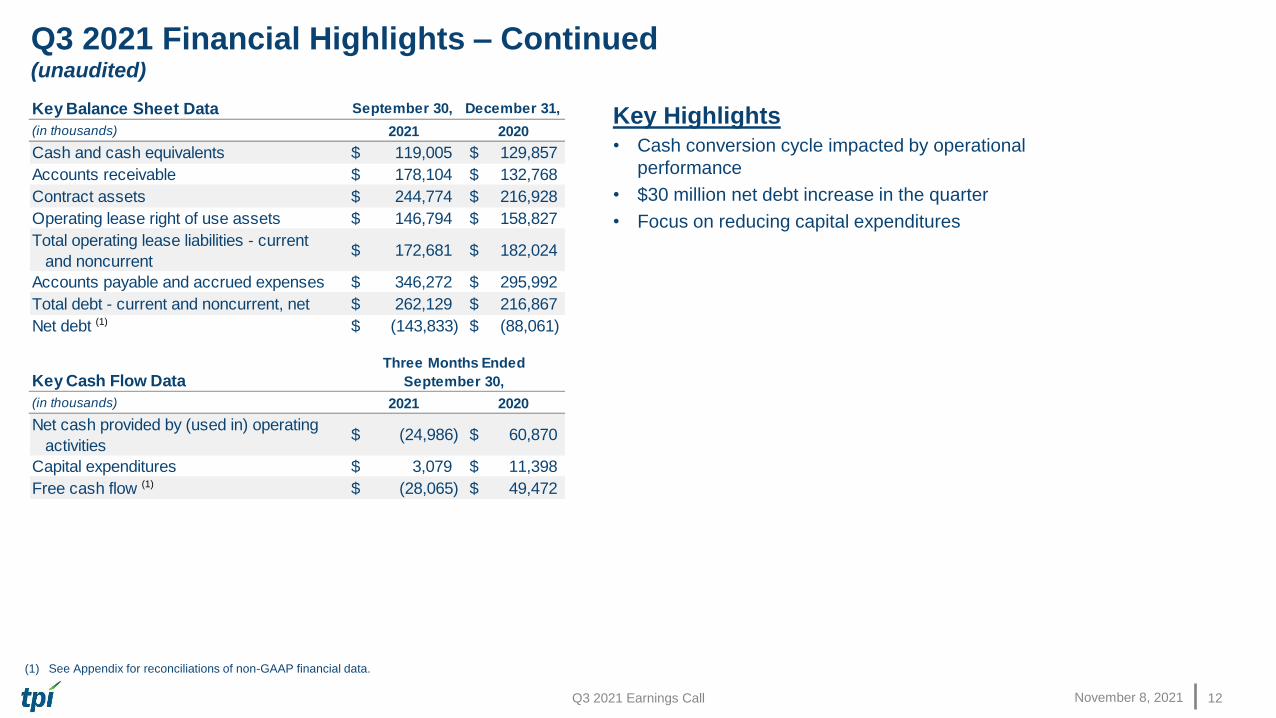
Q3 2021 Financial Highlights – Continued(unaudited)
12
Key Highlights• Cash conversion cycle impacted by operational
performance
• $30 million net debt increase in the quarter
• Focus on reducing capital expenditures
(1) See Appendix for reconciliations of non-GAAP financial data.
Key Balance Sheet Data September 30, December 31,
(in thousands) 2021 2020
Cash and cash equivalents $ 119,005 $ 129,857
Accounts receivable $ 178,104 $ 132,768
Contract assets $ 244,774 $ 216,928
Operating lease right of use assets $ 146,794 $ 158,827
Total operating lease liabilities - current
and noncurrent $ 172,681 $ 182,024
Accounts payable and accrued expenses $ 346,272 $ 295,992
Total debt - current and noncurrent, net $ 262,129 $ 216,867
Net debt (1) $ (143,833) $ (88,061)
Key Cash Flow Data
(in thousands) 2021 2020
Net cash provided by (used in) operating
activities $ (24,986) $ 60,870
Capital expenditures $ 3,079 $ 11,398
Free cash flow (1) $ (28,065) $ 49,472
Three Months Ended
September 30,

Q3 2021 Earnings Call November 8, 2021
2021 Guidance (1)
13
(1) These numbers could be significantly impacted by COVID-19.
(2) See Appendix for reconciliations of non-GAAP financial data.
Previous Updated
Net Sales $1.75 billion to $1.80 billion $1.72 billion to $1.74 billion
Adjusted EBITDA (2) $70 million to $85 million $30 million to $40 million
Dedicated Manufacturing Lines 54 Unchanged
Wind Blade Set Capacity 4,260 Unchanged
Utilization % Approximately 80% Approximately 76%
Average Selling Price per Blade $165,000 to $170,000 Approximately $165,000
Non-Blade Sales $115 million to $125 million $120 million to $125 million
Capital Expenditures Unchanged $40 million to $45 million
Startup Costs $11 million to $13 million $17 million to $20 million
Restructuring Costs $15 million to $22 million Approximately $30 million
November 8, 2021Q3 2021 Earnings Call
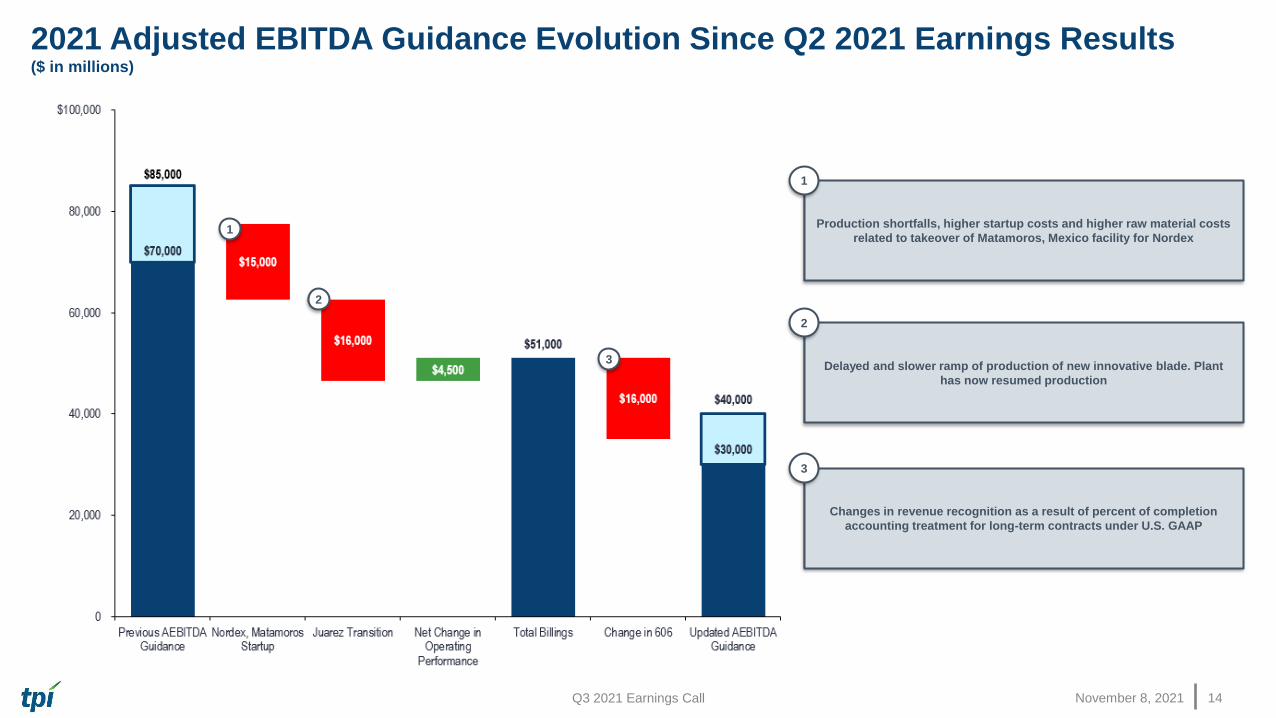
2021 Adjusted EBITDA Guidance Evolution Since Q2 2021 Earnings Results($ in millions)
14
Production shortfalls, higher startup costs and higher raw material costs
related to takeover of Matamoros, Mexico facility for Nordex
1
Delayed and slower ramp of production of new innovative blade. Plant
has now resumed production
2
Changes in revenue recognition as a result of percent of completion
accounting treatment for long-term contracts under U.S. GAAP
3
1
2
3
November 8, 2021
Overview of Investment by Oaktree

November 8, 2021Q3 2021 Earnings Call
Overview of Investment by Oaktree
16
Oaktree Transaction Summary
• On November 8, TPI entered into an agreement to sell $350 million of Series A preferred stock to funds managed by Oaktree Capital
Management
• TPI may elect at its option to sell an additional $50 million of Series A preferred stock to Oaktree at TPI's discretion within two years following
the initial issuance
• TPI will issue to Oaktree a warrant to purchase approximately 4.7 million shares of TPI common stock at an exercise price of $0.01 per share
• Oaktree is an experienced investor with a successful track record of investing across the energy value chain
• Series A preferred stock will be entitled to a 11% annual dividend, which may be payable in kind during the first two years
• Proceeds received by TPI will be used to:
- Repay all amounts outstanding under the revolving credit facility; and
- General corporate purposes
• Subject to mutual agreement, Oaktree may provide an additional amount up to $200 million for follow-on capital
November 8, 2021Q3 2021 Earnings Call
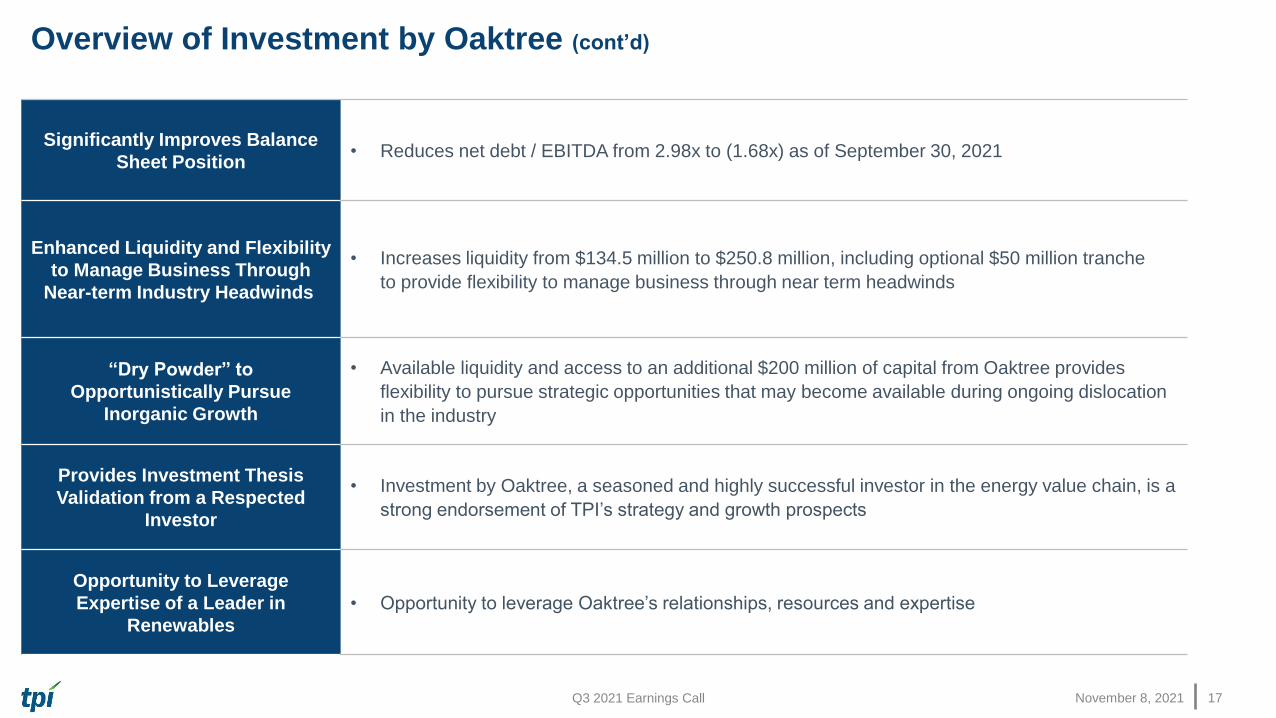
Overview of Investment by Oaktree (cont’d)
17
Significantly Improves Balance
Sheet Position• Reduces net debt / EBITDA from 2.98x to (1.68x) as of September 30, 2021
Enhanced Liquidity and Flexibility
to Manage Business Through
Near-term Industry Headwinds
• Increases liquidity from $134.5 million to $250.8 million, including optional $50 million tranche
to provide flexibility to manage business through near term headwinds
“Dry Powder” to
Opportunistically Pursue
Inorganic Growth
• Available liquidity and access to an additional $200 million of capital from Oaktree provides
flexibility to pursue strategic opportunities that may become available during ongoing dislocation
in the industry
Provides Investment Thesis
Validation from a Respected
Investor
• Investment by Oaktree, a seasoned and highly successful investor in the energy value chain, is a
strong endorsement of TPI’s strategy and growth prospects
Opportunity to Leverage
Expertise of a Leader in
Renewables
• Opportunity to leverage Oaktree’s relationships, resources and expertise
November 8, 2021Q3 2021 Earnings Call
Overview of Oaktree Investment
18
Key Terms of
the Oaktree
Investment
• Security: Series A Preferred Stock
• Amount: $400 million - Initial tranche of $350 million that is expected to close in late November 2021
• TPI also may elect at its option to require Oaktree to purchase an additional $50 million
of Series A Preferred Stock upon the same terms and conditions as the initial issuance
of the Series A Preferred Stock during the two-year period following the closing of the
initial issuance
• Follow-on Amount: Up to $200 million available, subject to mutual agreement
• Dividend: 11% per annum
- Payable in-kind (PIK) or in cash for the first two years at TPI’s election, thereafter full cash dividend
- The dividend rate increases by 200 bps beginning on the 5th anniversary (or sooner, under certain events
of non-compliance), subject to a cap
• Warrants: 4.7 million warrants with a five-year term, issued at a per-share exercise price of $0.01 per share
• Board Representation: Oaktree has the right to nominate one director to the Board in connection with the
transaction

November 8, 2021Q3 2021 Earnings Call
Sources & Uses and Pro Forma Capitalization ($ in millions)
19
(1) Transaction sources do not reflect follow-on $200 million commitment (i.e., total commitment of $600 million, less $350 million of Day 1 draw and additional $50 million of capital immediately available).
(2) Includes minimum cash for working capital of $47 million plus an additional working capital cushion of $25 million.
(3) Assumes ~$8 million of LCs outstanding not included in total debt calculation for covenant purposes.
(4) Includes domestic cash of ~$70 million, cash in various deposit accounts outside of the U.S. and short-term deposits in interest bearing accounts in China.
(5) Reflects allowable unrestricted domestic cash balance, capped at $50 million, available to offset total indebtedness for computation of leverage under status quo scenario with revolving credit facility in place. On a pro forma basis, global cash is util ized
for leverage calculations in the absence of a revolving credit facility.
(6) Assumes ASC 606-affected EBITDA and a $15 million cap on EBITDA adjustments for restructuring charges.
(7) Includes $119 million of cash on the balance sheet and ~$16 million of revolving credit facility availability (i.e., $205 mil lion revolver capacity pursuant to current Credit Agreement, less $181 million drawn amount and $8 million of LCs outstanding).
(8) Includes $201 million of cash on the balance sheet (not inclusive of the amount necessary for working capital needs) and addi tional $50 million of capital immediately available from Oaktree.
November 8, 2021
Q&A

November 8, 2021
Wrap Up
Q3 2021 Earnings Call November 8, 2021
Wrap Up
22
• Our priority is the health and safety of our associates and their families.
• Work closely with our customers to determine the optimal footprint and
capacity, both near term and long term, to support our profitable growth.
• Grow service business into meaningful contributor to earnings.
• Invest in transportation business in 2022 to reach profitability in 2023.
• Manage business through near-term challenges facing the industry and
today’s financing announcement with Oaktree highlight our efforts to best
position TPI to capitalize on long-term energy transition trends and
opportunities.
November 8, 2021
Appendix – Non-GAAP Financial
InformationThis presentation includes unaudited non-GAAP financial measures including EBITDA, adjusted EBITDA, net
cash (debt) and free cash flow. We define EBITDA as net income (loss) plus interest expense (including losses on
the extinguishment of debt and net of interest income), income taxes and depreciation and amortization. We
define Adjusted EBITDA as EBITDA plus any share-based compensation expense, any foreign currency
income or losses, any gains or losses on the sale of assets and asset impairments and any restructuring charges.
We define net cash (debt) as total unrestricted cash and cash equivalents less the total principal amount of debt
outstanding. We define free cash flow as net cash flow from operating activities less capital expenditures. We
present non-GAAP measures when we believe that the additional information is useful and meaningful to
investors. Non-GAAP financial measures do not have any standardized meaning and are therefore unlikely to be
comparable to similar measures presented by other companies. The presentation of non-GAAP financial
measures is not intended to be a substitute for, and should not be considered in isolation from, the financial
measures reported in accordance with GAAP. See below for a reconciliation of certain non-GAAP financial
measures to the comparable GAAP measures.

Q3 2021 Earnings Call November 8, 2021
EBITDA and adjusted EBITDA are reconciled as follows:
Net debt is reconciled as follows:
Free cash flow is reconciled as follows:
Non-GAAP Reconciliations (unaudited)
24
September 30, December 31,
(in thousands) 2021 2020
Cash and cash equivalents 119,005$ 129,857$
Less total debt, net of debt issuance costs (262,129) (216,867)
Less debt issuance costs (709) (1,051)
Net debt (143,833)$ (88,061)$
(in thousands) 2021 2020
Net cash provided by (used in) operating activities (24,986)$ 60,870$
Less capital expenditures (3,079) (11,398)
Free cash flow (28,065)$ 49,472$
Three Months Ended
September 30,
(in thousands) 2021 2020
Net income (loss) (30,677)$ 42,382$
Adjustments:
Depreciation and amortization 13,289 14,031
Interest expense, net 2,662 3,093
Income tax provision (benefit) 8,248 (32,338)
EBITDA (6,478) 27,168
Share-based compensation expense 1,943 2,631
Foreign currency loss (income) (3,958) 17,127
Loss on sale of assets and asset impairments 7,250 2,160
Restructuring charges, net 1,422 45
Adjusted EBITDA 179$ 49,131$
Three Months Ended
September 30,
Q3 2021 Earnings Call November 8, 2021
Non-GAAP Reconciliations (continued)(unaudited)
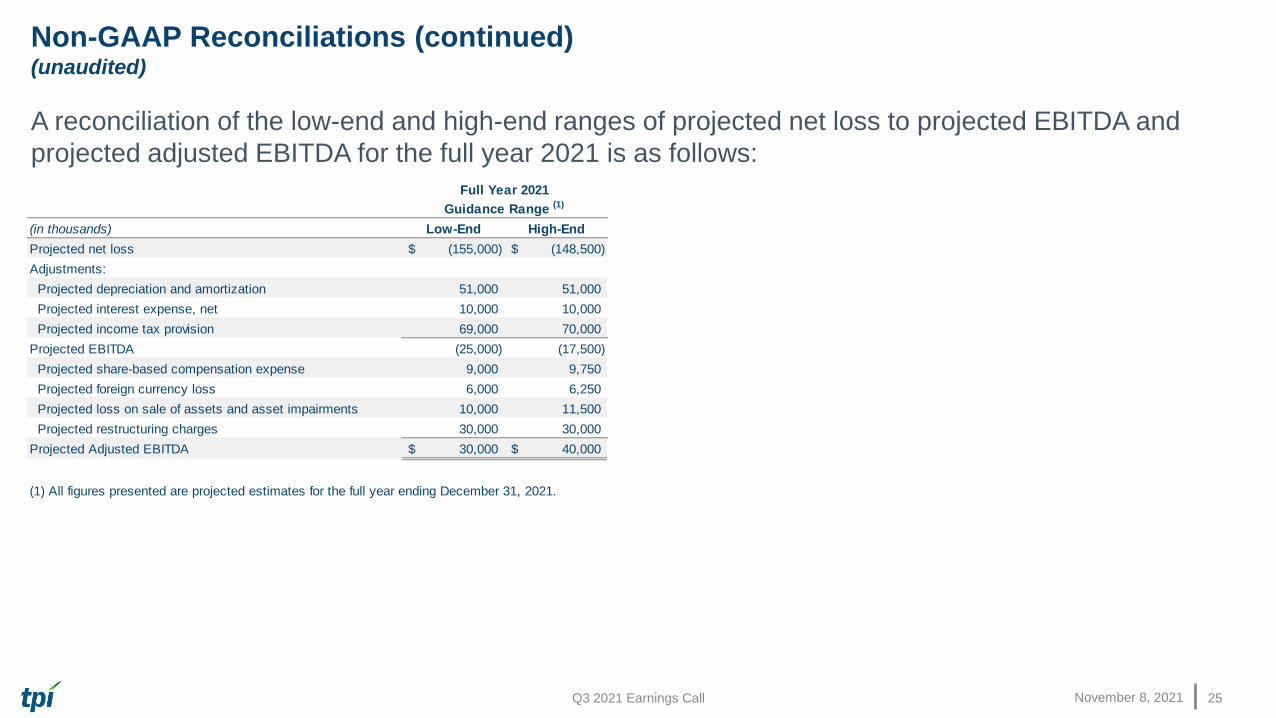
A reconciliation of the low-end and high-end ranges of projected net loss to projected EBITDA and
projected adjusted EBITDA for the full year 2021 is as follows:
25
(in thousands) Low-End High-End
Projected net loss (155,000)$ (148,500)$
Adjustments:
Projected depreciation and amortization 51,000 51,000
Projected interest expense, net 10,000 10,000
Projected income tax provision 69,000 70,000
Projected EBITDA (25,000) (17,500)
Projected share-based compensation expense 9,000 9,750
Projected foreign currency loss 6,000 6,250
Projected loss on sale of assets and asset impairments 10,000 11,500
Projected restructuring charges 30,000 30,000
Projected Adjusted EBITDA 30,000$ 40,000$
(1) All figures presented are projected estimates for the full year ending December 31, 2021.
Full Year 2021
Guidance Range (1)