Q3 2015 Financial Results Presentation - Union Bank Bank... · No statement in this presentation is...
39
1 Unaudited Results 9 Months ended 30 September, 2015
Transcript of Q3 2015 Financial Results Presentation - Union Bank Bank... · No statement in this presentation is...

1
Unaudited Results
9 Months ended 30 September, 2015
2
Forward Looking Statements
This presentation contains or incorporates by reference ‘forward-looking statements’ regarding the belief orcurrent expectations of Union Bank Plc, the Directors and other members of its senior management aboutthe Group’s businesses and the transactions described in this presentation. Generally, words such as ‘‘could’’,‘‘will’’, ‘‘expect’’, ‘‘intend’’, ‘‘anticipate’’, ‘‘believe’’, ‘‘plan’’, ‘‘seek’’ or similar expressions identify forward-lookingstatements.
These forward-looking statements are not guarantees of future performance. Rather, they are based oncurrent views and assumptions and involve known and unknown risks, uncertainties and other factors, manyof which are outside the control of the Company and/or its Group and are difficult to predict, that may causeactual results to differ materially from any future results or developments expressed or implied from theforward-looking statements. Such risks and uncertainties include, but are not limited to, regulatorydevelopments, competitive conditions, technological developments and general economic conditions. TheBank assumes no responsibility to update any of the forward looking statements contained in thispresentation.
Any forward-looking statement contained in this presentation based on past or current trends and/or activitiesof Union Bank should not be taken as a representation that such trends or activities will continue in the future.No statement in this presentation is intended to be a profit forecast or to imply that the earnings of theCompany for the current year or future years will necessarily match or exceed the historical or publishedearnings of the Company. Each forward-looking statement speaks only as of the date of the particularstatement. Union Bank expressly disclaims any obligation or undertaking to release publicly any updates orrevisions to any forward-looking statements contained herein to reflect any change in Union Bank’sexpectations with regard thereto or any change in events, conditions or circumstances on which any suchstatement is based.

3
UBN Overview
UBN Financial Performance
Full Year 2015 Outlook
The Operating Environment
Q & A
4
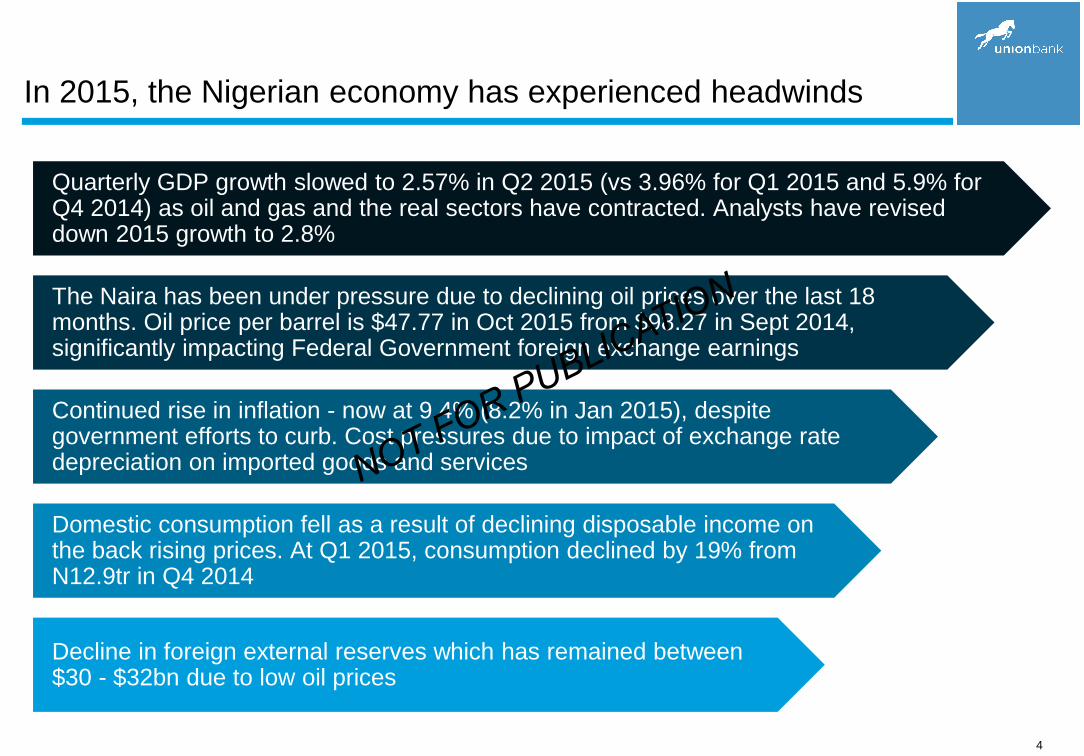
In 2015, the Nigerian economy has experienced headwinds
Domestic consumption fell as a result of declining disposable income on the back rising prices. At Q1 2015, consumption declined by 19% from N12.9tr in Q4 2014
Decline in foreign external reserves which has remained between $30 - $32bn due to low oil prices
Quarterly GDP growth slowed to 2.57% in Q2 2015 (vs 3.96% for Q1 2015 and 5.9% for Q4 2014) as oil and gas and the real sectors have contracted. Analysts have revised down 2015 growth to 2.8%
Continued rise in inflation - now at 9.4% (8.2% in Jan 2015), despite government efforts to curb. Cost pressures due to impact of exchange rate depreciation on imported goods and services
The Naira has been under pressure due to declining oil prices over the last 18 months. Oil price per barrel is $47.77 in Oct 2015 from $98.27 in Sept 2014, significantly impacting Federal Government foreign exchange earnings

5
Significant regulatory changes greatly impacted the banking
sector in 2015
To foster financial inclusion and access, bank transaction fees have been reduced
Implementation of Treasury Single Account which resulted in the transfer of N1.2trn ($6bn) of public sector funds to the CBN
Central Bank of Nigeria’s (“CBN”) closure of the Dutch Auction System in Q1 2015 contributed to the devaluation of the Naira (NGN) from N168/$1 to N198/$1
Changes in Cash Reserve Requirement - harmonized at 31% in May 2015 for public and private sector deposits but subsequently reduced to 25% in Sept 2015
Foreign exchange (“FX”) management directives included exclusion of 41 import items from accessing foreign currency (FCY) at the official FX rate and ban on FCY for local transactions
6
UBN Overview
UBN Financial Performance
Full Year 2015 Outlook
The Operating Environment
Q & A

7
The Union Bank Story
• Union Bank (“UBN”) was established in 1917 and is one of Nigeria’s long-standing and most respected
financial institutions, offering a portfolio of banking services to individual, SME, commercial and corporate
clients.
• Following the banking crisis in 2009 and the intervention of the Central Bank of Nigeria (CBN) via
AMCON, the bank was recapitalized in 2012 with an injection of $500 million by Union Global Partners
Limited (UGPL), a consortium of local and international investors. UGPL acquired 65% of the bank’s
shareholding and in 2014 AMCON’s remaining 20% stake in the bank was acquired by Atlas Mara.
• With new leadership, UBN has redefined its ambition and mapped out a strategy to be a highly respected
provider of quality banking services. Aggressive execution of this strategy is underway, leveraging a
robust transformation team largely focused on people, processes and technology. Our transformation
efforts are yielding positive results as evident from our financial results.
• With our unrelenting commitment to our transformation, we are repositioning Union Bank as a strong
player in the Nigerian banking sector – A Simpler, Smarter Bank.
• Other notable achievements to date include our successful migration to a new core banking platform,
implementation of new mobile banking platform, launch of five smarter banking centres, upgrade of 30+
branches, launch of Oracle ERP, upgrade of our data centre, establishment of our central processing
centre to drive operational efficiencies and strengthened talent base.
• Following the launch of our new identity, we have entered a new phase of our transformation. Our new
brand identity positions us competitively in the industry and we are confident in our ability to deliver a
superior customer experience to our existing customers and attract a new base of customers.

8
Union Bank at a Glance (Sept 2015)
Assets
N1.0tr
UGPL65.0% Atlas Mara
20.9%
Diverse Group of Shareholders
14.1%
Union Global Partners Limited consists of:
• African Capital Alliance
• Standard Chartered Private Equity
• African Development Corporation (ADC) *
• Corsair Capital
• FMO (Netherlands Development Finance Co.)
• Chandler Corporation
Ownership StructureChannels
314Branches
679ATMs
6,682POS
2,738
Equity
N220bn
Employees
~1.8 m
Customers
Recent Awards & Recognition
• Business Day Award for “best bank to support
Nigeria’s small and medium scale enterprises”
• CBN Award as the best bank in Agricultural Credit
Guarantee Scheme Fund in Nigeria
• MasterCard cashless champion awards: Cashless
POS Activation Champion
• First Nigerian bank awarded the latest Payment
Card Industry Data Security Standard (PCI DSS)
Version 3.0 certification
• Certified ISO27001:2013 standard for Information
Security
• Web Jurist: Best in Aesthetics, Banking
* Owned by Atlas Mara
Fitch: b-
Credit Ratings
GCR: A2 (Short-Term)
BBB+ (Long Term)

9
Growth Context for Union Bank
• Strategic direction defined
• Sale of non-banking subsidiaries -
refocus on core banking
• A right-sized organisation fit for
purpose and growth
2009 - 2012 2013 - 2014 2015 & Beyond …
• Repositioned as a highly
respected provider of quality
banking services
• Revitalized brand
• Enhanced technology platform
and operations
• Robust and modern distribution
network
• Consistent delivery of high quality
customer experience
• A simpler, smarter bank
• CBN Intervention
• Recapitalization
• New Management
Execute &
Reposition
Strategize
& Rebuild
Stabilize &
Rehabilitate

10
Our Ambition for Union Bank
We aspire to be a highly respected provider of quality banking services
Quality of
our customer experience
Quality of
our client base
Quality of
our talent
Quality of
our earnings
Quality of
our banking platform
Quality of
our professional
standards
1 2 3
4 5 6
A leading mid-tier Bank by 2018, on a trajectory to be top tier by 2020
11
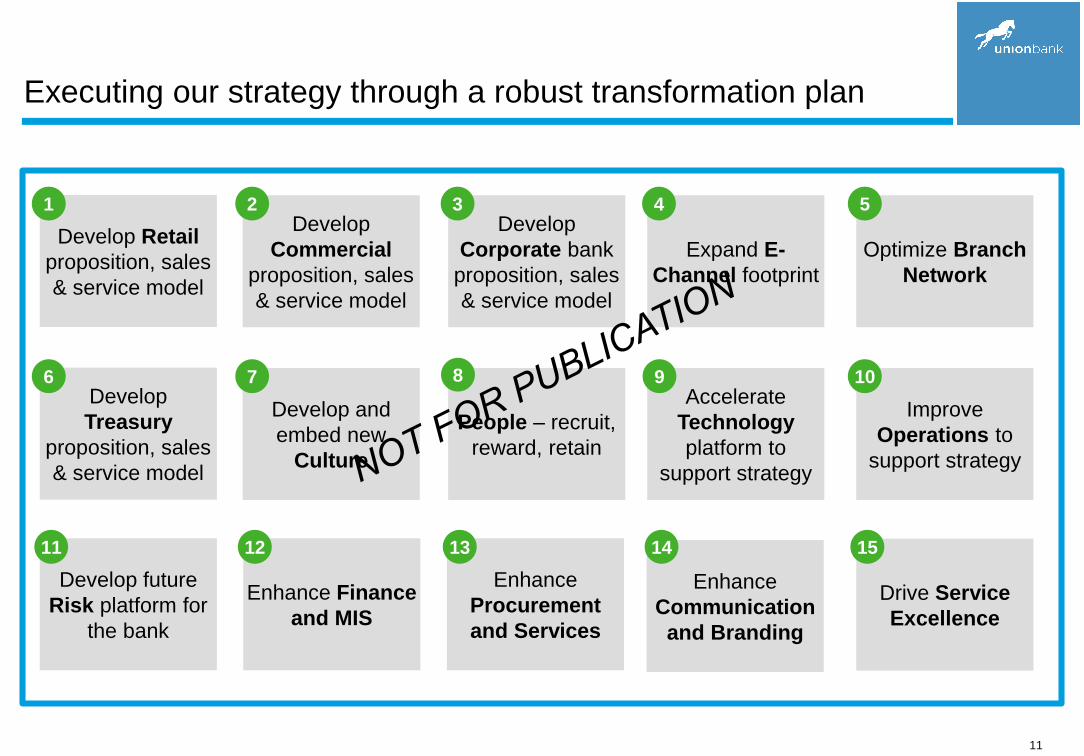
Executing our strategy through a robust transformation plan
Develop future
Risk platform for
the bank
11
Enhance Finance
and MIS
Enhance
Procurement
and Services
Enhance
Communication
and Branding
Drive Service
Excellence
12 13 14 15
Develop
Treasury
proposition, sales
& service model
6
Develop and
embed new
Culture
People – recruit,
reward, retain
Accelerate
Technology
platform to
support strategy
Improve
Operations to
support strategy
7 8 9 10
Develop Retail
proposition, sales
& service model
1Develop
Commercial
proposition, sales
& service model
Develop
Corporate bank
proposition, sales
& service model
Expand E-
Channel footprint
Optimize Branch
Network
2 3 4 5

12
Our Strong Leadership Team
Udoma Udo Udoma
Chairman
Emeka Emuwa
Chief Executive Officer
25+ years experience in banking
Oyinkan Adewale
Chief Financial Officer
31+ years Chartered Accountant, 25+
years experience in banking
Kandolo Kasongo
Chief Risk Officer
31+ years experience in banking
Lucky Jayaratne
Head, IT & Operations
34+ years experience in banking
Miyen Swomen
Head, Human Resources
19+ years experience in HR,
strategy & banking
Lola Cardoso
Head, Corporate Strategy
17+ years experience in
strategy & banking
Joseph Mbulu
Head, Transformation
23+ years experience in business
transformation & banking
Adekunle Sonola
Head, Commercial Banking
23+ years experience in banking
Ibrahim Kwargana
Head, North & Public Sector
25+ years experience in banking
Carlos Wanderley
Head, Retail Banking
23+ years experience in retail &
banking
Emeka Okonkwo
Head, Corporate Banking
23+ years experience in banking

13
Our Financial Performance - Proof Points of Our Success So Far
* Unaudited financials* Unaudited financials
FY 2011 FY 2012 FY 2013 FY 2014 9M 2015
Balance
Sheet
(N’bn)
Assets 827,153 886,468 882,097 920,936 1,015,469
Gross Loans 155,747 148,790 230,720 325,748 367,254
Customer Deposits 399,775 482,005 479,956 507,431 526,116
Equity 178,902 171,671 187,784 205,974 219,942
Key B/S
Ratios
Loan to Deposit 36% 31% 48% 64% 70%
Non Performing Loans 5.1% 6.7% 5.9% 5.1% 6.2%
Capital Adequacy 21% 20% 25% 16% 16%
Liquidity 93% 84% 63% 43% 32%
Income
Statement
(N’bn)
Gross Earnings 71,206 96,484 103,225 109,821 86,408
Net Operating Income (29,425) 74,337 66,052 82,277 55,458
Operating Expenses 73,208 70,899 56,686 57,222 42,291
PBT (102,633) 3,438 4,201 20,691 13,168
PAT (76,711) 3,170 5,121 20,486 13,082
Key P&L
Ratios
Net Interest Margin 4.3% 8.0% 7.6% 8.6% 8.6%
Cost to Income 183% 96% 71% 67% 770%1%
Return on Equity (428%) 1.8% 2.8% 10.4% 8.2%
Return on Asset (12.3%) 0.4% 0.5% 2.3% 1.8%
Earnings Per Share (1,252k) 19k 30k 121k 77k

14
UBN Overview
UBN Financial Performance
Full Year 2015 Outlook
The Operating Environment
Q & A

15
9M 2015 Performance - Bank Key Achievements
• In spite of significant volatility on the macro-economic front and strong regulatory headwinds,
reported profit after tax for 9M 2015 was N13.2bn, up 11% from 9M 2014. Excluding the gain on the
sale of subsidiaries, 9M 2015 PBT is N9.8bn and still compares favourably against 9M 2014 PBT of
N6.6bn, with a 74% YoY increase.
• Net interest income is up 4% to N39bn (N37bn for 9M’15) reflecting the positive asset growth of the
loans and advances that were up 13% to N367bn (N326bn in Dec’14). This improvement is despite
a slight increase in the average cost of funding for UBN given the market-broad liquidity pressures
currently being experienced.
• Non-interest income before gains on disposal of subsidiaries is up 6% to N18bn supported by the
increase in client base and positive trading income due to volatility in the currency market.
• Operating expenses for 9M’15 decreased by 2% to N42.3bn (N43.1bn 9M 2014). This downward
trend is expected to continue and reflects the cost efficiency benefits following the significant
transformation program conducted over the past 18 to 24 months.
• As we go into the final quarter of the year, we expect to sustain this level of performance, leveraging
on our new brand identity, maintaining our focus on improving operating efficiencies and proactively
managing our risk whilst cautiously exploring emerging opportunities in the economy.

16
9M 2015 Performance - Bank Financial Highlights (1)
Income
Statement
Balance
Sheet
Key
Ratios
• Gross Earnings up 11% to N86bn (N78bn 9M 2014)
• Net Operating Income up 2% to N55bn (N55bn 9M 2014)
• Operating Expenses down 2% to N42bn (N43bn 9M 2014)
• PBT up 11% to N13bn (N12bn 9M 2014)
• PBT excluding gains on subsidiary sale up 74% to 9.8bn (N7bn 9M 2014)
• PAT up 11% to N13bn (N12bn 9M 2014)
• Total Assets up 10% to N1,015bn (N921bn Dec 2014)
• Net Loans & Advances up 13% to N342bn (N302bn Dec 2014)
• Customer Deposits up 4% to N526bn (N507bn Dec 2014)
• Equity up 7% to N220bn (N206bn Dec 2014)
• Loan to Deposit Ratio 70% (64% Dec 2014)
• Non-Performing Loan Ratio 6.2% (6.3% 9M 2014)
• Capital Adequacy Ratio 16% (16% Dec 2014)
• Liquidity Ratio 32% (vs regulatory minimum of 30%)
• Net Interest Margin 8.8% (8.9% in 9M 2014)
• Cost to Income Ratio 70.6% (71.6% in 9M 2014)
• Return on Equity 8.2% (8.2% in 9M 2014)
• Return on Assets 1.8% (1.8% in 9M 2014)
• Earnings Per Share 77.2k (69.6k in 9M 2014)
• Cost of Risk 1.3% (1.7% in 9M 2014)1 Unaudited Financials
17
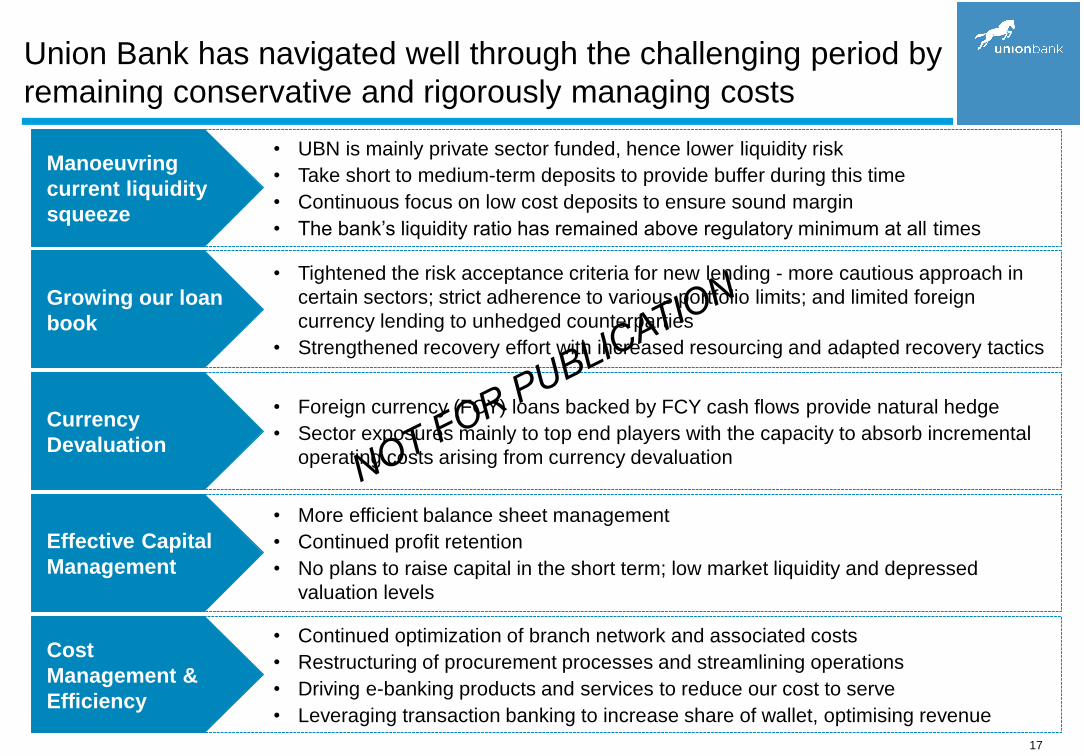
• Tightened the risk acceptance criteria for new lending - more cautious approach in
certain sectors; strict adherence to various portfolio limits; and limited foreign
currency lending to unhedged counterparties
• Strengthened recovery effort with increased resourcing and adapted recovery tactics
• Foreign currency (FCY) loans backed by FCY cash flows provide natural hedge
• Sector exposures mainly to top end players with the capacity to absorb incremental
operating costs arising from currency devaluation
• UBN is mainly private sector funded, hence lower liquidity risk
• Take short to medium-term deposits to provide buffer during this time
• Continuous focus on low cost deposits to ensure sound margin
• The bank’s liquidity ratio has remained above regulatory minimum at all times
• Continued optimization of branch network and associated costs
• Restructuring of procurement processes and streamlining operations
• Driving e-banking products and services to reduce our cost to serve
• Leveraging transaction banking to increase share of wallet, optimising revenue
• More efficient balance sheet management
• Continued profit retention
• No plans to raise capital in the short term; low market liquidity and depressed
valuation levels
Union Bank has navigated well through the challenging period by
remaining conservative and rigorously managing costs
Growing our loan
book
Currency
Devaluation
Manoeuvring
current liquidity
squeeze
Cost
Management &
Efficiency
Effective Capital
Management
18
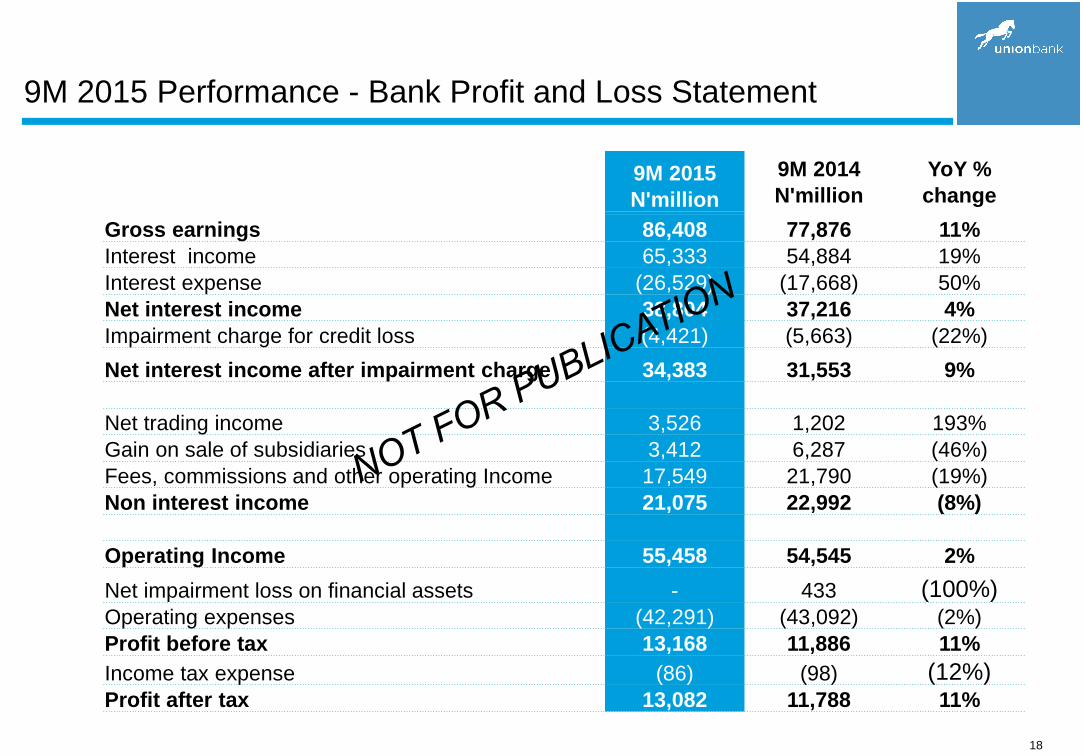
9M 2015 Performance - Bank Profit and Loss Statement
9M 2015
N'million
9M 2014
N'million
YoY %
change
Gross earnings 86,408 77,876 11%
Interest income 65,333 54,884 19%
Interest expense (26,529) (17,668) 50%
Net interest income 38,804 37,216 4%
Impairment charge for credit loss (4,421) (5,663) (22%)
Net interest income after impairment charge 34,383 31,553 9%
Net trading income 3,526 1,202 193%
Gain on sale of subsidiaries 3,412 6,287 (46%)
Fees, commissions and other operating Income 17,549 21,790 (19%)
Non interest income 21,075 22,992 (8%)
Operating Income 55,458 54,545 2%
Net impairment loss on financial assets - 433 (100%)Operating expenses (42,291) (43,092) (2%)
Profit before tax 13,168 11,886 11%
Income tax expense (86) (98) (12%)Profit after tax 13,082 11,788 11%
19
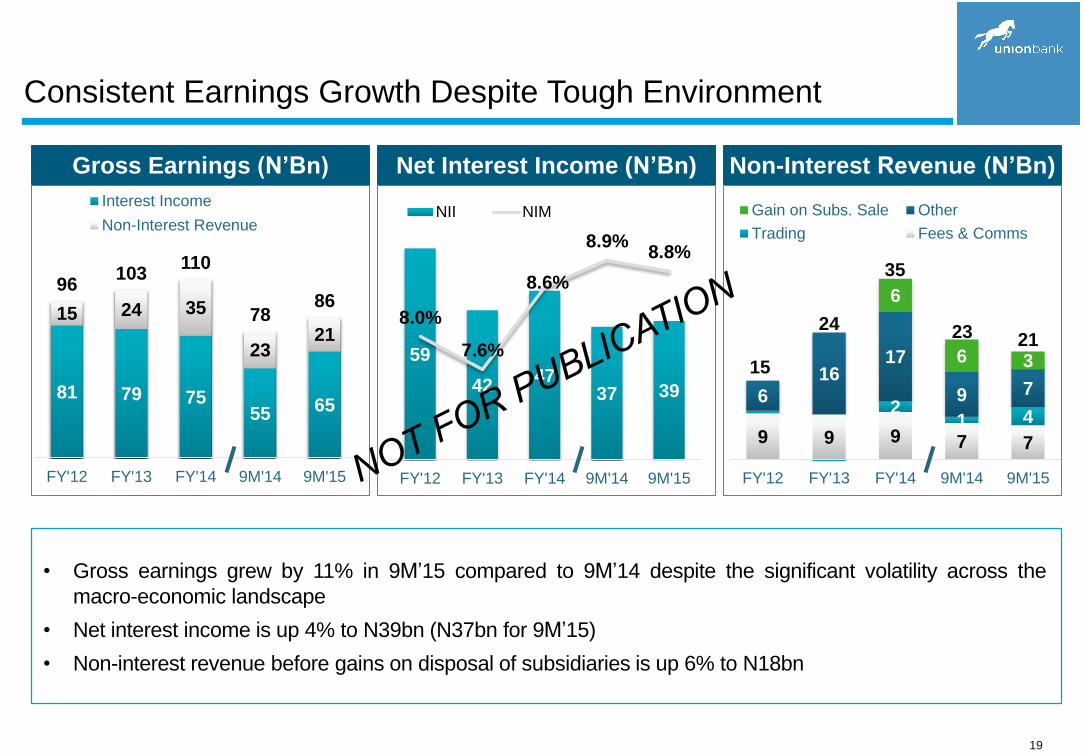
Consistent Earnings Growth Despite Tough Environment
81 79 7555 65
15 24 35
2321
96103
110
7886
FY'12 FY'13 FY'14 9M'14 9M'15
Interest Income
Non-Interest Revenue
Gross Earnings (N’Bn) Non-Interest Revenue (N’Bn)Net Interest Income (N’Bn)
59
4247
37 39
8.0%
7.6%
8.6%
8.9%8.8%
6.5%
7.0%
7.5%
8.0%
8.5%
9.0%
9.5%
0
10
20
30
40
50
60
70
FY'12 FY'13 FY'14 9M'14 9M'15
NII NIM
9 9 9 7 7
21 4
6
1617
9 7
6
6 3
FY'12 FY'13 FY'14 9M'14 9M'15
Gain on Subs. Sale Other
Trading Fees & Comms
15
35
21
• Gross earnings grew by 11% in 9M’15 compared to 9M’14 despite the significant volatility across the
macro-economic landscape
• Net interest income is up 4% to N39bn (N37bn for 9M’15)
• Non-interest revenue before gains on disposal of subsidiaries is up 6% to N18bn
24 23

20
Continued Profit Trajectory
• UBN delivered PBT of N13.2bn in 9M‘15, up 11% over 9M’14
• Excluding the gain on the sale of subsidiaries, 9M’15 PBT is N9.8bn and still compares favourably
against 9M’14 PBT of N6.6bn, with a 74% YoY increase
3 4
14
6
10
35
14
6
10
FY'12 FY'13 FY'14 9M'14 9M'15
PBT PAT
Profit Before Tax & Profit after Tax (N’Bn) Return on Assets & Return on Equity
1.8%2.8%
8.2% 8.2%
0.4% 0.5%
1.8% 1.8%
FY'12 FY'13 9M’14 9M’15
ROE ROA

21
Continuous Improvement in Cost Management
• Operating expenses have declined by 2% YoY driven by our sustained cost discipline. This is in spite
of our continued investment in technology, branch infrastructure, people and increased marketing
spend
• Continued focus on e-banking products and transaction banking will deliver further costs
4131 27 23 22
82
30
1828
21 21
0
10
20
30
40
50
60
70
FY'12 FY'13 FY'14 9M'14 9M'15
Staff costs (excl restructure) Restructuring costs
Other Op. costs
4344
Operating Expenses (N’Bn) Cost-To-Income Ratio
96.0%
71.5% 71.6%
66.9%
70.6%
60.0%
70.0%
80.0%
90.0%
100.0%
FY'12 FY'13 9M’14 FY'14 9M’15
71
5757
* CIR includes gain on sale of subsidiaries of N3.4bn 9M 2015, N6.3bn for 9M’15 and FY’15
22
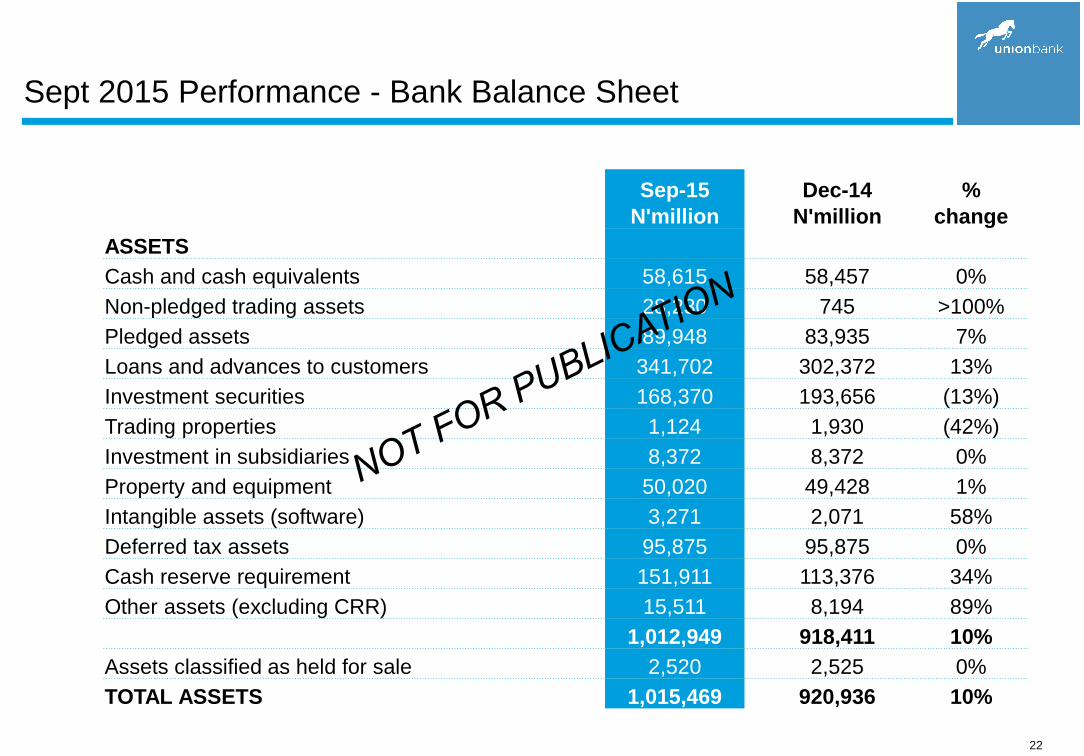
Sept 2015 Performance - Bank Balance Sheet
Sep-15
N'million
Dec-14
N'million
%
change
ASSETS
Cash and cash equivalents 58,615 58,457 0%
Non-pledged trading assets 28,230 745 >100%
Pledged assets 89,948 83,935 7%
Loans and advances to customers 341,702 302,372 13%
Investment securities 168,370 193,656 (13%)
Trading properties 1,124 1,930 (42%)
Investment in subsidiaries 8,372 8,372 0%
Property and equipment 50,020 49,428 1%
Intangible assets (software) 3,271 2,071 58%
Deferred tax assets 95,875 95,875 0%
Cash reserve requirement 151,911 113,376 34%
Other assets (excluding CRR) 15,511 8,194 89%
1,012,949 918,411 10%
Assets classified as held for sale 2,520 2,525 0%
TOTAL ASSETS 1,015,469 920,936 10%

23
Sept 2015 Performance - Bank Balance Sheet (Cont.)
Sep-15
N'million
Dec-14
N'million
%
change
LIABILITIES
Deposits from banks – Lcy 9,000 - 100%
Deposits from banks - Fcy 5,970 18,055 (67%)
Deposits from customers 526,116 507,431 4%
Current tax liabilities 517 635 (19%)
Other liabilities 153,480 109,861 40%
Retirement benefit obligations 245 845 (71%)
Other borrowed funds 100,199 78,135 28%
TOTAL LIABILITIES 795,527 714,962 11%
EQUITY
Share capital and share premium 400,109 400,109 -
Retained earnings / (accumulated loss) (244,909) (251,172) (2%)
Other reserves 64,742 57,037 14%
Equity attributable to equity-holders of the bank 219,942 205,974 7%
TOTAL LIABILITIES AND EQUITY 1,015,469 920,936 10%

24
97152 164 161 194
385 328 327347
332
2012 2013 9M 2014 2014 9M 2015
Term Current & Savings
Consistent Balance Sheet Growth
• Increased customer deposits by 7% Y-o-Y closing at N526bn, compared to N491bn in Sept 2014
• Improved loan-to-deposit ratio to 70% as at Sept 2015 from 64% in Dec. 2014
• Loan growth of 13% as at Sept 2015 from Dec. 2014, having slowed down loan growth end H1 in the face of
uncertainties on the policy front and growing risk in certain sectors
• Lending to resume cautiously as more clarity emerges, with a focus on premium quality risk assets as we
continue to explore opportunities to grow our market share responsibly
Deposits (N’Bn)
482 480 507
Loan to Deposit Ratio
31%
48%
57%
64%
70%
2012 2013 9M 2014 2014 9M 2015
526491
Gross Loans (N’Bn)
52 67 82 66 2
52
124166 210 328
34
30
13
2514
11
10
18
25
23
149
231
279
326367
0
50
100
150
200
250
300
350
2012 2013 9M 2014 2014 9M 2015
Overdrafts Term Loans
On-lending facilities Other Loans

25
Customer Deposits (N526Bn) Gross Loans (N367Bn)
Deposits and Loans by Business Segment
60%
8%
Retail & SME
15%26%
Commercial
25%
66%Corporate
• Retail deposits of N317bn at Sept’15, account for 60% of total bank. This diversified base implies
reduced concentration risk
• Corporate banking loans at N244bn account for 66% of the total loan book of the bank

26
Adequate Capital Adequacy & Liquidity
• The bank’s capital and liquidity ratios remain above regulatory requirements despite the volatility in
market liquidity occasioned by stringent regulatory policy.
• End Oct 2015, liquidity ratio 41.5% reflecting reduced pressure post CRR reduction.
84%
63%
51%43%
32%30%
10%
20%
30%
40%
50%
60%
70%
80%
90%
0%
10%
20%
30%
40%
50%
60%
70%
80%
90%
2012 2013 9M 2014 2014 9M 2015
UBN Liquidity Statutory Min.
LiquidityCapital Adequacy
20%
25%
17% 16%15%
5%
10%
15%
20%
25%
30%
0%
5%
10%
15%
20%
25%
30%
2012 2013 9M 2014 2014 9M 2015
UBN Basel I CAR Statutory Min. UBN Basel II CAR
16%
UBN Basel II CAR (unaudited profits)

27
Focus on Loan Book Quality
• Non performing loan (NPL) ratio of 6.2% vs 6.3% Sept 2014 and 5.1% Dec 2014 reflects increasingly difficult
macroeconomic conditions for our customers
• Coverage ratio of 113% reflects a conservative provisioning policy
• NPL recovery and continuous monitoring of existing loan book should see a reduction in the NPLs and reduced
levels of impairment losses for the rest of the year and onwards
Coverage Ratio
119%
151%149%
140%
113%
2012 2013 9M 2014 2014 9M 2015
Non Performing Loans (N’Bn)
10 14 18 17 23
6.7%
5.9%
6.3%
5.1%
6.2%
4.0%
4.5%
5.0%
5.5%
6.0%
6.5%
7.0%
7.5%
8.0%
0
5
10
15
20
25
2012 2013 9M 2014 2014 9M 2015
NPL NPL Ratio
Cost of Risk
-0.4%
7.0%
1.7%1.2% 1.3%
-1.0%
0.0%
1.0%
2.0%
3.0%
4.0%
5.0%
6.0%
7.0%
8.0%
2012 2013 9M 2014 2014 9M 2015
*
* Includes write back in 2012
28
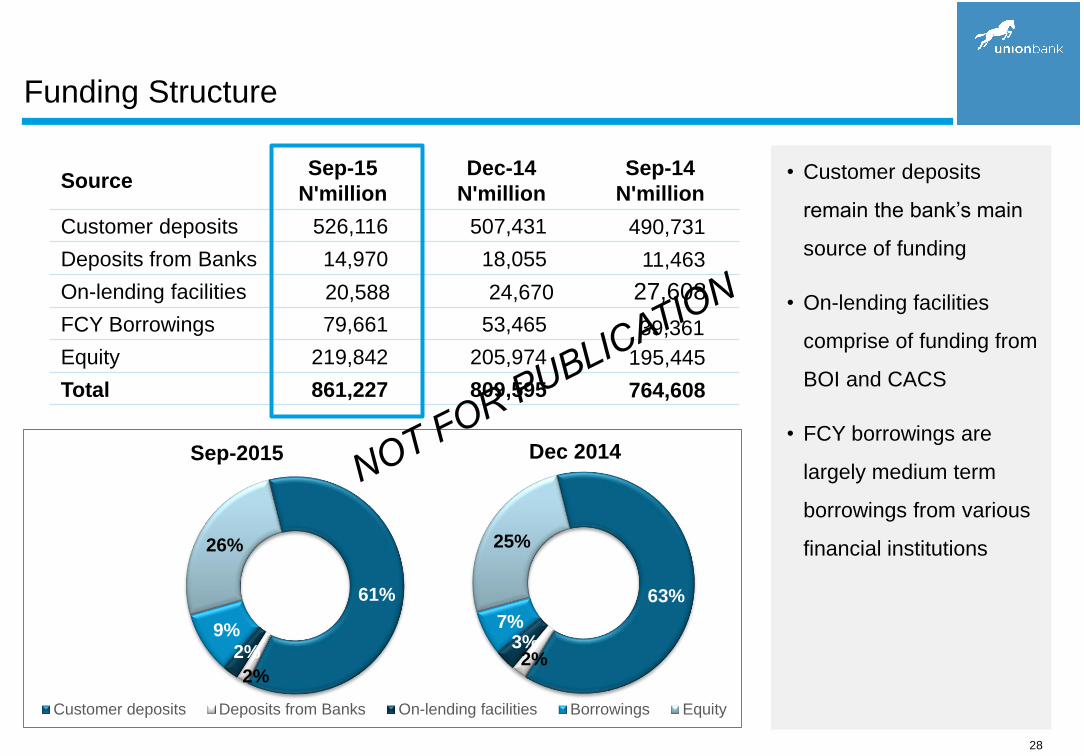
Funding Structure
• Customer deposits
remain the bank’s main
source of funding
• On-lending facilities
comprise of funding from
BOI and CACS
• FCY borrowings are
largely medium term
borrowings from various
financial institutions
Sep-2015
61%
2%
2%9%
26%
Customer deposits Deposits from Banks On-lending facilities Borrowings Equity
Dec 2014
63%
2%3%
7%
25%
SourceSep-15
N'million
Dec-14
N'million
Sep-14
N'million
Customer deposits 526,116 507,431 490,731
Deposits from Banks 14,970 18,055 11,463
On-lending facilities 20,588 24,670 27,608
FCY Borrowings 79,661 53,465 39,361
Equity 219,842 205,974 195,445
Total 861,227 809,595 764,608

29
UBN Overview
UBN Financial Performance
Full Year 2015 Outlook
The Operating Environment
Q & A

30
Union Bank’s priorities for 2015 remain unchanged
Leading Change,
Improving Productivity
&
Embedding Transformation
2
Effective Capital
Management
4
Cost Management and
CIR Reduction
3
Focus on
Low Cost Deposits and
Non-Interest Revenue
Sources
1
Proactive Risk
Management and
Recoveries
31
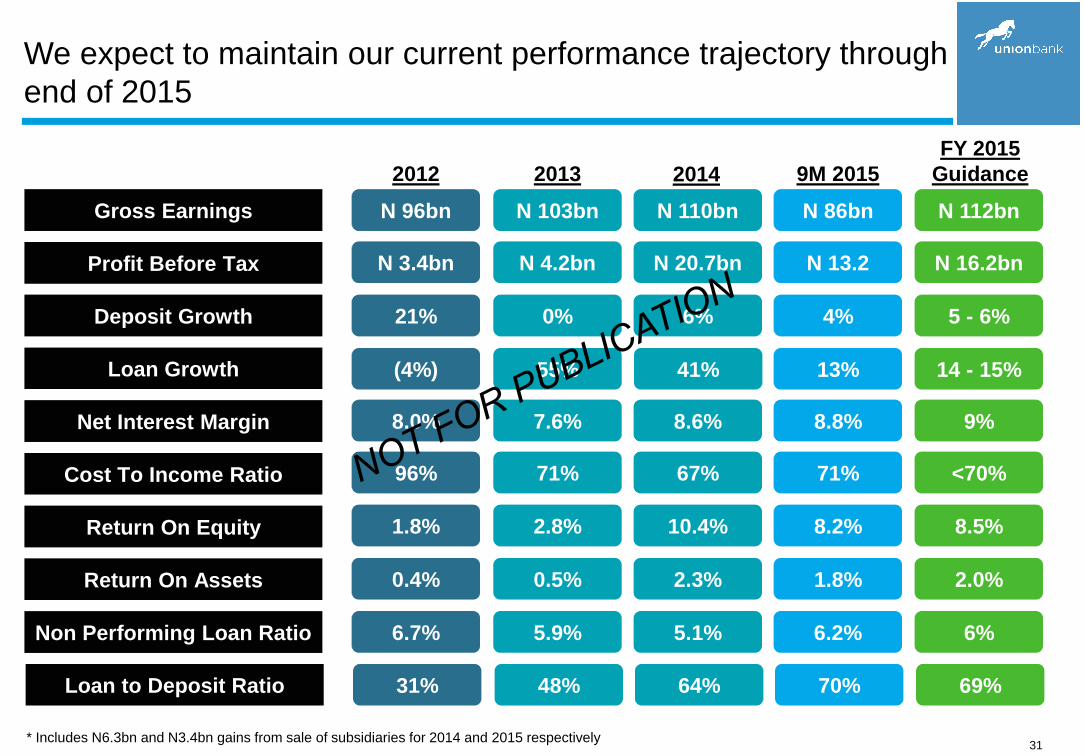
We expect to maintain our current performance trajectory through
end of 2015
* Includes N6.3bn and N3.4bn gains from sale of subsidiaries for 2014 and 2015 respectively
Loan Growth
Return On Assets
Gross Earnings
Deposit Growth
Profit Before Tax
Return On Equity
Net Interest Margin
Cost To Income Ratio
Non Performing Loan Ratio
Loan to Deposit Ratio
2014
N 110bn
41%
2.3%
6%
N 20.7bn
10.4%
67%
8.6%
5.1%
64%
2012
0.4%
(4%)
N 96bn
21%
N 3.4bn
1.8%
8.0%
96%
6.7%
31%
9M 2015
N 86bn
13%
1.8%
4%
N 13.2
8.2%
71%
8.8%
6.2%
70%
2013
0.5%
7.6%
71%
55%
N 103bn
5.9%
0%
N 4.2bn
2.8%
48%
FY 2015
Guidance
N 112bn
14 - 15%
2.0%
5 - 6%
N 16.2bn
8.5%
<70%
9%
6%
69%

32
UBN Overview
UBN Financial Performance
Full Year 2015 Outlook
The Operating Environment
Q & A

Draft/ Confidential
This information is confidential and was prepared by Bain & Company solely for the use of our client; it is not to be relied on by any 3rd party without Bain's prior written consent
Q & A
Draft/ Confidential
This information is confidential and was prepared by Bain & Company solely for the use of our client; it is not to be relied on by any 3rd party without Bain's prior written consent
Appendix – 9M 2015 Group Financial Performance

35
9M 2015 Performance – Group Financial Highlights (1)
Income
Statement
Balance
Sheet
Key
Ratios
• Net Interest Income up 5% to N40.0bn (N38.1bn 9M 2014)
• Non-Interest Income up 7% to N18.0bn (N16.8bn 9M 2014) 2
• Net Operating Income up 9% to N53.6bn (N49.3bn 9M 2014) 2
• Loss on sale of subsidiaries N0.5bn vs. gain on sale of N3.35bn for 9M
2014
• Total expenses down 1% to N43.7bn (N44.2bn 9M 2014)
• Profit Before Tax up 104% to N10.1bn (N4.9bn 9M 2014) 2
• Profit after tax up 108% to N10.5bn (N4.7bn 9M 2014) 2
• Total Assets up 7% to N1,084bn (N1,009bn Dec 2014)
• Net Loans & Advances up 13% to N362bn (N313bn Dec 2014)
• Customer Deposits down to N527bn (N528bn Dec 2014)
• Equity up 7% to N233bn (N222bn Dec 2014)
• Loan to Deposit Ratio of 73% (64% as at December 2014)
• Net Interest Margin of 8.1% (8.2% for 9M 2014)
• Cost to Income ratio of 76% (76% in 9M 2014)
• Return on Equity of 5.5% (5.4% for 9M 2014) 2
• Return on Asset of 1.2% (1.1% for 9M 2014) 2
• Earning Per Share of 55.2 kobo (43.6 kobo for 9M 2014) 3
(1) Unaudited financials
(2) Excludes gain on sale of subsidiaries from Q3-2014
(3) Q3-2014 profit includes gains of N3.3bn from sale of subsidiaries

36
9M 2015 Group Profit and Loss Statement
9M 2015
N'million
9M 2014
N'million%
change
Gross earnings 84,719 79,594 6%
Interest income 66,636 55,858 19%
Interest expense (26,634) (17,733) 50%
Net interest income 40,002 38,125 5%
Impairment charge for credit loss (4,454) (5,594) (20%)
Net interest income after impairment charge 35,548 32,531 9%
Net trading income 3,598 1,272 183%
Fees, commissions and other operating Income 13,938 18,885 (26%)
Non interest income 17,536 20,157 (13%)
Operating Income 53,084 52,688 1%
Net impairment loss on financial assets - 433 (100%)Operating expenses (43,704) (44,211) (1%)
Profit/(loss) before tax from discontinued operations 176 (625) (128%)Profit before tax 9,556 8,285 15%
Income tax expense (219) (201) 9%Profit after tax 9,337 8,084 15%

37
9M 2015 Group Balance Sheet
Sep-2015
N'million
Dec-2014
N'million
%
change
ASSETS
Cash and cash equivalents 100,201 121,960 (18%)
Non-pledged trading assets 28,230 745 >100%
Pledged assets 89,948 83,935 7%
Derivative assets held for risk management - 7 (100%)
Loans and advances to customers 361,515 312,797 16%
Investment in equity accounted investee 24 24 0%
Investment securities 177,679 197,200 (10%)
Trading properties 1,124 1,930 (42%)
Property and equipment 50,096 49,521 1%
Intangible assets (software) 3,705 2,422 53%
Deferred tax assets 95,883 95,883 0%
Cash reserve requirement 151,911 113,376 34%
Other assets (excluding CRR) 16,143 8,931 81%
1,076,459 988,731 9%
Assets classified as held for sale 7,064 20,426 (65%)
TOTAL ASSETS 1,083,523 1,009,157 7%
38
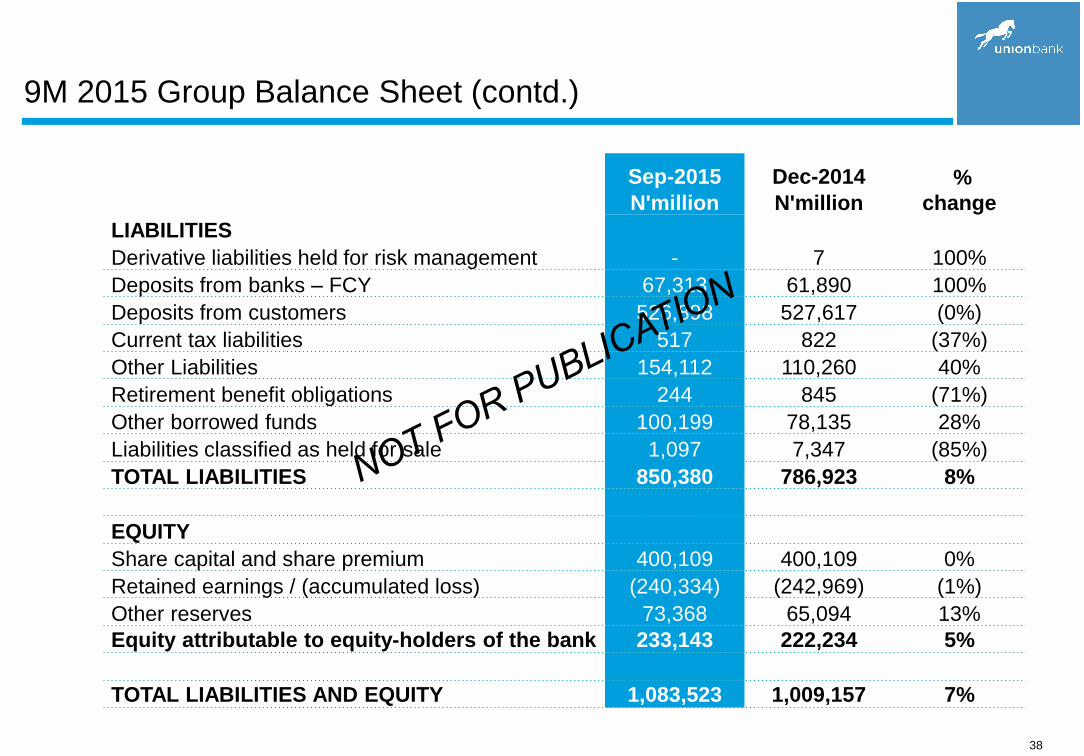
9M 2015 Group Balance Sheet (contd.)
Sep-2015
N'million
Dec-2014
N'million
%
change
LIABILITIES
Derivative liabilities held for risk management - 7 100%
Deposits from banks – FCY 67,313 61,890 100%
Deposits from customers 526,898 527,617 (0%)
Current tax liabilities 517 822 (37%)
Other Liabilities 154,112 110,260 40%
Retirement benefit obligations 244 845 (71%)
Other borrowed funds 100,199 78,135 28%
Liabilities classified as held for sale 1,097 7,347 (85%)
TOTAL LIABILITIES 850,380 786,923 8%
EQUITY
Share capital and share premium 400,109 400,109 0%
Retained earnings / (accumulated loss) (240,334) (242,969) (1%)
Other reserves 73,368 65,094 13%
Equity attributable to equity-holders of the bank 233,143 222,234 5%
TOTAL LIABILITIES AND EQUITY 1,083,523 1,009,157 7%