
Q2FY17/18 Earnings Announcement - Lenovo Home … Strategy Guiding Improved Performance Source:...
25
2017 Lenovo Internal. All rights reserved. Nov 2, 2017 – Tokyo Nov 2, 2017 – Hong Kong Q2FY17/18 Earnings Announcement
Transcript of Q2FY17/18 Earnings Announcement - Lenovo Home … Strategy Guiding Improved Performance Source:...

2017 Lenovo Internal. All rights reserved.
Nov 2, 2017 – Tokyo Nov 2, 2017 – Hong Kong
Q2FY17/18 Earnings Announcement

2
Forward Looking Statement
This presentation contains “forward-looking statements” which are statements that refer to expectations and plans for
the future and include, without limitation, statements regarding Lenovo’s future results of operations, financial condition
or business prospects as well as other statements based on projections, estimates and assumptions. In some cases,
these statements can be identified by terms such as "expect," "intend," "plan," "believe," "estimate," "may," "will,"
"should" and comparable words (including the negative of such words). These forward-looking statements, reflect the
current expectations and plans of the directors and management of Lenovo, which may not materialize or may change.
Many risks, uncertainties and other factors, some of which are unpredictable and beyond Lenovo’s control, could affect
the matters discussed in these forward-looking statements. These factors include, without limitation, economic and
business conditions globally and in the countries where we operate, Lenovo’s ability to predict and respond quickly to
market developments, consumer demand, pricing trends and competition; changes in applicable laws and regulations
(including applicable tax and tariff rates). Any variance from the expectations or plans on which these forward-looking
statements are based could cause Lenovo’s actual results or actions to differ materially from those expressed or
implied in these statements. These forward-looking statements are not guarantees of future performance and you are
cautioned not to place undue reliance on these statements. Lenovo undertakes no obligation to update any forward-
looking statements in this presentation, whether as a result of new information or any subsequent change, development
or event. All forward-looking statements in this presentation are qualified by reference to this paragraph.

2016 Lenovo Internal. All rights reserved.
Yuanqing Yang Chairman & CEO

4
Maintain PC Profitability
to Fuel New Businesses Build MBG & DCG
into New Growth Engines
Invest in “Device + Cloud”
and “Infrastructure +
Cloud” Powered by A.I.
5 2017 Lenovo. All rights reserved.
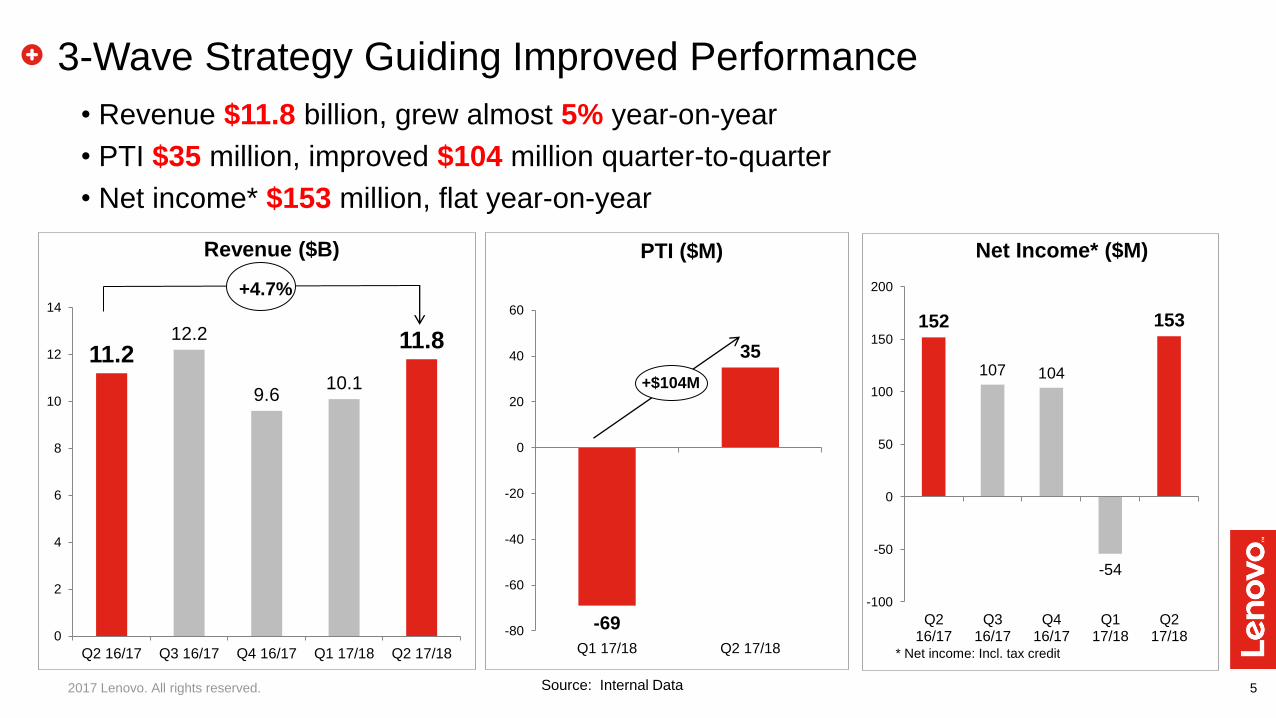
3-Wave Strategy Guiding Improved Performance
Source: Internal Data
• Revenue $11.8 billion, grew almost 5% year-on-year
• PTI $35 million, improved $104 million quarter-to-quarter
• Net income* $153 million, flat year-on-year
* Net income: Incl. tax credit
11.2 12.2
9.6 10.1
11.8
0
2
4
6
8
10
12
14
Q2 16/17 Q3 16/17 Q4 16/17 Q1 17/18 Q2 17/18
+4.7%
Revenue ($B)
+$104M
PTI ($M)
-69
35
-80
-60
-40
-20
0
20
40
60
Q1 17/18 Q2 17/18
152
107 104
-54
153
-100
-50
0
50
100
150
200
Q216/17
Q316/17
Q416/17
Q117/18
Q217/18
Net Income* ($M)

6 2017 Lenovo. All rights reserved.
• Revenue outgrew the market while maintaining industry leading profitability
• Strong growth in Latin America, Asia Pacific, EMEA; China returning to growth
• All geographies profitable
• Maintained growth in high-growth segments
• Tablet grew in the shrinking market, reached record high market share
• Leverage market consolidation, invest in high-growth segments & emerging areas
1st Wave: PC Delivers Strong Performance
2017 Lenovo. All rights reserved.
PC Revenue growth by GEO(YTY%) PC total revenue growth(YTY%)
2.2%
7.1%
Market Lenovo
2.7% 24.9%
China -0.8% 0.9%
NA 4.7% -8.6%
AP 0.9% 7.5%
LA 1.0% 37.1%
EMEA
Market Lenovo
High volume growth in different
segments(YTY%)
Tablet Workstation Detachable
Market Lenovo
8.9%11.1%
14.6%
10.2%
0.7%
-9.4%
Source: Industry Estimate & Internal Data

7
• Maintained leadership in High Performance Computing, traditional data center infrastructure.
• Strengthened technology & products in Software Defined, Hyperscale, storage and networking.
• Investment in sales force took effect: North America & EMEA revenue and profitability improved.
• China had quarter-to-quarter revenue improvement, a sign of turning around
• Business on track to return to profitable growth; will continue to invest
2nd Wave: Data Center Transformation on Track
2017 Lenovo. All rights reserved.
8 2017 Lenovo. All rights reserved.
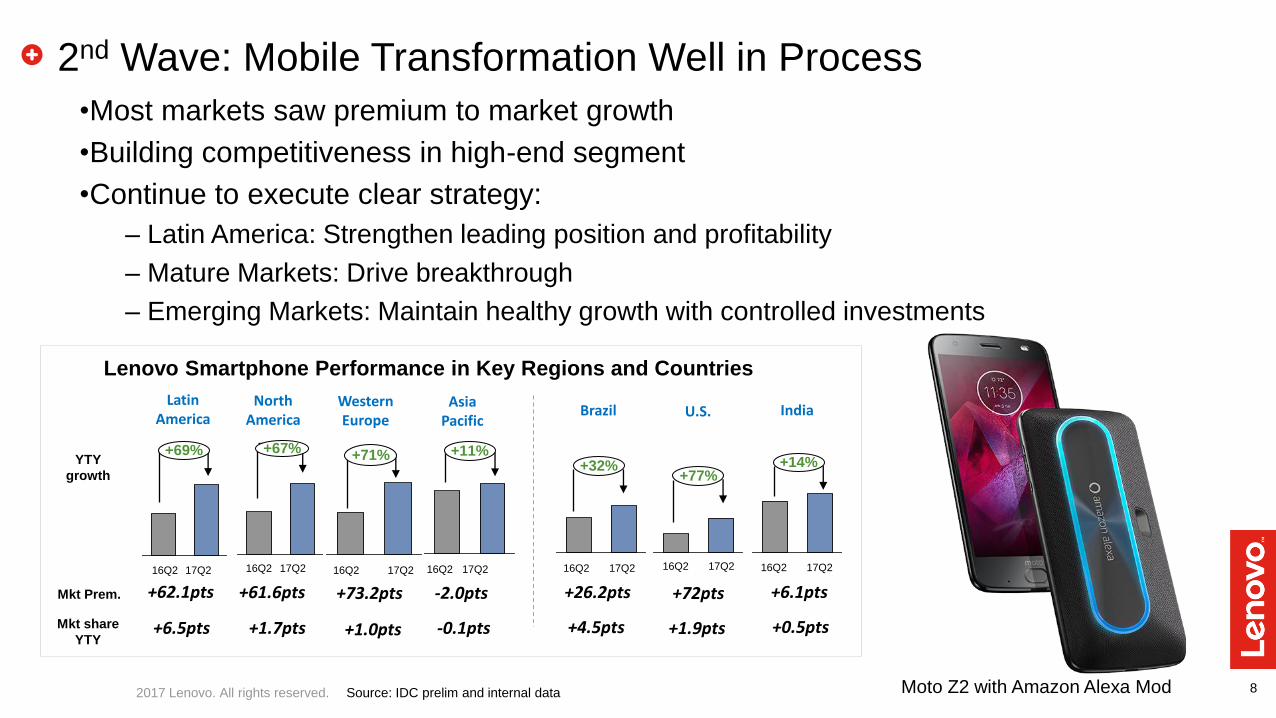
•Most markets saw premium to market growth
•Building competitiveness in high-end segment
•Continue to execute clear strategy:
– Latin America: Strengthen leading position and profitability
– Mature Markets: Drive breakthrough
– Emerging Markets: Maintain healthy growth with controlled investments
Source: IDC prelim and internal data
2nd Wave: Mobile Transformation Well in Process
YTY
growth
Mkt share
YTY
Lenovo Smartphone Performance in Key Regions and Countries
Moto Z2 with Amazon Alexa Mod
Latin America
North America
Asia Pacific
Western Europe
+6.5pts +1.7pts -0.1pts
16Q2
+69%
17Q2
+11%
17Q2 16Q2
+67%
17Q2 16Q2
+1.0pts
16Q2 17Q2
+71%
Mkt Prem. +62.1pts +61.6pts -2.0pts +73.2pts
Brazil
+4.5pts
+32%
+26.2pts
U.S.
+1.9pts
+77%
+72pts
India
+0.5pts
+14%
+6.1pts
16Q2 17Q2 16Q2 17Q2 16Q2 17Q2

9
3rd Wave: Good Progress in “Device+Cloud”
2017 Lenovo. All rights reserved.
•Continue to invest in Artificial Intelligence, smart office, smart home and AR/VR
•Star Wars AR headset on shelf for holiday season
Lenovo Mirage AR headset Lenovo SmartVest

10
Persistent Execution
Once direction set,
Persistent execution leads to
Accomplishing the goal

11
The Brazil Story
Brazil PC Business Rev. & Operational PTI ($ Millions)
Operational PTI Revenue 521
559561511
379350
302
407404
4652
79
56
-1-15
-24-35
-63
-300
-200
-100
0
100
200
300
400
500
600
-100
-50
0
50
100
150
200
Q3
15/16
Q1
16/17
Q4
15/16
Q2
16/17
Q4
16/17
Q1
17/18
Q2
17/18
Q3
16/17
Q2
15/16
Brazil Mobile Business Rev. & Operational PTI ($ Millions)
Revenue Operational PTI
Q3
16/17
Q1
17/18
Q2
17/18
Q4
16/17
Q2
16/17
Q3
15/16
Q4
15/16
Q2
15/16
Q1
16/17
-26
85 76
71 70 66
99 82
78
129
-20 -9
-2
-15 -5 -2 -4
5
(60)
(30)
0
30
60
90
120
150
(60)
(30)
0
30
60
90
120
150

12
A New Phase
of Growth

2017 Lenovo Internal. All rights reserved.
Wong Wai Ming Chief Financial Officer

14
Q2 FY2017/18 Highlights
Financial Highlights: • Strong group revenue growth of 5% YTY to US$11.8B • Transformation is on track with group reported PTI improved by US$104M QTQ • PCSD: strong revenue growth of 7% YTY with improved PTI margin QTQ • DCG: transformation on track; revenue stabilized with PTI margin improved QTQ • MBG: transformation on track; revenue grew YTY for 3rd consecutive quarter with improved PTI margin QTQ
Financial Snap Shot
US$ Million Q2 FY2017/18 Q2 FY2016/17 Q1 FY2017/18
Revenue 11,761 11,231 10,012
Gross Profit 1,613 1,607 1,365
Operating Expenses (1,525) (1,392) (1,371)
Operating Profit 88 215 (6)
Pre-tax Income 35 168 (69)
Less: One-time Property Disposal Gain - (218) -
Add: One-time Restructuring Charge - 136 -
Add: Non-cash M&A Related Accounting Charges 63 75 74
Operational PTI 98 161 5
Gross margin 13.7% 14.3% 13.6%
PTI margin 0.3% 1.5% -0.7%
Operational PTI margin 0.8% 1.4% 0.0%

15
2017 Lenovo Internal. All rights reserved.
Cash and Working Capital
US$ Million Q2 FY2017/18 Q2 FY2016/17 Q1 FY2017/18
Bank deposits and cash 1,262 2,450 1,541
Total Borrowings 2,661 2,527 2,843
Net Debt (1,399) (77) (1,302)
Net cash generated from/(used in)
operating activities 364 1,559 (577)
-40
-20
0
20
40
60
80
100
1Q 16/17 2Q 16/17 3Q 16/17 4Q 16/17 1Q 17/18 2Q 17/18
Days receivable 38 36 36 40 37 35
Days inventory 29 27 26 32 32 32
Days payable 67 68 75 94 84 81
Cash conversion cycle 0 -5 -13 -22 -15 -14

16 2017 Lenovo Internal. All rights reserved.
PC & Smart Device Business Group (PCSD)
Overview
• Strong revenue growth of up 7% YTY and 20% QTQ
• ASP improved from innovative products & better product mix, partly mitigated the impact of component cost
hike
• Premium to market revenue growth from all Geos except NA
• Strong growth in fast-growing segments
• PTI at 4.4% with QTQ improvement
Highlights
• Strong EMEA revenue growth with margin expansion thanks to solid performance across Europe
• Regained momentum in China despite the continued slow market from more innovative product launch and channel enhancement
US$ Million Q2 FY2017/18 Q2 FY2016/17 Q1 FY2017/18
Revenue 8,382 7,804 7,005
Pre-tax Income 367 405 291
Pre-tax Income Margin (%) 4.4% 5.2% 4.2%

17 2017 Lenovo Internal. All rights reserved.
Data Center Business Group (DCG) Overview
• Transformation on track: revenue stabilized with PTI margin improved QTQ
• 2nd consecutive quarter of rev YTY increase in NA & EMEA since System X acquisition
• China hit the bottom and on track to recover
• On track to improve profitability YTY from better product mix, but investments in sales capability and increase in component cost dragged the YTY PTI performance
Highlights
• Continued strong performance from Global Account, Software Defined Infrastructure, and High Performance Computing
• Fine tuned Hyperscale business model to further enhance competiveness
• On-going investments in sales capabilities and channel to drive future growth
* Included non-cash M&A-related accounting charges, such as intangible asset amortization, imputed interest expense of promissory notes and others
US$ Million Q2 FY2017/18 Q2 FY2016/17 Q1 FY2017/18
Revenue 976 1,082 971
Pre-tax Loss Operational (100) (108) (114)
Reported* (131) (141) (144)
Pre-tax Income Margin (%) Operational (10.3%) (10.0%) (11.7%)
Reported* (13.4%) (13.1%) (14.9%)

18 2017 Lenovo Internal. All rights reserved.
Mobile Business Group (MBG)
Overview
• Transformation on track: revenue grew 3rd consecutive quarter YTY
• Continued to successfully protect the strong position in LA
• Strong shipment for mainstream Moto models, i.e. Moto G & Moto E; Moto Z 2 successfully expanded to mature markets
• PTI margin improved QTQ, however increased advertising & promotion expenses on new product launches and the component cost pressure dragged the YTY margin performance
Highlights
• Maintained healthy growth in Asia Pacific with controlled investments, such as India where we regained market share
• Continued to expand in mature markets; strong momentum in Western Europe with improved ASP
• Successfully expanded to all major carriers in the U.S.
• New product roadmaps & strategy in China to drive growth
* Included non-cash M&A-related accounting charges, such as intangible asset amortization, imputed interest expense of promissory notes and others
US$ Million Q2 FY2017/18 Q2 FY2016/17 Q1 FY2017/18
Revenue 2,076 2,045 1,746
Pre-tax Loss Operational (132) (114) (129)
Reported* (164) (156) (173)
Pre-tax Income Margin (%) Operational (6.4%) (5.6%) (7.4%)
Reported* (7.9%) (7.7%) (9.9%)

Appendix
- Financial Summary
- Condensed Consolidated Income Statement
- Condensed Consolidated Balance Sheet
- Condensed Consolidated Cash Flow Statement
- Q1FY18 Performance by Geography

20
Financial Summary US$ Million Q2 FY2017/18 Q2 FY2016/17 Y/Y% Q/Q% YTD FY2017/18 Y/Y%
Revenue 11,761 11,231 5% 17% 21,773 2%
Gross Profit 1,613 1,607 0% 18% 2,977 (5%)
Operating Expenses (1,525) (1,392) 10% 11% (2,896) 8%
Operating Profit 88 215 (59%) (1534%) 81 (82%)
Other Non-Operating Expenses (53) (47) 13% (16%) (115) 33%
.
Pre-tax Income (Loss) 35 168 (79%) (151%) (34) NA
Taxation 118 (16) NA 665% 133 NA
Profit for the period 153 152 1% (384%) 99 (69%)
Non-controlling interests (14) 5 NA (22%) (32) (421%)
Profit attributable to Equity Holders 139 157 (11%) (292%) 67 (80%)
EPS (US cents)
- Basic 1.26 1.42 (0.16) 1.92 0.61 (2.38)
- Diluted 1.26 1.42 (0.16) 1.92 0.61 (2.37)
Dividend per share (HK cents) 6 6 6
Q2 FY2017/18 Q2 FY2016/17 Q1 FY2017/18 YTD FY2017/18 YTD FY2016/17
Gross margin 13.7% 14.3% 13.6% 13.7% 14.8%
E/R ratio 13.0% 12.4% 13.7% 13.3% 12.6%
Operating margin 0.7% 1.9% -0.1% 0.4% 2.2%
PTI margin 0.3% 1.5% -0.7% -0.2% 1.8%
Net margin attributable to Equity Holders 1.2% 1.4% -0.7% 0.3% 1.5%

21
Condensed Consolidated Income Statement US$ Million Q2 FY2017/18 Interim FY2017/18 Q2 FY2016/17 Interim FY2016/17
Revenue 11,761 21,773 11,231 21,287
Cost of sales (10,148) (18,795) (9,624) (18,146)
Gross profit 1,613 2,977 1,607 3,141
Other income-net - - 12 12
Selling and distribution expenses (796) (1,461) (707) (1,296)
Administrative expenses (387) (847) (438) (896)
Research and development expenses (311) (603) (349) (705)
Other operating (expense)/ income - net (31) 15 90 204
Operating profit 88 81 215 460
Finance income 8 17 6 12
Finance costs (60) (131) (56) (111)
Share of (loss)/profit of associated companies and joint
ventures (1) (1) 3 13
Profit/(loss) before taxation 35 (34) 168 374
Taxation 118 133 (16) (54)
Profit for the period 153 99 152 320
Profit attributable to:
Equity holders of the company 139 67 157 330
Perpetual securities holders 13 26 - -
Other non-controlling interests 1 6 (5) (10)
Dividend 85 85 86 86
Earnings/(Loss) per share (US cents)
- Basic 1.26 0.61 1.42 2.99
- Diluted 1.26 0.61 1.42 2.98
22
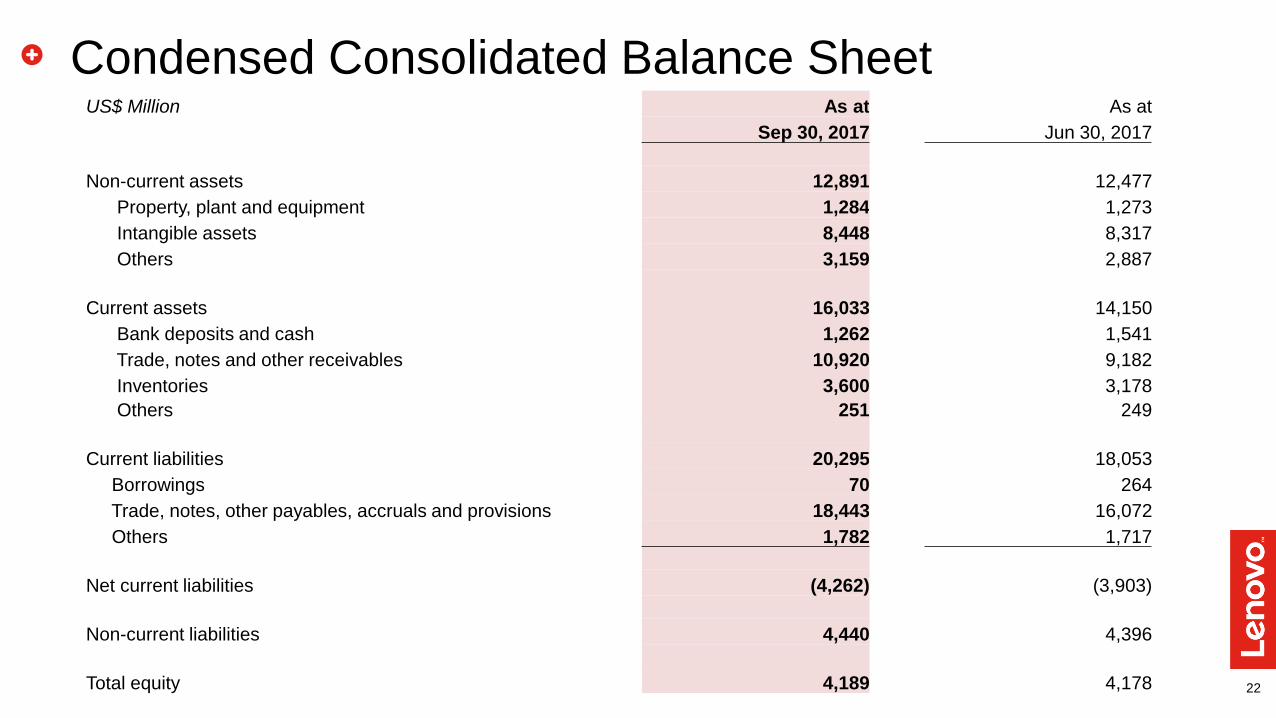
Condensed Consolidated Balance Sheet US$ Million As at As at
Sep 30, 2017 Jun 30, 2017
Non-current assets 12,891 12,477
Property, plant and equipment 1,284 1,273
Intangible assets 8,448 8,317
Others 3,159 2,887
Current assets 16,033 14,150
Bank deposits and cash 1,262 1,541
Trade, notes and other receivables 10,920 9,182
Inventories 3,600 3,178
Others 251 249
Current liabilities 20,295 18,053
Borrowings 70 264
Trade, notes, other payables, accruals and provisions 18,443 16,072
Others 1,782 1,717
Net current liabilities (4,262) (3,903)
Non-current liabilities 4,440 4,396
Total equity 4,189 4,178

23
Condensed Consolidated Cash Flow Statement
US$ Million Q2 FY2017/18 Q2 FY2016/17 Q1 FY2017/18
Net cash generated from/(used in) operating activities 364 1,792 (577)
Net cash (used in) investing activities (93) (434) (744)
Net cash used in financing activities (526) (1,015) (67)
(Decrease)/Increase in cash and cash equivalents (255) 343 (1,388)
Effect of foreign exchange rate changes 12 4 20
Cash and cash equivalents at the beginning of the
period 1,387 1,906 2,755
Cash and cash equivalents at the end of the period 1,144 2,253 1,387

24
Q2FY18 Performance by Geography
Revenue Segment Pretax Income/ (Loss) Segment Pretax Income Margin US$ Million US$ Million (%)
Q2
FY18 Y/Y Q/Q
Q2
FY18
Q2
FY17
Q1
FY18
Q2
FY18
Q2
FY17
Q1
FY18
China 3,018 (177) 503 115 158 83 3.8% 4.9% 3.3%
AP 2,028 131 455 (13) 2 (42) (0.6%) 0.1% (2.6%)
EMEA 3,152 414 449 (2) (65) (41) (0.1%) (2.4%) (1.5%)
AG 3,563 162 342 (59) 20 41 (1.6%) 0.6% 1.3%
China • PCSD: Regained momentum in a slow market via more innovated
product launch and channel enhancement • Mobile: Continued to focus on building efficient foundation
• Data Center: Sales establishment started to bring new customers and improved the product mix to drive long term growth
AP • PCSD: Strong share gained across most of the market • Mobile: Outgrow market with strong revenue and shipment
momentum; India: mkt share at 10%; continue to invest in channel expansion
• Data Center: Regained revenue growth momentum QTQ
EMEA • PCSD: Strong revenue growth with margin expansion thanks to
continued solid performance across the region • Mobile: Continue attacking WE, and seeking healthy growth in the
emerging regions • Data Center: Revenue continued to grow YTY thanks to momentum
across hyperscale and infrastructure business
AG (Americas) • PCSD: Slower progress due to focus on strengthen channel structure
and improve its efficiency in NA • Mobile: Strong momentum in LA; marketing investment in new product
launches • Data Center: Revenue continued its YTY growth helped by
time-to–market product capability bring customers win across segments