Shinkin International January 2013 Introduction and Analysis.

Copyright(C)2018 J TRUST Co., Ltd. All Rights Reserved. 1
IMPORTANT INFORMATION This document is meant to provide information about J Trust and is not intended to solicit investments
in securities issued by the company.
J Trust shall not be held liable for any damages or losses of profit resulting from the use of information and estimations contained within this document.
The J Trust Group has adopted the International Financial Reporting Standards (IFRS) since the fiscal year ended March 31st, 2018.
The opinions and estimations listed within this document are based on company data available at the time when the document was written and may contain underlying risks or uncertainties. Please understand that actual performance and future outlook are subject to change depending upon factors such as changes to the business environment.
This English-translated document was prepared solely for the convenience of English-speaking investors. If any discrepancies exist, the original Japanese version always prevails. J Trust shall not be liable for any damages or losses arising from this translation.
For all inquiries, please contact:J Trust Co., Ltd.
Corporate Planning Department, PR & IR DivisionTEL (03) 4330-9100
URL:https://www.jt-corp.co.jp/
Q2/6M FY03/2019FINANCIAL SUPPLEMENT
November 13th, 2018
J Trust Co., Ltd.
Copyright(C)2018 J TRUST Co., Ltd. All Rights Reserved.
1. Changes in Key Management Indices2. Consolidated Financial Results for FY03/2019
1) YOY Comparison of Consolidated Financial Results (Total)2) YOY Comparison of Operating Revenue and Profit (Consolidated and Total) by Segment
3. Progress in FY03/20194. Data Book
1) Summary(Consolidated Statement of Financial Position, Consolidated Statement of Profit or Loss)
2) Financial Business in Japan(Statement of Financial Position, Statement of Profit or Loss)
• Nihon Hoshou• Partir Servicer• J TRUST Card
3) Financial Business in South Korea and Mongolia (Statement of Financial Position, Statement of Profit or Loss) • JT Chinae Savings Bank• JT Savings Bank• JT Capital• TA Asset Management
4) Financial Business in Southeast Asia(Statement of Financial Position, Statement of Profit or Loss)
• Bank J Trust Indonesia• J Trust Investments Indonesia
5) Investment Business(Statement of Financial Position, Statement of Profit or Loss)
• JTrust Asia6) Other Non-Financial Business
(Statement of Profit or Loss )• Keynote
【 References】Overseas Subsidiaries (in local currency)(Statement of Financial Position, Statement of Profit or Loss)1) JT Chinae Savings Bank2) JT Savings Bank3) JT Capital4) TA Asset Management5) Bank J Trust Indonesia6) J Trust Investments Indonesia7) JTrust Asia
2
TABLE OF CONTENTS

Copyright(C)2018 J TRUST Co., Ltd. All Rights Reserved. 3
1. Changes in Key Management Indices
FY03/2016J-GAAP
FY03/2017IFRS※1※2
FY03/2018IFRS※2
Q2 FY03/2019IFRS※3
Operating revenue 75,478 66,453 76,266 36,575Operating expenses 38,957 38,116 50,224 23,507Gross operating profit 36,521 28,336 26,042 13,068SG&A expenses 40,635 26,431 25,493 13,135Other revenue - 1,254 2,258 247Other expenses - 2,552 451 154Operating profit (loss) -4,114 606 2,355 25Non-operating revenue 652 - - -Non-operating expenses 1,216 - - -Financial revenue - 282 47 1,173Financial expenses - 1,320 1,974 27Income from Equity Method Investments - -2 -12 -10
Ordinary income/loss -4,678 - - -Extraordinary income 1,753 - - -Extraordinary loss 2,676 - - -Profit (loss) before income taxes※4 -5,602 -433 416 1,160
Profit (loss) attributable to owners of parent※4 -5,712 -1,270 -731 -2,182
Operating profit ratio -5.45% 0.91% 3.09% 0.07%ROA※5 -1.09% -0.23% -0.11% -0.65%ROE※6 -3.25% -0.83% -0.50% -3.16%
September 30th, 2018
Mark cap (Millions of JPY) 77,728
Shares outstanding 112,649,910 Share price (JPY) 690
(Unit: 1 million JPY)
Q2 FY03/2019 (July - September) Key Initiatives of J Trust Group (includes ongoing initiatives)
(ⅰ) Developments in Japan(Nihon Hoshou)・ In July 2018, Nihon Hoshou signed a business agreement for loan guarantees with The Shonan Shinkin Bank.Starting on July 2nd, 2018, NH began loan guarantees for property-backed loans (the Reverse Mortgage “Security Life” Keikyu Collaboration Plan)⇒ Based on a business agreement signed in March 2018 with The Shonan Shinkin Bank and Keihin Electric Express Railway Co. which isintended to stimulate the local economy along the Keikyu railway line. ・ Gradually expanded the area in which the company guarantees overseas property-backed loans for The SAIKYO BANK, LTD.
(KeyHolder)・Live Entertainment BusinessIn July 2018, J Trust Group (“the Group”) established a joint venture called FA Project, Inc. with Mr. Yasushi Akimoto, Mr. Nobuyuki Akimoto, Mr. Yoshihiro Akatsuka, Y&N Brothers Inc. and A.M. Entertainment, Inc.
・TV Program Production BusinessIn May 2018, the Group signed an absorption-type split agreement to take over BIGFACE`s TV program production business and completed the succession on July 1st, 2018.
(Highlights Entertainment)・In September 2018, the Group decided to divest its shares as well as receivables with the objective of centralizing its business. The divestment was completed on October 1st.
(ⅱ) Development overseas・In April 2018, the J Trust Group decided to acquire shares of Indonesian multi-financing company PT OLYMPINDO MULTI FINANCE ( “OMF”, which changed its name on October 8th to PT JTRUST OLYMPINDO MULTI FINANCE) as well as third-party allotment of new
shares. The agreement was completed, and on October 4th the company acquired 60% of OMF`s issued shares. With this acquisition, J Trust has now built a three-pronged business segment consisting of banking, receivables collection and finance companies and has established a system which allows the Group to answer to a variety of needs over a wide area. PT JTRUST OLYMPINDO MULTI FINANCE will actively work on handling new financial products like financing for farm equipment and multi-financing. From here on, the company will work on expanding the size and scope of its financial business.
Financial Business in Japan 13%
Financial Business in Southeast
Asia17%
Non-Financial Business
15%
Operating revenue distributionQ2 FY03/2019 (Total)
Financial Business in South Korea and
Mongolia55%
※ 1 FY03/2017 figures are reclassified based on IFRS.※ 2 Figures showing revenue before taxes do not include discontinued operations (ADORES, Inc.)※ 3 Figures for Profit (loss) before income taxes do not include figures from discontinued operations (Highlights
Entertainment).※ 4 Titles under J-GAAP are “Profit (loss) before revenue tax” and “Profit (loss) attributable to owners of parent”.※ 5 ROA(Annualized) = Profit attributable to owner`s of parent ÷ Total assets(%)
※Note: Total assets = (Beginning assets + Ending assets) ÷ 2※ 6 ROE(Annualized) = Profit attributable to owners of parent ÷ Equity attributable to owners of parent (%)
※Note: Equity attributable to owners of parent = (Beginning assets + Ending assets) ÷ 2

Copyright(C)2018 J TRUST Co., Ltd. All Rights Reserved.
2. Consolidated Financial Results for FY03/20191) Comparison of Consolidated Financial Results with FY03/2018
Q2 FY03/2018(Total)
Q2 FY03/2019 (Total) Difference % Main factors behind difference
Result (%) Result (%)
Operating revenue 34,645 100.0 36,575 100.0 1,930 5.6
+
・In South Korea, interest revenue increased because of the increases mainly in loans in J Trust’s banking business and JT Capital.・In servicer business, book value adjustment gains and losses included in Interest revenue increased by changing the accounting method for revenue from the purchase of receivables. ⇒See Pg. 22
-・At J Trust Bank Indonesia, interest revenue decreased due to a decrease of loans in the banking business.・At JTrust Asia, interest revenue on securities decreased.
Operating expenses 18,698 54.0 23,507 64.3 4,809 25.7 +
・At savings banks in Korea, interest costs increased together with an increase of deposits in the banking business.・At J Trust`s savings banks in Korea and Bank J Trust Indonesia, credit costs increased in conjunction with the adoption of IFRS 9 starting in FY03/2019.
SG&A expenses 11,872 34.3 13,135 35.9 1,263 10.6 +・At J Trust, professional fees increased through an increase in M&A. ・At JTrust Asia, professional fees increased due to an increase in litigation against Group Lease.
Other revenue and expenses 527 1.5 92 0.3 -434 -82.5
Operating profit (loss) 4,602 13.3 25 0.1 -4,577 -99.4
Financial revenue and expenses -552 -1.6 1,145 3.1 1,698 -
+
・Although the Group recorded a foreign exchange loss due to depreciation of the U.S. dollar against the Singapore dollar mainly at JTrust Asia last year, this year it recorded a foreign exchange surplus of 1,156 million JPY due to a surging U.S. dollar.
Profit (loss) from Equity Investment Method
-0 -0.0 -10 -0.0 -9 -
Profit (loss) before income taxes 4,049 11.7 1,160 3.2 -2,889 -71.3
Income tax 1,236 3.6 739 2.0 -497 -40.2
Profit (loss) from continued operations
2,812 8.1 421 1.2 -2,391 -85.0
Profit (loss) from discontinued operations
-490 - -2,787 - -2,297 -
・The losses attributable to the discontinued operations were reported in conjunction with the Group’s decision to withdraw from the development, production and sale of amusement machines.
Non-controlling interests 53 - -183 - -236 -
Profit (loss) attributable to owner of parent
2,269 - -2,182 - -4,452 -
4
(Unit: 1 million JPY )IFRS
Copyright(C)2018 J TRUST Co., Ltd. All Rights Reserved.
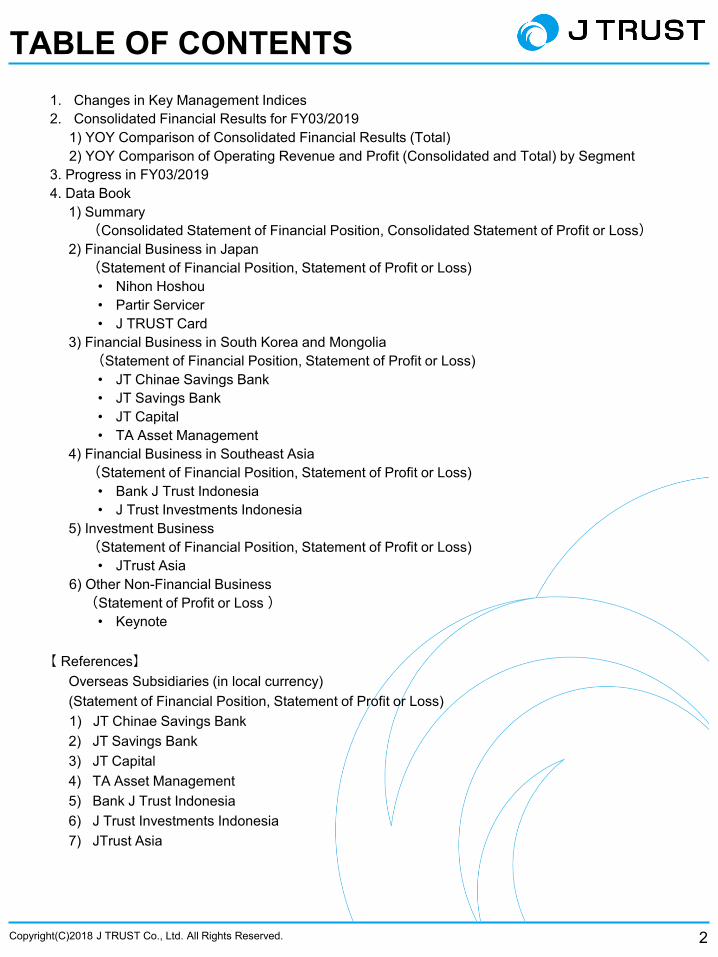
2. Consolidated Financial Results for FY03/2019
Q2 FY03/2018(Total)
Q2 FY03/2019(Total)
DifferenceDifference
(%) Main causes of difference
Financial Business in Japan
Operating revenue 4,982 4,905 -76 -1.5
・ Interest revenue losses were covered by guarantee fee revenue, so revenue remained nearly unchanged from Q2 FY03/2018
Operating profit 2,488 2,151 -337 -13.6
・ Operating expenses increased as a result of an increase in credit costs by reviewing future cash flows of purchased receivables.
FinancialBusiness inKorea andMongolia
Operating revenue 17,439 20,248 2,808 16.1
・ Interest revenue increased along with a steady increase in operating loans at J Trust’s credit card business and an increase in mainly corporate loans at its savings bank.・ In servicer business, book value adjustment gains and losses included in Interest revenue increased by changing the accounting method for revenue from purchase of receivables. ⇒See Pg. 22
Operating profit 2,449 2,400 -48 -2.0
・ Interest expenses increased at J Trust’s savings banks along with an increase in banking deposits. ・ Credit costs increased along with adoption of IFRS 9 starting in FY03/2019. ⇒ See Pgs. 16 and 18
Financial Business in Southeast Asia
Operating revenue 7,290 6,261 -1,028 -14.1
・ At J Trust Bank Indonesia, interest revenue decreased due to a decrease of loans in banking business.・Whereas a surplus of sales of seized assets was recorded at J Trust Bank Indonesia in Q2 FY03/2018, this year there was a decrease.
Operating profit -256 -2,418 -2,162 -
・ Decrease in operating revenue
・ At J Trust Bank Indonesia, operating expenses increased due to an increase in credit costs in response to lower credit ratings on loans, along with adoption of IFRS 9 starting in FY03/2019 ⇒ See Pg. 24
General entertainment business
Operating revenue
- 547 547 - ・ Along with the decision to divest stocks and sell the receivables of Highlights Entertainment, all results from previous year were classified as discontinued operations. Operating
profit - 3 3 -
Real estate business
Operating revenue 2,789 2,567 -222 -8.0 ・ Operating revenue and profit both decreased due to a
rise in construction personnel expenses in addition to the cost of purchasing land and poor sales of detached residences.Operating
profit 149 41 -108 -72.4
Investment business
Operating revenue 1,309 655 -653 -49.9 ・ At JTrust Asia, interest revenue on securities
decreased. ⇒ See Pg. 28
Operating profit 1,073 -291 -1,364 -
・ SG&A expenses increased due to an increase in litigation against Group Lease.
Other business
Operating revenue 1,263 1,726 462 36.6 ・ Operating revenue and profit both increased in
Keynote`s commercial facility construction division due to strong sales from orders for event halls and food & drink establishments.
Operating profit 46 49 2 5.7
Consolidated
Operating revenue 34,645 36,575 1,930 5.6
Operating profit 4,602 25 -4,577 -99.4
5
(Unit: 1 million JPY)
※1 Indicates total amount that resulted from continued business only.
IFRS2) YOY Comparison of operating revenue and profit by segment
Copyright(C)2018 J TRUST Co., Ltd. All Rights Reserved. 6
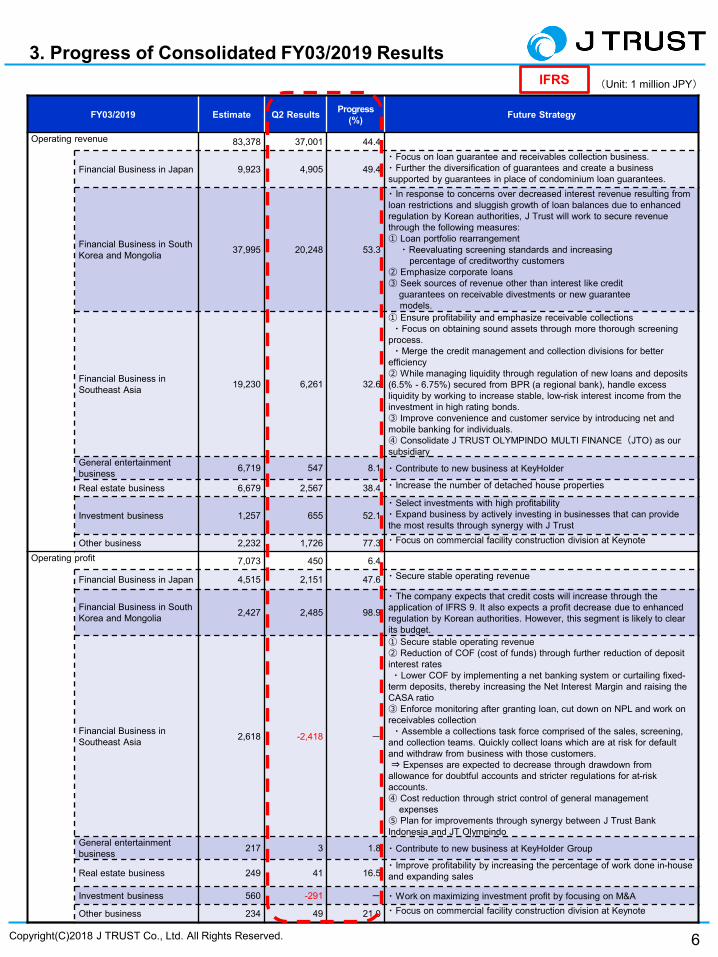
FY03/2019 Estimate Q2 Results Progress(%) Future Strategy
Operating revenue 83,378 37,001 44.4
Financial Business in Japan 9,923 4,905 49.4・ Focus on loan guarantee and receivables collection business. ・ Further the diversification of guarantees and create a business supported by guarantees in place of condominium loan guarantees.
Financial Business in South Korea and Mongolia 37,995 20,248 53.3
・ In response to concerns over decreased interest revenue resulting fromloan restrictions and sluggish growth of loan balances due to enhanced regulation by Korean authorities, J Trust will work to secure revenue through the following measures:① Loan portfolio rearrangement
・ Reevaluating screening standards and increasing percentage of creditworthy customers
② Emphasize corporate loans③ Seek sources of revenue other than interest like credit
guarantees on receivable divestments or new guaranteemodels.
Financial Business in Southeast Asia 19,230 6,261 32.6
① Ensure profitability and emphasize receivable collections・ Focus on obtaining sound assets through more thorough screening
process. ・ Merge the credit management and collection divisions for better
efficiency ② While managing liquidity through regulation of new loans and deposits (6.5% - 6.75%) secured from BPR (a regional bank), handle excess liquidity by working to increase stable, low-risk interest income from the investment in high rating bonds. ③ Improve convenience and customer service by introducing net and mobile banking for individuals. ④ Consolidate J TRUST OLYMPINDO MULTI FINANCE(JTO) as our subsidiary
General entertainment business 6,719 547 8.1 ・ Contribute to new business at KeyHolder
Real estate business 6,679 2,567 38.4 ・ Increase the number of detached house properties
Investment business 1,257 655 52.1・ Select investments with high profitability・ Expand business by actively investing in businesses that can provide the most results through synergy with J Trust
Other business 2,232 1,726 77.3 ・ Focus on commercial facility construction division at Keynote
Operating profit 7,073 450 6.4
Financial Business in Japan 4,515 2,151 47.6 ・ Secure stable operating revenue
Financial Business in South Korea and Mongolia 2,427 2,485 98.9
・ The company expects that credit costs will increase through the application of IFRS 9. It also expects a profit decrease due to enhanced regulation by Korean authorities. However, this segment is likely to clear its budget.
Financial Business in Southeast Asia 2,618 -2,418 -
① Secure stable operating revenue② Reduction of COF (cost of funds) through further reduction of deposit interest rates ・ Lower COF by implementing a net banking system or curtailing fixed-
term deposits, thereby increasing the Net Interest Margin and raising the CASA ratio ③ Enforce monitoring after granting loan, cut down on NPL and work on receivables collection・ Assemble a collections task force comprised of the sales, screening,
and collection teams. Quickly collect loans which are at risk for default and withdraw from business with those customers.⇒ Expenses are expected to decrease through drawdown from
allowance for doubtful accounts and stricter regulations for at-risk accounts.④ Cost reduction through strict control of general management
expenses⑤ Plan for improvements through synergy between J Trust Bank Indonesia and JT Olympindo
General entertainment business 217 3 1.8 ・ Contribute to new business at KeyHolder Group
Real estate business 249 41 16.5・ Improve profitability by increasing the percentage of work done in-house and expanding sales
Investment business 560 -291 - ・ Work on maximizing investment profit by focusing on M&A
Other business 234 49 21.0 ・ Focus on commercial facility construction division at Keynote
(Unit: 1 million JPY)
3. Progress of Consolidated FY03/2019 ResultsIFRS

Copyright(C)2018 J TRUST Co., Ltd. All Rights Reserved. 7
FY03/2019 Ended2018/03
Compared to 2018/032018/06 2018/09 2018/12 2019/03 Difference Difference
in %AssetsCash and cash equivalents 82,683 75,485 84,723 -9,238 -10.9%
(a)Loan balance 435,459 457,712 423,786 33,926 8.0%Accounts receivable-operating loans 63,406 67,037 63,485 3,551 5.6%Loans by banking business 368,844 386,884 357,779 29,104 8.1%Advances paid-installment 2,437 2,524 2,274 250 11.0%Finance lease receivables 771 1,266 246 1,019 413.7%
Purchased receivables 16,571 20,026 16,332 3,693 22.6%Other accounts receivable 16,372 19,061 15,188 3,872 25.5%
Operational investment securities 2,132 3,234 3,242 -7 -0.2%
Securities 37,915 43,075 37,367 5,707 15.3%
Other financial assets 56,737 57,894 52,331 5,562 10.6%
Allowance for doubtful accounts -30,741 -32,881 -25,214 -7,666 -
Assets held for sale 2,282 3,150 1,807 1,342 74.3%
Tangible assets 3,019 2,687 3,028 -340 -11.3%
Investment properties 609 608 610 -2 -0.4%
Goodwill 29,474 29,980 29,578 401 1.4%
Intangible assets 2,888 2,960 3,087 -127 -4.1%
Other assets 12,304 12,070 11,089 981 8.8%
Total assets 667,708 695,065 656,961 38,104 5.8%
LiabilitiesDeposits 416,507 432,618 403,509 29,109 7.2%
Total interest-bearing liabilities 80,860 87,653 78,727 8,925 11.3%Loans 48,747 54,484 45,906 8,578 18.7%Bonds 32,113 33,169 32,821 347 1.1%
Other liabilities 25,914 30,668 23,947 6,721 28.1%
Total liabilities 523,282 550,941 506,184 44,756 8.8%
EquityAttributable to owners of parent 138,314 138,052 144,366 -6,314 -4.4%Non-controlling interests 6,111 6,072 6,409 -337 -5.3%
Total equity 144,426 144,124 150,776 -6,651 -4.4%
Total liabilities and equity 667,708 695,065 656,961 38,104 5.8%
(Size of guarantee)※1 163,702 176,897 145,718 31,179 21.4%
(b) Balance of NPL 23,951 25,943 22,821 3,122 13.7%(c) Allowance for doubtful accounts 30,741 32,881 25,214 7,666 30.4%
①Allowance for doubtful accounts 23,534 25,022 18,688 6,334 33.9%NPL ratio (gross) (b)÷(a) 5.5% 5.7% 5.4% 0.3% -
NPL ratio (net) ((b)-①)÷(a) 0.1% 0.2% 1.0% -0.8% -
②Allowance for doubtful accounts (Others) ※2 7,207 7,858 6,526 1,332 20.4%
Allowance for doubtful accounts and others
4. Data Book1) Summary: Statement of Financial Position (unaudited)
(Unit: 1 million JPY)
※2 Allowance for purchased receivables, subrogation receivables, membership rights, investments and other assets
(Unit: 1 million JPY)
※1 Includes size of guarantee in banking business
IFRS
Excel data available on our homepage at:https://www.jt-corp.co.jp/ir/library/ir_data_00/
Copyright(C)2018 J TRUST Co., Ltd. All Rights Reserved.
4. Data Book1) Summary
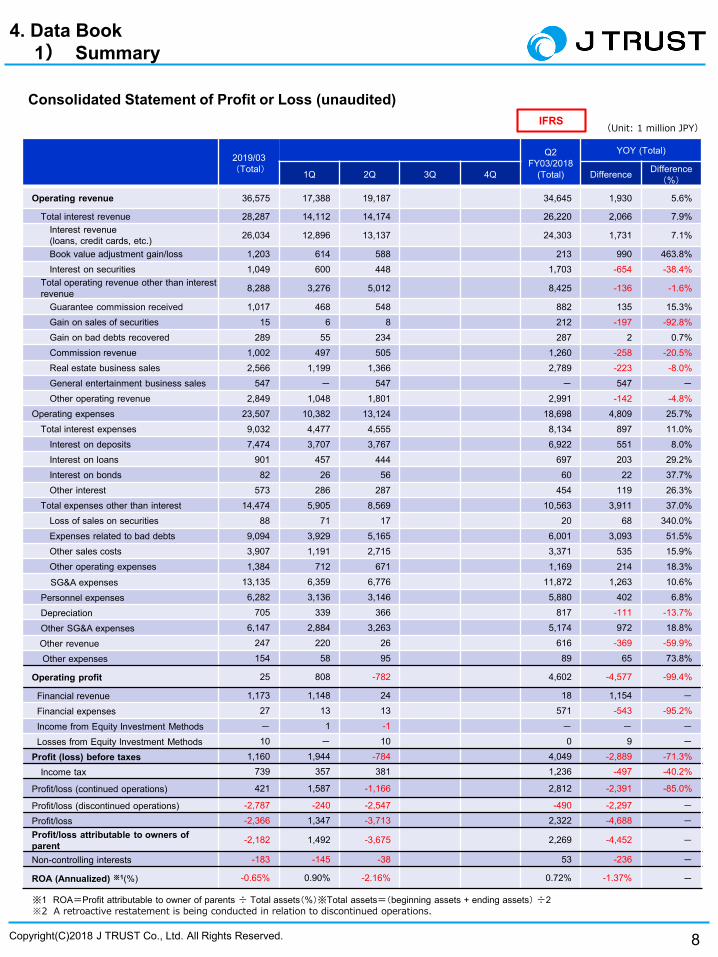
Consolidated Statement of Profit or Loss (unaudited)
8
2019/03(Total)
Q2 FY03/2018
(Total)
YOY (Total)
1Q 2Q 3Q 4Q Difference Difference(%)
Operating revenue 36,575 17,388 19,187 34,645 1,930 5.6%
Total interest revenue 28,287 14,112 14,174 26,220 2,066 7.9%Interest revenue(loans, credit cards, etc.) 26,034 12,896 13,137 24,303 1,731 7.1%
Book value adjustment gain/loss 1,203 614 588 213 990 463.8%Interest on securities 1,049 600 448 1,703 -654 -38.4%
Total operating revenue other than interest revenue 8,288 3,276 5,012 8,425 -136 -1.6%
Guarantee commission received 1,017 468 548 882 135 15.3%Gain on sales of securities 15 6 8 212 -197 -92.8%Gain on bad debts recovered 289 55 234 287 2 0.7%Commission revenue 1,002 497 505 1,260 -258 -20.5%Real estate business sales 2,566 1,199 1,366 2,789 -223 -8.0%General entertainment business sales 547 - 547 - 547 -
Other operating revenue 2,849 1,048 1,801 2,991 -142 -4.8%Operating expenses 23,507 10,382 13,124 18,698 4,809 25.7%
Total interest expenses 9,032 4,477 4,555 8,134 897 11.0%Interest on deposits 7,474 3,707 3,767 6,922 551 8.0%Interest on loans 901 457 444 697 203 29.2%Interest on bonds 82 26 56 60 22 37.7%Other interest 573 286 287 454 119 26.3%
Total expenses other than interest 14,474 5,905 8,569 10,563 3,911 37.0%Loss of sales on securities 88 71 17 20 68 340.0%Expenses related to bad debts 9,094 3,929 5,165 6,001 3,093 51.5%Other sales costs 3,907 1,191 2,715 3,371 535 15.9%Other operating expenses 1,384 712 671 1,169 214 18.3%SG&A expenses 13,135 6,359 6,776 11,872 1,263 10.6%
Personnel expenses 6,282 3,136 3,146 5,880 402 6.8%Depreciation 705 339 366 817 -111 -13.7%Other SG&A expenses 6,147 2,884 3,263 5,174 972 18.8%Other revenue 247 220 26 616 -369 -59.9%Other expenses 154 58 95 89 65 73.8%
Operating profit 25 808 -782 4,602 -4,577 -99.4%
Financial revenue 1,173 1,148 24 18 1,154 -
Financial expenses 27 13 13 571 -543 -95.2%Income from Equity Investment Methods - 1 -1 - - -
Losses from Equity Investment Methods 10 - 10 0 9 -
Profit (loss) before taxes 1,160 1,944 -784 4,049 -2,889 -71.3%Income tax 739 357 381 1,236 -497 -40.2%
Profit/loss (continued operations) 421 1,587 -1,166 2,812 -2,391 -85.0%
Profit/loss (discontinued operations) -2,787 -240 -2,547 -490 -2,297 -
Profit/loss -2,366 1,347 -3,713 2,322 -4,688 -
Profit/loss attributable to owners of parent -2,182 1,492 -3,675 2,269 -4,452 -
Non-controlling interests -183 -145 -38 53 -236 -
ROA (Annualized) ※1(%) -0.65% 0.90% -2.16% 0.72% -1.37% -
(Unit: 1 million JPY)IFRS
※1 ROA=Profit attributable to owner of parents ÷ Total assets(%)※Total assets=(beginning assets + ending assets) ÷2※2 A retroactive restatement is being conducted in relation to discontinued operations.

Copyright(C)2018 J TRUST Co., Ltd. All Rights Reserved. 9
FY03/2019 Ended Compared to 2018/03
2018/06 2018/09 2018/12 2019/03 2018/03 Difference Differencein %
AssetsCash and cash equivalents 5,738 6,247 7,106 -858 -12.1%(a)Loan balance 2,378 2,203 2,504 -300 -12.0%
Operating loans 2,378 2,203 2,504 -300 -12.0%Loans by banking business - - - - -
Advances paid - installment - - - - -
Finance lease receivables - - - - -
Purchased receivables 11,688 14,764 11,370 3,393 29.9%Other accounts receivables 11,707 13,240 10,875 2,364 21.7%Operational investment securities - - - - -
Securities 67 67 67 - -
Other financial assets 1,623 1,586 1,598 -11 -0.7%
Allowance for doubtful accounts -851 -963 -611 -351 -
Assets held for sale - - - - -
Tangible assets 57 75 60 15 24.9%Investment properties 76 76 76 -0 -0.4%Goodwill 126 126 126 - -
Intangible assets 111 105 109 -3 -3.2%Other assets 839 843 843 0 0.0%
Total assets 33,564 38,373 34,126 4,247 12.5%
LiabilitiesDeposits - - - - -
Total interest-bearing liabilities 5,813 8,605 6,226 2,378 38.2%Loans 5,543 8,365 5,956 2,408 40.4%Bonds 270 240 270 -30 -11.1%
Other liabilities 10,998 11,994 10,030 1,964 19.6%Total liabilities 16,812 20,599 16,256 4,343 26.7%Equity
Attributable to owners of parent 16,752 17,773 17,869 -95 -0.5%Non-controlling interests - - - - -
Total equity 16,752 17,773 17,869 -95 -0.5%Total liabilities and equity 33,564 38,373 34,126 4,247 12.5%
(Size of guarantee)※1 159,757 173,325 141,881 31,443 22.2%
(b) Balance of NPL 366 337 366 -28 -7.9%(c) Allowance for doubtful accounts 851 963 611 351 57.5%
①Allowance for doubtful accounts 96 84 108 -24 -22.2%NPL ratio (gross) (b)÷(a) 15.4% 15.3% 14.6% 0.7% -
NPL ratio (net)((b)-①)÷(a) 11.3% 11.5% 10.3% 1.2% -
②Allowance for doubtful accounts(others) ※2 754 878 503 375 74.6%
Allowance for doubtful accounts and others
4. Data Book2) Financial Business in Japan
Nihon Hoshou Statement on Financial Position (unaudited)
(Unit: 1 million JPY)
※2 Allowance for purchased receivables, subrogation receivables, membership rights, investments and other assets
(Unit: 1 million JPY)
※1 Includes size of guarantees in banking business
IFRS

Copyright(C)2018 J TRUST Co., Ltd. All Rights Reserved.
4. Data Book2) Financial Business in Japan
Nihon Hoshou Statement of Profit or Loss (unaudited)
10
03/2019(Total)
Q2FY03/2018
(Total)
YOY (Total)
1Q 2Q 3Q 4Q Difference Differencein %
Operating revenue 4,325 2,066 2,258 4,403 -78 -1.8%
Total interest revenue 3,038 1,439 1,599 3,104 -66 -2.1%Interest revenue (loans, credit cards, etc.) 2,447 1,223 1,224 2,556 -109 -4.3%
Book value adjustment gain/loss 590 216 374 548 42 7.8%
Interest on securities - - - - - -
Total operating revenue other than interest revenue 1,286 627 659 1,299 -12 -0.9%
Guarantee commission received 997 468 529 850 147 17.3%
Gain on sales of securities - - - - - -
Gain on bad debts recovered 17 5 11 21 -4 -21.3%
Commission revenue 209 115 94 182 26 14.6%
Real estate business sales - - - - - -
General entertainment business sales - - - - - -
Other operating revenue 62 37 25 244 -181 -74.3%
Operating expenses 601 347 254 481 120 25.0%
Total interest expenses 62 31 31 73 -11 -15.3%
Interest on deposits - - - - - -
Interest on loans 48 25 23 59 -11 -18.5%
Interest on bonds - - - - - -
Other interest 13 6 7 13 -0 -1.5%
Total expenses other than interest 539 315 223 407 131 32.3%
Loss of sales on securities - - - - - -
Expenses related to bad debts 457 277 179 269 187 69.6%
Other sales costs - - - 87 -87 -100.0%
Other operating expenses 81 38 43 50 30 60.7%
SG&A expenses 1,459 697 762 1,381 77 5.6%
Personnel expenses 511 255 256 521 -9 -1.8%
Depreciation 20 10 10 18 1 7.6%
Other SG&A expenses 927 431 495 841 85 10.1%
Other revenue 27 13 14 21 5 25.0%
Other expenses 0 0 0 3 -2 -74.2%
Operating profit 2,290 1,034 1,255 2,558 -267 -10.5%
Financial revenue 33 30 3 15 18 124.3%
Financial expenses 2 1 1 2 0 12.9%
Income from Equity Investment Methods - - - - - -
Losses from Equity Investment Methods - - - - - -
Profit (loss) before taxes 2,321 1,064 1,257 2,571 -249 -9.7%
Income tax 436 199 236 501 -65 -13.0%
Profit (loss) 1,885 864 1,021 2,070 -184 -8.9%
ROA(Annualized)※1(%) 10.40% 10.21% 11.36% 12.69% -2.29% -
(Unit: 1 million JPY)IFRS
※1 ROA=Profit attributable to owner of parents ÷ Total assets(%)※Total assets=(beginning assets + ending assets) ÷2

Copyright(C)2018 J TRUST Co., Ltd. All Rights Reserved. 11
FY03/2019 Ended2018/03
Compared to 2018/03
2018/06 2018/09 2018/12 2019/03 Difference Difference in %
AssetsCash and cash equivalents 695 653 635 17 2.8%(a)Loan balance - - - - -
Operating loans - - - - -
Loans by banking business - - - - -
Advances paid - installment - - - - -
Finance lease receivables - - - - -
Purchased receivables 1,347 1,313 1,399 -85 -6.1%Other accounts receivables - - - - -
Operational investment securities - - - - -
Securities - - - - -
Other financial assets 214 240 230 10 4.5%Allowance for doubtful accounts -62 -89 - -89 -
Assets held for sale - - - - -
Tangible assets 38 35 26 8 31.8%Investment properties - - - - -
Goodwill - - - - -
Intangible assets 49 41 56 -14 -26.1%Other assets 32 28 33 -4 -14.7%
Total assets 2,315 2,224 2,382 -157 -6.6%
LiabilitiesDeposits - - - - -
Total interest-bearing liabilities 567 529 606 -76 -12.7%Loans 567 529 606 -76 -12.7%Bonds - - - - -
Other liabilities 668 650 649 1 0.2%Total liabilities 1,236 1,180 1,255 -75 -6.0%Equity
Attributable to owners of parent 1,078 1,044 1,126 -82 -7.3%Non-controlling interests - - - - -
Total equity 1,078 1,044 1,126 -82 -7.3%Total liabilities and equity 2,315 2,224 2,382 -157 -6.6%
(Size of guarantees)※1 - - - - -
(b) Balance of NPL - - - - - - -
(c) Allowance for doubtful accounts 62 89 - 89 -
①Allowance for doubtful accounts - - - - -
NPL ratio (gross) (b)÷(a) - - - - -
NPL ratio (net)((b) - ①)÷(a) - - - - -
②Allowance for doubtful accounts(others) ※2 62 89 - 89 -
Allowance for doubtful accounts and others
4. Data Book2) Financial Business in Japan
Partir Servicer Statement of Financial Position (unaudited)
(Unit: 1 million JPY)
※2 Allowance for purchased receivables, subrogation receivables, membership rights, investments and other assets
(Unit: 1 million JPY)
※1 Includes size of guarantees in banking business
IFRS
Copyright(C)2018 J TRUST Co., Ltd. All Rights Reserved.
4. Data Book2) Financial Business in Japan
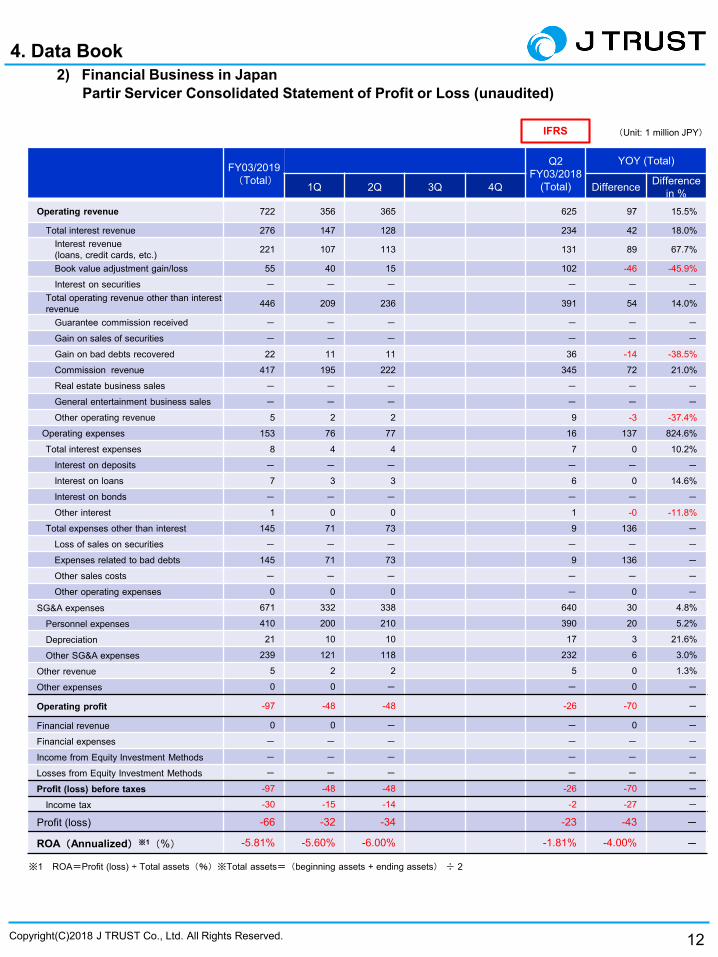
Partir Servicer Consolidated Statement of Profit or Loss (unaudited)
12
FY03/2019(Total)
Q2 FY03/2018
(Total)
YOY (Total)
1Q 2Q 3Q 4Q Difference Differencein %
Operating revenue 722 356 365 625 97 15.5%
Total interest revenue 276 147 128 234 42 18.0%Interest revenue (loans, credit cards, etc.) 221 107 113 131 89 67.7%
Book value adjustment gain/loss 55 40 15 102 -46 -45.9%
Interest on securities - - - - - -
Total operating revenue other than interest revenue 446 209 236 391 54 14.0%
Guarantee commission received - - - - - -
Gain on sales of securities - - - - - -
Gain on bad debts recovered 22 11 11 36 -14 -38.5%
Commission revenue 417 195 222 345 72 21.0%
Real estate business sales - - - - - -
General entertainment business sales - - - - - -
Other operating revenue 5 2 2 9 -3 -37.4%
Operating expenses 153 76 77 16 137 824.6%
Total interest expenses 8 4 4 7 0 10.2%
Interest on deposits - - - - - -
Interest on loans 7 3 3 6 0 14.6%
Interest on bonds - - - - - -
Other interest 1 0 0 1 -0 -11.8%
Total expenses other than interest 145 71 73 9 136 -
Loss of sales on securities - - - - - -
Expenses related to bad debts 145 71 73 9 136 -
Other sales costs - - - - - -
Other operating expenses 0 0 0 - 0 -
SG&A expenses 671 332 338 640 30 4.8%
Personnel expenses 410 200 210 390 20 5.2%
Depreciation 21 10 10 17 3 21.6%
Other SG&A expenses 239 121 118 232 6 3.0%
Other revenue 5 2 2 5 0 1.3%
Other expenses 0 0 - - 0 -
Operating profit -97 -48 -48 -26 -70 -
Financial revenue 0 0 - - 0 -
Financial expenses - - - - - -
Income from Equity Investment Methods - - - - - -
Losses from Equity Investment Methods - - - - - -
Profit (loss) before taxes -97 -48 -48 -26 -70 -
Income tax -30 -15 -14 -2 -27 -
Profit (loss) -66 -32 -34 -23 -43 -
ROA(Annualized)※1(%) -5.81% -5.60% -6.00% -1.81% -4.00% -
(Unit: 1 million JPY)IFRS
※1 ROA=Profit (loss) ÷ Total assets(%)※Total assets=(beginning assets + ending assets) ÷ 2

Copyright(C)2018 J TRUST Co., Ltd. All Rights Reserved. 13
FY03/2019 Ended Compared to 2018/03
2018/06 2018/09 2018/12 2019/03 2018/03 Difference Differencein %
AssetsCash and cash equivalents 296 426 484 -57 -12.0%(a)Loan balance 2,444 2,530 2,283 246 10.8%
Operating loans 6 5 9 -3 -40.4%Loans by banking business - - - - -
Advances paid - installment 2,437 2,524 2,274 250 11.0%Finance lease receivables - - - - -
Purchased receivables - - - - -
Other accounts receivables - - - - -
Operational investment securities - - - - -
Securities - - - - -
Other financial assets 134 133 141 -7 -5.0%Allowance for doubtful accounts -31 -25 -37 11 -
Assets held for sale - - - -
Tangible assets 44 45 45 0 0.2%Investment properties - - - - -
Goodwill - - - - -
Intangible assets 28 25 31 -5 -17.1%Other assets 15,000 14,999 15,015 -16 -0.1%
Total assets 17,916 18,135 17,963 171 1.0%
LiabilitiesDeposits - - - - -
Total interest-bearing liabilities 1,363 1,559 1,449 110 7.6%Loans 1,363 1,559 1,449 110 7.6%Bonds - - - - -
Other liabilities 443 457 414 42 10.4%Total liabilities 1,806 2,017 1,863 153 8.2%
Equity -
Attributable to owners of parent 16,110 16,118 16,100 18 0.1%Non-controlling interests - - - - -
Total equity 16,110 16,118 16,100 18 0.1%Total liabilities and equity 17,916 18,135 17,963 171 1.0%
(Size of guarantees)※1 - - - - -
(b) Balance of NPL 0 0 0 -0 -50.8%(c) Allowance for doubtful accounts 31 25 37 -11 -31.8%
①Allowance for doubtful accounts 30 25 30 -5 -16.9%NPL ratio (gross) (b)÷(a) 0.0% 0.0% 0.0% -0.0% -
NPL ratio (net)((b) - ①)÷(a) 0.0% 0.0% 0.0% 0.0% -
②Allowance for doubtful accounts (others) ※2 0 0 7 -6 -92.0%
Allowance for doubtful accounts and others
4. Data Book2)Financial Business in Japan
J Trust Card Statement of Financial Position (unaudited)
(Unit: 1 million JPY)
※2 Allowance for purchased receivables, subrogation receivables, membership rights, investments and other assets
(Unit: 1 million JPY)
※1 Includes size of guarantees in banking business
IFRS

Copyright(C)2018 J TRUST Co., Ltd. All Rights Reserved.
4. Data Book2) Financial Business in Japan
J Trust Card Statement of Profit or Loss (unaudited)
14
FY03/2019(Total)
Q2 FY03/2018(Total)
YOY (Total)
1Q 2Q 3Q 4Q Difference Differencein %
Operating revenue 191 93 97 221 -29 -13.5%
Total interest revenue 6 3 2 18 -11 -65.7%Interest revenue (loans, credit cards, etc.) 6 3 2 18 -11 -65.7%
Book value adjustment gain/loss - - - - - -
Interest on securities - - - - - -
Total operating revenue other than interest revenue 185 90 95 203 -17 -8.8%
Guarantee commission received - - - - - -
Gain on sales of securities - - - - - -
Gain on bad debts recovered - - - - - -
Commission revenue 185 90 95 203 -17 -8.8%
Real estate business sales - - - - - -
General entertainment business sales - - - - - -
Other operating revenue 0 0 0 0 -0 -9.6%
Operating expenses 14 7 6 41 -26 -64.9%
Total interest expenses 13 6 6 20 -7 -38.0%
Interest on deposits - - - - - -
Interest on loans 13 6 6 20 -7 -38.0%
Interest on bonds - - - - - -
Other interest - - - - - -
Total expenses other than interest 1 1 0 20 -18 -92.8%
Loss of sales on securities - - - - - -
Expenses related to bad debts 0 1 -0 19 -18 -95.9%
Other sales costs - - - - - -
Other operating expenses 0 0 0 0 -0 -14.6%
SG&A expenses 159 77 81 148 10 7.1%
Personnel expenses 68 33 34 62 5 9.5%
Depreciation 6 3 3 6 0 2.4%
Other SG&A expenses 84 40 43 79 4 5.6%
Other revenue 2 2 0 1 0 51.6%
Other expenses 0 - 0 - 0 -
Operating profit 19 10 9 33 -13 -40.7%
Financial revenue - - - 0 -0 -100.0%
Financial expenses - - - - - -
Income from Equity Investment Methods - - - - - -
Losses from Equity Investment Methods - - - - - -
Profit (loss) before taxes 19 10 9 33 -13 -40.7%
Income tax 1 0 0 8 -6 -82.6%
Profit (loss) 18 10 8 24 -6 -26.5%
ROA(Annualized)※1(%) 0.20% 0.22% 0.18% 0.27% -0.07% -
(Unit: 1 million JPY)IFRS
※1 ROA=Profit/ loss ÷ Total assets(%)※Total assets=(beginning assets + ending assets) ÷ 2

Copyright(C)2018 J TRUST Co., Ltd. All Rights Reserved. 15
FY03/2019 Ended Compared to 2018/03
2018/06 2018/09 2018/12 2019/03 2018/03 Difference Difference in %
AssetsCash and cash equivalents 29,270 18,729 20,246 -1,517 -7.5%(a)Loan balance 183,471 195,320 175,445 19,875 11.3%
Operating loans - - - - -
Loans by banking business 183,471 195,320 175,445 19,875 11.3%Advances paid - installment - - - - -
Finance lease receivables - - - - -
Purchased receivables - - - - -
Other accounts receivables 1,417 1,419 1,336 82 6.2%Operational investment securities - - - - -
Securities 10,443 10,767 7,570 3,196 42.2%Other financial assets 10,876 12,606 10,821 1,785 16.5%
Allowance for doubtful accounts -10,435 -10,786 -8,568 -2,218 -
Assets held for sale - - - - -
Tangible assets 390 350 459 -109 -23.7%Investment properties - - - - -
Goodwill 929 962 940 22 2.4%Intangible assets 614 601 668 -66 -10.0%Other assets 45 85 67 18 27.2%
Total assets 227,024 230,056 208,988 21,068 10.1%
LiabilitiesDeposits 205,298 206,071 185,511 20,559 11.1%Total interest-bearing liabilities 1,976 2,046 1,998 48 2.4%
Loans - - - - -
Bonds 1,976 2,046 1,998 48 2.4%Other liabilities 4,386 5,640 5,144 495 9.6%
Total liabilities 211,661 213,757 192,654 21,103 11.0%Equity
Attributable to owners of parent 15,363 16,299 16,333 -34 -0.2%Non-controlling interests - - - - -
Total equity 15,363 16,299 16,333 -34 -0.2%Total liabilities and equity 227,024 230,056 208,988 21,068 10.1%
(Size of guarantees)※1 - - - - -
(b) Balance of NPL 11,046 11,266 10,935 331 3.0%(c) Allowance for doubtful accounts 10,435 10,786 8,568 2,218 25.9%
①Allowance for doubtful accounts 10,394 10,741 8,545 2,196 25.7%NPL ratio (gross) (b)÷(a) 6.0% 5.8% 6.2% -0.5% -
NPL ratio (net)((b) - ①)÷(a) 0.4% 0.3% 1.4% -1.1% -
②Allowance for doubtful accounts (Other) ※2 41 44 22 21 97.6%
Allowance for doubtful accounts and others
4. Data Book3) Financial Business in South Korea and Mongolia
JT Chinae Savings Bank Statement of Financial Position (unaudited)
(Unit: 1 million JPY)
※2 Allowance for purchased receivables, subrogation receivables, membership rights, investments and other assets
(Unit: 1 million JPY)
※1 Includes size of guarantees in banking business
IFRS
Copyright(C)2018 J TRUST Co., Ltd. All Rights Reserved.
4. Data Book3) Financial Business in South Korea and Mongolia
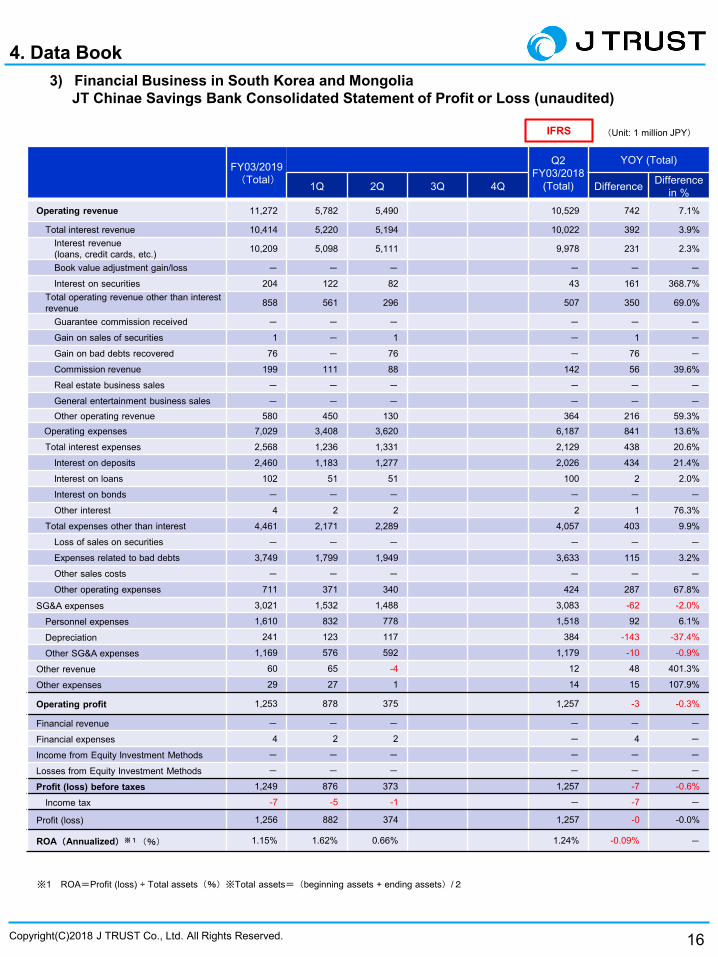
JT Chinae Savings Bank Consolidated Statement of Profit or Loss (unaudited)
16
FY03/2019(Total)
Q2FY03/2018
(Total)
YOY (Total)
1Q 2Q 3Q 4Q Difference Differencein %
Operating revenue 11,272 5,782 5,490 10,529 742 7.1%
Total interest revenue 10,414 5,220 5,194 10,022 392 3.9%Interest revenue (loans, credit cards, etc.) 10,209 5,098 5,111 9,978 231 2.3%
Book value adjustment gain/loss - - - - - -
Interest on securities 204 122 82 43 161 368.7%Total operating revenue other than interest revenue 858 561 296 507 350 69.0%
Guarantee commission received - - - - - -
Gain on sales of securities 1 - 1 - 1 -
Gain on bad debts recovered 76 - 76 - 76 -
Commission revenue 199 111 88 142 56 39.6%
Real estate business sales - - - - - -
General entertainment business sales - - - - - -
Other operating revenue 580 450 130 364 216 59.3%Operating expenses 7,029 3,408 3,620 6,187 841 13.6%
Total interest expenses 2,568 1,236 1,331 2,129 438 20.6%
Interest on deposits 2,460 1,183 1,277 2,026 434 21.4%
Interest on loans 102 51 51 100 2 2.0%
Interest on bonds - - - - - -
Other interest 4 2 2 2 1 76.3%
Total expenses other than interest 4,461 2,171 2,289 4,057 403 9.9%
Loss of sales on securities - - - - - -
Expenses related to bad debts 3,749 1,799 1,949 3,633 115 3.2%
Other sales costs - - - - - -
Other operating expenses 711 371 340 424 287 67.8%
SG&A expenses 3,021 1,532 1,488 3,083 -62 -2.0%
Personnel expenses 1,610 832 778 1,518 92 6.1%
Depreciation 241 123 117 384 -143 -37.4%
Other SG&A expenses 1,169 576 592 1,179 -10 -0.9%
Other revenue 60 65 -4 12 48 401.3%
Other expenses 29 27 1 14 15 107.9%
Operating profit 1,253 878 375 1,257 -3 -0.3%
Financial revenue - - - - - -
Financial expenses 4 2 2 - 4 -
Income from Equity Investment Methods - - - - - -
Losses from Equity Investment Methods - - - - - -
Profit (loss) before taxes 1,249 876 373 1,257 -7 -0.6%
Income tax -7 -5 -1 - -7 -
Profit (loss) 1,256 882 374 1,257 -0 -0.0%
ROA(Annualized)※1(%) 1.15% 1.62% 0.66% 1.24% -0.09% -
(Unit: 1 million JPY)IFRS
※1 ROA=Profit (loss) ÷ Total assets(%)※Total assets=(beginning assets + ending assets)/2

Copyright(C)2018 J TRUST Co., Ltd. All Rights Reserved. 17
FY03/2019 Ended Compared to 2018/03
2018/06 2018/09 2018/12 2019/03 2018/03 Difference Difference in %
AssetsCash and cash equivalents 7,422 12,524 12,366 158 1.3%(a)Loan balance 92,106 101,075 91,523 9,551 10.4%
Operating loans - - - - -
Loans by banking business 92,106 101,075 91,523 9,551 10.4%Advances paid - installment - - - - -
Finance lease receivables - - - - -
Purchased receivables - - - - -
Other accounts receivables 601 703 569 133 23.4%Operational investment securities - - - - -
Securities 6,046 7,434 2,648 4,785 180.7%Other financial assets 6,525 6,382 5,627 754 13.4%
Allowance for doubtful accounts -2,679 -3,077 -2,104 -973 -
Assets held for sale - - - - -
Tangible assets 138 143 146 -3 -2.1%Investment properties - - - - -
Goodwill - - - - -
Intangible assets 273 401 291 110 38.0%Other assets 44 22 87 -65 -74.9%
Total assets 110,480 125,610 111,157 14,453 13.0%
LiabilitiesDeposits 97,223 112,298 98,640 13,658 13.9%Total interest-bearing liabilities - - - - -
Loans - - - - -
Bonds - - - - -
Other liabilities 3,631 2,673 2,629 43 1.6%Total liabilities 100,854 114,971 101,270 13,701 13.5%Equity
Attributable to owners of parent 9,625 10,639 9,887 751 7.6%Non-controlling interests - - - - -
Total equity 9,625 10,639 9,887 751 7.6%Total liabilities and equity 110,480 125,610 111,157 14,453 13.0%
(Size of guarantees)※1 - - - - -
(b) Balance of NPL 2,682 3,149 2,949 199 6.8%(c) Allowance for doubtful accounts 2,679 3,077 2,104 973 46.2%
①Allowance for doubtful accounts 2,660 3,057 2,092 965 46.1%NPL ratio (gross) (b)÷(a) 2.9% 3.1% 3.2% -0.1% -
NPL ratio (net)((b)-①)÷(a) 0.0% 0.1% 0.9% -0.9% -
②Allowance for doubtful accounts(Others)※2 19 19 12 7 65.3%
Allowance for doubtful accounts and others
4. Data Book3) Financial Business in South Korea and Mongolia
JT Savings Bank Statement of Financial Position (unaudited)
(Unit: 1 million JPY)
※2 Allowance for purchased receivables, subrogation receivables, membership rights, investments and other assets
(Unit: 1 million JPY)
※1 Includes size of guarantees in banking business
IFRS

Copyright(C)2018 J TRUST Co., Ltd. All Rights Reserved.
4. Data Book3) Financial Business in South Korea and Mongolia
JT Savings Bank Consolidated Statement of Profit or Loss (unaudited)
18
FY03/2019(Total)
Q2 FY03/2018
(Total)
YOY (Total)
1Q 2Q 3Q 4Q Difference Difference in %
Operating revenue 4,992 2,417 2,574 3,420 1,571 45.9%
Total interest revenue 4,486 2,227 2,259 3,230 1,255 38.9%Interest revenue (loans, credit cards, etc.) 4,395 2,135 2,260 3,188 1,206 37.8%
Book value adjustment gain/loss - - - - - -
Interest on securities 90 91 -0 41 48 116.6%
Total profit other than interest 506 190 315 190 315 166.1%
Guarantee commission received - - - - - -
Gain on sale of securities 0 0 - 4 -4 -98.8%
Gain on bad debts recovered 45 - 45 - 45 -
Commission revenue 140 82 58 91 49 54.5%
Real estate business sales - - - - - -
General entertainment business sales - - - - - -
Other operating profit 319 108 211 94 224 236.6%
Operating expenses 2,939 1,366 1,573 1,593 1,345 84.4%
Total interest expenses 1,260 603 657 788 472 60.0%
Interest on deposits 1,259 602 656 787 471 59.9%
Interest on loans - - - - - -
Interest on liabilities - - - - - -
Other interest 1 0 0 0 0 91.7%
Total expenses other than interest 1,678 762 915 805 873 108.4%
Loss on sale of securities - - - - - -
Expenses related to bad debt 1,376 585 790 644 731 113.5%
Other sales costs - - - - - -
Other operating expenses 302 177 125 161 141 87.9%
SG&A expenses 1,248 646 602 1,108 140 12.7%
Personnel expenses 710 358 352 585 125 21.4%
Depreciation 52 26 26 43 8 20.3%
Other SG&A expenses 485 262 223 478 6 1.4%
Other revenue 4 2 1 6 -2 -40.5%
Other expenses 0 2 -2 4 -3 -92.0%
Operating profit 807 404 403 721 86 11.9%
Financial profit - - - - - -
Financial expenses 0 0 0 - 0 -
Profit from Equity Investment Method - - - - - -
Loss from Equity Investment Method - - - - - -
Profit (loss) before tax 807 404 403 721 85 11.9%
Income tax 177 88 88 158 18 12.0%
Profit (loss) 630 316 314 563 66 11.9%
ROA(Annualized)※1(%) 1.07% 1.14% 1.07% 1.31% -0.24% -
(Unit: 1 million JPY)IFRS
※1 ROA=Profit attributable to owners of parent ÷ total assets (%) Note: Total assets = (beginning assets + ending assets) ÷ 2

Copyright(C)2018 J TRUST Co., Ltd. All Rights Reserved. 19
Q2 FY03/2019 Ended Compared to 2018/032018/06 2018/09 2018/12 2019/03 2018/03 Difference Difference
in %Assets
Cash and cash equivalents 7,012 6,422 6,824 -402 -5.9%(a)Loan balance 55,182 59,679 55,262 4,417 8.0%
Operating loans 54,647 58,645 55,256 3,388 6.1%Loans by banking business - - - - -
Advances paid - installment - - - - -
Finance lease receivables 535 1,034 6 1,028 -
Purchased receivables - - - - -
Other accounts receivables 305 339 268 70 26.4%Operational investment securities - - - - -
Securities - 256 - 256 -
Other financial assets 2,081 2,165 2,113 52 2.5%Allowance for doubtful accounts -2,481 -2,841 -2,112 -728 -
Assets held for sale - - - - -
Tangible assets 203 192 221 -28 -12.8%Investment properties - - - - -
Goodwill - - - - -
Intangible assets 135 139 150 -10 -6.9%Other assets 458 487 471 15 3.4%
Total assets 62,897 66,841 63,199 3,642 5.8%
LiabilitiesDeposits - - - - -
Total interest-bearing liabilities 48,285 51,399 48,544 2,854 5.9%Loans 18,780 20,836 18,307 2,529 13.8%Bonds 29,504 30,563 30,237 325 1.1%
Other liabilities 663 987 436 551 126.2%Total liabilities 48,949 52,387 48,981 3,405 7.0%Equity
Attributable to owners of parent 13,948 14,454 14,218 236 1.7%Non-controlling interests - - - - -
Total equity 13,948 14,454 14,218 236 1.7%Total liabilities and equity 62,897 66,841 63,199 3,642 5.8%
(Size of guarantees)※1 33 29 21 7 35.2%
(b) Balance of NPL 4,145 4,727 3,887 839 21.6%(c) Allowance for doubtful accounts 2,481 2,841 2,112 728 34.5%
①Allowance for doubtful accounts 2,472 2,830 2,104 726 34.5%NPL ratio (gross) ((b)÷(a) 7.5% 7.9% 7.0% 0.9% -NPL ratio (net)((b) - ①)÷(a) 3.0% 3.2% 3.2% -0.1% -
②Allowance for doubtful accounts (Other)※2 9 10 7 2 37.2%
Allowance for doubtful accounts and others
4. Data Book3) Financial Business in South Korea and Mongolia
JT Capital Statement of Financial Position (unaudited)
(Unit: 1 million JPY)
※2 Allowance for purchased receivables, subrogation receivables, membership rights, investments and other assets
(Unit: 1 million JPY)
※1 Includes size of guarantees in banking business
IFRS

Copyright(C)2018 J TRUST Co., Ltd. All Rights Reserved.
4. Data Book3) Financial Business in South Korea and Mongolia
JT Capital Consolidated Statement of Profit or Loss (unaudited)
20
FY03/2019(Total)
Q2 FY03/2018
(Total)
YOY (Total)
1Q 2Q 3Q 4Q Difference Difference in %
Operating revenue 2,950 1,423 1,526 2,982 -31 -1.1%
Total interest revenue 2,692 1,345 1,346 2,443 248 10.2%Interest revenue (loans, credit cards, etc.) 2,692 1,345 1,346 2,443 248 10.2%
Book value adjustment gain/loss - - - - - -
Interest on securities - - - - - -
Total operating revenue other than interest revenue 258 78 179 538 -280 -52.0%
Guarantee commission received 0 0 0 - 0 -
Gain on sales of securities - - - - - -
Gain on bad debts recovered 52 - 52 31 21 67.9%
Commission revenue 204 77 126 88 116 132.2%
Real estate business sales - - - - - -
General entertainment business sales - - - - - -
Other operating revenue 0 -0 0 418 -418 -100.0%
Operating expenses 1,858 851 1,006 1,500 358 23.9%
Total interest expenses 1,081 541 539 866 214 24.7%
Interest on deposits - - - - - -
Interest on loans 606 306 300 467 138 29.6%
Interest on bonds 82 25 56 44 37 83.1%
Other interest 392 209 183 354 38 10.8%
Total expenses other than interest 777 310 467 633 143 22.7%
Loss of sales on securities - - - - - -
Expenses related to bad debts 776 310 465 633 142 22.6%
Other sales costs - - - - - -
Other operating expenses 1 - 1 0 1 690.4%
SG&A expenses 984 498 486 1,102 -117 -10.7%
Personnel expenses 605 303 301 641 -36 -5.7%
Depreciation 65 33 32 105 -39 -37.5%
Other SG&A expenses 314 161 152 355 -41 -11.6%
Other revenue 0 0 0 0 0 426.6%
Other expenses - - - 0 -0 -100.0%
Operating profit 107 74 33 378 -270 -71.5%
Financial revenue - - - - - -
Financial expenses 0 0 0 - 0 -
Income from Equity Investment Methods - - - - - -
Losses from Equity Investment Methods - - - - - -
Profit (loss) before taxes 107 73 33 378 -271 -71.6%
Income tax 25 4 21 83 -58 -69.9%
Profit (loss) 82 69 12 294 -212 -72.1%
ROA(Annualized)※1(%) 0.25% 0.44% 0.08% 1.04% -0.79% -
(Unit: 1 million JPY)IFRS
※1 ROA=Profit (loss) ÷ Total assets(%)※Total assets=(beginning assets + ending assets) ÷ 2

Copyright(C)2018 J TRUST Co., Ltd. All Rights Reserved. 21
FY03/2019 Ended Compared to 2018/03
2018/06 2018/09 2018/12 2019/03 2018/03 Difference Difference in %
AssetsCash and cash equivalents 2,647 405 4,415 -4,010 -90.8%(a)Loan balance 5,140 4,850 5,723 -872 -15.2%
Operating loans 5,140 4,850 5,723 -872 -15.2%Loans by banking business - - - - -
Advances paid - installment - - - - -
Finance lease receivables - - - - -
Purchased receivables 2,468 2,404 2,558 -154 -6.0%Other accounts receivables 32 30 36 -6 -18.2%Operational investment securities - - - - -
Securities - - - - -
Other financial assets 2,888 3,136 110 3,025 -
Allowance for doubtful accounts -2,352 -2,345 -2,068 -277 -
Assets held for sale - - - - -
Tangible assets 40 38 44 -6 -15.0%Investment properties - - - - -
Goodwill - - - - -
Intangible assets 29 29 31 -2 -7.3%Other assets 670 3,461 662 2,798 422.4%
Total assets 11,565 12,010 11,515 494 4.3%
LiabilitiesDeposits - - - - -
Total interest-bearing liabilities - - - - -
Loans - - - - -
Bonds - - - - -
Other liabilities 139 145 81 63 76.9%Total liabilities 139 145 81 63 76.9%Equity
Attributable to owners of parent 11,425 11,865 11,433 431 3.8%Non-controlling interests - - - - -
Total equity 11,425 11,865 11,433 431 3.8%Total liabilities and equity 11,565 12,010 11,515 494 4.3%
(Size of guarantees)※1 - - - - -
(b) Balance of NPL 2,409 2,456 2,337 118 5.1%(c) Allowance for doubtful accounts 2,352 2,345 2,068 277 13.4%
①Allowance for doubtful accounts 2,207 2,239 2,065 173 8.4%NPL ratio (Gross)(b)÷(a) 46.9% 50.6% 40.8% 9.8% -
NPL ratio (net)((b) - ①)÷(a) 3.9% 4.5% 4.8% -0.3% -
② Allowance for doubtful accounts (Other) ※2 145 106 2 104 -
Allowance for doubtful accounts and others
4. Data Book3) Financial Business in South Korea and Mongolia
TA Asset Management Statement of Financial Position (unaudited)
(Unit: 1 million JPY)
※2 Allowance for purchased receivables, subrogation receivables, membership rights, investments and other assets
(Unit: 1 million JPY)
※1 Includes size of guarantees in banking business
IFRS

Copyright(C)2018 J TRUST Co., Ltd. All Rights Reserved.
4. Data Book3) Financial Business in South Korea and Mongolia
TA Asset Management Statement of Profit or Loss (unaudited)
22
FY03/2019(Total)
Q2 FY03/2018
(Total)
YOY (Total)
1Q 2Q 3Q 4Q Difference Difference in %
Operating revenue 1,003 559 443 782 220 28.2%
Total interest revenue 907 516 390 660 246 37.3%Interest revenue (loans, credit cards, etc.) 433 223 209 364 69 19.0%
Book value adjustment gain/loss 473 292 181 252 221 87.9%
Interest on securities - - - 44 -44 -100.0%Total operating revenue other than interest revenue 96 43 52 121 -25 -21.0%
Guarantee commission received - - - - - -
Gain on sales of securities - - - - - -
Gain on bad debts recovered 19 10 8 25 -6 -25.7%
Commission revenue 0 0 0 0 0 21.4%
Real estate business sales - - - - - -
General entertainment business sales - - - - - -
Other operating revenue 76 32 43 95 -19 -20.0%
Operating expenses 265 219 46 30 235 779.4%
Total interest expenses - - - 13 -13 -100.0%
Interest on deposits - - - - - -
Interest on loans - - - - - -
Interest on bonds - - - 13 -13 -100.0%
Other interest - - - - - -
Total expenses other than interest 265 219 46 16 249 -
Loss of sales on securities - - - - - -
Expenses related to bad debts 265 219 46 16 249 -
Other sales costs - - - - - -
Other operating expenses - - - - - -
SG&A expenses 413 206 207 355 58 16.4%
Personnel expenses 217 105 111 213 3 1.7%
Depreciation 12 6 6 6 5 91.4%
Other SG&A expenses 184 94 89 135 48 35.8%
Other revenue 8 8 0 8 0 0.2%
Other expenses - - - 2 -2 -100.0%
Operating profit 332 142 190 402 -70 -17.4%
Financial revenue 176 142 33 75 100 132.6%
Financial expenses 12 0 12 0 12 -
Income from Equity Investment Methods - - - - - -
Losses from Equity Investment Methods - - - - - -
Profit (loss) before taxes 496 284 211 478 17 3.7%
Income tax 115 61 53 104 11 10.6%
Profit (loss) 380 222 157 374 6 1.8%
ROA(Annualized)※1(%) 6.47% 7.72% 5.36% 6.23% 0.24% -
(Unit: 1 million JPY)IFRS
※1 ROA=Profit (loss) ÷ Total assets(%)※Total assets=(beginning assets + ending assets)÷ 2

Copyright(C)2018 J TRUST Co., Ltd. All Rights Reserved. 23
FY03/2019 Ended Compared to 2018/03
2018/06 2018/09 2018/12 2019/03 2018/03 Difference Difference in %
AssetsCash and cash equivalents 4,914 3,796 5,696 -1,900 -33.4%
(a)Loan balance - - 90,791 -355 -0.4%Operating loans - - - - -
Loans by banking business 93,244 90,436 90,791 -355 -0.4%Advances paid - installment - - - - -
Finance lease receivables - - - - -
Purchased receivables - - - - -
Other accounts receivables 985 1,185 994 190 19.1%
Operational investment securities - - - - -
Securities 21,263 24,306 26,939 -2,633 -9.8%
Other financial assets 15,154 14,832 12,675 2,156 17.0%Allowance for doubtful accounts -10,066 -10,536 -8,022 -2,513 -
Assets held for sale 2,279 2,388 1,804 583 32.4%
Tangible assets 1,253 1,206 1,269 -62 -5.0%
Investment properties - - - - -
Goodwill - - - - -
Intangible assets 636 630 661 -30 -4.7%
Other assets 2,467 2,640 2,182 458 21.0%
Total assets 132,133 130,887 134,994 -4,106 -3.0%
LiabilitiesDeposits 119,257 116,400 119,588 -3,187 -2.7%
Total interest-bearing liabilities 4,418 5,673 4,266 1,407 33.0%
Loans 2,763 3,974 2,656 1,318 49.7%
Bonds 1,655 1,698 1,610 88 5.5%
Other liabilities 3,337 5,463 2,981 2,482 83.3%
Total liabilities 127,014 127,538 126,836 702 0.6%
EquityAttributable to owners of parent 5,119 3,348 8,157 -4,808 -59.0%Non-controlling interests - - - - -
Total equity 5,119 3,348 8,157 -4,808 -59.0%
Total liabilities and equity 132,133 130,887 134,994 -4,106 -3.0%
(Size of guarantees)※1 3,911 3,543 3,815 -271 -7.1%
(b) Balance of NPL 3,249 3,978 2,335 1,642 70.4%(c) Allowance for doubtful accounts 10,066 10,536 8,022 2,513 31.3%
①Allowance for doubtful accounts 5,735 6,091 3,807 2,284 60.0%NPL ratio (Gross)(b)÷(a) 3.5% 4.4% 2.6% 1.8% -
NPL ratio (net)((b)-①)÷(a) 0.0% 0.0% 0.0% 0.0% -②Allowance for doubtful accounts (Others) ※2 4,330 4,444 4,215 229 5.4%
Allowance for doubtful accounts and others
4. Data Book4) Financial Business in Southeast Asia
J Trust Bank Indonesia Statement of Financial Position (unaudited)
(Unit: 1 million JPY)
※2 Allowance for purchased receivables, subrogation receivables, membership rights, investments and other assets.
(Unit: 1 million JPY)
※1 Includes size of guarantees in banking business
IFRS
Copyright(C)2018 J TRUST Co., Ltd. All Rights Reserved.
4. Data Book4) Financial Business in Southeast Asia
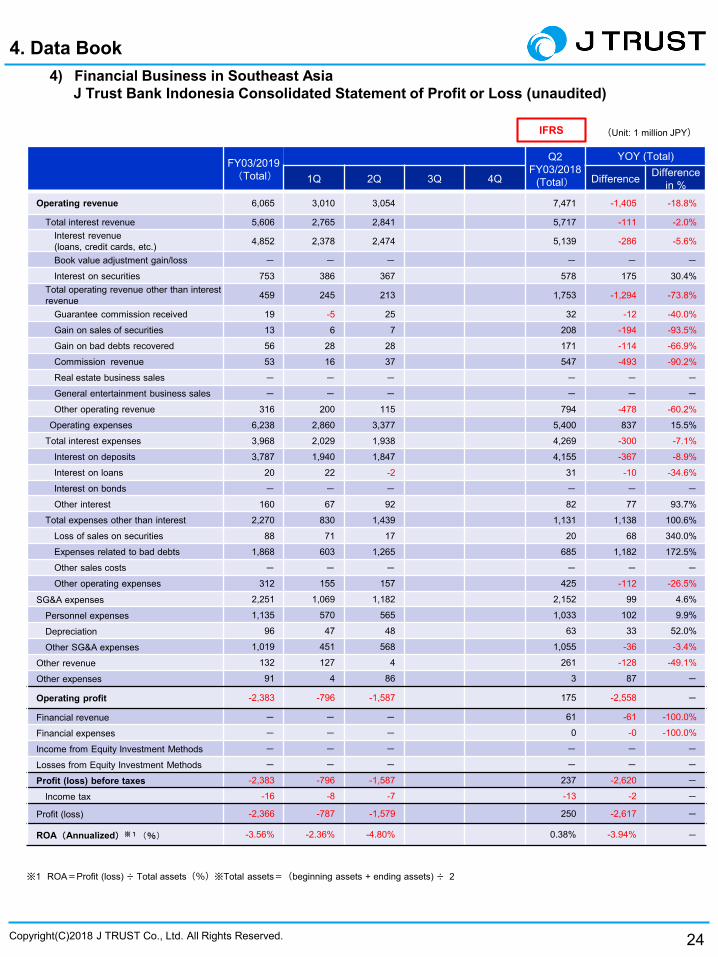
J Trust Bank Indonesia Consolidated Statement of Profit or Loss (unaudited)
24
FY03/2019(Total)
Q2 FY03/2018
(Total)
YOY (Total)
1Q 2Q 3Q 4Q Difference Difference in %
Operating revenue 6,065 3,010 3,054 7,471 -1,405 -18.8%
Total interest revenue 5,606 2,765 2,841 5,717 -111 -2.0%Interest revenue (loans, credit cards, etc.) 4,852 2,378 2,474 5,139 -286 -5.6%
Book value adjustment gain/loss - - - - - -
Interest on securities 753 386 367 578 175 30.4%Total operating revenue other than interest revenue 459 245 213 1,753 -1,294 -73.8%
Guarantee commission received 19 -5 25 32 -12 -40.0%
Gain on sales of securities 13 6 7 208 -194 -93.5%
Gain on bad debts recovered 56 28 28 171 -114 -66.9%
Commission revenue 53 16 37 547 -493 -90.2%
Real estate business sales - - - - - -
General entertainment business sales - - - - - -
Other operating revenue 316 200 115 794 -478 -60.2%
Operating expenses 6,238 2,860 3,377 5,400 837 15.5%
Total interest expenses 3,968 2,029 1,938 4,269 -300 -7.1%
Interest on deposits 3,787 1,940 1,847 4,155 -367 -8.9%
Interest on loans 20 22 -2 31 -10 -34.6%
Interest on bonds - - - - - -
Other interest 160 67 92 82 77 93.7%
Total expenses other than interest 2,270 830 1,439 1,131 1,138 100.6%
Loss of sales on securities 88 71 17 20 68 340.0%
Expenses related to bad debts 1,868 603 1,265 685 1,182 172.5%
Other sales costs - - - - - -
Other operating expenses 312 155 157 425 -112 -26.5%
SG&A expenses 2,251 1,069 1,182 2,152 99 4.6%
Personnel expenses 1,135 570 565 1,033 102 9.9%
Depreciation 96 47 48 63 33 52.0%
Other SG&A expenses 1,019 451 568 1,055 -36 -3.4%
Other revenue 132 127 4 261 -128 -49.1%
Other expenses 91 4 86 3 87 -
Operating profit -2,383 -796 -1,587 175 -2,558 -
Financial revenue - - - 61 -61 -100.0%
Financial expenses - - - 0 -0 -100.0%
Income from Equity Investment Methods - - - - - -
Losses from Equity Investment Methods - - - - - -
Profit (loss) before taxes -2,383 -796 -1,587 237 -2,620 -
Income tax -16 -8 -7 -13 -2 -
Profit (loss) -2,366 -787 -1,579 250 -2,617 -
ROA(Annualized)※1(%) -3.56% -2.36% -4.80% 0.38% -3.94% -
(Unit: 1 million JPY)IFRS
※1 ROA=Profit (loss) ÷ Total assets(%)※Total assets=(beginning assets + ending assets) ÷ 2

Copyright(C)2018 J TRUST Co., Ltd. All Rights Reserved. 25
FY03/2019 Ended Compared to 2018/03
2018/06 2018/09 2018/12 2019/03 2018/03 Difference Difference in %
AssetsCash and cash equivalents 247 882 272 610 223.9%(a)Loan balance - - - - -
Operating loans - - - - -
Loans by banking business - - - - -
Advances paid - installment - - - - -
Finance lease receivables - - - - -
Purchased receivables 849 1,347 773 573 74.2%Other accounts receivables - - - - -
Operational investment securities - - - - -
Securities - - - - -
Other financial assets 41 31 63 -31 -50.5%Allowance for doubtful accounts -25 -43 - -43 -
Assets held for sale 2 2 2 -0 -2.6%Tangible assets 590 581 600 -19 -3.2%Investment properties - - - - -
Goodwill - - - - -
Intangible assets 0 0 0 0 50.0%Other assets 546 545 546 -1 -0.2%
Total assets 2,252 3,347 2,259 1,088 48.2%
LiabilitiesDeposits - - - - -
Total interest-bearing liabilities 2,042 3,252 2,072 1,180 57.0%Loans 2,042 3,252 2,072 1,180 57.0%Bonds - - - - -
Other liabilities 80 14 54 -40 -74.1%Total liabilities 2,123 3,267 2,126 1,140 53.6%Equity
Attributable to owners of parent 129 80 132 -51 -39.1%Non-controlling interests - - - - -
Total equity 129 80 132 -51 -39.1%Total liabilities and equity 2,252 3,347 2,259 1,088 48.2%
(Size of guarantees)※1 - - - - -
(b) Balance of NPL - - - - -
(c) Allowance for doubtful accounts 25 43 - 43 -
①Allowance for doubtful accounts - - - - -
NPL ratio (Gross)(b)÷(a) - - - - -
NPL ratio (net)((b) - ①)÷(a) - - - - -
②Allowance for doubtful accounts (Others)※2 25 43 - 43 -
Allowance for doubtful accounts and others
4. Data Book4) Financial Business in Southeast Asia
J Trust Investments Indonesia Statement of Financial Position (unaudited)
(Unit: 1 million JPY)
※2 Allowance for purchased receivables, subrogation receivables, membership rights, investments and other assets
(Unit: 1 million JPY)
※1 Includes size of guarantees in banking business
IFRS

Copyright(C)2018 J TRUST Co., Ltd. All Rights Reserved.
4. Data Book4) Financial Business in Southeast Asia
J Trust Investments Indonesia Statement of Profit or Loss (unaudited)
26
FY03/2019(Total)
Q2 FY03/2018 (Total))
YOY (Total)
1Q 2Q 3Q 4Q Difference Difference in %
Operating revenue 205 127 78 -206 412 -
Total interest revenue 205 127 77 -206 411 -
Interest revenue(loans, credit cards, etc.) 154 94 59 516 -361 -70.1%
Book value adjustment gain/loss 50 33 17 -722 773 -
Interest on securities - - - - - -
Total operating revenue other than interest revenue 0 -0 0 - 0 -
Guarantee commission received - - - - - -
Gain on sales of securities - - - - - -
Gain on bad debts recovered - - - - - -
Commission revenue - - - - - -
Real estate business sales - - - - - -
General entertainment business sales - - - - - -
Other Operating revenue 0 -0 0 - 0 -
Operating expenses 157 79 78 166 -9 -5.6%
Total interest expenses 105 51 53 166 -61 -36.9%
Interest on deposits - - - - - -
Interest on loans 105 51 53 166 -61 -36.9%
Interest on bonds - - - - - -
Other interest - - - - - -
Total expenses other than interest 52 27 24 - 52 -
Loss of sales on securities - - - - - -
Expenses related to bad debts 52 27 24 - 52 -
Other sales costs - - - - - -
Other operating expenses - - - - - -
SG&A expenses 75 32 42 58 16 28.3%
Personnel expenses 20 10 9 27 -7 -27.9%
Depreciation 4 2 2 4 -0 -6.4%
Other SG&A expenses 50 20 30 26 24 94.5%
Other revenue 15 8 7 17 -1 -8.0%
Other expenses - - - 0 -0 -100.0%
Operating profit -11 23 -34 -415 404 -
Financial revenue 5 2 2 9 -3 -39.2%
Financial expenses 21 11 9 3 18 567.2%
Income from Equity Investment Methods - - - - - -
Losses from Equity Investment Methods - - - - - -
Profit (loss) before taxes -26 14 -41 -409 382 -
Income tax 33 22 11 0 33 -
Profit (loss) -60 -7 -53 -409 348 -
ROA(Annualized)※1(%) -4.33% -1.27% -7.66% -20.39% 16.06% -
(Unit: 1 million JPY)IFRS
※1 ROA=Profit (loss) ÷ Total assets(%)※ Total assets=(beginning assets + ending assets) ÷ 2

Copyright(C)2018 J TRUST Co., Ltd. All Rights Reserved. 27
FY03/2019 Ended Compared to 2018/03
2018/06 2018/09 2018/12 2019/03 2018/03 Difference Difference in %
AssetsCash and cash equivalents 4,175 4,548 3,135 1,413 45.1%
(a)Loan balance - - - - -
Operating loans - - - - -
Loans by banking business - - - - -
Advances paid - installment - - - - -
Finance lease receivables - - - - -
Purchased receivables - - - - -
Other accounts receivables 970 1,169 655 513 78.4%
Operational investment securities 2,132 3,234 3,242 -7 -0.2%
Securities - - - - -
Other financial assets 25,782 25,959 23,719 2,240 9.5%Allowance for doubtful accounts -1,677 -2,076 -1,616 -459 -
Assets held for sale - - - - -
Tangible assets 18 24 19 4 24.8%
Investment properties - - - - -
Goodwill - - - - -
Intangible assets 0 0 0 -0 -31.7%
Other assets 982 981 661 319 48.3%
Total assets 32,383 33,842 29,817 4,025 13.5%
LiabilitiesDeposits - - - - -
Total interest-bearing liabilities 2,763 - - - -
Loans 2,763 - - - -
Bonds - - - - -
Other liabilities 35 155 122 32 26.6%
Total liabilities 2,799 155 122 32 26.6%
EquityAttributable to owners of parent 29,584 33,687 29,694 3,992 13.4%
Non-controlling interests - - - - -
Total equity 29,584 33,687 29,694 3,992 13.4%
Total liabilities and equity 32,383 33,842 29,817 4,025 13.5%
(Size of guarantees)※1 - - - - -
(b) Balance of NPL - - - - -
(c) Allowance for doubtful accounts 1,677 2,076 1,616 459 28.4%①Allowance for doubtful accounts - - - - -
NPL ratio (Gross)(b)÷(a) - - - - -
NPL ratio (net)((b) - ①)÷(a) - - - - -
②Allowance for doubtful accounts (Others) ※2 1,677 2,076 1,616 459 28.4%
Allowance for doubtful accounts and others
4. Data Book5) Investment Business
JTrust Asia Statement of Financial Position (unaudited)
(Unit: 1 million JPY)
※2 Allowance for purchased receivables, subrogation receivables, membership rights, investments and other assets
(Unit: 1 million JPY)
※1 Includes size of guarantees in banking business
IFRS

Copyright(C)2018 J TRUST Co., Ltd. All Rights Reserved.
4. Data Book5) Investment Business
JTrust Asia Statement of Profit or Loss (unaudited)
28
FY03/2019(Total)
Q2 FY 03/2018 (Total)
YOY (Total)
1Q 2Q 3Q 4Q Difference Difference in %
Operating revenue 655 322 333 1,309 -653 -49.9%
Total interest revenue 655 322 333 1,199 -544 -45.4%Interest revenue (loans, credit cards, etc.) 655 322 333 204 451 220.9%
Book value adjustment gain/loss - - - - - -
Interest on securities - - - 995 -995 -100.0%Total operating revenue other than interest revenue - - - 109 -109 -100.0%
Guarantee commission received - - - - - -
Gain on sales of securities - - - - - -
Gain on bad debts recovered - - - - - -
Commission revenue - - - - - -
Real estate business sales - - - - - -
General entertainment business sales - - - - - -
Other operating revenue - - - 109 -109 -100.0%
Operating expenses 356 4 352 152 204 134.0%
Total interest expenses 10 2 8 - 10 -
Interest on deposits - - - - - -
Interest on loans 10 2 8 - 10 -
Interest on bonds - - - - - -
Other interest - - - - - -
Total expenses other than interest 345 2 343 152 193 127.1%
Loss of sales on securities - - - - - -
Expenses related to bad debts 343 - 343 - 343 -
Other sales costs - - - - - -
Other operating expenses 2 2 0 152 -150 -98.7%
SG&A expenses 588 131 457 83 505 605.0%
Personnel expenses 64 30 33 63 1 1.6%
Depreciation 2 1 1 3 -0 -17.2%
Other SG&A expenses 521 99 422 16 504 -
Other revenue 0 0 0 0 -0 -47.1%
Other expenses 1 - 1 0 1 -
Operating profit -291 186 -478 1,073 -1,364 -
Financial revenue 1,109 987 121 7 1,102 -
Financial expenses 246 74 172 678 -432 -63.6%
Income from Equity Investment Methods - - - - - -
Losses from Equity Investment Methods - - - - - -
Profit (loss) before taxes 570 1,099 -529 401 169 42.2%Income tax 19 3 16 113 -93 -82.7%
Profit (loss) 551 1,096 -545 288 262 91.2%
ROA(Annualized)※1(%) 3.46% 14.10% -6.59% 1.59% 1.87% -
(Unit: 1 million JPY)IFRS
※1 ROA=Profit (loss) ÷ Total assets(%)※Total assets=(beginning assets + ending assets) ÷ 2

Copyright(C)2018 J TRUST Co., Ltd. All Rights Reserved.
4. Data Book6) Other Non-Financial Business
Keynote Statement of Profit or Loss (unaudited)
29
FY03/2019(Total)
Q2 FY 03/2018(Total)
YOY (Total)
1Q 2Q 3Q 4Q Difference Difference in %
Operating revenue 3,966 1,371 2,595 3,671 294 8.0%
Total interest revenue - - - - - -
Interest revenue (Loans, credit cards, etc.) - - - - - -
Book value adjustment gain/loss - - - - - -
Interest on securities - - - - - -
Total operating revenue other than interest revenue 3,966 1,371 2,595 3,671 294 8.0%
Guarantee commission received - - - - - -
Gain on sales of securities - - - - - -
Gain on bad debts recovered - - - - - -
Commission revenue - - - - - -
Real estate business sales 2,485 1,158 1,326 2,696 -210 -7.8%
General entertainment business sales - - - - - -
Other operating revenue 1,481 212 1,268 975 505 51.9%
Operating expenses 3,396 1,153 2,242 3,201 194 6.1%
Total interest expenses - - - - - -
Interest on deposits - - - - - -
Interest on loans - - - - - -
Interest on bonds - - - - - -
Other interest - - - - - -
Total expenses other than interest 3,396 1,153 2,242 3,201 194 6.1%
Loss of sales on securities - - - - - -
Expenses related to bad debts - - - - - -
Other sales costs 3,396 1,153 2,242 3,201 194 6.1%
Other operating expenses - - - - - -
SG&A expenses 484 230 253 340 143 42.3%
Personnel expenses 259 128 130 218 41 19.0%
Depreciation 2 1 1 2 -0 -6.0%
Others SG&A expenses 222 100 121 119 102 85.9%
Other revenue 13 0 12 31 -18 -57.7%
Other expenses 19 10 8 2 16 576.7%
Operating profit 80 -22 102 157 -77 -49.3%
Financial revenue 0 0 0 0 -0 -1.1%
Financial expenses 49 23 26 41 7 19.1%
Income from Equity Investment Methods - - - - - -
Losses from Equity Investment Methods - - - - - -
Profit (loss) before taxes 30 -45 76 116 -85 -73.6%
Income tax 1 -3 5 27 -26 -93.5%
Profit (loss) 28 -42 71 88 -59 -67.3%
ROA(Annualized)※1(%) 0.73% -2.39% 3.37% 2.64% -1.91% -
(Unit: 1 million JPY)IFRS
※1 ROA=Profit (loss) ÷ Total assets(%)※Total assets=(beginning assets + ending assets) ÷ 2

Copyright(C)2018 J TRUST Co., Ltd. All Rights Reserved. 30
FY03/2019 Ended Compared to 2018/03
2018/06 2018/09 2018/12 2019/03 2018/03 Difference Difference in %
AssetsCash and cash equivalents 29,626 18,308 20,267 -1,958 -9.7%(a)Loan balance 185,700 190,929 175,621 15,308 8.7%
Operating loans - - - - -
Loans by banking business 185,700 190,929 175,621 15,308 8.7%Advances paid - installment - - - - -
Finance lease receivables - - - - -
Purchased receivables - - - - -
Other accounts receivables 1,434 1,387 1,337 49 3.7%Operational investment securities - - - - -
Securities 10,570 10,524 7,578 2,946 38.9%Other financial assets 11,008 12,323 10,832 1,490 13.8%
Allowance for doubtful accounts -10,562 -10,543 -8,576 -1,967 -
Assets held for sale - - - - -
Tangible assets 395 342 459 -117 -25.5%Investment properties - - - - -
Goodwill 941 941 941 - -
Intangible assets 622 588 668 -80 -12.1%Other assets 45 83 67 16 24.2%
Total assets 229,781 224,884 209,197 15,687 7.5%
LiabilitiesDeposits 207,791 201,438 185,697 15,740 8.5%Total interest-bearing liabilities 2,000 2,000 2,000 - -
Loans - - - - -
Bonds 2,000 2,000 2,000 - -
Other liabilities 4,440 5,513 5,149 363 7.1%Total liabilities 214,232 208,951 192,847 16,104 8.4%Equity
Attributable to owners of parent 15,549 15,932 16,350 -417 -2.6%Non-controlling interests - - - - -
Total equity 15,549 15,932 16,350 -417 -2.6%Total liabilities and equity 229,781 224,884 209,197 15,687 7.5%
(Size of guarantees)※1 - - - - -
(b) Balance of NPL 11,180 11,013 10,946 67 0.6%(c) Allowance for doubtful accounts 10,562 10,543 8,576 1,967 22.9%
① Allowance for doubtful accounts 10,520 10,500 8,554 1,946 22.8%NPL ratio (Gross)(b)÷(a) 6.0% 5.8% 6.2% -0.5% -
NPL ratio (net)((b) - ①)÷(a) 0.4% 0.3% 1.4% -1.1% -
② Allowance for doubtful accounts (Others) ※2 42 43 22 20 93.0%
Allowance for doubtful accounts and others
1) JT Chinae Savings BankStatement of Financial Position (unaudited)
(Unit: 10 million KRW)
※2 Allowance for purchased receivables, subrogation receivables, membership rights, investments and other assets
(Unit:10 million KRW )
※1 Includes size of guarantees in banking business
IFRS
【Reference】 Overseas Subsidiaries(in local currency)
Copyright(C)2018 J TRUST Co., Ltd. All Rights Reserved.
【Reference】 Overseas Subsidiaries(in local currency)
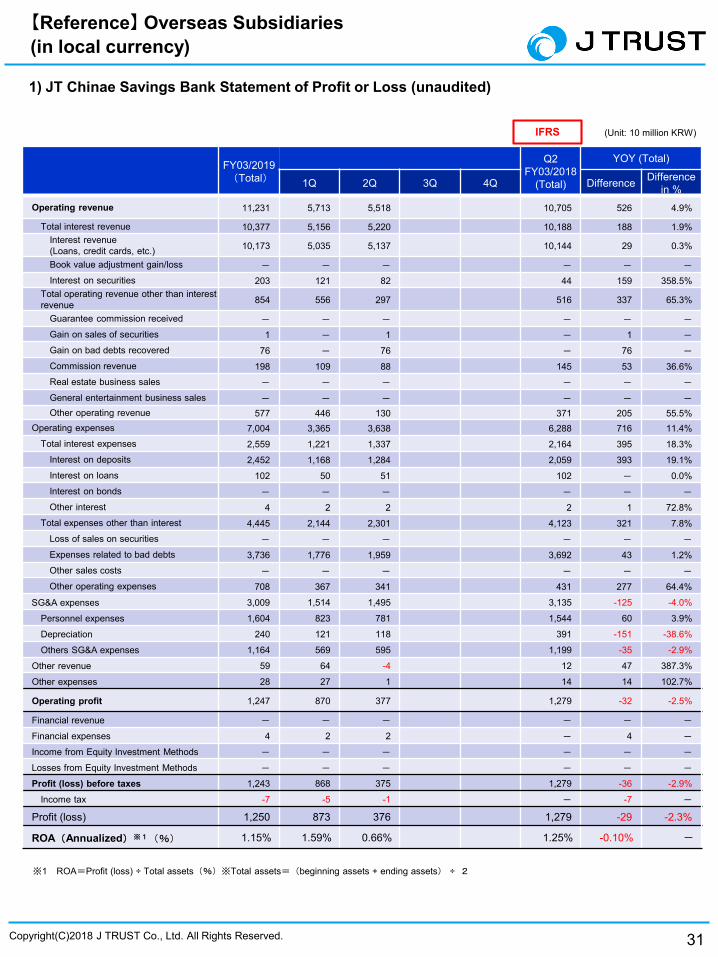
1) JT Chinae Savings Bank Statement of Profit or Loss (unaudited)
31
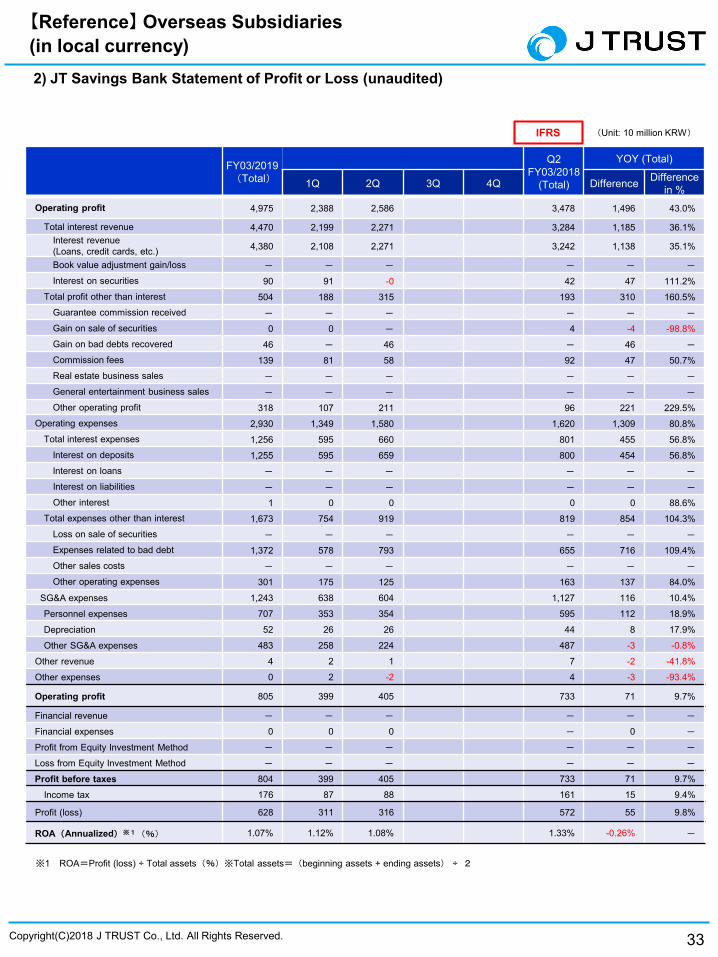
FY03/2019(Total)
Q2FY03/2018
(Total)
YOY (Total)
1Q 2Q 3Q 4Q Difference Difference in %
Operating revenue 11,231 5,713 5,518 10,705 526 4.9%
Total interest revenue 10,377 5,156 5,220 10,188 188 1.9%Interest revenue (Loans, credit cards, etc.) 10,173 5,035 5,137 10,144 29 0.3%
Book value adjustment gain/loss - - - - - -
Interest on securities 203 121 82 44 159 358.5%Total operating revenue other than interest revenue 854 556 297 516 337 65.3%
Guarantee commission received - - - - - -
Gain on sales of securities 1 - 1 - 1 -
Gain on bad debts recovered 76 - 76 - 76 -
Commission revenue 198 109 88 145 53 36.6%Real estate business sales - - - - - -
General entertainment business sales - - - - - -
Other operating revenue 577 446 130 371 205 55.5%Operating expenses 7,004 3,365 3,638 6,288 716 11.4%
Total interest expenses 2,559 1,221 1,337 2,164 395 18.3%Interest on deposits 2,452 1,168 1,284 2,059 393 19.1%Interest on loans 102 50 51 102 - 0.0%Interest on bonds - - - - - -
Other interest 4 2 2 2 1 72.8%Total expenses other than interest 4,445 2,144 2,301 4,123 321 7.8%
Loss of sales on securities - - - - - -
Expenses related to bad debts 3,736 1,776 1,959 3,692 43 1.2%Other sales costs - - - - - -
Other operating expenses 708 367 341 431 277 64.4%
SG&A expenses 3,009 1,514 1,495 3,135 -125 -4.0%
Personnel expenses 1,604 823 781 1,544 60 3.9%
Depreciation 240 121 118 391 -151 -38.6%
Others SG&A expenses 1,164 569 595 1,199 -35 -2.9%
Other revenue 59 64 -4 12 47 387.3%
Other expenses 28 27 1 14 14 102.7%
Operating profit 1,247 870 377 1,279 -32 -2.5%
Financial revenue - - - - - -
Financial expenses 4 2 2 - 4 -
Income from Equity Investment Methods - - - - - -
Losses from Equity Investment Methods - - - - - -
Profit (loss) before taxes 1,243 868 375 1,279 -36 -2.9%
Income tax -7 -5 -1 - -7 -
Profit (loss) 1,250 873 376 1,279 -29 -2.3%
ROA(Annualized)※1(%) 1.15% 1.59% 0.66% 1.25% -0.10% -
(Unit: 10 million KRW)IFRS
※1 ROA=Profit (loss) ÷ Total assets(%)※Total assets=(beginning assets + ending assets) ÷ 2
Copyright(C)2018 J TRUST Co., Ltd. All Rights Reserved.
【Reference】 Overseas Subsidiaries(in local currency)
32
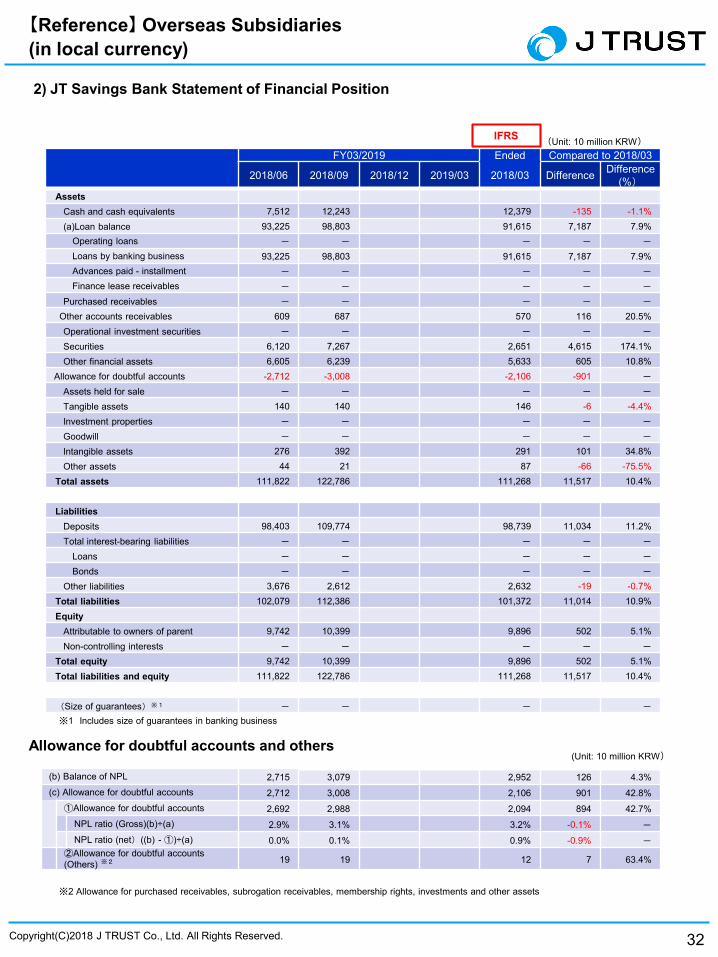
FY03/2019 Ended Compared to 2018/03
2018/06 2018/09 2018/12 2019/03 2018/03 Difference Difference (%)
AssetsCash and cash equivalents 7,512 12,243 12,379 -135 -1.1%(a)Loan balance 93,225 98,803 91,615 7,187 7.9%
Operating loans - - - - -
Loans by banking business 93,225 98,803 91,615 7,187 7.9%Advances paid - installment - - - - -
Finance lease receivables - - - - -
Purchased receivables - - - - -
Other accounts receivables 609 687 570 116 20.5%Operational investment securities - - - - -
Securities 6,120 7,267 2,651 4,615 174.1%Other financial assets 6,605 6,239 5,633 605 10.8%
Allowance for doubtful accounts -2,712 -3,008 -2,106 -901 -
Assets held for sale - - - - -
Tangible assets 140 140 146 -6 -4.4%Investment properties - - - - -
Goodwill - - - - -
Intangible assets 276 392 291 101 34.8%Other assets 44 21 87 -66 -75.5%
Total assets 111,822 122,786 111,268 11,517 10.4%
LiabilitiesDeposits 98,403 109,774 98,739 11,034 11.2%Total interest-bearing liabilities - - - - -
Loans - - - - -
Bonds - - - - -
Other liabilities 3,676 2,612 2,632 -19 -0.7%Total liabilities 102,079 112,386 101,372 11,014 10.9%Equity
Attributable to owners of parent 9,742 10,399 9,896 502 5.1%Non-controlling interests - - - - -
Total equity 9,742 10,399 9,896 502 5.1%Total liabilities and equity 111,822 122,786 111,268 11,517 10.4%
(Size of guarantees)※1 - - - -
(b) Balance of NPL 2,715 3,079 2,952 126 4.3%(c) Allowance for doubtful accounts 2,712 3,008 2,106 901 42.8%
①Allowance for doubtful accounts 2,692 2,988 2,094 894 42.7%NPL ratio (Gross)(b)÷(a) 2.9% 3.1% 3.2% -0.1% -
NPL ratio (net)((b) - ①)÷(a) 0.0% 0.1% 0.9% -0.9% -
②Allowance for doubtful accounts (Others) ※2 19 19 12 7 63.4%
Allowance for doubtful accounts and others
2) JT Savings Bank Statement of Financial Position
(Unit: 10 million KRW)
※2 Allowance for purchased receivables, subrogation receivables, membership rights, investments and other assets
(Unit: 10 million KRW)
※1 Includes size of guarantees in banking business
IFRS
Copyright(C)2018 J TRUST Co., Ltd. All Rights Reserved.
【Reference】 Overseas Subsidiaries(in local currency)2) JT Savings Bank Statement of Profit or Loss (unaudited)
33
FY03/2019(Total)
Q2 FY03/2018
(Total)
YOY (Total)
1Q 2Q 3Q 4Q Difference Difference in %
Operating profit 4,975 2,388 2,586 3,478 1,496 43.0%
Total interest revenue 4,470 2,199 2,271 3,284 1,185 36.1%Interest revenue (Loans, credit cards, etc.) 4,380 2,108 2,271 3,242 1,138 35.1%
Book value adjustment gain/loss - - - - - -
Interest on securities 90 91 -0 42 47 111.2%Total profit other than interest 504 188 315 193 310 160.5%
Guarantee commission received - - - - - -
Gain on sale of securities 0 0 - 4 -4 -98.8%Gain on bad debts recovered 46 - 46 - 46 -
Commission fees 139 81 58 92 47 50.7%Real estate business sales - - - - - -
General entertainment business sales - - - - - -
Other operating profit 318 107 211 96 221 229.5%Operating expenses 2,930 1,349 1,580 1,620 1,309 80.8%
Total interest expenses 1,256 595 660 801 455 56.8%Interest on deposits 1,255 595 659 800 454 56.8%Interest on loans - - - - - -
Interest on liabilities - - - - - -
Other interest 1 0 0 0 0 88.6%Total expenses other than interest 1,673 754 919 819 854 104.3%
Loss on sale of securities - - - - - -
Expenses related to bad debt 1,372 578 793 655 716 109.4%Other sales costs - - - - - -
Other operating expenses 301 175 125 163 137 84.0%
SG&A expenses 1,243 638 604 1,127 116 10.4%
Personnel expenses 707 353 354 595 112 18.9%
Depreciation 52 26 26 44 8 17.9%
Other SG&A expenses 483 258 224 487 -3 -0.8%
Other revenue 4 2 1 7 -2 -41.8%
Other expenses 0 2 -2 4 -3 -93.4%
Operating profit 805 399 405 733 71 9.7%
Financial revenue - - - - - -
Financial expenses 0 0 0 - 0 -
Profit from Equity Investment Method - - - - - -
Loss from Equity Investment Method - - - - - -
Profit before taxes 804 399 405 733 71 9.7%
Income tax 176 87 88 161 15 9.4%
Profit (loss) 628 311 316 572 55 9.8%
ROA(Annualized)※1(%) 1.07% 1.12% 1.08% 1.33% -0.26% -
(Unit: 10 million KRW)IFRS
※1 ROA=Profit (loss) ÷ Total assets(%)※Total assets=(beginning assets + ending assets) ÷ 2

Copyright(C)2018 J TRUST Co., Ltd. All Rights Reserved. 34
FY03/2019 Ended Compared to 2018/03
2018/06 2018/09 2018/12 2019/03 2018/03 Difference Difference in %
Cash and cash equivalents 7,097 6,278 6,831 -553 -8.1%(a)Loan balance 55,852 58,338 55,317 3,020 5.5%
Operating loans 55,310 57,327 55,311 2,015 3.6%
Loans by banking business - - - - -
Advances paid - installment - - - - -
Finance lease receivables 541 1,010 6 1,004 -
Purchased receivables - - - - -
Other accounts receivables 309 332 269 63 23.4%Operational investment securities - - - - -
Securities - 250 - - -
Other financial assets 2,106 2,116 2,115 250 0.1%Allowance for doubtful accounts -2,511 -2,777 -2,114 -662 -
Assets held for sale - - - - -
Tangible assets 205 188 221 -32 -14.8%Investment properties - - - - -
Goodwill - - - - -
Intangible assets 136 136 150 -13 -9.1%Other assets 464 476 471 4 0.9%
Total assets 63,661 65,339 63,262 2,076 3.3%
LiabilitiesDeposits - - - - -
Total interest-bearing liabilities 48,871 50,243 48,593 1,650 3.4%Loans 19,008 20,367 18,325 2,042 11.1%Bonds 29,863 29,875 30,267 -391 -1.3%
Other liabilities 671 965 437 528 120.9%Total liabilities 49,543 51,209 49,030 2,178 4.4%Equity
Attributable to owners of parent 14,117 14,129 14,232 -102 -0.7%Non-controlling interests - - - - -
Total equity 14,117 14,129 14,232 -102 -0.7%Total liabilities and equity 63,661 65,339 63,262 2,076 3.3%
(Size of guarantees)※1 33 28 21 6 32.1%
(b) Balance of NPL 4,195 4,620 3,891 729 18.8%(c) Allowance for doubtful accounts 2,511 2,777 2,114 662 31.4%
①Allowance for doubtful accounts 2,502 2,767 2,106 660 31.3%NPL ratio (Gross)(b)÷(a) 7.5% 7.9% 7.0% 0.9% -
NPL ratio (net)((b) - ①)÷(a) 3.0% 3.2% 3.2% -0.1% -
②Allowance for doubtful accounts (Others) ※2 9 10 7 2 34.0%
Allowance for doubtful accounts and others
3)JT Capital Statement of Financial Position (unaudited)
(Unit: 10 million KRW )
※2 Allowance for purchased receivables, subrogation receivables, membership rights, investments and other assets
(Unit:10 million KRW )
※1 Includes size of guarantees in banking business
IFRS
【Reference】 Overseas Subsidiaries (in local currency)

Copyright(C)2018 J TRUST Co., Ltd. All Rights Reserved.
【Reference】 Overseas Subsidiaries(in local currency)3) JT Capital
Statement of Profit or Loss (unaudited)
35
FY03/2019(Total)
Q2 FY 03/2018(Total)
YOY (Total)
1Q 2Q 3Q 4Q Difference Difference in %
Operating revenue 2,940 1,406 1,534 3,029 -88 -2.9%
Total interest revenue 2,682 1,329 1,353 2,483 199 8.0%interest revenue (Loans, credit cards, etc.) 2,682 1,329 1,353 2,483 199 8.0%
Book value adjustment gain/loss - - - - - -
Interest on securities - - - - - -
Total operating revenue other than interest revenue 258 77 180 546 -287 -52.7%
Guarantee commission received 0 0 0 - 0 -
Gain on sales of securities - - - - - -
Gain on bad debts recovered 52 - 52 31 21 66.7%Commission revenue 204 77 127 89 114 128.3%Real estate business sales - - - - - -
General entertainment business sales - - - - - -
Other Operating revenue 0 -0 0 424 -424 -100.0%Operating expenses 1,853 841 1,011 1,525 327 21.5%
Total interest expenses 1,077 534 542 881 195 22.2%Interest on deposits - - - - - -
Interest on loans 604 302 302 475 128 27.1%Interest on bonds 81 25 56 45 36 80.7%Other interest 390 206 183 360 30 8.5%
Total expenses other than interest 776 306 469 644 132 20.5%Loss of sales on securities - - - - - -
Expenses related to bad debts 774 306 468 644 130 20.3%Other sales costs - - - - - -
Other operating expenses 1 - 1 - 1 -
SG&A expenses 981 492 489 1,120 -139 -12.5%
Personnel expenses 602 299 303 652 -49 -7.6%
Depreciation 65 33 32 106 -41 -38.8%
Other SG&A expenses 312 159 153 361 -48 -13.5%
Other revenue 0 0 0 0 0 419.1%
Other expenses - - - 0 -0 -100.0%
Operating profit 107 72 34 382 -275 -72.0%
Financial revenue - - - - - -
Financial expenses 0 0 0 - 0 -
Income from Equity Investment Methods - - - - - -
Losses from Equity Investment Methods - - - - - -
Profit (loss) before taxes 106 72 33 382 -276 -72.1%
Income tax 25 4 21 85 -60 -70.4%
Profit (loss) 81 68 12 297 -215 -72.6%
ROA(Annualized)※1(%) 0.25% 0.43% 0.08% 1.04% -0.79% -
(Unit: 10 million KRW )IFRS
※1 ROA=Profit (loss) ÷ Total assets(%)※Total assets=(beginning assets + ending assets)/2
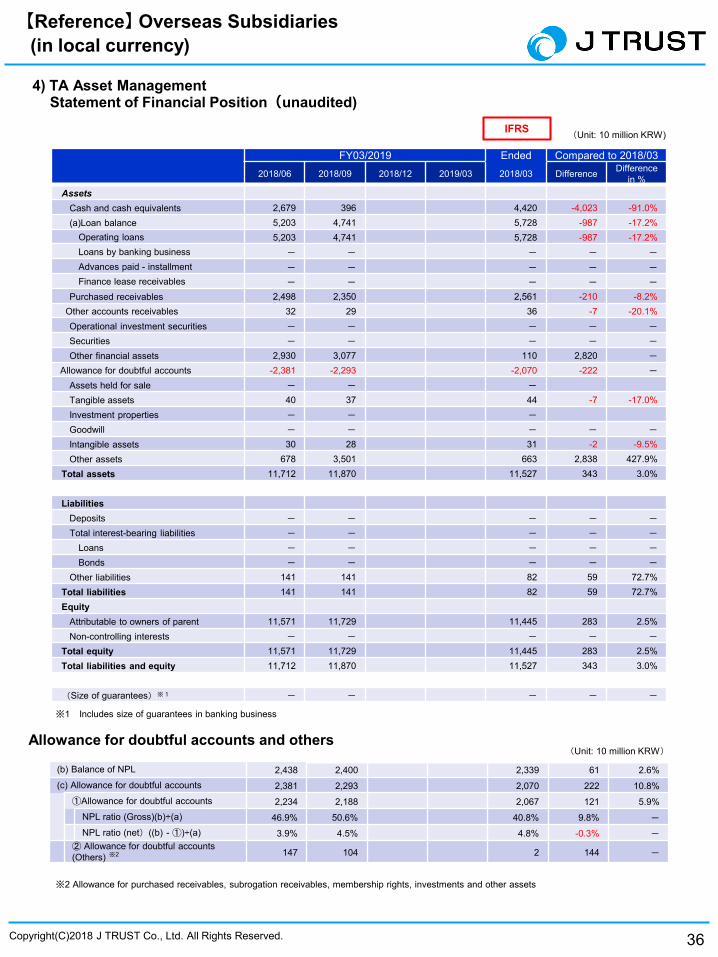
Copyright(C)2018 J TRUST Co., Ltd. All Rights Reserved. 36
FY03/2019 Ended Compared to 2018/032018/06 2018/09 2018/12 2019/03 2018/03 Difference Difference
in %Assets
Cash and cash equivalents 2,679 396 4,420 -4,023 -91.0%(a)Loan balance 5,203 4,741 5,728 -987 -17.2%
Operating loans 5,203 4,741 5,728 -987 -17.2%Loans by banking business - - - - -
Advances paid - installment - - - - -
Finance lease receivables - - - - -
Purchased receivables 2,498 2,350 2,561 -210 -8.2%Other accounts receivables 32 29 36 -7 -20.1%Operational investment securities - - - - -
Securities - - - - -
Other financial assets 2,930 3,077 110 2,820 -
Allowance for doubtful accounts -2,381 -2,293 -2,070 -222 -
Assets held for sale - - -
Tangible assets 40 37 44 -7 -17.0%Investment properties - - -
Goodwill - - - - -
Intangible assets 30 28 31 -2 -9.5%Other assets 678 3,501 663 2,838 427.9%
Total assets 11,712 11,870 11,527 343 3.0%
LiabilitiesDeposits - - - - -
Total interest-bearing liabilities - - - - -
Loans - - - - -
Bonds - - - - -
Other liabilities 141 141 82 59 72.7%Total liabilities 141 141 82 59 72.7%Equity
Attributable to owners of parent 11,571 11,729 11,445 283 2.5%Non-controlling interests - - - - -
Total equity 11,571 11,729 11,445 283 2.5%Total liabilities and equity 11,712 11,870 11,527 343 3.0%
(Size of guarantees)※1 - - - - -
(b) Balance of NPL 2,438 2,400 2,339 61 2.6%(c) Allowance for doubtful accounts 2,381 2,293 2,070 222 10.8%
①Allowance for doubtful accounts 2,234 2,188 2,067 121 5.9%NPL ratio (Gross)(b)÷(a) 46.9% 50.6% 40.8% 9.8% -
NPL ratio (net)((b) - ①)÷(a) 3.9% 4.5% 4.8% -0.3% -
② Allowance for doubtful accounts (Others) ※2 147 104 2 144 -
Allowance for doubtful accounts and others
4) TA Asset ManagementStatement of Financial Position(unaudited)
(Unit: 10 million KRW)
※2 Allowance for purchased receivables, subrogation receivables, membership rights, investments and other assets
(Unit: 10 million KRW)
※1 Includes size of guarantees in banking business
IFRS
【Reference】 Overseas Subsidiaries(in local currency)

Copyright(C)2018 J TRUST Co., Ltd. All Rights Reserved.
【Reference】 Overseas Subsidiaries(in local currency)4) TA Asset Management
Statement of Profit or Loss (unaudited)
37
FY03/2019(Total)
Q2 FY03/2018 (Total)
YOY (Total)
1Q 2Q 3Q 4Q Difference Difference in %
Operating revenue 999 554 445 797 202 25.4%
Total interest revenue 903 511 392 672 230 34.3%interest revenue (Loans, credit cards, etc.) 431 220 210 371 60 16.2%
Book value adjustment gain/loss 472 290 181 256 215 84.1%Interest on securities - - - 44 -44 -100.0%
Total operating revenue other than interest revenue 95 43 52 124 -28 -22.8%
Guarantee commission received - - - - - -
Gain on sales of securities - - - - - -
Gain on bad debts recovered 19 10 8 26 -7 -27.2%Commission revenue 0 0 0 0 0 18.5%Real estate business sales - - - - - -
General entertainment business sales - - - - - -
Other Operating revenue 76 32 43 97 -21 -21.8%Operating expenses 263 216 46 31 231 742.1%
Total interest expenses - - - 14 -14 -100.0%Interest on deposits - - - - - -
Interest on loans - - - - - -
Interest on bonds - - - 14 -14 -100.0%Other interest - - - - - -
Total expenses other than interest 263 216 46 17 246 -
Loss of sales on securities - - - - - -
Expenses related to bad debts 263 216 46 17 246 -
Other sales costs - - - - - -
Other operating expenses - - - - - -
SG&A expenses 412 204 208 361 51 14.1%
Personnel expenses 216 104 111 217 -0 -0.3%
Depreciation 12 6 6 6 5 87.6%
Other SG&A expenses 183 93 90 137 45 33.3%
Other revenue 8 7 0 8 -0 -1.8%
Other expenses - - - 2 -2 -100.0%
Operating profit 332 141 191 410 -77 -18.9%
Financial revenue 174 141 33 78 96 123.2%
Financial expenses 12 0 12 0 12 -
Income from Equity Investment Methods - - - - - -
Losses from Equity Investment Methods - - - - - -
Profit (loss) before taxes 494 282 212 488 6 1.3%
Income tax 114 61 53 106 8 8.2%
Profit (loss) 379 221 158 382 -2 -0.6%
ROA(Annualized)※1(%) 6.50% 7.61% 5.39% 6.34% 0.16% -
(Unit:10 million KRW)IFRS
※1 ROA=Profit (loss) ÷ Total assets(%)※Total assets=(beginning assets + ending assets) ÷ 2

Copyright(C)2018 J TRUST Co., Ltd. All Rights Reserved. 38
FY03/2019 Ended Compared to 2018/03
2018/06 2018/09 2018/12 2019/03 2018/03 Difference Difference in %
AssetsCash and cash equivalents 6,382 4,995 7,303 -2,308 -31.6%(a)Loan balance 121,096 118,995 116,399 2,595 2.2%
Operating loans - - - - -Loans by banking business 121,096 118,995 116,399 2,595 2.2%Advances paid - installment - - - - -
Finance lease receivables - - - - -
Purchased receivables - - - - -
Other accounts receivables 1,280 1,559 1,275 284 22.3%Operational investment securities - - - - -
Securities 27,614 31,982 34,538 -2,556 -7.4%Other financial assets 19,680 19,516 16,250 3,265 20.1%
Allowance for doubtful accounts -13,072 -13,863 -10,285 -3,578 -Assets held for sale 2,960 3,142 2,313 829 35.8%Tangible assets 1,628 1,588 1,627 -39 -2.5%Investment properties - - - - -
Goodwill - - - - -
Intangible assets 826 829 847 -18 -2.2%Other assets 3,204 3,474 2,797 406 14.5%
Total assets 171,602 172,220 173,069 -848 -0.5%
LiabilitiesDeposits 154,880 153,159 153,318 -159 -0.1%Total interest-bearing liabilities 5,732 7,451 5,507 1,944 35.3%
Loans 3,582 5,215 3,441 1,774 51.5%Bonds 2,149 2,235 2,065 170 8.2%
Other liabilities 4,334 7,189 3,821 3,367 88.1%Total liabilities 164,947 167,799 162,647 5,151 3.2%Equity
Attributable to owners of parent 6,655 4,420 10,421 -6,000 -57.6%Non-controlling interests - - - - -
Total equity 6,655 4,420 10,421 -6,000 -57.6%Total liabilities and equity 171,602 172,220 173,069 -848 -0.5%
(Size of guarantees)※1 5,079 4,662 4,891 -228 -4.7%
4,219 5,234 2,994 2,240 74.8%(c) Allowance for doubtful accounts 13,072 13,863 10,285 3,578 34.8%
①Allowance for doubtful accounts 7,449 8,015 4,881 3,133 64.2%NPL ratio (Gross)(b)÷(a) 3.5% 4.4% 2.6% 1.8% -NPL ratio (net)((b) - ①)÷(a) 0.0% 0.0% 0.0% 0.0% -
②Allowance for doubtful accounts (Others) ※2 5,623 5,848 5,403 444 8.2%
Allowance for doubtful accounts and others
【Reference】 Overseas Subsidiaries (in local currency)5) J Trust Bank Indonesia
Statement of Financial Position (unaudited)
(Unit: 100 million IDR )
※2 Allowance for purchased receivables, subrogation receivables, membership rights, investments and other assets
(Unit: 100 million IDR)
※1 Includes size of guarantees in banking business
IFRS

Copyright(C)2018 J TRUST Co., Ltd. All Rights Reserved.
【Reference】 Overseas Subsidiaries (in local currency)
5)J Trust Bank Indonesia Statement of Profit of Loss (unaudited)
39
FY03/2019(Total)
Q2 FY03/2018 (Total)
YOY (Total)
1Q 2Q 3Q 4Q Difference Difference in %
Operating revenue 7,795 3,825 3,969 8,895 -1,100 -12.4%
Total interest revenue 7,205 3,515 3,689 6,800 405 6.0%Interest revenue (loans, credit cards, etc.) 6,236 3,024 3,212 6,112 124 2.0%
Book value adjustment gain/loss - - - - - -Interest on securities 968 491 477 688 280 40.7%
Total operating revenue other than interest revenue 589 310 279 2,095 -1,505 -71.8%
Guarantee commission received 25 -7 32 38 -13 -33.9%Gain on sales of securities 17 7 9 248 -231 -93.1%Gain on bad debts recovered 72 35 36 205 -133 -64.8%Commission revenue 71 20 50 657 -586 -89.2%Real estate business sales - - - - - -General entertainment business sales - - - - - -
Other Operating revenue 403 253 150 944 -541 -57.3%Operating expenses 8,017 3,633 4,384 6,431 1,586 24.7%
Total interest expenses 5,097 2,580 2,516 5,082 14 0.3%Interest on deposits 4,865 2,465 2,399 4,947 -81 -1.7%Interest on loans 25 28 -3 36 -11 -31.5%Interest on bonds - - - - - -
Other interest 206 85 120 98 107 109.6%Total expenses other than interest 2,920 1,053 1,867 1,348 1,571 116.5%
Loss of sales on securities 112 90 22 23 89 372.1%Expenses related to bad debts 2,404 765 1,639 818 1,586 193.8%Other sales costs - - - - - -
Other operating expenses 402 197 205 506 -103 -20.5%SG&A expenses 2,897 1,359 1,537 2,562 334 13.0%
Personnel expenses 1,459 724 734 1,230 228 18.6%Depreciation 124 60 63 75 48 64.1%Other SG&A expenses 1,313 574 739 1,256 57 4.5%
Other revenue 168 161 6 311 -143 -46.0%Other expenses 117 6 111 4 113 -
Operating profit -3,069 -1,012 -2,056 208 -3,277 -
Financial revenue - - - 73 -73 -100.0%Financial expenses - - - - - -Income from Equity Investment Methods - - - - - -
Losses from Equity Investment Methods - - - - - - -
Profit (loss) before taxes -3,069 -1,012 -2,056 281 -3,350 -Income tax -21 -10 -10 -16 -5 -
Profit (loss) -3,047 -1,001 -2,046 297 -3,345 -
ROA(Annualized)※1(%) -3.53% -2.32% -4.76% 0.38% -3.91% -
(Unit: 100 million IDR)IFRS
※1 ROA=Profit (loss) ÷ Total assets(%)※Total assets=(beginning assets + ending assets) ÷ 2

Copyright(C)2018 J TRUST Co., Ltd. All Rights Reserved. 40
FY03/2019 Ended Compared to 2018/03
2018/06 2018/09 2018/12 2019/03 2018/03 Difference Difference in %
AssetsCash and cash equivalents 321 1,161 349 811 232.4%(a)Loan balance - - - - -
Operating loans - - - - -
Loans by banking business - - - - -
Advances paid - installment - - - - -
Finance lease receivables - - - - -
Purchased receivables 1,103 1,773 992 781 78.7%Other accounts receivables - - - - -
Operational investment securities - - - - -
Securities - - - - -
Other financial assets 53 41 81 -39 -49.2%Allowance for doubtful accounts -32 -56 - -56 -
Assets held for sale 3 3 3 -0 -
Tangible assets 766 764 769 -4 -0.6%Investment properties - - - - -
Goodwill - - - - -
Intangible assets 0 0 0 0 53.9%Other assets 583 583 584 -1 -0.2%
Total assets 2,800 4,270 2,780 1,490 53.6%
LiabilitiesDeposits - - - - -
Total interest-bearing liabilities 2,654 4,280 2,659 1,620 60.9%Loans 2,654 4,280 2,659 1,620 60.9%Bonds - - - - -
Other liabilities 104 18 70 -51 -73.4%Total liabilities 2,758 4,298 2,729 1,568 57.5%Equity
Attributable to owners of parent 41 -28 50 -78 -157.1%Non-controlling interests - - - - -
Total equity 41 -28 50 -78 -157.1%Total liabilities and equity 2,800 4,270 2,780 1,490 53.6%
(Size of guarantees)※1 - - - - -
(b) Balance of NPL - - - - -
(c) Allowance for doubtful accounts 32 56 - 56 -①Allowance for doubtful accounts - - - - -
NPL ratio (Gross)(b)÷(a) - - - - -NPL ratio (net)((b) - ①)÷(a) - - - - -
②Allowance for doubtful accounts (Others)※2 32 56 - 56 -
Allowance for doubtful accounts and others
【Reference】 Overseas Subsidiaries (in local currency)6)J Trust Investments Indonesia
Statement of Financial Position (unaudited)
(Unit: 100 million IDR )
※2 Allowance for purchased receivables, subrogation receivables, membership rights, investments and other assets
(Unit: 100 million IDR)
※1 Includes size of guarantees in banking business
IFRS

Copyright(C)2018 J TRUST Co., Ltd. All Rights Reserved.
【Reference】Overseas Subsidiaries (in local currency)
6)J Trust Investments IndonesiaStatement of Profit or Loss (unaudited)
41
FY03/2019(Total)
Q2FY03/2018
(Total)
YOY (Total)
1Q 2Q 3Q 4Q Difference Difference in %
Operating revenue 263 161 101 -244 508 -
Total interest revenue 263 161 101 -244 508 -
Interest revenue (loans, credit cards, etc.) 198 119 78 616 -417 -67.8%
Book value adjustment gain/loss 65 42 23 -860 925 -
Interest on securities - - - - - -
Total operating revenue other than interest revenue - - - - - -
Guarantee commission received - - - - - -
Gain on sales of securities - - - - - -
Gain on bad debts recovered - - - - - -
Commission revenue - - - - - -
Real estate business sales - - - - - -
General entertainment business sales - - - - - -
Other Operating revenue - - - - - -
Operating expenses 202 100 101 198 3 2.0%Total interest expenses 135 65 69 198 -63 -31.9%
Interest on deposits - - - - - -
Interest on loans 135 65 69 198 -63 -31.9%Interest on bonds - - - - - -
Other interest - - - - - -
Total expenses other than interest 67 35 32 - 67 -
Loss of sales on securities - - - - - -
Expenses related to bad debts 67 35 32 - 67 -
Other sales costs - - - - - -
Other operating expenses - - - - - -
SG&A expenses 97 41 55 70 27 38.7%Personnel expenses 25 12 12 33 -7 -22.2%Depreciation 5 2 2 5 0 1.1%
Other SG&A expenses 65 26 39 31 34 110.6%
Other revenue 20 10 9 20 -0 -0.6%Other expenses - - - 0 -0 -100.0%
Operating profit -15 30 -45 -493 477 -
Financial revenue 7 3 3 10 -3 -33.9%Financial expenses 27 14 12 3 23 620.9%
Income from Equity Investment Methods - - - - - -
Losses from Equity Investment Methods - - - - - -
Profit (loss) before taxes -35 19 -54 -485 450 -
Income tax 43 27 15 0 43 -
Profit (loss) -78 -8 -69 -485 407 -
ROA(Annualized)※1(%) -4.47% -1.26% -7.91% -20.62% 16.15% -
(Unit: 100 million IDR )IFRS
※1 ROA=Profit (loss) ÷ Total assets(%)※Total assets=(beginning assets + ending assets) ÷ 2

Copyright(C)2018 J TRUST Co., Ltd. All Rights Reserved. 42
FY03/2019 Ended Compared to 2018/03
2018/06 2018/09 2018/12 2019/03 2018/03 Difference Difference in %
AssetsCash and cash equivalents 51,682 54,797 38,695 16,101 41.6%(a)Loan balance - - - - -
Operating loans - - - - -
Loans by banking business - - - - -
Advances paid - installment - - - - -
Finance lease receivables - - - - -
Purchased receivables - - - - -
Other accounts receivables 12,007 14,091 8,095 5,996 74.1%Operational investment securities 26,398 38,968 40,020 -1,052 -2.6%Securities - - - - -
Other financial assets 318,950 312,677 292,517 20,160 6.9%Allowance for doubtful accounts -20,768 -25,016 -19,957 -5,059 -
Assets held for sale - - - - -
Tangible assets 228 299 246 53 21.8%Investment properties - - - - -
Goodwill - - - - -
Intangible assets 1 1 1 -0 -33.3%Other assets 11,421 11,414 7,457 3,956 53.1%
Total assets 399,921 407,234 367,077 40,157 10.9%
LiabilitiesDeposits - - - - -
Total interest-bearing liabilities 34,125 - - - -
Loans 34,125 - - - -
Bonds - - - - -
Other liabilities 445 1,870 1,514 356 23.5%Total liabilities 34,570 1,870 1,514 356 23.5%Equity
Attributable to owners of parent 365,351 405,363 365,562 39,800 10.9%Non-controlling interests - - - - -
Total equity 365,351 405,363 365,562 39,800 10.9%Total liabilities and equity 399,921 407,234 367,077 40,157 10.9%
(Size of guarantees)※1 - - - - -
(b) Balance of NPL - - - - -
(c) Allowance for doubtful accounts 20,768 25,016 19,957 5,059 25.4%①Allowance for doubtful accounts - - - - -
NPL ratio (Gross)(b)÷(a) - - - - -
NPL ratio (net)((b) - ①)÷(a) - - - - -
② Allowance for doubtful accounts (Other) ※2 20,768 25,016 19,957 5,059 25.4%
Allowance for doubtful accounts and others
【Reference】 Overseas Subsidiaries (in local currency)
7) JTrust AsiaStatement of Financial Position (unaudited)
(Unit:1,000 SGD)
※2 Allowance for purchased receivables, subrogation receivables, membership rights, investments and other assets
(Unit:1,000 SGD)
※1 Includes size of guarantees in banking business
IFRS

Copyright(C)2018 J TRUST Co., Ltd. All Rights Reserved.
【Reference】 Overseas Subsidiaries (in local currency)7)JTrust Asia
Statement of Profit or Loss (unaudited)
43
FY03/2019(Total)
Q2 FY03/2018
(Total)
YOY (Total)
1Q 2Q 3Q 4Q Difference Difference in %
Operating revenue 8,028 3,940 4,088 16,239 -8,210 -50.6%
Total interest revenue 8,028 3,940 4,088 14,864 -6,835 -46.0%Interest revenue (loans, credit cards, etc.) 8,028 3,940 4,088 2,530 5,498 217.3%
Book value adjustment gain/loss - - - - - -
Interest on securities - - - 12,333 -12,333 -100.0%Total operating revenue other than interest revenue - - - 1,375 -1,375 -100.0%
Guarantee commission received - - - - - -
Gain on sales of securities - - - - - -
Gain on bad debts recovered - - - - - -
Commission revenue - - - - - -
Real estate business sales - - - - - -
General entertainment business sales - - - - - -
Other operating revenue - - - 1,375 -1,375 -100.0%Operating expenses 4,369 49 4,319 1,977 2,391 120.9%Total interest expenses 128 25 103 - 128 -
Interest on deposits - - - - - -
Interest on loans 128 25 103 - 128 -
Interest on bonds - - - - - -
Other interest - - - - - -
Total expenses other than interest 4,240 24 4,216 1,977 2,262 114.4%Loss of sales on securities - - - - - -
Expenses related to bad debts 4,216 - 4,216 - 4,216 -
Other sales costs - - - - - -
Other operating expenses 24 24 0 1,977 -1,953 -98.8%SG&A expenses 7,222 1,607 5,615 1,034 6,188 598.2%
Personnel expenses 785 375 409 781 3 0.5%
Depreciation 35 17 17 42 -7 -18.2%
Other SG&A expenses 6,402 1,214 5,188 210 6,192 -
Other revenue 0 0 0 - 0 -
Other expenses 21 - 21 1 19 -
Operating profit -3,584 2,283 -5,867 13,225 -16,809 -
Financial revenue 13,576 12,079 1,497 88 13,488 -
Financial expenses 3,024 910 2,113 8,374 -5,349 -63.9%
Income from Equity Investment Methods - - - - - -
Losses from Equity Investment Methods - - - - - -
Profit (loss) before taxes 6,967 13,451 -6,484 4,939 2,028 41.1%
Income tax 239 41 198 1,401 -1,161 -82.9%
Profit (loss) 6,727 13,410 -6,682 3,538 3,189 90.2%
ROA(Annualized)※1(%) 3.48% 13.99% -6.62% 1.59% 1.89% -
(Unit:1,000 SGD)IFRS
※1 ROA=Profit (loss) ÷ Total assets(%)※Total assets=(beginning assets + ending assets) ÷ 2