Q2 Report 2011 - Hammond Power Solutions · 2017-03-21 · Q2 Report 2011 F or the six months ......
19
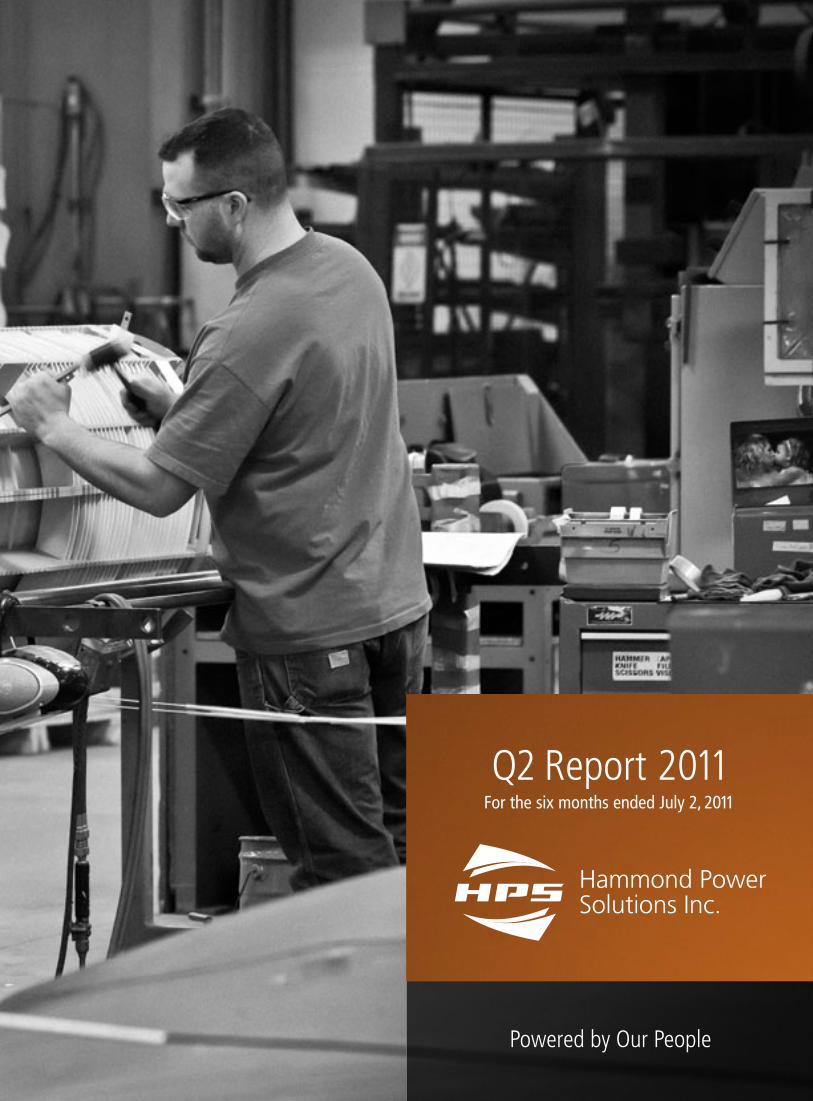
Powered by Our People Q2 Report 2011 For the six months ended July 2, 2011
Transcript of Q2 Report 2011 - Hammond Power Solutions · 2017-03-21 · Q2 Report 2011 F or the six months ......
Powered by Our People
Q2 Report 2011 For the six months ended July 2, 2011

Letter to shareholders 3
Mangement’s Discussion & Analysis 4
Selected Annual and Quarterly Financial Information 14
Consolidated Statement of Financial Position 15
Consolidated Statement of Income 16
Consolidated Statement of Comprehensive Income 17
Consolidated Statement of Changes in Equity 18
Consolidated Statement of Cash Flows 19
Notes to Consolidated Financial Statements 20
William G. HammondChairman of the Board & Chief exeCutive offiCer
Fellow Shareholders,Hammond Power Solutions Inc. (“HPS”) has come through a more challenging quarter than expected over the last three months and unfortunately we missed both our sales and profit targets for the quarter. Surprisingly, sales in Canada missed our target by 10% and were the primary reason for our shortcomings in Quarter 2, 2011. A very wet spring and late start to the construction season across the country delayed start up and completion of many projects in Manitoba, Ontario, and Quebec. U.S. sales growth in the quarter was also lower than expected because of economic, financial and geopolitical events beyond our control.
Despite our miss in Canadian sales during the quarter, we remain very positive about our sales momentum for the remaining half of 2011. Overall our bookings are 20% higher than the same quarter in 2010, with Canadian bookings up 13% and U.S. bookings up 16%. At the end of June, our total backlog of business is approximately 23% higher than at the end of Quarter 2, 2010. We continue to see expanding and sustainable growth coming from our distributor channel as well as our OEM’s (“Original Equipment Manufacturers”) serving the global economy. As a result, we remain guardedly optimistic about our performance going forward.
At the same time, our gross margins in the United States are beginning to climb after sluggish numbers in the first two quarters of 2011. Until recently, we have been unable to recover all material cost increases through price increase given the very competitive nature of the U.S. market, particularly in the commercial construction market. However through perseverance and a willingness to lose unprofitable business, we have been able to implement price increases of the magnitude that we need to recover our cost increases.
The global economy was weaker in the second quarter than expected, and a number of unplanned situations like the Japanese natural disaster, a worsening debt crisis in Europe, and even a very wet spring all contributed to this. We are disappointed that our results couldn’t have been better given the positive momentum building in the first quarter. However, in both good times and in bad our job is to deliver the positive results our Shareholders expect. Although we are not satisfied with some of our results we remain confident that HPS will deliver respectable financial results in the remaining quarters, especially in light of the continuing economic and
financial challenges that the world still faces. U
H a m m o n d P o w e r S o l u t i o n S | Q 2 r e P o r t 3Q 2 R e p oQ 2 R e p o RR tt || H a m m o n d H a m m o n d pp o w eo w e RR S o l u t i o n S o l u t i o n SS2
DOLLARS IN THOUSANDS UNLESS OTHERWISE STATEDManagement’s Discussion & Analysis – Second Quarter 2011
Overview
Hammond Power Solutions Inc. (“HPS” or the “Company”) is the North American leader for the design and manufacture of custom electrical engineered magnetics, as well as a leading manufacturer of standard electrical dry-type transformers. Advanced engineering capabilities, high quality products, and fast responsive service to customers’ needs have established the Company, as a technical and innovative leader in the electrical and electronic industries. The Company has manufacturing plants in Canada, the United States (“U.S.”), Mexico and Italy.
The following is Management’s Discussion and Analysis of the Company’s consolidated operating results for the three and six months ended July 2, 2011, and should be read in conjunction with the unaudited interim Consolidated Financial Statements of the Company for the second quarter of Fiscal 2011. The Company assumes that the reader of this MD&A has access to and has read the audited annual consolidated financial statements and MD&A of the Company, contained in our 2010 Annual Report, and accordingly, the purpose of this document is to provide a second quarter update to the information contained in the Fiscal 2010 MD&A. Starting Quarter 1, 2011 all amounts for 2011 and 2010 are reported under IFRS ( “International Financial Reporting Standards”) All amounts in this report are expressed in thousands of Canadian dollars except share information and unless otherwise noted. These documents and other information relating to the Company may be found on SEDAR’s website at www.sedar.com.
Caution regarding forward looking information
Our MD&A contains forward-looking information that reflects the current expectations of Management about the future results, performance, achievements, prospects or opportunities for HPS and the transformer business. These statements generally can be identified by use of forward looking words such as “may”, “will”, “expect”, “estimate”, “anticipate”, “believe”, “project”, “should” or “continue” or the negative thereof or similar variations. Forward-looking statements are based upon a number of assumptions and are subject to a number of known and unknown risks and uncertainties, many of which are beyond Company control that could cause actual results to differ materially from those that are disclosed in or implied by such forward-looking statements.
We do not have an intention to update any forward-looking information, except as required by applicable securities laws. Any forward-looking information contained in our MD&A represents our views as of the date of this document and such information should not be relied upon as representing our views as of any date subsequent to the date of this document. There can be no assurance that any forward-looking information will prove to be accurate, as actual results and future events could differ materially from those expected or estimated in such statements. Accordingly, readers should not place undue reliance on any such forward-looking information. For a list of factors that could affect HPS see “risk factors” highlighted in materials filed with the securities regulatory authorities in Canada from time to time.
Non-GAAP measures
This document uses the terms “earnings from operations” which represents earnings before other income and expenses and income taxes. “EBITDA” is also used and is defined as earnings before interest, taxes, depreciation and amortization. Operating earnings and EBITDA are some of the measures the Company uses to evaluate the operational profitability. The Company presents EBITDA to show its performance before interest, taxes and depreciation and amortization. Management believes that HPS shareholders and potential investors in HPS use non-GAAP financial measures, such as operating earnings and EBITDA, in making investment decisions about the Company and to measure its operational results. A reconciliation of EBITDA to earnings from operations for the quarters ending July 2, 2011 and July 3, 2010 is contained in the MD&A. EBITDA should not be construed as a substitute for net income determined in accordance with GAAP. “Order bookings” represent confirmed purchase orders for goods or services received from our customers. “Backlog” represents all unshipped customer orders. “Book value per share” is the total shareholders’ equity divided by the average outstanding shares. The terms “earnings from operations” “EBITDA”, “adjusted EBITDA”, “order bookings”, “backlog” and “book value per share” do not have any standardized meaning prescribed within GAAP and therefore may not be comparable to similar measures presented by other companies.
In February 2008, the Accounting Standards Board of the Canadian Institute of Chartered Accountants (“CICA”) affirmed its intention to replace Canadian GAAP with International Financial Reporting Standards (“IFRS”). The Company has now adopted IFRS effective the Quarter 1, 2011 Interim Financial Statements and 2010 comparative data.
Sales
Sales for the quarter-ended July 2, 2011 were $52,330 up $1,510 or 3.0% from the comparative quarter last year, and were higher by $10,014 or 10.5% year-to-date, finishing at $105,107 compared to $95,093 last year. Due to an increase in new order booking activity from the same quarter last year, sales in the United States stated in U.S. dollars (“USD”) were $31,258 in Quarter 2, 2011 an increase of $830 or 2.7% from Quarter 2, 2010. Year-to-date sales in the U.S. were $61,186, an increase of $3,582 or 6.2%, when compared to $57,604 last year-to-date.
A 6.4% stronger Canadian dollar ($1.00 USD = $.977 CA in Quarter 2, 2011 compared against $1.00 USD = $1.04 CA in Quarter 2, 2010) had a an impact on the amount of stated sales for the U.S. this quarter as compared to Quarter 2, 2010. On a year-to-date comparison basis, the Canadian dollar is higher by 5.2% ($1.00 USD = $.977 CA versus $1.00 USD = $1.028 CA) over the first six months of last year. This too has impacted the year-to-date sales denominated in U.S. dollars. U.S. dollar sales stated in constant dollars are higher by $853 or 2.7% from the same quarter last year and for year-to-date increased by $7,196 or 12.5%. This growth was primarily fueled by our market expansion activities in the U.S. Canadian sales were $19,011 for the quarter, a decrease over Quarter 2, 2010, of $529 or 2.7% attributed to the delay in projects in the Canadian construction market due to abnormal weather conditions. Canadian sales increased $2,005 or 5.3% year-to-date, finishing at $39,494. The Quarter 2, 2011 sales include sales of $3,083 derived from the Company’s acquisition, Euroelettro S.p.A, in Vicenza, Italy (“EE”). Year-to-date sales derived from EE were $4,425.
The Company continues to grow sales in its strategic markets, geographically and as well has seen a moderate improvement in overall market activity in the electrical industry in the U.S. and Canada as evidenced by increased quotation and order booking activities. The Company’s focus on custom engineered and competitive product design and consistent quality will promote market growth.
Quarter 2, 2011 sales by geographic segment include U.S. sales of 57.8% of our total sales, Canadian sales of 36.3% and European sales of 5.9%. Year-to-date, 58.2% of the Company’s sales were generated in the U.S., 37.6% in Canada and 4.2% within Europe.
For the year, HPS sales increased in both Canada and the U.S. electrical markets, while the European market continues to remain flat. The mining, capital equipment, specialty transformer and catalog markets in both Canada and the U.S yielded increased sales in Quarter 2, 2011 compared against Quarter 2, 2010. Quotation and order activity in the OEM market segment has increased. Despite the negative effects of a stronger Canadian dollar and Canadian project delays, HPS still delivered increased sales in the quarter.
The Company is steadfast in its implementation of channel growth initiatives in strategic market segments in the U.S., Canada, and Europe. The Company is committed to producing premium quality transformers, and competitive custom engineered designs and to offering a broad and evolving product range. We expect that this, combined with our capabilities in custom product design, manufacturing agility, competitive lead-times, product breadth, uncompromised quality, and geographically diverse manufacturing capabilities will produce sales growth through existing and new customer sales.
The Company is steadfast in its implementation of its market share growth and channel expansion strategies in U.S., Canada and Europe. This, combined with our strong distribution channel, broad product offering and our multinational manufacturing capabilities, will continue to be a competitive advantage and the cornerstone to our revenue and profit growth.
Order Bookings and Backlog
Our sales growth initiatives combined with better market conditions have produced excellent booking rates resulting in a 20.0% increase in Quarter 2, 2011 bookings as compared to Quarter 2, 2010. By channel, booking levels were 38.6% higher on a direct basis and grew 2.0% through our distributor channel, as compared to Quarter 2, 2010 and on a year-to-date basis were 36.3% higher through the direct channel and 17.7%) better via the distributor channel when compared to year-to-date 2010. The growth above is inclusive of bookings for our newly acquired company, Euroelettro S.p.A, which had a 3.4% quarterly impact on the bookings increase and a 1.4% impact on the year-to-date increase, almost all through the direct channel. Due to the increased level of bookings our order backlog increased by 21.4% from the Quarter 1, 2011 and increased 23.0% from Quarter 2, 2010.
Currently, many of our customers are feeling more positive about market trends, as they are seeing an increase in their business activity and a longer booking horizon. The Company is very cognizant that it may see some month to month fluctuations in booking rates.
As a result, HPS will see some volatility in booking rates and anticipates a trend of higher order bookings year-over-year.
Gross Margins
The Company’s gross margin rates were primarily impacted by negative selling price pressures, and the detrimental impact that a stronger Canadian dollar has on U.S. resale margins. These influences resulted with Quarter 2, 2011 gross margin rates finishing at 22.9% versus 24.8% in Quarter 2, 2010 a decrease of 1.9% of sales. Second Quarter 2011 gross margin rates were further eroded by higher copper raw material costs and increased labour costs. Competitive pricing pressures have slowed down the implementation of our selling price increases. This resulted in lower than anticipated gross margin rates as we were unable to recoup all of our cost increases, through corresponding selling price increases within the Quarter. Gross margin rates will benefit from implemented market specific price increases in the second half of the year.
On a year-to-date basis, gross margin rates were 23.6% compared to 25.7% in 2010, down 2.1% of sales. Quarter 2, 2011 gross margin rates were hampered by a 6.4% stronger Canadian dollar as compared to Quarter 2, 2010. This negatively impacts
gross margin rates on Canadian manufactured products sold in the U.S. The Company continues to experience negative selling price pressures from many of our competitors due to the available excess capacity in the industry. Margins were positively impacted through internally driven cost reductions, the
H a m m o n d P o w e r S o l u t i o n S | Q 2 r e P o r t 5Q 2 R e p o R t | H a m m o n d p o w e R S o l u t i o n S4

DOLLARS IN THOUSANDS UNLESS OTHERWISE STATEDManagement’s Discussion & Analysis – Second Quarter 2011
favorable impact of a stronger Canadian dollar on our U.S. sourced raw material purchases in Canada and material procurement cost reductions contributed approximately 1.3% to margin rates. Despite the unpredictable economic climate, the Company continues to implement its capacity expansion projects during the year. In the short-term, the additional fixed costs associated with the expansion are dilutive to our net margin rates. As sales grow the favourable impact that higher manufacturing throughput will have on absorption of our factory overheads will positively affect margin rates. This will better match manufacturing capacity requirements to anticipated future booking rates. The Company is focused on productivity improvements, cost reductions and lead-time improvements throughout the organization.
The Company is confident that these actions combined with increased sales and higher manufacturing throughput will enhance margin rates.
Selling and Distribution Expenses
Total selling and distribution expenses were $5,506 in Quarter 2, 2011 versus $4,889 in Quarter 2, 2010 an increase of $617 or 12.6%. Year-to-date, selling and distribution costs were $10,893 versus $9,425 in 2010, an increase of $1,468 or 15.6%. The Quarter 2, 2011 selling and distribution expenses also include an additional $339 or 0.6% of total sales, pertaining to EE and on a year-to-date basis total selling costs related to EE were $465 or 0.4% of total sales. Excluding EE, Quarter 2, 2011 expenses were $5,167 in Quarter 2, 2011 versus $4,889 in Quarter 2, 2010 an increase of $278 or 5.7% and year-to-date, selling costs were $10,428 versus $9,425 in 2010, an increase of $1,003 or 10.6%.
Commission expenses for the quarter were higher by $173 and year-to-date increased $428. The higher commission expense is due to increased sales. There was also an increase in salaries of $149 for the quarter and $223 year-to-date, associated with strategic hires to support our sales strategies. Freight expenses for the quarter increased $66 and are up $457 year-to-date due to higher sales and increased transportation costs due to higher gasoline prices.
General and Administrative Expense
The general and administrative expenses for Quarter 2, 2011 totaled $4,764, an increase of $395 or 9.0% when compared to Quarter 2, 2010 costs of $4,369. Year-to-date, general and administrative costs are higher by $1,359 or 16.7%, totaling $9,511 when compared to $8,152 for 2010. For the quarterly comparison the increase can be attributed to additional general and administrative costs related to EE totaling $488. For the year-to-date change, the additional costs related to EE, were $641. There were increases in stock option expenses of $137, costs related to the company’s ongoing acquisition activities and engineering costs, most related to R&D, of $339. Excluding EE, Quarter 2, 2011 expenses were $4,276 in Quarter 2, 2011 versus $4,369 in Quarter 2, 2010 a decrease of $93 or 2.1% and year-to-date general and administrative expenses were $8,870 versus $8,152 in 2010, an increase of $718 or 8.8%.
The Company continues with its people resource investment, specifically in the areas of information services and engineering. HPS is in a growth period and is increasing its general and adminstrative expense investment in support of its strategic growth initiatives, but remains
very cognizant of prudent general and adminstrative expense expense management.
Earnings from Operations
The earnings from operations are reflective of a period of extreme volatility and of a company in transitional growth. Earnings from operations for the quarter continue to be impacted by lower gross margin rates due to the lower U.S. dollar, competitive price pressures and increased selling and distribution and general and administrative expenses.
This resulted in a decrease in earnings from operations of $1,635 or 48.6% from the same quarter last year, finishing at $1,726 in the quarter, as compared to $3,361 in Quarter 2, 2010. On a year-to-date basis, earnings from operations were $4,395 versus $6,867 for the same period of 2010, a decrease of $2,472 or 36.0%.
Interest Expense
The interest expense for Quarter 1, 2011 finished at $77 compared to $24 in Quarter 2, 2010 an increase of $53. Year-to-date interest cost was $107, an increase of $46 when compared to year-to-date 2010 expense of $61. The increase in interest expense for the quarter and year-to-date is a result of higher operating debt levels related to the assumption of debt as a result of the purchase of EE. Interest expense includes all bank fees.
Foreign Exchange Gain / Loss
The foreign exchange loss in Quarter 2, 2011 was $180 compared to a foreign exchange loss of $1,378 in Quarter 2, 2010. For the first six months of 2011 the exchange loss of $482 was compared to a foreign exchange loss of $305 for the same period of 2010. The Company’s hedging strategy for 2010 included forward foreign exchange contracts to hedge Balance Sheet translational losses. Under IFRS, the Balance Sheet translational gains and losses are now recognized within Other Comprehensive Income in retained earnings, and the transactional gains derived from forward exchange contracts of $1,170 remain in the consolidated statement of income. Due to this change in accounting treatment in that translation gains and losses are now recorded under Other Comprehensive Income under IFRS, HPS’ hedging strategy for 2011 does not include the utilization of forward foreign exchange contracts to hedge against U.S. dollar Balance Sheet translational gains and losses.
Income Taxes
Quarter 2, 2011 income tax expense was $754 as compared to $750 in Quarter 2, 2010 an increase of $4 or 0.5% and was $1,488 year-to-date versus $2,283 last year, a decrease of $795 or 34.8%, as a result of lower income before income tax. Compared to Quarter 2, 2010 the tax rate is higher this quarter as the Company is now subject to Italian minimum tax requirements for its new subsidiary, EE.
The long term future tax assets and liabilities, consisting mainly of reserves and allowances, are related to temporary differences on current assets and liabilities which are not deductible against current year earnings. The long-term future tax assets and liabilities relate to temporary differences resulting from intangible assets and the difference between the net book value and undepreciated capital cost of property, plant and equipment.
Net Earnings
Net earnings for Quarter 2, 2011, decreased by $488 or 41.7%, finishing at $682 compared to $1,170 in Quarter 2, 2010. On a year-to-date basis net earnings finished at $2,253 a decrease of $1,893 when compared to year-to-date 2010 net earnings of $4,146.
EBITDA for Quarter 2, 2011 was $2,876 versus $3,062 in Quarter 2, 2010 a decrease of $186 or 6.1% and year-to-date totaled $ 6,456 versus $8,676 for the first six months of 2010 a change of $2,220 or 25.6%. Adjusted for foreign exchange losses EBITDA for Quarter 2, 2011 was $3,056 versus $4,440 in Quarter 2, 2010 a decrease of $1,384 or 31.2% and year-to-date adjusted EBITA totaled $6,938 compared to $8,981, a decrease of $2,043 or 22.7%.
EBITDA and adjusted EBITDA is calculated as outlined in the following table:
(tabular amounts in thousands of dollars) Quarter 2 2011 Quarter 2 2010 Year-to-date 2011 Year-to-date 2010
Net earnings $ 682 $ 1,170 $ 2,253 $ 4,146
Add:
Interest expense $ 77 $ 24 $ 107 $ 61
Income tax expense $ 754 $ 750 $ 1,488 $ 2,283
Depreciation and amortization $ 1,363 $ 1,118 $ 2,608 $ 2,186
EBITDA $ 2,876 $ 3,062 $ 6,456 $ 8,676
Add (Deduct):
Foreign Exchange Losses $ 180 $ 1,378 $ 482 $ 305
Adjusted EBITDA $ 3,056 $ 4,440 $ 6,938 $ 8,981
H a m m o n d P o w e r S o l u t i o n S | Q 2 r e P o r t 7Q 2 R e p o R t | H a m m o n d p o w e R S o l u t i o n S6

DOLLARS IN THOUSANDS UNLESS OTHERWISE STATEDManagement’s Discussion & Analysis – Second Quarter 2011
Summary of Quarterly Financial Information (Unaudited)
Fiscal 2011 Quarters (Stated Per IFRS) Q1, 2011 Q2, 2011 Year-to-date Total
Sales $ 52,777 $ 52,330 $ 105,107
Net earnings $ 1,571 $ 682 $ 2,253
Earnings per share – basic $ 0.14 $ 0.06 $ 0.20
Average U.S. to Canadian exchange rate $ 0.986 $ 0.967 $ 0.977
Fiscal 2010 Quarters (Stated Per IFRS) Q1, 2010 Q2, 2010 Q3, 2010 Q4, 2010 Total
Sales $ 44,273 $ 50,820 $ 47,903 $ 47,608 $ 190,604
Net earnings $ 2,976 $ 1,170 $ 2,250 $ 4,256 $ 10,652
Earnings per share – basic $ 0.25 $ 0.10 $ 0.20 $ 0.37 $ 0.92
Average U.S. to Canadian exchange rate $ 1.041 $ 1.028 $ 1.039 $ 1.013 $ 1.030
Fiscal 2009 Quarters (Stated Per GAAP) Q1, 2009 Q2, 2009 Q3, 2009 Q4, 2009 Total
Sales $ 54,845 $ 48,203 $ 43,768 $ 48,621 $ 195,437
Net earnings $ 4,242 $ 472 $ 57 $ 4,860 $ 9,631
Net earnings per share – basic $ 0.36 $ 0.04 $ 0.01 $ 0.41 $ 0.82
Average U.S. to Canadian exchange rate $ 1.245 $ 1.175 $ 1.103 $ 1.058 $ 1.145
Historically the first quarter of the Company’s fiscal year has lower revenues due to a general decline in activity in the construction industry and overall electrical markets as many projects are just getting underway at the start of the year. There was an exception in Quarter 1, 2009 as the Company ended a very robust 2008, and there was an unusually high order backlog just prior to the collapse of the electrical markets in North America. The sales decline can be noted starting in Quarter 2, 2009. Sales in Quarter 2, 2011 have shown an increase over the prior year as general business activity was moderately improved over Quarter 2, 2010 and also includes the sales and financial results of EE. The year-to-year quarterly fluctuations in both sales and income are affected by the changes in the U.S. to Canadian foreign exchange rates, changing economic conditions, and competitive pricing pressures.
Capital Resources and Liquidity
Net cash used in operating activities for Quarter 2, 2011 was $6,504 versus cash provided of $2,012 in Quarter 2, 2010 a difference of $8,516. Year-to-date cash used from operations was $9,061 compared to 2010 cash provided of $3,619 a change of $12,680.
Change in non-cash operating working capital was an increase in usage of cash of $8,334 compared to an increase usage of cash of $122 for the same quarter last year resulting in an overall increase difference of $8,212. Quarter 2, 2011 usage was primarily a net result of an increase in inventory of $1,879 due to increased warehouse stocking levels in the U.S., a rise in accounts receivable of $7,297 which was primarily caused by a postal service interruption in Canada and extended payment terms with several of our key customers and an increase in accounts payable of $1,976. For the first six months of 2011, the change in non cash working capital was a net usage of cash of $13,518, as compared to a net usage of cash in working capital of $3,402 in the first six months of 2010, an increase in cash usage of $10,116. For comparison purposes on a year-to-date basis, excluding the working capital impact of EE, accounts receivable has increased by $6,815, inventories increased by $3,217 as a result of a planned increase to finish goods in order to improve our customer service level necessitated by increased demand and accounts payable decreased by $2,175.
The Company continues to focus on its customer accounts receivable collections cycle time and inventory turnover rates in 2011. Capital expenditures were $1,260 in Quarter 2, 2011 compared to $1,689 for Quarter 2, 2010 a decrease of $429 and on a year-to-date basis were
$1,667 compared to $2,620 in 2010 a decrease of $953. Investment areas of our capital expenditure program in the quarter included expansion of our manufacturing capacity, the establishment of a new research and development test lab, productivity improvement projects, Enterprise Resource Planning software investment and information technology infrastructure. Total cash provided by financing activities for Quarter 2, 2011 was $3,074 as compared to cash used of $1,302 in Quarter 2, 2010. There was a Quarter 2, 2011 increase in advances from bank operating lines of $3,642 versus a reduction of $928 in Quarter 2, 2010. During the first six months of 2011, cash provided from financing activities totaled $2,159 versus cash used in 2010 of $3,183. In 2011, year-to-date bank operating lines increased $2,137 compared to 2010 where they decreased by $2,784.
Bank operating lines of credit finished Quarter 2, 2011 at $6,594 compared to $1,241 at the end of Quarter 2, 2010 an increase of $5,353. The Company’s overall debt, net of cash was $7,520 in Quarter 2, 2011 compared to a net cash position of $10,626 in Quarter 2, 2010, a reduction
in cash position of $18,146. The major contributing factors to this was the purchase of Euroelettro S.p.A. for $7,786 plus the assumed debt of $6,573 and the change in non-cash working capital described above.
All bank covenants continue to be met as at July 2, 2011.HPS remains well financed, as it has a $25,000,000 U.S. revolving credit facility and a $15,000,000 U.S. delayed draw credit facility available to the
Company with JP Morgan Chase Bank, N.A. which provides financing for our operational requirements, and capital for our strategic initiatives.The Company will utilize its cash generated from operations combined with the existing available credit facilities to finance the ongoing business
operational cash requirements for working capital, capital expenditures and investing activities going forward.
Contractual Obligations
(tabular amounts in thousands of dollars) 2011 2012 2013 2014 2015 Thereafter Total
Operating Leases $ 723 $ 923 $ 783 $ 455 $ 118 – $ 3,002
Accounts payable and accrued liabilities $ 30,942 – – – – – $ 30,942
Capital expenditure purchase commitments $ 1,252 – – – – – $ 1,252
Total $ 32,917 $ 923 $ 783 $ 455 $ 118 – $ 35,196
Contingent Liabilities
Management is not aware of any contingent liabilities.
Controls and Procedures
The Chief Executive Officer and the Chief Financial Officer are responsible for establishing and maintaining disclosure controls and procedures and for establishing and maintaining adequate internal controls over financial reporting. The control framework used in the design of disclosure controls and procedures and internal control over financial reporting is the internal control integrated framework issued by the Committee of Sponsoring Organizations of the Treadway Commission (COSO Framework). Our internal control system was designed to provide reasonable assurance to our Management and Board of Directors regarding the preparation and fair presentation of published financial statements in accordance with generally accepted accounting principles. All internal control systems, no matter how well designed, have inherent limitations. Therefore, even those systems determined to be effective can provide only reasonable assurance with respect to financial statement preparation and presentation.
During Quarter 2, 2011 there were no material changes identified in HPS’ internal controls over financial reporting that had materially affected, or was reasonably likely to materially affect, HPS’ internal control over financial reporting. HPS does carry out ongoing improvements to its internal controls over financial reporting but nothing considered at a material level.
The Company acquired EE on March 15, 2011 and has included the financial results of EE as part of HPS’ consolidated financial results as of March 1, 2011 for administrative convenience. Management has not yet fully assessed the design or operating effectiveness of EE’s disclosure controls and procedures and internal controls over financial reporting.
International Financial Reporting Standards
IFRS 9 introduces new classification and measurement requirements for financial assets and financial liabilities that are within the scope of International Accounting Standards (“IAS”) 39 Financial Instruments: Recognition and Measurement. Specifically, IFRS 9 requires all financial assets to be classified and subsequently measured at amortized cost using the effective interest method or at fair value through profit or loss (“FVTPL”). Upon initial recognition, an entity may designate a financial liability as measured at FVTPL when permitted or when doing so results in more relevant information.
IFRS 11 replaces the guidance in IAS 31, Interest in Joint Ventures, and classifies join arrangements as either joint operations or joint ventures. Under IFRS 11 joint ventures will no longer be able to be accounted for using proportionate consolidate and will be required to use the equity method.
IFRS 12 is a comprehensive standard on disclosure requirements for all forms of interests in other entities and is designed to provide information to evaluate the nature of and the risks associates with an entity’s interest in other entities, and the effects of those interests on the entity’s financial position, financial performance and cash flows.
H a m m o n d P o w e r S o l u t i o n S | Q 2 r e P o r t 9Q 2 R e p o R t | H a m m o n d p o w e R S o l u t i o n S8
DOLLARS IN THOUSANDS UNLESS OTHERWISE STATEDManagement’s Discussion & Analysis – Second Quarter 2011
IAS 28 (2011) carries forward the requirements of IAS 28 (2008) Investments in Associates with limited amendments.The International Accounting Standards Board has issues IFRS 13 effective for annual periods beginning on or after January 1, 2013 with early adoption
permitted. IFRS 13 replaces the fair value measurement guidance. It established a framework fro measure fair value and sets out disclosure requirements for fair value measurements. The Company intends to adopt IFRS 13 in its financial statements for the annual period beginning on January 1, 2013.
The Company intends to adopt these standards and the amendment to the standards noted above in its financial statements for the annual period beginning on January 1, 2013. The company does not expect these to have a material impact on the financial statements.
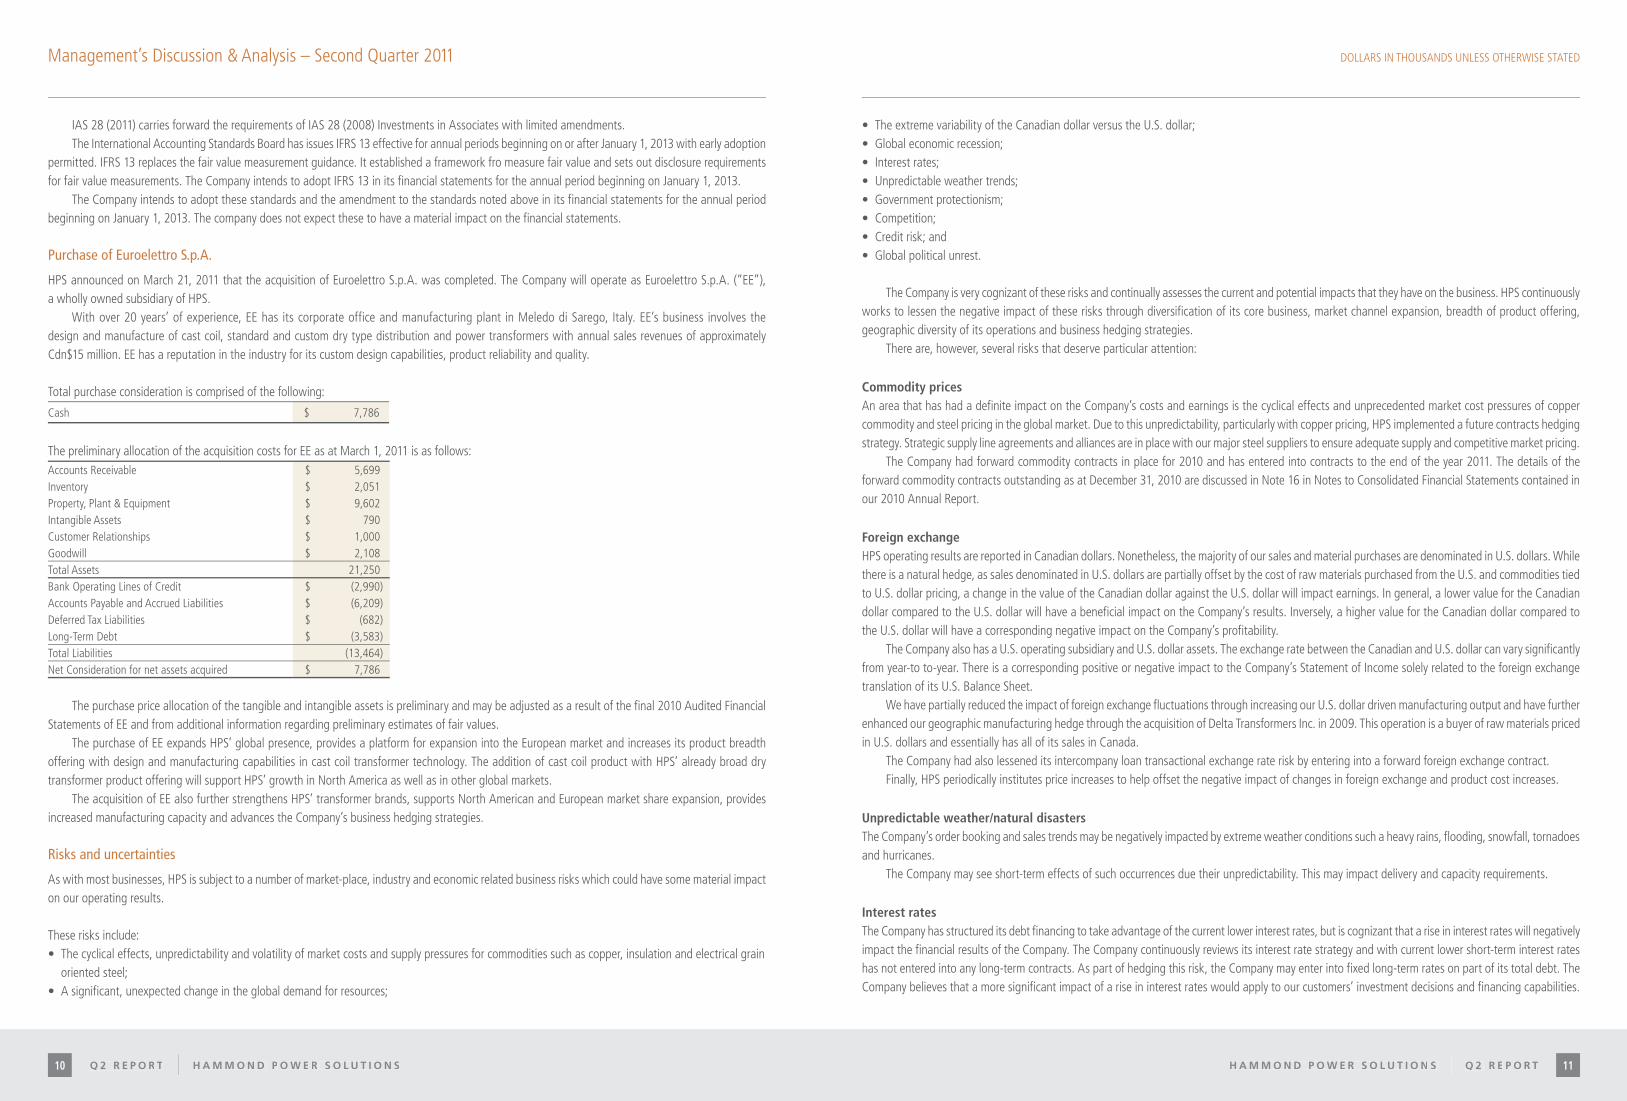
Purchase of Euroelettro S.p.A.
HPS announced on March 21, 2011 that the acquisition of Euroelettro S.p.A. was completed. The Company will operate as Euroelettro S.p.A. (“EE”), a wholly owned subsidiary of HPS.
With over 20 years’ of experience, EE has its corporate office and manufacturing plant in Meledo di Sarego, Italy. EE’s business involves the design and manufacture of cast coil, standard and custom dry type distribution and power transformers with annual sales revenues of approximately Cdn$15 million. EE has a reputation in the industry for its custom design capabilities, product reliability and quality.
Total purchase consideration is comprised of the following:
Cash $ 7,786
The preliminary allocation of the acquisition costs for EE as at March 1, 2011 is as follows:Accounts Receivable $ 5,699Inventory $ 2,051Property, Plant & Equipment $ 9,602Intangible Assets $ 790Customer Relationships $ 1,000Goodwill $ 2,108Total Assets 21,250Bank Operating Lines of Credit $ (2,990)Accounts Payable and Accrued Liabilities $ (6,209)Deferred Tax Liabilities $ (682)Long-Term Debt $ (3,583)Total Liabilities (13,464)Net Consideration for net assets acquired $ 7,786
The purchase price allocation of the tangible and intangible assets is preliminary and may be adjusted as a result of the final 2010 Audited Financial Statements of EE and from additional information regarding preliminary estimates of fair values.
The purchase of EE expands HPS’ global presence, provides a platform for expansion into the European market and increases its product breadth offering with design and manufacturing capabilities in cast coil transformer technology. The addition of cast coil product with HPS’ already broad dry transformer product offering will support HPS’ growth in North America as well as in other global markets.
The acquisition of EE also further strengthens HPS’ transformer brands, supports North American and European market share expansion, provides increased manufacturing capacity and advances the Company’s business hedging strategies.
Risks and uncertainties
As with most businesses, HPS is subject to a number of market-place, industry and economic related business risks which could have some material impact on our operating results.
These risks include:• The cyclical effects, unpredictability and volatility of market costs and supply pressures for commodities such as copper, insulation and electrical grain
oriented steel;• A significant, unexpected change in the global demand for resources;
• The extreme variability of the Canadian dollar versus the U.S. dollar;• Global economic recession;• Interest rates;• Unpredictable weather trends;• Government protectionism;• Competition;• Credit risk; and• Global political unrest.
The Company is very cognizant of these risks and continually assesses the current and potential impacts that they have on the business. HPS continuously works to lessen the negative impact of these risks through diversification of its core business, market channel expansion, breadth of product offering, geographic diversity of its operations and business hedging strategies.
There are, however, several risks that deserve particular attention:
Commodity pricesAn area that has had a definite impact on the Company’s costs and earnings is the cyclical effects and unprecedented market cost pressures of copper commodity and steel pricing in the global market. Due to this unpredictability, particularly with copper pricing, HPS implemented a future contracts hedging strategy. Strategic supply line agreements and alliances are in place with our major steel suppliers to ensure adequate supply and competitive market pricing.
The Company had forward commodity contracts in place for 2010 and has entered into contracts to the end of the year 2011. The details of the forward commodity contracts outstanding as at December 31, 2010 are discussed in Note 16 in Notes to Consolidated Financial Statements contained in our 2010 Annual Report.
Foreign exchangeHPS operating results are reported in Canadian dollars. Nonetheless, the majority of our sales and material purchases are denominated in U.S. dollars. While there is a natural hedge, as sales denominated in U.S. dollars are partially offset by the cost of raw materials purchased from the U.S. and commodities tied to U.S. dollar pricing, a change in the value of the Canadian dollar against the U.S. dollar will impact earnings. In general, a lower value for the Canadian dollar compared to the U.S. dollar will have a beneficial impact on the Company’s results. Inversely, a higher value for the Canadian dollar compared to the U.S. dollar will have a corresponding negative impact on the Company’s profitability.
The Company also has a U.S. operating subsidiary and U.S. dollar assets. The exchange rate between the Canadian and U.S. dollar can vary significantly from year-to to-year. There is a corresponding positive or negative impact to the Company’s Statement of Income solely related to the foreign exchange translation of its U.S. Balance Sheet.
We have partially reduced the impact of foreign exchange fluctuations through increasing our U.S. dollar driven manufacturing output and have further enhanced our geographic manufacturing hedge through the acquisition of Delta Transformers Inc. in 2009. This operation is a buyer of raw materials priced in U.S. dollars and essentially has all of its sales in Canada.
The Company had also lessened its intercompany loan transactional exchange rate risk by entering into a forward foreign exchange contract. Finally, HPS periodically institutes price increases to help offset the negative impact of changes in foreign exchange and product cost increases.
Unpredictable weather/natural disastersThe Company’s order booking and sales trends may be negatively impacted by extreme weather conditions such a heavy rains, flooding, snowfall, tornadoes and hurricanes.
The Company may see short-term effects of such occurrences due their unpredictability. This may impact delivery and capacity requirements.
Interest ratesThe Company has structured its debt financing to take advantage of the current lower interest rates, but is cognizant that a rise in interest rates will negatively impact the financial results of the Company. The Company continuously reviews its interest rate strategy and with current lower short-term interest rates has not entered into any long-term contracts. As part of hedging this risk, the Company may enter into fixed long-term rates on part of its total debt. The Company believes that a more significant impact of a rise in interest rates would apply to our customers’ investment decisions and financing capabilities.
H a m m o n d P o w e r S o l u t i o n S | Q 2 r e P o r t 11Q 2 R e p o R t | H a m m o n d p o w e R S o l u t i o n S10

DOLLARS IN THOUSANDS UNLESS OTHERWISE STATEDManagement’s Discussion & Analysis – Second Quarter 2011
CreditA substantial portion of the Company’s accounts receivable are with customers in manufacturing sectors and are subject to credit risks normal to those industries. Although the Company has historically incurred very low bad debt expense, the current economic conditions increase this exposure.
Global/North American economyGiven the negative economic environment, particularly in North America, we are focusing our efforts over the next twelve months on projects that will increase our cost competitiveness, capacity and improve our manufacturing flexibility. The Company believes that being agile as an organization will become even more important in order to respond quickly to both unexpected opportunities and challenges. We also believe that through our OEM and distributor channels, our growing access to a variety of global and domestic markets will help HPS expand market share during this economic slowdown.
Off-Balance Sheet Arrangements
The Company has no off-Balance Sheet arrangements, other than operating leases disclosed in Notes to the Consolidated Financial Statements contained in our 2010 Annual Report.
Transactions with Related Parties
The Company had no transactions with related parties in Quarter 2, 2011.
Proposed Transactions
While the Company continues to evaluate potential business expansion initiatives and it has no firm transactions as at June 2, 2011.
Financial Instruments
There is a foreign exchange contract in place as a hedge of the intercompany loan from Hammond Power Solutions, Inc., HPS’ U.S. entity and EE. The forward exchange contract is to sell 11,575 Euros at a rate OF 1.4469 U.S., maturing September 30, 2011. There is a foreign exchange contract in place as a hedge of the intercompany receivable from Hammond Power Solutions S.A de C.V. HPS’ Mexican entity to Hammond Power Solutions, Inc., HPS’ U.S. entity. The forward exchange contract is to sell 55,455 MXP at a rate of$.08475 U.S., maturing September 30, 2011.
Critical Accounting Estimates
The preparation of the Company’s consolidated financial statements requires Management to make estimates and assumptions that affect the reported amounts of assets, liabilities, revenues and expenses and the disclosure of contingent assets and liabilities. These estimates are based upon Management’s historical experience and various other assumptions that are believed by Management to be reasonable under the circumstances. Such assumptions and estimates are evaluated on an ongoing basis and form the basis for making judgments about the carrying values of assets and liabilities that are not readily apparent from other sources. Actual results could differ from these estimates. The Company assesses the carrying value of its property, plant and equipment, intangible assets and goodwill every year, or more often if necessary, if it is determined that we cannot recover the carrying value of an asset or goodwill, the unrecoverable amount is written off against current earnings. The Company bases its assessment of recoverability on assumptions and judgments about future prices, demand and manufacturing costs. A material change in any of these assumptions could have a significant impact on the potential impairment and/or useful lives of these assets.
Outstanding Share Data
Details of the Company’s outstanding share data as of July 2, 2011 are as follows:8,804,624 Class A Shares2,778,300 Class B Common Shares11,582,924 Total Class A and B Shares
Strategic Direction and Outlook
HPS continues to expand its core business in both Canada and the U.S. and has been successful at gaining a manufacturing presence in Italy. Although their economies and the electrical market are improving they are still somewhat unpredictable; the Company is very aware of the general global economic decline particularly in North America and Europe, the potential negative impact of a stronger and unpredictable Canadian dollar, and the variability of raw material commodity costs. The Company continues to deal with these deterrents in a deliberate and forthright manner through its operational projects and strategic initiatives.
The Company is not immune to the challenges it faces from these negative influences but is confident that the business fundamentals that it has built will sustain and grow the Company in the future. The Company believes that this is a time to be cautious but not complacent, conservative but progressive. It will be unwavering in its pursuit of improved productivity gains, sales growth from new product development, geographic diversification, capacity expansion and escalation of market share.
The Company is proud of our past achievements and is aware of the cloak of economic pessimism, but we are optimistic about our future opportunities. We are stronger and more capable of enduring economic uncertainty.
HPS showed strong performance across all financial and operational metrics and it is noteworthy that last year’s solid financial performance was realized during a global economic decline.
We will continue to focus our efforts on sustaining profit rates through selling price increases, sales growth, geographic manufacturing dispersion, productivity gains, new product development and market share penetration.
We expect sales growth will be realized in several of our market segments but will remain at a lower level in others. A portion of our sales will come from major customer projects for which the exact timing is hard to predict, thus influencing quarterly sales fluctuations.
HPS is positioned to meet the evolving needs of our traditional markets while becoming a central player in a growing number of emerging and global markets. Our experience, engineering expertise, solid supplier relationships, as well as a unique business perspective gained through our diverse products, customers and markets will be the cornerstone to our success.
We remain attentive in continuing our disciplined cost management initiatives and in bringing quality and value to all stakeholders of the Company. We will deliver solid financial performance, provide a sustainable return to our shareholders and maintain the Balance Sheet strength of the Company.
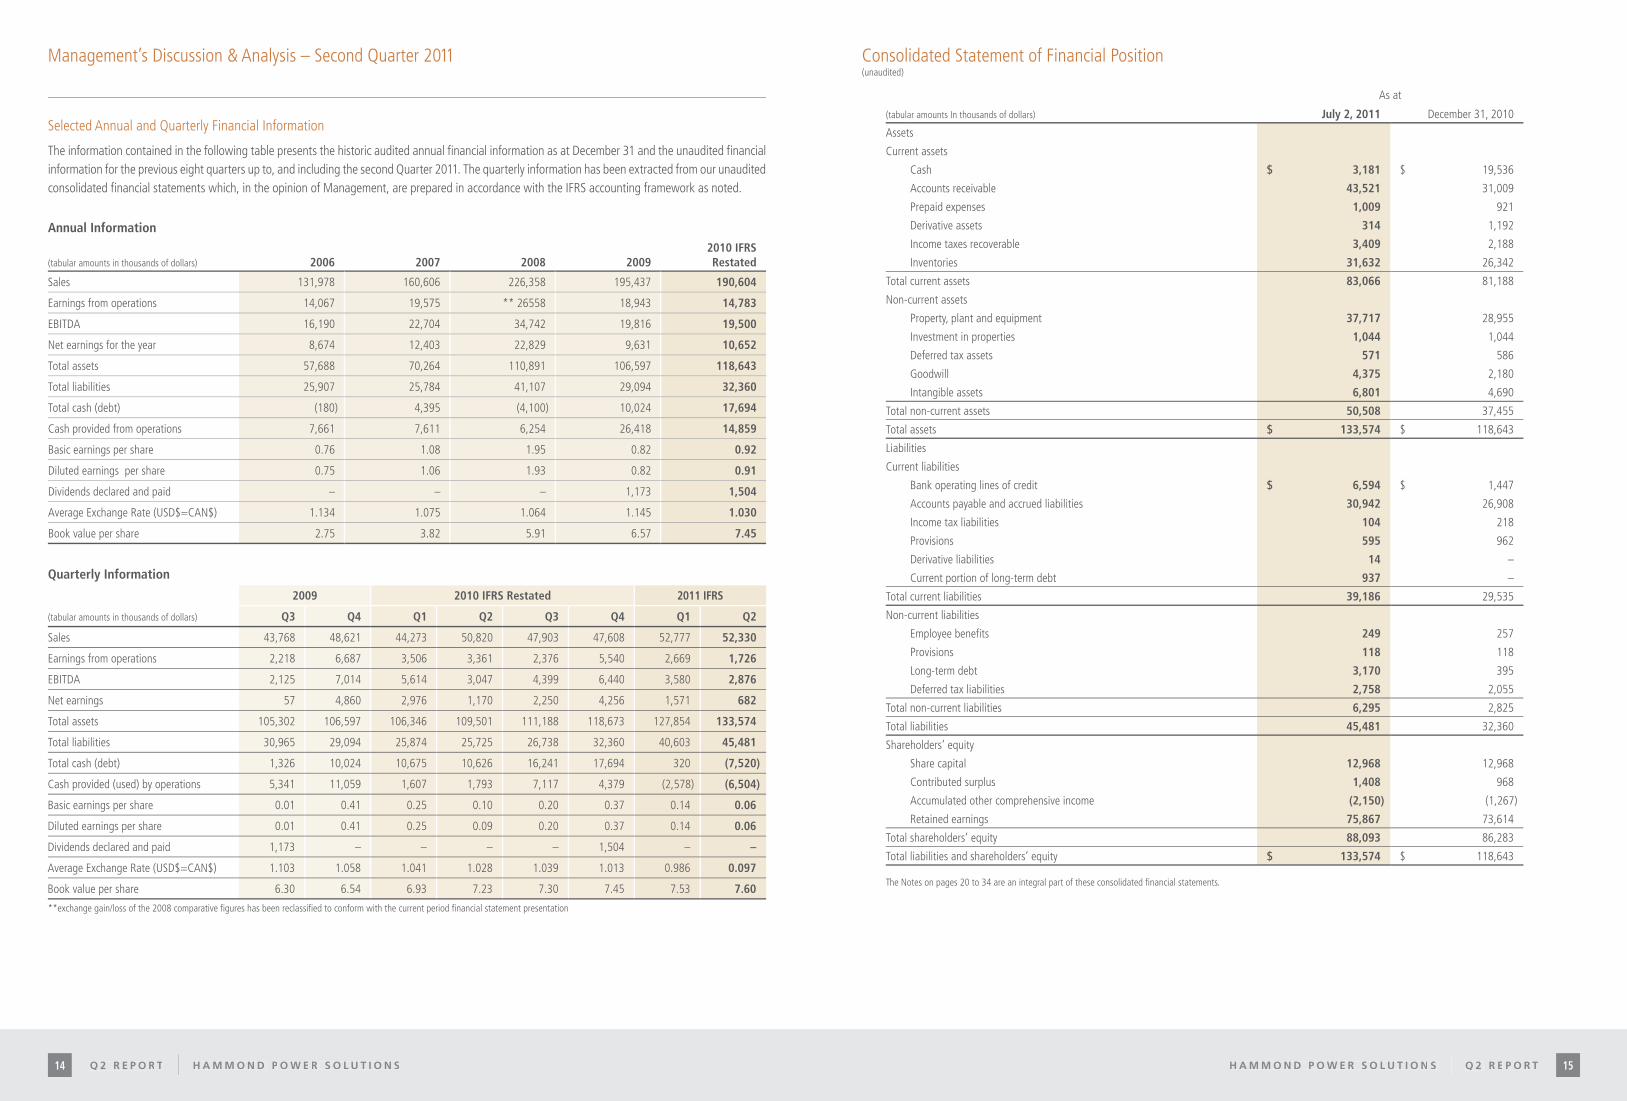
Selected Annual and Quarterly Financial Information
The information contained in the following table presents the historic audited annual financial information as at December 31 and the unaudited financial information for the previous eight quarters up to, and including the Second Quarter 2011. The quarterly information has been extracted from our unaudited consolidated financial statements which, in the opinion of Management, are prepared in accordance with the IFRS accounting framework as noted.
H a m m o n d P o w e r S o l u t i o n S | Q 2 r e P o r t 13Q 2 R e p o R t | H a m m o n d p o w e R S o l u t i o n S12
Management’s Discussion & Analysis – Second Quarter 2011
Selected Annual and Quarterly Financial Information
The information contained in the following table presents the historic audited annual financial information as at December 31 and the unaudited financial information for the previous eight quarters up to, and including the second Quarter 2011. The quarterly information has been extracted from our unaudited consolidated financial statements which, in the opinion of Management, are prepared in accordance with the IFRS accounting framework as noted.
Annual Information
(tabular amounts in thousands of dollars) 2006 2007 2008 20092010 IFRS Restated
Sales 131,978 160,606 226,358 195,437 190,604
Earnings from operations 14,067 19,575 ** 26558 18,943 14,783
EBITDA 16,190 22,704 34,742 19,816 19,500
Net earnings for the year 8,674 12,403 22,829 9,631 10,652
Total assets 57,688 70,264 110,891 106,597 118,643
Total liabilities 25,907 25,784 41,107 29,094 32,360
Total cash (debt) (180) 4,395 (4,100) 10,024 17,694
Cash provided from operations 7,661 7,611 6,254 26,418 14,859
Basic earnings per share 0.76 1.08 1.95 0.82 0.92
Diluted earnings per share 0.75 1.06 1.93 0.82 0.91
Dividends declared and paid – – – 1,173 1,504
Average Exchange Rate (USD$=CAN$) 1.134 1.075 1.064 1.145 1.030
Book value per share 2.75 3.82 5.91 6.57 7.45
Quarterly Information
2009 2010 IFRS Restated 2011 IFRS
(tabular amounts in thousands of dollars) Q3 Q4 Q1 Q2 Q3 Q4 Q1 Q2
Sales 43,768 48,621 44,273 50,820 47,903 47,608 52,777 52,330
Earnings from operations 2,218 6,687 3,506 3,361 2,376 5,540 2,669 1,726
EBITDA 2,125 7,014 5,614 3,047 4,399 6,440 3,580 2,876
Net earnings 57 4,860 2,976 1,170 2,250 4,256 1,571 682
Total assets 105,302 106,597 106,346 109,501 111,188 118,673 127,854 133,574
Total liabilities 30,965 29,094 25,874 25,725 26,738 32,360 40,603 45,481
Total cash (debt) 1,326 10,024 10,675 10,626 16,241 17,694 320 (7,520)
Cash provided (used) by operations 5,341 11,059 1,607 1,793 7,117 4,379 (2,578) (6,504)
Basic earnings per share 0.01 0.41 0.25 0.10 0.20 0.37 0.14 0.06
Diluted earnings per share 0.01 0.41 0.25 0.09 0.20 0.37 0.14 0.06
Dividends declared and paid 1,173 – – – – 1,504 – –
Average Exchange Rate (USD$=CAN$) 1.103 1.058 1.041 1.028 1.039 1.013 0.986 0.097
Book value per share 6.30 6.54 6.93 7.23 7.30 7.45 7.53 7.60
**exchange gain/loss of the 2008 comparative figures has been reclassified to conform with the current period financial statement presentation
Consolidated Statement of Financial Position(unaudited)
As at
(tabular amounts In thousands of dollars) July 2, 2011 December 31, 2010
Assets
Current assets
Cash $ 3,181 $ 19,536
Accounts receivable 43,521 31,009
Prepaid expenses 1,009 921
Derivative assets 314 1,192
Income taxes recoverable 3,409 2,188
Inventories 31,632 26,342
Total current assets 83,066 81,188
Non-current assets
Property, plant and equipment 37,717 28,955
Investment in properties 1,044 1,044
Deferred tax assets 571 586
Goodwill 4,375 2,180
Intangible assets 6,801 4,690
Total non-current assets 50,508 37,455
Total assets $ 133,574 $ 118,643
Liabilities
Current liabilities
Bank operating lines of credit $ 6,594 $ 1,447
Accounts payable and accrued liabilities 30,942 26,908
Income tax liabilities 104 218
Provisions 595 962
Derivative liabilities 14 –
Current portion of long-term debt 937 –
Total current liabilities 39,186 29,535
Non-current liabilities
Employee benefits 249 257
Provisions 118 118
Long-term debt 3,170 395
Deferred tax liabilities 2,758 2,055
Total non-current liabilities 6,295 2,825
Total liabilities 45,481 32,360
Shareholders’ equity
Share capital 12,968 12,968
Contributed surplus 1,408 968
Accumulated other comprehensive income (2,150) (1,267)
Retained earnings 75,867 73,614
Total shareholders’ equity 88,093 86,283
Total liabilities and shareholders’ equity $ 133,574 $ 118,643
The Notes on pages 20 to 34 are an integral part of these consolidated financial statements.
H a m m o n d P o w e r S o l u t i o n S | Q 2 r e P o r t 15Q 2 R e p o R t | H a m m o n d p o w e R S o l u t i o n S14
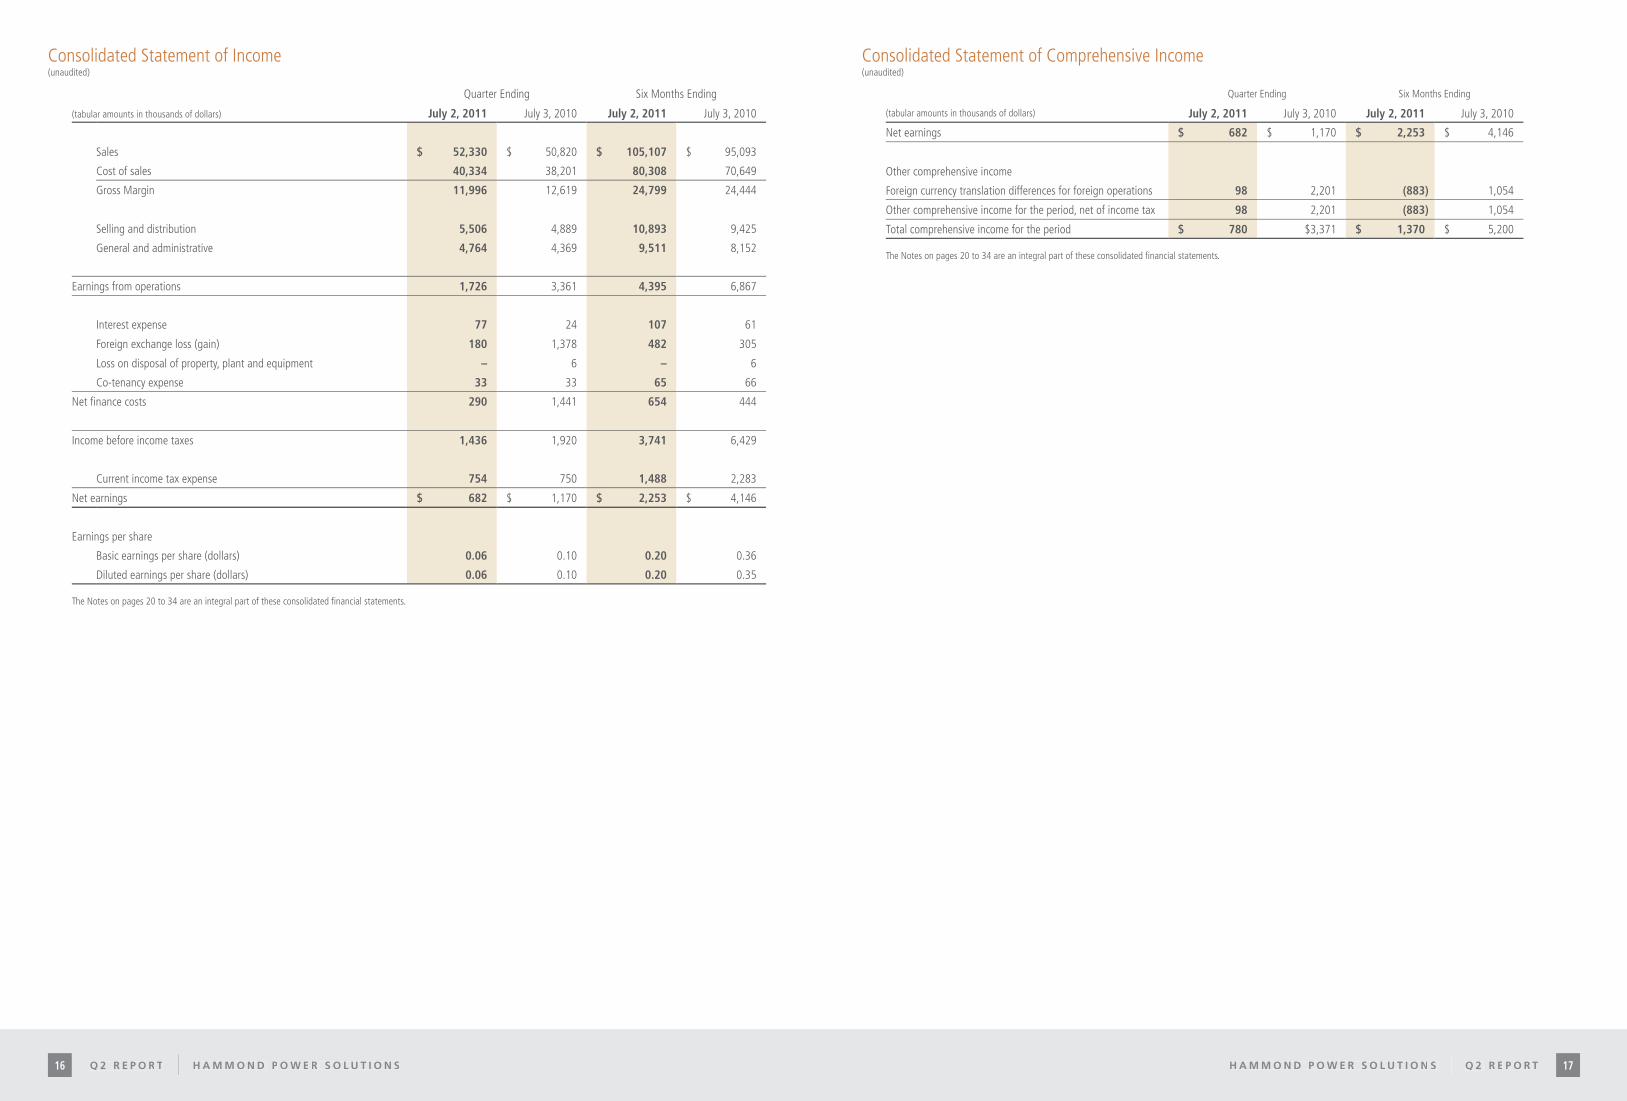
Consolidated Statement of Income(unaudited)
Quarter Ending Six Months Ending
(tabular amounts in thousands of dollars) July 2, 2011 July 3, 2010 July 2, 2011 July 3, 2010
Sales $ 52,330 $ 50,820 $ 105,107 $ 95,093
Cost of sales 40,334 38,201 80,308 70,649
Gross Margin 11,996 12,619 24,799 24,444
Selling and distribution 5,506 4,889 10,893 9,425
General and administrative 4,764 4,369 9,511 8,152
Earnings from operations 1,726 3,361 4,395 6,867
Interest expense 77 24 107 61
Foreign exchange loss (gain) 180 1,378 482 305
Loss on disposal of property, plant and equipment – 6 – 6
Co-tenancy expense 33 33 65 66
Net finance costs 290 1,441 654 444
Income before income taxes 1,436 1,920 3,741 6,429
Current income tax expense 754 750 1,488 2,283
Net earnings $ 682 $ 1,170 $ 2,253 $ 4,146
Earnings per share
Basic earnings per share (dollars) 0.06 0.10 0.20 0.36
Diluted earnings per share (dollars) 0.06 0.10 0.20 0.35
The Notes on pages 20 to 34 are an integral part of these consolidated financial statements.
Consolidated Statement of Comprehensive Income(unaudited)
Quarter Ending Six Months Ending
(tabular amounts in thousands of dollars) July 2, 2011 July 3, 2010 July 2, 2011 July 3, 2010
Net earnings $ 682 $ 1,170 $ 2,253 $ 4,146
Other comprehensive income
Foreign currency translation differences for foreign operations 98 2,201 (883) 1,054
Other comprehensive income for the period, net of income tax 98 2,201 (883) 1,054
Total comprehensive income for the period $ 780 $3,371 $ 1,370 $ 5,200
The Notes on pages 20 to 34 are an integral part of these consolidated financial statements.
H a m m o n d P o w e r S o l u t i o n S | Q 2 r e P o r t 17Q 2 R e p o R t | H a m m o n d p o w e R S o l u t i o n S16

Consolidated Statement of Cash Flows(unaudited)
Six Months Ending
(tabular amounts in thousands of dollars) July 2, 2011 July 3, 2010
Cash flows from operating activities
Net earnings $ 2,253 $ 4,146
Add (deduct) items not involving cash:
Amortization of property, plant and equipment 2,265 1,881
Amortization of intangible assets 343 305
Provisions (367) 882
Interest expense 107 61
Income tax expense 1,488 2,285
Loss on disposal of property, plant and equipment – 6
Stock based compensation expense 440 301
6,529 9,867
Change in non-cash working capital (13,518) (3,402)
Cash (used in)from operating activities (6,989) 6,465
Income tax paid (2,072) (2,846)
Cash (used in) from operating activities (9,061) 3,619
Cash flows from investing activities
Acquisition of subsidiary company (7,786) –
Proceeds on disposal of property, plant and equipment – 2
Acquisition of property, plant and equipment (1,042) (2,552)
Acquisition of intangible assets (625) (68)
Cash used in investing activities (9,453) (2,618)
Cash flows from financing activities
Proceeds from issue of share capital – 12
Share repurchase and cancellation – (350)
Advances (repayment) of borrowings 2,137 (2,784)
Advances of long term debt 129 –
Interest paid (107) (61)
Cash provided by (used in) financing activities 2,159 (3,183)
Decrease in cash (16,355) (2,182)
Cash at beginning of period 19,536 14,049
Cash at end of period $ 3,181 $ 11,867
The Notes on pages 20 to 34 are an integral part of these consolidated financial statements.
Consolidated Statement of Changes in Equity(unaudited)For the six months ended July 2, 2011
Attributable to equity holders of the Company
(tabular amounts in thousands of dollars)
Sharecapital
Contributedsurplus AOCI **
Retainedearnings
Total shareholders’
equity
Balance at January 1, 2011 $ 12,968 $ 968 $ (1,267) $ 73,614 $ 86,283
Total comprehensive income for the period
Profit or loss – – – 2,253 2,253
Other comprehensive income
Foreign currency translation differences – – (883) – (883)
Total other comprehensive income – – (883) – (883)
Total comprehensive income for the period – – (883) 2,253 1,370
Transactions with owners, recorded directly in equity
Share-based payment transactions – 440 – – 440
Share options exercised – – – – –
Total transactions with owners – 440 – – 440
Balance at July 2, 2011 $ 12,968 $ 1,408 $ (2,150) $ 75,867 $ 88,093
**AOCI = Accumulated other comprehensive incomeThe Notes on pages 20 to 34 are an integral part of these consolidated financial statements.
Consolidated Statement of Changes in Equity(unaudited) For the six months ended July 3, 2010
Attributable to equity holders of the Company
(tabular amounts in thousands of dollars)
Sharecapital
Contributedsurplus AOCI **
Retainedearnings
Total shareholders’
equity
Balance at January 1, 2010 $ 12,959 $ 626 – $ 64,998 $ 78,583
Total comprehensive income for the period
Profit or loss – – – 4,146 4,146
Other comprehensive income
Foreign currency translation differences – – 1,054 – 1,054
Total other comprehensive income – – 1,054 – 1,054
Total comprehensive income for the period – – 1,054 4,146 5,200
Transactions with owners, recorded directly in equity
Own shares acquired (44) (2) (304) (350)
Share-based payment transactions – 301 – – 301
Share options exercised 19 (7) – – 12
Total transactions with owners (25) 292 – (304) (37)
Balance at July 3, 2010 $ 12,934 $ 918 $ 1,054 $ 68,840 $83,746
** AOCI = Accumulated other comprehensive income The Notes on pages 20 to 34 are an integral part of these consolidated financial statements.
H a m m o n d P o w e r S o l u t i o n S | Q 2 r e P o r t 19Q 2 R e p o R t | H a m m o n d p o w e R S o l u t i o n S18
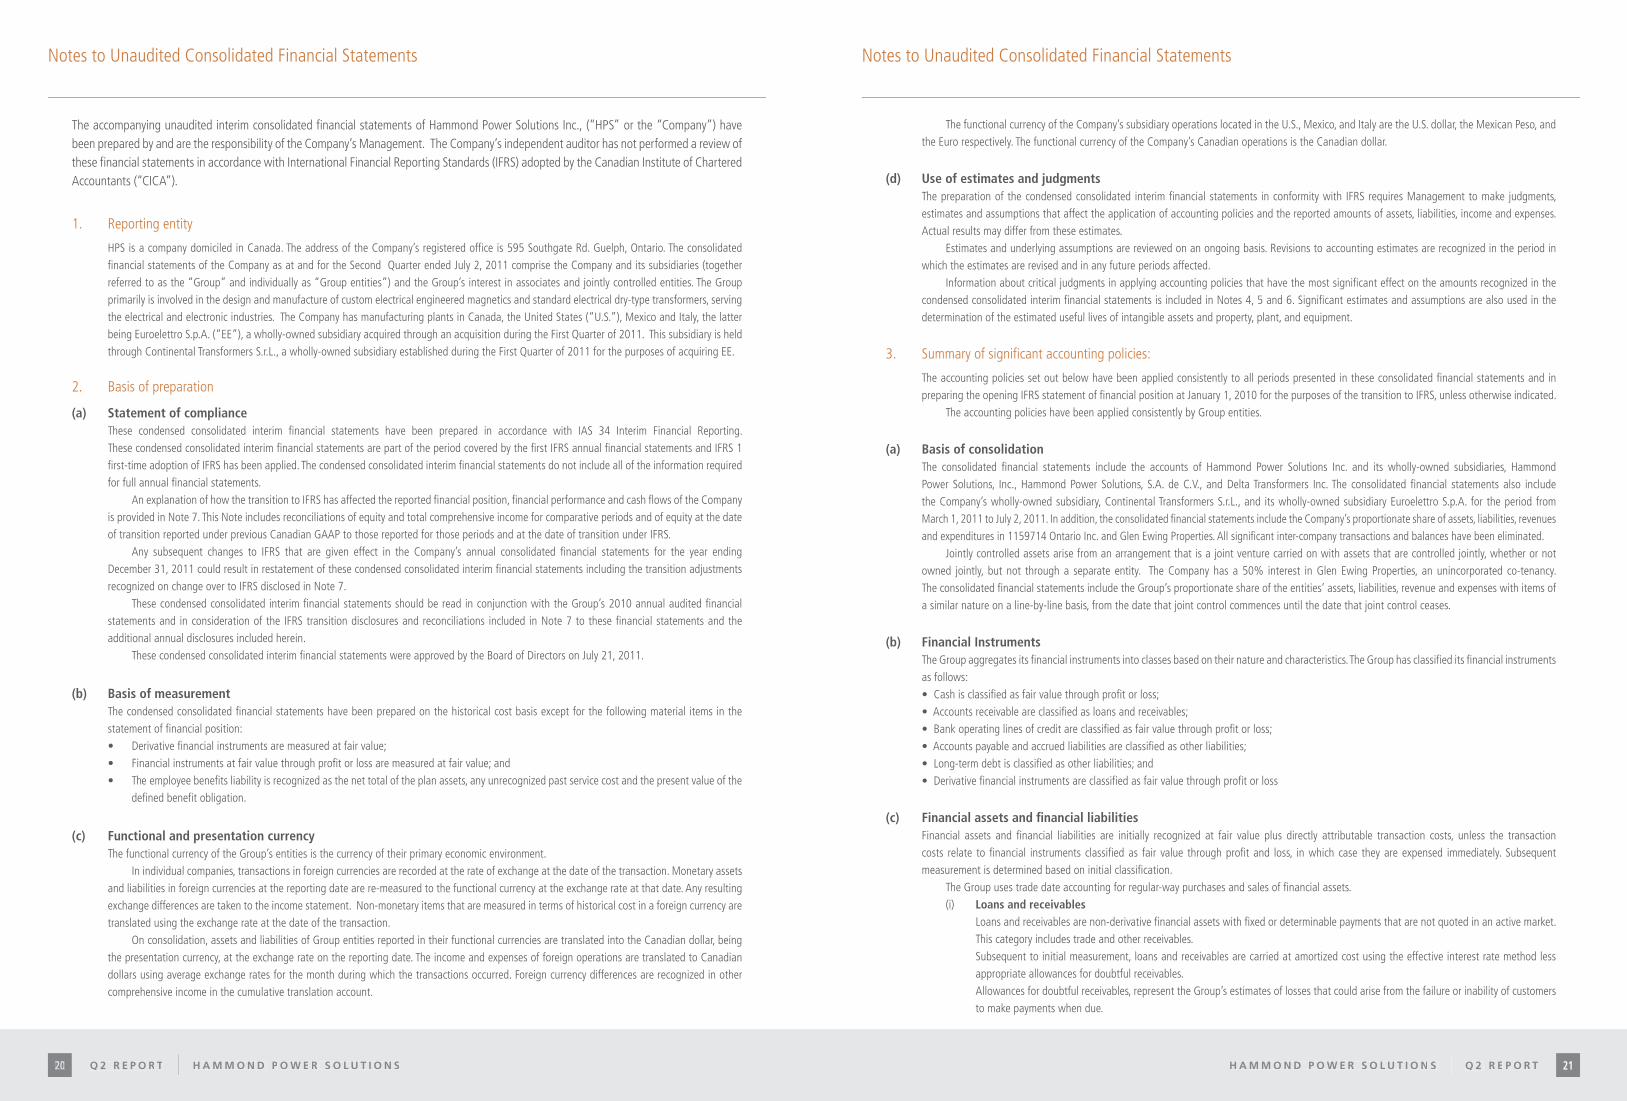
Notes to Unaudited Consolidated Financial StatementsNotes to Unaudited Consolidated Financial Statements
The accompanying unaudited interim consolidated financial statements of Hammond Power Solutions Inc., (“HPS” or the “Company”) have been prepared by and are the responsibility of the Company’s Management. The Company’s independent auditor has not performed a review of these financial statements in accordance with International Financial Reporting Standards (IFRS) adopted by the Canadian Institute of Chartered Accountants (“CICA”).
1. Reporting entity
HPS is a company domiciled in Canada. The address of the Company’s registered office is 595 Southgate Rd. Guelph, Ontario. The consolidated financial statements of the Company as at and for the Second Quarter ended July 2, 2011 comprise the Company and its subsidiaries (together referred to as the “Group” and individually as “Group entities”) and the Group’s interest in associates and jointly controlled entities. The Group primarily is involved in the design and manufacture of custom electrical engineered magnetics and standard electrical dry-type transformers, serving the electrical and electronic industries. The Company has manufacturing plants in Canada, the United States (“U.S.”), Mexico and Italy, the latter being Euroelettro S.p.A. (“EE”), a wholly-owned subsidiary acquired through an acquisition during the First Quarter of 2011. This subsidiary is held through Continental Transformers S.r.L., a wholly-owned subsidiary established during the First Quarter of 2011 for the purposes of acquiring EE.
2. Basis of preparation
(a) Statement of complianceThese condensed consolidated interim financial statements have been prepared in accordance with IAS 34 Interim Financial Reporting.These condensed consolidated interim financial statements are part of the period covered by the first IFRS annual financial statements and IFRS 1 first-time adoption of IFRS has been applied. The condensed consolidated interim financial statements do not include all of the information required for full annual financial statements.
An explanation of how the transition to IFRS has affected the reported financial position, financial performance and cash flows of the Company is provided in Note 7. This Note includes reconciliations of equity and total comprehensive income for comparative periods and of equity at the date of transition reported under previous Canadian GAAP to those reported for those periods and at the date of transition under IFRS.
Any subsequent changes to IFRS that are given effect in the Company’s annual consolidated financial statements for the year ending December 31, 2011 could result in restatement of these condensed consolidated interim financial statements including the transition adjustments recognized on change over to IFRS disclosed in Note 7.
These condensed consolidated interim financial statements should be read in conjunction with the Group’s 2010 annual audited financial statements and in consideration of the IFRS transition disclosures and reconciliations included in Note 7 to these financial statements and the additional annual disclosures included herein.
These condensed consolidated interim financial statements were approved by the Board of Directors on July 21, 2011.
(b) Basis of measurementThe condensed consolidated financial statements have been prepared on the historical cost basis except for the following material items in the statement of financial position:• Derivative financial instruments are measured at fair value;• Financial instruments at fair value through profit or loss are measured at fair value; and• The employee benefits liability is recognized as the net total of the plan assets, any unrecognized past service cost and the present value of the
defined benefit obligation.
(c) Functional and presentation currencyThe functional currency of the Group’s entities is the currency of their primary economic environment.
In individual companies, transactions in foreign currencies are recorded at the rate of exchange at the date of the transaction. Monetary assets and liabilities in foreign currencies at the reporting date are re-measured to the functional currency at the exchange rate at that date. Any resulting exchange differences are taken to the income statement. Non-monetary items that are measured in terms of historical cost in a foreign currency are translated using the exchange rate at the date of the transaction.
On consolidation, assets and liabilities of Group entities reported in their functional currencies are translated into the Canadian dollar, being the presentation currency, at the exchange rate on the reporting date. The income and expenses of foreign operations are translated to Canadian dollars using average exchange rates for the month during which the transactions occurred. Foreign currency differences are recognized in other comprehensive income in the cumulative translation account.
The functional currency of the Company’s subsidiary operations located in the U.S., Mexico, and Italy are the U.S. dollar, the Mexican Peso, and the Euro respectively. The functional currency of the Company’s Canadian operations is the Canadian dollar.
(d) Use of estimates and judgmentsThe preparation of the condensed consolidated interim financial statements in conformity with IFRS requires Management to make judgments, estimates and assumptions that affect the application of accounting policies and the reported amounts of assets, liabilities, income and expenses. Actual results may differ from these estimates.
Estimates and underlying assumptions are reviewed on an ongoing basis. Revisions to accounting estimates are recognized in the period in which the estimates are revised and in any future periods affected.
Information about critical judgments in applying accounting policies that have the most significant effect on the amounts recognized in the condensed consolidated interim financial statements is included in Notes 4, 5 and 6. Significant estimates and assumptions are also used in the determination of the estimated useful lives of intangible assets and property, plant, and equipment.
3. Summary of significant accounting policies:
The accounting policies set out below have been applied consistently to all periods presented in these consolidated financial statements and in preparing the opening IFRS statement of financial position at January 1, 2010 for the purposes of the transition to IFRS, unless otherwise indicated.
The accounting policies have been applied consistently by Group entities.
(a) Basis of consolidation The consolidated financial statements include the accounts of Hammond Power Solutions Inc. and its wholly-owned subsidiaries, Hammond Power Solutions, Inc., Hammond Power Solutions, S.A. de C.V., and Delta Transformers Inc. The consolidated financial statements also include the Company’s wholly-owned subsidiary, Continental Transformers S.r.L., and its wholly-owned subsidiary Euroelettro S.p.A. for the period from March 1, 2011 to July 2, 2011. In addition, the consolidated financial statements include the Company’s proportionate share of assets, liabilities, revenues and expenditures in 1159714 Ontario Inc. and Glen Ewing Properties. All significant inter-company transactions and balances have been eliminated.
Jointly controlled assets arise from an arrangement that is a joint venture carried on with assets that are controlled jointly, whether or not owned jointly, but not through a separate entity. The Company has a 50% interest in Glen Ewing Properties, an unincorporated co-tenancy. The consolidated financial statements include the Group’s proportionate share of the entities’ assets, liabilities, revenue and expenses with items of a similar nature on a line-by-line basis, from the date that joint control commences until the date that joint control ceases.
(b) Financial InstrumentsThe Group aggregates its financial instruments into classes based on their nature and characteristics. The Group has classified its financial instruments as follows:• Cash is classified as fair value through profit or loss;• Accounts receivable are classified as loans and receivables;• Bank operating lines of credit are classified as fair value through profit or loss;• Accounts payable and accrued liabilities are classified as other liabilities;• Long-term debt is classified as other liabilities; and• Derivative financial instruments are classified as fair value through profit or loss
(c) Financial assets and financial liabilitiesFinancial assets and financial liabilities are initially recognized at fair value plus directly attributable transaction costs, unless the transaction costs relate to financial instruments classified as fair value through profit and loss, in which case they are expensed immediately. Subsequent measurement is determined based on initial classification.
The Group uses trade date accounting for regular-way purchases and sales of financial assets.(i) Loans and receivables
Loans and receivables are non-derivative financial assets with fixed or determinable payments that are not quoted in an active market. This category includes trade and other receivables. Subsequent to initial measurement, loans and receivables are carried at amortized cost using the effective interest rate method less appropriate allowances for doubtful receivables.Allowances for doubtful receivables, represent the Group’s estimates of losses that could arise from the failure or inability of customers to make payments when due.
H a m m o n d P o w e r S o l u t i o n S | Q 2 r e P o r t 2120 Q 2 R e p o R t | H a m m o n d p o w e R S o l u t i o n S20
Notes to Unaudited Consolidated Financial StatementsNotes to Unaudited Consolidated Financial Statements
Loans and receivables are further classified as current and non-current depending whether these will be realized within twelve months after the Balance Sheet date or beyond.
(ii) Other liabilitiesThis category includes accounts payable and accrued liabilities and long-term debt. Subsequent to initial measurement, other liabilities are carried at amortized cost using the effective interest rate method.
(iii) Fair value through profit or loss A financial instrument is classified as fair value through profit or loss if it is classified as held for trading or is designated as such on initial recognition. This category includes cash, loans and borrowings and derivative financial instruments.
(iv) Derivative financial instrumentsThe Group is party to derivative financial instruments in the form of forward foreign exchange contracts used to hedge an intercompany loan foreign currency exposure and forward copper contracts used to manage commodity price exposures. The Group records all of its forward contracts at fair value, changes in fair value of exchange contracts are recognized through exchange gains and losses in the income statement and changes in fair value of copper contracts are recognized through earnings as cost of sales.
(v) Fair valueThe fair value of a financial instrument is the amount of consideration that would be agreed upon in an arm’s length transaction between knowledgeable willing parities that are under no compulsion to act. The fair value of a financial instrument on initial recognition is the transaction price, which is the fair value of the consideration given or received. Subsequent to initial recognition, the fair values of financial instruments that are quoted in active markets are based on bid prices for financial assets held and offer prices for financial liabilities. When independent prices are not available, fair values are determined by using valuation techniques that refer to observable market data.
(d) Property, plant and equipmentProperty, plant and equipment are shown in the statement of financial position at their historical cost. Cost includes expenditure that is directly attributable to the acquisition of the asset. The cost of self-constructed assets includes the cost of materials and direct labour, any other costs directly attributable to bringing the assets to a working condition for their intended use, the costs of dismantling and removing the items and restoring the site on which they are located, and borrowing costs on qualifying assets for which the commencement date for capitalization is on or after January 1, 2010. Purchased software that is integral to the functionality of the related equipment is capitalized as part of that equipment.
When parts of an item of property, plant and equipment have different useful lives, they are accounted for as separate items (major components) of property, plant and equipment.
Depreciation is provided on components that have homogenous useful lives by using the straight-line method so as to depreciate the initial
cost down to the residual value over the estimated useful lives.
The estimated useful lives for the current and comparative periods are as follows:• Buildings 14-30 years• Leaseholds 5 years• Machinery and equipment 4-10 years• Office equipment 4-10 years• Land is not depreciated.Depreciation methods, useful lives and residual values are reviewed at each financial year-end and adjusted if appropriate.
(e) Intangible assets other than goodwillIntangible assets that are acquired either separately or in a business combination are recognized when they are identifiable and can be reliably measured. Intangible assets are considered to be identifiable if they arise from contractual or other rights, or if they are separable (i.e. they can be disposed of either individually or together with other assets). Intangible assets comprise finite life intangible assets.
Finite life intangible assets are those for which there is an expectation of obsolescence that limits their useful economic life or where the useful life is limited by contractual or other terms. They are amortized over the shorter of their contractual or useful economical lives. The balance is comprised mainly of customer relationships and software.The estimated useful lives for the current and comparative periods are as follows:• Customer relationships 15 years• Software and other 4 yearsDepreciation methods, useful lives and residual values are reviewed at each financial year-end and adjusted if appropriate.
(f) GoodwillAcquisitions on or after January 1, 2010, are accounted for using the acquisition method required by IFRS 3. Goodwill is the residual amount that results when the purchase price of an acquired business exceeds the sum of the amount allocated to the identifiable assets acquired, less liabilities assumed based on their fair values. Goodwill is allocated as of the date of the business combination to the Company’s reporting units that are expected to benefit from the synergies of the business combination.
As part of its transition to IFRS, the Company elected to restate only those business combinations that occurred on or after January 1, 2010. In respect of acquisitions prior to January 1, 2010 goodwill represents the amounts recognized under previous Canadian GAAP.
Goodwill is tested for impairment at least annually and upon the occurrence of an indication of impairment.The impairment tests are performed at the cash generating unit (CGU) level. The Group defines it CGUs based on the way it monitors and
derives economic benefits from the acquired goodwill and intangibles. The impairment tests are performed by comparing the carrying value of the assets of these CGUs with the greater of its value in use and its fair value less costs to sell. The value in use is based on their future projected cash flows discounted to the present value at an appropriate pre-tax discount rate. Usually, the cash flows correspond to estimates made by Group Management in financial and strategic business plans covering a period of five years. They are then projected beyond 5 years using a steady or declining growth rate given that the Group businesses are of a long-term nature. The Group assesses the uncertainty of these estimates by making sensitivity analyses. The discount rate used approximated the Company’s weighted average cost of capital. The business risk is included in the determination of the cash flows. Both the cash flows and the discount rates exclude inflation.
An impairment loss in respect of goodwill is never subsequently reversed. The group completed its annual impairment test at December 31, 2010 as well as an impairment test on transition to IFRS, and concluded there was no impairment.
(g) Investment propertyInvestment property is property held either to earn rental income or for capital appreciation or for both, but not for sale in the ordinary course of business, use in the production or supply of goods or services or for administrative purposes. The Group measures its investment property, being the property held by Glen Ewing Properties, at historical cost.
(h) InventoriesInventories are valued at the lower of cost and net realizable value.
The cost of inventories is based on the first-in first-out principle, and includes expenditures incurred in acquiring the inventories, production or conversion costs and other costs incurred in bringing them to their existing location and condition. In the case of manufactured inventories and work in progress, cost includes an appropriate share of production overheads based on normal operating capacity.
Net realizable value is the estimated selling price in the ordinary course of business, less the estimated costs of completion and selling expenses.When circumstances which previously caused inventories to be written down to its net realizable value no longer exist, the previous
impairment is reversed.
(i) Impairment of property, plant and equipment and finite life intangible assetsThe Group periodically reviews the useful lives and the carrying values of its long-lived assets for continued appropriateness. Consideration is given at each Balance Sheet date to determine whether there is any indication of impairment of the carrying amounts of the Group’s property, plant and equipment and finite life intangible assets. The Group reviews for impairment of long-lived assets, or asset groups, held and used whenever events or changes in circumstances indicate that the carrying amount of the assets may not be recoverable.
The recoverable amount is the greater of the fair value less cost to sell and value in use. In assessing value in use, the estimated future cash flows are discounted to their present value, based on the time value of money and the risks specific to the country where the assets are located. Assets that suffer impairment are tested for possible reversal of the impairment at each reporting date.
(j) Share-based payment transactionsThe Group has a stock-based compensation plan, which is described in Note 5. The Group accounts for all stock-based payments using the fair value based method.
Under the fair value based method, compensation cost for stock options and direct awards of stock is measured at fair value at the grant date. Compensation cost is recognized in earnings on a straight-line basis over the relevant vesting period. The amount recognized as an expense is adjusted to reflect the number of awards for which the related services are expected to meet. The counterpart is recognized in contributed surplus. Upon exercise of a stock option, share capital is recorded at the sum of the proceeds received and the related amount of contributed surplus.
H a m m o n d P o w e r S o l u t i o n S | Q 2 r e P o r t 2322 Q 2 R e p o R t | H a m m o n d p o w e R S o l u t i o n S22

Notes to Unaudited Consolidated Financial StatementsNotes to Unaudited Consolidated Financial Statements
(k) ProvisionsProvisions comprise liabilities of uncertain timing or amounts that arise from restructuring plans, environmental, litigation, commercial or other risks. Provisions are recognized when there exists a legal or constructive obligation stemming from a past event and when the future cash outflows can be reliably estimated. A provision for warranties is recognized when the underlying products or services are sold. The provision is based on historical warranty data and a weighting of all possible outcomes against their associated probabilities.
(l) RevenueThe Group recognizes revenue when products are shipped and the customer takes ownership and assumes risk of loss, collection of the relevant receivable is probable, persuasive evidence of an arrangement exists and the sales price is fixed or determinable.
Service revenue is recognized when the service is performed.
(m) Income taxIncome tax expense comprises current and deferred tax. Current tax is the expected tax payable or receivable on the taxable income or loss for the year, using tax rates enacted or substantively enacted at the reporting date, and any adjustment to tax payable in respect of previous years. Deferred tax is recognized in respect of temporary differences between the carrying amounts of assets and liabilities for financial reporting purposes and the amounts used for taxation purposes. Deferred tax is measured at the tax rates that are expected to be applied to temporary differences when they reverse, based on the laws that have been enacted or substantively enacted by the reporting date.
A deferred tax asset is recognized for unused tax losses, tax credits and deductible temporary differences, to the extent that it is probable that future taxable profits will be available against which they can be utilized. Deferred tax assets are reviewed at each reporting date and are reduced to the extent that it is no longer probable that the related tax benefit will be realized.
(n) Earnings per shareThe Group presents basic and diluted earnings per share (“EPS”) data for its common shares. Basic EPS is calculated by dividing net earnings of the Group by the weighted average number of common shares outstanding during the reporting period. Diluted EPS are computed similar to basic EPS except that the weighted average shares outstanding are increased to include additional shares from the assumed exercise of stock options, if dilutive. The number of additional shares is calculated by assuming that outstanding stock options were exercised and that proceeds from such exercises along with the unamortized stock-based compensation were used to acquire shares of common stock at the average market price during the reporting period.
4. Impairment testing for cash-generating units
The Company has defined its cash generating units as each manufacturing and contract manufacturing location, due to the fact that each location is managed separately, has its own dedicated human resources and fixed assets. Each manufacturing facility produces products largely independent of the other facilities and is ultimately responsible for producing products that generate revenue.
The Company monitors the performance of each manufacturing location through the use of profitability analysis based on the most recent business plan in place as of January 1, 2010. Where there were indicators of impairment, the Company performed an impairment test using the value in use method, under which a 5 year present value cash flow projection was completed using the Company’s weighted average cost of capital of 7.2%. The cash flow model also incorporated growth rates in the range of 5% – 10% depending on location and the facility’s operating history. This was then compared to the carrying value of the facility’s assets to determine if there was impairment.
Impairment testing for cash-generating units containing goodwillIFRS 1 requires entities to test goodwill for impairment upon transition to IFRS. Accordingly, effective January 1, 2010, the assets, including goodwill, of the company’s wholly owned subsidiary, Delta Transformers Inc., were tested and no impairment was found.
Impairment testing for cash-generating units not containing goodwillThe assets for those facilities that had indicators of impairment were tested and no impairment was found.
5. Stock option plan
Summary of the plan:
July 2, 2011 December 31, 2010
Number of optionsWeighted average
exercise price Number of optionsWeighted average
exercise price
Outstanding, beginning of year 353,500 $ 7.32 269,500 $ 5.90
Granted 171,667 11.70 100,000 10.55
Exercised – – (16,000) 3.46
Cancelled – – – –
Outstanding, end of year 525,167 $ 8.75 353,500 $ 7.32
Options outstanding and exercisable as at July 2, 2011:
Options outstanding Options exercisable
Exercise price
Number of options
outstanding
Weighted average remaining
contractual life (years)
Weighted average
exercise price
Number of options
exercisable
Weighted average
exercise price
$ 1.93 94,000 1.2 $ 1.93 94,000 $ 1.93
6.00 47,000 2.5 6.00 47,000 6.00
13.64 52,500 3.8 13.64 52,500 13.64
5.91 60,000 4.8 5.91 60,000 5.91
10.55 100,000 5.8 10.55 100,000 10.55
11.70 171,667 6.9 11.70 90,556 11.70
525,167 4.7 $ 8.75 444,056 $ 7.09
H a m m o n d P o w e r S o l u t i o n S | Q 2 r e P o r t 2524 Q 2 R e p o R t | H a m m o n d p o w e R S o l u t i o n S24

Notes to Unaudited Consolidated Financial StatementsNotes to Unaudited Consolidated Financial Statements
Terms and conditions of the stock option plan
All options are to be settled by physical delivery of shares:
Grant date/employees entitledNumber of
instruments Vesting conditions
Contractual life of
options
Option grant to Board of Directors, Officers and Senior Management July 22, 2005
94,000 Vest immediately 7 years
Option grant to Board of Directors and Officers Dec 5, 2006 10,000 Vest immediately 7 years
Option grant Officers, and Senior Management on Dec 5, 200637,000 Vest equally over 5 years with
¹⁄5th immediately7 years
Option grant to Board of Directors and Officers and Senior Management March 6, 2008
52,500 Vest immediately 7 years
Option grant to Board of Directors and Officers February 24, 2009
60,000 BOD vest immediately, Officers vest equally over 3 years with 1⁄3 rd immediately
7 years
Option grant to Board of Directors and Officers March 15, 2010
100,000 BOD vest immediately, Officers vest equally over 3 years with 1⁄3 rd immediately
7 years
Option grant to Board of Directors, Officers, and Senior Management March 17, 2011
171,667 BOD vest immediately, Officers and Senior Management vest equally over 3 years with 1⁄3 rd immediately
7 years
Total share options outstanding 525,167
Inputs for measurement of grant date fair valuesThe grant date fair value of share-based payment plans was measured based on the Black-Scholes formula. Expected volatility is estimated by considering historic average share price volatility. The inputs used in the measurement of the fair values at grant date of the share-based payment plans are the following:
Stock option plan
Directors, officers, and senior
management
Directors, officers, and senior
management
2011 2010
Fair value of share options and assumptions
Fair value at grant date $ 11.70 $ 10.55
Share price at grant date $ 11.70 $ 10.55
Exercise price $ 11.70 $ 10.55
Expected volatility (weighted average volatility) 47.3% 50.4%
Option life (expected weighted average life) 3.8 years 3.8 years
Expected dividends 1.1% 1.2%
Risk-free interest rate (based on government bonds) 2.13% 2.08%
6. Business Acquisition:
Euroelettro S.p.A.On March 16, 2011, the Company acquired all of the outstanding shares of Euroeletrro S.p.A. (“EE”) a transformer business involved in the design and manufacture of standard and custom dry-type and cast coil distribution and power transformers, for cash consideration of $7,786.
The purchase of EE expands the Group’s global presence, provides a platform for expansion into the European market and increases its product breadth offering with design and manufacturing capabilities in cast coil transformer technology. The addition of cast coil product with the Group’s already broad dry transformer product offering will support the Group’s growth in North America as well as in other global markets.
The following summarizes the preliminary allocation of the purchase price and the estimated fair value of the assets acquired and liabilities assumed at the date of acquisition:
Accounts receivable $ 5,699
Inventory 2,051
Property, plant and equipment 9,602
Intangible assets 790
Customer relations 1,000
Goodwill 2,108
Assets 21,250
Bank operating loan (2,990)
Accounts payable (6,209)
Deferred tax liability (682)
Long term debt (3,583)
Liabilities (13,464)
Total purchase consideration $ 7,786
The acquisition was accounted for using the purchase method whereby identified assets acquired and liabilities assumed were recorded at their estimated fair values as of the date of acquisition. The excess of the purchase price over such fair value was recorded as goodwill, which represents the expected synergies to be realized from EE’s complementary products. None of the goodwill recognized is deductible for income tax purposes.
The accounting for the acquisition is currently based on estimates and preliminary financial statements. The Company is awaiting final property, plant and equipment valuations and intangible asset valuations from external sources, and accordingly any changes may result in adjustments to goodwill, property, plant and equipment, intangible assets and the deferred tax liability.
Included in the Group’s consolidated results for the Second Quarter of 2011 is revenue of $3,083, YTD $4,425 and net loss of $356 YTD net loss of $352,recognized by EE from March 1, 2011, the date of convenience, to July 2, 2011.
If the company had acquired EE effective January 1, 2011, the revenue would have been approximately $6,360 and there would have been a loss of approximately $492.
7. Explanation of transition to IFRS
As stated in Note 2(a), these condensed consolidated financial statements are part of the period covered by the first annual financial statements prepared in accordance with IFRS.
The significant accounting policies set out in Note 3 have been applied in preparing the financial statements for the Second Quarter and Year-to-Date ended July 2, 2011, the comparative information presented in these financial statements for the year ended December 31, 2010 and the Second Quarter and Year-to-Date ended July 3, 2010 and in the preparation of an opening IFRS statement of financial position at January 1, 2010 (the Group’s date of transition).
In preparing its comparative IFRS financial statements, the Group has adjusted amounts reported previously in financial statements prepared in accordance with previous Canadian GAAP. An explanation of how the transition from previous Canadian GAAP to IFRS has affected the Group’s financial position, financial performance and cash flows is set out in the following tables and the notes that accompany the tables.
H a m m o n d P o w e r S o l u t i o n S | Q 2 r e P o r t 2726 Q 2 R e p o R t | H a m m o n d p o w e R S o l u t i o n S26
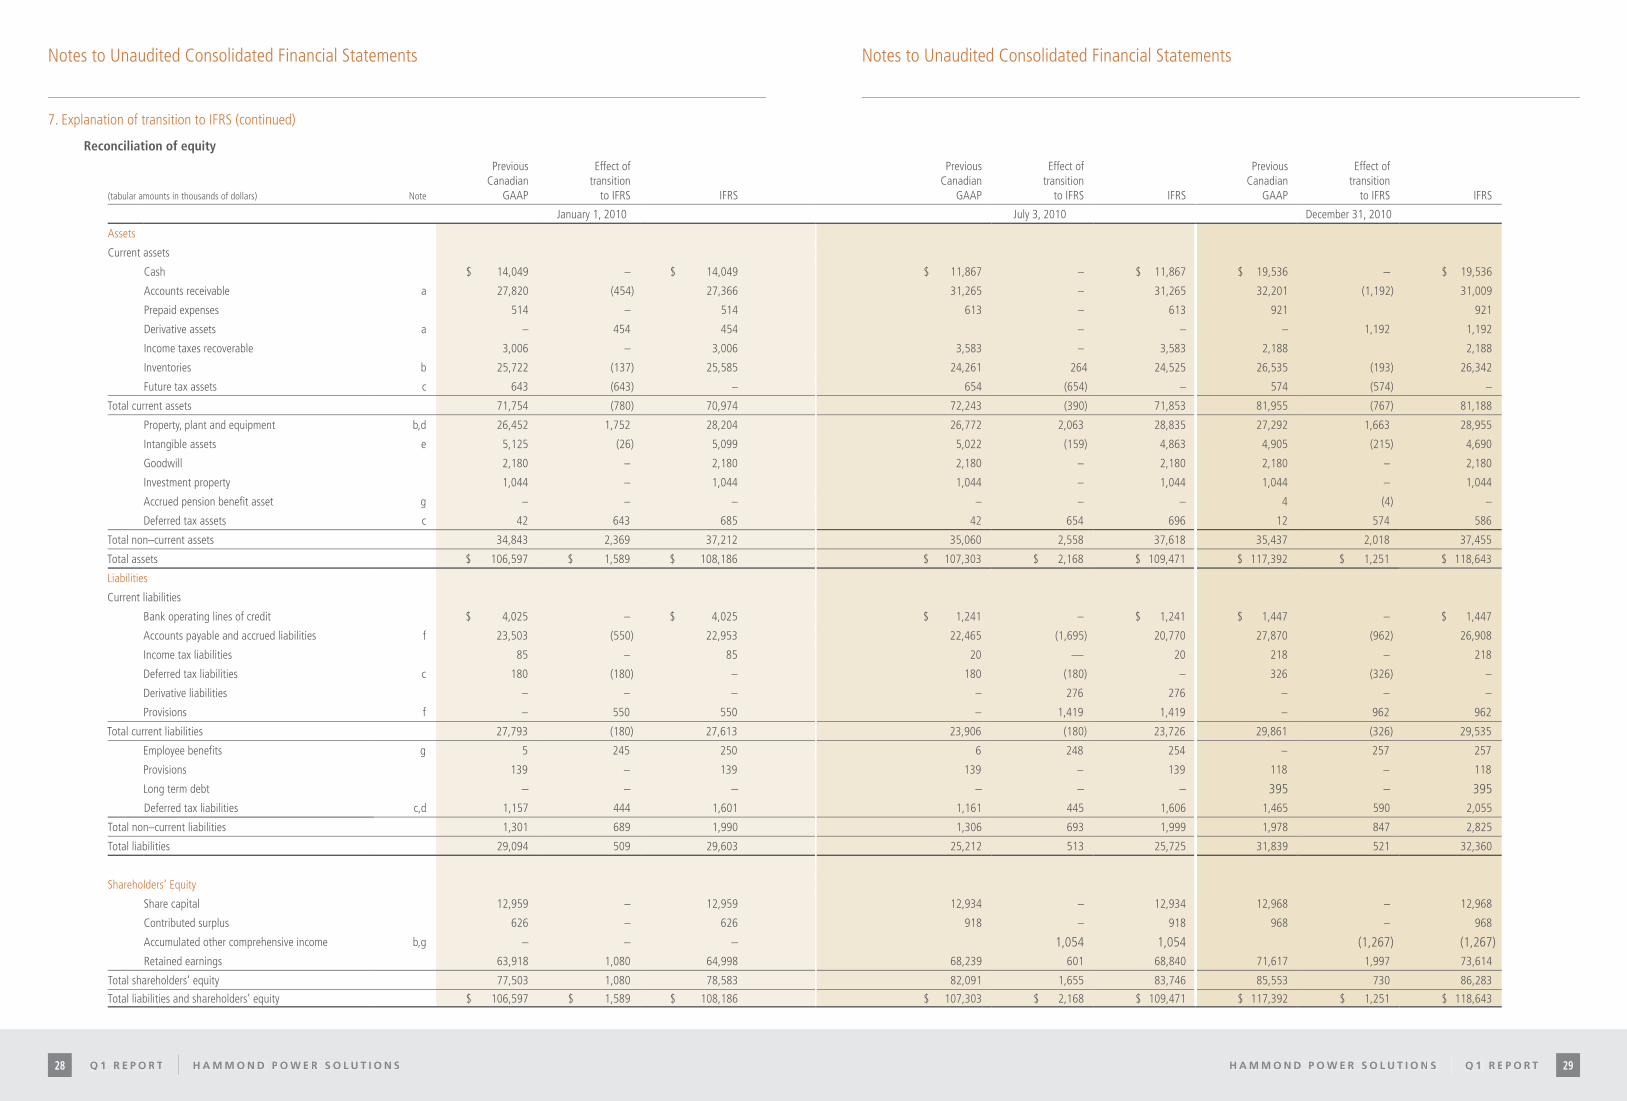
Notes to Unaudited Consolidated Financial StatementsNotes to Unaudited Consolidated Financial Statements
7. Explanation of transition to IFRS (continued)
Reconciliation of equity
(tabular amounts in thousands of dollars) Note
Previous Canadian
GAAP
Effect of transition
to IFRS IFRS
Previous Canadian
GAAP
Effect of transition
to IFRS IFRS
Previous Canadian
GAAP
Effect of transition
to IFRS IFRS
January 1, 2010 July 3, 2010 December 31, 2010
Assets
Current assets
Cash $ 14,049 – $ 14,049 $ 11,867 – $ 11,867 $ 19,536 – $ 19,536
Accounts receivable a 27,820 (454) 27,366 31,265 – 31,265 32,201 (1,192) 31,009
Prepaid expenses 514 – 514 613 – 613 921 921
Derivative assets a – 454 454 – – – 1,192 1,192
Income taxes recoverable 3,006 – 3,006 3,583 – 3,583 2,188 2,188
Inventories b 25,722 (137) 25,585 24,261 264 24,525 26,535 (193) 26,342
Future tax assets c 643 (643) – 654 (654) – 574 (574) –
Total current assets 71,754 (780) 70,974 72,243 (390) 71,853 81,955 (767) 81,188
Property, plant and equipment b,d 26,452 1,752 28,204 26,772 2,063 28,835 27,292 1,663 28,955
Intangible assets e 5,125 (26) 5,099 5,022 (159) 4,863 4,905 (215) 4,690
Goodwill 2,180 – 2,180 2,180 – 2,180 2,180 – 2,180
Investment property 1,044 – 1,044 1,044 – 1,044 1,044 – 1,044
Accrued pension benefit asset g – – – – – – 4 (4) –
Deferred tax assets c 42 643 685 42 654 696 12 574 586
Total non–current assets 34,843 2,369 37,212 35,060 2,558 37,618 35,437 2,018 37,455
Total assets $ 106,597 $ 1,589 $ 108,186 $ 107,303 $ 2,168 $ 109,471 $ 117,392 $ 1,251 $ 118,643
Liabilities
Current liabilities
Bank operating lines of credit $ 4,025 – $ 4,025 $ 1,241 – $ 1,241 $ 1,447 – $ 1,447
Accounts payable and accrued liabilities f 23,503 (550) 22,953 22,465 (1,695) 20,770 27,870 (962) 26,908
Income tax liabilities 85 – 85 20 –– 20 218 – 218
Deferred tax liabilities c 180 (180) – 180 (180) – 326 (326) –
Derivative liabilities – – – – 276 276 – – –
Provisions f – 550 550 – 1,419 1,419 – 962 962
Total current liabilities 27,793 (180) 27,613 23,906 (180) 23,726 29,861 (326) 29,535
Employee benefits g 5 245 250 6 248 254 – 257 257
Provisions 139 – 139 139 – 139 118 – 118
Long term debt – – – – – – 395 – 395Deferred tax liabilities c,d 1,157 444 1,601 1,161 445 1,606 1,465 590 2,055
Total non–current liabilities 1,301 689 1,990 1,306 693 1,999 1,978 847 2,825
Total liabilities 29,094 509 29,603 25,212 513 25,725 31,839 521 32,360
Shareholders’ Equity
Share capital 12,959 – 12,959 12,934 – 12,934 12,968 – 12,968
Contributed surplus 626 – 626 918 – 918 968 – 968
Accumulated other comprehensive income b,g – – – 1,054 1,054 (1,267) (1,267)Retained earnings 63,918 1,080 64,998 68,239 601 68,840 71,617 1,997 73,614
Total shareholders’ equity 77,503 1,080 78,583 82,091 1,655 83,746 85,553 730 86,283
Total liabilities and shareholders’ equity $ 106,597 $ 1,589 $ 108,186 $ 107,303 $ 2,168 $ 109,471 $ 117,392 $ 1,251 $ 118,643
H a m m o n d P o w e r S o l u t i o n S | Q 1 r e P o r t 29Q 1 R e p o R t | H a m m o n d p o w e R S o l u t i o n S28

Notes to Unaudited Consolidated Financial StatementsNotes to Unaudited Consolidated Financial Statements
7. Explanation of transition to IFRS (continued)
Reconciliation of Comprehensive Income for the Three Months Ended July 3, 2010, Six Months ended
July 3, 2010 and Year Ended December 31, 2010
(tabular amounts in thousands of dollars) Note
Canadian GAAP
Effect of transition
to IFRS IFRSCanadian
GAAP
Effect of transition
to IFRS IFRSCanadian
GAAP
Effect of transition
to IFRS IFRS
Three months ended July 3, 2010 Six months ended July 3, 2010 December 31, 2010
Continuing operations
Sales $ 50,820 – $ 50,820 $ 95,093 – $ 95,093 $ 190,604 – $ 190,604
Cost of sales 38,201 – 38,201 70,649 – 70,649 141,286 – 141,286
Gross margin 12,619 – 12,619 24,444 – 24,444 49,318 – 49,318
Selling, general and
administrativek 9,199 (9,199) – 17,444 (17,444) – 34,341 (34,341) –
Selling and distribution k – 4,889 4,889 – 9,425 9,425 – 19,319 19,319
General and administrative e, g, k – 4,369 4,369 – 8,152 8,152 – 15,216 15,216
Earnings from operations e,g 3,420 (59) 3,361 7,000 (133) 6,867 14,977 (194) 14,783
Interest expense 24 – 24 61 – 61 103 – 103
Foreign exchange loss (gain) b 206 1,172 1,378 (41) 346 305 14 (1,136) (1,122)
Loss on disposal of equipment 6 – 6 6 – 6 6 – 6
Co-tenancy expense 33 – 33 66 – 66 84 – 84
Earnings loss – rental property – – – – – – 3 – 3
Net finance costs 249 1,172 1,441 (92) 346 438 210 (1,136) (926)
Income before income tax 3,151 (1,231) 1,920 6,908 (479) 6,429 14,767 942 15,709
Income tax expense 750 – 750 2,283 – 2,283 5,057 – 5,057
Net earnings 2,401 (1,231) 1,170 4,625 (479) 4146 9,710 942 10,652
Other comprehensive income
Foreign currency translation
differences for foreign operationsb – 2,201 2,201 – 1,054 1,054 – (1,267) (1,267)
Defined benefit plan actuarial
(losses)g – – – – – – (25) (25)
Other comprehensive income for the period 2,201 2,201 1,054 1,054 (1,292) (1,292)
Total comprehensive income for the period $ 2,401 $ 970 $ 3,371 $ 4,625 $ 575 $ 5,200 $ 9,710 $ (350) $ 9,360
Earnings per share
Basic earnings per share (dollars) 0.21 0.10 0.40 0.36 0.84 0.92
Diluted earnings per share (dollars) 0.21 0.10 0.40 0.35 0.83 0.91
7. Explanation of transition to IFRS (continued)
Notes to the reconciliations(a) Upon adoption of IFRS, the Group reclassified derivative financial instruments measured as fair value through profit or loss, being forward
foreign exchange and copper contracts from trade and other receivables to derivative assets on the statement of financial position. The effect was to reduce trade and other receivables and increase derivative assets.
Consolidated statement of financial positionAs at
January 1, 2010As at
July 3, 2010As at
December 31, 2010
Trade and other receivables (454) – (1,192)
Derivative assets 454 – 1,192
(b) Under previous Canadian GAAP, the Group’s functional currency was determined to be the Canadian dollar, as the Company’s subsidiaries operate as integrated foreign operations due to the fact that they are financially and operationally interdependent with the Canadian parent company. As a result, the temporal method was used to translate assets, liabilities, revenues and expenses. The result of the application of this method was that monetary items were translated at the exchange rate in effect at the Balance Sheet date, non–monetary items were translated at historical rates, revenue and expense items were translated at the exchange rates in effect on the dates they occurred, and depreciation was translated at historical exchange rates as the asset to which it relates.
In accordance with IFRS, the Group examined the functional currencies for each of its component entities upon transition. Under IFRS, when the indicators are mixed and the functional currency is not obvious, priority should be given to indicators that have a greater weighting. Canadian GAAP has similar indicators as IFRS in determining functional currency; however, Canadian GAAP does not have a hierarchy of indicators under which certain indicators are given priority. In particular, under IFRS, the Group evaluated the primary economic environment within which each entity operates. In performing this evaluation, the Group looked to the currency that mainly influences sales prices, the currency of the country whose competitive forces and regulations mainly determine the sales prices, and the currency that mainly influences labour, material and other costs of providing goods. The result of this assessment was the determination that the domestic currency of each component entity is the functional currency.
Under IAS 21, Foreign Operations, assets and liabilities are translated from their functional currency into the group presentation currency at the exchange rate at the reporting date, and revenue and expenses are translated at the transaction date.
The impact arising from the change is summarized as follows:
(tabular amounts in thousands of dollars) 3 months 6 months 12 months
Consolidated statement of comprehensive income July 3, 2010 July 3, 2010 December 31, 2010
Decrease in finance costs: Foreign exchange gain
1,172 346 (1,136)
Decrease in other comprehensive income: Foreign currency translation differences
(2,201) (1,054) 1,267
Total adjustment (1,029) (708) 131
As at
Consolidated statement of financial position January 1, 2010 July 3, 2010 December 31, 2010
Reduction in inventories (137) 264 (193)
Reduction in property, plant and equipment (488) (177) (577)
Increase in cumulative translation reserve (625) (87) (770)
(c) Upon adoption of IFRS, the Group classified deferred tax assets previously presented as current assets as non–current assets, in accordance with IAS 12, Income Taxes. Similarly, the Group classified deferred tax liabilities previously presented as current liabilities as non–current liabilities.
As at
Deferred tax assets January 1, 2010 July 3, 2010 December 31, 2010
Current deferred tax assets (643) (654) (574)
Non-current deferred tax assets 643 654 574
Current deferred tax liabilities (180) (180) (326)
Non-current deferred tax liabilities 180 180 326
H a m m o n d P o w e r S o l u t i o n S | Q 2 r e P o r t 3130 Q 2 R e p o R t | H a m m o n d p o w e R S o l u t i o n S30
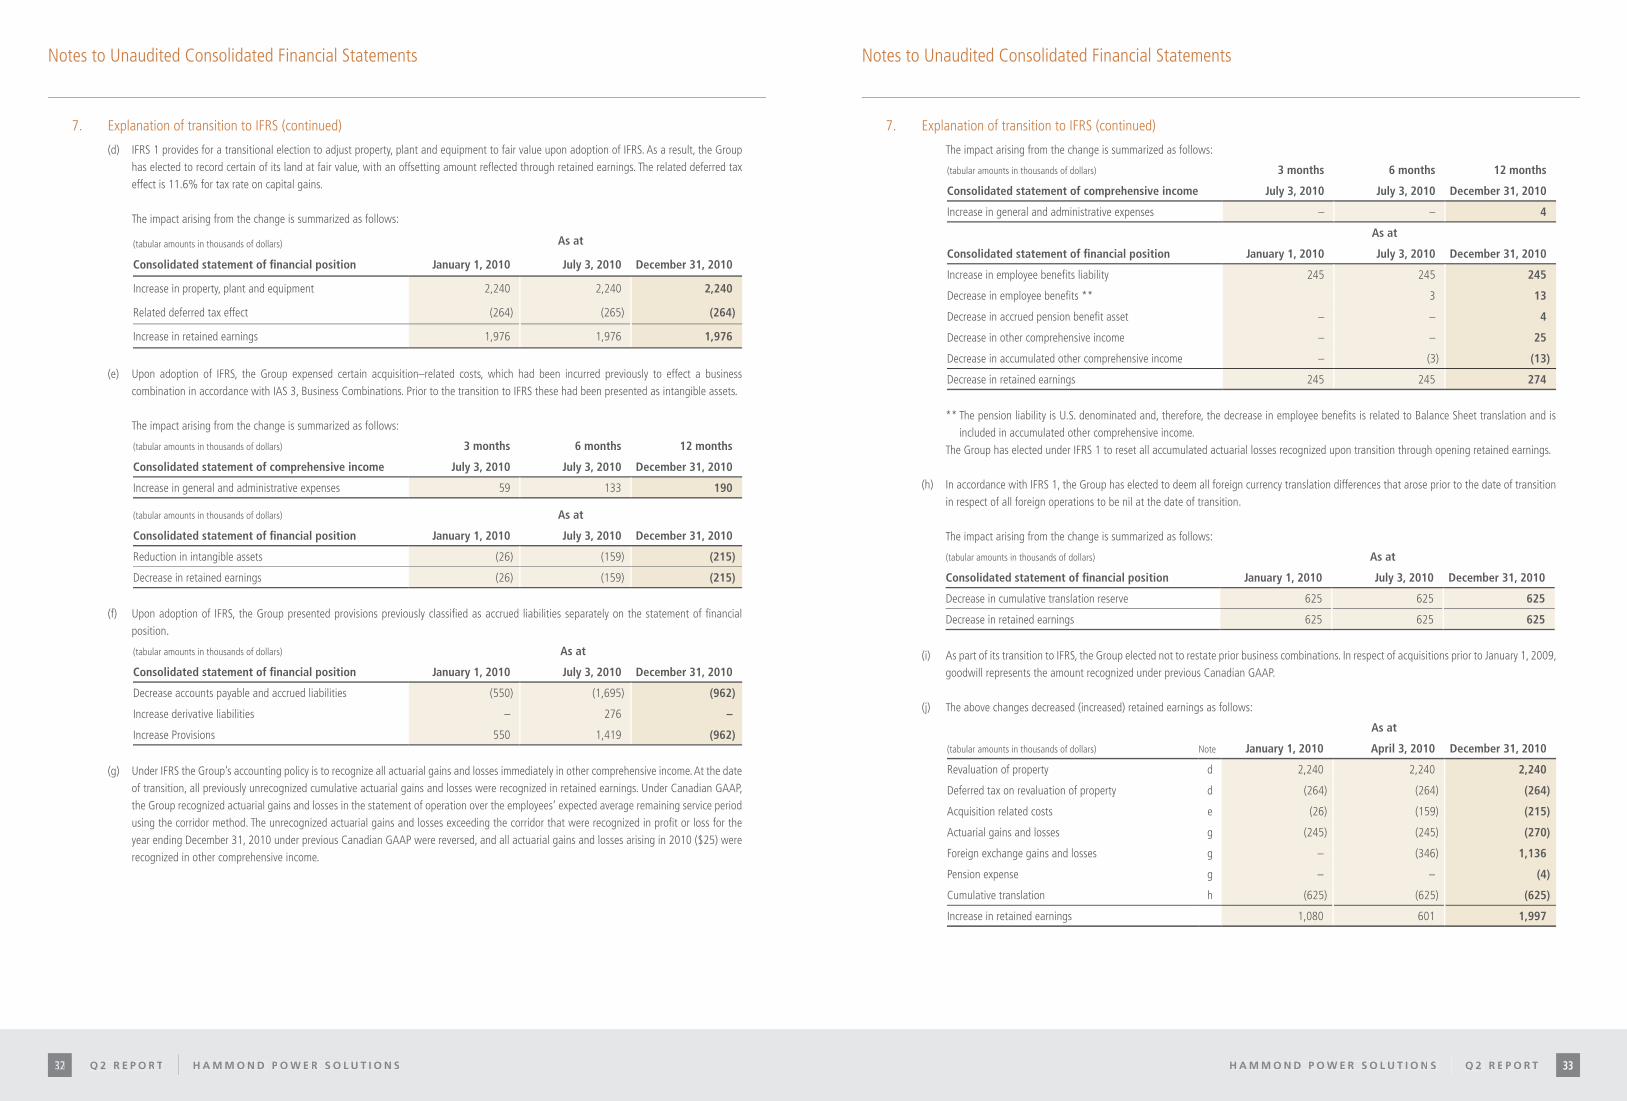
Notes to Unaudited Consolidated Financial StatementsNotes to Unaudited Consolidated Financial Statements
7. Explanation of transition to IFRS (continued)
(d) IFRS 1 provides for a transitional election to adjust property, plant and equipment to fair value upon adoption of IFRS. As a result, the Group has elected to record certain of its land at fair value, with an offsetting amount reflected through retained earnings. The related deferred tax effect is 11.6% for tax rate on capital gains.
The impact arising from the change is summarized as follows:
(tabular amounts in thousands of dollars) As at
Consolidated statement of financial position January 1, 2010 July 3, 2010 December 31, 2010
Increase in property, plant and equipment 2,240 2,240 2,240
Related deferred tax effect (264) (265) (264)
Increase in retained earnings 1,976 1,976 1,976
(e) Upon adoption of IFRS, the Group expensed certain acquisition–related costs, which had been incurred previously to effect a business combination in accordance with IAS 3, Business Combinations. Prior to the transition to IFRS these had been presented as intangible assets.
The impact arising from the change is summarized as follows:
(tabular amounts in thousands of dollars) 3 months 6 months 12 months
Consolidated statement of comprehensive income July 3, 2010 July 3, 2010 December 31, 2010
Increase in general and administrative expenses 59 133 190
(tabular amounts in thousands of dollars) As at
Consolidated statement of financial position January 1, 2010 July 3, 2010 December 31, 2010
Reduction in intangible assets (26) (159) (215)
Decrease in retained earnings (26) (159) (215)
(f) Upon adoption of IFRS, the Group presented provisions previously classified as accrued liabilities separately on the statement of financial position.
(tabular amounts in thousands of dollars) As at
Consolidated statement of financial position January 1, 2010 July 3, 2010 December 31, 2010
Decrease accounts payable and accrued liabilities (550) (1,695) (962)
Increase derivative liabilities – 276 –
Increase Provisions 550 1,419 (962)
(g) Under IFRS the Group’s accounting policy is to recognize all actuarial gains and losses immediately in other comprehensive income. At the date of transition, all previously unrecognized cumulative actuarial gains and losses were recognized in retained earnings. Under Canadian GAAP, the Group recognized actuarial gains and losses in the statement of operation over the employees’ expected average remaining service period using the corridor method. The unrecognized actuarial gains and losses exceeding the corridor that were recognized in profit or loss for the year ending December 31, 2010 under previous Canadian GAAP were reversed, and all actuarial gains and losses arising in 2010 ($25) were recognized in other comprehensive income.
7. Explanation of transition to IFRS (continued)
The impact arising from the change is summarized as follows:
(tabular amounts in thousands of dollars) 3 months 6 months 12 months
Consolidated statement of comprehensive income July 3, 2010 July 3, 2010 December 31, 2010
Increase in general and administrative expenses – – 4
As at
Consolidated statement of financial position January 1, 2010 July 3, 2010 December 31, 2010
Increase in employee benefits liability 245 245 245
Decrease in employee benefits ** 3 13
Decrease in accrued pension benefit asset – – 4
Decrease in other comprehensive income – – 25
Decrease in accumulated other comprehensive income – (3) (13)
Decrease in retained earnings 245 245 274
** The pension liability is U.S. denominated and, therefore, the decrease in employee benefits is related to Balance Sheet translation and is included in accumulated other comprehensive income.
The Group has elected under IFRS 1 to reset all accumulated actuarial losses recognized upon transition through opening retained earnings.
(h) In accordance with IFRS 1, the Group has elected to deem all foreign currency translation differences that arose prior to the date of transition in respect of all foreign operations to be nil at the date of transition.
The impact arising from the change is summarized as follows:
(tabular amounts in thousands of dollars) As at
Consolidated statement of financial position January 1, 2010 July 3, 2010 December 31, 2010
Decrease in cumulative translation reserve 625 625 625
Decrease in retained earnings 625 625 625
(i) As part of its transition to IFRS, the Group elected not to restate prior business combinations. In respect of acquisitions prior to January 1, 2009, goodwill represents the amount recognized under previous Canadian GAAP.
(j) The above changes decreased (increased) retained earnings as follows:
As at
(tabular amounts in thousands of dollars) Note January 1, 2010 April 3, 2010 December 31, 2010
Revaluation of property d 2,240 2,240 2,240
Deferred tax on revaluation of property d (264) (264) (264)
Acquisition related costs e (26) (159) (215)
Actuarial gains and losses g (245) (245) (270)
Foreign exchange gains and losses g – (346) 1,136
Pension expense g – – (4)
Cumulative translation h (625) (625) (625)
Increase in retained earnings 1,080 601 1,997
H a m m o n d P o w e r S o l u t i o n S | Q 2 r e P o r t 3332 Q 2 R e p o R t | H a m m o n d p o w e R S o l u t i o n S32

Corporate Officers and Directors
William G. Hammond *Chairman and Chief Executive Officer
Chris R. HuetherCorporate Secretary and
Chief Financial Officer
Donald H. MacAdam *+
Director
Zoltan D. Simo *+
Director
Douglas V. Baldwin *+
Director
Grant C. Robinson *+
Director
David J. FitzGibbon *+
Director
Dahra Granovsky *+
Director
* Corporate Governance Committee + Audit and Compensation Committee
Corporate Head Office595 Southgate DriveGuelph, Ontario N1G 3W6
Stock Exchange Listing Toronto Stock Exchange (TSX)Trading Symbol: HPS.A
Registrar and Transfer AgentComputershare Investor Share Services Inc.100 University AvenueToronto, Ontario M5J 2Y1
AuditorsKPMG, LLP 115 King Street SouthWaterloo, Ontario N2J 5A3
Investor RelationsContact: Dawn Henderson, Manager Investor RelationsTelephone: 519.822.2441Email: [email protected]
Notes to Unaudited Consolidated Financial Statements
7. Explanation of transition to IFRS (continued)
(k) IFRS requires the presentation of expenses in the statement of comprehensive income to be made based on their nature of the function to which the expenditure relates. Previous Canadian GAAP permitted a combination of these approaches. The Group has elected to present items in its consolidated statement of income based on the function to which they relate, and accordingly, has reclassified items previously presented as selling, general and administrative expenses into selling and distribution and general and administrative.
(l) Upon transition to IFRS the Group has moved the amount of cash paid for interest and income taxes into the body of the Statement of Cash Flows, whereas they were previously disclosed as supplementary information. There are no other material differences between the statement of cash flows presented under IFRS and the statement of cash flows presented under previous Canadian GAAP.
H a m m o n d P o w e r S o l u t i o nH a m m o n d P o w e r S o l u t i o n S S || Q 2 Q 2 rr ee PP o r to r t 35Q 2 R e p oQ 2 R e p o RR tt || H a m m o n d H a m m o n d pp o w eo w e RR S o l u t i o n S o l u t i o n SS34

hammondpowersolutions.com