Q2 2017 - Dream€¦ · Q2 2017 Dream Industrial REIT. Table of contents Management’s discussion...
56
Q2 2017 Dream Industrial REIT
Transcript of Q2 2017 - Dream€¦ · Q2 2017 Dream Industrial REIT. Table of contents Management’s discussion...

Q2 2017Dream Industrial REIT

Table of contents
Management’s discussion and analysis 1Condensed consolidated financial statements 38Notes to the condensed consolidated financial statements 42 Corporate information IBC
Dream Industrial REIT 2017 Second Quarter Report | 1
Management’s discussion and analysis (All square footages and dollar amounts in our tables are presented in thousands, except rental rates, Unit and per Unit amounts, unless otherwise stated.)
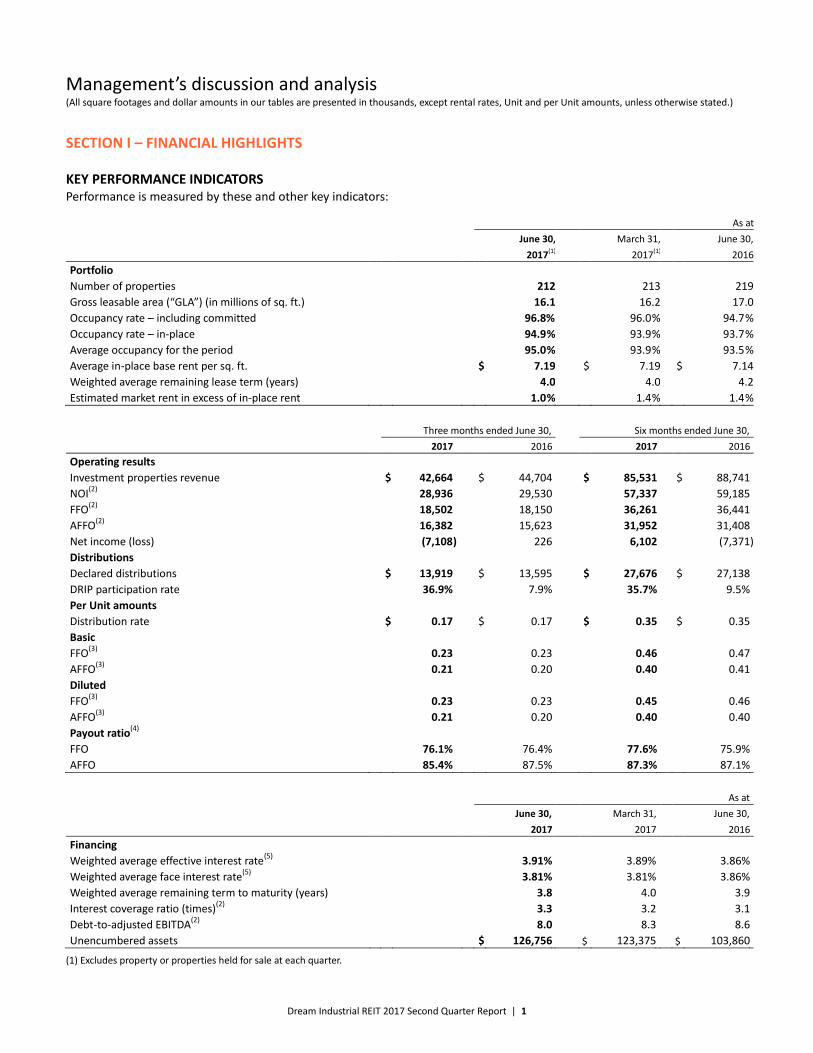
SECTION I – FINANCIAL HIGHLIGHTS KEY PERFORMANCE INDICATORS Performance is measured by these and other key indicators:
As at
June 30, March 31, June 30,
2017(1) 2017(1) 2016
Portfolio
Number of properties 212 213 219
Gross leasable area (“GLA”) (in millions of sq. ft.) 16.1 16.2 17.0
Occupancy rate – including committed 96.8 % 96.0 % 94.7 %
Occupancy rate – in-place 94.9 % 93.9 % 93.7 %
Average occupancy for the period 95.0 % 93.9 % 93.5 %
Average in-place base rent per sq. ft. $ 7.19 $ 7.19 $ 7.14
Weighted average remaining lease term (years) 4.0 4.0 4.2
Estimated market rent in excess of in-place rent 1.0 % 1.4 % 1.4 %
Three months ended June 30, Six months ended June 30,
2017 2016 2017 2016
Operating results
Investment properties revenue $ 42,664 $ 44,704 $ 85,531 $ 88,741
NOI(2)
28,936 29,530 57,337 59,185
FFO(2)
18,502 18,150 36,261 36,441
AFFO(2)
16,382 15,623 31,952 31,408
Net income (loss) (7,108 ) 226 6,102 (7,371 )
Distributions
Declared distributions $ 13,919 $ 13,595 $ 27,676 $ 27,138
DRIP participation rate 36.9% 7.9% 35.7% 9.5%
Per Unit amounts
Distribution rate $ 0.17 $ 0.17 $ 0.35 $ 0.35
Basic
FFO(3)
0.23 0.23 0.46 0.47
AFFO(3)
0.21 0.20 0.40 0.41
Diluted
FFO(3)
0.23 0.23 0.45 0.46
AFFO(3)
0.21 0.20 0.40 0.40
Payout ratio(4)
FFO 76.1% 76.4% 77.6% 75.9%
AFFO 85.4% 87.5% 87.3% 87.1%
As at
June 30, March 31, June 30,
2017 2017 2016
Financing
Weighted average effective interest rate(5)
3.91% 3.89% 3.86%
Weighted average face interest rate(5)
3.81% 3.81% 3.86%
Weighted average remaining term to maturity (years) 3.8 4.0 3.9
Interest coverage ratio (times)(2)
3.3 3.2 3.1
Debt-to-adjusted EBITDA(2)
8.0 8.3 8.6
Unencumbered assets $ 126,756 $ 123,375 $ 103,860
(1) Excludes property or properties held for sale at each quarter.

Dream Industrial REIT 2017 Second Quarter Report | 2
(2) NOI, FFO, AFFO, interest coverage ratio and debt-to-adjusted EBITDA are non-GAAP measures. See “Non-GAAP measures and other disclosures” for a description of these non-GAAP measures.
(3) A description of the determination of basic and diluted amounts per Unit can be found under the heading “Non-GAAP measures and other disclosures”.
(4) Payout ratios for FFO and AFFO (non-GAAP measures) are calculated as the ratio of distribution rate to diluted FFO and AFFO per Unit, respectively.
(5) Weighted average effective interest rate is calculated as the weighted average face rate of interest net of amortization of fair value adjustments and financing costs of all interest bearing debt. Weighted average face interest rate is calculated as the weighted average face interest rate of all interest bearing debt.
BASIS OF PRESENTATION Our discussion and analysis of the financial position and results of operations of Dream Industrial Real Estate Investment Trust (“Dream Industrial REIT” or “Dream Industrial” or “the Trust”) should be read in conjunction with the audited consolidated financial statements of Dream Industrial for the year ended December 31, 2016 and the condensed consolidated financial statements for the period ended June 30, 2017.
This MD&A is dated as at August 8, 2017.
For simplicity, throughout this discussion, we may make reference to the following:
• “REIT Units”, meaning units of the Trust, excluding Special Trust Units
• “LP B Units” and “subsidiary redeemable units”, meaning the Class B Units of Dream Industrial LP
• “Units”, meaning REIT Units and LP B Units
When we use terms such as “we”, “us” and “our”, we are referring to Dream Industrial REIT and its subsidiaries.
Estimated market rents disclosed throughout the MD&A are management’s estimates and are based on current period leasing fundamentals. The current estimated market rents are at a point in time and are subject to change based on future market conditions.
Certain information herein contains or incorporates comments that constitute forward-looking information within the meaning of applicable securities legislation, including but not limited to statements relating to the Trust’s objectives, strategies to achieve those objectives, the Trust’s beliefs, plans, estimates, projections and intentions, and similar statements concerning anticipated future events, future growth, results of operations, performance, business prospects and opportunities, acquisitions or divestitures, tenant base, future maintenance and development plans and costs, capital investments, financing, the availability of financing sources, income taxes, vacancy and leasing assumptions, litigation and the real estate industry in general — in each case they are not historical facts. Forward-looking statements generally can be identified by words such as “outlook”, “objective”, “strategy”, “may”, “will”, “would”, “expect”, “intend”, “estimate”, “anticipate”, “believe”, “should”, “could”, “likely”, “plan”, “project”, “budget” or “continue”, or similar expressions suggesting future outcomes or events. Forward-looking information is based on a number of assumptions and is subject to a number of risks and uncertainties, many of which are beyond the Trust’s control, which could cause actual results to differ materially from those disclosed in or implied by such forward-looking information. These risks and uncertainties include, but are not limited to, general and local economic and business conditions; the financial condition of tenants; our ability to refinance maturing debt; leasing risks, including those associated with the ability to lease vacant space; our ability to source and complete accretive acquisitions; and interest rates.
Although the forward-looking statements contained in this MD&A are based on what we believe are reasonable assumptions, there can be no assurance that actual results will be consistent with these forward-looking statements. Factors that could cause actual results to differ materially from those set forth in the forward-looking statements and information include, but are not limited to, general economic conditions; local real estate conditions, including the development of properties in close proximity to the Trust’s properties; timely leasing of vacant space and re-leasing of occupied space upon expiration; dependence on tenants’ financial condition; the uncertainties of acquisition activity; the ability to effectively integrate acquisitions; interest rates; availability of equity and debt financing; our continued compliance with the real estate investment Trust (“REIT”) exemption under the specified investment flow-through trust (“SIFT”) legislation; and other risks and factors described from time to time in the documents filed by the Trust with securities regulators.
All forward-looking information is as of August 8, 2017. Dream Industrial does not undertake to update any such forward-looking information whether as a result of new information, future events or otherwise, except as required by applicable law. Additional information about these assumptions, risks and uncertainties is contained in our filings with securities regulators. Certain filings are also available on our website at www.dreamindustrialreit.ca.

Dream Industrial REIT 2017 Second Quarter Report | 3
BACKGROUND Dream Industrial REIT is an unincorporated, open-ended real estate investment trust that was formed to provide investors with the opportunity to invest in a Canadian focused, pure-play industrial REIT. Our REIT Units are listed on the Toronto Stock Exchange under the trading symbol DIR.UN.
At June 30, 2017, we owned 212 primarily light industrial income-producing properties totalling 16.1 million square feet of gross leasable area (“GLA”). Our properties are located in key industrial markets across Canada.
OUR OBJECTIVES We are committed to:
• Managing our business to provide growing cash flow and stable and sustainable returns, through adapting our strategy and tactics to changes in the real estate industry and the economy;
• Building and maintaining a diversified, growth-oriented portfolio of light industrial properties in major markets, based on an established platform;
• Providing predictable and sustainable cash distributions to unitholders while prudently managing our capital structure over time; and
• Maintaining a REIT that satisfies the REIT exception under the SIFT legislation in order to provide certainty to unitholders with respect to taxation of distributions.
OUR STRATEGY Dream Industrial REIT is a growth-oriented owner of income-producing light industrial properties across Canada, providing stable and predictable distributions to unitholders on a tax-efficient basis. Our strategy is to grow our portfolio by investing in key markets to generate stable cash flows for our unitholders. We will continue to review and modify our strategy to meet the ever changing real estate and economic conditions. Our strategy includes:
Optimizing the performance, value and cash flow of our portfolio We actively manage our assets to optimize performance, maintain value, retain and attract tenants and maximize cash flows to our unitholders. Dream Industrial REIT employs experienced staff in all markets where we are active. We strive to ensure that our assets are the most attractive and cost-effective premises for our tenants.
Maintaining and strengthening our conservative financial profile We operate our business in a disciplined manner with a strong focus on maintaining a conservative financial structure. We actively manage our mortgage maturity profile, maintain a conservative debt ratio and generate cash flows sufficient to fund our distributions.
Growing and diversifying our portfolio to reduce risk We seek to grow and diversify our portfolio to increase value on a per Unit basis, further improve the sustainability of our distributions, strengthen our tenant profile and mitigate risk. We anticipate that growing our portfolio will also reduce our cost of capital, allowing us to both refinance existing mortgages at lower rates and increase our ability to competitively bid on acquisition opportunities. We have experience in each of Canada’s key real estate markets, which we believe will provide us with the flexibility to pursue acquisitions in whichever markets offer compelling investment opportunities.
Seeking accretive growth opportunities Dream Industrial REIT seeks to invest in desirable, highly functional properties located in major industrial centres that are well-leased on a long-term basis to quality tenants. When evaluating acquisitions we consider a variety of criteria, including per Unit accretion; replacement cost of the asset, its functionality and appeal to future tenants; and how the asset complements our existing portfolio.

Dream Industrial REIT 2017 Second Quarter Report | 4
FINANCIAL OVERVIEW Dream Industrial’s financial metrics remained stable with the value of our investment properties at $1.6 billion and debt- to-total assets (a non-GAAP measure) at 52.4%.
Diluted funds from operations (“FFO”) per Unit (a non-GAAP measure) for the quarter ended June 30, 2017 was $0.23, unchanged from the prior year comparative quarter. For the six months ended June 30, 2017, diluted FFO was $0.45 compared to $0.46 in the prior year comparative period. The decrease when compared to the six months ended June 30, 2016 was primarily as a result of property dispositions in 2016, offset by savings in interest expense and general and administrative expense.
Diluted adjusted funds from operations (“AFFO”) per Unit (a non-GAAP measure) for the quarter ended June 30, 2017 was $0.21, compared to $0.20 for the prior year comparative quarter. For the six months ended June 30, 2017, diluted AFFO was $0.40, unchanged from the prior year comparative period. The overall movements are due to the same factors impacting FFO and the exclusion of certain accounting adjustments, such as straight-line rent and fair value adjustments on assumed debt.
Net income (loss) for the three months ended June 30, 2017 was $7.1 million loss (six months ended June 30, 2017 – $6.1 million income). The loss in the quarter is primarily due to fair value adjustments to investment properties and financial instruments.
In-place occupancy (including committed space) for our total portfolio increased to 96.8%, compared to 96.0% at March 31, 2017. The occupancy for our comparative portfolio slightly increased to 96.8%, compared to 96.5% at March 31, 2017. Our occupancy at June 30, 2017 includes 297,000 square feet of commitments on vacant space, with the majority of these leases commencing in the next two quarters.
In-place rents remained at $7.19 per square foot, compared to March 31, 2017. Renewals for the quarter were completed at $7.25 per square foot, or 2.8% lower than expiring rates, largely due to renewals of three mid- and large-bay tenants in Western Canada. New leases were completed at $7.42 per square foot.
Estimated market rents were stable at $7.26 at June 30, 2017 when compared to $7.29 at March 31, 2017. On a regional basis, changes were driven by adjustments to specific units that did not have a material impact on the overall portfolio.
Leasing activity during the quarter consisted of 799,000 square feet of new leases and renewals, compared to 731,000 square feet of expiries and terminations. Approximately 67.4% of our expiries were renewed during the quarter, and, including the relocation of tenants within our portfolio, the retention ratio was 76.1%. As at June 30, 2017, leasing commitments of approximately 81.7% of the remaining 2017 expiring tenancies were obtained.
Leasing and tenant profile remained stable. Our lease maturities profile remains staggered, and the tenant base remains diversified.
Comparative properties net operating income (“NOI”) (a non-GAAP measure) for the three months ended June 30, 2017 was $29.1 million compared to $28.5 million for the prior year comparative quarter. For the six months ended June 30, 2017, comparative properties NOI was $57.8 million compared to $56.9 million for the prior year comparative period. On a regional basis, comparative properties NOI increased in Ontario and Québec from higher occupancy and decreased in Western Canada and Eastern Canada for the three- and six-month periods.
Investment properties at June 30, 2017 totalled 16.1 million square feet and was valued at $1.6 billion, reflecting a weighted average capitalization rate of 6.64% on stabilized NOI (a non-GAAP measure). On a comparative properties basis, the capitalization rate at June 30, 2017 was 6.64% compared to 6.72% at March 31, 2017, largely driven by capitalization rate decreases in Ontario and Québec. Compared to the prior quarter, our comparative property values in the Western Canada, Québec and Eastern Canada regions decreased by $4.0 million, $2.9 million and $9.9 million, respectively, and increased in Ontario by $10.5 million.
Total debt as at June 30, 2017 was $861.2 million. The total level of debt (debt-to-total assets) (a non-GAAP measure) stood at 52.4%, down 90 bps compared to the prior year comparative quarter. The weighted average remaining term on our debt was 3.8 years, and the weighted average face interest rate (a non-GAAP measure) was 3.81%, which is higher than what we are currently seeing in the market for comparable mortgage debt. Our debt profile remains balanced with maturities well distributed. As at June 30, 2017, $126.8 million of the Trust’s assets were unencumbered and $98 million was available to be drawn on the revolving credit facility, which provide additional sources of financial flexibility.
Our first U.S. asset acquisition was announced subsequent to the quarter. We entered into a purchase and sale agreement with Dream Office REIT to acquire a 717,000 square foot distribution centre in Nashville, Tennessee, for approximately $60 million including transaction costs. The purchase price will be partially funded by assumed mortgage debt of $29 million. An interest-bearing refundable deposit in the amount of $30 million was made on August 1, 2017. The acquisition is expected to close during the second half of 2017 and is subject to customary closing conditions and lender consents.

Dream Industrial REIT 2017 Second Quarter Report | 5
OUR PROPERTIES Dream Industrial REIT owns and manages high-quality light industrial properties located in primary and secondary markets across Canada.
As at June 30, 2017, our portfolio consists of 212 properties comprising 16.1 million square feet of GLA. Our properties are located in desirable business parks, situated close to highways and generally considered functional and well suited for their respective markets. The occupancy rate across our portfolio is 96.8%. Our occupancy rate includes lease commitments totalling approximately 297,000 square feet for space that is currently being readied for occupancy but for which rental revenue is not yet being recognized.
Our properties are geographically diversified as follows:
June 30, 2017(1) December 31, 2016(1)
Number of Owned GLA % of owned Number of Owned GLA % of owned
properties (sq. ft.) GLA properties (sq. ft.) GLA
Western Canada 82 4,867 30.3 82 4,868 30.1
Ontario 57 4,793 29.8 58 4,890 30.2
Québec 36 3,765 23.4 36 3,765 23.3
Eastern Canada 37 2,659 16.5 37 2,659 16.4
Total 212 16,084 100.0 213 16,182 100.0
(1) Excludes property or properties held for sale at each quarter.
Our portfolio, totalling 16.1 million square feet, consists of 10.7 million square feet, or 66% of total GLA, of multi-tenant buildings, and 5.4 million square feet, or 34% of total GLA, of single-tenant buildings. Of the 5.4 million square feet of single-tenant space, 4.6 million square feet is located in Ontario and Québec. Multi-tenant space is distributed more evenly throughout the provinces in the portfolio, with a relatively higher concentration of 4.1 million square feet in Alberta and Saskatchewan. The differences between single- and multi-tenant buildings can be seen in the following operating metrics:
• Average tenant size – single tenants typically occupy significantly more space on an individual basis than those tenants in multi-tenant buildings;
• Average lease term – single tenants typically have lease terms that are significantly longer than those for multi-tenant buildings, which tends to offset the concentration risk of having a large single tenant in a building; and
• Average in-place rents per square foot – they are typically moderately higher in multi-tenant buildings.
Multi-tenant buildings with shorter lease terms allow a landlord to bring rents to market rates on a more frequent basis, thereby taking advantage of supply-constrained market conditions. Small-bay multi-tenant buildings tend to have higher construction costs and tend to be located in denser urban markets, which increases the barriers to competition from new supply. Selective ownership of single-tenant buildings provides a source of stable cash flow with relatively less management effort required. In addition to the geographic distribution, maintaining a balance of the two building types in the portfolio is part of our diversification strategy.

Dream Industrial REIT 2017 Second Quarter Report | 6
SECTION II – EXECUTING THE STRATEGY
OUR OPERATIONS The following key performance indicators related to our operations influence the cash generated from operating activities:
Occupancy At June 30, 2017, the overall percentage of occupied and committed space across our portfolio remained high at 96.8%, which was 0.8% higher than the occupancy at March 31, 2017, and 2.1% higher than occupancy at June 30, 2016.
On a comparative properties basis, occupancy at June 30, 2017 increased 0.3% and 0.9%, respectively, when compared to March 31, 2017 and June 30, 2016.
Total portfolio Comparative properties(2)
June 30, March 31, June 30, June 30, March 31, June 30,
(percentage) 2017(1) 2017(1) 2016 2017 2017 2016
Western Canada 96.5 97.1 96.7 96.5 97.1 96.7
Ontario 99.5 97.0 95.8 99.5 99.0 98.0
Québec 96.7 97.2 95.7 96.7 97.2 96.7
Eastern Canada 92.5 90.2 87.7 92.5 90.2 89.3
Total 96.8 96.0 94.7 96.8 96.5 95.9
Portfolio size (millions of sq. ft.) 16.1 16.2 17.0 16.1 16.1 16.1
(1) Excludes property or properties held for sale at each quarter.
(2) Comparative properties include assets owned by the Trust as at June 30, 2016, and excludes properties sold in 2016 and properties held for sale as at June 30, 2017.
Occupancy roll-forward Leasing activity for the quarter included approximately 466,000 square feet of renewals and approximately 333,000 square feet of new leases.
The following tables detail the change in occupancy (including committed) during the three and six months ended June 30, 2017:
Weighted For the three Weighted For the six
average months ended average months ended
rate June 30, 2017 As a % of rate June 30, 2017 As a % of
per sq. ft. (sq. ft.) total GLA per sq. ft. (sq. ft.) total GLA
Occupancy (including committed) at beginning of period 15,528 96.0 % 15,412 95.2 %
Vacancy committed for future occupancy (327 ) (2.1 %) (233 ) (1.4 %)
Change due to property held for sale(1)
— 0.6 % — 0.6 %
Occupancy at beginning of period – restated 15,201 94.5 % 15,179 94.4 %
Expiries (all leases) $ 7.74 (691 ) (4.3 %) $ 7.24 (1,341 ) (8.3 %)
Early terminations and bankruptcies $ 9.96 (40 ) (0.3 %) $ 9.21 (94 ) (0.7 %)
New leases $ 7.42 333 2.1 % $ 7.07 509 3.2 %
Renewals $ 7.25 466 2.9 % $ 6.97 1,016 6.3 %
Occupancy – June 30, 2017 15,269 94.9 % 15,269 94.9 %
Vacancy committed for future occupancy 297 1.9 % 297 1.9 %
Occupancy (including committed) – June 30, 2017 15,566 96.8 % 15,566 96.8 %
(1) Vacant property; only impacts % of total GLA.

Dream Industrial REIT 2017 Second Quarter Report | 7
The committed occupancy on vacant space based on existing contractual commitments at June 30, 2017 totalled 297,000 square feet. Of this committed space, 99% will become occupied in the next two quarters.
For the three months ended For the six months ended
June 30, 2017 June 30, 2017
Tenant renewal ratio(1)
67.4 % 75.8 %
Expiring rents on renewed space (per sq. ft.) $ 7.46 $ 7.00
Renewal to expiring rent spread (per sq. ft.)(2)
$ (0.21) $ (0.03)
(1) Tenant renewal ratio is calculated as the ratio of total square feet of renewals over expiries.
(2) Renewal to expiring rent spread is calculated as the difference between the rates at which the renewals were completed and the expiring rents on the renewed space.
The tenant renewal ratio for the portfolio was 67.4% during the quarter. Including relocations of existing tenants (excluding their expansion space), the retention ratio was 76.1%. Renewals for the quarter were completed at $7.25 per square foot, or 2.8% lower than the expiring rates. Within our Western Canada region, our retention ratio was 68.3% for the quarter and renewals were completed at $8.28 per square foot, which was $1.00 below expiring rates. The negative renewal spread was largely driven by three mid- and large-bay tenants where there is more competition in the market. The tenant renewal ratio for the portfolio was 75.8% for the six months ended June 30, 2017. Including relocations of existing tenants (excluding their expansion space), the retention ratio was 80.7%. Renewals for the six months ended June 30, 2017 were completed at $6.97 per square foot compared to the expiring rate of $7.00 per square foot.
In-place rental rates Estimated market rent represents management’s best estimate of the net rental rate that would be achieved in a new arm’s length lease in the event that a unit becomes vacant after a reasonable marketing period with an inducement and lease term appropriate for the particular space. Market rent by property is reviewed regularly by our leasing and portfolio management teams. Market rents may differ by property or by unit and depend upon a number of factors. Some of the factors considered include the condition of the space, the location within the building, the amount of office build-out for the units, lease term and a normal level of tenant inducements. Market rental rates are also compared against the external appraisal information that is gathered on a quarterly basis as well as other external market data sources.
During the second quarter, market rents have been stable at $7.26 at June 30, 2017 compared to $7.29 in the prior quarter, with changes on specific units that did not have a material impact on the overall portfolio.
The following table summarizes our in-place rental rates by region, along with the estimated market rents.
June 30, 2017(1) March 31, 2017(1) June 30, 2016
Average Average Average
Average Estimated remaining Average Estimated remaining Average Estimated remaining
in-place market lease term in-place market lease term in-place market lease term
Total portfolio base rent rent(2) (years) base rent rent(2) (years) base rent rent(2) (years)
Western Canada $ 9.03 $ 9.19 3.8 $ 9.05 $ 9.26 3.9 $ 9.07 $ 9.23 4.0
Ontario 6.16 6.16 3.9 6.14 6.11 3.9 5.97 6.05 3.9
Québec 6.14 6.08 4.7 6.14 6.14 4.6 6.19 6.23 5.3
Eastern Canada 7.24 7.42 3.6 7.18 7.51 3.6 7.34 7.48 3.3
Total $ 7.19 $ 7.26 4.0 $ 7.19 $ 7.29 4.0 $ 7.14 $ 7.24 4.2
(1) Excludes property or properties held for sale at each quarter.
(2) Estimate only; based on current market rents with no allowance for increases in future years. Subject to changes in market conditions in each market.

Dream Industrial REIT 2017 Second Quarter Report | 8
Leasing and tenant profile The average remaining lease term and other portfolio information are detailed in the following table. Overall, our average remaining lease term is 4.0 years and our average tenant size is 12,000 square feet. Our single-tenant buildings have an average remaining lease term of 5.2 years and our multi-tenant buildings have an average remaining lease term of 3.4 years.
The following table details our lease maturity profile, net of renewals, by region at June 30, 2017:
Remainder of
(in sq. ft., except %) Vacancy 2017 2018 2019 2020 2021 2022+ Total
Western Canada 169 202 663 573 737 625 1,898 4,867
Ontario 23 29 773 880 800 563 1,725 4,793
Québec 125 236 211 499 166 370 2,158 3,765
Eastern Canada 201 124 391 457 216 393 877 2,659
Total portfolio
Total GLA 518 591 2,038 2,409 1,919 1,951 6,658 16,084
Percentage of total GLA (%) 3.2 3.7 12.7 15.0 11.9 12.1 41.4 100.0
Our lease maturity profile, net of renewals, remains staggered. Lease expiries, net of committed occupancy as a percentage of total GLA between 2017 and 2021, range from 3.7% to 15.0%.
2017 lease expiry profile
Western Eastern Total
(in sq. ft., except %) Canada Ontario Québec Canada portfolio
2017 expiries (as at June 30, 2017) (374 ) (482 ) (518 ) (245 ) (1,619 )
Expiries committed for renewals 172 453 282 121 1,028
Expiries, net of renewals (as at June 30, 2017) (202 ) (29 ) (236 ) (124 ) (591 )
2017 vacancy (as at June 30, 2017) (264 ) (74 ) (163 ) (312 ) (813 )
Vacancy committed for future occupancy 95 51 38 111 295
2017 vacancy, net of commitments for occupancy
(as at June 30, 2017) (169 ) (23 ) (125 ) (201 ) (518 )
Total commitments as a % of expiries (as at June 30, 2017) 71.4% 104.6% (1)
61.8% 94.7% 81.7%
(1) In Ontario, we have obtained leasing commitments on 104.6% of the remaining 2017 expiring tenancies, which translates into addressing 100% of the remaining 2017 expiring tenancies and increasing occupancy by approximately 22,000 square feet, or 4.6%, of the remaining 2017 expiring tenancies.
As at June 30, 2017, leasing commitments of approximately 81.7% of remaining 2017 expiring tenancies had been obtained.
The following table details expiring rents across our portfolio as well as our estimate of average market rents based on current leasing activity in similar properties at June 30, 2017. For remaining 2017 expiries, estimated market rents are 2.7% below expiring rents, largely driven by flex-office units in our Western Canada portfolio. These types of spaces compete directly with the suburban office market, which has been negatively impacted in the last couple of years with low demand and high vacancy rates. In our Ontario, Québec and Eastern Canada portfolios, estimated market rents are higher than expiring rents, representing an opportunity to increase rents as spaces are re-leased.
Western Eastern Total Average Canada Ontario Québec Canada portfolio
Expiring rents – remaining 2017 expiries $ 10.80 $ 6.86 $ 5.84 $ 6.97 $ 7.82
Market rents(1)
– remaining 2017 expiries $ 9.76 $ 7.32 $ 6.11 $ 7.04 $ 7.61
(1) Estimate only; based on current market rents with no allowance for increases in future years. Subject to changes in market conditions in each market.
Dream Industrial REIT 2017 Second Quarter Report | 9
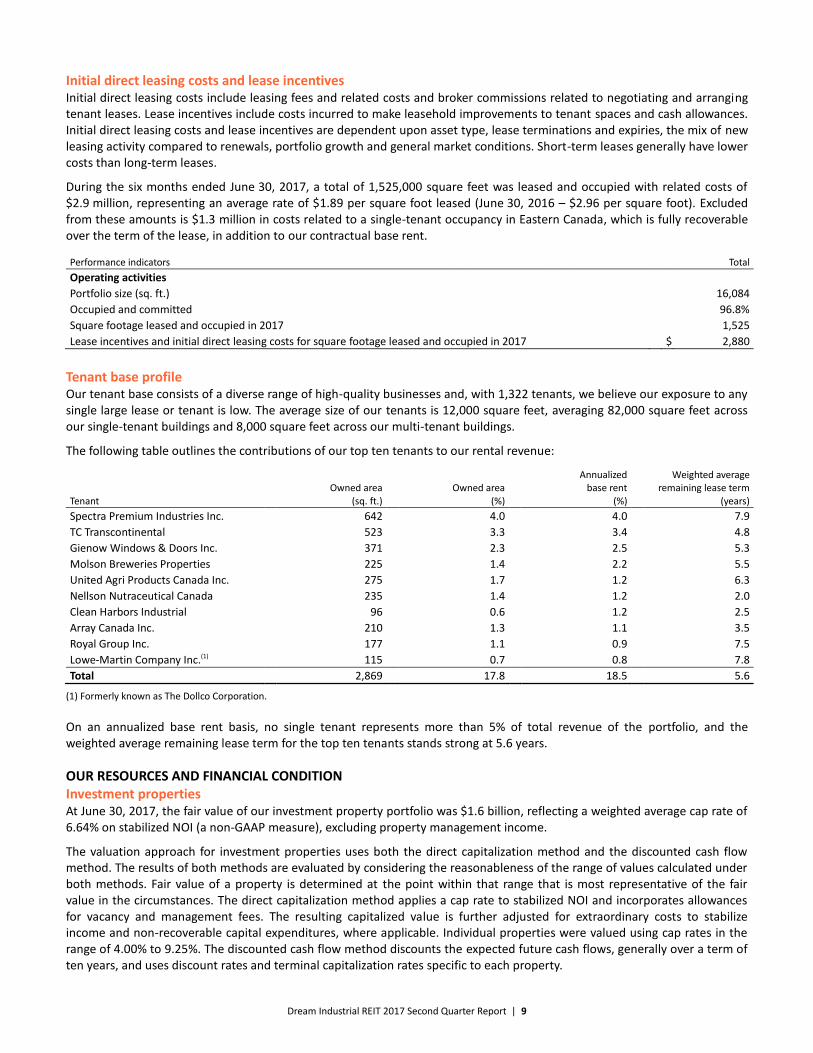
Initial direct leasing costs and lease incentives Initial direct leasing costs include leasing fees and related costs and broker commissions related to negotiating and arranging tenant leases. Lease incentives include costs incurred to make leasehold improvements to tenant spaces and cash allowances. Initial direct leasing costs and lease incentives are dependent upon asset type, lease terminations and expiries, the mix of new leasing activity compared to renewals, portfolio growth and general market conditions. Short-term leases generally have lower costs than long-term leases.
During the six months ended June 30, 2017, a total of 1,525,000 square feet was leased and occupied with related costs of $2.9 million, representing an average rate of $1.89 per square foot leased (June 30, 2016 – $2.96 per square foot). Excluded from these amounts is $1.3 million in costs related to a single-tenant occupancy in Eastern Canada, which is fully recoverable over the term of the lease, in addition to our contractual base rent.
Performance indicators Total
Operating activities
Portfolio size (sq. ft.) 16,084
Occupied and committed 96.8%
Square footage leased and occupied in 2017 1,525
Lease incentives and initial direct leasing costs for square footage leased and occupied in 2017 $ 2,880
Tenant base profile Our tenant base consists of a diverse range of high-quality businesses and, with 1,322 tenants, we believe our exposure to any single large lease or tenant is low. The average size of our tenants is 12,000 square feet, averaging 82,000 square feet across our single-tenant buildings and 8,000 square feet across our multi-tenant buildings.
The following table outlines the contributions of our top ten tenants to our rental revenue:
Annualized Weighted average
Owned area Owned area base rent remaining lease term Tenant (sq. ft.) (%) (%) (years)
Spectra Premium Industries Inc. 642 4.0 4.0 7.9
TC Transcontinental 523 3.3 3.4 4.8
Gienow Windows & Doors Inc. 371 2.3 2.5 5.3
Molson Breweries Properties 225 1.4 2.2 5.5
United Agri Products Canada Inc. 275 1.7 1.2 6.3
Nellson Nutraceutical Canada 235 1.4 1.2 2.0
Clean Harbors Industrial 96 0.6 1.2 2.5
Array Canada Inc. 210 1.3 1.1 3.5
Royal Group Inc. 177 1.1 0.9 7.5
Lowe-Martin Company Inc.(1) 115 0.7 0.8 7.8
Total 2,869 17.8 18.5 5.6
(1) Formerly known as The Dollco Corporation.
On an annualized base rent basis, no single tenant represents more than 5% of total revenue of the portfolio, and the weighted average remaining lease term for the top ten tenants stands strong at 5.6 years.
OUR RESOURCES AND FINANCIAL CONDITION Investment properties At June 30, 2017, the fair value of our investment property portfolio was $1.6 billion, reflecting a weighted average cap rate of 6.64% on stabilized NOI (a non-GAAP measure), excluding property management income.
The valuation approach for investment properties uses both the direct capitalization method and the discounted cash flow method. The results of both methods are evaluated by considering the reasonableness of the range of values calculated under both methods. Fair value of a property is determined at the point within that range that is most representative of the fair value in the circumstances. The direct capitalization method applies a cap rate to stabilized NOI and incorporates allowances for vacancy and management fees. The resulting capitalized value is further adjusted for extraordinary costs to stabilize income and non-recoverable capital expenditures, where applicable. Individual properties were valued using cap rates in the range of 4.00% to 9.25%. The discounted cash flow method discounts the expected future cash flows, generally over a term of ten years, and uses discount rates and terminal capitalization rates specific to each property.

Dream Industrial REIT 2017 Second Quarter Report | 10
The fair value of our investment properties is set out below:
Comparative portfolio
June 30, March 31, December 31,
2017(1) 2017(1) 2016(1)
Western Canada $ 627,442 $ 631,425 $ 636,855
Ontario 447,681 437,175 433,560
Québec 292,380 295,350 296,190
Eastern Canada 249,595 259,465 259,010
Total $ 1,617,098 $ 1,623,415 $ 1,625,615
(1) Excludes properties held for sale.
Capitalization rate information for investment properties is set out in the table below:
Comparative portfolio
June 30, 2017(1) March 31, 2017(1) December 31, 2016(1)
Range (%) Weighted
average (%) Range (%) Weighted
average (%) Range (%) Weighted
average (%)
Western Canada 6.00–8.00 6.62 6.00–8.00 6.64 6.00–8.00 6.62
Ontario 4.00–7.75 6.19 5.50–7.75 6.41 5.50–7.75 6.43
Québec 6.25–7.50 6.94 6.25–7.50 7.03 6.25–7.50 7.03
Eastern Canada 6.50–9.25 7.11 6.50–9.25 7.01 6.50–9.25 7.01
Total 4.00–9.25 6.64 5.50–9.25 6.72 5.50–9.25 6.71
(1) Excludes properties held for sale.
Overall, the fair value of our investment properties at June 30, 2017 was $1.6 billion at a weighted average capitalization rate of 6.64%.
The fair value of our comparative portfolio decreased by $6.3 million compared to March 31, 2017, primarily due to fair value losses of $13.6 million, offset by building improvements and lease incentives and initial direct leasing costs of $7.4 million. On a regional basis, the total fair value decrease comprises decreases of $4.0 million in Western Canada, $2.9 million in Québec and $9.9 million in Eastern Canada, offset by a $10.5 million increase in Ontario.
During the quarter, the Trust obtained external appraisals on 17 properties and obtained external input from its appraisers on the market assumptions used for internally valued properties. On a regional basis, external appraisals were completed for four properties in Western Canada, six in Ontario, one in Québec and six in Eastern Canada. The fair value of externally appraised properties decreased by $0.7 million, from $159.2 million at March 31, 2017 to $158.5 million at June 30, 2017. On a regional basis, the movement in externally valued properties was comprised of decreases of $1.5 million in Western Canada and $7.7 million in Eastern Canada, offset by increases of $7.7 million in Ontario and $0.8 million in Québec. The value changes in externally appraised properties were primarily driven by property-specific changes in capitalization rates and market rents.
The fair value of the internally appraised properties decreased by $5.6 million, from $1,464.2 million at March 31, 2017 to $1,458.6 million at June 30, 2017. On a regional basis, the movement in internally valued properties comprised of decreases of $2.5 million in Western Canada, $3.8 million in Québec and $2.1 million in Eastern Canada, offset by an increase of $2.8 million in Ontario. The value changes in internally appraised properties were primarily driven by property-specific changes in leasing activity, market rents, discount rates and capitalization rates.
In Western Canada, the fair value of the investment properties declined by $4.0 million, of which $3.6 million relates to Alberta and $0.4 million relates to Saskatchewan. Four properties were externally appraised in Calgary, resulting in a fair value decrease of $1.5 million due to changes in market rents and capitalization rates. The decrease in values for the internally valued properties in Alberta were primarily driven by changes in leasing activity and market rents in certain flex-office units.

Dream Industrial REIT 2017 Second Quarter Report | 11
Building improvements and leasing costs The table below represents costs incurred during the periods ended June 30:
Three months ended June 30, Six months ended June 30,
2017 2016 2017 2016
Building improvements
Recoverable capital expenditures $ 4,142 $ 3,768 $ 4,318 $ 3,946
Other capital expenditures 1,115 1,331 1,872 1,878
Initial direct leasing costs and lease incentives
Leasing costs 893 1,086 1,569 1,637
Landlord’s work 1,026 1,268 2,604 2,264
Tenant improvements 199 652 660 788
Other leasing costs 23 222 254 349
Total $ 7,398 $ 8,327 $ 11,277 $ 10,862
Other capital expenditures primarily consisted of upgrades completed on certain properties that are expected to increase the Trust’s ability to attract tenants and obtain higher rental rates. Landlord’s work for the six months ended June 30, 2017 includes $0.9 million in relation to a ten-year lease at one of our single-tenant properties in Eastern Canada which is fully recoverable over the term of the lease. For the six months ended June 30, 2017, $0.3 million of other leasing costs were incurred towards various major reconfigurations of units to attract and put in place high value tenancies or to improve quality of the assets.
OUR FINANCING Our debt strategy includes managing our maturity schedule to help mitigate interest rate risk and limit exposure in any given year, as well as fixing the rates and extending loan terms as long as possible when interest rates are favourable.
Summary of debt The key performance indicators in the management of our debt are as follows:
As at
June 30, 2017 December 31, 2016
Financing metrics
Debt $ 861,177 $ 868,347
Weighted average effective interest rate(1)
3.91% 3.89%
Weighted average face interest rate(1)
3.81% 3.81%
Interest coverage ratio (times)(2)(4)
3.3 3.1
Debt-to-adjusted EBITDA (years)(2)
8.0 8.4
Level of debt (debt-to-total assets)(2)
52.4% 52.6%
Liquidity metrics
Maximum proportion of debt maturities and principal repayments due in any one year 21.0% (2019) 20.8% (2019)
Weighted average term to maturity (years) 3.8 4.2
Cash on hand $ 6,136 $ 6,595
Unencumbered assets(3)
126,756 121,210
Undrawn lines of credit 98,000 98,000
(1) Weighted average effective interest rate is calculated as the weighted average face rate of interest net of amortization of fair value adjustments and financing costs of all interest bearing debt. Weighted average face interest rate is calculated as the weighted average face interest rate of all interest bearing debt.
(2) The calculation of the following non-GAAP measures – interest coverage ratio, debt-to-adjusted EBITDA and level of debt (debt-to-total assets) – is included in the “Non-GAAP measures and other disclosures” section of the MD&A.
(3) Includes assets held for sale.
(4) Calculated for the three months ended June 30, 2017.

Dream Industrial REIT 2017 Second Quarter Report | 12
We currently use cash flow performance and debt level indicators to assess our ability to meet our financing obligations. Our current interest coverage ratio is 3.3 times, demonstrating our ability to more than adequately cover interest expense requirements. At June 30, 2017, our weighted average face rate of interest is 3.81% and, after accounting for market adjustments and financing costs, the weighted average effective interest rate for outstanding debt is 3.91%.
Liquidity and capital resources Dream Industrial’s primary sources of capital are cash generated from operating activities, credit facilities, mortgage financing and refinancing, and equity and debt issues. Our primary uses of capital include the payment of distributions, costs of attracting and retaining tenants, recurring property maintenance, major property improvements, debt principal repayments, interest payments and property acquisitions. We expect to meet all of our ongoing obligations with current cash and cash equivalents, cash generated from (utilized in) operations, draws on the revolving credit facility, conventional mortgage refinancings and, as growth requires and when appropriate, new equity or debt issues.
In our condensed consolidated financial statements prepared under International Financial Reporting Standards (“IFRS”), our current liabilities exceed our current assets by $151.3 million. Typically, real estate entities seek to address liquidity needs by having a balanced debt maturity schedule, undrawn credit facilities and a pool of unencumbered assets. We are able to use our revolving credit facility on short notice, which eliminates the need to hold a significant amount of cash and cash equivalents on hand. Working capital balances fluctuate significantly from period-to-period depending on the timing of receipts and payments. Scheduled principal repayments that are due within one year amount to $22.2 million, and debt maturities that are due within one year amount to $135.3 million. The debt maturities are typically refinanced with mortgages of terms between five and ten years. Amounts payable outstanding at the end of any reporting period depend primarily on the timing of leasing costs and capital expenditures incurred, as well as the impact of transaction costs incurred on any acquisitions or dispositions completed during the reporting period. Our unencumbered assets pool as at June 30, 2017 is $126.8 million. With our balanced debt maturity schedule, undrawn credit facility of $98.0 million and unencumbered assets pool, we have sufficient liquidity as at June 30, 2017.
The total debt as at June 30, 2017 is as follows:
June 30, 2017 December 31, 2016
Total debt $ 861,177 $ 868,347
Average term to maturity (years) 3.8 4.2
Financing activities New mortgage financing is highlighted in the table below:
Three and six months ended June 30, 2017
Weighted
Term to average face
maturity interest rate
Amount(1) (years) (%)
New mortgages $ 14,500 5.0 3.98
(1) Excludes financing costs.
On April 3, 2017, we completed a $14.5 million refinancing on a portfolio of two properties located in Edmonton with a term of five years at a face interest rate of 3.98% and an effective interest rate of 4.20%.
Revolving credit facility At June 30, 2017, no amounts were drawn from the $100 million available on the revolving credit facility and all other terms and conditions on the facility remained unchanged from December 31, 2016. The amounts available to be drawn at June 30, 2017 after the reserve of $2 million in the letter of credit and forward agreement was $98 million (December 31, 2016 – $98 million). The maturity date on the revolving credit facility is June 30, 2019.
Dream Industrial REIT 2017 Second Quarter Report | 13
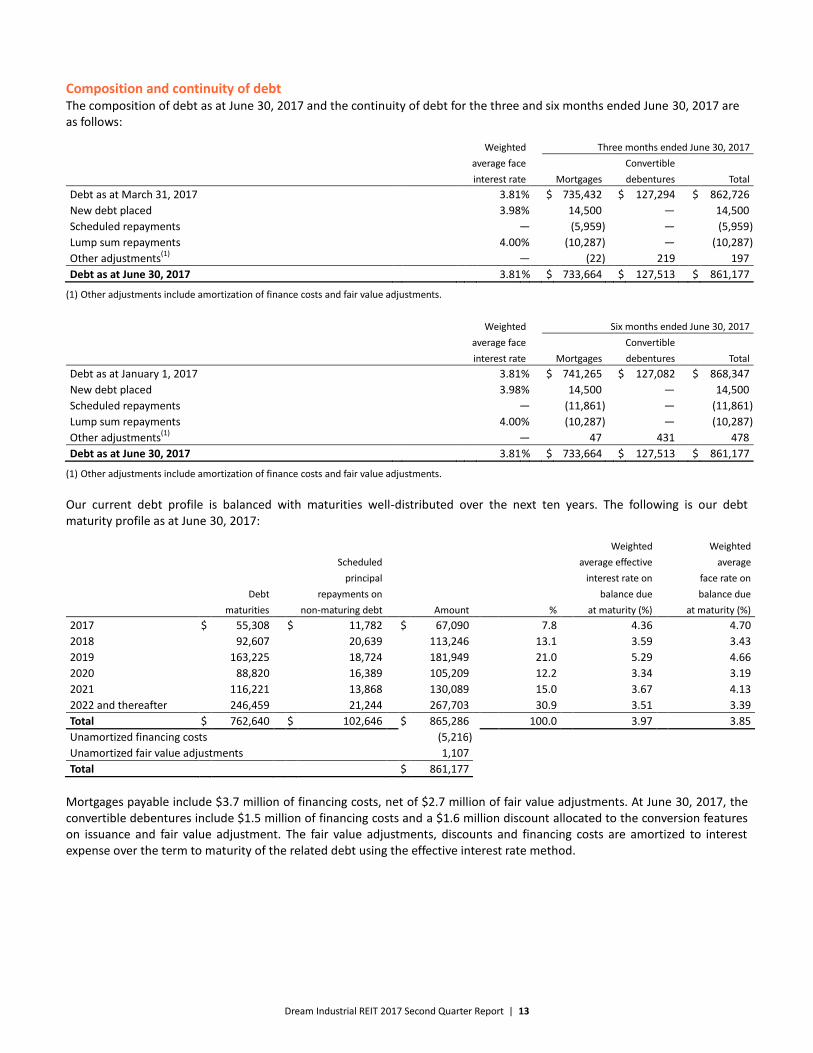
Composition and continuity of debt The composition of debt as at June 30, 2017 and the continuity of debt for the three and six months ended June 30, 2017 are as follows:
Weighted Three months ended June 30, 2017
average face Convertible
interest rate Mortgages debentures Total
Debt as at March 31, 2017 3.81 % $ 735,432 $ 127,294 $ 862,726
New debt placed 3.98 % 14,500 — 14,500
Scheduled repayments — (5,959 ) — (5,959 )
Lump sum repayments 4.00 % (10,287 ) — (10,287 )
Other adjustments(1)
— (22 ) 219 197
Debt as at June 30, 2017 3.81 % $ 733,664 $ 127,513 $ 861,177
(1) Other adjustments include amortization of finance costs and fair value adjustments.
Weighted Six months ended June 30, 2017
average face Convertible
interest rate Mortgages debentures Total
Debt as at January 1, 2017 3.81 % $ 741,265 $ 127,082 $ 868,347
New debt placed 3.98 % 14,500 — 14,500
Scheduled repayments — (11,861 ) — (11,861 )
Lump sum repayments 4.00 % (10,287 ) — (10,287 )
Other adjustments(1)
— 47 431 478
Debt as at June 30, 2017 3.81 % $ 733,664 $ 127,513 $ 861,177
(1) Other adjustments include amortization of finance costs and fair value adjustments.
Our current debt profile is balanced with maturities well-distributed over the next ten years. The following is our debt maturity profile as at June 30, 2017:
Weighted Weighted
Scheduled average effective average
principal interest rate on face rate on
Debt repayments on balance due balance due
maturities nonmaturing debt Amount % at maturity (%) at maturity (%)
2017 $ 55,308 $ 11,782 $ 67,090 7.8 4.36 4.70
2018 92,607 20,639 113,246 13.1 3.59 3.43
2019 163,225 18,724 181,949 21.0 5.29 4.66
2020 88,820 16,389 105,209 12.2 3.34 3.19
2021 116,221 13,868 130,089 15.0 3.67 4.13
2022 and thereafter 246,459 21,244 267,703 30.9 3.51 3.39
Total $ 762,640 $ 102,646 $ 865,286 100.0 3.97 3.85
Unamortized financing costs (5,216 )
Unamortized fair value adjustments 1,107
Total $ 861,177
Mortgages payable include $3.7 million of financing costs, net of $2.7 million of fair value adjustments. At June 30, 2017, the convertible debentures include $1.5 million of financing costs and a $1.6 million discount allocated to the conversion features on issuance and fair value adjustment. The fair value adjustments, discounts and financing costs are amortized to interest expense over the term to maturity of the related debt using the effective interest rate method.

Dream Industrial REIT 2017 Second Quarter Report | 14
Convertible debentures The total principal amounts outstanding for all of our convertible debentures are as follows:
Outstanding Outstanding REIT Units
principal principal if converted
Conversion June 30, August 8, August 8,
Date issued Maturity date price 2017 2017 2017
5.25% Debentures December 13, 2012 December 31, 2019 $ 13.80 $ 86,250 $ 86,250 6,250,000
5.25% Debentures December 19, 2012 December 31, 2019 13.80 25,000 25,000 1,811,594
6.75% Debentures May 15, 2013(1)
November 30, 2017 12.37 19,420 19,420 1,569,927
Total $ 130,670 $ 130,670 9,631,521
(1) The 6.75% Debentures were assumed as part of the C2C acquisition on May 15, 2013.
The fair value of the conversion feature of the convertible debentures is remeasured each period with fair value changes recorded in comprehensive income. At June 30, 2017, the conversion feature is valued at $4.0 million (December 31, 2016 – $3.3 million), and included in other non-current assets on the condensed consolidated balance sheet.
Commitments and contingencies We are contingently liable with respect to guarantees that are issued in the normal course of business and with respect to litigation and claims that may arise from time to time. In the opinion of management, any liability that may arise from such contingencies would not have a material adverse effect on our condensed consolidated financial statements.
Dream Industrial did not enter into any operating or finance leases as lessee during this reporting period. As at June 30, 2017, the Trust has entered into lease agreements with tenants that may require leasing and tenant improvement costs of approximately $1.3 million (June 30, 2016 – $3.6 million).
OUR EQUITY Our discussion of equity includes LP B Units, which are economically equivalent to REIT Units. However, pursuant to IFRS, the LP B Units are classified as a liability in our condensed consolidated financial statements.
Unitholders’ equity
June 30, 2017 December 31, 2016
Number of Units Amount Number of Units Amount
REIT Units 60,904,202 $ 600,004 59,633,237 $ 589,252
Retained earnings (deficit) — (12,402 ) — 2,727
Add: LP B Units 18,551,855 161,401 18,551,855 158,247
Accumulated other comprehensive loss — (484 ) — (869 )
Total equity(1)
79,456,057 $ 748,519 78,185,092 $ 749,357
(1) Total equity (non-GAAP measure) includes LP B Units.
Our Declaration of Trust authorizes the issuance of an unlimited number of two classes of units: REIT Units and Special Trust Units. The Special Trust Units may only be issued to holders of LP B Units, are not transferable separately from these Units and are used to provide voting rights with respect to Dream Industrial REIT to persons holding LP B Units. The LP B Units are held by wholly owned subsidiaries of Dream Office REIT. Both the REIT Units and the Special Trust Units entitle the holder to one vote for each Unit at all meetings of the unitholders. The LP B Units are exchangeable on a one-for-one basis for REIT Units at the option of the holder. The LP B Units and corresponding Special Trust Units together have economic and voting rights equivalent in all material respects to REIT Units. The REIT Units have economic and voting rights equivalent in all material respects to each other.
During the three months ended June 30, 2017, under the Distribution Reinvestment and Unit Purchase Plan (“DRIP”) for LP B Units and REIT Units, the Trust issued 419,969 REIT Units (836,064 for the six months ended June 30, 2017) to the subsidiaries of Dream Office REIT for a total cost of $3.6 million ($7.2 million for the six months ended June 30, 2017). As at June 30, 2017, Dream Office REIT, directly and indirectly through its wholly owned subsidiaries, held 1,718,537 REIT Units and 18,551,855 LP B Units, representing approximately 25.5% ownership in the Trust.

Dream Industrial REIT 2017 Second Quarter Report | 15
The following table summarizes the changes in our outstanding equity:
REIT Units LP B Units Total
Total Units outstanding on January 1, 2017 59,633,237 18,551,855 78,185,092
Units issued pursuant to DRIP 1,187,352 — 1,187,352
Units issued pursuant to Unit Purchase Plan 271 — 271
Units issued pursuant to Deferred Unit Incentive Plan (“DUIP”) 83,342 — 83,342
Total Units outstanding on June 30, 2017 60,904,202 18,551,855 79,456,057
Percentage of all Units 76.7% 23.3% 100.0%
Units issued pursuant to Unit Purchase Plan 114 — 114
Units issued pursuant to DRIP on July 17, 2017 209,213 — 209,213
Total Units outstanding on August 8, 2017(1)
61,113,529 18,551,855 79,665,384
Percentage of all Units 76.7% 23.3% 100.0%
(1) The date of this report.
Normal course issuer bid The Trust renewed its normal course issuer bid, which commenced on December 19, 2016 and will remain in effect until the earlier of December 18, 2017 or the date on which the Trust has purchased the maximum number of REIT Units permitted under the bid. Under the bid, the Trust has the ability to purchase for cancellation up to a maximum of 5,803,445 REIT Units (representing 10% of the REIT’s public float of 58,034,459 REIT Units as at December 1, 2016) through the facilities of the Toronto Stock Exchange (the “TSX”) at prevailing market prices and in accordance with the rules and policies of the TSX. The actual number of REIT Units that may be purchased and the timing of any such purchases will be determined by the Trust, subject to a maximum daily purchase limitation of 29,969 REIT Units except where purchases are made in accordance with block purchase exemptions under applicable TSX rules. To the date of this MD&A, no purchases have been made.
Distribution policy Our Declaration of Trust provides our trustees with the discretion to determine the percentage payout of income that would be in the best interest of the Trust, which allows for any unforeseen expenditures.
We currently pay monthly distributions of $0.058 per Unit, or $0.70 per Unit on an annual basis. For the quarter ended June 30, 2017, approximately 36.9% of our total Units were enrolled in the DRIP.
2017 2016 2015
Q2 Q1 Q4 Q3 Q2 Q1 Q4 Q3
Annualized distribution rate $ 0.70 $ 0.70 $ 0.70 $ 0.70 $ 0.70 $ 0.70 $ 0.70 $ 0.70
Monthly distribution rate $ 0.058 $ 0.058 $ 0.058 $ 0.058 $ 0.058 $ 0.058 $ 0.058 $ 0.058
Period-end closing price $ 8.70 $ 8.22 $ 8.53 $ 7.85 $ 8.73 $ 8.04 $ 7.18 $ 7.89
Annualized distribution yield on
closing price (%)(1)
8.0 % 8.5 % 8.2 % 8.9 % 8.0 % 8.7 % 9.7 % 8.9 %
(1) Annualized distribution yield is calculated as the annualized distribution rate divided by the period-end closing price.
Dream Industrial REIT 2017 Second Quarter Report | 16
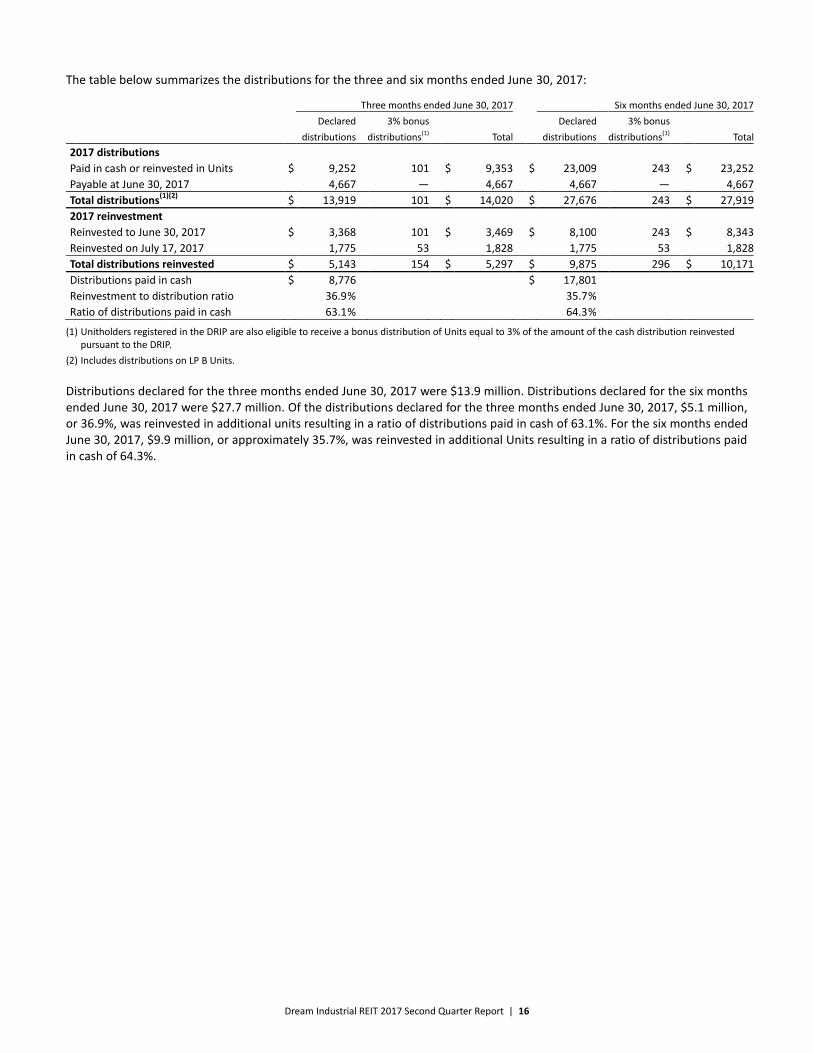
The table below summarizes the distributions for the three and six months ended June 30, 2017:
Three months ended June 30, 2017 Six months ended June 30, 2017
Declared 3% bonus Declared 3% bonus
distributions distributions(1) Total distributions distributions(1) Total
2017 distributions
Paid in cash or reinvested in Units $ 9,252 101 $ 9,353 $ 23,009 243 $ 23,252
Payable at June 30, 2017 4,667 — 4,667 4,667 — 4,667
Total distributions(1)(2)
$ 13,919 101 $ 14,020 $ 27,676 243 $ 27,919
2017 reinvestment
Reinvested to June 30, 2017 $ 3,368 101 $ 3,469 $ 8,100 243 $ 8,343
Reinvested on July 17, 2017 1,775 53 1,828 1,775 53 1,828
Total distributions reinvested $ 5,143 154 $ 5,297 $ 9,875 296 $ 10,171
Distributions paid in cash $ 8,776 $ 17,801
Reinvestment to distribution ratio 36.9 % 35.7 %
Ratio of distributions paid in cash 63.1 % 64.3 %
(1) Unitholders registered in the DRIP are also eligible to receive a bonus distribution of Units equal to 3% of the amount of the cash distribution reinvested pursuant to the DRIP.
(2) Includes distributions on LP B Units.
Distributions declared for the three months ended June 30, 2017 were $13.9 million. Distributions declared for the six months ended June 30, 2017 were $27.7 million. Of the distributions declared for the three months ended June 30, 2017, $5.1 million, or 36.9%, was reinvested in additional units resulting in a ratio of distributions paid in cash of 63.1%. For the six months ended June 30, 2017, $9.9 million, or approximately 35.7%, was reinvested in additional Units resulting in a ratio of distributions paid in cash of 64.3%.

Dream Industrial REIT 2017 Second Quarter Report | 17
OUR RESULTS OF OPERATIONS
Three months ended June 30, Six months ended June 30,
2017 2016 2017 2016
Investment properties revenue $ 42,664 $ 44,704 $ 85,531 $ 88,741
Investment properties operating expenses (13,728 ) (15,174 ) (28,194 ) (29,556 )
Net rental income 28,936 29,530 57,337 59,185
Other income
Interest and fee income 32 7 57 23
32 7 57 23
Other expenses
General and administrative (2,124 ) (2,559 ) (4,273 ) (4,955 )
Interest:
Interest expense on debt (8,612 ) (8,862 ) (17,196 ) (17,809 )
Subsidiary redeemable units (3,344 ) (3,247 ) (6,688 ) (6,493 )
Depreciation and amortization (14 ) (13 ) (28 ) (26 )
(14,094 ) (14,681 ) (28,185 ) (29,283 )
Fair value adjustments and other items
Fair value adjustments to investment properties (13,606 ) (2,465 ) (19,666 ) (5,601 )
Fair value adjustments to financial instruments (8,219 ) (11,211 ) (2,223 ) (28,463 )
Net losses on transactions and other activities (802 ) (1,305 ) (1,733 ) (3,486 )
(22,627 ) (14,981 ) (23,622 ) (37,550 )
Income (loss) before income taxes (7,753 ) (125 ) 5,587 (7,625 )
Recovery of income taxes 645 351 515 254
Net income (loss) for the period $ (7,108 ) $ 226 $ 6,102 $ (7,371 )
Investment properties revenue Investment properties revenue includes rental income from investment properties as well as the recovery of operating costs and property taxes from tenants. Investment properties revenue totalled $42.7 million for the quarter, a decrease of $2.0 million, or 4.6%, over the prior year comparative quarter. The decrease is primarily due to the impact of sold properties during 2016; there were also smaller decreases in straight-line rent and comparative properties revenue. For the six months ended June 30, 2017, investment properties revenue decreased by $3.2 million, or 3.6%, compared to the prior year comparative period, primarily due to the impact of sold properties during 2016 and properties classified as assets held for sale, slightly offset by an increase in comparative properties revenue. There was also a smaller decrease in straight-line rent and an increase in amortization of lease incentives.
Investment properties operating expenses Operating expenses comprise occupancy costs and property taxes as well as certain expenses that are not recoverable from tenants. Operating expenses fluctuate with changes in occupancy levels, weather, utility costs, realty taxes, and repairs and maintenance.
Investment properties operating expenses decreased by $1.4 million, or 9.5%, compared to the prior year comparative quarter. The decrease is primarily due to the impact of sold properties during 2016, as well as lower comparative properties expense, specifically recoverable operating expense. For the six months ended June 30, 2017, investment properties operating expenses decreased by $1.4 million, or 4.6%, compared to the prior year comparative period due to the impact of sold properties in 2016.

Dream Industrial REIT 2017 Second Quarter Report | 18
General and administrative General and administrative expenses comprise expenses related to corporate management, trustees’ fees and expenses, investor relations and asset management fees. The following table summarizes our general and administrative expenses for the three and six months ended June 30:
Three months ended June 30, Six months ended June 30,
2017 2016 2017 2016
Asset management fee $ 1,002 $ 1,044 $ 2,005 $ 2,092
Deferred compensation expenses 375 383 678 727
Professional fees 312 376 624 728
General corporate expenses(1)
435 756 966 1,408
Total $ 2,124 $ 2,559 $ 4,273 $ 4,955
(1) Includes corporate management and Board of Trustees’ fees and expenses.
General and administrative expenses decreased by $0.4 million, or 17.0%, compared to the prior year comparative quarter (decrease of $0.7 million, or 13.8%, compared to the six months ended June 30, 2016), primarily due to savings as a result of the cost reduction program implemented during the fourth quarter of 2016.
Interest expense – debt Interest expense on debt decreased by $0.3 million, or 2.8%, compared to the prior year comparative quarter ($0.6 million, or 3.4%, compared to the six months ended June 30, 2016), primarily due to debt repayments from the proceeds of 2016 dispositions. This is offset by additional refinancing and mark-to-market amortizations on matured mortgages.
Fair value adjustments to investment properties During the three and six months ended June 30, 2017, the Trust recorded fair value losses to investment properties of $13.6 million and $19.7 million, respectively. On a regional basis, for the three months ended June 30, 2017, there was a fair value loss of $11.9 million in Eastern Canada, $6.0 million loss in Western Canada and $3.9 million loss in Québec, offset by an $8.2 million gain in Ontario. For the six months ended June 30, 2017, there was a fair value loss of $13.1 million in Eastern Canada, $12.8 million loss in Western Canada and $5.2 million loss in Québec, offset by an $11.4 million gain in Ontario.
Fair value adjustments to financial instruments Fair value adjustments to financial instruments include fair value adjustments on the conversion feature of convertible debt, remeasurement of the carrying value of subsidiary redeemable units, remeasurement of the deferred trust units, and fair value adjustments on the interest rate swap.
During the three and six months ended June 30, 2017, the Trust recorded a gain of $0.5 million and $0.7 million, respectively, on the remeasurement on conversion feature of the convertible debentures, due to changes in the trading price of the convertible debentures.
During the three and six months ended June 30, 2017, the Trust recorded a loss of $8.9 million and $3.2 million, respectively, on the measurement of the subsidiary redeemable units, due to an increase in the trading value of REIT Units.
During the three and six months ended June 30, 2017, the Trust recorded a loss of $0.4 million and $0.3 million, respectively, on the measurement of deferred trust units, due to an increase in the trading value of REIT Units.
In August 2015, the Trust entered into an interest rate swap agreement for an initial notional value of $50 million to effectively fix the interest rate on a variable rate mortgage. The Trust did not apply hedge accounting to this relationship; therefore the fair value adjustment on the interest rate swap is recognized in net income. For the three months ended June 30, 2017, the fair value adjustment resulted in a gain of $0.6 million ($0.5 million for the six months ended June 30, 2017).
Net losses on transactions and other activities Net losses on transactions and other activities decreased by $0.5 million compared to the prior year comparative quarter ($1.8 million compared to the six months ended June 30, 2016). The decrease is due to business transformation charges which have ceased since October 2016, lower internal leasing costs from the cost reduction program, and the loss on sale of investment properties in 2016.

Dream Industrial REIT 2017 Second Quarter Report | 19
Related party transactions Dream Industrial and its subsidiaries enter into transactions with related parties that are disclosed in Note 13 to the condensed consolidated financial statements.
Pursuant to the Asset Management Agreement, Shared Services and Cost Sharing Agreement, during the three months ended June 30, 2017, the Trust paid $1.2 million (six months ended June 30, 2017 – $2.6 million) to DAM.
Pursuant to the Services Agreement, during the three months ended June 30, 2017, the Trust paid $0.9 million (six months ended June 30, 2017 – $1.6 million) to Dream Office REIT.
Subsequent to the quarter-end, the Trust entered into a purchase and sale agreement with Dream Office REIT as described on page 4 of this MD&A and as disclosed in Note 18 to the condensed consolidated financial statements.
Net operating income (“NOI”) We define NOI as investment properties revenue less investment properties operating expenses, including the share of net rental income from investments in joint venture and property management income, if any. As a result of the Trust not having any net rental income from investments in joint ventures or property management income, during the periods ended June 30, 2017, NOI is the same as net rental income presented in the condensed consolidated financial statements.
NOI is an important measure used by management in evaluating property operating performance; however, it is not defined by IFRS, does not have a standard meaning and may not be comparable with similar measures presented by other income trusts.
Three months ended June 30, Six months ended June 30,
2017 2016 2017 2016
Amount % Amount % Amount % Amount %
Western Canada $ 11,253 39 % $ 11,480 39 % $ 22,428 39 % $ 23,022 39 %
Ontario 7,747 27 % 7,613 26 % 15,292 27 % 15,281 26 %
Québec 5,683 19 % 5,947 20 % 11,279 20 % 11,789 20 %
Eastern Canada 4,253 15 % 4,490 15 % 8,338 14 % 9,093 15 %
NOI $ 28,936 100 % $ 29,530 100 % $ 57,337 100 % $ 59,185 100 %
Net rental income reported per condensed
consolidated financial statements $ 28,936 $ 29,530 $ 57,337 $ 59,185
For the three months ended June 30, 2017, NOI decreased by $0.6 million, or 2.0%, when compared to the prior year comparative quarter. The decrease is primarily due to the impact of sold properties during 2016 and lower straight-line rent. The decrease is partially offset by an increase in comparative properties NOI. For the six months ended June 30, 2017, NOI decreased by $1.8 million, or 3.1%, over the prior year comparative period, for the same reasons described for the prior year comparative quarter, in addition to an increase in amortization of lease incentives.

Dream Industrial REIT 2017 Second Quarter Report | 20
Comparative properties NOI NOI shown below details comparative and non-comparative items to assist in understanding the impact each component has on NOI. The comparative properties disclosed in the following table are properties acquired prior to January 1, 2016 and exclude the properties sold during 2016 and properties classified as held for sale as at June 30, 2017. Comparative properties NOI excludes lease termination fees, other rental income, straight-line rent, bad debt expenses and amortization of lease incentives.
Three months ended June 30, Six months ended June 30,
Growth Growth
2017 2016 $ % 2017 2016 $ %
Western Canada $ 11,235 $ 11,376 $ (141 ) (1 ) $ 22,365 $ 22,785 $ (420 ) (2 )
Ontario 7,786 7,175 611 9 15,410 14,384 1,026 7
Québec 5,754 5,451 303 6 11,434 10,810 624 6
Eastern Canada 4,361 4,458 (97 ) (2 ) 8,552 8,924 (372 ) (4 )
Comparative properties NOI 29,136 28,460 676 2 57,761 56,903 858 2
Lease termination fees 33 31 2 60 71 (11 )
Other rental income 3 88 (85 ) 3 136 (133 )
Straight-line rent 169 440 (271 ) 393 825 (432 )
Bad debt expenses (10 ) (129 ) 119 (127 ) (183 ) 56
Amortization of lease incentives (278 ) (162 ) (116 ) (521 ) (301 ) (220 )
NOI $ 29,053 $ 28,728 $ 325 1 $ 57,569 $ 57,451 $ 118 —
NOI from properties held for sale (117 ) 10 (127 ) (232 ) 154 (386 )
NOI from sold properties — 792 (792 ) — 1,580 (1,580 )
NOI including income from assets held for sale
and sold properties $ 28,936 $ 29,530 $ (594 ) (2 ) $ 57,337 $ 59,185 $ (1,848 ) (3 )
Net rental income reported per condensed
consolidated financial statements $ 28,936 $ 29,530 $ 57,337 $ 59,185
Average occupancy (comparative properties) 95.0% 94.5% 94.5% 94.4%
In-place rental rates (per sq. ft.) at quarter-end
(comparative properties) $ 7.20 $ 7.22 $ 7.20 $ 7.22
For the three months ended June 30, 2017, comparative properties NOI increased by $0.7 million, or 2.4%, compared to the prior year comparative quarter (increased by $0.9 million, or 1.5%, compared to the six months ended June 30, 2016). Ontario and Québec increased due to higher average occupancy, as well as higher recoveries on capital spending in 2016. This was offset by decreases in Western Canada and Eastern Canada; Western Canada decreased due to lower average occupancy, and Eastern Canada decreased due to vacancies in units with higher rents.

Dream Industrial REIT 2017 Second Quarter Report | 21
NOI prior quarter comparison The comparative properties discussed in the following table include properties acquired prior to January 1, 2017 and properties classified as asset held for sale at June 30, 2017.
Overall, the comparative properties NOI increased by $0.5 million, or 1.8%, when compared to the previous quarter. Comparative properties NOI increased across all regions primarily due to an increase in average occupancies in Western Canada, Ontario and Eastern Canada.
Three months ended
June 30, March 31, Growth
2017 2017 $ %
Western Canada $ 11,235 $ 11,130 $ 105 1
Ontario 7,786 7,624 162 2
Québec 5,754 5,680 74 1
Eastern Canada 4,361 4,191 170 4
Comparative properties NOI 29,136 28,625 511 2
Lease termination fees 33 27 6
Other rental income 3 — 3
Straight-line rent 169 224 (55 )
Bad debt expenses (10 ) (117 ) 107
Amortization of lease incentives (278 ) (243 ) (35 )
NOI $ 29,053 $ 28,516 $ 537 2
NOI from properties held for sale (117 ) (115 ) (2 )
NOI including income from assets held for sale and sold properties $ 28,936 $ 28,401 $ 535 2
Net rental income reported per condensed consolidated financial statements $ 28,936 $ 28,401
Average occupancy (comparative properties) 95.0% 94.5%
In-place rental rates (per sq. ft.) at quarter-end (comparative properties) $ 7.20 $ 7.19

Dream Industrial REIT 2017 Second Quarter Report | 22
Funds from operations and adjusted funds from operations
Three months ended June 30, Six months ended June 30,
2017 2016 2017 2016
Net income (loss) $ (7,108 ) $ 226 $ 6,102 $ (7,371 )
Add (deduct):
Amortization of lease incentives 278 162 521 301
Interest expense on subsidiary redeemable units 3,344 3,247 6,688 6,493
Fair value adjustments to investment properties 13,606 2,465 19,666 5,601
Fair value adjustments to financial instruments 8,219 11,211 2,223 28,463
Transaction costs — — — 969
Net loss on sale of investment properties — 145 — 215
Fair value adjustments of DUIP included in general
and administrative expenses 6 10 (7 ) (28 )
Debt settlement costs (gains) — — — (4 )
Internal leasing costs 802 1,035 1,583 2,056
(Recovery of) deferred income taxes (645 ) (351 ) (515 ) (254 )
FFO $ 18,502 $ 18,150 $ 36,261 $ 36,441
FFO $ 18,502 $ 18,150 $ 36,261 $ 36,441
Add (deduct):
Amortization of fair value adjustments on assumed debt (118 ) (343 ) (239 ) (725 )
Deferred unit compensation expense excluding
fair value adjustments 369 373 685 755
Straight-line rent (169 ) (440 ) (393 ) (825 )
Investment in business transformation activities — 125 — 250
18,584 17,865 36,314 35,896
Deduct:
Normalized initial direct leasing costs and non-recoverable
recurring capital expenditures 2,202 2,242 4,362 4,488
AFFO $ 16,382 $ 15,623 $ 31,952 $ 31,408
Funds from operations
Three months ended June 30, Six months ended June 30,
2017 2016 2017 2016
FFO $ 18,502 $ 18,150 $ 36,261 $ 36,441
FFO per Unit – basic(1)
$ 0.23 $ 0.23 $ 0.46 $ 0.47
FFO per Unit – diluted(1)
$ 0.23 $ 0.23 $ 0.45 $ 0.46
(1) The LP B Units are included in the calculation of basic and diluted FFO per Unit.
Basic FFO per Unit for the three months ended June 30, 2017 remained unchanged compared to the prior year comparative quarter. For the six months ended June 30, 2017, basic FFO decreased by $0.01, or 2.6%, compared to the prior year comparative period.
Diluted FFO per Unit for the three months ended June 30, 2017 remained unchanged compared to the prior year comparative quarter. For the six months ended June 30, 2017, diluted FFO decreased by $0.01, or 2.2%, compared to the prior year comparative period.
The decrease in FFO per Unit compared to the prior year comparative period is due to the impact of sold properties in 2016 on NOI, offset by savings in general and administrative expenses and interest expense.

Dream Industrial REIT 2017 Second Quarter Report | 23
Adjusted funds from operations
Three months ended June 30, Six months ended June 30,
2017 2016 2017 2016
AFFO $ 16,382 $ 15,623 $ 31,952 $ 31,408
AFFO per Unit – basic(1)
$ 0.21 $ 0.20 $ 0.40 $ 0.41
AFFO per Unit – diluted(1)
$ 0.21 $ 0.20 $ 0.40 $ 0.40
(1) The LP B Units are included in the calculation of basic and diluted AFFO per Unit.
Basic AFFO per Unit for the three months ended June 30, 2017 increased by $0.01, or 2.5%, compared to the prior year comparative quarter. Basic AFFO per Unit for the six months ended June 30, 2017 decreased by $0.01, or 0.2%, compared to the prior year comparative period.
Diluted AFFO per Unit for the three months ended June 30, 2017 increased by $0.01, or 2.5%, compared to the prior year comparative quarter. Diluted AFFO per Unit for the six months ended June 30, 2017 remained unchanged compared to the prior year comparative period.
The movements were primarily due to the same factors impacting FFO and the exclusion of certain accounting adjustments, such as straight-line rent and fair value adjustments on assumed debt.
QUARTERLY INFORMATION The following tables show quarterly information since July 1, 2015:
Key leasing, financing and portfolio information
2017 2016 2015
Q2 Q1 Q4 Q3 Q2 Q1 Q4 Q3
Leasing
Occupancy rate – including committed (period-end) 96.8 % 96.0 % 95.2 % 94.5 % 94.7 % 94.7 % 95.0 % 94.6 %
Occupancy rate – in-place (period-end) 94.9 % 93.9 % 93.8 % 93.2 % 93.7 % 93.5 % 93.4 % 93.2 %
Tenant renewal ratio 67.4 % 84.6 % 66.1 % 72.3 % 59.6 % 69.2 % 63.2 % 65.1 %
Average in-place base rent per sq. ft. (period-end) $ 7.19 $ 7.19 $ 7.19 $ 7.13 $ 7.14 $ 7.15 $ 7.14 $ 7.15
Estimated market rent in excess of in-place rent (%) 1.0 % 1.4 % 1.3 % 1.5 % 1.4 % 2.7 % 2.9 % 2.9 %
Financing
Weighted average face interest rate(2)
3.81 % 3.81 % 3.81 % 3.83 % 3.86 % 3.87 % 3.91 % 3.94 %
Interest coverage ratio (times)(3)
3.3 3.2 3.1 3.1 3.1 3.1 3.1 3.1
Level of debt (debt-to-total assets)(3)
52.4 % 52.3 % 52.6 % 52.7 % 53.3 % 53.7 % 53.8 % 52.2 %
Portfolio
Number of properties(1) 212 213 213 217 219 219 219 220
GLA (in millions of sq. ft.) 16.1 16.2 16.2 16.6 17.0 17.0 17.0 16.9
(1) Excludes property or properties held for sale at each quarter.
(2) Weighted average face interest rate is calculated as the weighted average face interest rate of all interest bearing debt.
(3) The calculation of the following non-GAAP measures – interest coverage ratio and level of debt (debt-to-total assets) – is included in the “Non-GAAP measures and other disclosures” section of the MD&A.

Dream Industrial REIT 2017 Second Quarter Report | 24
Results of operations
2017 2016 2015
Q2 Q1 Q4 Q3 Q2 Q1 Q4 Q3
Investment properties revenue $ 42,664 $ 42,867 $ 42,715 $ 43,233 $ 44,704 $ 44,037 $ 44,463 $ 43,634
Investment properties operating expenses (13,728 ) (14,466 ) (13,939 ) (13,807 ) (15,174 ) (14,382 ) (14,550 ) (13,762 )
Net rental income 28,936 28,401 28,776 29,426 29,530 29,655 29,913 29,872
Other income 32 25 41 4 7 16 7 11
Other expenses (14,094 ) (14,091 ) (14,590 ) (14,525 ) (14,681 ) (14,602 ) (14,375 ) (14,318 )
Fair value adjustments and other items (22,627 ) (995 ) (23,799 ) (947 ) (14,981 ) (22,569 ) (30,219 ) 349
Income (loss) before income taxes (7,753 ) 13,340 (9,572 ) 13,958 (125 ) (7,500 ) (14,674 ) 15,914
Recovery of (deferred) income taxes 645 (130 ) (30 ) 325 351 (97 ) (57 ) (79 )
Net income (loss) $ (7,108 ) $ 13,210 $ (9,602 ) $ 14,283 $ 226 $ (7,597 ) $ (14,731 ) $ 15,835
Other comprehensive income (loss)
Unrealized gain (loss) on interest rate swap $ 310 $ 75 $ 360 $ 157 $ 144 $ 47 $ 120 $ (119 )
310 75 360 157 144 47 120 (119 )
Comprehensive income (loss) $ (6,798 ) $ 13,285 $ (9,242 ) $ 14,440 $ 370 $ (7,550 ) $ (14,611 ) $ 15,716
Calculation of funds from operations
2017 2016 2015
Q2 Q1 Q4 Q3 Q2 Q1 Q4 Q3
Net income (loss) $ (7,108 ) $ 13,210 $ (9,602 ) $ 14,283 $ 226 $ (7,597 ) $ (14,731 ) $ 15,835
Add (deduct):
Amortization of lease incentives 278 243 249 192 162 139 173 135
Interest expense on subsidiary
redeemable units 3,344 3,344 3,311 3,246 3,247 3,246 3,247 3,247
Fair value adjustments to investment
properties 13,606 6,060 7,784 18,648 2,465 3,136 7,300 2,583
Fair value adjustments to financial
instruments 8,219 (5,996 ) 13,385 (19,497 ) 11,211 17,252 (13,193 ) (4,387 )
Net loss on sale of investment properties — — 130 472 145 70 41 281
Fair value adjustments of DUIP included
in general and administrative expenses 6 (13 ) 2 (27 ) 10 (38 ) (88 ) (60 )
Debt settlement costs (gains) — — 369 218 — (4 ) — 115
Internal leasing costs 802 781 1,019 981 1,035 1,021 1,023 914
Transaction costs — — — — — 969 — —
Impairment of goodwill — — — — — — 34,903 —
(Recovery of) deferred income taxes (645 ) 130 30 (325 ) (351 ) 97 57 79
FFO $ 18,502 $ 17,759 $ 16,677 $ 18,191 $ 18,150 $ 18,291 $ 18,732 $ 18,742
FFO per Unit – basic(1) $ 0.23 $ 0.23 $ 0.21 $ 0.23 $ 0.23 $ 0.24 $ 0.24 $ 0.24
FFO per Unit – diluted(1)(2) $ 0.23 $ 0.22 $ 0.21 $ 0.23 $ 0.23 $ 0.23 $ 0.24 $ 0.24
(1) The LP B Units are included in the calculation of basic and diluted FFO per Unit.
(2) Diluted FFO per Unit for each quarter listed above excludes $2.0 million in interest on convertible debentures.

Dream Industrial REIT 2017 Second Quarter Report | 25
2017 2016 2015
Q2 Q1 Q4 Q3 Q2 Q1 Q4 Q3
Funds from operations (FFO) $ 18,502 $ 17,759 $ 16,677 $ 18,191 $ 18,150 $ 18,291 $ 18,732 $ 18,742
Add (deduct):
Amortization of fair value adjustment
on assumed debt (118 ) (121 ) (175 ) (262 ) (343 ) (382 ) (471 ) (532 )
Deferred unit compensation expense
excluding fair value adjustments 369 316 345 374 373 382 378 376
Straight-line rent (169 ) (224 ) (180 ) (273 ) (440 ) (385 ) (326 ) (441 )
Investment in business transformation
activities — — 42 125 125 125 145 145
18,584 17,730 16,709 18,155 17,865 18,031 18,458 18,290
Adjusted for:
Normalized initial direct leasing costs
and non-recoverable recurring
capital expenditures 2,202 2,160 2,221 2,232 2,242 2,246 2,267 2,246
Adjusted funds from operations (AFFO) $ 16,382 $ 15,570 $ 14,488 $ 15,923 $ 15,623 $ 15,785 $ 16,191 $ 16,044
AFFO per Unit – basic and diluted(1)(2)
$ 0.21 $ 0.20 $ 0.19 $ 0.20 $ 0.20 $ 0.20 $ 0.21 $ 0.21
Weighted average Units outstanding for
FFO and AFFO(3)
Basic (in thousands) 79,437 78,681 78,099 77,875 77,717 77,456 77,214 77,059
Diluted (in thousands) 89,299 88,892 88,302 88,096 87,931 87,608 87,318 87,152
(1) The LP B Units are included in the calculation of basic and diluted AFFO per Unit.
(2) Diluted AFFO per Unit for each quarter listed above excludes $1.9 million in interest on convertible debentures.
(3) A description of the weighted average number of Units (non-GAAP measure) can be found under the heading “Non-GAAP measures and other disclosures”.

Dream Industrial REIT 2017 Second Quarter Report | 26
NON-GAAP MEASURES AND OTHER DISCLOSURES The following non-GAAP measures are important measures used by management in evaluating the Trust’s underlying operating performance and debt management. These non-GAAP measures are not defined by IFRS, do not have a standardized meaning and may not be comparable with similar measures presented by other income trusts.
In March 2017, the Real Property Association of Canada published two white papers, dated February 2017, on “FFO and AFFO” and “Adjusted Cash Flow From Operations”, with a recommended adoption date for fiscal years commencing on or after January 1, 2017 and with prior period amounts restated to conform to the new definition(s). The Trust is in the process of reviewing the white papers and the impact to its disclosures.
Funds from operations Management believes FFO is an important measure of our operating performance. This non-GAAP measure is a commonly used measure of performance of real estate operations; however, it does not represent net income or cash generated from (utilized in) operating activities, as defined by IFRS, and is not necessarily indicative of cash available to fund Dream Industrial REIT’s needs. FFO is not defined by IFRS, does not have a standard meaning and may not be comparable with similar measures presented by other issuers.
In compliance with Canadian Securities Administrators Staff Notice 52-306 (Revised), “Non-GAAP Financial Measures”, FFO has been reconciled to net income under the heading “Funds from operations and adjusted funds from operations”.
Adjusted funds from operations Management believes AFFO is an important measure of our economic performance and is indicative of our ability to pay distributions. This non-GAAP measurement is commonly used for assessing real estate performance; however, it does not represent cash generated from (utilized in) operating activities, as defined by IFRS, and is not necessarily indicative of cash available to fund the Trust’s needs. AFFO is not defined by IFRS, does not have a standard meaning and may not be comparable with similar measures presented by other issuers. In calculating AFFO, we also normalize leasing costs, which fluctuate with lease maturities, renewal terms and the type of asset being leased.
In determining AFFO, the Trust assumes 8% of NOI, adjusted for straight-line rent, property management income and amortization of tenant inducements for normalized initial direct leasing costs and non-recoverable maintenance capital expenditures. Management uses 8% of NOI adjusted for the above items as the normalized initial direct leasing costs and non-recoverable maintenance capital expenditures based on assessments of the condition of our properties, history from vendors, internal capital expenditure budgets, level of expiries and appraisal data, taking into account that these expenditures typically are not incurred at a rate that is consistent from period to period. We also evaluate the impact of leasing activity based on averages of our portfolio from time to time based on actual experience.
In compliance with Canadian Securities Administrators Staff Notice 52-306 (Revised), “Non-GAAP Financial Measures”, AFFO has been reconciled to cash generated from operating activities under the heading “Cash generated from (utilized in) operating activities to AFFO reconciliation”.
NOI NOI is defined by the Trust as investment properties revenue, less investment properties operating expenses, plus the share of net rental income from investments in joint ventures and property management income, if any. This non-GAAP measure is an important measure used by the Trust in evaluating property operating performances; however, it is not defined by IFRS, does not have a standard meaning and may not be comparable with similar measures presented by other issuers. As a result of the Trust not having any net rental income from investments in joint ventures or property management income during the periods ended June 30, 2017 and June 30, 2016, NOI is the same as net rental income presented in the condensed consolidated financial statements. In compliance with Canadian Securities Administrators Staff Notice 52-306 (Revised), “Non-GAAP Financial Measures”, NOI has been reconciled to net rental income under the heading “Net operating income”.
Stabilized NOI Stabilized NOI for an individual property is defined by the Trust as investment properties revenue less investment properties operating expenses adjusted for items such as average lease up costs, long-term vacancy rates, non-recoverable capital expenditures, management fees, straight-line rents and other non-recurring items. This non-GAAP measure is an important measure used by the Trust in determining the fair value of individual investment properties; however, it is not defined by IFRS, does not have a standard meaning and may not be comparable with similar measures presented by other issuers.

Dream Industrial REIT 2017 Second Quarter Report | 27
Comparative properties NOI Comparative properties NOI is an important non-GAAP measure used by management to evaluate the performance of the properties fully owned by the Trust in both the current and comparative periods presented, excluding the properties held for sale at the period-end date. This non-GAAP measure is not defined by IFRS, does not have a standard meaning and may not be comparable with similar measures presented by other issuers. Comparative properties NOI excludes lease termination fees and certain other adjustments, straight-line rents, bad debt expenses and amortization of lease incentives.
In compliance with Canadian Securities Administrators Staff Notice 52-306 (Revised), “Non-GAAP Financial Measures”, comparative properties NOI has been reconciled to net rental income under the headings “Comparative properties NOI” and “NOI prior quarter comparison”.
Weighted average number of Units The basic weighted average number of Units outstanding used in the FFO and AFFO calculations includes the weighted average of all REIT Units, LP B Units, and vested but unissued deferred trust units and income deferred trust units. The diluted weighted average number of Units assumes the conversion of the convertible debentures and includes the unvested deferred trust units and income deferred trust units. As at June 30, 2017, there were 815,052 deferred trust units and income deferred trust units outstanding.
Three months ended June 30, Six months ended June 30,
2017 2016 2017 2016
Weighted average Units outstanding for basic
per Unit amounts (in thousands) 79,437 77,717 79,109 77,586
Weighted average Units outstanding for diluted
per Unit amounts (in thousands) 89,299 87,931 89,236 87,770
Level of debt (debt-to-total assets) Management believes this non-GAAP measure is an important measure in the management of our debt levels. Level of debt is not defined by IFRS, does not have a standard meaning and may not be comparable with similar measures presented by other issuers. Level of debt (debt-to-total assets) as shown below is determined as total debt at principal amount outstanding divided by total assets.
In compliance with Canadian Securities Administrators Staff Notice 52-306 (Revised), “Non-GAAP Financial Measures”, the table below calculates the level of debt (debt-to-total assets):
June 30, December 31,
Amounts per condensed consolidated financial statements 2017 2016
Non-current debt $ 705,025 $ 780,622
Current debt 156,152 87,725
Total debt 861,177 868,347
Add (deduct):
Unamortized financing costs 5,216 5,932
Unamortized fair value adjustments (1,107 ) (1,346 )
Total debt at principal amount outstanding 865,286 872,933
Total assets $ 1,652,322 $ 1,658,076
Debt-to-total assets 52.4% 52.6%
Debt-to-adjusted EBITDA Management believes this non-GAAP measure is an important measure in determining the time it takes the Trust, based on its operating performance, to repay its debt. Debt-to-adjusted EBITDA is not defined by IFRS, does not have a standard meaning and may not be comparable with similar measures presented by other issuers.
Debt-to-adjusted EBITDA as shown below is determined as total debt at principal amount outstanding divided by annualized adjusted EBITDA for the quarter. Adjusted EBITDA is calculated as net income before taxes adjusted for fair value adjustments to investment properties and financial instruments, net losses on transactions and other activities, interest expense, depreciation and amortization, and other items included in investment properties revenue.

Dream Industrial REIT 2017 Second Quarter Report | 28
In compliance with Canadian Securities Administrators Staff Notice 52-306 (Revised), “Non-GAAP Financial Measures”, the table below calculates the debt-to-adjusted EBITDA:
Three months ended Three months ended
Amounts per condensed consolidated financial statements June 30, 2017 December 31, 2016
Non-current debt $ 705,025 $ 780,622
Current debt 156,152 87,725
Total debt 861,177 868,347
Add (deduct):
Unamortized financing costs 5,216 5,932
Unamortized fair value adjustments (1,107 ) (1,346 )
Total debt at principal amount outstanding $ 865,286 $ 872,933
Income (loss) before income taxes $ (7,753 ) $ (9,572 )
Add (deduct):
Fair value adjustments to investment properties 13,606 7,784
Fair value adjustments to financial instruments 8,219 13,385
Net losses on transactions and other activities 802 2,630
Interest – debt 8,612 8,762
Interest – subsidiary redeemable units 3,344 3,311
Depreciation and amortization 14 14
Other items included in investment properties revenues(1)
73 (361 )
Adjusted EBITDA – quarterly $ 26,917 $ 25,953
Adjusted EBITDA – annualized $ 107,668 $ 103,812
Debt-to-adjusted EBITDA (years) 8.0 8.4
(1) Includes adjustments for lease termination fees, other items that are non-recurring in nature, straight-line rent, amortization of lease incentives and NOI from sold properties.
Interest coverage ratio Management believes this non-GAAP measure is an important measure in determining our ability to cover interest expense based on our operating performance. It is not defined by IFRS, does not have a standard meaning and may not be comparable with similar measures presented by other issuers. Interest coverage ratio as shown below is calculated as net rental income plus interest and fee income, less general and administrative expenses, plus deferred unit compensation expense, all divided by interest expense on total debt excluding amortization of financing costs and fair value adjustments.
In compliance with Canadian Securities Administrators Staff Notice 52-306 (Revised), “Non-GAAP Financial Measures”, the table below calculates the interest coverage ratio:
Three months ended June 30, Six months ended June 30,
Amounts per condensed consolidated financial statements 2017 2016 2017 2016
Net rental income $ 28,936 $ 29,530 $ 57,337 $ 59,185
Add (deduct):
Interest and other 32 7 57 23
General and administrative expenses (2,124 ) (2,559 ) (4,273 ) (4,955 )
Deferred unit compensation expense 375 383 678 727
27,219 27,361 53,799 54,980
Interest expense incurred, at contractual rate $ 8,320 $ 8,841 $ 16,624 $ 17,817
Interest coverage ratio (times) 3.3 3.1 3.2 3.1

Dream Industrial REIT 2017 Second Quarter Report | 29
Adjusted cash generated from (utilized in) operating activities In any given period, actual distributions declared may differ from cash generated from (utilized in) operating activities, primarily due to seasonal fluctuations in non-cash working capital and the impact of when lease incentives and initial direct leasing costs are funded, if necessary, with our cash and cash equivalents and revolving credit facility. The Trust determines distributions and the distribution rate by, among other considerations, its assessment of cash flow as determined using adjusted cash generated from (utilized in) operating activities (a non-GAAP measure), which excludes the fluctuations in non-cash working capital, transaction costs on business combinations and investment in lease incentives and initial direct leasing costs. As such, the Trust believes the cash distributions are not an economic return of capital, but a distribution of sustainable adjusted cash generated from (utilized in) operating activities. Adjusted cash generated from (utilized in) operating activities is not defined by IFRS, does not have a standard meaning and may not be comparable with similar measures presented by other issuers.
The Trust anticipates that actual distributions declared will, in the foreseeable future, continue to vary from net income as net income includes non-cash items such as fair value adjustments to investment properties and fair value adjustments to financial instruments. Accordingly, the Trust does not use net income as a proxy for distributions.
As required by National Policy 41-201, “Income Trusts and Other Indirect Offerings”, the following table also outlines the differences between cash generated from (utilized in) operating activities and distributions paid and payable, as well as the differences between net income and distributions paid and payable, in accordance with the guidelines.
As the Trust uses adjusted cash generated from (utilized in) operating activities in determining its cash available for distribution, the following table also outlines the difference between adjusted cash generated from (utilized in) operating activities and distributions paid and payable:
Three months ended June 30, Six months ended June 30,
2017 2016 2017 2016
Net income (loss) $ (7,108 ) $ 226 $ 6,102 $ (7,371 )
Cash generated from operating activities 15,372 16,586 31,368 30,771
Add (deduct):
Investment in lease incentives and initial direct leasing costs 2,141 3,228 5,087 5,038
Change in non-cash working capital 692 (2,732 ) (885 ) (1,476 )
Adjusted cash generated from operating activities 18,205 17,082 35,570 34,333
Distributions paid and payable(1)
14,020 13,617 27,919 27,205
Excess of adjusted cash generated from
operating activities over distributions paid and payable 4,185 3,465 7,651 7,128
Shortfall of net income (loss) over distributions paid and payable (21,128 ) (13,391 ) (21,817 ) (34,576 )
Excess of cash generated from
operating activities over distributions paid and payable $ 1,352 $ 2,969 $ 3,449 $ 3,566
(1) Includes distributions on LP B Units.
For the three months ended June 30, 2017, adjusted cash generated from operating activities exceeded distributions paid and payable by $4.2 million ($3.5 million for the three months ended June 30, 2016). For the six months ended June 30, 2017, adjusted cash generated from operating activities exceeded distributions paid and payable by $7.7 million ($7.1 million for the six months ended June 30, 2017).
For the three months ended June 30, 2017, distributions paid and payable exceeded net income (loss) by $21.1 million ($13.4 million for the three months ended June 30, 2016). For the six months ended June 30, 2017, distributions paid and payable exceeded net income (loss) by $21.8 million ($34.6 million for the six months ended June 30, 2016). Net income is net of distributions paid and payable on subsidiary redeemable units of $3.4 million for the three months ended June 30, 2017 ($6.7 million for the six months ended June 30, 2016), which amounts are also included in distributions paid and payable.
The shortfalls for the three and six months ended June 30, 2017 were primarily driven by the fair value adjustments to financial instruments and investment properties. As this is a non-cash item and does not affect cash generated from operating activities and adjusted cash generated from operating activities (a non-GAAP term), the Trust does not believe that the distributions for the affected periods represent a return of capital and accordingly, the Trust does not anticipate cash distributions will be suspended in the foreseeable future.

Dream Industrial REIT 2017 Second Quarter Report | 30
Of the distributions paid and payable for the three months ended June 30, 2017, $5.3 million ($10.2 million for the six months ended June 30, 2017) was reinvested into the DRIP. Over time, reinvestments pursuant to the DRIP will increase the number of Units outstanding, which may result in upward pressure on the total amount of cash distributions. Our Declaration of Trust provides our trustees with the discretion to determine the percentage payout of income that would be in the best interest of the Trust, which allows for any unforeseen expenditures and the variability in cash distributions as a result of additional Units issued pursuant to the Trust’s DRIP.
Cash generated from (utilized in) operating activities to AFFO reconciliation AFFO is not defined by IFRS and, therefore, may not be comparable to similar measures presented by other real estate investment trusts. In compliance with Canadian Securities Administrators Staff Notice 52-306 (Revised), “Non-GAAP Financial Measures”, the table below reconciles AFFO to cash generated from (utilized in) operating activities:
Three months ended June 30, Six months ended June 30,
2017 2016 2017 2016
Cash generated from operating activities $ 15,372 $ 16,586 $ 31,368 $ 30,771
Add (deduct):
Initial direct leasing costs and lease incentives incurred 2,141 3,228 5,087 5,038
Change in non-cash working capital 692 (2,732 ) (885 ) (1,476 )
Amortization of financing costs on debt (409 ) (364 ) (811 ) (717 )
Depreciation of property and equipment (14 ) (13 ) (28 ) (26 )
Investment in business transformation activities — 125 — 250
Internal leasing costs 802 1,035 1,583 2,056
Normalized initial direct leasing costs and
non-recoverable recurring capital expenditures (2,202 ) (2,242 ) (4,362 ) (4,488 )
AFFO $ 16,382 $ 15,623 $ 31,952 $ 31,408
SECTION III – DISCLOSURE CONTROLS AND PROCEDURES AND INTERNAL CONTROL OVER FINANCIAL REPORTING
At June 30, 2017, the Chief Executive Officer (“CEO”) and Chief Financial Officer (“CFO”) of the Trust, along with the assistance of senior management, have designed disclosure controls and procedures to provide reasonable assurance that material information relating to Dream Industrial REIT is made known to the CEO and CFO in a timely manner and information required to be disclosed by Dream Industrial REIT is recorded, processed, summarized and reported within the time periods specified in securities legislation, and have designed internal controls over financial reporting to provide reasonable assurance regarding the reliability of financial reporting and the preparation of the condensed consolidated financial statements in accordance with IFRS.
During the six months ended June 30, 2017, there have not been any changes that have materially affected, or are reasonably likely to materially affect, the internal control over financial reporting.
SECTION IV – RISKS AND OUR STRATEGY TO MANAGE
We are exposed to various risks and uncertainties, many of which are beyond our control and could have an impact on our business, financial condition, operating results and prospects. Unitholders should consider these risks and uncertainties when assessing our outlook in terms of investment potential. For a discussion of the risks and uncertainties identified by Dream Industrial REIT, please refer to our 2016 Annual Report and our 2016 Annual Information Form filed on SEDAR (www.sedar.com).

Dream Industrial REIT 2017 Second Quarter Report | 31
SECTION V – CRITICAL ACCOUNTING POLICIES
CRITICAL ACCOUNTING JUDGMENTS, ESTIMATES AND ASSUMPTIONS IN APPLYING ACCOUNTING POLICIES Preparing the condensed consolidated financial statements requires management to make judgments, estimates and assumptions that affect the reported amounts of assets, liabilities, revenues and expenses, and the disclosures of contingent liabilities. Management bases its judgments and estimates on historical experience and other factors it believes to be reasonable under the circumstances, but that are inherently uncertain and unpredictable, the result of which is the basis of the carrying amounts of assets and liabilities. However, uncertainty about these assumptions and estimates could result in outcomes that could require a material adjustment in the future to the carrying amounts of the asset or liability affected. Dream Industrial’s critical accounting judgments, estimates and assumptions in applying accounting policies are described in Note 4 to the condensed consolidated financial statements and also in our annual consolidated financial statements for the year ended December 31, 2016.
CHANGES IN ACCOUNTING ESTIMATES AND CHANGES IN ACCOUNTING POLICIES Future accounting policy changes Dream Industrial’s changes in accounting policies are described in Note 3 to the condensed consolidated financial statements and in the annual consolidated financial statements for the year ended December 31, 2016.
Additional information Additional information relating to Dream Industrial REIT, including the latest Annual Information Form of Dream Industrial REIT, is available on SEDAR (www.sedar.com).

Dream Industrial REIT 2017 Second Quarter Report | 32
SECTION VI – SUPPLEMENTARY INFORMATION
The tables in this section include supplementary information on our portfolio as at June 30, 2017.
PROPERTY LIST AND SELECTED DATA
Property Ownership
Total GLA in
square feet
Owned share of
total GLA in square feet
Year built/ renovated
Clear ceiling height
(warehouse component)
in feet
Total site area in acres
Owned share of site area in acres
No. of tenants
Weighted average
remaining lease
term in years
In-place and committed occupancy
7140 40th Street SE, Calgary 100% 351,306 351,306 1978/2007 30.0 13.8 13.8 1 5.3 100.0%
1919 84th Avenue (Park 19), Edmonton 100% 48,365 48,365 1975/1987 21.0 3.7 3.7 1 1.9 100.0%
2721 Hopewell Place NE, Calgary 100% 37,690 37,690 2006 22.0 1.9 1.9 1 5.3 100.0%
204 - 26229 Township Road 531A (Parkland County), Edmonton 100% 34,904 34,904 2005 24.0 9.0 9.0 1 2.7 100.0%
6908 6th Street SE (Glenmore Business Park), Calgary 100% 31,467 31,467 1978 18.0 3.2 3.2 1 2.3 100.0%
3917 81st Avenue, Edmonton 100% 30,353 30,353 2006 28.0 5.5 5.5 1 3.8 100.0%
2876 Sunridge Way NE (Sunridge Business Park), Calgary 100% 30,000 30,000 2000 16.0 2.3 2.3 1 3.4 100.0%
3250 Sunridge Way NE (Sunridge Business Park), Calgary 100% 27,180 27,180 2000 24.0 2.1 2.1 1 3.1 100.0%
9601 156th Avenue, Grand Prairie 100% 27,058 27,058 2005 24.0 27.3 27.3 1 2.7 100.0%
2240 Premier Way (GE Turbine), Edmonton 100% 26,381 26,381 2003 30.0 1.5 1.5 1 5.1 100.0%
1802 Stock Road, Regina 50% 46,157 23,079 2012 28.0 3.6 1.8 1 5.9 100.0%
7121 6th Street SE (Glenmore Business Park), Calgary 100% 19,274 19,274 1984 20.0 0.9 0.9 1 4.4 100.0%
120 Pond Street East, Brooks 100% 14,305 14,305 2006 24.0 5.2 5.2 1 4.3 100.0%
363 Maxwell Crescent, Regina 50% 23,415 11,708 1984/1997 24.0 0.4 0.2 1 3.7 100.0%
1105 Pettigrew Avenue, Regina 50% 12,234 6,117 1980/2012 18.0 2.1 1.1 1 0.8 100.0%
2190 Industrial Drive, Regina 50% 11,677 5,839 2006 18.0 2.7 1.4 1 4.9 100.0%
1640 Broder Street, Regina 50% 11,169 5,585 1989/1997 16.0 1.1 0.5 1 6.6 100.0%
Western Canada Single-tenant 93.3% 782,935 730,611 26.1 86.3 81.4 17 4.4 100.0%
310 Henderson Drive, Regina 100% 373,284 373,284 1976 24.0 24.0 24.0 2 6.3 100.0%
15303 128th Avenue, Edmonton 100% 177,058 177,058 1977/2004 25.0 12.4 12.4 3 6.6 100.0%
611-615 71st Avenue SE & 7515 6th Street SE (Glenmore Business Park), Calgary 100% 167,779 167,779 1979 20.0 6.5 6.5 16 3.0 96.9%
628-668 Henderson Drive (Chestermere), Regina 100% 164,055 164,055 1975 19.0 9.1 9.1 21 3.0 96.2%
7504 30th Street SE, Calgary 100% 138,729 138,729 1976 22.0 6.0 6.0 2 5.2 100.0%
11445 163rd Street (Alberta Park), Edmonton 100% 130,019 130,019 1981 22.0 5.2 5.2 6 2.7 53.7%
9603-9699 45th Avenue NW, Edmonton 100% 110,397 110,397 1975 22.0 6.0 6.0 21 2.4 88.2%
603 Park Street, Regina 100% 109,691 109,691 1978 19.0 6.8 6.8 18 3.5 77.2%
3916 61st Avenue, Calgary 100% 99,978 99,978 1976 26.0 5.1 5.1 2 4.3 100.0%
7004-7042 30th Street SE, Calgary 100% 94,176 94,176 1976 18.0 5.3 5.3 7 5.8 94.6%
651 Henderson Drive (Henderson Business Centre), Regina 100% 90,259 90,259 1982 19.0 5.0 5.0 19 3.3 100.0%
26229 Township Road 531, Parkland County 100% 89,192 89,192 1968 24.7 6.5 6.5 12 1.8 97.8%
7008 5th Street SE (Glenmore Business Park), Calgary 100% 85,961 85,961 1975 17.0 3.7 3.7 6 3.0 93.7%
11404 Winterburn Rd NW, Edmonton 100% 80,909 80,909 2004 23.8 6.3 6.3 14 1.6 79.0%
7004 5th Street SE (Glenmore Business Park), Calgary 100% 79,369 79,369 1975 20.0 3.4 3.4 11 4.0 100.0%
9451 45th Avenue (Southwood Centre), Edmonton 100% 75,172 75,172 1998 28.0 4.5 4.5 2 1.8 100.0%
4710-4760 14th Street NE (McCall Industrial Park), Calgary 100% 73,031 73,031 1976 18.0 4.0 4.0 20 2.7 90.1%
2777 23rd Avenue NE (Sunridge Business Park), Calgary 100% 67,250 67,250 2001 24.0 3.8 3.8 4 1.9 100.0%
3510 29th Street NE (ACC Centre), Calgary 100% 65,022 65,022 1998 24.0 3.0 3.0 7 3.1 100.0%
7111 6th Street SE (Glenmore Business Park), Calgary 100% 64,939 64,939 1985 20.0 2.9 2.9 4 4.9 100.0%
3401 19th Street, Calgary 100% 63,962 63,962 1976 22.0 4.1 4.1 6 3.4 100.0%
2150 29th Street NE (Sunridge Business Park), Calgary 100% 59,814 59,814 1999 24.0 3.3 3.3 7 3.6 100.0%
7710 5th Street SE (Glenmore Business Park), Calgary 100% 58,533 58,533 1980 20.0 2.3 2.3 23 2.7 89.6%
2175 29th Street NE (Sunridge Business Park), Calgary 100% 58,184 58,184 2000 24.0 3.5 3.5 3 3.1 100.0%
2256 29th Street NE (Sunridge Business Park), Calgary 100% 58,015 58,015 1998 24.0 3.5 3.5 5 1.8 100.0%
4403-4435 97th Street North West, Edmonton 100% 57,813 57,813 1975 24.0 3.2 3.2 5 4.9 100.0%
550 71st Avenue SE (Glenmore Business Park), Calgary 100% 57,788 57,788 1982 12.0 2.6 2.6 10 3.8 100.0%
1139-1165 40th Avenue NE, Calgary 100% 57,466 57,466 1974 20.0 2.9 2.9 6 3.3 100.0%
2928 Sunridge Way NE (Sunridge Business Park), Calgary 100% 57,196 57,196 2003 24.0 4.1 4.1 4 3.4 100.0%

Dream Industrial REIT 2017 Second Quarter Report | 33
Property Ownership
Total GLA in
square feet
Owned share of
total GLA in square feet
Year built/ renovated
Clear ceiling height
(warehouse component)
in feet
Total site area in acres
Owned share of site area in acres
No. of tenants
Weighted average
remaining lease
term in years
In-place and committed occupancy
2151 32nd Street NE (Sunridge Business Park), Calgary 100% 57,225 57,225 1999 24.0 3.4 3.4 6 2.7 100.0%
501-529 36th Avenue SE, Calgary 100% 57,200 57,200 1974 18.0 2.9 2.9 6 3.4 100.0%
4504-4576 14th Street NE, Calgary 100% 57,147 57,147 1976 16.0 4.1 4.1 31 2.3 100.0%
2121 29th Street NE (Sunridge Business Park), Calgary 100% 56,979 56,979 2000 24.0 3.8 3.8 3 1.8 100.0%
6812 6th Street SE (Glenmore Business Park), Calgary 100% 56,970 56,970 1978 20.0 5.7 5.7 6 2.8 100.0%
402 McDonald Street (Imperial Business Centre), Regina 100% 56,217 56,217 1984 18.0 2.8 2.8 15 2.2 95.3%
2985 23rd Avenue NE (Sunridge Business Park), Calgary 100% 54,065 54,065 2000 24.0 3.0 3.0 3 2.6 100.0%
4402-4434 10th Street NE, Calgary 100% 53,992 53,992 1974 16.0 3.1 3.1 7 3.9 100.0%
7003 5th Street SE (Glenmore Business Park), Calgary 100% 52,825 52,825 1975 20.0 2.7 2.7 14 5.3 100.0%
16134 114th Avenue NW, Edmonton 100% 47,926 47,926 2006 26.8 4.4 4.4 9 2.8 100.0%
2886 Sunridge Way NE (Sunridge Business Park), Calgary 100% 44,433 44,433 2001 24.0 3.5 3.5 3 1.2 100.0%
610 70th Avenue SE (Glenmore Business Park), Calgary 100% 44,218 44,218 1985 20.0 3.5 3.5 12 3.0 100.0%
1512-1514 8th Street, Edmonton 100% 42,670 42,670 1980 20.0 10.2 10.2 2 2.4 100.0%
535-561 36th Avenue SE, Calgary 100% 41,440 41,440 1974 16.0 1.9 1.9 2 8.7 100.0%
5824 Burbank Road SE, Calgary 100% 39,849 39,849 1972 20.0 2.4 2.4 6 6.2 100.0%
310 Hoffer Drive (McDonald Business Centre), Regina 100% 38,050 38,050 1985 18.0 2.8 2.8 5 2.8 100.0%
4001 19th Street, Calgary 100% 36,939 36,939 1978 22.0 2.5 2.5 7 1.9 100.0%
6810 6th Street SE (Glenmore Business Park), Calgary 100% 31,726 31,726 1978 19.0 3.2 3.2 3 3.0 100.0%
6804-6818 30th Street SE, Calgary 100% 29,986 29,986 1976 16.0 1.2 1.2 4 3.9 100.0%
7131 6th Street SE (Glenmore Business Park), Calgary 100% 29,002 29,002 1982 20.0 1.3 1.3 2 4.1 100.0%
6023-6039 Centre Street South, Calgary 100% 28,795 28,795 1973 15.0 1.5 1.5 6 3.4 100.0%
4502-4516 10th Street NE, Calgary 100% 28,641 28,641 1974 16.0 1.4 1.4 5 2.5 75.4%
16104 114th Avenue NW, Edmonton 100% 28,624 28,624 1972 20.0 4.4 4.4 8 2.4 100.0%
3030 Sunridge Way NE (Sunridge Business Park), Calgary 100% 26,967 26,967 2000 24.0 2.1 2.1 5 3.4 100.0%
6043-6055 Centre Street South, Calgary 100% 25,234 25,234 1973 15.0 1.3 1.3 5 3.1 100.0%
530-544 38A Avenue SE, Calgary 100% 23,987 23,987 1974 16.0 1.2 1.2 6 2.1 87.5%
7007 5th Street SE (Glenmore Business Park), Calgary 100% 23,371 23,371 1974 19.0 1.2 1.2 2 2.2 90.6%
616 71st Avenue SE (Glenmore Business Park), Calgary 100% 21,957 21,957 1985 21.0 1.0 1.0 3 3.9 100.0%
1135-1149 45th Avenue NE, Calgary 100% 21,552 21,552 1974 16.0 1.3 1.3 6 3.2 100.0%
6910 6th Street SE (Glenmore Business Park), Calgary 100% 21,268 21,268 1978 16.0 2.1 2.1 4 1.7 100.0%
4620-4640 11th Street NE, Calgary 100% 21,161 21,161 1971 16.0 1.4 1.4 11 2.3 100.0%
102-114 61st Avenue SW, Calgary 100% 18,890 18,890 1973 14.0 1.1 1.1 4 1.7 100.0%
4001-4019 23rd Street NE, Calgary 100% 15,764 15,764 1976 16.0 1.1 1.1 5 4.9 100.0%
2915-2925 58th Avenue SE, Calgary 100% 15,599 15,599 1976 16.0 1.0 1.0 6 2.8 100.0%
3503-3521 62nd Avenue SE, Calgary 100% 13,413 13,413 1975 13.0 1.2 1.2 9 2.3 100.0%
125 McDonald Street, Regina 50% 14,080 7,041 1975 13.0 1.2 0.6 2 1.9 71.9%
Western Canada Multi-tenant 99.8% 4,143,203 4,136,164 21.1 251.9 251.3 499 3.7 95.9%
Western Canada 98.8% 4,926,138 4,866,775 21.9 338.2 332.7 516 3.8 96.5%
275 Wellington Street East, Aurora 100% 317,000 317,000 1986 27.0 16.3 16.3 1 4.8 100.0%
45 Progress Avenue, Toronto 100% 209,754 209,754 1965/2000 24.0 10.3 10.3 1 3.5 100.0%
3230 Mainway Drive, Burlington 100% 207,703 207,703 1965 21.0 9.9 9.9 1 8.3 100.0%
290 Humberline Drive, Etobicoke 100% 180,329 180,329 1981/2010 20.0 6.9 6.9 1 5.6 100.0%
750 Creditstone Road, Vaughan 100% 176,535 176,535 1999 24.0 9.0 9.0 1 7.5 100.0%
121 Pippin Road, Vaughan 100% 169,500 169,500 1999 24.0 8.6 8.6 1 2.5 100.0%
580 Industrial Road, London 100% 113,595 113,595 1972/2002 24.0 12.7 12.7 1 10.6 100.0%
441 Chrislea Road, Vaughan 100% 100,626 100,626 1998 22.0 4.1 4.1 1 1.3 100.0%
970 Fraser Drive, Burlington 100% 95,444 95,444 1999 28.0 6.9 6.9 1 10.5 100.0%
274 Humberline Drive, Etobicoke 100% 80,540 80,540 1981 20.0 3.9 3.9 1 2.8 100.0%
2226 South Service Road West, Oakville 100% 79,174 79,174 1980 22.0 3.5 3.5 1 3.5 100.0%
439 Sovereign, London 100% 77,877 77,877 1988 22.0 5.6 5.6 1 1.3 100.0%
9305 Twin Oaks Drive, Windsor 100% 74,239 74,239 1996 28.0 5.2 5.2 1 3.1 100.0%
2 Lone Oak Court, Toronto 100% 72,197 72,197 2001 24.0 4.4 4.4 1 5.0 100.0%
6885-6895 Menway Court, Mississauga 100% 66,383 66,383 1988 20.0 3.4 3.4 1 2.7 100.0%
896 Meyerside Drive, Mississauga 100% 46,774 46,774 1986 20.0 2.4 2.4 1 8.9 100.0%
880 Rangeview Road, Mississauga 100% 45,600 45,600 1977/2005 24.0 3.2 3.2 1 5.3 100.0%
135 Pinebush Road, Cambridge 100% 44,470 44,470 2001 60.0 5.6 5.6 1 3.0 100.0%
5905 Kennedy Road, Mississauga 100% 38,158 38,158 1988 22.0 2.1 2.1 1 3.6 100.0%
6045 Kestrel Road, Mississauga 100% 34,879 34,879 1986 20.0 1.8 1.8 1 1.8 100.0%
2946 Walker Road, Windsor 100% 32,264 32,264 1960 22.0 4.0 4.0 1 2.5 100.0%
781 Westgate Road, Oakville 100% 29,850 29,850 1985 22.0 4.2 4.2 1 3.2 100.0%

Dream Industrial REIT 2017 Second Quarter Report | 34
Property Ownership
Total GLA in
square feet
Owned share of
total GLA in square feet
Year built/ renovated
Clear ceiling height
(warehouse component)
in feet
Total site area in acres
Owned share of site area in acres
No. of tenants
Weighted average
remaining lease
term in years
In-place and committed occupancy
6520 Gottardo Court, Mississauga 100% 25,932 25,932 1987 18.0 1.2 1.2 1 4.5 100.0%
750 Barmac Drive, Toronto 100% 23,959 23,959 1979 18.0 1.5 1.5 1 1.7 100.0%
7420 Pacific Circle, Mississauga 100% 23,777 23,777 1987 18.0 1.2 1.2 1 2.0 100.0%
1300 Fewster Road, Mississauga 100% 23,500 23,500 1969 14.0 1.2 1.2 1 4.0 100.0%
5805 Kennedy Road, Mississauga 100% 21,780 21,780 1986 18.0 1.0 1.0 1 0.5 100.0%
5380 Timberlea Boulevard, Mississauga 100% 19,988 19,988 1986 18.0 1.0 1.0 1 2.6 100.0%
5462 Timberlea Boulevard, Mississauga 100% 17,708 17,708 1977 18.0 1.0 1.0 1 2.9 100.0%
5370 Timberlea Boulevard, Mississauga 100% 16,693 16,693 1986 18.0 0.8 0.8 1 2.7 100.0%
5750 Coopers Avenue, Mississauga 100% 16,366 16,366 1987 18.0 0.9 0.9 1 3.7 100.0%
5444 Timberlea Boulevard, Mississauga 100% 15,316 15,316 1977 18.0 0.9 0.9 1 0.6 100.0%
Ontario Single-tenant 100% 2,497,910 2,497,910 23.6 144.7 144.7 32 4.9 100.0%
6581-6601 Kitimat Road, Mississauga 100% 318,363 318,363 1986 25.0 16.9 16.9 15 2.6 100.0%
2360 Cornwall Road, Oakville 100% 199,736 199,736 2004 28.0 10.3 10.3 3 3.3 100.0%
45 A & B West Wilmot Street, Richmond Hill 100% 189,128 189,128 1986 19.0 8.0 8.0 38 3.4 99.8%
255 Wicksteed Avenue, Toronto 100% 177,562 177,562 1955 24.0 8.0 8.0 4 1.9 100.0%
2140-2150 Winston Park Drive, Mississauga 100% 172,331 172,331 1987 19.0 7.5 7.5 43 2.5 91.3%
90 Nolan Court, Markham 100% 124,890 124,890 1982 18.0 7.0 7.0 29 3.0 100.0%
55 Horner Avenue, Etobicoke 100% 93,516 93,516 1988 22.0 6.2 6.2 4 1.4 100.0%
4515/4525 Rhodes Drive, Windsor 100% 92,089 92,089 1999 22.0 9.0 9.0 7 2.2 100.0%
3 & 5 Blair Drive, Brampton 100% 82,232 82,232 2001 28.0 6.4 6.4 2 2.0 100.0%
1111 Tristar Drive, Mississauga 100% 77,726 77,726 1986 22.0 3.7 3.7 2 2.0 100.0%
903-951 Matheson Boulevard, Mississauga 100% 77,420 77,420 1977 18.0 3.8 3.8 8 3.8 100.0%
1100 Courtney Park Drive, Mississauga 100% 72,393 72,393 1981 22.0 3.4 3.4 4 4.0 100.0%
100 Lingard Road, Cambridge 100% 70,154 70,154 2003 46.0 5.4 5.4 2 1.6 100.0%
5825-5895 Kennedy Road, Mississauga 100% 67,846 67,846 1988 15.0 3.4 3.4 8 4.4 100.0%
6400 Shawson Drive, Mississauga 100% 61,715 61,715 1981 22.0 2.9 2.9 3 6.5 100.0%
5554 Tomken Road, Mississauga 100% 61,245 61,245 1979 18.0 3.2 3.2 9 2.2 100.0%
6300 Viscount Road, Mississauga 100% 60,179 60,179 1966 16.0 4.3 4.3 4 2.4 99.7%
845 Harrington Court, Burlington 100% 55,889 55,889 1982 15.0 4.0 4.0 9 3.5 85.8%
5716-5730 Coopers Avenue, Mississauga 100% 53,695 53,695 1987 14.0 3.4 3.4 23 2.6 100.0%
855 Matheson Boulevard, Mississauga 100% 46,652 46,652 1986 18.0 2.0 2.0 13 2.1 100.0%
5448 Timberlea Boulevard, Mississauga 100% 32,025 32,025 1977 16.0 1.8 1.8 2 2.3 100.0%
5430 Timberlea Boulevard, Mississauga 100% 31,448 31,448 1977 17.0 1.8 1.8 2 5.0 100.0%
5466 Timberlea Boulevard, Mississauga 100% 28,657 28,657 1977 18.0 1.6 1.6 2 6.3 100.0%
135 East Beaver Creek, Richmond Hill 100% 28,506 28,506 1986 17.0 1.8 1.8 2 1.0 100.0%
5420 Timberlea Boulevard, Mississauga 100% 19,816 19,816 1977 18.0 1.1 1.1 2 3.8 100.0%
Ontario Multi-tenant 100% 2,295,213 2,295,213 22.1 126.9 126.9 240 2.8 99.0%
Ontario 100% 4,793,123 4,793,123 22.9 271.6 271.6 272 3.9 99.5%
1411, 1421 and 1451 Rue Ampère, Boucherville 100% 457,875 457,875 1998/2002 27.0 21.6 21.6 1 7.9 100.0%
1900 Dickson Street (Molson Distribution Centre), Montréal 100% 225,000 225,000 2003 26.0 17.1 17.1 1 5.5 100.0%
2350 de la Province, Longueuil 100% 222,464 222,464 1967 20.0 11.5 11.5 1 4.6 100.0%
1125 50th Avenue, Montréal 100% 210,710 210,710 2000 26.0 13.3 13.3 1 2.3 100.0%
8000 Avenue Blaise-Pascal, Montréal 100% 206,345 206,345 1993 23.0 13.8 13.8 1 4.8 100.0%
1313 Autoroute Chomedey, Laval 100% 184,493 184,493 1999 26.0 8.1 8.1 1 7.9 100.0%
650 Rue Bergeron, Drummondville 100% 181,000 181,000 2007 28.0 10.5 10.5 1 5.5 100.0%
2340 St. Laurent Blvd., Ottawa 100% 114,724 114,724 1989 24.0 6.2 6.2 1 7.8 100.0%
101 Autoroute 440, Laval 100% 68,444 68,444 1977 22.0 4.6 4.6 1 5.9 100.0%
1805 50e Avenue, Lachine 100% 60,750 60,750 1986 19.0 2.3 2.3 1 3.9 100.0%
1421 Rue Nobel, Sainte-Julie 100% 50,878 50,878 1998 22.0 4.3 4.3 1 4.3 100.0%
3700-3720 Autoroute des Laurentides, Laval 100% 49,500 49,500 2002 24.0 3.6 3.6 1 5.1 100.0%
1870 Boulevard Saint-Régis, Dollard-des-Ormeaux 100% 40,231 40,231 1984 22.0 1.8 1.8 1 3.9 100.0%
29 Rue de Varennes, Gatineau 100% 23,959 23,959 2006 20.0 3.4 3.4 1 3.6 100.0%
361 Boulevard Montpellier, St-Laurent 100% 19,220 19,220 1987 18.0 1.2 1.2 1 9.3 100.0%
Québec Single-tenant 100% 2,115,593 2,115,593 24.7 123.3 123.3 15 5.8 100.0%
2995 Boulevard le Corbusier, Laval 100% 130,824 130,824 1975 24.0-29.0 4.7 4.7 6 5.2 99.3%
5000 Rue Fairway & 1645 50e Avenue, Lachine 100% 106,517 106,517 1978 18.0 5.5 5.5 4 0.5 85.5%
1700-1764 50e Avenue, Lachine 100% 94,569 94,569 1989 24.0 4.2 4.2 2 0.1 100.0%
1100-1154 Rue Berlier, Laval 100% 91,843 91,843 1975 18.0 4.5 4.5 8 2.7 90.1%
9090-9100 Boulevard Cavendish, St-Laurent 100% 89,322 89,322 1987 18.0 7.5 7.5 5 2.0 83.6%
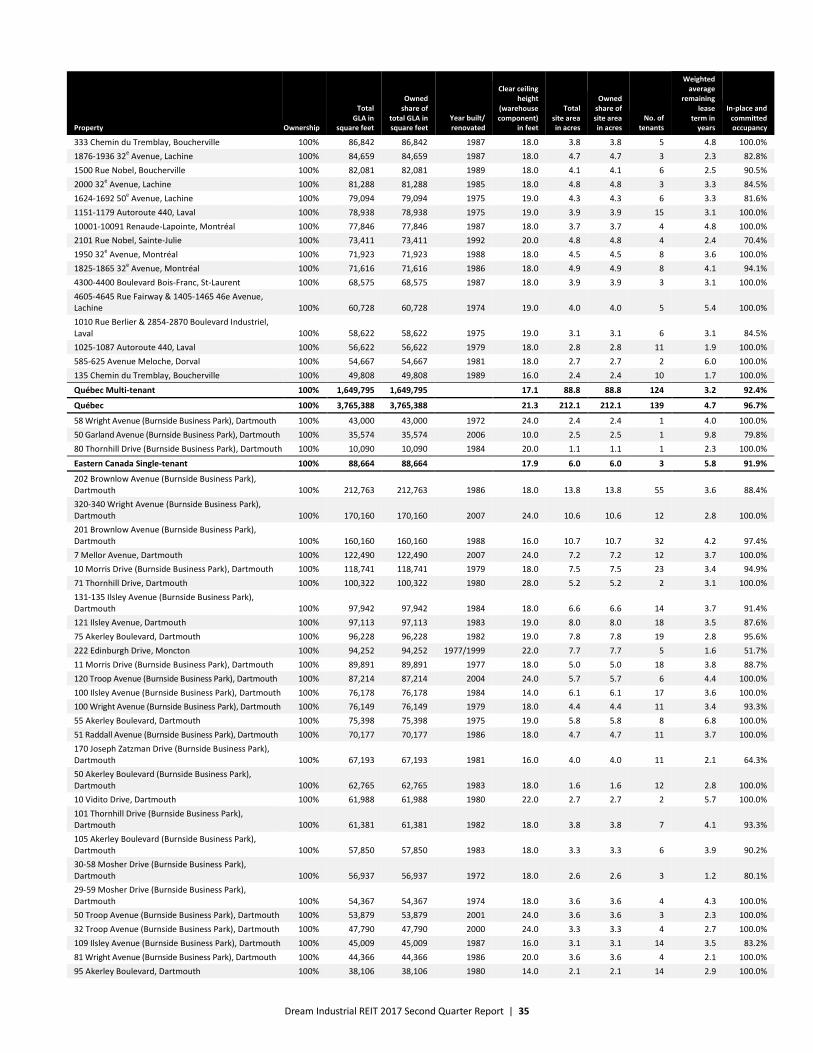
Dream Industrial REIT 2017 Second Quarter Report | 35
Property Ownership
Total GLA in
square feet
Owned share of
total GLA in square feet
Year built/ renovated
Clear ceiling height
(warehouse component)
in feet
Total site area in acres
Owned share of site area in acres
No. of tenants
Weighted average
remaining lease
term in years
In-place and committed occupancy
333 Chemin du Tremblay, Boucherville 100% 86,842 86,842 1987 18.0 3.8 3.8 5 4.8 100.0%
1876-1936 32e Avenue, Lachine 100% 84,659 84,659 1987 18.0 4.7 4.7 3 2.3 82.8%
1500 Rue Nobel, Boucherville 100% 82,081 82,081 1989 18.0 4.1 4.1 6 2.5 90.5%
2000 32e Avenue, Lachine 100% 81,288 81,288 1985 18.0 4.8 4.8 3 3.3 84.5%
1624-1692 50e Avenue, Lachine 100% 79,094 79,094 1975 19.0 4.3 4.3 6 3.3 81.6%
1151-1179 Autoroute 440, Laval 100% 78,938 78,938 1975 19.0 3.9 3.9 15 3.1 100.0%
10001-10091 Renaude-Lapointe, Montréal 100% 77,846 77,846 1987 18.0 3.7 3.7 4 4.8 100.0%
2101 Rue Nobel, Sainte-Julie 100% 73,411 73,411 1992 20.0 4.8 4.8 4 2.4 70.4%
1950 32e Avenue, Montréal 100% 71,923 71,923 1988 18.0 4.5 4.5 8 3.6 100.0%
1825-1865 32e Avenue, Montréal 100% 71,616 71,616 1986 18.0 4.9 4.9 8 4.1 94.1%
4300-4400 Boulevard Bois-Franc, St-Laurent 100% 68,575 68,575 1987 18.0 3.9 3.9 3 3.1 100.0%
4605-4645 Rue Fairway & 1405-1465 46e Avenue, Lachine 100% 60,728 60,728 1974 19.0 4.0 4.0 5 5.4 100.0%
1010 Rue Berlier & 2854-2870 Boulevard Industriel, Laval 100% 58,622 58,622 1975 19.0 3.1 3.1 6 3.1 84.5%
1025-1087 Autoroute 440, Laval 100% 56,622 56,622 1979 18.0 2.8 2.8 11 1.9 100.0%
585-625 Avenue Meloche, Dorval 100% 54,667 54,667 1981 18.0 2.7 2.7 2 6.0 100.0%
135 Chemin du Tremblay, Boucherville 100% 49,808 49,808 1989 16.0 2.4 2.4 10 1.7 100.0%
Québec Multi-tenant 100% 1,649,795 1,649,795 17.1 88.8 88.8 124 3.2 92.4%
Québec 100% 3,765,388 3,765,388 21.3 212.1 212.1 139 4.7 96.7%
58 Wright Avenue (Burnside Business Park), Dartmouth 100% 43,000 43,000 1972 24.0 2.4 2.4 1 4.0 100.0%
50 Garland Avenue (Burnside Business Park), Dartmouth 100% 35,574 35,574 2006 10.0 2.5 2.5 1 9.8 79.8%
80 Thornhill Drive (Burnside Business Park), Dartmouth 100% 10,090 10,090 1984 20.0 1.1 1.1 1 2.3 100.0%
Eastern Canada Single-tenant 100% 88,664 88,664 17.9 6.0 6.0 3 5.8 91.9%
202 Brownlow Avenue (Burnside Business Park), Dartmouth 100% 212,763 212,763 1986 18.0 13.8 13.8 55 3.6 88.4%
320-340 Wright Avenue (Burnside Business Park), Dartmouth 100% 170,160 170,160 2007 24.0 10.6 10.6 12 2.8 100.0%
201 Brownlow Avenue (Burnside Business Park), Dartmouth 100% 160,160 160,160 1988 16.0 10.7 10.7 32 4.2 97.4%
7 Mellor Avenue, Dartmouth 100% 122,490 122,490 2007 24.0 7.2 7.2 12 3.7 100.0%
10 Morris Drive (Burnside Business Park), Dartmouth 100% 118,741 118,741 1979 18.0 7.5 7.5 23 3.4 94.9%
71 Thornhill Drive, Dartmouth 100% 100,322 100,322 1980 28.0 5.2 5.2 2 3.1 100.0%
131-135 Ilsley Avenue (Burnside Business Park), Dartmouth 100% 97,942 97,942 1984 18.0 6.6 6.6 14 3.7 91.4%
121 Ilsley Avenue, Dartmouth 100% 97,113 97,113 1983 19.0 8.0 8.0 18 3.5 87.6%
75 Akerley Boulevard, Dartmouth 100% 96,228 96,228 1982 19.0 7.8 7.8 19 2.8 95.6%
222 Edinburgh Drive, Moncton 100% 94,252 94,252 1977/1999 22.0 7.7 7.7 5 1.6 51.7%
11 Morris Drive (Burnside Business Park), Dartmouth 100% 89,891 89,891 1977 18.0 5.0 5.0 18 3.8 88.7%
120 Troop Avenue (Burnside Business Park), Dartmouth 100% 87,214 87,214 2004 24.0 5.7 5.7 6 4.4 100.0%
100 Ilsley Avenue (Burnside Business Park), Dartmouth 100% 76,178 76,178 1984 14.0 6.1 6.1 17 3.6 100.0%
100 Wright Avenue (Burnside Business Park), Dartmouth 100% 76,149 76,149 1979 18.0 4.4 4.4 11 3.4 93.3%
55 Akerley Boulevard, Dartmouth 100% 75,398 75,398 1975 19.0 5.8 5.8 8 6.8 100.0%
51 Raddall Avenue (Burnside Business Park), Dartmouth 100% 70,177 70,177 1986 18.0 4.7 4.7 11 3.7 100.0%
170 Joseph Zatzman Drive (Burnside Business Park), Dartmouth 100% 67,193 67,193 1981 16.0 4.0 4.0 11 2.1 64.3%
50 Akerley Boulevard (Burnside Business Park), Dartmouth 100% 62,765 62,765 1983 18.0 1.6 1.6 12 2.8 100.0%
10 Vidito Drive, Dartmouth 100% 61,988 61,988 1980 22.0 2.7 2.7 2 5.7 100.0%
101 Thornhill Drive (Burnside Business Park), Dartmouth 100% 61,381 61,381 1982 18.0 3.8 3.8 7 4.1 93.3%
105 Akerley Boulevard (Burnside Business Park), Dartmouth 100% 57,850 57,850 1983 18.0 3.3 3.3 6 3.9 90.2%
30-58 Mosher Drive (Burnside Business Park), Dartmouth 100% 56,937 56,937 1972 18.0 2.6 2.6 3 1.2 80.1%
29-59 Mosher Drive (Burnside Business Park), Dartmouth 100% 54,367 54,367 1974 18.0 3.6 3.6 4 4.3 100.0%
50 Troop Avenue (Burnside Business Park), Dartmouth 100% 53,879 53,879 2001 24.0 3.6 3.6 3 2.3 100.0%
32 Troop Avenue (Burnside Business Park), Dartmouth 100% 47,790 47,790 2000 24.0 3.3 3.3 4 2.7 100.0%
109 Ilsley Avenue (Burnside Business Park), Dartmouth 100% 45,009 45,009 1987 16.0 3.1 3.1 14 3.5 83.2%
81 Wright Avenue (Burnside Business Park), Dartmouth 100% 44,366 44,366 1986 20.0 3.6 3.6 4 2.1 100.0%
95 Akerley Boulevard, Dartmouth 100% 38,106 38,106 1980 14.0 2.1 2.1 14 2.9 100.0%

Dream Industrial REIT 2017 Second Quarter Report | 36
Property Ownership
Total GLA in
square feet
Owned share of
total GLA in square feet
Year built/ renovated
Clear ceiling height
(warehouse component)
in feet
Total site area in acres
Owned share of site area in acres
No. of tenants
Weighted average
remaining lease
term in years
In-place and committed occupancy
30 Simmonds Drive (Burnside Business Park), Dartmouth 100% 37,877 37,877 1982 16.0 2.8 2.8 7 2.3 88.6%
40 Thornhill Drive (Burnside Business Park), Dartmouth 100% 32,186 32,186 1982 16.0 3.8 3.8 10 2.7 100.0%
50 Thornhill Drive (Burnside Business Park), Dartmouth 100% 32,065 32,065 1983 16.0 3.8 3.8 10 2.5 86.3%
60 Thornhill Drive (Burnside Business Park), Dartmouth 100% 32,002 32,002 1986 16.0 2.0 2.0 5 5.6 78.3%
10 Thornhill Drive, Dartmouth 100% 28,633 28,633 1983 15.0 3.4 3.4 9 1.4 83.2%
16 Garland Avenue (Burnside Business Park), Dartmouth 100% 10,888 10,888 2008 14.0 1.5 1.5 4 2.5 100.0%
Eastern Canada Multi-tenant 100% 2,570,460 2,570,460 19.4 171.4 171.4 392 3.5 92.5%
Eastern Canada 100% 2,659,124 2,659,124 19.3 177.4 177.4 395 3.6 92.5%
Total Multi-tenant buildings 99.9% 10,658,671 10,651,632 20.3 639.0 638.4 1,255 3.4 95.2%
Total Single-tenant buildings 99.0% 5,485,102 5,432,778 24.3 360.3 355.4 67 5.2 99.9%
Total 99.6% 16,143,773 16,084,410 21.6 999.3 993.8 1,322 4.0 96.8%

Dream Industrial REIT 2017 Second Quarter Report | 37
LARGEST TENANTS BY GLA(1)
Tenant Total area in
square feet Properties City Province
Spectra Premium Industries Inc. 642,368 1411, 1421 and 1451 Rue Ampère Boucherville Québec
1313 Autoroute Chomedey Laval Québec
TC Transcontinental 523,345 275 Wellington Street East Aurora Ontario
8000 Avenue Blaise-Pascal Montréal Québec
Gienow Windows & Doors Inc. 370,691 7140 40th Street SE Calgary Alberta
628-668 Henderson Drive Regina Saskatchewan
United Agri Products Canada Inc. 275,335 310 Henderson Drive Regina Saskatchewan
Nellson Nutraceutical Canada 234,555 1125 50th Avenue Montréal Québec
5000 Rue Fairway & 1645 50e Avenue Montréal Québec
Molson Breweries Properties 225,000 1900 Dickson Street (Molson Distribution Centre) Montréal Québec
Hasbro Canada Corporation 222,464 2350 Rue de la Province Longueuil Québec
Array Canada Inc. 209,754 45 Progress Avenue Toronto Ontario
Pioneer Distribution Inc. 207,703 3230 Mainway Drive Burlington Ontario
McKesson Canada Corporation 181,000 650 Rue Bergeron Drummondville Québec
Alumicor Limited 180,329 290 Humberline Drive Etobicoke Ontario
Royal Group Inc. 176,535 750 Creditstone Road Vaughan Ontario
North American Profiles Canada 169,500 121 Pippin Road Vaughan Ontario
RockTenn-Container Canada/RockTenn-Preprint Canada 134,863 7420 Pacific Circle Mississauga Ontario
6581-6601 Kitimat Road Mississauga Ontario
DIRTT Environmental Solutions 122,419 7504 30th Street SE Calgary Alberta
Lowe-Martin Company Inc. 114,724 2340 St. Laurent Boulevard Ottawa Ontario
Colabor Limited Partnership 113,595 580 Industrial Road London Ontario
Legendary Logistics Inc. 104,260 2360 Cornwall Road Oakville Ontario
Aquarium Services Warehouse 100,626 441 Chrislea Road Vaughan Ontario
Total 4,309,066
(1) Represents all tenants with GLA greater than 100,000 square feet.

Dream Industrial REIT 2017 Second Quarter Report | 38
Condensed consolidated balance sheets (unaudited)
June 30, December 31, (in thousands of Canadian dollars) Note 2017 2016
Assets NON-CURRENT ASSETS Investment properties 5 $ 1,617,098 $ 1,634,315 Other non-current assets 5,307 3,716
1,622,405 1,638,031
CURRENT ASSETS Amounts receivable 3,876 4,088 Prepaid expenses and other assets 7,205 5,362 Cash and cash equivalents 6,136 6,595
17,217 16,045
Assets held for sale 9 12,700 4,000
Total assets $ 1,652,322 $ 1,658,076
Liabilities NON-CURRENT LIABILITIES Debt 6 $ 705,025 $ 780,622 Subsidiary redeemable units 161,401 158,247 Deferred Unit Incentive Plan 7 4,692 4,350 Other non-current liabilities 12,917 13,170
884,035 956,389
CURRENT LIABILITIES Debt 6 156,152 87,725 Amounts payable and accrued liabilities 8 25,017 22,852
181,169 110,577
Total liabilities 1,065,204 1,066,966
Equity Unitholders’ equity 600,004 589,252 Retained earnings (deficit) (12,402 ) 2,727 Accumulated other comprehensive loss (484 ) (869 )
Total equity 587,118 591,110
Total liabilities and equity $ 1,652,322 $ 1,658,076
See accompanying notes to the condensed consolidated financial statements.
On behalf of the Board of Trustees of Dream Industrial Real Estate Investment Trust: Vincenza Sera Sheldon Wiseman Trustee Trustee

Dream Industrial REIT 2017 Second Quarter Report | 39
Condensed consolidated statements of net income (loss) and comprehensive income (loss) (unaudited)
Three months ended June 30, Six months ended June 30,
(in thousands of Canadian dollars) Note 2017 2016 2017 2016
Investment properties revenue $ 42,664 $ 44,704 $ 85,531 $ 88,741 Investment properties operating expenses (13,728 ) (15,174 ) (28,194 ) (29,556 )
Net rental income 28,936 29,530 57,337 59,185
Other income Interest and fee income 32 7 57 23
32 7 57 23 Other expenses General and administrative (2,124 ) (2,559 ) (4,273 ) (4,955 ) Interest:
Interest expense on debt (8,612 ) (8,862 ) (17,196 ) (17,809 )
Subsidiary redeemable units (3,344 ) (3,247 ) (6,688 ) (6,493 ) Depreciation and amortization 14 (14 ) (13 ) (28 ) (26 )
(14,094 ) (14,681 ) (28,185 ) (29,283 )
Income before fair value adjustments and other
items, and income taxes 14,874 14,856 29,209 29,925
Fair value adjustments and other items Fair value adjustments to investment properties 5 (13,606 ) (2,465 ) (19,666 ) (5,601 ) Fair value adjustments to financial instruments 10 (8,219 ) (11,211 ) (2,223 ) (28,463 ) Net losses on transactions and other activities 11 (802 ) (1,305 ) (1,733 ) (3,486 )
(22,627 ) (14,981 ) (23,622 ) (37,550 )
Income (loss) before income taxes (7,753 ) (125 ) 5,587 (7,625 ) Recovery of income taxes 645 351 515 254
Net income (loss) for the period $ (7,108 ) $ 226 $ 6,102 $ (7,371 )
Other comprehensive income Unrealized gain on effective interest rate hedge $ 310 $ 144 $ 385 $ 191
310 144 385 191
Comprehensive income (loss) for the period $ (6,798 ) $ 370 $ 6,487 $ (7,180 )
See accompanying notes to the condensed consolidated financial statements.

Dream Industrial REIT 2017 Second Quarter Report | 40
Condensed consolidated statements of changes in equity
(unaudited)
Attributable to unitholders of the Trust
Accumulated Retained other (in thousands of Canadian dollars, Number Unitholders’ earnings comprehensive except number of Units) Note of Units equity (deficit)
loss Total
Balance at January 1, 2017 59,633,237 $ 589,252 $ 2,727 $ (869 ) $ 591,110 Net income for the period — — 6,102 — 6,102
Distributions paid and payable — — (21,231 ) — (21,231 ) Distribution Reinvestment Plan
(1) 1,187,352 10,064 — — 10,064
REIT Units issued for vested deferred
trust units 7 83,342 697 — — 697
Unit Purchase Plan 271 2 — — 2
Issue costs — (11 ) — — (11 ) Other comprehensive income — — — 385 385
Balance at June 30, 2017 60,904,202 $ 600,004 $ (12,402 ) $ (484 ) $ 587,118
(1) Includes REIT units issued under the Distribution Reinvestment and Unit Purchase Plan (“DRIP”) for LP B Units.
Attributable to unitholders of the Trust
Accumulated other (in thousands of Canadian dollars, Number Unitholders’ Retained comprehensive except number of Units) Note of Units equity earnings loss Total
Balance at January 1, 2016 58,645,223 $ 581,476 $ 46,984 $ (1,577 ) $ 626,883 Net loss for the period — — (7,371 ) — (7,371 ) Distributions paid and payable — — (20,712 ) — (20,712 ) Distribution Reinvestment Plan
(1) 370,938 2,831 — — 2,831
REIT Units issued for vested deferred
trust units 99,378 786 — — 786
Unit Purchase Plan 1,484 12 — — 12
Issue costs — (18 ) — — (18 ) Other comprehensive income — — — 191 191
Balance at June 30, 2016 59,117,023 $ 585,087 $ 18,901 $ (1,386 ) $ 602,602
(1) Includes REIT units issued under the Distribution Reinvestment and Unit Purchase Plan (“DRIP”) for LP B Units.
See accompanying notes to the condensed consolidated financial statements.
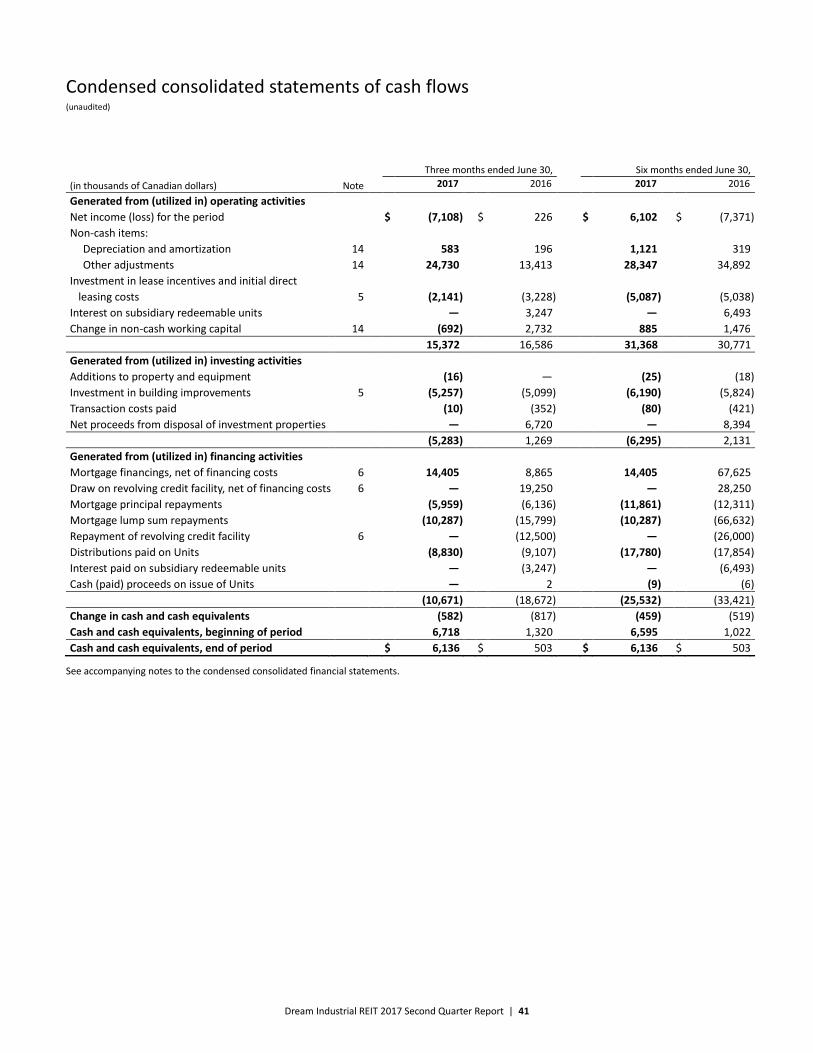
Dream Industrial REIT 2017 Second Quarter Report | 41
Condensed consolidated statements of cash flows (unaudited)
Three months ended June 30, Six months ended June 30,
(in thousands of Canadian dollars) Note 2017 2016 2017 2016
Generated from (utilized in) operating activities
Net income (loss) for the period $ (7,108 ) $ 226 $ 6,102 $ (7,371 )
Non-cash items:
Depreciation and amortization 14 583 196 1,121 319
Other adjustments 14 24,730 13,413 28,347 34,892
Investment in lease incentives and initial direct
leasing costs 5 (2,141 ) (3,228 ) (5,087 ) (5,038 )
Interest on subsidiary redeemable units — 3,247 — 6,493
Change in non-cash working capital 14 (692 ) 2,732 885 1,476
15,372 16,586 31,368 30,771
Generated from (utilized in) investing activities
Additions to property and equipment (16 ) — (25 ) (18 )
Investment in building improvements 5 (5,257 ) (5,099 ) (6,190 ) (5,824 )
Transaction costs paid (10 ) (352 ) (80 ) (421 )
Net proceeds from disposal of investment properties — 6,720 — 8,394
(5,283 ) 1,269 (6,295 ) 2,131
Generated from (utilized in) financing activities
Mortgage financings, net of financing costs 6 14,405 8,865 14,405 67,625
Draw on revolving credit facility, net of financing costs 6 — 19,250 — 28,250
Mortgage principal repayments (5,959 ) (6,136 ) (11,861 ) (12,311 )
Mortgage lump sum repayments (10,287 ) (15,799 ) (10,287 ) (66,632 )
Repayment of revolving credit facility 6 — (12,500 ) — (26,000 )
Distributions paid on Units (8,830 ) (9,107 ) (17,780 ) (17,854 )
Interest paid on subsidiary redeemable units — (3,247 ) — (6,493 )
Cash (paid) proceeds on issue of Units — 2 (9 ) (6 )
(10,671 ) (18,672 ) (25,532 ) (33,421 )
Change in cash and cash equivalents (582 ) (817 ) (459 ) (519 )
Cash and cash equivalents, beginning of period 6,718 1,320 6,595 1,022
Cash and cash equivalents, end of period $ 6,136 $ 503 $ 6,136 $ 503
See accompanying notes to the condensed consolidated financial statements.

Dream Industrial REIT 2017 Second Quarter Report | 42
Notes to the condensed consolidated financial statements (All dollar amounts in thousands of Canadian dollars, except as otherwise noted)
Note 1
ORGANIZATION Dream Industrial Real Estate Investment Trust (“Dream Industrial REIT”, “Dream Industrial” or “the Trust”) is an open-ended investment trust created pursuant to a Declaration of Trust, as amended and restated, under the laws of the Province of Ontario. The condensed consolidated financial statements of Dream Industrial include the accounts of Dream Industrial and its subsidiaries. Dream Industrial’s portfolio comprises industrial properties located in urban centres across Canada. A subsidiary of Dream Industrial performs the property management function.
The Trust’s registered office is 30 Adelaide Street East, Suite 301, Toronto, Ontario, Canada M5C 3H1. The Trust is listed on the Toronto Stock Exchange under the symbol “DIR.UN”. Dream Industrial’s condensed consolidated financial statements for the period ended June 30, 2017 were authorized for issuance by the Board of Trustees on August 8, 2017, after which date they may be amended only with the Board of Trustees’ approval.
Throughout the Notes, reference is made to the following:
• “REIT Units”, meaning the REIT Units
• “Special Trust Units”, meaning units that are exchangeable for REIT Units, including the LP B Units
• “Units”, meaning REIT Units and Special Trust Units, collectively
For simplicity, throughout the Notes, reference is made to “subsidiary redeemable units”, meaning the LP B Units of Dream Industrial LP (“DILP”). Subsidiary redeemable units are classified as liabilities.
At June 30, 2017, Dream Office Real Estate Investment Trust (“Dream Office REIT”), directly and indirectly through its subsidiaries, held 18,551,855 (December 31, 2016 – 18,551,855) subsidiary redeemable units, being all of the subsidiary redeemable units of the Trust. At June 30, 2017, Dream Office REIT, directly and indirectly through its subsidiaries, held 1,718,537 REIT Units (December 31, 2016 – 882,473).
Note 2
SUMMARY OF SIGNIFICANT ACCOUNTING POLICIES Basis of presentation These condensed consolidated financial statements have been prepared in accordance with International Accounting Standard (“IAS”) 34, “Interim Financial Reporting”, as issued by the International Accounting Standards Board (“IASB”). Accordingly, certain information and footnote disclosures normally included in annual consolidated financial statements prepared in accordance with International Financial Reporting Standards (“IFRS”), as issued by the IASB, have been omitted or condensed.
The condensed consolidated financial statements have been prepared using the same significant accounting policies and methods as those used in the consolidated financial statements for the year ended December 31, 2016.
These condensed consolidated financial statements should be read in conjunction with the Trust’s consolidated financial statements for the year ended December 31, 2016.
Note 3
ACCOUNTING POLICIES SELECTED AND APPLIED FOR SIGNIFICANT TRANSACTIONS AND EVENTS The accounting policies selected and applied for significant transactions and events are consistent with those for the year ended December 31, 2016.
Future changes in accounting standards Future changes to the accounting standards are noted in the December 31, 2016 consolidated financial statements.

Dream Industrial REIT 2017 Second Quarter Report | 43
Note 4
CRITICAL ACCOUNTING JUDGMENTS, ESTIMATES AND ASSUMPTIONS IN APPLYING ACCOUNTING POLICIES Preparing the condensed consolidated financial statements requires management to make judgments, estimates and assumptions that affect the amounts reported. Management bases its judgments and estimates on historical experience and other factors it believes to be reasonable under the circumstances, but which are inherently uncertain and unpredictable, the result of which forms the basis of the carrying values of assets and liabilities. However, uncertainty about these assumptions and estimates could result in outcomes that could require a material adjustment to the carrying value of the affected asset or liability in the future. Management has applied the same methodologies in making critical accounting judgments, estimates and assumptions as disclosed in the Trust’s consolidated financial statements for the year ended December 31, 2016.
Note 5
INVESTMENT PROPERTIES
Six months ended Year ended
Note June 30, 2017 December 31, 2016
Balance at beginning of period $ 1,634,315 $ 1,700,992 Additions:
Investment property acquisitions(1)
— 200
Building improvements 6,190 18,522
Lease incentives and initial direct leasing costs 5,087 11,257
Total additions to investment properties 11,277 29,979
Investment properties classified as held for sale and disposed during the period 9 (8,700 ) (65,432 )
Gains (losses) included in net income:
Fair value adjustments to investment properties(2)
(19,666 ) (31,760 )
Straight-line rent 393 1,278
Amortization of lease incentives (521 ) (742 )
Total losses included in net income (loss) (19,794 ) (31,224 )
Balance at end of period $ 1,617,098 $ 1,634,315
(1) 2016 balance relates to post-closing adjustment on 2015 acquisition.
(2) Fair value adjustments to investment properties included in net income (loss) for the period ended June 30, 2017 and year ended December 31, 2016 includes unrealized losses of $19,666 and $38,770, respectively.
The key valuation metrics for investment properties are set out below:
June 30, 2017 December 31, 2016
Weighted Weighted
Range (%) average (%) Range (%) average (%)
Cap rate 4.00–9.25 6.64 5.50–9.25 6.71
Discount rate 5.00–9.00 7.53 6.25–9.00 7.58
Terminal rate 4.50–8.25 6.74 5.75–8.00 6.92
Investment properties with an aggregate fair value of $212,536 for the six months ended June 30, 2017 (for the year ended December 31, 2016 – $706,760) were valued by qualified external valuation professionals.
If the cap rate were to increase by 25 basis points (“bps”), the value of investment properties would decrease by $57,102. If the cap rate were to decrease by 25 bps, the value of investment properties would increase by $61,441.
As at June 30, 2017, investment properties with a fair value of $1,340,522 (December 31, 2016 – $1,353,915) are pledged as first-ranking and/or second-ranking collateral for mortgages. As at June 30, 2017, investment properties with a fair value of $162,520 (December 31, 2016 – $163,190) are pledged as security for the Trust’s revolving credit facility.

Dream Industrial REIT 2017 Second Quarter Report | 44
Note 6
DEBT
June 30, December 31,
2017 2016
Mortgages(1)
$ 733,664 $ 741,265
Revolving credit facility(1)
— —
Convertible debentures 127,513 127,082
Total 861,177 868,347
Less: Current portion (156,152 ) (87,725 )
Non-current debt $ 705,025 $ 780,622
(1) Secured by charges on specific investment properties (refer to Note 5). Amount available to be drawn under the revolving credit facility as at June 30, 2017 is $98,000 (December 31, 2016 – $98,000).
Mortgage financing activities The Trust completed the following financings for the six months ended June 30:
Six months ended June 30, 2017 Six months ended June 30, 2016
Term to Weighted Term to Weighted
maturity average face maturity average face
Amount(1) (years) interest rate (%) Amount(1) (years) interest rate (%)
New mortgages $ 14,500 5.0 3.98 $ 68,250 8.2 3.31
(1) Excludes financing costs.
Revolving credit facility The following table summarizes certain details of the Trust’s revolving credit facility as at June 30, 2017:
Letter of credit Principal Borrowing and forward amount Available capacity agreement outstanding to be drawn(1) Interest rate(2) Maturity date
Revolving credit facility(3)
$ 100,000 $ 2,000 $ — $ 98,000 — June 30, 2019
(1) Formula-based amount available to be drawn as at June 30, 2017.
(2) Bankers’ acceptance (“BA”) rate plus 1.70% or the bank’s prime rate plus 0.70%.
(3) Twenty-five properties are secured as first-ranking mortgages on the facility.
Interest rate swaps The following table summarizes the details of the interest rate swaps that are outstanding at June 30, 2017:
Mortgage principal Fixed Financial instrument Transaction date amount (notional) interest rate Maturity date classification Fair value
February 24, 2014 $ 48,533 3.31 % March 1, 2019 Cash flow hedge(1)
$ 484
Fair value through
August 26, 2015 48,080 2.93 % September 1, 2022 profit or loss (395)
Non-current debt $ 96,613 3.12 % $ 89
(1) The Trust has assessed that there is no ineffectiveness in the cash flow hedge of its interest rate exposure. The effectiveness of the hedging relationship is reviewed on a quarterly basis.

Dream Industrial REIT 2017 Second Quarter Report | 45
Note 7
DEFERRED UNIT INCENTIVE PLAN The DUIP provides for the grant of deferred trust units to trustees, officers and employees as well as affiliates and their service providers, including the asset manager. Deferred trust units are granted at the discretion of the trustees and earn income deferred trust units based on the payment of distributions. Once issued, each deferred trust unit, and the related distribution of income deferred trust units, vests evenly over a three- or five-year period on the anniversary date of the grant. Subject to an election option available for certain participants to defer receipt of REIT Units, such REIT Units will be issued immediately on vesting. As at June 30, 2017, up to a maximum of 1,500,000 (December 31, 2016 – 1,500,000) deferred trust units were issuable under the DUIP.
The movement in DUIP balance was as follows:
Note
As at January 1, 2017 $ 4,350
Compensation expense during the period 678
REIT Units issued for vested deferred trust units(1)
(646 )
Remeasurement of carrying value 10 310
As at June 30, 2017 $ 4,692
(1) Excludes $51 of REIT Units issued for vested deferred trust units as part of the fourth quarter 2016 cost reduction program.
During the six months ended June 30, 2017, $678 of compensation expense was recorded (June 30, 2016 – $727) and included in general and administrative expenses. For the same period, a fair value loss of $310 (June 30, 2016 – $802) was recognized in fair value adjustments to financial instruments representing the remeasurement of the DUIP liability for the year.
On February 21, 2017, 103,050 deferred trust units were granted to senior management and employees of the Trust. Of the units granted, 50,000 units relate to key management personnel. The grant date value of these deferred trust units was $8.75 per Unit granted.
On March 31, 2017, 6,997 deferred trust units were granted to trustees who elected to receive their 2017 quarterly fees in the form of deferred trust units rather than in cash. The grant date value of these deferred trust units was $8.22 per Unit granted.
On May 2, 2017, 40,000 deferred trust units were granted to trustees. The grant date value of these deferred trust units was $8.53 per Unit granted.
On June 30, 2017, 6,119 deferred trust units were granted to trustees who elected to receive their 2017 quarterly fees in the form of deferred trust units rather than in cash. The grant date value of these deferred trust units was $8.75 per Unit granted.
Note 8
AMOUNTS PAYABLE AND ACCRUED LIABILITIES
June 30, December 31,
2017 2016
Trade payables $ 1,776 $ 1,146
Accrued liabilities and other payables 13,130 12,416
Accrued interest 3,440 3,477
Rent received in advance 3,118 2,335
Distributions payable 3,553 3,478
Total $ 25,017 $ 22,852
Note 9
ASSETS HELD FOR SALE AND DISPOSITIONS Assets held for sale As at June 30, 2017, management had committed to a plan to sell one additional investment property, for a total of two investment properties. These properties are classified as assets held for sale.
June 30, December 31,
2017 2016
Investment properties $ 12,700 $ 4,000
Assets held for sale $ 12,700 $ 4,000

Dream Industrial REIT 2017 Second Quarter Report | 46
The following table summarizes the movements in investment properties classified as assets held for sale during the six months ended June 30, 2017 and year ended December 31, 2016:
Six months ended Year ended
Note June 30, 2017 December 31, 2016
Balance at beginning of period $ 4,000 $ 8,550
Add (deduct):
Capitalized costs — 171
Investment properties classified as held for sale during the period 5 8,700 65,432
Fair value adjustments to investment properties — (273 )
Investment properties disposed during the period — (69,880 )
Balance at end of period $ 12,700 $ 4,000
Dispositions There were no dispositions during the six months ended June 30, 2017. The following dispositions were completed during the six months ended June 30, 2016:
Gross Loss Mortgage
proceeds(1) on sale(2) discharged Date disposed
722 Edinburgh Drive, Moncton $ 1,625 $ (70 ) $ 981 March 30, 2016
1155 Autoroute Chomedey, Laval 6,750 (145 ) — June 6, 2016
Total $ 8,375 $ (215 ) $ 981
(1) Gross proceeds before transaction costs.
(2) Carrying value of assets approximated gross proceeds. The loss on sale arose entirely from transaction costs.
Note 10
FAIR VALUE ADJUSTMENTS TO FINANCIAL INSTRUMENTS Three months ended June 30, Six months ended June 30,
Note 2017 2016 2017 2016
Fair value adjustment on conversion feature of
the convertible debentures $ 494 $ 2,201 $ 709 $ 2,146
Remeasurement of carrying value of subsidiary
redeemable units (8,905 ) (12,800 ) (3,154 ) (28,755 )
Remeasurement of carrying value of DUIP 7 (370 ) (375 ) (310 ) (802 )
Fair value adjustment on interest rate swap 562 (237 ) 532 (1,052 )
Total $ (8,219 ) $ (11,211 ) $ (2,223 ) $ (28,463 )
Note 11
NET LOSSES ON TRANSACTIONS AND OTHER ACTIVITIES Three months ended June 30, Six months ended June 30,
Note 2017 2016 2017 2016
Investment in business transformation 13 $ — $ (125 ) $ — $ (250 )
Internal leasing costs (802 ) (1,035 ) (1,583 ) (2,056 )
Debt settlement gains — — — 4
Net loss on sale of investment properties 9 — (145 ) — (215 )
Transaction costs — — — (969 )
Cost reduction program charge — — (150 ) —
Total $ (802 ) $ (1,305 ) $ (1,733 ) $ (3,486 )

Dream Industrial REIT 2017 Second Quarter Report | 47
Note 12
SEGMENTED INFORMATION For the three and six months ended June 30, 2017 and June 30, 2016, the Trust’s investment properties were segmented into geographic components, namely Western Canada, Ontario, Québec and Eastern Canada. The Trust did not allocate interest expense to these segments since financing is viewed as a corporate function. The decision as to where to incur the debt is largely based on minimizing the cost of debt and is not specifically related to the segments. Similarly, other income, other expenses, fair value adjustments to financial instruments, net losses on transactions and other activities excluding internal leasing costs and income taxes were not allocated to the segment expenses.
Western Eastern Segment
Three months ended June 30, 2017 Canada Ontario Québec Canada total Other(1) Total
Operations
Investment properties revenue $ 16,313 $ 11,038 $ 7,543 $ 7,770 $ 42,664 $ — $ 42,664
Investment properties operating expenses (5,060 ) (3,291 ) (1,860 ) (3,517 ) (13,728 ) — (13,728 )
Net rental income 11,253 7,747 5,683 4,253 28,936 — 28,936
Other income — — — — — 32 32
Other expenses — — — — — (14,094 ) (14,094 )
Fair value adjustments and other items (6,283 ) 7,993 (3,995 ) (12,123 ) (14,408 ) (8,219 ) (22,627 )
Income (loss) before income taxes 4,970 15,740 1,688 (7,870 ) 14,528 (22,281 ) (7,753 )
Recovery of income taxes — — — — — 645 645
Net income (loss) for the period $ 4,970 $ 15,740 $ 1,688 $ (7,870 ) $ 14,528 $ (21,636 ) $ (7,108 )
(1) Includes other income, other expenses, fair value adjustments to financial instruments, and net losses on transactions and other activities, excluding internal leasing costs and income taxes, which are not monitored at a regional level.
Western Eastern Segment
Six months ended June 30, 2017 Canada Ontario Québec Canada total Other(1) Total
Operations
Investment properties revenue $ 32,785 $ 21,964 $ 15,225 $ 15,557 $ 85,531 $ — $ 85,531
Investment properties operating expenses (10,357 ) (6,672 ) (3,946 ) (7,219 ) (28,194 ) — (28,194 )
Net rental income 22,428 15,292 11,279 8,338 57,337 — 57,337
Other income — — — — — 57 57
Other expenses — — — — — (28,185 ) (28,185 )
Fair value adjustments and other items (13,445 ) 11,031 (5,440 ) (13,395 ) (21,249 ) (2,373 ) (23,622 )
Income (loss) before income taxes 8,983 26,323 5,839 (5,057 ) 36,088 (30,501 ) 5,587
Recovery of income taxes — — — — — 515 515
Net income (loss) for the period $ 8,983 $ 26,323 $ 5,839 $ (5,057 ) $ 36,088 $ (29,986 ) $ 6,102
(1) Includes other income, other expenses, fair value adjustments to financial instruments, and net losses on transactions and other activities, excluding internal leasing costs and income taxes, which are not monitored at a regional level.
Western Eastern Segment
Three months ended June 30, 2016 Canada Ontario Québec Canada total Other(1) Total
Operations
Investment properties revenue $ 17,205 $ 11,393 $ 8,074 $ 8,032 $ 44,704 $ — $ 44,704
Investment properties operating expenses (5,725 ) (3,780 ) (2,127 ) (3,542 ) (15,174 ) — (15,174 )
Net rental income 11,480 7,613 5,947 4,490 29,530 — 29,530
Other income — — — — — 7 7
Other expenses — — — — — (14,681 ) (14,681 )
Fair value adjustments and other items (9,230 ) 1,206 9,831 (5,306 ) (3,499 ) (11,482 ) (14,981 )
Income (loss) before income taxes 2,250 8,819 15,778 (816 ) 26,031 (26,156 ) (125 )
Recovery of income taxes — — — — — 351 351
Net income (loss) for the period $ 2,250 $ 8,819 $ 15,778 $ (816 ) $ 26,031 $ (25,805 ) $ 226
(1) Includes other income, other expenses, fair value adjustments to financial instruments, and net losses on transactions and other activities, excluding internal leasing costs and income taxes, which are not monitored at a regional level.

Dream Industrial REIT 2017 Second Quarter Report | 48
Western Eastern Segment
Six months ended June 30, 2016 Canada Ontario Québec Canada total Other(1) Total
Operations
Investment properties revenue $ 33,505 $ 22,756 $ 16,244 $ 16,236 $ 88,741 $ — $ 88,741
Investment properties operating expenses (10,483 ) (7,475 ) (4,455 ) (7,143 ) (29,556 ) — (29,556 )
Net rental income 23,022 15,281 11,789 9,093 59,185 — 59,185
Other income — — — — — 23 23
Other expenses — — — — — (29,283 ) (29,283 )
Fair value adjustments and other items (10,818 ) 252 8,832 (5,922 ) (7,656 ) (29,894 ) (37,550 )
Income (loss) before income taxes 12,204 15,533 20,621 3,171 51,529 (59,154 ) (7,625 )
Recovery of income taxes — — — — — 254 254
Net income (loss) for the period $ 12,204 $ 15,533 $ 20,621 $ 3,171 $ 51,529 $ (58,900 ) $ (7,371 )
(1) Includes other income, other expenses, fair value adjustments to financial instruments, and net losses on transactions and other activities, excluding internal leasing costs and income taxes, which are not monitored at a regional level.
Investment properties
Western Eastern
Six months ended June 30, 2017 Canada Ontario Québec Canada Total
Investment properties $ 627,442 $ 447,681 $ 292,380 $ 249,595 $ 1,617,098
Total capital expenditures and leasing costs(1)
3,291 2,739 1,472 3,775 11,277
(1) Includes building improvements and lease incentives and initial direct leasing costs.
Western Eastern
Year ended December 31, 2016 Canada Ontario Québec Canada Total
Investment properties $ 636,855 $ 442,260 $ 296,190 $ 259,010 $ 1,634,315
Total capital expenditures and leasing costs(1)
8,665 9,057 4,591 7,466 29,779
(1) Includes building improvements and lease incentives and initial direct leasing costs.
Note 13
RELATED PARTY TRANSACTIONS AND ARRANGEMENTS From time to time, Dream Industrial and its subsidiaries enter into transactions with related parties. Dream Industrial, DILP (a wholly owned subsidiary of the Trust), Dream Industrial Management LP (a wholly owned subsidiary of DILP), Dream Industrial Management Corp. and Dream Office Management Corp. (a subsidiary of Dream Office REIT), are parties to an administrative services agreement (the “Services Agreement”) which is automatically renewed on October 4 of every year for additional one-year terms unless terminated by any party.
Effective October 4, 2012, Dream Industrial also has an asset management agreement (the “Asset Management Agreement”) with Dream Asset Management Corporation (“DAM”), formerly known as Dundee Realty Corporation, a subsidiary of Dream Unlimited Corp., pursuant to which DAM provides certain asset management services to Dream Industrial and its subsidiaries, which is in effect until October 4, 2022.
Shared Services and Cost Sharing Agreement The existing Asset Management Agreement provides the Trust and DAM, from time to time, the opportunity to agree on additional services to be provided to the Trust for which DAM is to be reimbursed for its costs. The Trust and DAM are party to an amended Shared Services and Cost Sharing Agreement as of April 2, 2015. According to the terms of the amended arrangement, DAM will continue to provide administrative and support services on an as-needed basis and will be reimbursed on a cost recovery basis for any expenses incurred. The Trust will continue to reimburse DAM for any shared costs allocated in each calendar year. This amended agreement provides for the automatic reappointment of DAM for additional one-year terms commencing on January 1 unless and until terminated in accordance with its terms or by mutual agreement of the parties.
Effective January 1, 2016, Dream Technology Ventures LP (“DTV LP”), a limited partnership, was established by a wholly owned subsidiary of DAM acting as general partner and DAM, Dream Office LP, DILP, Dream Global REIT and Dream Alternatives Master LP as limited partners. Each of the limited partners, including the Trust, contribute capital to DTV LP to fund costs incurred relating to technology personnel and technology related platforms. In addition, the Trust is party to a licensing agreement in respect of the use of the developed technology. The Trust accounts for its investment in DTV LP on an equity
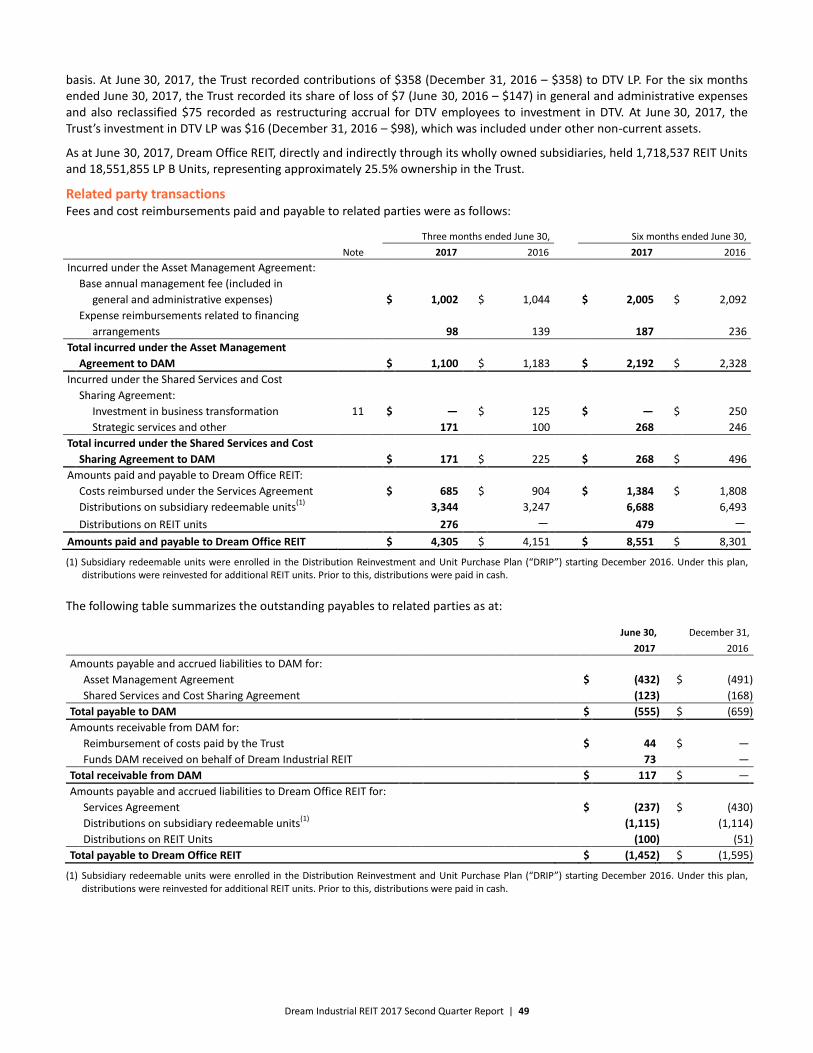
Dream Industrial REIT 2017 Second Quarter Report | 49
basis. At June 30, 2017, the Trust recorded contributions of $358 (December 31, 2016 – $358) to DTV LP. For the six months ended June 30, 2017, the Trust recorded its share of loss of $7 (June 30, 2016 – $147) in general and administrative expenses and also reclassified $75 recorded as restructuring accrual for DTV employees to investment in DTV. At June 30, 2017, the Trust’s investment in DTV LP was $16 (December 31, 2016 – $98), which was included under other non-current assets.
As at June 30, 2017, Dream Office REIT, directly and indirectly through its wholly owned subsidiaries, held 1,718,537 REIT Units and 18,551,855 LP B Units, representing approximately 25.5% ownership in the Trust.
Related party transactions Fees and cost reimbursements paid and payable to related parties were as follows:
Three months ended June 30, Six months ended June 30,
Note 2017 2016 2017 2016
Incurred under the Asset Management Agreement:
Base annual management fee (included in
general and administrative expenses) $ 1,002 $ 1,044 $ 2,005 $ 2,092
Expense reimbursements related to financing
arrangements 98 139 187 236
Total incurred under the Asset Management
Agreement to DAM $ 1,100 $ 1,183 $ 2,192 $ 2,328
Incurred under the Shared Services and Cost
Sharing Agreement:
Investment in business transformation 11 $ — $ 125 $ — $ 250
Strategic services and other 171 100 268 246
Total incurred under the Shared Services and Cost
Sharing Agreement to DAM $ 171 $ 225 $ 268 $ 496
Amounts paid and payable to Dream Office REIT:
Costs reimbursed under the Services Agreement $ 685 $ 904 $ 1,384 $ 1,808
Distributions on subsidiary redeemable units(1)
3,344 3,247 6,688 6,493
Distributions on REIT units 276 — 479 —
Amounts paid and payable to Dream Office REIT $ 4,305 $ 4,151 $ 8,551 $ 8,301
(1) Subsidiary redeemable units were enrolled in the Distribution Reinvestment and Unit Purchase Plan (“DRIP”) starting December 2016. Under this plan, distributions were reinvested for additional REIT units. Prior to this, distributions were paid in cash.
The following table summarizes the outstanding payables to related parties as at:
June 30, December 31,
2017 2016
Amounts payable and accrued liabilities to DAM for:
Asset Management Agreement $ (432 ) $ (491 )
Shared Services and Cost Sharing Agreement (123 ) (168 )
Total payable to DAM $ (555 ) $ (659 )
Amounts receivable from DAM for:
Reimbursement of costs paid by the Trust $ 44 $ —
Funds DAM received on behalf of Dream Industrial REIT 73 —
Total receivable from DAM $ 117 $ —
Amounts payable and accrued liabilities to Dream Office REIT for:
Services Agreement $ (237 ) $ (430 )
Distributions on subsidiary redeemable units(1)
(1,115 ) (1,114 )
Distributions on REIT Units (100 ) (51 )
Total payable to Dream Office REIT $ (1,452 ) $ (1,595 )
(1) Subsidiary redeemable units were enrolled in the Distribution Reinvestment and Unit Purchase Plan (“DRIP”) starting December 2016. Under this plan, distributions were reinvested for additional REIT units. Prior to this, distributions were paid in cash.

Dream Industrial REIT 2017 Second Quarter Report | 50
Compensation of key management personnel, including trustees, is as follows:
Three months ended June 30, Six months ended June 30,
2017 2016 2017 2016
Unit-based awards granted during the period(1)
$ 395 $ 388 $ 890 $ 827
Trustees’ fees paid in cash 32 23 83 44
Total $ 427 $ 411 $ 973 $ 871
(1) Deferred trust units granted to officers and trustees vest over a five-year period with one-fifth of the deferred trust units vesting each year. Amounts are determined based on the grant date fair value of deferred trust units multiplied by the number of deferred trust units granted in the period.
Note 14
SUPPLEMENTARY CASH FLOW INFORMATION The components of depreciation and amortization, net, under operating activities include:
Three months ended June 30, Six months ended June 30,
Note 2017 2016 2017 2016
Amortization of lease incentives 5 $ 278 $ 162 $ 521 $ 301
Amortization of financing costs 409 364 811 717
Depreciation of property and equipment 14 13 28 26
Amortization of fair value adjustments on
assumed debt (118 ) (343 ) (239 ) (725 )
Total $ 583 $ 196 $ 1,121 $ 319
The components of other adjustments under operating activities include:
Three months ended June 30, Six months ended June 30,
Note 2017 2016 2017 2016
Deferred unit compensation expense 7 $ 375 $ 383 $ 678 $ 727
Straight-line rent 5 (169 ) (440 ) (393 ) (825 )
Fair value adjustments to investment properties 5 13,606 2,465 19,666 5,601
Fair value adjustments to financial instruments 10 8,219 11,211 2,223 28,463
Transaction costs 11 — — — 969
Net loss on sale of investment properties 9 — 145 — 215
(Recovery of) deferred income taxes (645 ) (351 ) (515 ) (254 )
Debt settlement gains 11 — — — (4 )
Non-cash distributions on subsidiary
redeemable units 3,344 — 6,688 —
Other adjustments to operating activities $ 24,730 $ 13,413 $ 28,347 $ 34,892
The components of the changes in non-cash working capital under operating activities include:
Three months ended June 30, Six months ended June 30,
2017 2016 2017 2016
Decrease in amounts receivable $ 205 $ 606 $ 212 $ 77
(Increase) in prepaid expenses and other assets (781 ) (1,192 ) (1,843 ) (2,043 )
(Increase) decrease in other non-current assets (49 ) 33 (56 ) (16 )
Increase (decrease) in amounts payable and accrued liabilities (55 ) 2,371 2,303 2,417
Increase (decrease) in tenant security deposits (12 ) 914 269 1,041
Change in non-cash working capital $ (692 ) $ 2,732 $ 885 $ 1,476
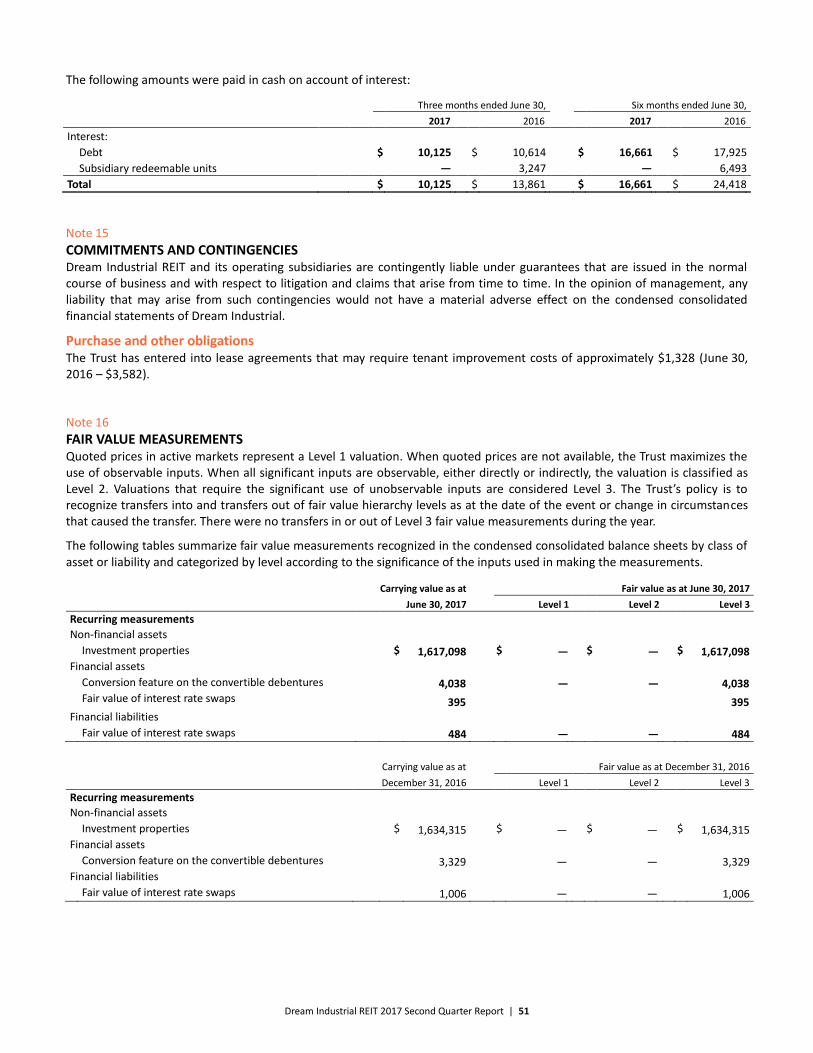
Dream Industrial REIT 2017 Second Quarter Report | 51
The following amounts were paid in cash on account of interest:
Three months ended June 30, Six months ended June 30,
2017 2016 2017 2016
Interest:
Debt $ 10,125 $ 10,614 $ 16,661 $ 17,925
Subsidiary redeemable units — 3,247 — 6,493
Total $ 10,125 $ 13,861 $ 16,661 $ 24,418
Note 15
COMMITMENTS AND CONTINGENCIES Dream Industrial REIT and its operating subsidiaries are contingently liable under guarantees that are issued in the normal course of business and with respect to litigation and claims that arise from time to time. In the opinion of management, any liability that may arise from such contingencies would not have a material adverse effect on the condensed consolidated financial statements of Dream Industrial.
Purchase and other obligations The Trust has entered into lease agreements that may require tenant improvement costs of approximately $1,328 (June 30, 2016 – $3,582).
Note 16
FAIR VALUE MEASUREMENTS Quoted prices in active markets represent a Level 1 valuation. When quoted prices are not available, the Trust maximizes the use of observable inputs. When all significant inputs are observable, either directly or indirectly, the valuation is classified as Level 2. Valuations that require the significant use of unobservable inputs are considered Level 3. The Trust’s policy is to recognize transfers into and transfers out of fair value hierarchy levels as at the date of the event or change in circumstances that caused the transfer. There were no transfers in or out of Level 3 fair value measurements during the year.
The following tables summarize fair value measurements recognized in the condensed consolidated balance sheets by class of asset or liability and categorized by level according to the significance of the inputs used in making the measurements.
Carrying value as at Fair value as at June 30, 2017
June 30, 2017 Level 1 Level 2 Level 3
Recurring measurements Non-financial assets
Investment properties $ 1,617,098 $ — $ — $ 1,617,098 Financial assets
Conversion feature on the convertible debentures 4,038 — — 4,038
Fair value of interest rate swaps 395 395
Financial liabilities
Fair value of interest rate swaps 484 — — 484
Carrying value as at Fair value as at December 31, 2016
December 31, 2016 Level 1 Level 2 Level 3
Recurring measurements Non-financial assets
Investment properties $ 1,634,315 $ — $ — $ 1,634,315 Financial assets
Conversion feature on the convertible debentures 3,329 — — 3,329 Financial liabilities
Fair value of interest rate swaps 1,006 — — 1,006
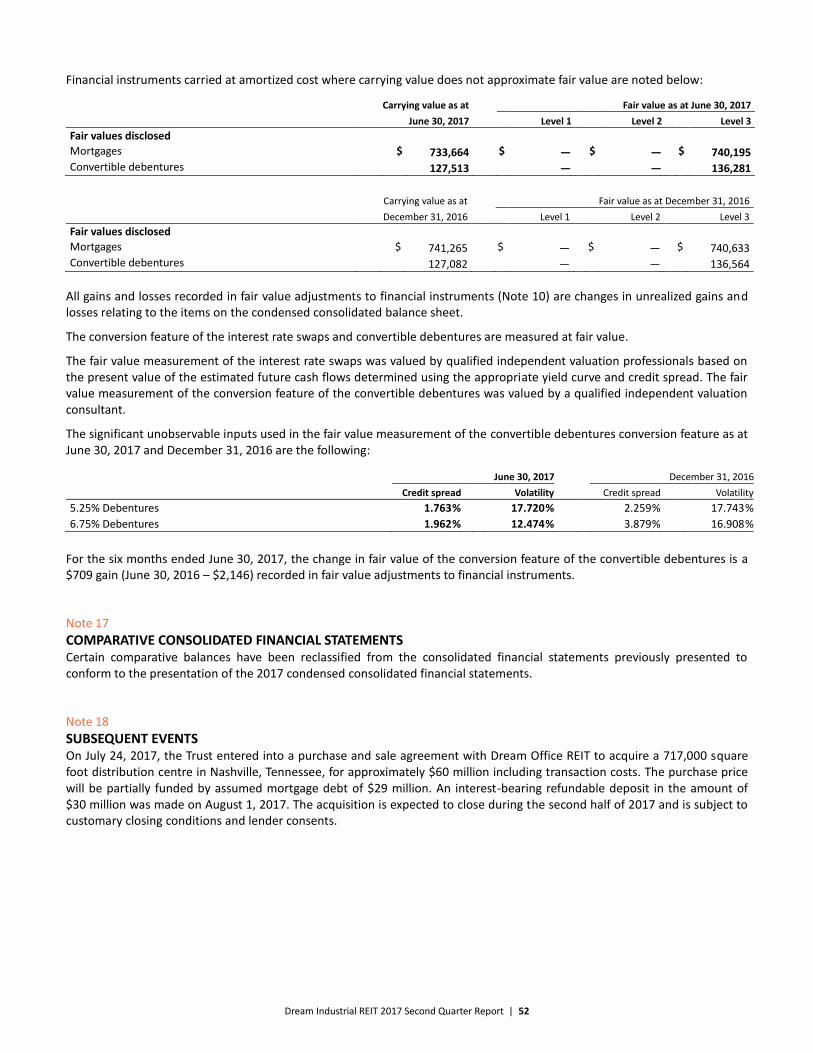
Dream Industrial REIT 2017 Second Quarter Report | 52
Financial instruments carried at amortized cost where carrying value does not approximate fair value are noted below:
Carrying value as at Fair value as at June 30, 2017
June 30, 2017 Level 1 Level 2 Level 3
Fair values disclosed Mortgages $ 733,664 $ — $ — $ 740,195 Convertible debentures 127,513 — — 136,281
Carrying value as at Fair value as at December 31, 2016
December 31, 2016 Level 1 Level 2 Level 3
Fair values disclosed Mortgages $ 741,265 $ — $ — $ 740,633 Convertible debentures 127,082 — — 136,564
All gains and losses recorded in fair value adjustments to financial instruments (Note 10) are changes in unrealized gains and losses relating to the items on the condensed consolidated balance sheet.
The conversion feature of the interest rate swaps and convertible debentures are measured at fair value.
The fair value measurement of the interest rate swaps was valued by qualified independent valuation professionals based on the present value of the estimated future cash flows determined using the appropriate yield curve and credit spread. The fair value measurement of the conversion feature of the convertible debentures was valued by a qualified independent valuation consultant.
The significant unobservable inputs used in the fair value measurement of the convertible debentures conversion feature as at June 30, 2017 and December 31, 2016 are the following:
June 30, 2017 December 31, 2016
Credit spread Volatility Credit spread Volatility
5.25% Debentures 1.763 % 17.720 % 2.259 % 17.743 %
6.75% Debentures 1.962 % 12.474 % 3.879 % 16.908 %
For the six months ended June 30, 2017, the change in fair value of the conversion feature of the convertible debentures is a $709 gain (June 30, 2016 – $2,146) recorded in fair value adjustments to financial instruments.
Note 17
COMPARATIVE CONSOLIDATED FINANCIAL STATEMENTS Certain comparative balances have been reclassified from the consolidated financial statements previously presented to conform to the presentation of the 2017 condensed consolidated financial statements.
Note 18
SUBSEQUENT EVENTS On July 24, 2017, the Trust entered into a purchase and sale agreement with Dream Office REIT to acquire a 717,000 square foot distribution centre in Nashville, Tennessee, for approximately $60 million including transaction costs. The purchase price will be partially funded by assumed mortgage debt of $29 million. An interest-bearing refundable deposit in the amount of $30 million was made on August 1, 2017. The acquisition is expected to close during the second half of 2017 and is subject to customary closing conditions and lender consents.

Corporate information
HEAD OFFICE Dream Industrial Real Estate Investment TrustState Street Financial Centre30 Adelaide Street East, Suite 301Toronto, Ontario M5C 3H1Phone: (416) 365-3535Fax: (416) 365-6565
TRANSFER AGENT(for change of address, registration or other unitholder enquiries)
Computershare Trust Company of Canada100 University Avenue, 8th FloorToronto, Ontario M5J 2Y1Phone: (514) 982-7555 or 1 800 564-6253Fax: (416) 263-9394 or1 888 453-0330E-mail: [email protected]
AUDITORSPricewaterhouseCoopers LLPPwC Tower, 18 York Street, Suite 2600Toronto, Ontario M5J 0B2
CORPORATE COUNSELOsler, Hoskin & Harcourt LLPBox 50, 1 First Canadian Place, Suite 6200Toronto, Ontario M5X 1B8
INVESTOR RELATIONSPhone: (416) 365-3535Toll free: 1 877 365-3535E-mail: [email protected]: www.dreamindustrialreit.ca
STOCK EXCHANGE LISTINGThe Toronto Stock ExchangeListing symbols:REIT Units: DIR.UN5.25% Convertible Debentures: DIR.DB6.75% Convertible Debentures: DIN.DB
DISTRIBUTION REINVESTMENT AND UNIT PURCHASE PLANThe purpose of our Distribution Reinvestment and Unit Purchase Plan (“DRIP”) is to provide unitholders with a convenient way of investing in additional units without incurring transaction costs such as commissions, service charges or brokerage fees. By participating in the DRIP, you may invest in additional units in two ways:
Distribution reinvestment: Unitholders will have cash distributions from Dream Industrial REIT reinvested in additional units as and when cash distributions are made. If you register in the DRIP, you will also receive a “bonus” distribution of units equal to 3% of the amount of your cash distribution reinvested pursuant to the DRIP. In other words, for every $1.00 of cash distributions reinvested by you under the plan, $1.03 worth of units will be purchased.
Cash purchase: Unitholders may invest in additional units by making cash purchases.
To enrol, contact: Computershare Trust Company of Canada100 University Avenue, 8th FloorToronto, Ontario M5J 2Y1Attention: Dividend Reinvestment Services
Or call their Customer Contact Centre at 1 800 564-6253 (toll free) or (514) 982-7555

Corporate office
30 Adelaide Street East, Suite 301Toronto, ON M5C 3H1 Phone: 416.365.3535Fax: 416.365.6565Email: [email protected]