![H1 - Financial Year 2016 - EDAGir.edag.com/download/companies/edag/Presentations/H12016... · Analyst Presentation – H1 2016 355.2 362.4 H1 2015 H1 2016 Core Revenue [m€] Revenues](https://static.fdocuments.in/doc/165x107/5f746af321bff008d84401b2/h1-financial-year-2016-analyst-presentation-a-h1-2016-3552-3624-h1-2015.jpg)
Q2 2016 RESULTS TELECONFERENCE - TormQ2 2016 Results HIGHLIGHTS FOR THE SECOND QUARTER OF 2016 •...
13
16 August 2016 Q2 2016 RESULTS TELECONFERENCE
Transcript of Q2 2016 RESULTS TELECONFERENCE - TormQ2 2016 Results HIGHLIGHTS FOR THE SECOND QUARTER OF 2016 •...

1 6 A u gu s t 2 0 1 6
Q2 2016 RESULTS
TELECONFERENCE
2
SAFE HARBOR STATEMENT
Matters discussed in this release may constitute forward-looking statements. Forward-looking statements reflect our current views with respect to future events and financial performance and may include statements concerning plans, objectives, goals, strategies, future events or performance, and underlying assumptions and statements other than statements of historical facts. The words “believe,” “anticipate,” “intend,” “estimate,” “forecast,” “project,” “plan,” “potential,” “may,” “should,” “expect,” “pending” and similar expressions generally identify forward-looking statements.
The forward-looking statements in this release are based upon various assumptions, many of which are based, in turn, upon further assumptions, including without limitation, management’s examination of historical operating trends, data contained in our records and other data available from third parties. Although the Company believes that these assumptions were reasonable when made, because these assumptions are inherently subject to significant uncertainties and contingencies that are difficult or impossible to predict and are beyond our control, the Company cannot guarantee that it will achieve or accomplish these expectations, beliefs or projections.
Important factors that, in our view, could cause actual results to differ materially from those discussed in the forward- looking statements include the strength of the world economy and currencies, changes in charter hire rates and vessel values, changes in demand for “ton miles” of oil carried by oil tankers, the effect of changes in OPEC’s petroleum production levels and worldwide oil consumption and storage, changes in demand that may affect attitudes of time charterers to scheduled and unscheduled dry-docking, changes in TORM’s operating expenses, including bunker prices, dry-docking and insurance costs, changes in the regulation of shipping operations, including requirements for double hull tankers or actions taken by regulatory authorities, potential liability from pending or future litigation, domestic and international political conditions, potential disruption of shipping routes due to accidents, political events or acts by terrorists.
In light of these risks and uncertainties, you should not place undue reliance on forward-looking statements contained in this release because they are statements about events that are not certain to occur as described or at all. These forward-looking statements are not guarantees of our future performance, and actual results and future developments may vary materially from those projected in the forward-looking statements.
Except to the extent required by applicable law or regulation, the Company undertakes no obligation to release publicly any revisions to these forward-looking statements to reflect events or circumstances after the date of this release or to reflect the occurrence of unanticipated events.

3
Jacob Meldgaard
▪ Executive Director in TORM plc
▪ CEO of TORM A/S since April 2010
▪ Previously Executive Vice President of the Danish shipping company NORDEN where he was in charge of the company’s dry cargo division
▪ Prior to that he held various positions with J. Lauritzen and A.P. Møller-Mærsk
▪ More than 20 years of shipping experience
Christian Søgaard-Christensen
▪ Acting CFO of TORM A/S
▪ Previously Head of Corporate Support at TORM A/S
▪ Prior to that with McKinsey & Co
▪ 10+ years in transportation
TODAYS PRESENTERS

4
Product tanker
market
Corporate
events
• New corporate structure of the TORM Group has been established including the insertion of a UK parent company, TORM plc, a delisting of
TORM A/S and a listing of TORM plc on Nasdaq Copenhagen
• TORM will distribute USD 25m in dividends in September 2016 and intends to subsequently distribute 25 to 50% of Net Income going forward
• Since May 2016 TORM has conducted share repurchase for a total of USD 20m from the squeeze-out process (USD 19m), and general
market purchases (USD 1m)
Sales &
Purchase
• Product tanker ordering was very limited in the first half of 2016. By the end of July 2016, the order book stands at 15% of the total fleet which
is a decrease of 5 percentage points from the end of 2015
• Second-hand values have continued to be under pressure due to limited available financing and a high number of sale candidates
• Contracting of newbuildings has been historically low in all segments resulting in reduced prices which has been further impacted by the
restructuring of the Korean yard industry
• The value of TORM’s product tanker fleet has decreased by USD 198m (~11%) in the second quarter of 2016
Q2 2016
Results
HIGHLIGHTS FOR THE SECOND QUARTER OF 2016
• EBITDA of USD 57m (H1 2016: USD 126m) and Profit before tax of USD 15m (H1 2016: USD 46m)
• RoIC of 6% (H1 2016: 8%) and Earnings per share of USD 0.2 or DKK 1.6 (H1 2016: USD 0.7 or DKK 4.9)
• Net Asset Value estimated at USD 873m, corresponding to a NAV/share of USD 14.0 or DKK 93.9
• For the full-year 2016, TORM has specified its guidance to:
‒ EBITDA in the range of USD 210-250m
‒ Profit before tax in the range of USD 50-90m
2016
guidance
• TORM’s achieved product tanker freight rates across segments have been at USD/day ~17,500, which is a decrease of USD/day ~2,000
compared to the last two quarters. Looking ahead, the third quarter market looks challenging, but profitable, with current rates below the
levels seen in H1
• Fundamental oil demand was high during the second quarter of 2016. However, the product tanker market was negatively impacted by
primarily high gasoline and diesel stocks causing most regions to cover own consumption by drawing down on inventories
• In the East, the market has been negatively impacted by weak naphtha imports due to maintenance at production facilities and usage of
substitution products such as LPG

5
PRODUCT TANKER FREIGHT RATES SOFTENED DURING Q2
Source: Clarksons. Spot earnings: LR2: TC1 Ras Tanura-> Chiba, LR1: TC5 Ras Tanura-> Chiba and MR: average basket of Rotterdam->NY, Bombay->Chiba, Mina Al Ahmadi->Rotterdam, Amsterdam->Lome,
Houston->Rio de Janeiro, Singapore->Sidney
FREIGHT RATES IN ‘000 USD/DAY
West
• Despite high product stockpiles, the transatlantic trade volumes were at
a healthy level driven by high gasoline demand in the US
• US exports of clean petroleum products increased compared to last
quarter
• Naphtha arbitrage trade from West to East declined
• Economic and political issues in West Africa reduced imports to the
region
• These negative factors kept freight rates at lower levels compared to
previous quarters despite the fundamentally strong US gasoline imports
and clean product exports
East
• Far East naphtha imports weakened due to maintenance in the
petrochemical sector and an increase in the use of liquefied petroleum
gas as substitution for naphtha
• In addition, the markets were negatively impacted by lower exports out of
India due to increased domestic consumption as a result of strong
economic growth and drought reducing available hydro power
6
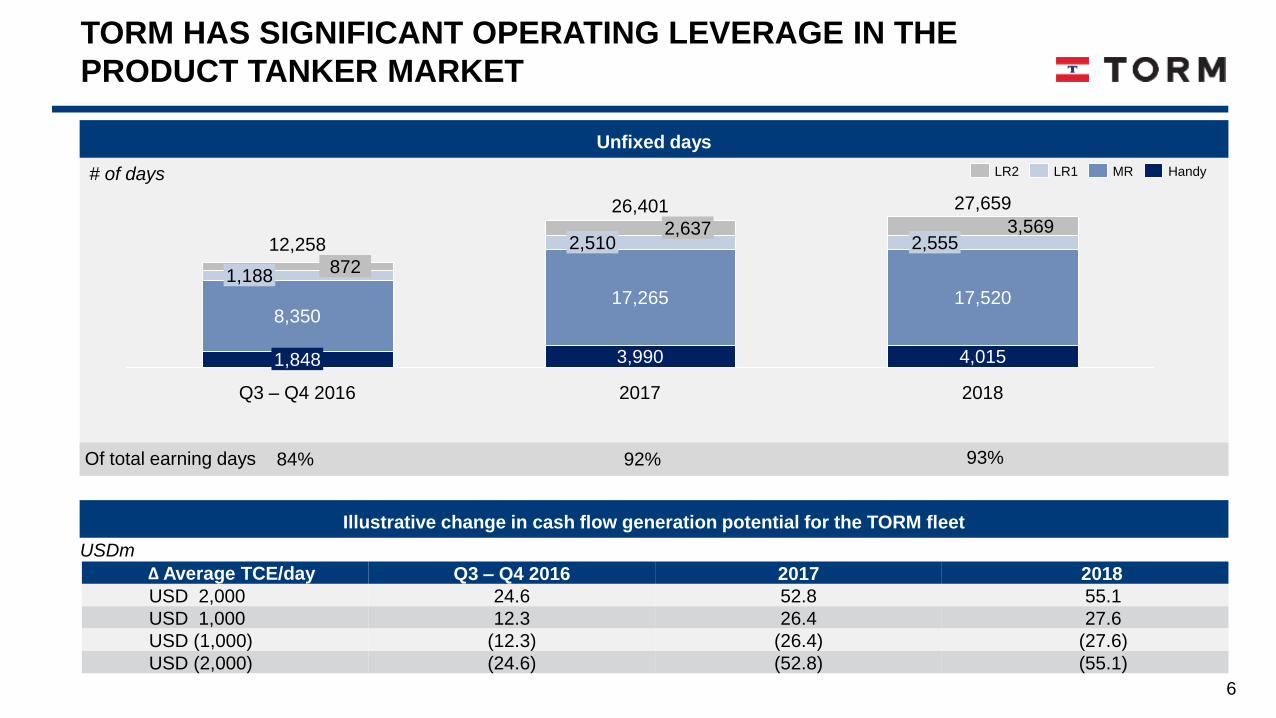
Unfixed days
2017 2018
27,659
4,015
17,520
2,5553,569
26,401
3,990
17,265
2,5102,637
Q3 – Q4 2016
12,258
1,848
8,350
1,188872
HandyMRLR1LR2
Illustrative change in cash flow generation potential for the TORM fleet
∆ Average TCE/day Q3 – Q4 2016 2017 2018
USD 2,000 24.6 52.8 55.1
USD 1,000 12.3 26.4 27.6
USD (1,000) (12.3) (26.4) (27.6)
USD (2,000) (24.6) (52.8) (55.1)
USDm
# of days
Of total earning days 84% 92%
TORM HAS SIGNIFICANT OPERATING LEVERAGE IN THE
PRODUCT TANKER MARKET
93%
7
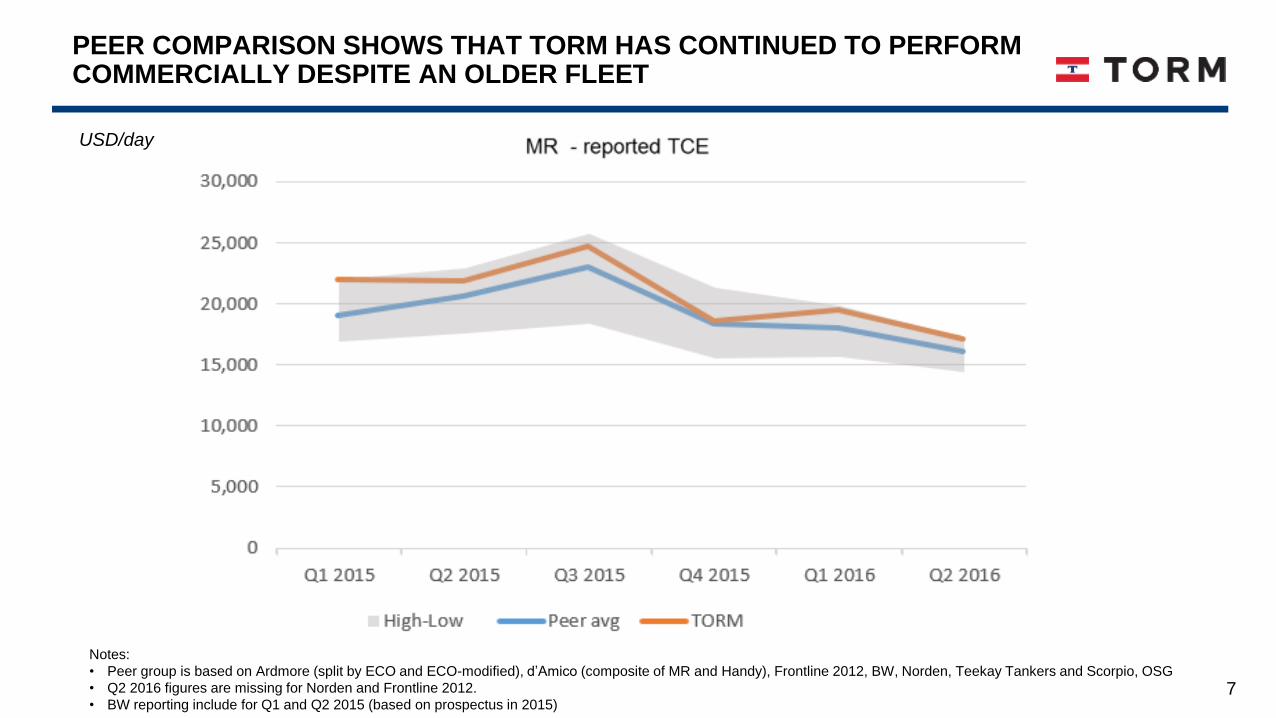
Notes:
• Peer group is based on Ardmore (split by ECO and ECO-modified), d’Amico (composite of MR and Handy), Frontline 2012, BW, Norden, Teekay Tankers and Scorpio, OSG
• Q2 2016 figures are missing for Norden and Frontline 2012.
• BW reporting include for Q1 and Q2 2015 (based on prospectus in 2015)
USD/day
PEER COMPARISON SHOWS THAT TORM HAS CONTINUED TO PERFORM COMMERCIALLY DESPITE AN OLDER FLEET

8
PRO FORMA OPEX HAS SHOWN A FLAT TREND
9,000
0
2,000
1,000
3,000
4,000
5,000
6,000
7,000
8,000
USD/operating day
OPEX
Q2 15 Q3 15 Q4 15 Q1 16 Q2 16Q1 15

9
TORM operates on a fully integrated commercial and
technical platformTORM has trimmed administration expenses significantly
Admin. expenses (quarterly avg. in USDm)
• TORM’s operational platform handles all commercial and
technical operation
• The integrated business model provides TORM with the highest
possible trading flexibility and earning power
• TORM manages
‒ ~80 vessels commercially
‒ ~75 vessels technically
• TORM has a global reach with offices in Denmark, India, the
Philippines, Singapore, the UK and the US
• Average admin cost per earning day for Q2 of USD/day 1,550
• Outsourced technical and commercial management would
affect other line items of the P&L
TORM HAS A FULLY INTEGRATED BUSINESS MODEL AND ADMIN EXPENSES ARE TRENDING SIGNIFICANTLY DOWN
0 2 4 6 8 10 12 14 16 18 20 22 24
2015*
2014
2013
2012 -52%
1H 2016
2011
2010
2009
2008
* Pro forma figures for 2015 presented as though the Restructuring occurred as of 1 January 2015 and include the combined TORM and Njord fleet

10
TORM has, in order to allow for dividend
payments, terminated the cash sweep
mechanism under the term facility and will
start to pay fixed amortization from Q3
2016
Ample headroom under our attractive
covenant package:
Minimum liquidity: USD 75m*
Minimum book equity ratio: 25%
(adjusted for market value of vessels)
* Of which USD 20m must be cash or cash equivalent
57
15072
7363720
Hereafter
304
2020
repayment
2019
repayment
2018
repayment
2017
repayment
ROY 2016
repayment
Debt as of
30 Jun 2016
1688662
20
Total201820172016
75117
Available
debt facility
Cash position
CAPEX commitments Available liquidity
CAPEX and liquidity as of 30 June 2016 (USDm)
TORM is well-positioned to service future
CAPEX and debt commitments
On 8 July TORM finalized financing of the
LR2 newbuildings of up to USD 115m (up
to 60% financing) with 12 years maturity
at attractive terms
Strong operational cash flows expected in
2016
Scheduled debt repayments (USDm)
100% 9% 10% 10% 21% 8% 42%
TORM HAS A FAVOURABLE FINANCING PROFILE AND STRONG LIQUIDITY POSITION
Financing of LR2
newbuildings
Total available
liquidity
307
192
115

11
TORM HAS DISTRIBUTED A TOTAL OF USD 45M TO SHAREHOLDERS FOLLOWING THE SEPTEMBER DIVIDEND
2016 distribution to shareholders (USDm)
Yield of 8% *
50-90% of 2016 Net Income
• In connection with the Corporate Restructuring TORM plc has made
accretive share repurchases for an amount of USD 19m covering 2.4% of
the outstanding TORM A/S shares
• During June and July 2016 TORM plc has repurchased 113,347 shares on
Nasdaq Copenhagen for a total consideration of USD 1m, at a significant
discount to NAV and TORM may from time to time continue to conduct
limited share purchase in the market
• In line with the announcement in connection with TORM’s Q1 report on 12
May 2016, TORM plc will pay a USD 25m dividend on 15 September
2016, with ex-dividend date on 24 August 2016
• The USD 25m in dividend corresponds to a dividend per share of
USD 0.41 or DKK 2.74*
• During 2016 TORM has distributed a total of USD 45m to shareholders, in
addition to any further purchase in the market, corresponding to a yield of
8% *
Total distributionSeptember
dividend
119
Market purchaseRepurchase
from Corporate
Reorganization
25
45
Potential further distributions
TORM’s distribution policy from 2017
• 25 to 50% of Net Income
• Semi-annual distribution
• Dividend and/or share repurchase
• Policy reviewed periodically
* Based on share price as of 12 August and a USD/DKK fx rate of 6.7

12
EBITDA
(USDm)
Profit before
tax (USDm)
Earnings per
Share (USD)
2016 full-year result USD/day 1,000
freight rate change
210 – 250 +/- 12
50 – 90 +/- 12
+/- 24
+/- 24
+/- 0.2
FORECASTED EBITDA IN THE RANGE OF USD 210M TO USD 250M FOR FY2016
With 12,258 unfixed earning days as of 30 June 2016, TORM’s financial result is highly exposed to freight
rate fluctuations.
USD/day 2,000
freight rate change
0.8 – 1.4
Earnings per
Share* (DKK)+/- 1.35.3 – 9.6
* Earning per Share in DKK is calculated assuming an USD/DKK fx rate of 6.7 and 62.2m shares
+/- 0.4
+/- 2.6

13