H1 2017 IFRS Financial Results - Metalloinvest · H1 2017 IFRS Financial Results ... *Hereinafter...
24
Resources create opportunities Resources create opportunities H1 2017 IFRS Financial Results 22 August 2017
Transcript of H1 2017 IFRS Financial Results - Metalloinvest · H1 2017 IFRS Financial Results ... *Hereinafter...

Resources create opportunitiesResources create opportunities
H1 2017 IFRS Financial Results22 August 2017

2
Disclaimer
The following USD/RUB exchange rates were used for the presentation of those financial results:
Average over the period: Q1 2016 – 74.6283; Q2 2016 – 65.8833; Q1 2017 – 58.8442 ; Q2 2017 – 57.1451.
End of the period: H1 2016 – 64.2575; 2016 – 60.6569; H1 2017 –59.0855.
This presentation of Metalloinvest’s financial results for H1 2017 (the “Presentation”) contains certain forward-looking statements, particularly those relating to
anticipated demand and consumption, global economic conditions, commodity prices, management aims and objectives, strategy, production, anticipated investments
and anticipated completion of previously announced transactions. Metalloinvest will not update these statements to reflect events and circumstances occurring after the
date hereof. By their nature, forward-looking statements involve risks and uncertainties because they relate to events and depend on circumstances that will or may occur
in the future. Actual results may differ from those expressed in such statements depending on a variety of factors, including future levels of industry product supply,
demand and pricing, operational problems, general economic conditions, political stability and economic growth in relevant areas of the world, changes in laws and
governmental regulations, exchange rate fluctuations, development and use of new technology, changes in public expectations and other changes in business conditions,
the actions of competitors, natural disasters and adverse weather conditions, wars and acts of terrorism or sabotage, other factors discussed elsewhere in this document,
as well as other risks affecting Metalloinvest and its operations.
The contents of this Presentation do not constitute or form part of any advertisement of securities, any offer or invitation to issue, sell, purchase, exchange or transfer or
any solicitation of any offer to purchase or subscribe for, any securities of Metalloinvest in any jurisdiction, nor shall this Presentation nor any part of it nor the fact of its
presentation, communication or distribution form the basis of, or be relied on in connection with, any contract or investment decision. Any foreign securities which are
mentioned in this Presentation are not and will not be registered in the Russian Federation by any state authority responsible for registration of such securities and such
securities shall not be admitted to subscription nor shall be publicly available in the Russian Federation and cannot be the subject of any offer in the Russian Federation,
except in the cases permitted by the law of the Russian Federation. No representation or warranty, express or implied, is given by Metalloinvest, its affiliates or any of their
respective advisers, officers, employees or agents, as to the accuracy of the information or opinions or for any loss howsoever arising, directly or indirectly, from any use of
these materials or their contents.

3
Content
I. Key Highlights………...….……….………………..…………………………………........................... 4
II. Operational Results..…….....………………………………………………………………………………... 6
III. Financial Results …...…………………………………………………………………........................... 10
IV. Debt & Credit Ratings…………………………………………………….….................................. 14
V. Subsequent Events……………………………………………………………………………………………... 18
4
KEY HIGHLIGHTS

5
Highlights
Key financialsUSD mn H1 2017 H1 2016 Change
Revenue 3,032 1,931 57.0%
Gross profit 1,556 896 73.7%
EBITDA* 1,061 533 99.1%
EBITDA margin 35.0% 27.6% 7.4 p.p.
Net Income 585 428 36.7%
Capex 188 155 21.3%
USD mn, eop 30.06.2017 31.12.2016 Change
Total Debt 4,468 4,183 6.8%
Short-term debt 289 91 х3.2
Cash & equivalents 866 989 (12.4%)
Net Debt 3,602 3,194 12.8%
Net Debt / EBITDA LTM 2.0х 2.5х (0.5x)
Notes:
*Hereinafter EBITDA stands for EBITDA adjusted according to IFRS requirements. For more details please refer
to IFRS Statements
Net Debt / EBITDA LTM is calculated based on EBITDA for the last 12 months; the indicator has
an informational character and does not contain adjustments as per loan documentation
35
55
75
95
Jan 2016 Jul 2016 Jan 2017 Jul 2017
Iron ore index (62% Fe, CFR China)
USD/ t
Source: Bloomberg
52
65
74
Global iron ore prices
1,9312,330
3,032
Revenue
H1 2016 H2 2016 Н1 2017
533725
1,061
EBITDAH1 2016 H2 2016 H1 2017
3.3x2.5x
2.0x
Net Debt/EBITDA LTM

6
OPERATIONAL RESULTS

7
H1 2017 key developments
• Iron ore production decreased by 1.1%*, due to
a change in ore mixture
• Pellet production remained flat y-o-y
• HBI/DRI production grew by 11.9%, mostly due to
hot tests at HBI-3 at LGOK
• Hot metal production fell by 11.9% following
major maintenance works on a blast furnace
at Ural Steel
• Crude steel production rose by 3.6%, mainly
due to an increase in effective orders
Production volumes
20.4
12.3
2.9
1.5
2.3
20.3
12.9
2.8
1.5
2.4
20.2
12.3
3.3
1.3
2.4
Iron ore
Pellets
HBI/DRI
Hot metal
Crude steel
H1 2016 H2 2016 H1 2017
mn t
Notes:
Data on major plants: LGOK, MGOK, OEMK, Ural Steel
Iron ore refers to iron ore concentrate and sintering ore
*Hereinafter comparison with H1 2016

8
1.5 0.6
3.2 4.3
8.2 7.1
H1 2016 H1 2017
Russia Europe Asia MENA Others*
13.8 13.3
0.9 1.2
1.0 0.6
0.6 0.4
0.70.9
H1 2016 H1 2017
3.3 3.2
Shipment structure
Mining Segment
Steel Segment
• Shipments to Russia accounted for 54% of total shipments,
decreasing by 13.6% in real terms, mainly due to the termination of
pellet delivery to NLMK and reallocation of supplies to the export,
as well as intra-group consumption
• Shipments to Europe grew by 32.9% mainly as a result of increased
pellet supplies to the customers in Poland, Serbia and Germany
• Shipments to Asia declined by 61.8% due to a reallocation
of iron ore concentrate volumes to the domestic market
• Shipments to Russia increased by 32.5%, due to a growth in
deliveries of long steel products under long-term contract, among
other factors
• Shipments to other countries increased by 27.9% mainly due to
a growth in pig iron supplies to Nucor Corporation (USA)
• Shipments to MENA and Europe fell by 39.3% and 43.4%,
respectively, due to a reallocation of shipments to other regions
mn t
mn t
Data on major plants: LGOK, MGOK, OEMK, Ural Steel
* Others include shipments to Americas, CIS countries and Africa. Americas’ share in H1 2017 – 82%

9
Key capex development projects implemented in H1 2017
Source: management accounts* Direct reduced iron** Continuous casting machine*** In terms of financing
Enterprise ProjectCapex in H1 2017,
USD mnShare of
completion***
Min
ing
Se
gm
en
tS
tee
l Se
gm
en
t
Construction of HBI-3 Plant63 83%
Complex for LGOK iron ore concentrate storage
10
Modernisation of DRI*-218
Modernisation of CCM** #1
6
47%
35%
44%
10
FINANCIAL RESULTS

11
734
482
110
293
312
1,233
731
91
312
665
Russia
Europe
Asia
MENA
Other
countries*
H1 2016
H1 2017
Revenue composition
H1 2017 Revenue: USD 3,032 mn
USD mn
12%
19%
12%13%
40%
4%
12%
22%
13%11%
39%
3%
Iron ore Pellets
HBI Pig iron
Steel products Other revenue
H1 2017 – outer circleH1 2016 – inner circle
Revenue by region
Export share59% in H1 2017
vs.62% in H1 2016
* Others include Americas and CIS countries

12
412
113
587
188
936
153
Mining Steel
H1 2016 H2 2016 H1 2017
533
1,061
1,101
(441)
(96)
(35)
(1)
EBITDA H1 2016
Revenue
Cost of sales
Distribution expenses
G&A expenses
Other
EBITDA H1 2017
EBITDA y-o-y dynamics
EBITDA composition
H1 2017 EBITDA: USD 1,061 mn
USD mnSupportive market conditions resulted in more than
two-fold increase of the Mining Segment EBITDA,
accounting for 88% of the Company’s total EBITDA
in H1 2017
EBITDA by segment dynamics
35.0%
27.6%
EBITDA margin
USD mn

13
283381533 44
25
1,061
(144)
(20)(155)
(168)
(233)
(60)
(188)(31)
EB
ITD
A
Inte
rest
Taxe
s
Ch
g.
in N
WC
Ca
pe
x
Oth
ers
FCF
EB
ITD
A
Inte
rest
Taxe
s
Ch
g.
in N
WC
Ca
pe
x
Oth
ers
FCF
Positive free cash flow
USD mn
H1 2016 H1 2017

14
DEBT & CREDIT RATINGS

15
H1 2017 key developments
• Feb-Apr: ING BANK increased the limit of the Company’s two-year
committed revolving credit line from USD 100 mn to USD 200 mn
• May: Tender offer of Eurobonds-2020 and issue of USD 800 mn
Eurobonds-2024 with a 4.85% interest rate
• June: Refinancing of USD 1.03 bn PXF* using funds obtained
through a new PXF-2017 with better pricing terms and maturity
schedule
Debt profile as of 30 June 2017
Sources:IFRS data, management accounts
*Pre-export financing
Total Debt: USD 4,468 mn
Breakdown by sourceBreakdown by currency
H1 2017 – outer circle2016 – inner circle
38%
56%
6%
36%
57%
7%
RUB
USD
EUR
31%
24%16%
22%
7% 31%
25%15%
21%
8% PXF
Eurobonds
RUB bonds
Sberbank
Other
2%
98%
6%
94%
Short-term
Long-term

16
0.90.6 0.4
1.1
0.5
0.20.5
0.3 0.6
1.4
0.3
0.6
0.91.0
0.4
1.3
Liquidity H2 2017 2018 2019 2020 2021 2022 After 2022
Liquidity position and repayment schedule
Notes:
Management accounts
* Undrawn committed credit lines
Cash
USD bn
Cash
*
1.3
Debt maturity schedule as of 31 December 2016 (USD 4.2 bn of total debt)
*
RUBUSD, EUR
Debt maturity schedule as of 30 June 2017 (USD 4.5 bn of total debt)USD bn
1.0
0.3 0.4
1.3
0.2
0.5
0.3
0.6
0.3
0.1
0.5
0.9
1.6
0.7
0.2 0.2
Liquidity 2017 2018 2019 2020 2021 2022 After 2022
17
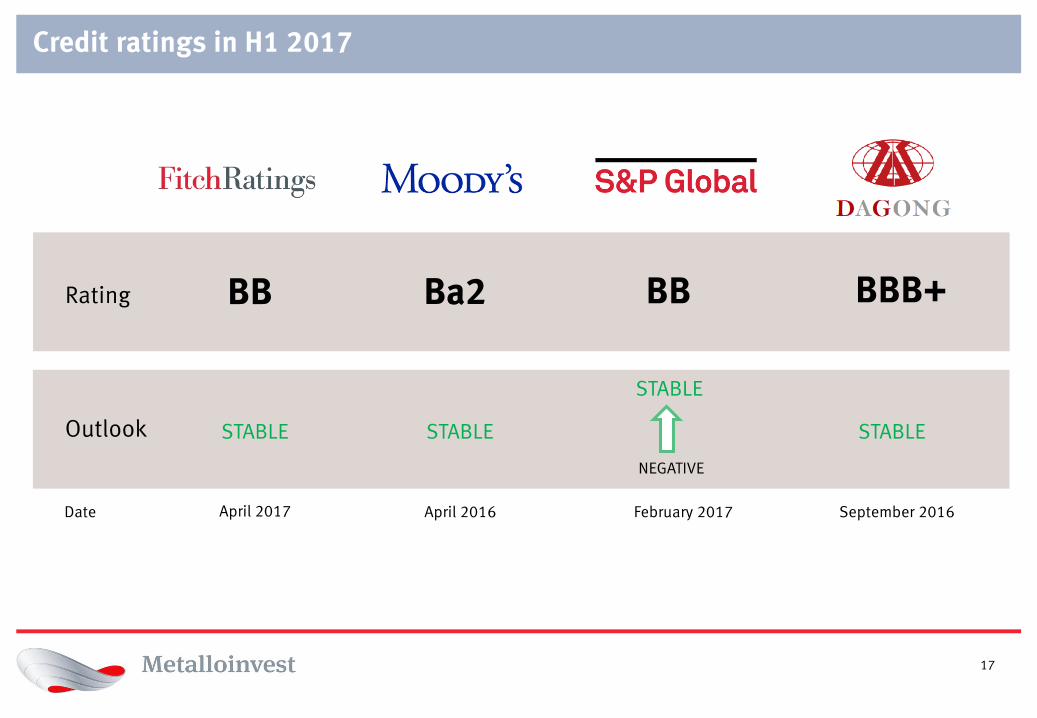
Credit ratings in H1 2017
April 2016 February 2017Date
Rating
STABLESTABLEOutlook
Ba2 BB
STABLE
BBB+
STABLE
September 2016
NEGATIVE
BB
April 2017

18
SUBSEQUENT EVENTS
In July, Metalloinvest launched HBI-3 Plant at LGOK
• Designed capacity of 1.8 mn t HBI per year
• Capex of approximately USD 660 mn
Vladimir Putin has participated in the official launch ceremony of HBI-3 Plant
In August, Metalloinvest announced the signing of supply contracts with the following key Russian
steel companies: EVRAZ, Mechel and Severstal. Deliveries of iron ore concentrate and pellets for a
total amount of 6.8 mn tonnes will be carried out before 30 June 2018

19
SUBSEQUENT EVENTS
July 2017
• Metalloinvest paid a dividend in the total amount of RUB 25.1 bn. The funds from the dividend
were returned in full to the Company for the repayment of existing intragroup loans
• Metalloinvest disposed in full its 1.8% interest in Norilsk Nickel for a total consideration
of USD 400 mn
August 2017
• The Company repaid USD 100 mn of PXF-2016 ahead of the scheduled maturity dates
• Based on the recommendation of Metalloinvest’s Board of Directors, the Company’s
shareholders took the decision to pay a dividend amounting to ~USD 330 mn

20
Q&A SESSION

21
APPENDIX

22
0.44
0.27
0.440.30
2014 2015 2016 H1 2017
Health, Safety & Environment
LTIFR*
Atmospheric emissions**tonnes ‘000
126 124117
59
2014 2015 2016 H1 2017
Health & Safety
Safety is the Company’s top priority
• In H1 2017, LTIFR decreased by 32% vs. 2016
• The Company is committed to a zero fatality rate
Environment
The Company devotes special attention to the environment
• In 2016, Metalloinvest completed reconstruction of thesecond gas purification unit at OEMK. As a result, dust levelsin steelmaking workplaces fell by an average of 50%
• Implementing the best available technologies at HBI-3at LGOK allows the Company to minimise its adverseenvironmental impact
• In 2017, Ural Steel started exploitation of a landfill forindustrial waste with a capacity of 1.2 mn tonnes
Accidents and Fatalities
2620
32
125
03
0
2014 2015 2016 H1 2017
* LTIFR is calculated on the basis of 4 Metalloinvest major plants (LGOK, MGOK, OEMK, Ural Steel ):
(total number of injuries with loss of labour capacity / number of worked man hours) х 1 mn man hours
** Total amount of pollution emission into atmosphere from stationary sources

23
Key financial indicators
USD mn Q2 2017 Q1 2017 Change H1 2017 H1 2016 Change
Revenue 1,512 1,520 (0.5%) 3,032 1,931 57.0%
Gross profit 785 771 1.8% 1,556 896 73.7%
EBITDA 534 527 1.3% 1,061 533 99.1%
EBITDA margin 35.3% 34.7% 0.6 p.p. 35.0% 27.6% 7.4 p.p.
Net Income 194 391 (50.4%) 585 428 36.7%
Capex 126 62 х2.0 188 155 21.3%
Total Debt 4,468 4,303 3.8% 4,468 5,357 (16.6%)
Short-term Debt 289 335 (13.7%) 289 855 (66.2%)
Cash and cash equivalents* 866 869 (0.3%) 866 1,775 (51.2%)
Net Debt 3,602 3,434 4.9% 3,602 3,581 5.9%
Net Debt / EBITDA LTM 2.0x 2.1х (0.1x) 2.0x 3.3х (1.3x)
* Cash & equivalents include short-term bank deposits
24
Investor Relations & Corporate Ratings Department
Contacts
Artem Lavrischev
Director of Investor Relations & Corporate Ratings
T: +7 (495) 981 55 55, ext. 7243
www.metalloinvest.com