Q2 2016 EARNINGS PRESENTATION · Q2 2016 EARNINGS PRESENTATION August 4, 2016. 2 Disclaimer Forward...
25
1 Q2 2016 EARNINGS PRESENTATION August 4, 2016
Transcript of Q2 2016 EARNINGS PRESENTATION · Q2 2016 EARNINGS PRESENTATION August 4, 2016. 2 Disclaimer Forward...

1
Q2 2016 EARNINGS
PRESENTATION
August 4, 2016

2
Disclaimer
Forward Looking Statements
This presentation may contain forward looking statements for the purposes of the safe harborprovision under the Private Securities Litigation Reform Act of 1995. Forward-looking statementsare identified by words such as “expect,” “anticipate,” “may,” “intends,” “believes,” “estimate,”“project,” and other similar expressions.
Such statements involve a number of risks, uncertainties and other factors that could cause actualresults to differ materially from these forward looking statements. These factors include, but arenot limited to, the factors described in OMAM’s filings made with the Securities and ExchangeCommission, including our most recent Annual Report on Form 10-K, filed with the SEC on March15, 2016, under the heading “Risk Factors” and the Company’s Current Report on Form 8-K filedwith the Securities and Exchange Commission on July 20, 2016.
Any forward-looking statements in this presentation are based on assumptions as of today and weundertake no obligation to update these statements as a result of new information or futureevents. We urge you not to place undue reliance on any forward-looking statements.
Non-GAAP Financial Measures
This presentation contains non-GAAP financial measures. Reconciliations of GAAP to non-GAAPmeasures are included in the appendix to this presentation.
3
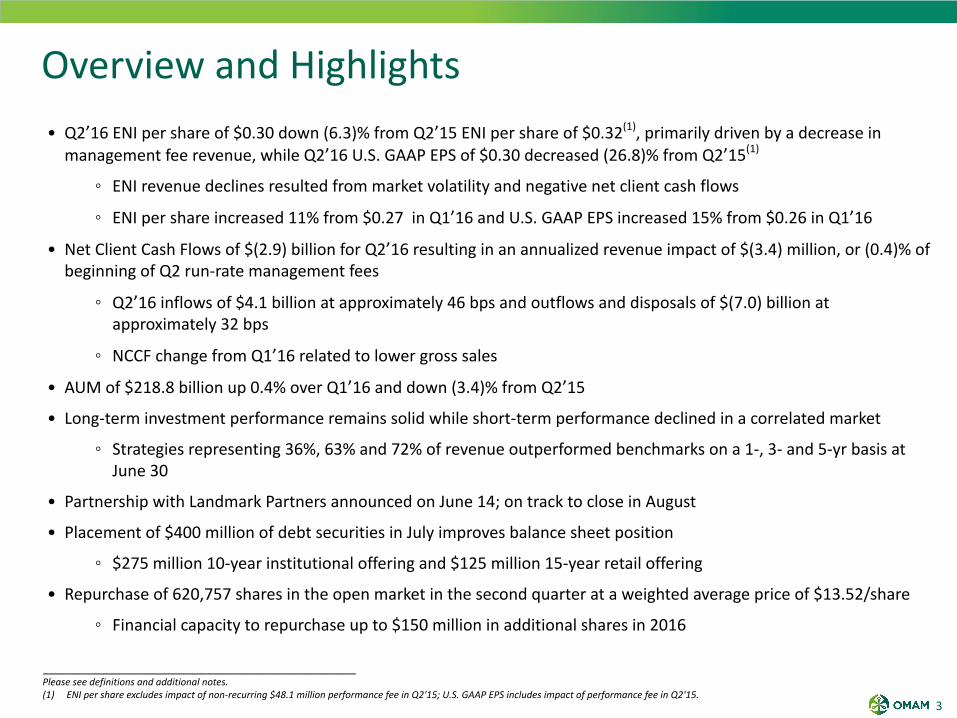
Overview and Highlights• Q2’16 ENI per share of $0.30 down (6.3)% from Q2’15 ENI per share of $0.32(1), primarily driven by a decrease in
management fee revenue, while Q2’16 U.S. GAAP EPS of $0.30 decreased (26.8)% from Q2’15(1)
◦ ENI revenue declines resulted from market volatility and negative net client cash flows
◦ ENI per share increased 11% from $0.27 in Q1’16 and U.S. GAAP EPS increased 15% from $0.26 in Q1’16
• Net Client Cash Flows of $(2.9) billion for Q2’16 resulting in an annualized revenue impact of $(3.4) million, or (0.4)% ofbeginning of Q2 run-rate management fees
◦ Q2’16 inflows of $4.1 billion at approximately 46 bps and outflows and disposals of $(7.0) billion atapproximately 32 bps
◦ NCCF change from Q1’16 related to lower gross sales
• AUM of $218.8 billion up 0.4% over Q1’16 and down (3.4)% from Q2’15
• Long-term investment performance remains solid while short-term performance declined in a correlated market
◦ Strategies representing 36%, 63% and 72% of revenue outperformed benchmarks on a 1-, 3- and 5-yr basis atJune 30
• Partnership with Landmark Partners announced on June 14; on track to close in August
• Placement of $400 million of debt securities in July improves balance sheet position
◦ $275 million 10-year institutional offering and $125 million 15-year retail offering
• Repurchase of 620,757 shares in the open market in the second quarter at a weighted average price of $13.52/share
◦ Financial capacity to repurchase up to $150 million in additional shares in 2016
___________________________________________________________Please see definitions and additional notes.(1) ENI per share excludes impact of non-recurring $48.1 million performance fee in Q2'15; U.S. GAAP EPS includes impact of performance fee in Q2'15.

4
Growth StrategyOMAM's multi-boutique model is well positioned for growth, with four keyareas of focus...
Multi-Boutique Value Proposition DrivesIncremental Growth Opportunities
Four KeyGrowth Areas New
Partnerships
GlobalDistribution
Collaborative Organic Growth(Growth and Seed / Co-Investment Capital)
Core Affiliate Growth(Investment Performance and Net Client Cash Flows)
OMAM's Aligned Partnership Model
- Operating autonomy - Affiliate-level employee ownership
- Long-term perspective - Talent Management
- Profit-sharing model - At-scale Affiliates
Unique Partnership ApproachProvides Stability and theFoundation for Growth

5
• Leading global secondary private equity, real estate,and real asset investment manager
• $15.5 billion of committed capital since inception in1989
◦ $5.3 billion raised in most recent 2013-14fundraising cycle
• 26-year track record; one of the longest in thesecondary industry
◦ Attractive growth and margins
• Differented secondary investing approach generatesstrong long-term results
• Stable, deep, and experienced investment team
◦ Average senior tenure of 17 years
◦ Total of 89 employees
• Diversified, global, institutional client base
• Headquartered in Simsbury, CT with offices in NewYork, Boston and London
• OMAM will acquire 60% of Landmark's equity;remaining 40% retained by management
◦ Long-term management retentionagreements in effect
• Approximately $240 million in cash to be paid atclosing in August 2016
◦ Funded through $400 million in financing inJuly
• Up to an additional $225 million payment based onthe growth of the business through the secondanniversary
• Purchase multiple of 8-10x Economic Net Income(ENI) generated by the Landmark transaction, priorto financing costs
• No performance fee revenue or co-investmentassets acquired
Overview of Landmark Partnership
Landmark Overview Summary of Partnership

6
AUM
AUM by Affiliate $B %Total
$ 70.5 32%
90.2 41%
4.9 2%
4.9 2%
30.3 14%
1.9 1%
16.1 8%
Total $ 218.8 100%
$220
$200
$180
$160
$140
$120
Q2'15 Q2'16
$226.6
$(6.2) $(1.6)
$218.8
OMAM AUM Progression and Mix
AUM Progression (Last 12 Months) AUM Mix (6/30/16)
AUM
AUM by Asset Class $B %Total
US Equity $ 78.6 36%
International Equity 37.8 17%
Alternative, Real Estate & Timber 36.9 17%
Global Equity 30.8 14%
Emerging Markets Equity 20.4 9%
Fixed Income 14.3 7%
Total $ 218.8 100%
AUM Progression (2nd Quarter)
$220
$200
$180
$160
$140
$120
$100
Q1 '16 Q2 '16
$218.0
$(2.9)
$3.7
$218.8
AUM at Period End As % of BoP AUM
Net flowsMarket and
other
% Change: (3.4)%
% Change: 0.4%
1.7% (1.3)%
(2.7)% (0.7)%
___________________________________________________________Please see definitions and additional notes.
Net flowsMarket and
other
$B
$B

7
DerivedAverageWeightedNCCF ($b)(2)
Net Client Cash Flows and Revenue Impact
AUM Net Client Cash Flows (“NCCF”) Revenue Impact of NCCF(1)
$20
$16
$12
$8
$4
$0
-$4
-$8
$11.6
$8.6
$5.8
$16.5
$(3.0)
$18.4$19.1
$20.0
$11.3
$13.5
$0.7
$(6.6)
$7.3
$(3.4)
Q1 Q2 Q3 Q4 Q1 Q2 Q3 Q4 Q1 Q2 Q3 Q4 Q1 Q2
40 35 41 44 40 43 46 44 47 46 46 45 38 46
41 40 38 41 38 36 38 38 30 31 32 37 40 32
2013 2014 2015 2016
$42.5 $54.5 $18.9 $3.9
Bps inflows
Bps outflows
___________________________________________________________(1) Annualized revenue impact of net flows represents the difference between annualized management fees expected to be earned on new accounts and net assets contributed to existing accounts, less the annualized management fees lost on
terminated accounts or net assets withdrawn from existing accounts, including equity-accounted Affiliates. Annualized revenue is calculated by multiplying the annual gross fee rate for the relevant account by the net assets gained in the account inthe event of a positive flow or the net assets lost in the account in the event of an outflow.
(2) Derived Average Weighted NCCF reflects the implied NCCF if annualized revenue impact of net flows represents asset flows at the weighted fee rate for OMAM overall (i.e. 35.0 bps in Q2’16). For example, NCCF annualized revenue impact of $(3.4)million divided by average weighted fee rate of OMAM’s overall AUM of 35.0 bps equals the derived average weighted NCCF of $(1.0) billion.
$4
$2
$0
-$2
-$4
$3.0$3.2
$1.0
$3.3
$(1.0)
$3.6
$3.1
$3.8
$(0.2)
$0.8
$(2.5)
$(3.2)
$2.4
$(2.9)
Q1 Q2 Q3 Q4 Q1 Q2 Q3 Q4 Q1 Q2 Q3 Q4 Q1 Q2
$ 3.4 $2.6 $1.7 $4.9 $(0.9) $5.5 $5.8 $6.1 $3.3 $3.9 $0.2 $(1.9) $2.1 $(1.0)
2013 2014 2015 2016
$10.5 $9.5 $(5.1) $(0.5)
$B $M

8
Hard asset disposals
$5
$4
$3
$2
$1
$0
-$1
-$2
-$3
-$4
-$5Q2 2015 Q3 2015 Q4 2015 Q1 2016 Q2 2016
$(0.9)
$(3.6)
$(1.9)
$0.7
$(2.5)
$0.9$1.3
$(0.6)
$1.8
$0.7
$0.1
$(0.2)
$(0.5)
$(0.4)
$(0.3)
$(0.2)
$(0.9)
$(1.0)
$(1.3)
$(1.0)
$0.9 $0.9
$0.8
$1.6
$0.2
$15
$10
$5
$0
-$5
-$10Q2 2015 Q3 2015 Q4 2015 Q1 2016 Q2 2016
$(0.7)
$(6.4)
$(3.4)
$2.1
$(4.4)
$9.8
$5.6
$(1.1)
$6.2
$3.9
$0.2
$(0.5)
$(1.2)
$(0.7)
$(0.8)
$(1.8)
$(2.9)$(3.9)
$(6.4)
$(3.3)
$6.0
$4.9
$3.0
$6.1
$1.2
Net Client Cash Flows Breakdown
AUM Net Client Cash Flows (“NCCF”) - by Asset Class Revenue Impact of NCCF - by Asset Class
TotalRevenueImpact(2)
$13.5 $0.7 $(6.6) $7.3 $(3.4)
___________________________________________________________(1) Average fee rate represents the average blended fee rate on overall assets for each asset class for the three months ended June 30, 2016.(2) Annualized revenue impact of net flows represents the difference between annualized management fees expected to be earned on new accounts and net assets contributed to existing accounts, less the annualized management fees lost on
terminated accounts or net assets withdrawn from existing accounts, including equity-accounted Affiliates. Annualized revenue is calculated by multiplying the annual gross fee rate for the relevant account by the net assets gained in the account inthe event of a positive flow or the net assets lost in the account in the event of an outflow.
U.S. Equity Global/non-U.S. Equity Fixed Income Alternative, Real Estate & Timberflows
Avg. Fee Rate (bps)(1)
TotalNCCF $0.8 $(2.5) $(3.2) $2.4 $(2.9)
20
25
42
44
$M$B
44

9
Competitive Investment PerformanceProducts representing > 60% of revenue outperforming on a 3- and 5-year basis
Commentary
• OMAM uses revenue-weighted performance as its primary investment metric◦ Ties investment performance to business performance◦ Reflects percent of management fee revenue in products outperforming their benchmarks (1)
• OMAM also uses equal-weighted performance as it considers earlier stage products that may grow to have significant impact• Asset-weighted performance is broadly used across the industry
___________________________________________________________(1) Excludes revenue in products which are not benchmarked; includes management fee revenue from equity-accounted Affiliates in the analysis.(2) Data as of June 30, 2016.(3) Revenue-Weighted: Calculates each strategy’s percentage weight by taking its estimated composite revenue over total composite revenues in each period, then sums the total percentage of strategies outperforming.(4) Equal-Weighted (>$100m): Each strategy over $100m has the same weight, then sums the total percentage of strategies outperforming.(5) Asset-Weighted: Calculates each strategy’s percentage weight by taking its composite AUM over total composite AUM in each period, then sums the total percentage of strategies outperforming.(6) Barrow Hanley’s Windsor II Large Cap Value account AUM and return are separated from Barrow Hanley’s Large Cap Value composite in revenue-weighted, equal-weighted and asset-weighted outperformance percentage calculations.
100%
80%
60%
40%
20%
0%
1-Year 3-Year 5-Year
33%51%
60%
100%
80%
60%
40%
20%
0%
1-Year 3-Year 5-Year
50%
75% 80%
100%
80%
60%
40%
20%
0%
1-Year 3-Year 5-Year
36%
63%72%
Revenue-Weighted (2)(3)(6) Equal-Weighted (>$100m) (2)(4)(6) Asset-Weighted (2)(5)(6)
% outperformance vs. benchmark % outperformance vs. benchmark % outperformance vs. benchmark
Q1'16 46% 68% 77%
Q2'15 70% 74% 89%
Q1'16 63% 82% 84%
Q2'15 64% 81% 88%
Q1'16 53% 66% 65%
Q2'15 61% 61% 80%

10
Financial Highlights – Q2 2016 v. Q2 2015(1)
• Q2’16 economic net income down (4.7)% to $36.2 million ($0.30 per share) from $38.0 million ($0.32 per share) inQ2’15
◦ Lower management and performance fees drive decline
• ENI revenue decrease of $(7.8) million, or (4.6)%, to $160.0 million in Q2’16
◦ Management fees decline (4.7)% to $157.1 million, reflecting a (5.4)% decline in average AUM offset by a0.3 bps increase in average yield to 33.8 bps(2)
◦ Performance fees decline by $(1.3) million(1)
• The sum of ENI operating expense and variable compensation declined (1.9)% to $102.8 million from $104.8million in year ago quarter, driven by lower variable compensation
◦ Operating expenses up 1.1% from year-ago quarter to $61.8 million, reflecting 2015 new hires and annualcost of living increases, offset by favorable foreign currency impact and lower sales-based compensation
◦ Variable compensation down (6.2)% to $41.0 million, representing approximately 42% of earnings beforevariable compensation
• ENI operating margin of 35.8% reduced from 37.5% in year ago quarter
• Adjusted EBITDA of $50.3 million, a (7.5)% reduction from $54.4 million in Q2’15
• Revolving credit facility debt of $50.0 million at June 30 represents 0.2x trailing twelve months Adjusted EBITDA
• Placement of $400 million of bonds in July
◦ $275 million to institutional investors and $125 million to retail investors
___________________________________________________________Please see definitions and additional notes.(1) Excludes impact of non-recurring performance fee in Q2'15.(2) Average AUM and average yield exclude equity-accounted Affiliates.

11
$210
$180
$150
$120
$90
$60
$30
$0
-$30
Q2'15 Q3'15 Q4'15 Q1'16 Q2'16
$167 $163 $161 $153 $161
$166 $160
___________________________________________________________Please see definitions and additional notes.
(1) ENI Revenue consists of management fees, performance fees, and other income, which primarily consists of earnings of our equity-accounted Affiliates.(2) Excludes impact of non-recurring performance fee in Q2'15.(3) Includes fees for equity-accounted Affiliates.(4) ENI Operating Margin is calculated before Affiliate key employee distributions. This is a non-GAAP efficiency measure, calculated based on earnings after variable compensation divided by ENI Revenue.(5) ENI per share is calculated as Economic Net Income divided by total diluted shares outstanding.
Improving Markets and Fee Mix Benefit Q2'16Results
$70
$60
$50
$40
$30
$20
Q2'15 Q3'15 Q4'15 Q1'16 Q2'16
$52 $50$45 $43
$48
$200
$150
$100
$50
Q2'15 Q3'15 Q4'15 Q1'16 Q2'16
$167 $163 $161 $153 $161
$0.50
$0.40
$0.30
$0.20
$0.10
$0.00
Q2'15 Q3'15 Q4'15 Q1'16 Q2'16
$0.32 $0.30 $0.28 $0.27 $0.30
$250
$225
$200
$175
$150
Q2'15 Q3'15 Q4'15 Q1'16 Q2'16
$227$219 $215 $211
$219
Average AUM
Fee Rate (Basis Points)(3)
ENI Revenue(1)(2)
ENI Operating Margin(2)(4) ENI Per Share(2)(5)
Pre-tax ENI(2)
40.0
35.0
30.0
25.0
20.0
Q2'15 Q3'15 Q4'15 Q1'16 Q2'16
34.3 34.5 34.7 34.7 35.0
$0.32 $0.31 $0.30
% Change Q2'15 to Q2'16: (3.5)% % Change Q2'15 to Q2'16:(4.6)%
% Change Q2'15 to Q2'16: (6.3)%
$168 $166
PerformanceFees
$167
$0.27
PerformanceFees
$160
% Change ex. perf. fees: (3.9)%
$52 $51 $49 $48
PerformanceFees% Change Q2'15 to Q2'16:(8.2)%
45%
38%
31%
24%
17%
10%
Q2'15 Q3'15 Q4'15 Q1'16 Q2'16
37% 37% 35% 34% 36%
38% 37% 36% 34%
PerformanceFees
$0.30
% Change ex. perf. fees: (6.9)%
% Change ex. perf. fees: (6.3)%
$m$b $m
$153
$43
36%
$(1)
4%5% 12%
11%

12
Revenue Impact of Decline in Average AssetsPartially Offset by Increase in Fee Rates
______________________________________________________________________________________________________________(1) Figures in parenthesis represent the percent of the total respective bar.(2) Equity-accounted Affiliates’ revenue included in other income.
$220
$165
$110
$55
$0
Q2 2015 Q2 2016
$227.2$219.2
Gross Management Fee Revenue by Asset Class(1)Average AUM and Fee Rate by Asset Class(1)
U.S. Equity Global/non-U.S. Equity Fixed Income Alternative, Real Estate & Timber Avg. Fee Rate (bps)
$BAvg. AUM% Change
5%
(7)%
(2)%
(8)% 24
% Change: (3.5)%
42
22
43
25
42
20
44
Avg. AUM: $ 227.2 $ 219.2
Less: Equity-AccountedAffiliates: $ (29.7) $ (32.4)
Avg. AUM excl. Equity-Accounted Affiliates: $ 197.5 $ 186.8
$200
$150
$100
$50
$0
Q2 2015 Q2 2016
$194.5 $190.5
$M % Change
7%
(13)%
(3)%
(4)%
% Change: (2.1)%
Gross Mgmt. Fee Revenues: $ 194.5 $ 190.5
Less: Revenue from Equity-Accounted Affiliates(2): $ (29.6) $ (33.4)
Revenue excl. Equity-Accounted Affiliates (ENIMgmt. Fee Revenue): $ 164.9 $ 157.1
$86.0 (38%)
$90.8 (40%)
$15.2 (7%)
$35.2 (15%)
$37.0 (17%)
$14.2 (6%)
$88.9 (41%)
$79.1 (36%)
$ 52.2 (27%)
$ 96.1 (49%)
$ 37.9 (20%)
$ 8.3 (4%)
$ 50.0 (26%)
$ 92.8 (49%)
$ 40.5 (21%)
$ 7.2 (4%)
34.3 35.0

13
Q2'16 Q2'15 Q-O-Q H1'16 H1'15 P-O-P
$M $M % of MFs(1) $M % of MFs(1)Q2'16 vs.
Q2'15 $M % of MFs(1) $M % of MFs(1)2016 vs.
2015
Fixed compensation and benefits $ 34.0 21.6% $ 31.4 19.0% 8% $ 69.4 22.6% $ 64.9 20.2% 7%
G&A expenses (excl. sales basedcompensation) 21.1 13.4% 22.8 13.8% (7)% 42.8 14.0% 42.6 13.2% —%
Depreciation and amortization 2.3 1.5% 1.6 1.0% 44% 4.4 1.4% 3.2 1.0% 38%
Core operating expense subtotal $ 57.4 36.5% $ 55.8 33.8% 3% $ 116.6 38.0% $ 110.7 34.4% 5%
Sales based compensation 4.4 2.8% 5.3 3.2% (17)% 9.2 3.0% 9.9 3.1% (7)%
Total ENI operating expenses $ 61.8 39.3% $ 61.1 37.0% 1% $ 125.8 41.0% $ 120.6 37.5% 4%
Note: Management fees $ 157.1 $ 164.9 (5)% $ 306.7 $ 321.8 (5)%
• Total ENI operating expenses reflect Affiliate operating expenses, Center expenses and key initiatives, including Global Distribution(excluding variable compensation)
• Q2’16 ENI Operating Expense Ratio(2) increased to 39.3% for the period primarily due to the decline of management fee revenue in Q2’16
• Expense increase represents annualization of 2015 hires, annual cost of living increases and systems and technology investment, offset byfavorable foreign currency impact and a decrease in sales-based compensation
• Full-year ENI Operating Expense Ratio(2) expected to be in the range of 40-42%(3)
__________________________________________________________(1) Represents management fee revenue.(2) The ENI Operating Expense Ratio reflects total ENI operating expenses as a percent of management fees.(3) Includes impact of Landmark investment assuming August 2016 close.
Expenses Were Stable During Q2 '16 vs. Q2 '15
Commentary
Total ENI Operating Expenses

14
• Variable compensation typically awarded based on contractual percentage (e.g., ~25 – 30%) of each Affiliate’s ENI earnings beforevariable compensation, plus Center bonuses
◦ Affiliate variable compensation includes cash and equity provided through recycling
◦ Center variable compensation includes cash and OMAM equity
• Variable Compensation Ratio increased slightly to approximately 42% compared to prior year period
• Cash variable compensation decreased in line with business profitability, while the current quarter reflects higher 2016 amortizationof recycled Affiliate equity and year-end grants at the Center
• Full-year Variable Compensation Ratio expected to be in the range of 41-42%(1)
___________________________________________________________Please see definitions and additional notes.(1) Includes impact of Landmark investment assuming August 2016 close.(2) Excludes impact of non-recurring performance fee in 2015.(3) Earnings before variable compensation represents ENI revenue less ENI operating expense.
Variable Compensation Reduced In Line with BusinessProfitability
Commentary
Q-O-Q P-O-P$M Q2'16 Q2'15 Q2'16 vs. Q2'15 H1'16 H1'15 2016 vs. 2015
Cash Variable Compensation $ 34.5 $ 37.9 (9)% $ 65.6 $ 76.3 (14)%
Add: Non-cash equity-based award amortization 6.5 5.8 12% 12.8 10.8 19%
Variable compensation 41.0 43.7 (6)% 78.4 87.1 (10)%
Earnings before variable compensation(3) $ 98.2 $ 106.7 (8)% $ 187.1 $ 210.5 (11)%
Variable Compensation Ratio (VC as % of earnings beforevariable comp.) 41.8% 41.0% 80 bps 41.9% 41.4% 53 bps
Variable Compensation(2)

15
Q-O-Q P-O-P
$MQ2'16 Q2'15
Q2'16 vs.Q2'15 H1'16 H1'15
2016 vs.2015
Earnings after variable compensation (ENI operating earnings) $ 57.2 $ 63.0 (9)% $ 108.7 $ 123.4 (12)%
Less: Affiliate key employee distributions (9.2) (10.2) (10)% (17.5) (18.7) (6)%
Earnings after Affiliate key employee distributions $ 48.0 $ 52.8 (9)% $ 91.2 $ 104.7 (13)%
Affiliate Key Employee Distribution Ratio ( / ) 16.1% 16.2% (11) bps 16.1% 15.2% 95 bps
• Represents employees’ share of profit from their respective Affiliates, ranging from 15 - 35%, in some cases following an initialpreference to OMAM(1)
• Q2'16 Key Employee Distributions decreased primarily due to lower ENI operating earnings
• Q2'16 Distribution Ratio of 16.1% consistent with Q2'15 and is in line with full year ratios in 2013-2015
• Full-year Key Employee Distribution Ratio expected to be in the range of 17-18%(2)
__________________________________________________________(1) For consolidated Affiliates.(2) Includes impact of Landmark investment assuming August 2016 close; Landmark employees will continue to own 40% of their business post-closing.(3) Excludes impact of non-recurring performance fee in 2015.
Affiliate Key Employee Distributions Typically WillMove In Line With Affiliate Profitability
Commentary
Affiliate Key Employee Distributions(3)
A
B
B A

16
$MJune 30, 2016
December 31,2015
Assets
Cash and cash equivalents $ 65.1 $ 135.9
Investment advisory fees receivable 142.3 151.8
Investments 217.6 202.6
Other assets 512.3 523.8
Total assets $ 937.3 $ 1,014.1
Liabilities and shareholders' equity
Accounts payable and accrued expenses $ 132.8 $ 179.7
Due to related parties 207.5 222.9
Third party borrowings 50.0 90.0
Other liabilities 360.2 355.6
Total liabilities 750.5 848.2
Total equity 186.8 165.9
Total liabilities and equity $ 937.3 $ 1,014.1
Shares outstanding in the quarter ended:
Basic 119.4 120.0
Diluted 119.8 120.6
Leverage ratio 0.2x 0.4x
Balance Sheet
Balance Sheet Management Provides Multiple Opportunities toIncrease Shareholder Value
• $0.08 per share interim dividend approved, reflecting 25%payout rate◦ Payable September 30 to shareholders of record as of
September 16• Since March 16, 2016, the Company has repurchased a total of
921,740 shares in the open market at a weighted average priceof $13.22/share
◦ Financial capacity remains for potential additional buybackof up to $150.0 million in 2016
• In Q2'16, repaid $35.0 million net on revolving credit facility◦ $50 million currently drawn on OMAM’s $350 million
revolving credit facility ◦ June 30 leverage ratio (Debt / Adjusted EBITDA) of 0.2x well
below 3.0x covenant limit• Issued $400 million of bonds in July 2016
◦ $275 million of 10 year 4.8% bonds to institutional investors◦ $125 million of 15 year 5.125% bonds to retail investors
• In June 2016, agreed to adjust seed capital and DTAarrangements with Old Mutual plc:◦ Seed repurchase of approximately $35 million in Q3'16 and
$100 million at 6/30/17 ◦ DTA purchase at 6/30/17, 12/31/17, and 6/30/18 totaling
approximately $135-145 million
Capital
Dividend & Share Buyback

17
Appendix

18
Exclude non-cash expenses representingchanges in the value of Affiliate equity andprofit interests held by Affiliate keyemployees
i. Exclude non-cash amortization or impairmentexpenses related to acquired goodwill andother intangibles as they represent non-cashcharges that do not result in an outflow oftangible economic benefits from the business
ii. Exclude capital transaction costs including thecosts of raising debt or equity, gains or lossesrealized as a result of redeeming debt orequity and direct incremental costs associatedwith acquisitions of businesses or assets
iii. Exclude results of discontinued operations asthey are not part of the ongoing business, andrestructuring costs incurred in continuingoperations which represent an exit from adistinct product or line of business
iv. Exclude one-off tax benefits or costsunrelated to current operations
Reconciliation: GAAP to ENI and Adjusted EBITDAENI AdjustmentsThree Months Ended Six Months Ended
June 30, June 30,
$m 2016 2015 2016 2015
U.S. GAAP net income $ 36.3 $ 49.4 $ 67.1 $ 83.6
Adjustments to reflect the economic earnings of the Company:
Non-cash key employee-owned equity and profit interestrevaluations(1) (1.1) 6.5 (2.4) 11.3
Amortization and impairment of goodwill and acquiredintangible assets(1) — 0.1 0.1 0.1
Capital transaction costs(1) 1.6 — 1.7 —
Discontinued operations and restructuring costs (1.4) (0.7) (1.6) (0.9)
Total adjustment to reflect earnings of the Company $ (0.9) $ 5.9 $ (2.2) $ 10.5
Less: Tax effect of above adjustments(1) (0.2) (2.7) 0.3 (4.6)
Less: ENI tax normalization 1.0 (3.2) 3.0 (2.8)
Economic net income (including non-recurring performance fee) $ 36.2 $ 49.4 $ 68.2 $ 86.7
Non-recurring performance fee — (11.4) — (11.4)
Economic net income excluding non-recurring performance fee $ 36.2 $ 38.0 $ 68.2 $ 75.3
Net interest expense to third parties 0.1 0.6 0.4 1.5
Depreciation and amortization 2.3 1.6 4.4 3.2
Tax on Economic Net Income 11.7 14.2 22.6 27.9
Adjusted EBITDA excluding non-recurring performance fee $ 50.3 $ 54.4 $ 95.6 $ 107.9
___________________________________________________________(1) Tax-affected items for which adjustments are included in “Tax effect of above adjustments” line; taxed at 40.2% U.S. statutory rate (including state tax).
1
3
2
4
5
12
3
4
5

19
Components of ENI operating expense($ in millions) Three Months Ended June 30, Six Months Ended June 30,
2016 2015 2016 2015
Fixed compensation & benefits $ 34.0 $ 31.4 $ 69.4 $ 64.9
General and administrative expenses 25.5 28.1 52.0 52.5
Depreciation and amortization 2.3 1.6 4.4 3.2
ENI operating expense $ 61.8 $ 61.1 $ 125.8 $ 120.6
Reconciliation: GAAP to ENI and Components of ENIComponents of ENI revenue
($ in millions) Three Months Ended June 30, Six Months Ended June 30,
2016 2015 2016 2015
Management fees(1) $ 157.1 $ 164.9 $ 306.7 $ 321.8
Performance fees(2) (0.8) 0.5 (0.8) 4.1
Other income, including equity-accounted Affiliates(3) 3.7 2.4 7.0 5.2
ENI revenue $ 160.0 $ 167.8 $ 312.9 $ 331.1
U.S. GAAP revenue to ENI revenue
___________________________________________________________(1) ENI management fees correspond to U.S. GAAP management fees.(2) Excludes the impact of non-recurring performance fee in 2015.(3) ENI other income is comprised of other revenue under U.S. GAAP, plus our earnings from equity-accounted Affiliates of $3.5 million and $6.8 million for the three and six months
ended June 30, 2016, respectively, $2.4 million and $5.1 million for the three and six months ended June 30, 2015, respectively.
($ in millions) Three Months Ended June 30, Six Months Ended June 30,
2016 2015 2016 2015
U.S. GAAP revenue $ 156.5 $ 213.5 $ 306.1 $ 374.1Include investment return on equity-accounted
Affiliates 3.5 2.4 6.8 5.1
Exclude the non-recurring performance fee — (48.1) — (48.1)ENI revenue $ 160.0 $ 167.8 $ 312.9 $ 331.1

20
U.S. GAAP compensation expense to ENI fixed compensation and benefits expense($ in millions) Three Months Ended June 30, Six Months Ended June 30,
2016 2015 2016 2015
Total U.S. GAAP compensation expense $ 87.5 $ 126.0 $ 172.1 $ 220.8Non-cash affiliate key employee equity revaluations excludedfrom ENI 1.1 (6.5) 2.4 (11.3)
Sales-based compensation reclassified to ENI general &administrative expenses (4.4) (5.3) (9.2) (9.9)
Affiliate key employee distributions (9.2) (10.2) (17.5) (18.7)
Variable compensation and other adjustments excluded fromfixed compensation(2) (41.0) (72.6) (78.4) (116.0)
ENI fixed compensation and benefits $ 34.0 $ 31.4 $ 69.4 $ 64.9
Reconciliation: GAAP to ENI
($ in millions) Three Months Ended June 30, Six Months Ended June 30,
2016 2015 2016 2015
U.S. GAAP operating expense $ 112.5 $ 150.6 $ 221.1 $ 266.8
Less: items excluded from economic net income
Affiliate key employee equity revaluations 1.1 (6.5) 2.4 (11.3)
Amortization of acquired intangible assets — (0.1) (0.1) (0.1)
Capital transaction costs (1.6) — (1.7) —
Other items excluded from ENI(1) — (0.1) — (0.1)
Less: items segregated out of U.S. GAAP operating expense
Variable compensation and other adjustments(2) (41.0) (72.6) (78.4) (116.0)
Affiliate key employee distributions (9.2) (10.2) (17.5) (18.7)ENI operating expense $ 61.8 $ 61.1 $ 125.8 $ 120.6
U.S. GAAP operating expense to ENI operating expense
___________________________________________________________(1) Other items include expenses (excluding compensation) associated with the non-recurring performance fee in 2015.(2) For the three and six months ended June 30, 2015, $43.7 million and $87.1 million, respectively, of variable compensation expense (of the $72.6 million and $116.0 million above)
is included within economic net income, which excludes the revenue and compensation attributable to the non-recurring performance fee and also includes fixed compensationand benefits associated with the non-recurring performance fee in 2015 of $0.4 million.

21
($ in millions) Three Months Ended June 30, Six Months Ended June 30,
2016 2015 2016 2015
U.S. GAAP operating income $ 44.0 $ 62.9 $ 85.0 $ 107.3
Include investment return on equity-accounted Affiliates 3.5 2.4 6.8 5.1
Exclude the impact of:
Non-recurring performance fee — (48.1) — (48.1)
Affiliate key employee equity revaluations (1.1) 6.5 (2.4) 11.3
Amortization of acquired intangible assets — 0.1 0.1 0.1
Capital transaction costs 1.6 — 1.7 —
Other items excluded from ENI(1) — 0.1 — 0.1
Affiliate key employee distributions 9.2 10.2 17.5 18.7
Variable compensation and other adjustments(2) 41.0 72.6 78.4 116.0
ENI earnings before variable compensation 98.2 106.7 187.1 210.5
Less: ENI variable compensation(3) (41.0) (43.7) (78.4) (87.1)
ENI operating earnings 57.2 63.0 108.7 123.4
Less: ENI Affiliate key employee distributions (9.2) (10.2) (17.5) (18.7)
ENI earnings after Affiliate key employee distributions $ 48.0 $ 52.8 $ 91.2 $ 104.7
_______________________________________________________(1) Other items include expenses (excluding compensation) associated with the non-recurring performance fee in 2015.(2) For the three and six months ended June 30, 2015, $43.7 million and $87.1 million, respectively, of variable compensation expense (of the $72.6 million and $116.0 million above) is included within
economic net income, which excludes the revenue and compensation attributable to the non-recurring performance fee and also includes fixed compensation and benefits associated with the non-recurring performance fee in 2015 of $0.4 million.
(3) Excludes the impact of the non-recurring performance fee in 2015.
Reconciliation: GAAP to ENI
U.S. GAAP operating income to ENI operating earnings and ENI earnings after Affiliate key employee distributions
U.S. GAAP general and administrative expense to ENI general and administrative expense($ in millions) Three Months Ended June 30, Six Months Ended June 30,
2016 2015 2016 2015
U.S. GAAP general and administrative expense $ 22.7 $ 22.9 $ 44.5 $ 42.7
Sales-based compensation 4.4 5.3 9.2 9.9
Capital transaction costs (1.6) — (1.7) —
Other items excluded from ENI(1) — (0.1) — (0.1)
ENI general and administrative expense $ 25.5 $ 28.1 $ 52.0 $ 52.5

22
Calculation of ENI Effective Tax Rate($ in millions) Three Months Ended June 30, Six Months Ended June 30,
2016 2015 2016 2015
Pre-tax economic net income(1) $ 47.9 $ 52.2 $ 90.8 $ 103.2
Intercompany interest expense deductible for U.S. tax purposes (17.7) (17.7) (35.4) (35.2)
Taxable economic net income 30.2 34.5 55.4 68.0Taxes at the U.S. federal and statutory rates(2) (12.2) (13.8) (22.3) (27.3)
Other reconciling tax adjustments 0.5 (0.4) (0.3) (0.6)
Tax on economic net income (11.7) (14.2) (22.6) (27.9)Add back intercompany interest expense previously excluded 17.7 17.7 35.4 35.2
Economic net income $ 36.2 $ 38.0 $ 68.2 $ 75.3
Economic net income effective tax rate(3) 24.4% 27.2% 24.9% 27.0%
_______________________________________________________(1) Pre-tax economic net income is shown before intercompany interest and tax expense.(2) Calculated using a 40.2% tax rate.(3) The economic net income effective tax rate is calculated by dividing the tax on economic net income by pre-tax economic net income.
Calculation of ENI Effective Tax Rate

23
Definitions and Additional NotesReferences to “OMAM” or the “Company” refer to OM Asset Management plc; references to the “Parent” or “Old Mutual” refer to Old Mutual plc. OMAM operates its businessthrough seven boutique asset management firms (the "Affiliates"). OMAM's distribution activities are conducted in various jurisdictions through affiliates companies inaccordance with local regulatory requirements.
The Company uses a non-GAAP performance measure referred to as economic net income (“ENI”) to represent its view of the underlying economic earnings of the business. ENIis used to make resource allocation decisions, determine appropriate levels of investment or dividend payout, manage balance sheet leverage, determine Affiliate variablecompensation and equity distributions, and incentivize management. The Company’s ENI adjustments to U.S. GAAP include both reclassifications of U.S. GAAP revenue andexpense items, as well as adjustments to U.S. GAAP results, primarily to exclude non-cash, non-economic expenses, or to reflect cash benefits not recognized under U.S. GAAP.
The Company re-categorizes certain line items on the income statement to:
• include the Company’s share of earnings from equity-accounted Affiliates within other income, rather than investment income;• treat sales-based compensation as a general and administrative expense, rather than part of fixed compensation and benefits;• identify separately from operating expenses, variable compensation and Affiliate key employee distributions, which represent Affiliate earnings shared with Affiliate
key employees.
The Company also makes the following adjustments to U.S. GAAP results to more closely reflect its economic results by excluding:
i. non-cash expenses representing changes in the value of Affiliate equity and profit interests held by Affiliate key employees. These ownerships interests may incertain circumstances be repurchased by OMAM at a value based on a pre-determined fixed multiple of trailing earnings and as such this value is carried on theCompany’s balance sheet as a liability. Non-cash movements in the value of this liability are treated as compensation expense under U.S. GAAP. However, any equityor profit interests repurchased by OMAM can be used to fund a portion of future variable compensation awards, resulting in savings in cash variable compensationthat offset the negative cash effect of repurchasing the equity.
ii. non-cash amortization or impairment expenses related to acquired goodwill and other intangibles as these are non-cash charges that do not result in an outflow oftangible economic benefits from the business.
iii. capital transaction costs, including the costs of raising debt or equity, gains or losses realized as a result of redeeming debt or equity and direct incremental costsassociated with acquisitions of businesses or assets.
iv. the results of discontinued operations since they are not part of the Company’s ongoing business, and restructuring costs incurred in continuing operations whichrepresent an exit from a distinct product or line of business.
v. deferred tax resulting from changes in tax law and expiration of statutes, adjustments for uncertain tax positions, deferred tax attributable to intangible assets andother unusual items not related to current operating results to reflect ENI tax normalization.
The Company adjusts its income tax expense to reflect any tax impact of its ENI adjustments. Please see Slide 18 for a reconciliation of U.S. GAAP net income to economic netincome.
Adjusted EBITDA Adjusted EBITDA is defined as economic net income before interest, income taxes, depreciation and amortization. The Company notes that its calculation of Adjusted EBITDAmay not be consistent with Adjusted EBITDA as calculated by other companies. The Company believes Adjusted EBITDA is a useful liquidity metric because it indicates theCompany’s ability to make further investments in its business, service debt and meet working capital requirements. Please see Slide 18 for a reconciliation of economic netincome to Adjusted EBITDA.

24
Methodologies for calculating investment performance(1):
Revenue-weighted investment performance measures the percentage of management fee revenue generated by Affiliate strategies which are beating benchmarks. Itcalculates each strategy’s percentage weight by taking its estimated composite revenue over total composite revenues in each period, then sums the total percentage ofrevenue for strategies outperforming. Equal-weighted investment performance measures the percentage of Affiliates’ scale strategies (defined as strategies with greater than $100 million of AUM) beatingbenchmarks. Each outperforming strategy over $100 million has the same weight; the calculation sums the number of strategies outperforming relative to the totalnumber of composites over $100 million. Asset-weighted investment performance measures the percentage of AUM in strategies beating benchmarks. It calculates each strategy’s percentage weight by taking itscomposite AUM over total composite AUM in each period, then sums the total percentage of AUM for strategies outperforming.
ENI Operating EarningsENI operating earnings represents ENI earnings before Affiliate key employee distributions and is calculated as ENI revenue, less ENI operating expense, less ENI variablecompensation. It differs from economic net income because it does not include the effects of Affiliate key employee distributions, net interest expense or income tax expense.
ENI Operating Margin The ENI operating margin, which is calculated before Affiliate key employee distributions, is used by management and is useful to investors to evaluate the overall operatingmargin of the business without regard to our various ownership levels at each of the Affiliates. ENI operating margin is a non-GAAP efficiency measure, calculated based on ENIoperating earnings divided by ENI revenue. The ENI operating margin is most comparable to our U.S. GAAP operating margin.
ENI management fee revenueENI Management fee revenue corresponds to U.S. GAAP management fee revenue. ENI operating expense ratioThe ENI operating expense ratio is used by management and is useful to investors to evaluate the level of operating expense as measured against our recurring management feerevenue. We have provided this ratio since many operating expenses, including fixed compensation & benefits and general and administrative expense, are generally linked to theoverall size of the business. We track this ratio as a key measure of scale economies at OMAM because in our profit sharing economic model, scale benefits both the Affiliateemployees and OMAM shareholders. ENI earnings before variable compensationENI earnings before variable compensation is calculated as ENI revenue, less ENI operating expense.
Definitions and Additional Notes
___________________________________________________________(1) Barrow Hanley’s Windsor II Large Cap Value account AUM and return are separated from Barrow Hanley’s Large Cap Value composite in revenue-weighted, equal-weighted and asset-weighted
outperformance percentage calculations.

25
Definitions and Additional NotesENI variable compensation ratioThe ENI variable compensation ratio is calculated as variable compensation divided by ENI earnings before variable compensation. It is used by management and is useful toinvestors to evaluate consolidated variable compensation as measured against our ENI earnings before variable compensation. Variable compensation is usually awarded based ona contractual percentage of each Affiliate’s ENI earnings before variable compensation and may be paid in the form of cash or non-cash Affiliate equity or profit interests. Centervariable compensation includes cash and OMAM equity. Non-cash variable compensation awards typically vest over several years and are recognized as compensation expenseover that service period. The variable compensation ratio at each Affiliate will typically be between 25% and 30%.
ENI Affiliate key employee distribution ratioThe Affiliate key employee distribution ratio is calculated as Affiliate key employee distributions divided by ENI operating earnings. The ENI Affiliate key employee distribution ratiois used by management and is useful to investors to evaluate Affiliate key employee distributions as measured against our ENI operating earnings. Affiliate key employeedistributions represent the share of Affiliate profits after variable compensation that is attributable to Affiliate key employee equity and profit interests holders, according to theirownership interests. At certain Affiliates, OMUS is entitled to an initial preference over profits after variable compensation, structured such that before a preference threshold isreached, there would be no required key employee distributions, whereas for profits above the threshold the key employee distribution amount would be calculated based on thekey employee ownership percentages, which range from approximately 15% to 35% at our consolidated Affiliates. U.S. GAAP operating marginU.S. GAAP operating margin equals operating income from continuing operations divided by total revenue. Annualized Revenue Impact of Net Flows (“NCCF”)Annualized revenue impact of net flows represents the difference between annualized management fees expected to be earned on new accounts and net assets contributed toexisting accounts, less the annualized management fees lost on terminated accounts or net assets withdrawn from existing accounts, including equity-accounted Affiliates.Annualized revenue is calculated by multiplying the annual gross fee rate for the relevant account by the net assets gained in the account in the event of a positive flow or the netassets lost in the account in the event of an outflow. Hard asset disposalsNet flows include hard asset disposals made by OMAM’s Affiliates. This category is made up of investment-driven asset dispositions made by Heitman, a real estate manager, orCampbell, a timber manager.
Derived average weighted NCCFDerived average weighted NCCF reflects the implied NCCF if annualized revenue impact of net flows represents asset flows at the weighted fee rate for OMAM overall (i.e. 35.0 bpsin Q2 ‘16). For example, NCCF annualized revenue impact of $(3.4) million divided by the average weighted fee rate of OMAM’s overall AUM of 35.0 bps equals the derived averageweighted NCCF of $(1.0) billion.
n/m“Not meaningful.”