Q12 Technical and Regulatory Considerations for ... · 3 The examples provided below are intended...
21
Q12 Technical and Regulatory Considerations for Pharmaceutical Product Lifecycle Management Annex This draft guidance, when finalized, will represent the current thinking of the Food and Drug Administration (FDA or Agency) on this topic. It does not establish any rights for any person and is not binding on FDA or the public. You can use an alternative approach if it satisfies the requirements of the applicable statutes and regulations. To discuss an alternative approach, contact the FDA staff responsible for this guidance as listed on the title page. For questions regarding this draft document contact (CDER) Mahesh Ramanadham 301- 796-3272 or (CBER) Ingrid Markovic 240-402-8115.
Transcript of Q12 Technical and Regulatory Considerations for ... · 3 The examples provided below are intended...

Q12 Technical and Regulatory Considerations for Pharmaceutical
Product Lifecycle Management
Annex This draft guidance, when finalized, will represent the current thinking of the Food and Drug Administration (FDA or Agency) on this topic. It does not establish any rights for any person and is not binding on FDA or the public. You can use an alternative approach if it satisfies the requirements of the applicable statutes and regulations. To discuss an alternative approach, contact the FDA staff responsible for this guidance as listed on the title page.
For questions regarding this draft document contact (CDER) Mahesh Ramanadham 301-796-3272 or (CBER) Ingrid Markovic 240-402-8115.

INTERNATIONAL COUNCIL FOR HARMONISATION OF TECHNICAL REQUIREMENTS FOR PHARMACEUTICALS FOR HUMAN USE
ICH HARMONISED GUIDELINE
Technical and Regulatory Considerations for Pharmaceutical
Product Lifecycle Management Annex
Q12
Draft version
Endorsed on 16 November 2017
Currently under public consultation
At Step 2 of the ICH Process, a consensus draft text or guideline, agreed by the appropriate ICH Expert Working Group, is transmitted by the ICH Assembly to the regulatory authorities of the ICH regions for internal and external consultation, according to national or regional procedures.

TABLE OF CONTENTS
ANNEX I: ECs – ILLUSTRATIVE EXAMPLES ................................................................. 1 Annex I A: Chemical Product ...................................................................................... 2 Annex I B: Biological Product ..................................................................................... 5
ANNEX II: PACMP – ILLUSTRATIVE EXAMPLES ......................................................... 9 Annex II A: PACMP Example 1 .................................................................................. 9 Annex II B: PACMP Example 2 ................................................................................ 12
ANNEX III: PRODUCT LIFECYCLE MANAGEMENT DOCUMENT – ILLUSTRATIVE EXAMPLE .................................................................................... 15

1
ANNEX I: ECs – ILLUSTRATIVE EXA/MPLES1 1
Identification of Established Conditions for the Manufacturing Process 2
The examples provided below are intended for illustrative purposes and only suggest how 3 the ECs concept could be applied using the development approaches described in ICH Q12 4 Guideline Chapter 3.2.3.1. 5
The examples describe the relevant reporting categories for changes to the ranges of the 6 manufacturing process parameters, controls or equipment referenced in the tables. 7
This demonstrates that increased knowledge and understanding (e.g., enhanced 8 development approaches) lead to reduction of uncertainty and improved management of 9 risk. As a result, ECs could become less extensive and reporting categories more flexible. 10
For example: 11
- Enhanced knowledge may lead to a reduction in uncertainty demonstrating that an 12 initially determined CPP does not have a direct impact on a CQA. Therefore, it 13 could be classified as either a KPP (impact on process consistency) or a process 14 parameter (PP). 15
- Risk management activities could lead to downgraded reporting categories e.g., 16 change to CPP could be downgraded from prior approval to notification. 17
- Where the performance-based approach is used, some process parameters may not 18 be classified as ECs due to assurance of quality being provided by online 19 monitoring. In this circumstance the typical operating conditions for process 20 parameters is provided as supportive information. During manufacture, the process 21 parameters may be adjusted to deliver the expected outcome. The risks related to 22 the inline PAT (Process Analytical Technology) tests, e.g., NIR, should be 23 appropriately managed throughout the lifecycle. The inline PAT tests are 24 considered ECs. 25
For the parameter-based approach where there is limited process understanding, if specific 26 ECs were not proposed by the MAH then regional regulations would be followed for 27 managing post-approval changes. This is illustrated in the examples for comparative 28 purposes. 29
A holistic view of the manufacturing process and overall control strategy is necessary when 30 considering ECs, as the output of one unit operation is the input for a subsequent operation. 31
32
1 This Annex document is intended to be considered in conjunction with the ICH Q12 Core Guideline
being simultaneously published for comment.

2
Change Reporting Categories: 33
Prior Approval (PA) – PAS, Type II, PCA, etc. 34
Notification Moderate (NM) – CBE 30, Type IB, MCN, etc. 35
Notification Low (NL) –AR, Type IA, MCN etc. 36
Not Reported (NR) 37
Annex I A: Chemical Product 38
Process Flow 39
40
41
42
Roller Compaction
Components Process Step
Powder Blending - API - Excipient #1 - Excipient #2 - Excipient #3
Subsequent Steps

3
Powder Blending Unit Operation
Parameter
Acceptable ranges and reporting categories (White boxes are ECs, and grey ones are not ECs.)
Comments/Justification Refer to section 3.2.P.2. for detailed justification and experimental data
Parameter Based Approach
Enhanced Approach
Performance Based Approach
Inpu
t Mat
eria
ls
API PSD
20-50um (PA)
5-200um (NM)
5-200um (NM)
API moisture and Pharmacopeial specifications for excipients 1-3 are ECs in all cases. Excipient specifications managed in line with the Pharmacopoeia. Equipment type is an EC in all cases. Enhanced Approach API Moisture has limited impact on quality demonstrated within the ranges explored. Particle size distribution (PSD) of API demonstrated no impact on dissolution or absorption. DoE studies showed no significant impact on blend uniformity for 5-200um PSD of API. This allows reduction in reporting type for API moisture or PSD. Understanding of variability of blending on product performance allows reduction in reporting type. Knowledge of the impact of scale on blending may allow downgrading of the reporting category (See 3.2.P.2). Homogeneity (blend uniformity <5% RSD) is required for assurance of quality in the next manufacturing step. Experimental studies identified the range of blend speeds and times utilised without significant impact on blend uniformity as confirmed by successful process demonstration. Blending parameters being defined as ECs means homogeneity is not routinely measured but confirmed by end-product testing. Performance Based Approach Using a performance-based approach (online NIR analyser) in the control strategy allows homogeneity confirmation in real-time. Use of the NIR analyser with feedback to blending operating parameters minimises the need to rely on blend speed and time to ensure process control. Therefore, these parameters are not ECs. The NIR method and blend homogeneity specification are ECs. Enhanced understanding of blending and output measurement allows for a wider range of manufacturing scale. Typical operating conditions for blend speed and time described in Module 3.2 is supportive information and monitored to assure performance.
API Moisture
<1.0% (NM)
<1.0% (NL)
<1.0% (NL)
Excipients #1-3 Specification
Pharmacopeial
Pharmacopeial
Pharmacopeial
Equ
ipm
ent a
nd P
aram
eter
s
Equipment type Diffusion blender (V-blender) (PA)
Diffusion blender (V-blender) (NM)
Diffusion blender (V-blender) (NM)
Scale >10x
200kg (NM)
200kg (NL)
200-600kg (NL)
Blend Speed
20rpm CPP (NM)
10-20rpm KPP (NL)
15 rpm (NR)
Blend Time 20 minutes CPP (NM)
15-25 minutes KPP (NL)
20 minutes (NR)
Out
put P
erfo
rman
ce
Mea
sure
Homogeneity method
Not Tested Not Tested NIR online analyser (PA)
Homogeneity Not Tested Not Tested <5% RSD IPC (NM)

4
Roller Compaction Unit Operation:
Parameter
Acceptable ranges and reporting categories (White boxes are ECs, and grey ones are not ECs.) Comments/Justification
Refer to section 3.2.P.2. for detailed justification and experimental data Parameter Based Approach Enhanced Approach
Performance Based Approach
Inpu
t M
ater
ials Powder Blend from blending
operation from blending operation
from blending operation
Enhanced Approach Understanding of the inter-relationship between roll force/gap and roll speed allows for consistent process operation in achieving a target ribbon density. This provides the optimal input for the subsequent milling operation. Following milling, granules with the desired particle size distribution, flow and compressibility characteristics are generated. These quality attributes verified following the milling operation minimise the need for output performance measurements in the roller compaction operation. Expanded knowledge from experimental studies allows definition of operating ranges and lower reporting categories to be proposed. Performance Based Approach Using a performance based approach (online NIR analyser) in the control strategy allows ribbon density to be confirmed in real-time. This allows more flexibility in the type of roller compactor equipment and operating conditions. These output measurements ensure process performance and acceptable ribbon quality attributes. Online measurement of a defined ribbon density with feedback to roller compactor operating parameters reduces variability and ensures lot to lot uniformity of granules for compression. Typical operating conditions are described in Module 3.2 as supportive information and monitored to assure performance.
Equ
ipm
ent a
nd P
aram
eter
s
Equipment type Roller compactor with 10cm rolls (PA)
Roller compactor with 10cm rolls (NM)
Roller compactor with 10cm rolls (NL)
Roll gap 3mm CPP (NM)
2-4mm KPP (NL)
3 mm (NR)
Roller compaction force
8kNcm-1 CPP (NM)
5-10kNcm-1 KPP (NL)
7.5kNcm-1 (NR)
Roller Speed 8rpm CPP (NM)
4-10rpm KPP (NL)
7rpm (NR)
Out
put p
erfo
rman
ce
mea
sure
Ribbon Density Method
Not Tested Not Tested NIR online analyser (PA)
Ribbon density (solid fraction)
Not Tested Not Tested 0.7-0.9 gcm-3 IPC (PA)

5
Annex I B: Biological Product
EXAMPLE FOR BIOLOGICAL PRODUCT
FLOW DIAGRAM The following monoclonal antibody example illustrates how, in a future state, established conditions could be defined differently in terms of acceptable ranges, extent of parameters included in ECs, and reported depending on their related risk and development approaches. This example will focus on 4 steps: seed train, production culture, low pH and anion-exchange chromatography.
WORKING CELL BANK
↓
Seed train
↓
N-1 bioreactor
↓
Production Cultures
↓
Harvest
↓
Affinity Chromatography
↓
Low pH (viral inactivation)
↓
Cation Exchange Chromatography
↓
Anion-Exchange Chromatography
↓
Viral filtration
↓
Ultrafiltration
↓
Diafiltration
↓
DRUG SUBSTANCE

6
Uni
t op
erat
ion
Input/Output
Acceptable ranges and reporting categories
(White boxes are ECs, and grey ones are not ECs.) Comments
Parameter Based Approach
Enhanced Approach Performance
Based Approach
Seed
trai
n
inpu
t
Viable cell density at thaw
≥1.0 x10⁶ cells/mL
KPP (NL)
≥1.0 x10⁶ cells/mL
KPP (NL)
≥1.0 x10⁶ cells/mL
PP
Parameter Based Approach:
The impact of inputs on outputs were not studied. Minimal value is needed to ensure proper seeding of subsequent bioreactors. Viable cell density, pH, duration and input X are considered KPP as they are important to ensure process consistency as it relates to product quality.
Viable cell density is tested as output; lower reporting (NL) is proposed.
Enhanced Approach :
Interaction of inputs on outputs were studied through multivariate analyses. No product is produced at this step, and thus the direct impact of PP on CQA cannot be studied for this step (i.e., no CPP identified).
Interaction studies shows that a viable cell density at thaw, pH and input X needs to be controlled within tight ranges to ensure proper output (classified as KPP). Duration does not require tight control.
Based on the process understanding, outputs of this step are not considered EC, but are internally monitored.
Performance Based Approach:
In addition to the study performed for enhanced approach parameer based:
- Outputs of this step were linked to subsequent steps,
- Inline tests are used to control outputs in a real time manner; inline test equipment is considered EC (PA).
pH 6.5 − 7.5
KPP (NM)
6.5 − 7.5
KPP (NM)
6.5 − 7.5
PP
Duration 20 - 28 hours
KPP (NM)
12 - 48 hours
PP (Monitored)
12 - 48 hours
PP
Input X ###
KPP (NM)
###
KPP (NM)
###
PP
outp
ut
Cell viability ≥ 70%
IPC (NM)
≥ 70%
(Monitored)
≥ 70%
IPC inline automatic
counting (NM)
Cell density ≥ 5 x10⁶ cells/mL
IPC (NM)
≥ 5 x10⁶ cells/mL
(Monitored)
≥ 5 x10⁶ cells/mL
IPC at-line NIR (NM)
Output Y ###
IPC (NM)
###
(Monitored)
###
IPC (NM)
7
Uni
t op
erat
ion
Input/Output
Acceptable ranges and reporting categories
(White boxes are ECs, and grey ones are not ECs.) Comments
Parameter Based Approach
Enhanced Approach Performance
Based Approach
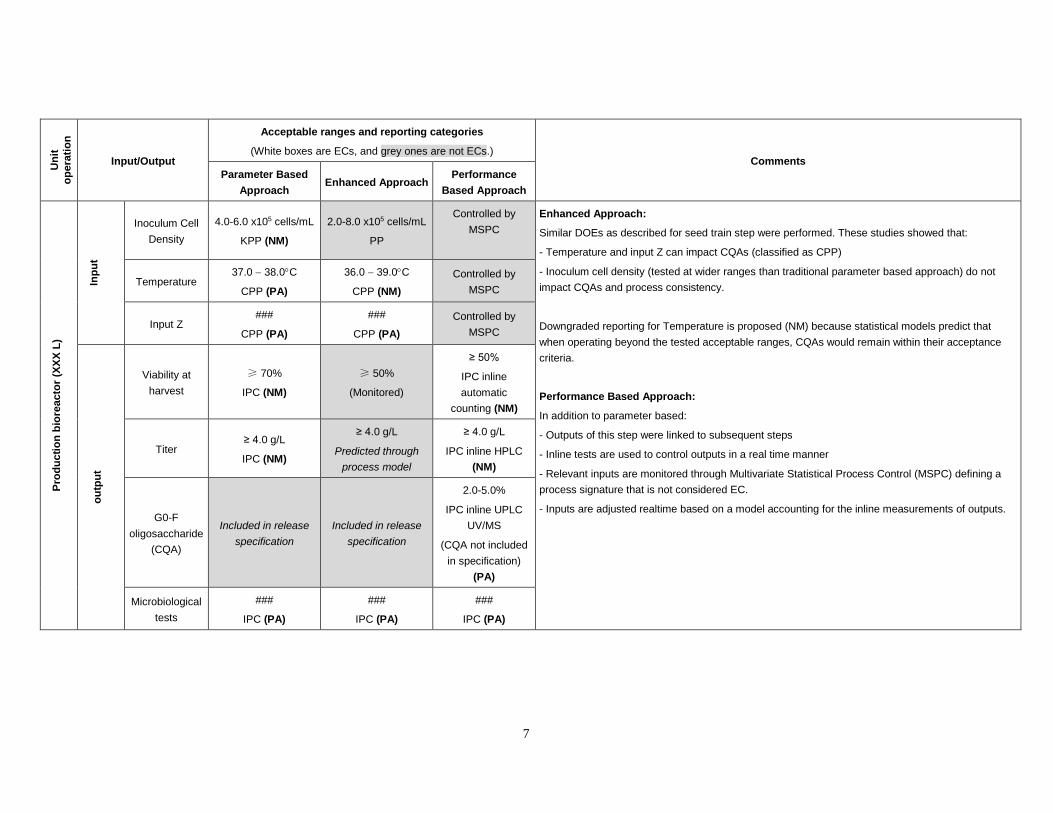
Prod
uctio
n bi
orea
ctor
(XXX
L)
Inpu
t
Inoculum Cell Density
4.0-6.0 x10⁵ cells/mL
KPP (NM)
2.0-8.0 x10⁵ cells/mL
PP
Controlled by MSPC
Enhanced Approach:
Similar DOEs as described for seed train step were performed. These studies showed that:
- Temperature and input Z can impact CQAs (classified as CPP)
- Inoculum cell density (tested at wider ranges than traditional parameter based approach) do not impact CQAs and process consistency.
Downgraded reporting for Temperature is proposed (NM) because statistical models predict that when operating beyond the tested acceptable ranges, CQAs would remain within their acceptance criteria.
Performance Based Approach:
In addition to parameter based:
- Outputs of this step were linked to subsequent steps
- Inline tests are used to control outputs in a real time manner
- Relevant inputs are monitored through Multivariate Statistical Process Control (MSPC) defining a process signature that is not considered EC.
- Inputs are adjusted realtime based on a model accounting for the inline measurements of outputs.
Temperature 37.0 − 38.0°C
CPP (PA)
36.0 − 39.0°C
CPP (NM) Controlled by
MSPC
Input Z ###
CPP (PA)
###
CPP (PA) Controlled by
MSPC
outp
ut
Viability at harvest
≥ 70%
IPC (NM)
≥ 50%
(Monitored)
≥ 50%
IPC inline automatic
counting (NM)
Titer ≥ 4.0 g/L
IPC (NM)
≥ 4.0 g/L
Predicted through process model
≥ 4.0 g/L
IPC inline HPLC (NM)
G0-F oligosaccharide
(CQA)
Included in release specification
Included in release specification
2.0-5.0%
IPC inline UPLC UV/MS
(CQA not included in specification)
(PA)
Microbiological tests
###
IPC (PA)
###
IPC (PA)
###
IPC (PA)

8
Uni
t op
erat
ion
Input/Output
Acceptable ranges and reporting categories
(White boxes are ECs, and grey ones are not ECs.) Comments
Parameter Based Approach
Enhanced Approach Performance Based
Approach
Low
pH
Inpu
t
Operating temperature
18°C − 23°C
CPP (PA)
15°C − 25°C
CPP (PA)
15°C − 25°C
CPP (PA)
Performance based approach is not applicable due to intrinsic viral safety risk (i.e., meaningful output cannot be tested); Such situation should follow parameter based or enhanced approach.
pH 2.0 – 4.0
CPP (PA)
2.0 – 4.0
CPP (PA)
2.0 – 4.0
CPP (PA)
Incubation time 120 -240 min
CPP (PA)
120 -360 min
CPP (PA)
120 -360 min
CPP (PA)
Ani
on-E
xcha
nge
Chr
omat
ogra
phy
Inpu
t
Feedstock Conductivity
6.0 − 8.0 mS/cm
CPP (PA)
6.0 − 8.0 mS/cm
CPP (PA)
6.0 − 8.0 mS/cm
PP
Enhanced Approach:
- Scale down studies demonstrate that feedstocks conductivity, pH, resin age and input XX can impact CQA and are considered CPP.
- Ongoing validation protocol includes time points beyond the claim of 100 cycles up to 3 years for the resin age. A downgraded reporting (NL) is proposed to extend the maximum number of cycle / lifetime in accordance to validation protocol.
Performance Based Approach:
In addition to parameter based:
- Outputs of this step were linked to subsequent steps
- Inline tests are used to control outputs in a real time manner
- Inputs are adjusted realtime based on a model accounting for the inline measurements of outputs.
Feedstock pH 4.8 – 5.2
CPP (PA)
4.5-5.5
CPP (PA)
4.0-6.0
PP
Resin age ≤ 20 cycles, ≤ 3 yrs
CPP (PA)
≤ 100 cycles, ≤ 3 yrs
CPP (NL)
≤ 100 cycles, ≤ 3 yrs
PP
Input XX ###
CPP (PA) ###
CPP (PA) XX PP
outp
ut
Bioburden ≤ 10 CFU/10 mL IPC (PA)
≤ 10 CFU/10 mL IPC (PA)
≤ 10 CFU/10 mL IPC (PA)
Endotoxin ≤ 5 EU/mL IPC (NM)
≤ 5 EU/mL Monitored
≤ 5 EU/mL Monitored
HCP
(CQA)
Tested in DS specification
Predicted through process model
≤ 100 ppm
IPC inline UPLC UV/MS (PA)
CQA XXX Tested in DS specification
Predicted through process model
Inline IPC (PA)

9
ANNEX II: PACMP- ILLUSTRATIVE EXAMPLES 43
The examples provided below are intended to illustrate the range of PACMPs that are 44 possible for a given type of change. They are not intended to serve as a binding template 45 and other approaches may also be acceptable. The first example below outlines a protocol 46 for a single change (a manufacturing site change) to a single product. The second example 47 outlines a protocol for multiple changes (multiple manufacturing site changes) that could 48 be implemented for multiple products. These examples are not intended to suggest that the 49 only type of change appropriate for inclusion in a PACMP is a manufacturing site change. 50 As described in ICH Q12 Guideline Chapter 4, in order to meet expectations regarding 51 continuous improvement of the product and process, many other quality-related changes 52 may be suitable for inclusion in a PACMP. 53
Annex II A: PACMP Example 1 54
Alternative manufacturing site for a small molecule drug substance 55
Outline for Step 1 Submission 56
1. Introduction and Scope 57
This PACMP is intended to allow for the addition of an alternative manufacturing site for 58 the manufacture, testing, and release of the drug substance for a small molecule solid oral 59 drug product. 60
Based on the risk management activities described below, the implementation of this 61 change in Step 2 is proposed to be reported in a submission type that is a lower category 62 than currently provided for in existing regulations or guidance, or a submission type 63 eligible for accelerated review timelines, depending on regional requirements. 64
2. Quality Risk Management (QRM) Activities 65
QRM is conducted for the proposed alternative site and includes: 66
o Identification and assessment of the potential risks associated with the 67 proposed change, as well as the activities proposed to mitigate each risk; 68
o Accounting for known elements of the process, such as robustness, existing 69 controls, and potential impact on product quality; and 70
o Incorporating prior knowledge gained from development and commercial 71 manufacturing experience. 72
3. Acceptance criteria 73
Based on the risk assessment, the following acceptance criteria should be met: 74
• In a comparative batch analysis, three consecutive batches of drug substance 75 manufactured at the alternative manufacturing site should meet approved 76 specification to demonstrate equivalence to batches manufactured at the currently 77 approved site. 78

10
Other conditions to be met prior to implementation: 79
• Stability studies will be initiated immediately on a suitable number of commercial 80 scale batches of drug substance manufactured at the alternate manufacturing site 81 and drug product manufactured with drug substance produced at the alternate 82 manufacturing site. Stability data are to be reported to the regulatory authority 83 subsequent to implementation of the new site according to regional requirements. 84
• Alternative manufacturing site to have acceptable compliance status for small 85 molecule drug substance manufacturing; depending on the region, this may be 86 indicated by the last GMP inspection with acceptable outcome, through a valid 87 GMP certificate, or other appropriate documentation (e.g., Qualified Person 88 declaration). 89
• Alternative manufacturing site to use similar manufacturing equipment or 90 equipment with the same type of material of construction. 91
• Technology transfer and process qualification to be completed. 92 • No change to synthetic route, control strategy, impurity profile, or physicochemical 93
properties. 94 • No change to any specification or analytical method for starting material or 95
intermediates. 96 • No change in analytical methods or specification for release and stability testing for 97
drug substance manufactured at the alternative site. 98 • Any additional regional requirements. 99
100

11
Summary of Step 1 and Step 2 Submissions 101
PACMP Component
PACMP Step 1 Contents (registration/approval of protocol)
PACMP Step 2 Contents (change implementation)
Overall Strategy (Scope and Limitations of proposed change)
Defined scope and limitations Demonstrate requirements of scope are met
QRM Description of QRM activities and summary of risk assessment
Confirmation that previously conducted risk assessment has not changed; or, if new information is available that impacts the risk assessment, an updated risk assessment is provided
Acceptance criteria Tests and studies to be performed; description of any other criteria to be met, including plans to report outcomes from ongoing stability testing
Data demonstrating that acceptance criteria are met; confirmation that other criteria are met. Updated CTD sections for S.2.1 Manufacturer(s) of Drug Substance and S.4.4 Batch Analyses for Drug Substance.
102

12
Annex II B: PACMP Example 2 103
Manufacturing Site Transfers of Biotech Drug Substances 104
Proposed Outline for Step 1 Submission 105
1. Introduction and Scope 106
The primary objective of this expanded PACMP is to support the mobility across biologic 107 drug substance manufacturing sites, i.e., the transfer of one or multiple products from one 108 donor site to one or more recipient site(s), including CMOs (sites already licensed with 109 appropriate inspection record), thereby reducing the number of regulatory submissions of 110 similar content and driving consistency. The expanded PACMP effectively leverages 111 concepts of Quality Risk Management and ICH Q9. Typical process adaptations linked to 112 scale and equipment differences at the donor and recipient site(s) are in scope of the 113 protocol (e.g., change in raw material sourcing) whereas the scope excludes opportunistic 114 significant process changes (e.g., changes to increase productivity/yield). 115
2. Quality Risk Management (QRM) 116
QRM is performed for each individual site transfer, and includes: 117
• Identification, scoring, and documentation of the potential hazard and harm 118 associated with each manufacturing unit operation and process change, as well as 119 the prevention and detection controls 120
• Accounting for known elements of the process, such as robustness, existing 121 controls, and potential impact on product quality 122
3. Comparability/Acceptance Criteria 123
The overall comparability plan in line with ICH Q5E comprises the following elements: 124
• The drug substance meets all release and in-process specifications, as well as 125 comparability acceptance criteria (e.g., tolerance intervals [TI, 95/99]) derived 126 from the entire manufacturing history. 127
• Analytical profiles from selected characterisation tests of post-change material are 128 consistent with pre-change material in side-by-side comparison. 129
• Process performance attributes, e.g., cell culture performance, purification process 130 yields, and impurities levels, are comparable between donor and recipient site. 131
• Planned process validation at the recipient site. 132
• Drug Substance degradation studies consistent with pre-change material. 133
134

13
4. Site-specific Considerations 135
a) Site Risk 136
A risk assessment for the receiving site will be conducted by the MAH at the time of 137 implementation. The risk assessment includes the GMP compliance status and should also 138 include factors such as facility experience, process knowledge, and any additional regional 139 assessments such as QP declaration. The outcome of the risk assessment will indicate to 140 the MAH whether a site inspection by the competent regulatory authority may be needed 141 and whether additional data to support the change should be generated (e.g., site-specific 142 stability data). 143
b) Process Validation 144
An overview of the process validation project plan and validation master plan for the site 145 transfer in accordance to the current PQS system should be provided (at step 1). A summary 146 of validation studies performed to support the site transfers, e.g., studies adopted from 147 donor site and new studies at the recipient site are part of the step 2 implementation 148 submission. 149
The number of proposed validation batches should be based on the variability of the 150 process, the complexity of the process/product, process knowledge gained during 151 development, supportive data at commercial scale during the technology transfer and the 152 overall experience of the MAH. 153
c) Stability 154
Stability studies are traditionally rate-limiting to site transfer timelines; following 155 successful demonstration of comparability by analytical characterisation methods, 156 including accelerated and/or stress stability studies (see ICH Q12 Guideline Chapter 8.2.), 157 can leverage tiered regulatory submission reporting categories and commitments. 158
159

14
Summary Expanded PACMP Step 1 submission and proposed outline for Step 2 160 submission 161
Component Step 1 contents (registration of protocol)
Step 2 contents (change implementation)
Overall Strategy (Scope and Limitations)
Defined scope and limitations
Demonstrate requirements of scope met, including process changes associated with transfer
QRM Description of QRM program and approach to site transfer risk assessment
Documented risk control strategy and executed risk management report summary
Comparability & Stability
Comparability plan, real-time stability commitments and acceptance criteria (product-specific)
Data demonstrating that acceptance criteria are met
Process Validation
Overview of validation program
Summary of facility/equipment differences and applicable validation; validation summary data support the process, facility/equipment, and method transfer
Site risk Description of site inspection risk assessment
Outcome of site inspection risk assessment defines actual change submission requirements
162
15
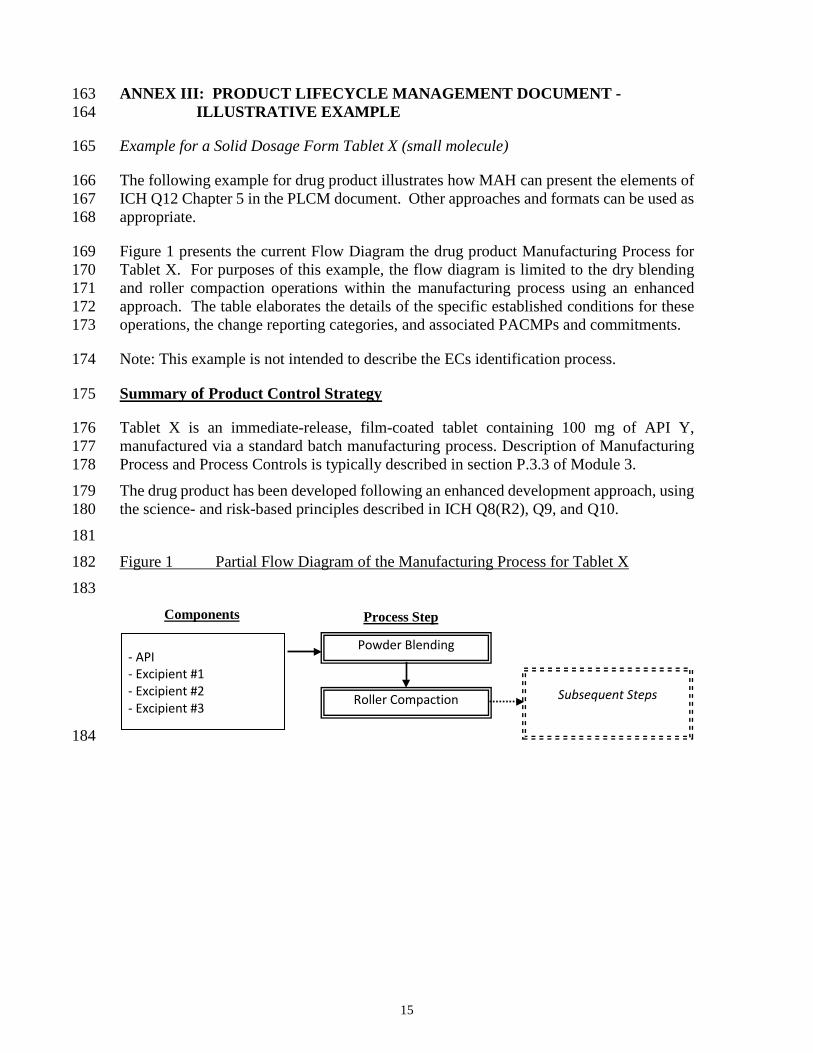
ANNEX III: PRODUCT LIFECYCLE MANAGEMENT DOCUMENT - 163 ILLUSTRATIVE EXAMPLE 164
Example for a Solid Dosage Form Tablet X (small molecule) 165
The following example for drug product illustrates how MAH can present the elements of 166 ICH Q12 Chapter 5 in the PLCM document. Other approaches and formats can be used as 167 appropriate. 168
Figure 1 presents the current Flow Diagram the drug product Manufacturing Process for 169 Tablet X. For purposes of this example, the flow diagram is limited to the dry blending 170 and roller compaction operations within the manufacturing process using an enhanced 171 approach. The table elaborates the details of the specific established conditions for these 172 operations, the change reporting categories, and associated PACMPs and commitments. 173
Note: This example is not intended to describe the ECs identification process. 174
Summary of Product Control Strategy 175
Tablet X is an immediate-release, film-coated tablet containing 100 mg of API Y, 176 manufactured via a standard batch manufacturing process. Description of Manufacturing 177 Process and Process Controls is typically described in section P.3.3 of Module 3. 178
The drug product has been developed following an enhanced development approach, using 179 the science- and risk-based principles described in ICH Q8(R2), Q9, and Q10. 180
181
Figure 1 Partial Flow Diagram of the Manufacturing Process for Tablet X 182
183
184
Roller Compaction
Components Process Step
Powder Blending - API - Excipient #1 - Excipient #2 - Excipient #3
Subsequent Steps

16
185
CTD Section
Section Title Established Conditions
Note that identification and justification of ECs are presented in the relevant section of CTD
Reporting Category when making a change to the Established Condition
PACMP or Post-approval CMC Commitment, if applicable
3.2.P
3.2.P.3.3 Description of Manufacturing Process and Process Controls - Unit Operations
Powder Blending Operation
Input Material - API PSD
5-200um
Notification Moderate
Input Material – API Moisture
<1.0%
Notification Low
Excipients Specification
Pharmacopeial
By regional requirement

17
CTD Section
Section Title Established Conditions
Note that identification and justification of ECs are presented in the relevant section of CTD
Reporting Category when making a change to the Established Condition
PACMP or Post-approval CMC Commitment, if applicable
Equipment Type
Diffusion blender (V-blender)
Notification Moderate
Scale
200kg
Notification Low PACMP included in the MAA for expanded range for scale to be submitted as a Notification Low
Blend speed
10-20rpm
Notification Low
Blend time
15-25 minutes
Notification Low CMC commitment to monitor dissolution performance for 10 batches manufactured at upper end of blend time range due to potential over lubrication at the proposed commercial scale (200kg).
Equipment Type
Roller compactor with 10cm rolls
Notification Moderate

18
CTD Section
Section Title Established Conditions
Note that identification and justification of ECs are presented in the relevant section of CTD
Reporting Category when making a change to the Established Condition
PACMP or Post-approval CMC Commitment, if applicable
Roller Compaction Operation
Roll Gap
2-4mm
Notification Low
Roller Compaction Force
5-10kNcm-1
Notification Low
Roller Speed
4-10rpm
Notification Low
186